


Abstract
Coral reefs in the South China Sea (SCS) are critical for regional marine biodiversity and ecosystem services but face escalating threats from climate change and anthropogenic stressors. However, a holistic evaluation of habitat suitability spanning the distinct environmental gradients from low-latitude deep-water atolls to high-latitude marginal reefs remains limited. This study utilized high-resolution remote sensing data and the MaxEnt (Maximum Entropy) model combined with Principal Component Analysis (PCA) to systematically map potential habitat suitability and elucidate the multi-scale environmental drivers shaping the realized niche of SCS corals. The results revealed significant spatial heterogeneity characterized by a distinct “High South, Low North” latitudinal gradient, with Unsuitable areas dominating 85.5% of the study region, followed by Marginally Suitable habitats at 5.0%, while the northern Nansha Islands were identified as the core distribution area with the highest suitability and continuity. Minimum Phosphate (Min. Phos.) concentration and Sea Surface Temperature (SST) were identified as the core environmental factors determining the spatial distribution of coral reefs in the South China Sea. The optimal environmental ranges were identified as: SST between 28.52 °C and 29.41 °C, water depth shallower than 34 m, extremely low phosphate (0–0.005 mmol/m3), and low cumulative thermal stress (DHW < 0.83 °C-weeks). Crucially, PCA further quantified two potential climate refugia: low-latitude thermal refugia in the southern Nansha Islands, characterized by high environmental stability, and high-latitude marginal refugia in the Beibu Gulf, which offer physical buffering against warming, while necessitating targeted efforts to mitigate the risks of habitat degradation and eutrophication driven by intensifying anthropogenic activities These findings challenge the traditional conservation view relying solely on high-latitude migration, advocating for a climate-resilient spatial planning strategy that prioritizes strict protection of southern biodiversity source banks while enhancing the connectivity of northern marginal stepping stones.
1. Introduction
Coral reefs, often termed the rainforests of the sea, support over 25% of marine life despite covering less than 0.1% of the global ocean areas, possessing immense biodiversity and economic value [1,2,3,4]. However, under the combined effects of ocean warming, acidification, and anthropogenic stressors, corals have become one of the most vulnerable marine ecosystems [5,6,7]. To address this crisis, identifying and protecting potential suitable habitats has become a primary task for marine spatial planning. Achieving this requires first quantifying the habitat characteristics suitable for coral reef distribution and gaining a deep understanding of the key environmental drivers governing their biogeographical patterns and niche.
The biogeographical distribution of coral reefs is constrained by multiple physical, chemical, and biological factors [8,9,10,11]. Since the seminal work of Kleypas et al. [12], sea surface temperature (SST), aragonite saturation state, and light availability have been identified as critical determinants of global coral distribution. For instance, Guan et al. [13] utilized global datasets to demonstrate that nutrient concentrations, such as nitrate and phosphate, alongside temperature and acidification, are pivotal indicators of habitat suitability. Similarly, McClanahan and Azali [14] found in the Western Indian Ocean that, in addition to heat stress, dissolved oxygen, calcite concentration, and statistical characteristics of SST (e.g., skewness and kurtosis) are key variables for predicting coral cover, highlighting the importance of incorporating these background variables to improve model precision. The physical environment limits the distribution ranges and diversity of coral species; therefore, understanding how these environmental factors interact to define critical thresholds for survival is essential for predicting the future fate of coral reefs under climate change.
In recent years, Species Distribution Models (SDMs) have become vital tools for predicting potential marine species distributions and assessing ecological risks [15]. Common SDMs include Generalized Linear Models (GLM), Generalized Additive Models (GAM), Genetic Algorithm for Rule-set Production (GARP), and Ecological Niche Factor Analysis (ENFA) [16]. However, these models have specific limitations: GLM and GAM typically require high-quality presence absence data, which are often unavailable in vast marine environments [17]; GARP, as a stochastic algorithm, can produce results with high variability [18]; and ENFA is often restricted to linear dependencies, failing to capture complex nonlinear ecological responses [19]. In contrast, the Maximum Entropy (MaxEnt) model stands out for its robustness and predictive performance using presence-only data [20]. Furthermore, MaxEnt can fit complex nonlinear functions to simulate species responses to the environment and has demonstrated superior mapping accuracy compared to other machine learning algorithms such as Boosted Regression Trees (BRT) [21]. Consequently, MaxEnt is considered the optimal choice for modeling habitat suitability in the South China Sea (SCS) in our research.
Despite these advancements, significant knowledge gaps remain in current coral reef suitability modeling. First, previous studies have predominantly focused on deep-sea or cold-water corals. For instance, Davies and Guinotte [22] utilized MaxEnt to model global suitability for the framework-forming cold-water coral Lophelia pertusa, identifying depth and temperature as key drivers. Similarly, Tong et al. [18], Anderson et al. [23], and Sundahl et al. [8] successfully predicted the distributions of deep-water gorgonians and scleractinians based on terrain variables. In contrast, systematic assessments of shallow-water tropical reefs at large scales remain relatively scarce. Second, regarding the SCS, although studies exist, they are often limited to coastal zones or specific islands. For example, Hu et al. [24] focused on mapping the vulnerability of coastal scleractinian corals in the northern SCS. While Li et al. [10] and Shen et al. [11] recently applied MaxEnt to major island groups, existing research has not fully covered higher-latitude coral communities (e.g., Beibu Gulf) or offshore deep-water reefs, which are potential climate refugia. Furthermore, these studies are often constrained by the coarse resolution of environmental data and omissions in coral distribution records, leading to imprecise assessments.
To overcome these data limitations, new remote sensing technologies offer unprecedented performance in acquiring high-resolution data for shallow coastal landscapes. For example, Pittman and Brown [21] demonstrated that satellite imagery allows for the derivation of detailed bathymetric and benthic habitat layers, significantly improving model predictions for reef fish distributions. Similarly, da Silveira et al. [25] used remote sensing data to model hydrocoral distributions, highlighting the importance of high-resolution topographical variables. Integrating these high-precision environmental data with the high-performance MaxEnt model provides a new opportunity to identify the potential distribution of SCS coral reefs at a fine scale.
Based on this background, our study aims to utilize the MaxEnt model, combined with high-resolution environmental data, to investigate the distribution characteristics of warm-water corals and their response to environmental factors across a large-scale geographic area in the SCS (encompassing Beibu Gulf, Xisha, Zhongsha, and Nansha Islands). The core scientific question addressed is: (i) What is the spatial heterogeneity of habitat suitability for warm-water corals across the broad latitudinal gradient of the South China Sea (SCS)? (ii) What are the biophysical factors governing this pattern? (iii) What are the optimal ranges for these environmental factors? We propose the scientific hypothesis that while SST acts as a global stressor defining the boundaries of the fundamental niche [3], local environmental factors (e.g., water quality, currents, and thermal stress history) act as environmental filters determining the realized niche [15]. Based on this, we predict that habitat suitability in the SCS will exhibit significant spatial differentiation rather than a uniform distribution; specifically, potential climate refugia or high-suitability hotspots may exist in high-latitude marginal zones or offshore deep-water reef areas with lower historical thermal stress or optimal water quality [26,27]. By verifying these hypotheses, this study reveals the critical environmental thresholds for coral survival and provides a scientific basis for identifying biodiversity hotspots and priority conservation areas within the context of marine spatial planning.
2. Materials and Methods
2.1. Study Area
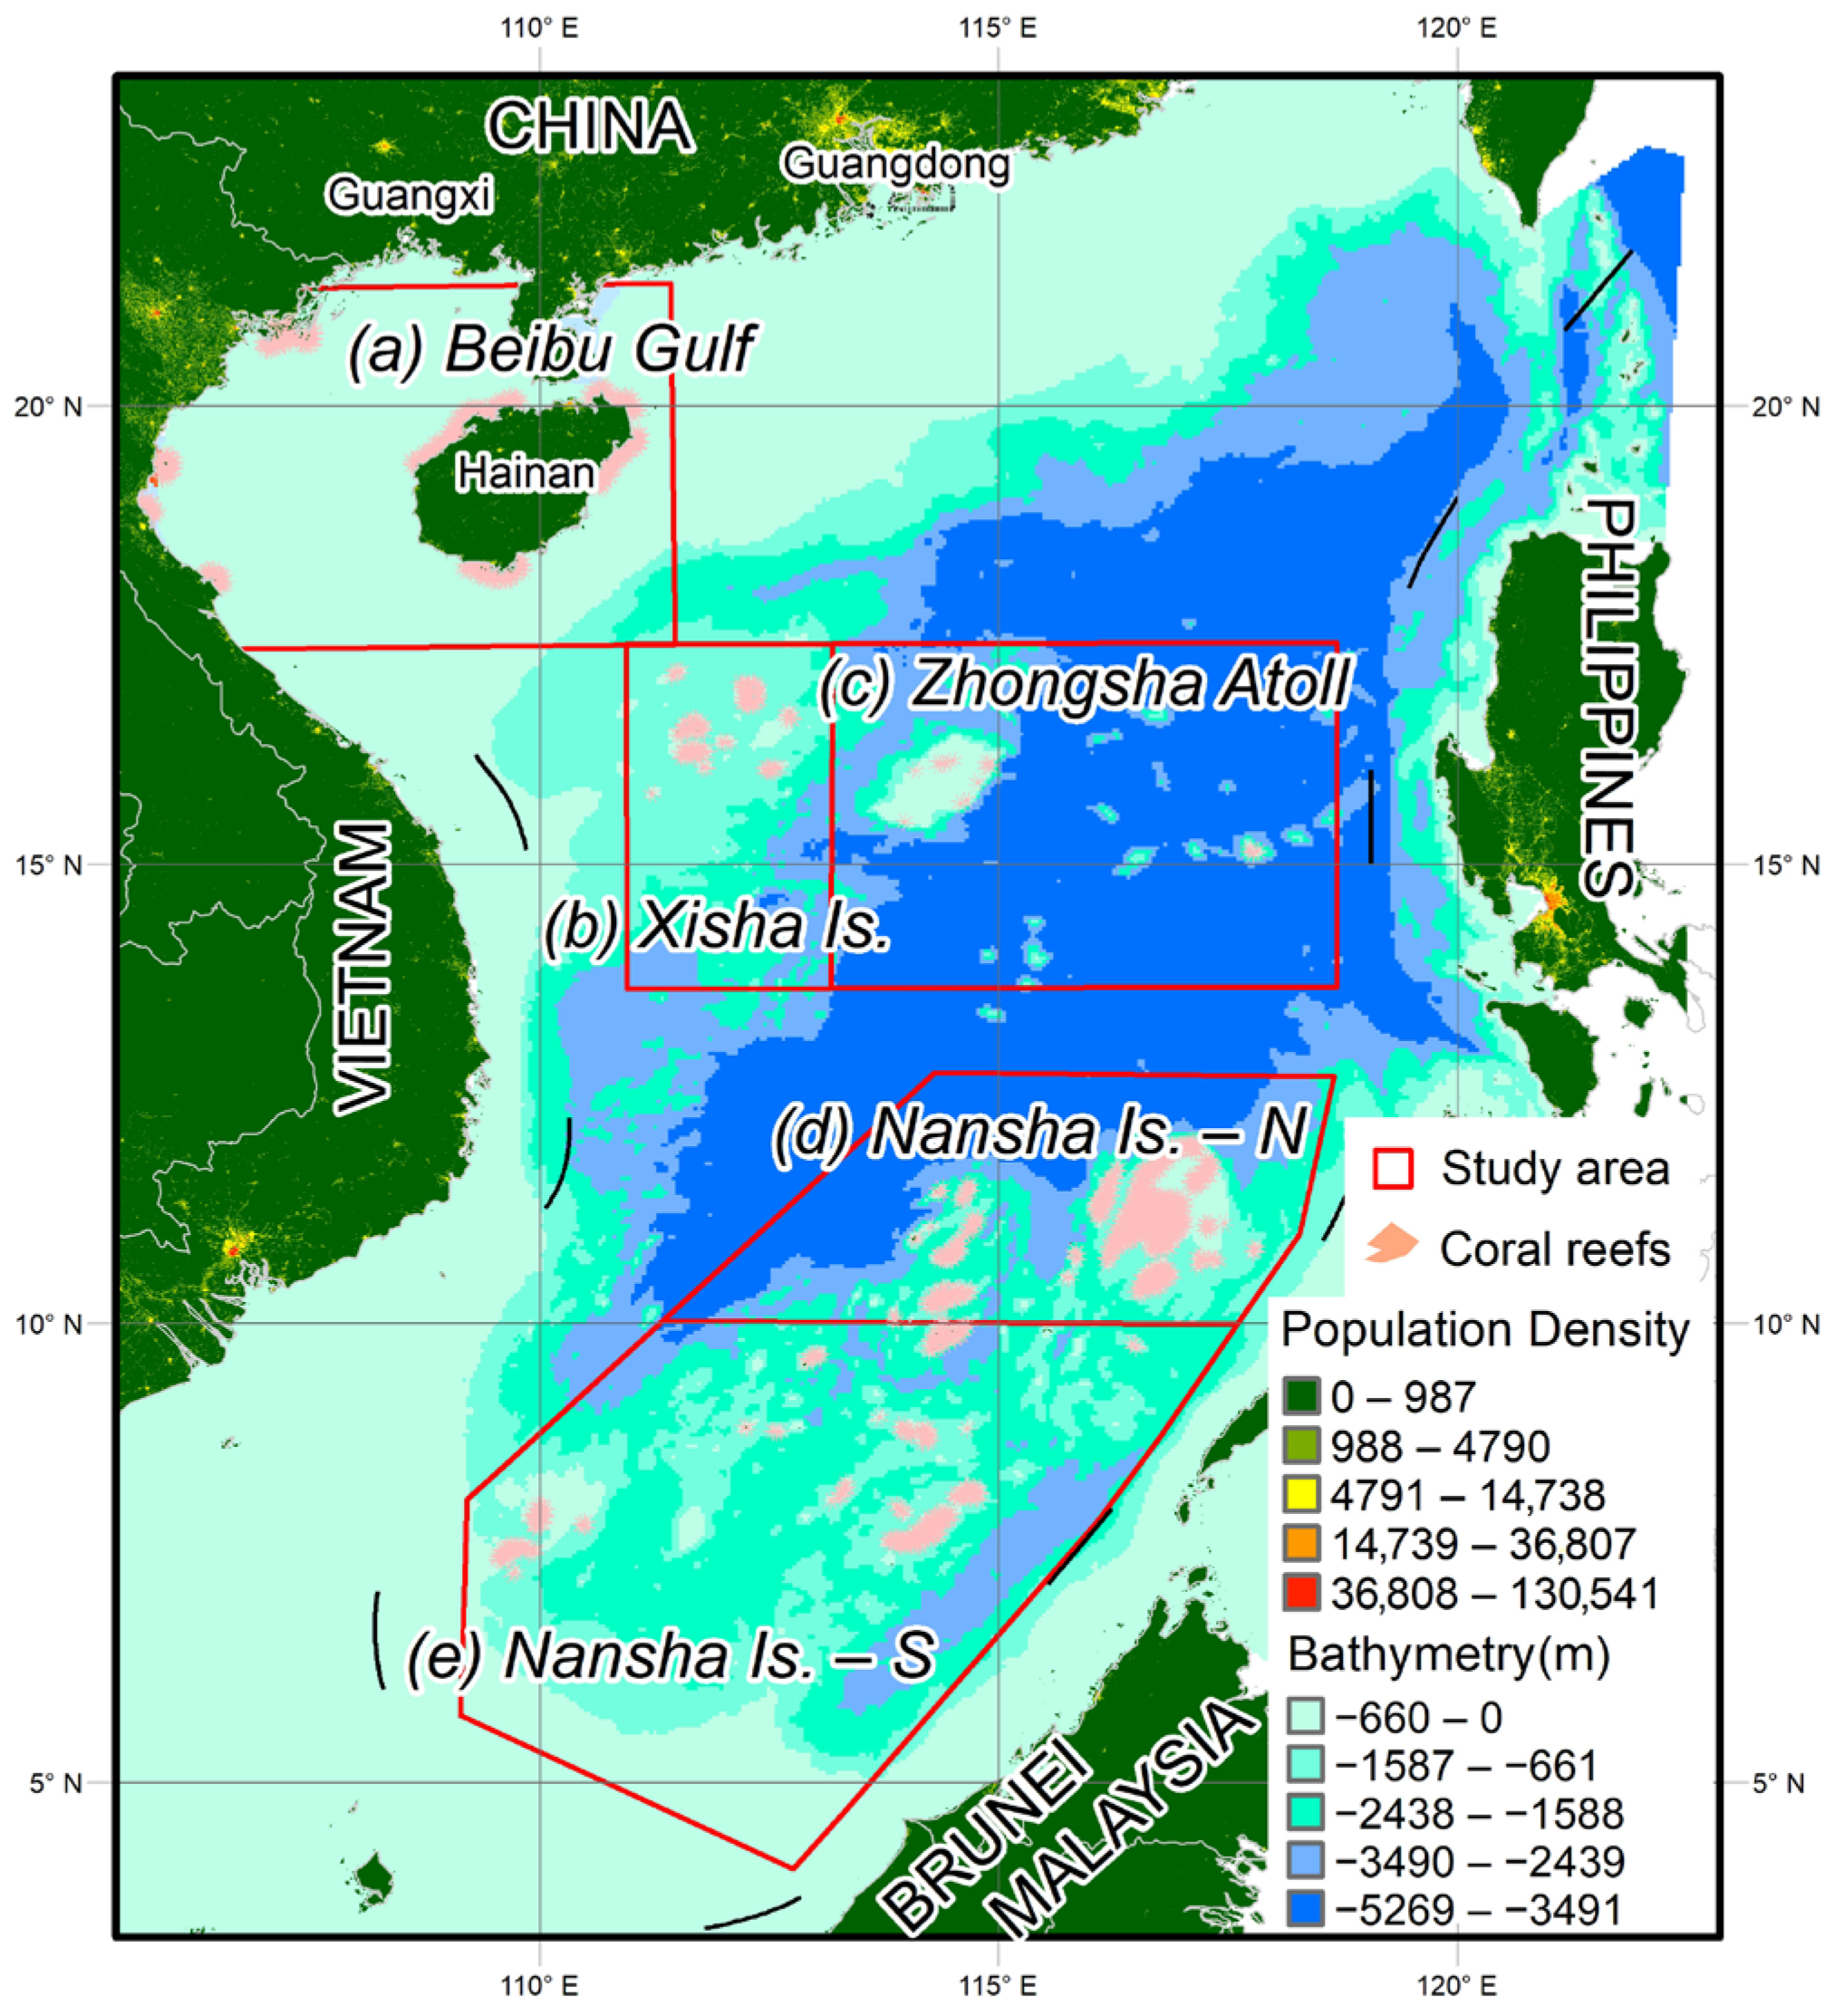
The South China Sea (SCS) is the largest semi-enclosed marginal sea in the Western Pacific, spanning tropical and subtropical regions (Figure 1). The study area covers a vast expanse extending from James Shoal (Zengmu Ansha, ~4° N) near the equator northward to Weizhou Island (~21° N) in the Beibu Gulf and the coast of South China. Key coral reef distribution areas include the Beibu Gulf, Xisha Islands, Zhongsha Islands, and Nansha Islands. The South China Sea Islands are divided into two parts, the north and the south, based on the 10° N. The SCS possesses extremely rich coral reef resources; statistics indicate that the total area of coral reefs (including islands, reefs, shoals, and sands) in the SCS islands and adjacent waters ranges from approximately 37,200 km2 to 37,935 km2, accounting for about 5% of the global coral reef coverage [28]. The Nansha, Xisha, and Zhongsha Islands are dominated by deep-water atolls and platform reefs, mostly developed on steep continental slopes or seamounts within deep-sea basins, whereas fringing reefs are primarily developed around the Beibu Gulf and Hainan Island [28,29]. Approximately 250 species of reef-building scleractinian corals have been recorded in this region; the resulting complex three-dimensional structures provide essential habitats, nursery grounds, and foraging sites for numerous marine organisms [30]. In particular, the Nansha Islands exhibit extremely high species richness due to their proximity to the Coral Triangle diversity center [31,32]. The study area is characterized by a typical tropical monsoon climate, strongly influenced by the East Asian monsoon system. The prevailing northeast monsoon in winter and southwest monsoon in summer drive the seasonal alternation of surface circulation in the SCS. Furthermore, this region is surrounded by frequent anthropogenic activities, as clearly indicated by the population density patterns illustrated in Figure 1.
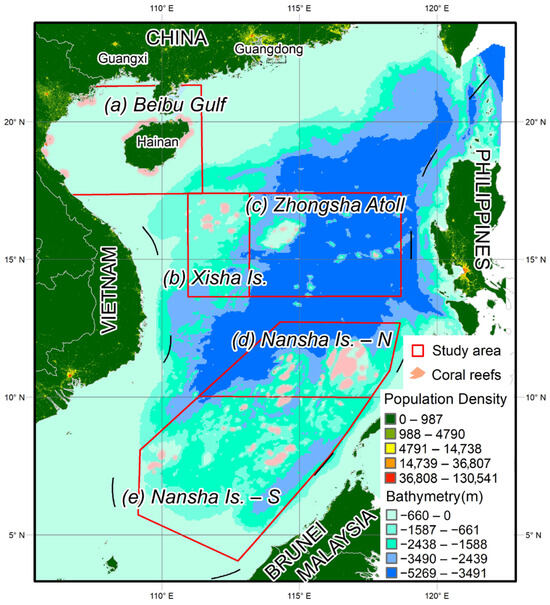
Figure 1.
Study areas, the spatial distribution of coral reefs in the SCS and the population density around the SCS.
2.2. Coral Reef Distribution Data
Coral reef distribution data were primarily obtained from the Global Distribution of Coral Reefs dataset [33]. To enhance data currency and accuracy, the original dataset was corrected and supplemented using the latest high-resolution satellite imagery from the Allen Coral Atlas [34], alongside field surveys and remote sensing interpretation data from Zuo et al. [35]. To meet the modeling requirements of MaxEnt and ensure consistency with the spatial resolution of environmental variables, data preprocessing was conducted using ArcGIS 10.8. Following the methodologies of Li et al. [10] and Shen et al. [11], the original coral location vector polygons were converted into point data and resampled to a spatial resolution of 4 km. After filtering and removing spatial duplicates, a total of 1266 coral occurrence records were obtained. Regarding the final study extent, Zengmu Ansha (James Shoal) at the southern tip of the Nansha Islands was excluded due to a lack of detailed survey data [10]. Furthermore, Weizhou Island in the Beibu Gulf was also excluded from this study since its relatively low coral coverage. The specific distribution of coral reefs are illustrated in Figure 1.
2.3. Environmental Data
A total of three categories of environmental variables were compiled for this study, encompassing biochemical, physical, and meteorological parameters (Table 1). Specifically, the biochemical parameters include chlorophyll a, dissolved oxygen (DO), nitrate, phosphate, silicate, and pH. The physical parameters consist of seawater velocity, sea surface salinity (SSS), sea surface temperature (SST) and its anomaly (SSTA), HotSpot (the current SST minus the maximum monthly mean for that location.), and Degree Heating Weeks (DHW) while meteorological parameters comprise photosynthetically active radiation (PAR), precipitation, and cloud cover.
Table 1.
Sources of environmental data.
Regarding data acquisition, the majority of biochemical variables, select physical variables (i.e., velocity and salinity), and cloud cover data were retrieved from the Bio-ORACLE (Bio-Ocean Rasters for Analysis of Climate and Environment) dataset [36], featuring a native spatial resolution of 0.083°. Data for SSTA, HotSpot, and DHW—indicators closely associated with coral thermal bleaching—were obtained from NOAA (National Oceanic and Atmospheric Administration) Coral Reef Watch [37] at a 5 km resolution. SST and PAR data were derived from MODIS (Moderate Resolution Imaging Spectroradiometer) Aqua and Terra satellite products provided by NASA (National Aeronautics and Space Administration) Ocean Color (4 km resolution), while precipitation data were downloaded from the NASA GES DISC (Goddard Earth Sciences Data and Information Services Center, 0.1° resolution).
For each variable, the long-term mean was computed. Additionally, for specific variables, the averages of the annual minimum (Lt. Min) and annual maximum (Lt. Max) records were calculated. Given the dependence of reef-building corals in the South China Sea and their symbiotic zooxanthellae on sunlight for photosynthesis, these organisms predominantly inhabit shallow waters. Consequently, a depth mask was constructed using GEBCO (General Bathymetric Chart of the Oceans) bathymetric (water depth) data [38] to exclude deep-water regions exceeding 200 m in depth. Subsequently, all environmental datasets were processed using this mask and resampled to a uniform 4 km spatial resolution using bilinear interpolation. This method was chosen over linear or nearest-neighbor approaches because it ensures the continuity of oceanographic surface gradients and minimizes spatial artifacts when integrating multi-source data with varying native resolutions. This approach is consistent with established protocols for MaxEnt modeling to maintain the integrity of the environmental niche space.
2.4. Methods
2.4.1. Variable Selection Strategy
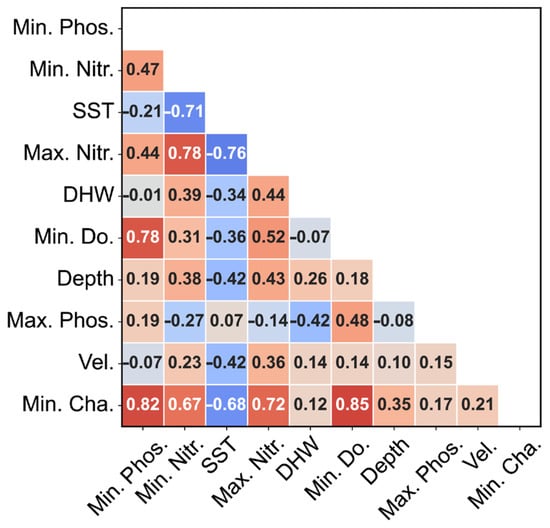
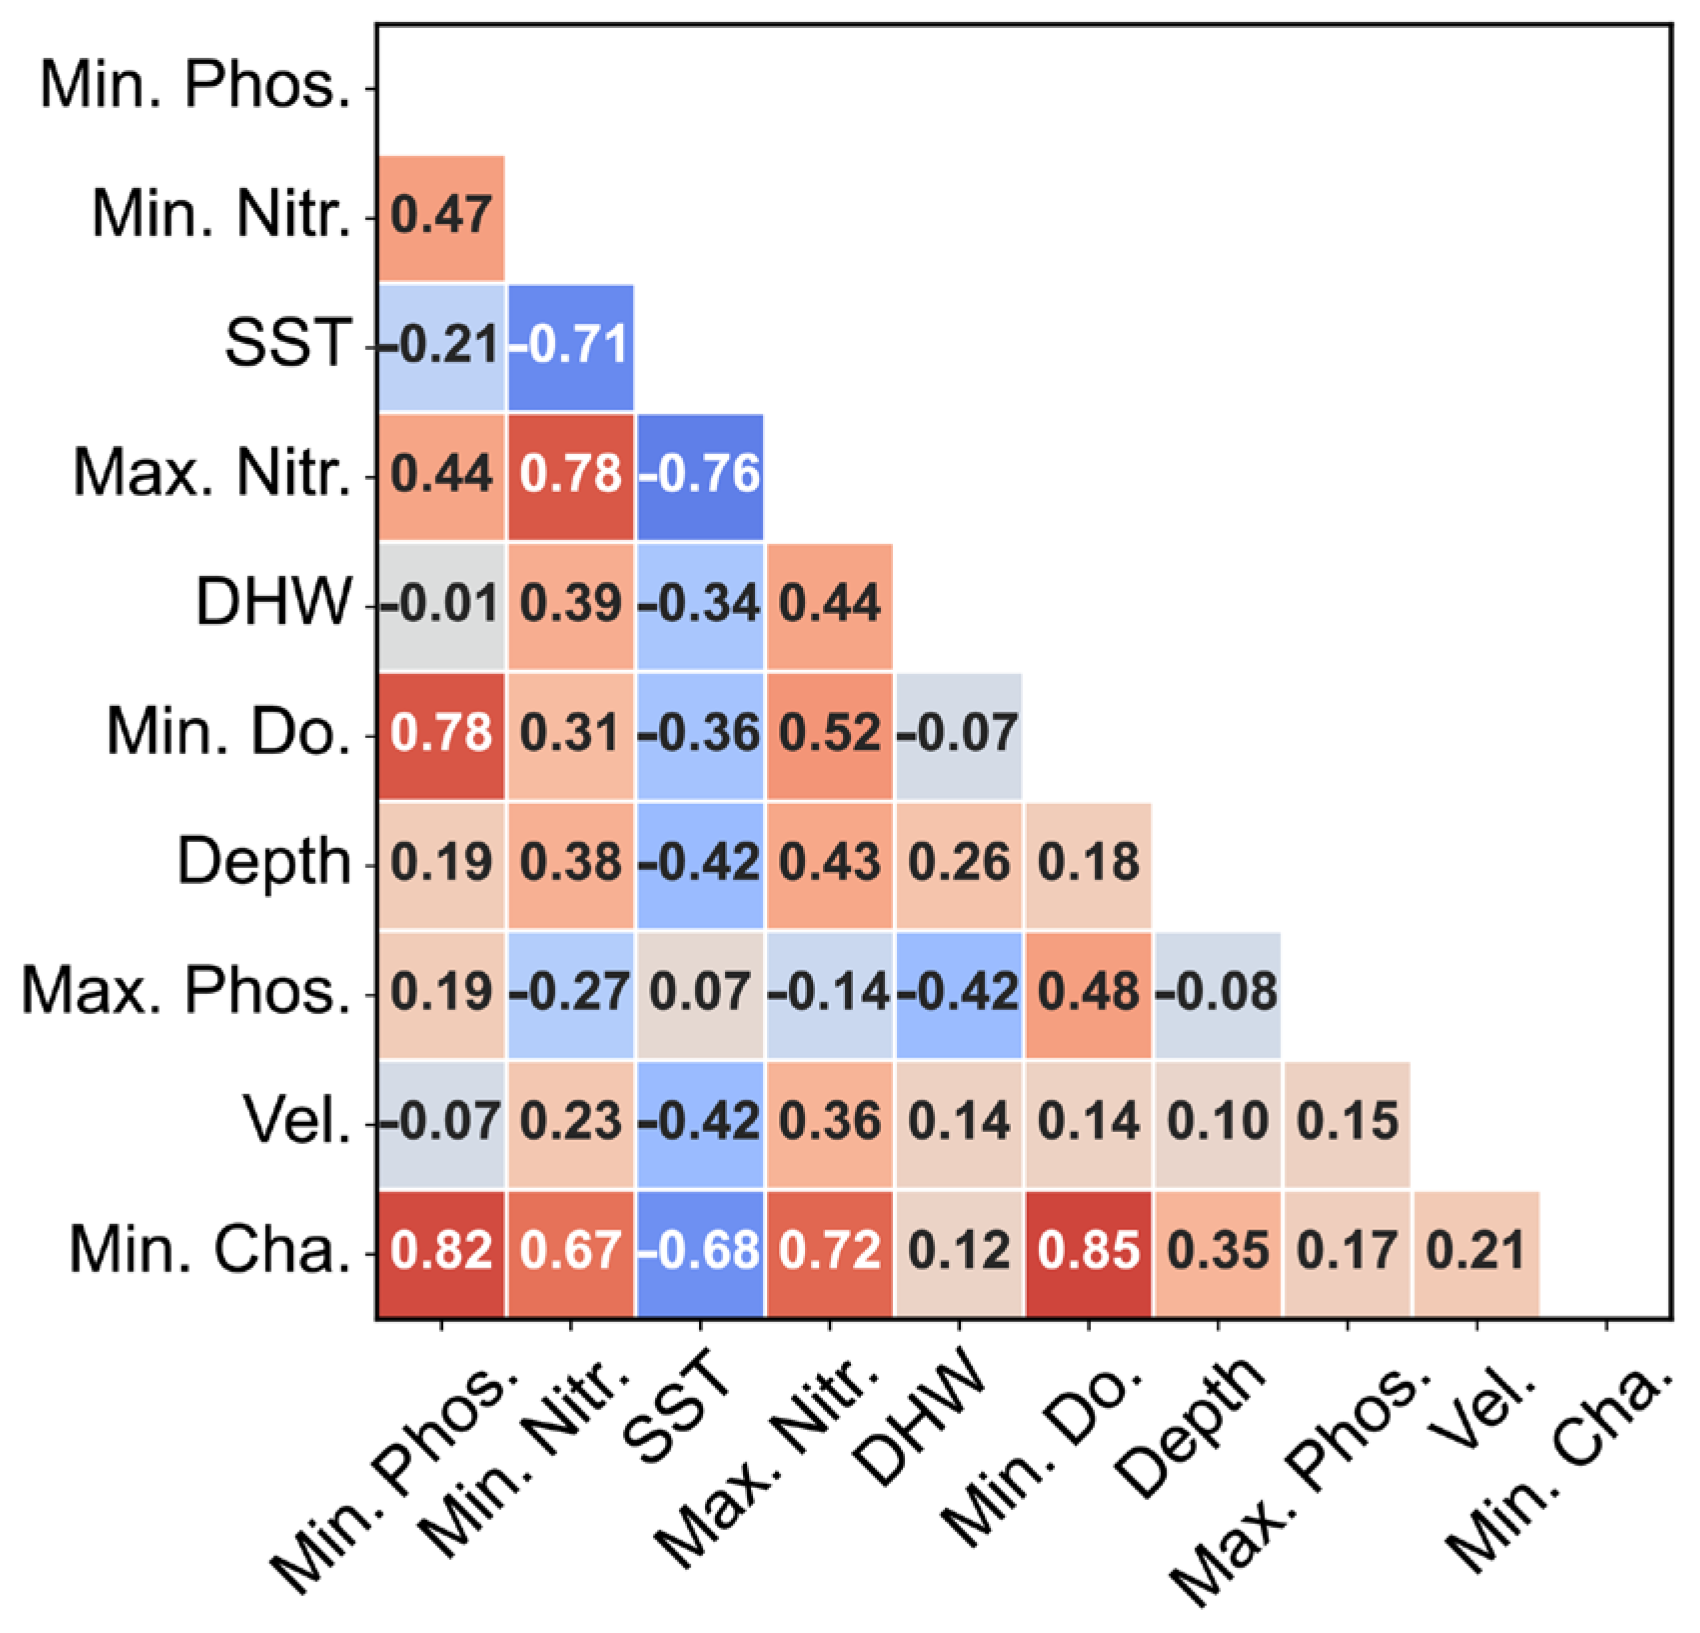
To ensure the robust performance of the MaxEnt model and mitigate the interference of multicollinearity [3], we conducted a rigorous screening of 36 initial environmental variables. A Pearson correlation analysis (Figure 2) was performed, and variables with correlation coefficients over 0.85 were excluded to prevent overfitting and redundancy [15,39]. The final suite of predictors was selected based on their functional relevance to the physiological constraints and ecological requirements of marine benthic communities. Our selection framework encompasses three primary dimensions: physical oceanography, biogeochemistry, and metabolic indicators (Table 2). Thermal variables, specifically SST and DHW, represent fundamental metabolic constraints and cumulative thermal stress, respectively. Bathymetric and hydrodynamic factors (Depth and Vel.) serve as proxies for light attenuation and nutrient flux. To capture the non-linear effects of nutrient availability, we employed a “dual-threshold” approach utilizing both minimum (Min. Phos./Nitr.) and maximum (Max. Phos./Nitr.) values. This allows the model to identify both natural nutrient limitations and the risks of eutrophication potentially driven by anthropogenic activities. Furthermore, biological indicators (Min. Do. and Min. Cha.) were incorporated to account for extreme hypoxia constraints and water column productivity. By prioritizing physiological thresholds (extremes) over simple annual means, this multi-dimensional ensemble provides a robust mechanistic framework for characterizing the ecological niche of the target species (Figure 3).
Figure 2.
Environmental variables used in the MaxEnt model and their correlation coefficients. Note: Abbreviations: SST, Sea Surface Temperature; DHW, Degree Heating Weeks; Depth, Water depth (Bathymetry); Vel., Seawater velocity; Min./Max Phos., Minimum/Maximum Phosphate; Min./Max Nitr., Minimum/Maximum Nitrate; Min. Cha., Minimum Chlorophyll-a; Min. Do., Minimum Dissolved Oxygen.
Table 2.
Environmental variables used in the MaxEnt model and their biological significance.
2.4.2. MaxEnt Modeling Framework
- (1)
- Model implementation
To predict the potential distribution of coral reefs in the SCS, we utilized the Maximum Entropy (MaxEnt) model (Version 3.4.4; https://biodiversityinformatics.amnh.org/open_source/maxent/, accessed on 1 January 2026). It is a machine learning algorithm specifically designed for presence-only data, estimating the target probability distribution by finding the distribution of maximum entropy (i.e., closest to uniform) subject to constraints imposed by environmental variables at known occurrence sites [20,21]. This approach was selected due to its proven robustness in handling complex non-linear species environment relationships and its superior predictive performance even with limited sample sizes compared to other algorithms such as GARP [18,40].
- (2)
- Parameter configuration and optimization
To ensure the reliability and generalizability of the model, we implemented a rigorous cross-validation and parameter setting strategy. Firstly, the screened coral occurrence records were randomly partitioned into two subsets: 75% (n = 950) were allocated for model training, and the remaining 25% (n = 316) were set aside as an independent test set for model validation [3]. Secondly, to prevent model overfitting and minimize excessive complexity, we optimized the MaxEnt model using the ENMeval package in R. The optimization focused on the selection of optimal feature classes (FC) and the regularization multiplier (RM), the latter of which modulates the strength of the penalty on model complexity [41]. Thirdly, to minimize the uncertainty associated with random data splitting and to test model stability, we performed 10 replicate runs using the subsample method [10,11]. The final habitat suitability map was generated by averaging the outputs of these 10 replicates. Fourthly, the model was run with a convergence threshold of 105 and a maximum of 500 iterations [40,42]. Feature classes (FC) and regularization demonstrated that default settings often perform well across a wide range of species [43]. This configuration was chosen to balance model goodness-of-fit with complexity, allowing the model to fit complex ecological responses while maintaining transferability [43,44].
- (3)
- Model performance evaluation
The predictive performance of the MaxEnt model was evaluated using the Area Under the Receiver Operating Characteristic Curve (AUC). The AUC is a threshold-independent metric ranging from 0 to 1, where a value of 0.5 indicates random prediction and 1.0 implies perfect discrimination [45]. Following the classification standards adapted by [46], model performance was categorized as follows: failing (AUC ≤ 0.6), poor (0.6 < AUC ≤ 0.7), fair (0.7 < AUC ≤ 0.8), good (0.8 < AUC ≤ 0.9), and excellent (0.9 < AUC ≤ 1.0).
- (4)
- Assessment of variable contributions
To identify the key environmental drivers of coral distribution, we utilized four complementary metrics provided by MaxEnt, (i) Percent Contribution, (ii) Permutation Importance, (iii) Jackknife Test and (iv) Response Curve. The Percent contribution reflects the variable’s influence during the model training path, while permutation importance is calculated by randomly permuting the values of a variable and measuring the resulting drop in training AUC. The latter is considered more robust to collinearity. We conducted Jackknife tests to rigorously assess the relative importance of predictor variables. This involves comparing the regularized training gain of the model in three scenarios: using all variables, using only the variable in isolation (to test for independent predictive power), and excluding the variable (to test for unique information not captured by others) [20]. Response curves were generated to visualize the individual quantitative relationship between the probability of coral presence and environmental variables, illustrating how habitat suitability changes across the gradient of each predictor [40].
- (5)
- Mapping of habitat suitability index
Finally, the model output was generated in a logistic format, providing a continuous map of habitat suitability index (HSI) ranging from 0 (unsuitable) to 1 (optimal suitability) for each grid cell in the study area [25,43]. Based on the previous studies [10,11], the HSI was categorized as follows: unsuitable (HSI < 0.2), marginally suitable (0.2 ≤ HSI < 0.4), moderately suitable (0.4 ≤ HSI < 0.6), and highly suitable (HSI ≥ 0.6) to facilitate quantitative spatial analysis.
2.4.3. Comparison of Environmental Factors in Different Coral Reef Areas
To quantitatively analyze the similarities and differentiation of habitat characteristics among different zones in the SCS, Principal Component Analysis (PCA) was employed to perform a multi-dimensional ecological niche analysis based on six key environmental variables. It provided a quantitative framework for environmental niche partitioning. First, raw environmental data were standardized using Z-score normalization to eliminate the influence of varying units and scales on the analysis. Subsequently, two distinct PCA models were constructed: a global habitat model including the Beibu Gulf and a refined habitat model specifically for the offshore coral reef areas. This dual-model approach allowed for a robust comparison between nearshore and pelagic coral reef habitats.
The explanatory variance contribution of each principal component was calculated through eigenvalue decomposition. Within the PCA ordination plots, the first two principal components (PC1 and PC2) were used to construct the environmental niche space, onto which 1266 coral reef occurrence records were projected. Furthermore, loading vectors representing the direction and strength of environmental drivers were superimposed, and convex hulls were plotted for each zone to visualize the degree of niche overlap. All statistical analyses and visualizations were implemented in the R 4.4.2 environment using the FactoMineR, factoextra, and ggplot2 packages. This multi-regional comparison allowed us to provide a quantitative basis for assessing regional refugia potential.
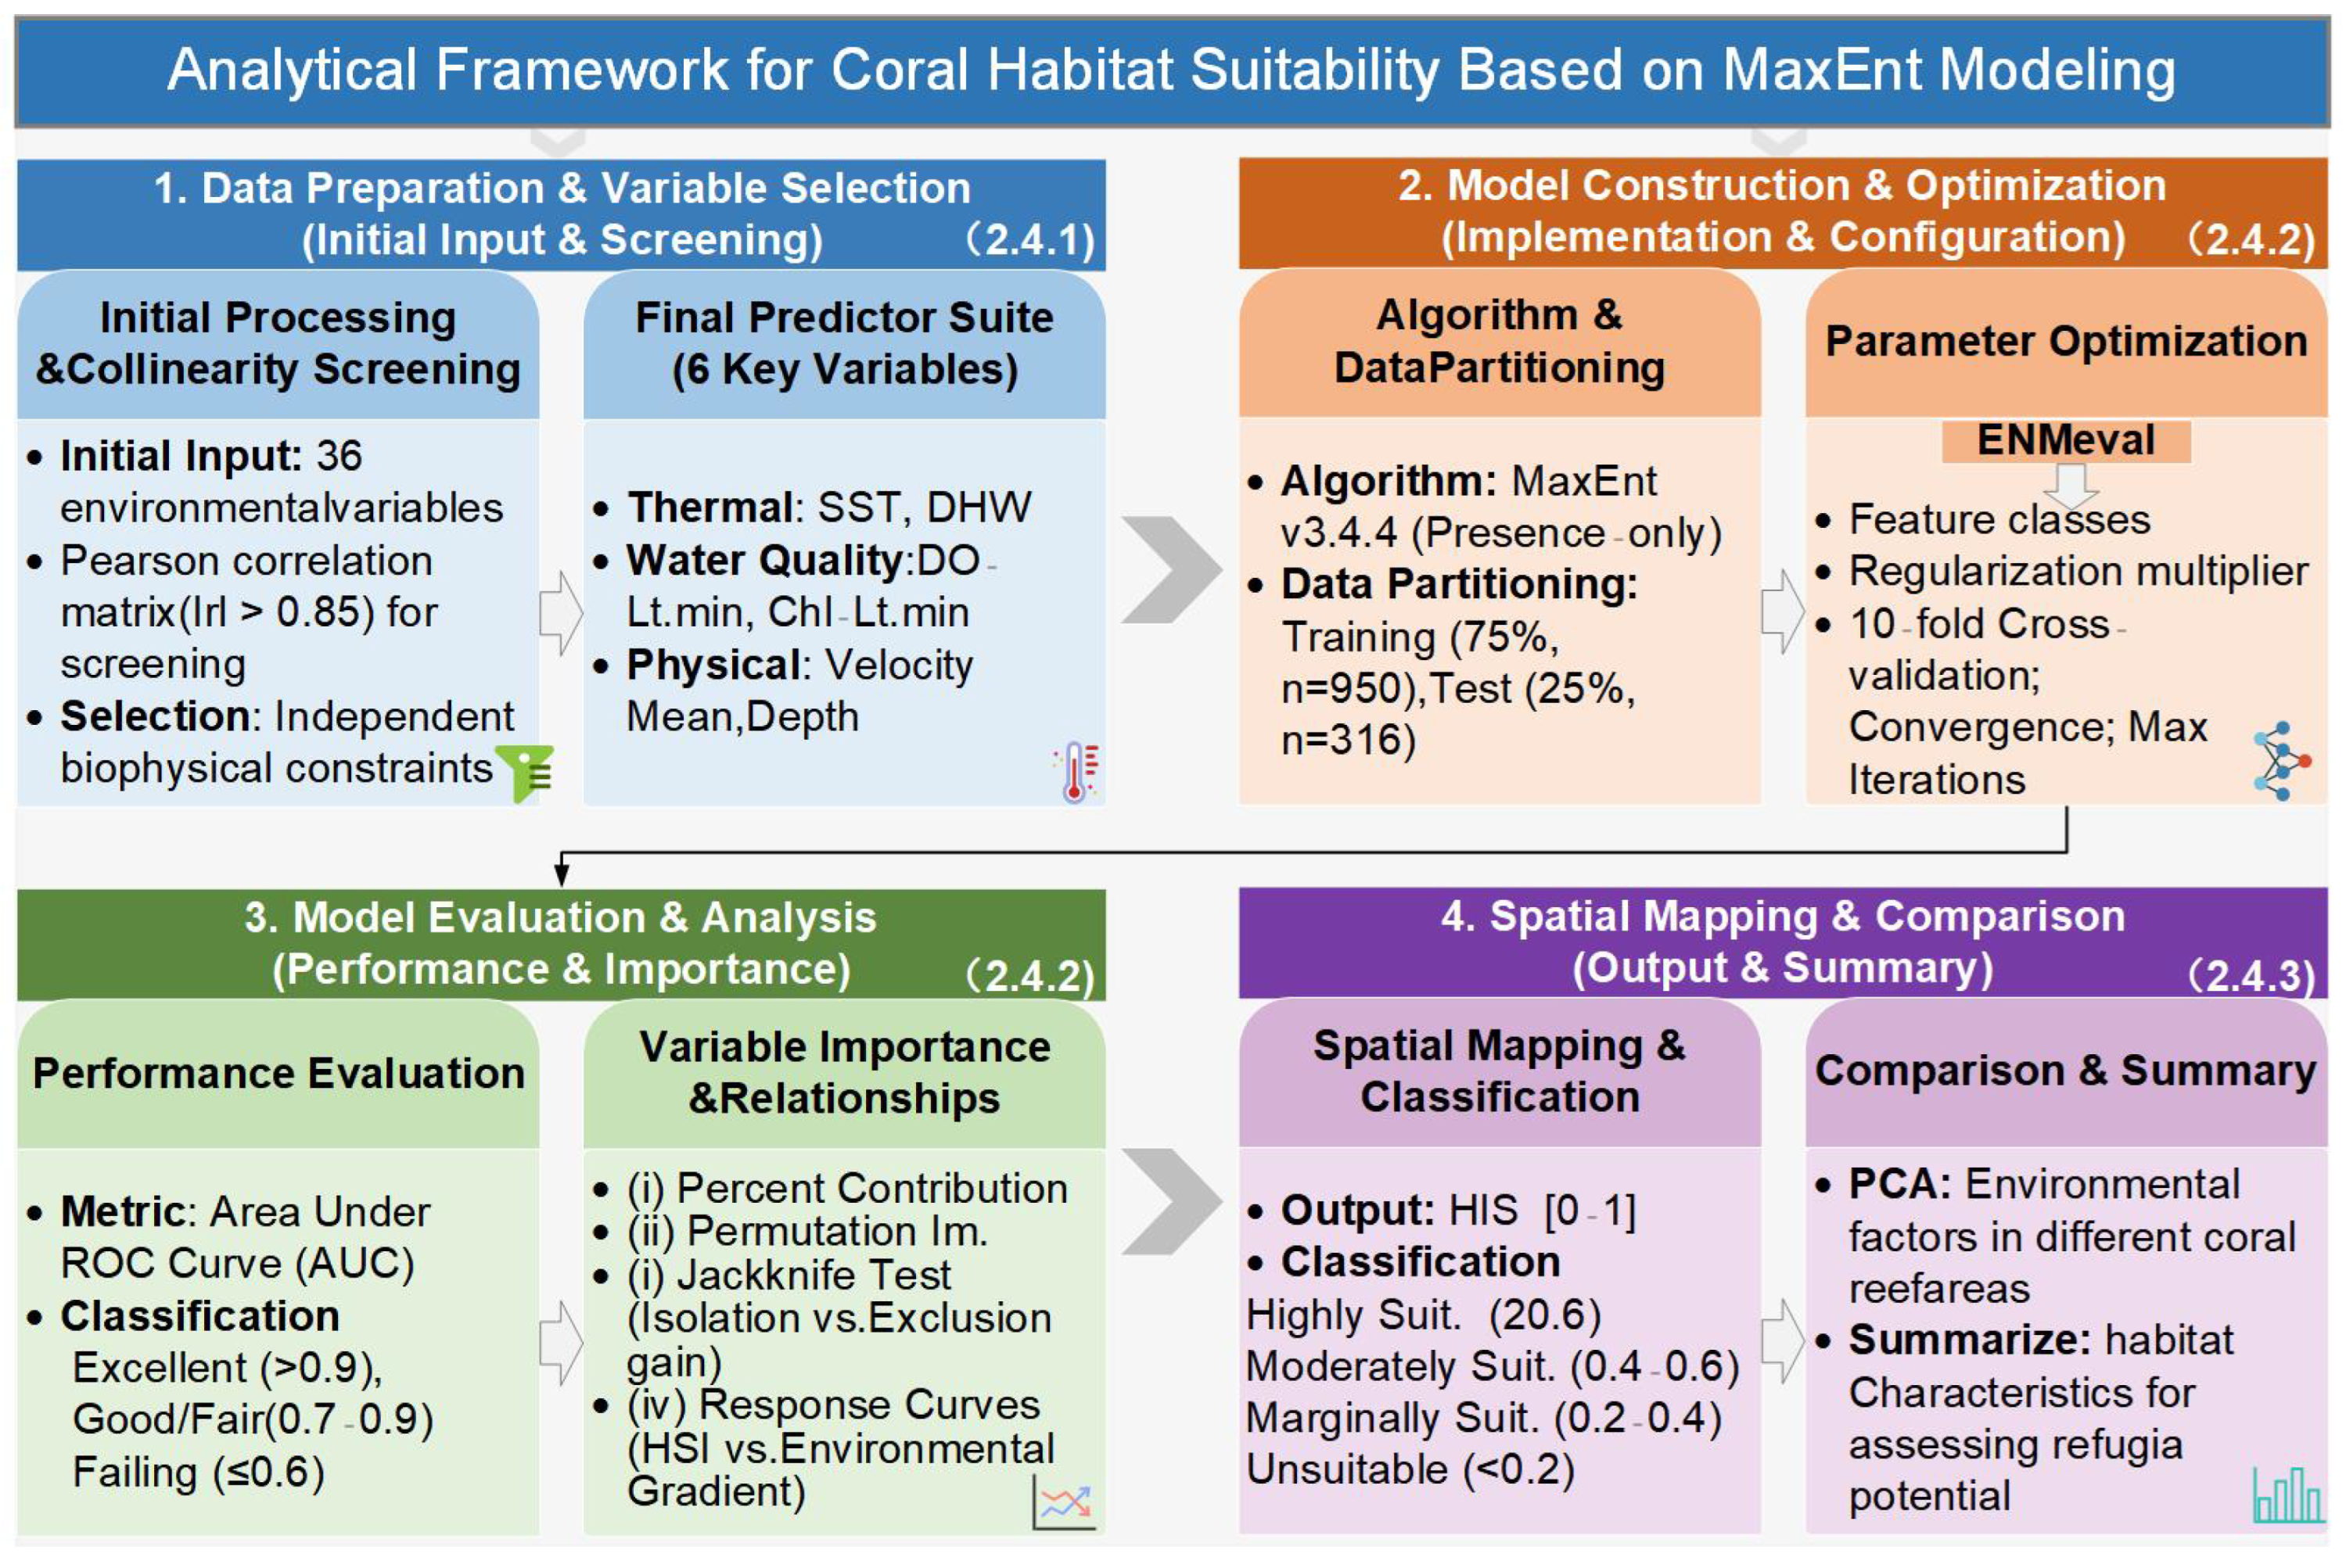
Figure 3.
Analytical workflow. Note: ROC represents Receiver Operating Characteristic. HSI represents habitat suitability index. Suit. Represents suitable. Im. represents importance. PCA represents Principal Components Analysis.
3. Results
3.1. Model Performance
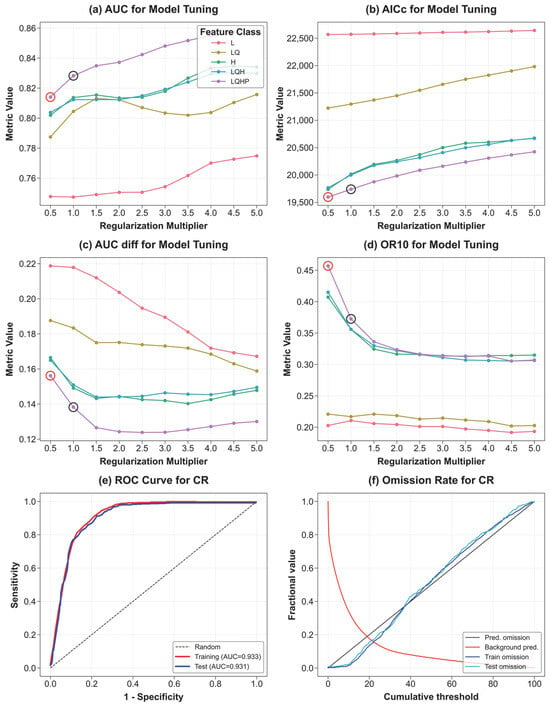
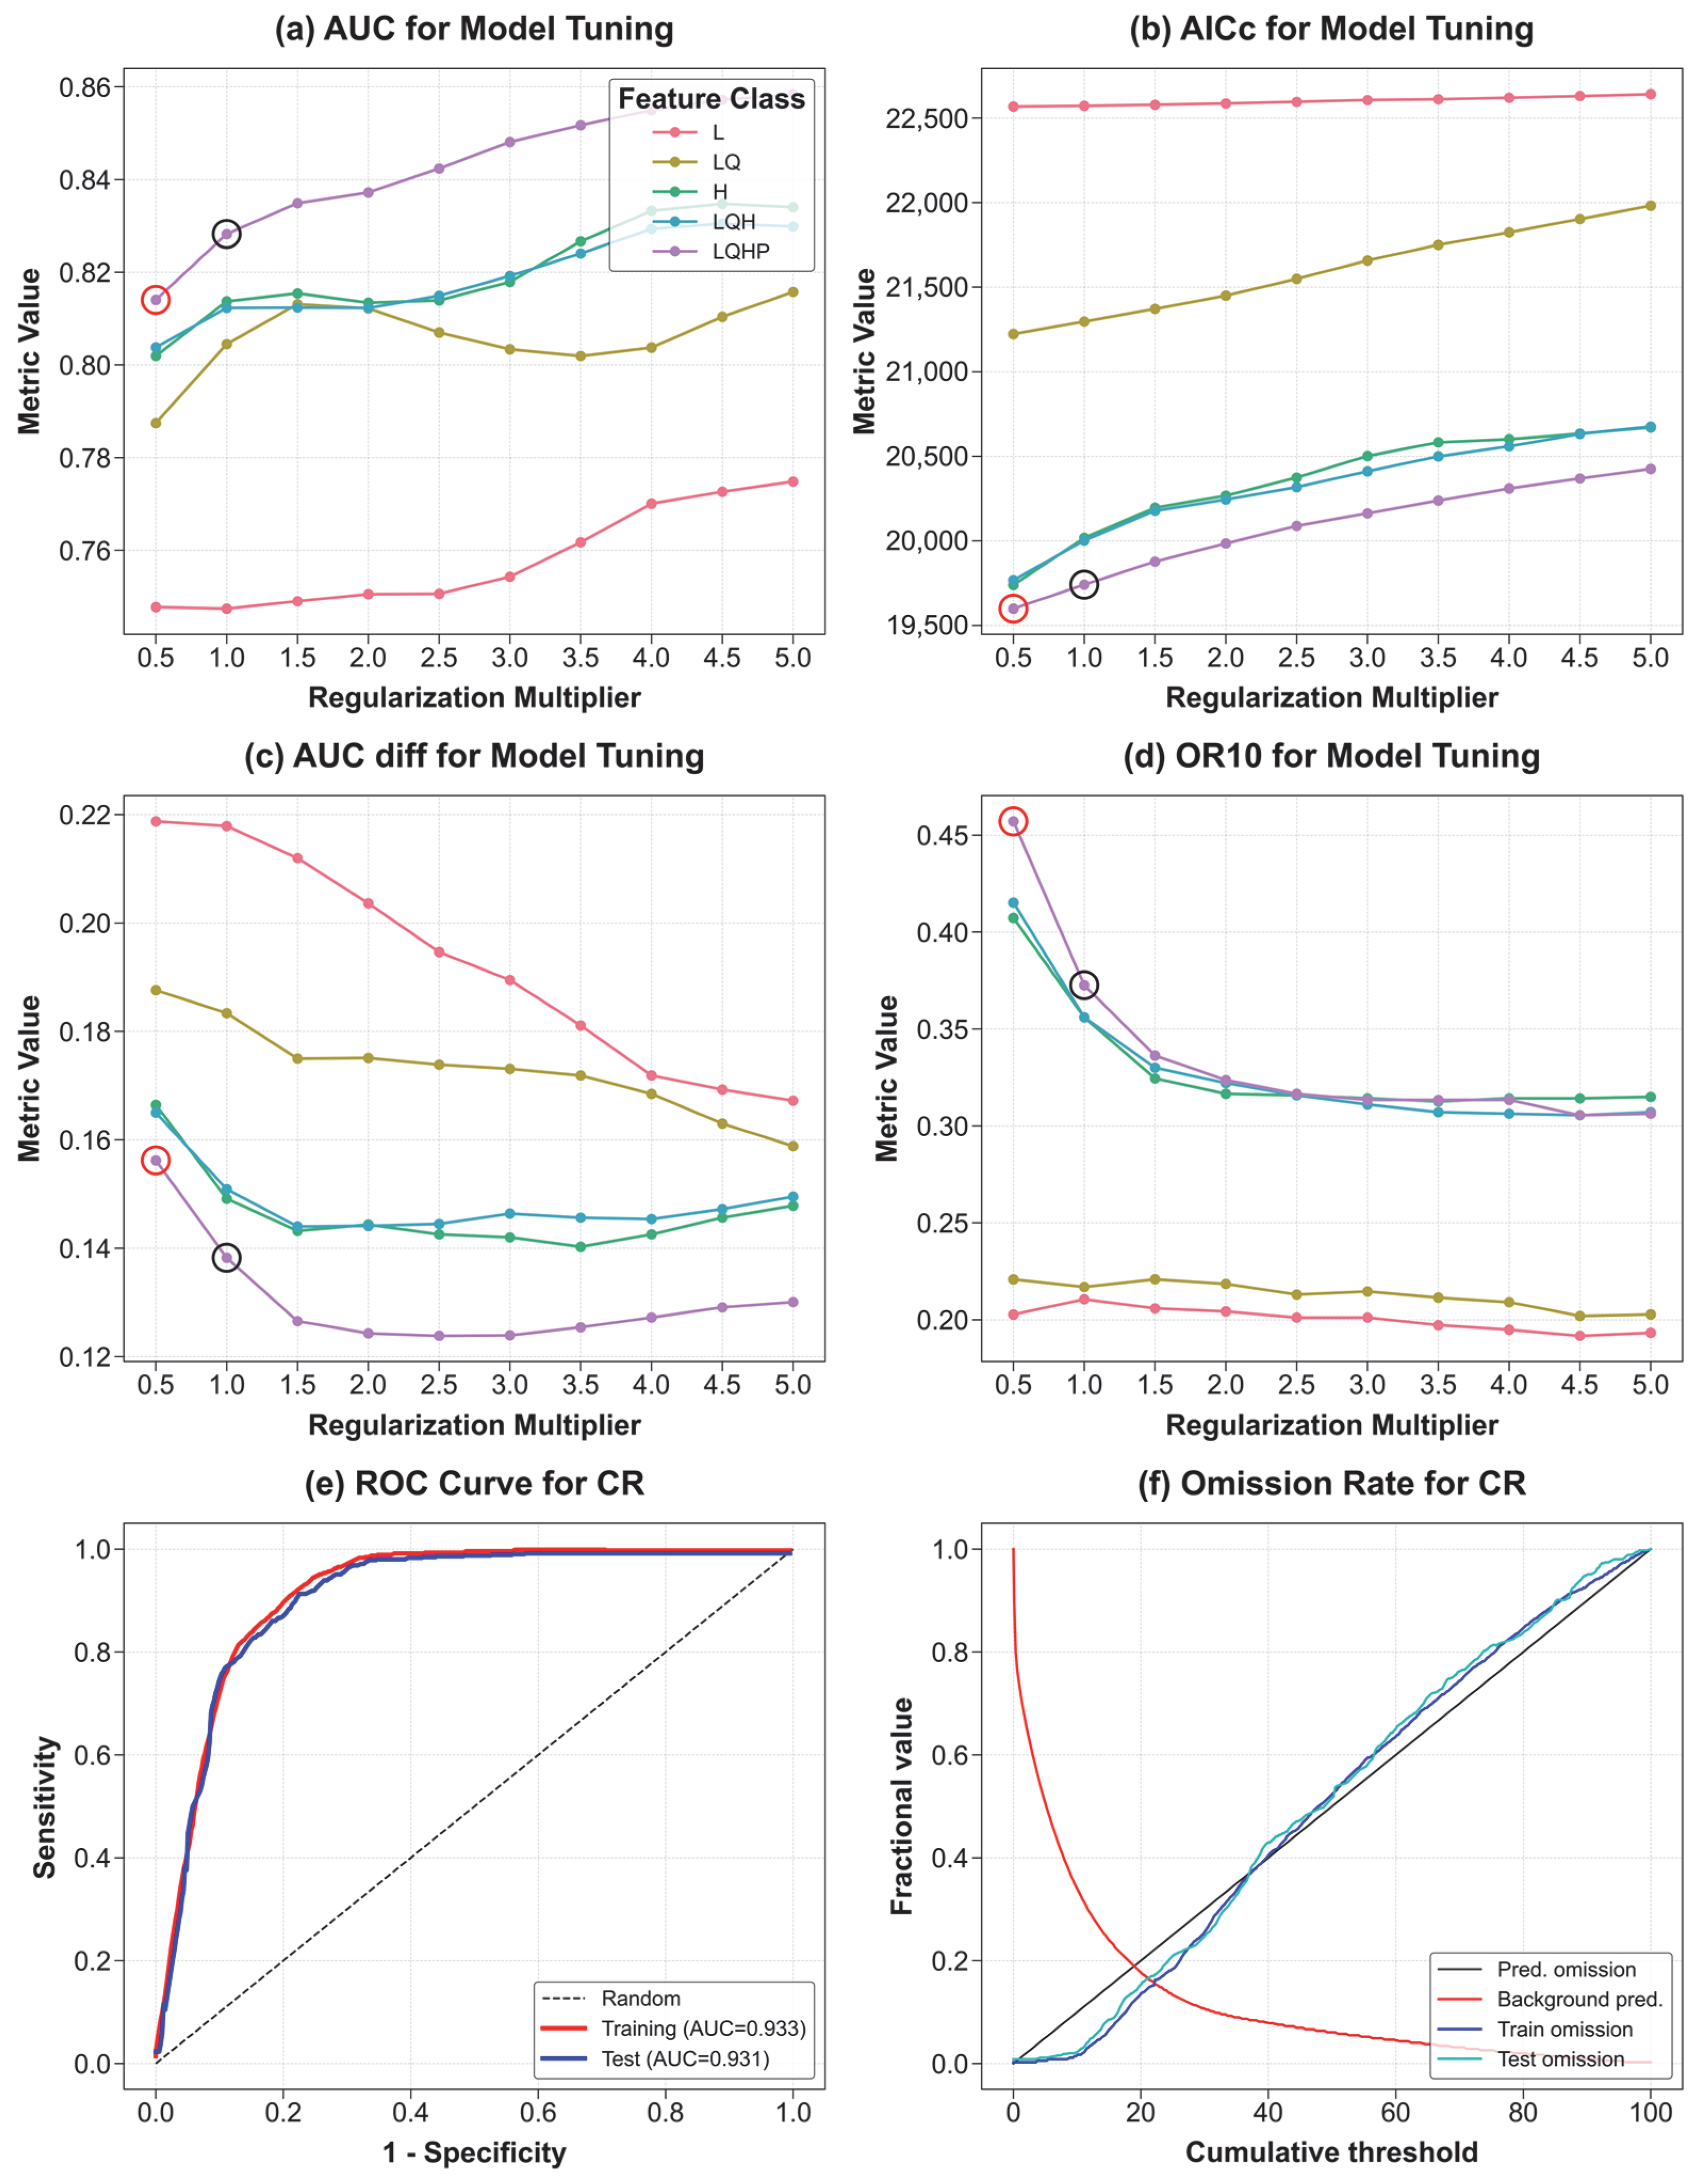
In the process of model parameter optimization, this study integrated information criteria and predictive performance (Figure 4a–d). The results indicate that the configuration of fc = LQHP and rm (regularization multiplier) = 0.5 yielded the lowest AICc value (19,598.68), representing the optimal statistical balance between model fit and parameter complexity. Although the mean validation AUC (auc.val.avg) exhibited an upward trend with the increase in the rm, reaching a peak of 0.858 at rm = 5, the significant rise in AICc suggests a potential risk of overfitting. Given that both auc.diff.avg and or.10p.avg performed favorably under this configuration, fc = LQHP, rm = 0.5 was ultimately selected as the optimal predictive model for this study.
Figure 4.
Model tuning and performance evaluation for based on the MaxEnt algorithm. (a–d) Evaluation metrics for model tuning across different feature classes (FCs) and regularization multipliers (RMs). The metrics include: (a) mean Area Under the ROC Curve (AUC) for validation, (b) Akaike Information Criterion corrected for small sample sizes (AICc), (c) AUC difference between training and validation, and (d) 10% omission rate (OR10). The red circle indicates the optimal model selected based on the lowest ΔAICc, while the black circle represents the default setting. (e) Receiver Operating Characteristic (ROC) curve for the final model (CR), showing training and test data performance relative to a random prediction. (f) Omission rate and predicted area for the final model (CR) across various cumulative thresholds.
In Figure 4e,f, the results indicate that local environmental characteristics served as precise indicators for predicting the distribution of the coral habitats. Specifically, as shown in Figure 4e, the AUC values for the training and test datasets were 0.933 and 0.931, respectively. The minimal difference between the training and test AUC values, combined with the nearly overlapping ROC curves, demonstrated that the model possessed strong generalization capability and effectively mitigated overfitting.
Furthermore, the analysis of omission rate versus predicted area (Figure 4f) revealed that the actual omission rate curve for the test data closely tracked the predicted omission diagonal. This alignment indicates that the model’s performance across various cumulative thresholds was consistent with theoretical expectations, further confirming its reliability. In summary, the model demonstrated high robustness and accurately reflected the potential spatial distribution of suitable habitats for coral reefs in the SCS.
3.2. Habitat Suitability Patterns of Coral Reefs in the SCS
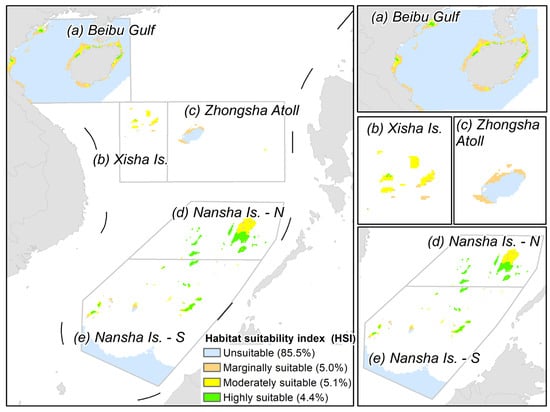
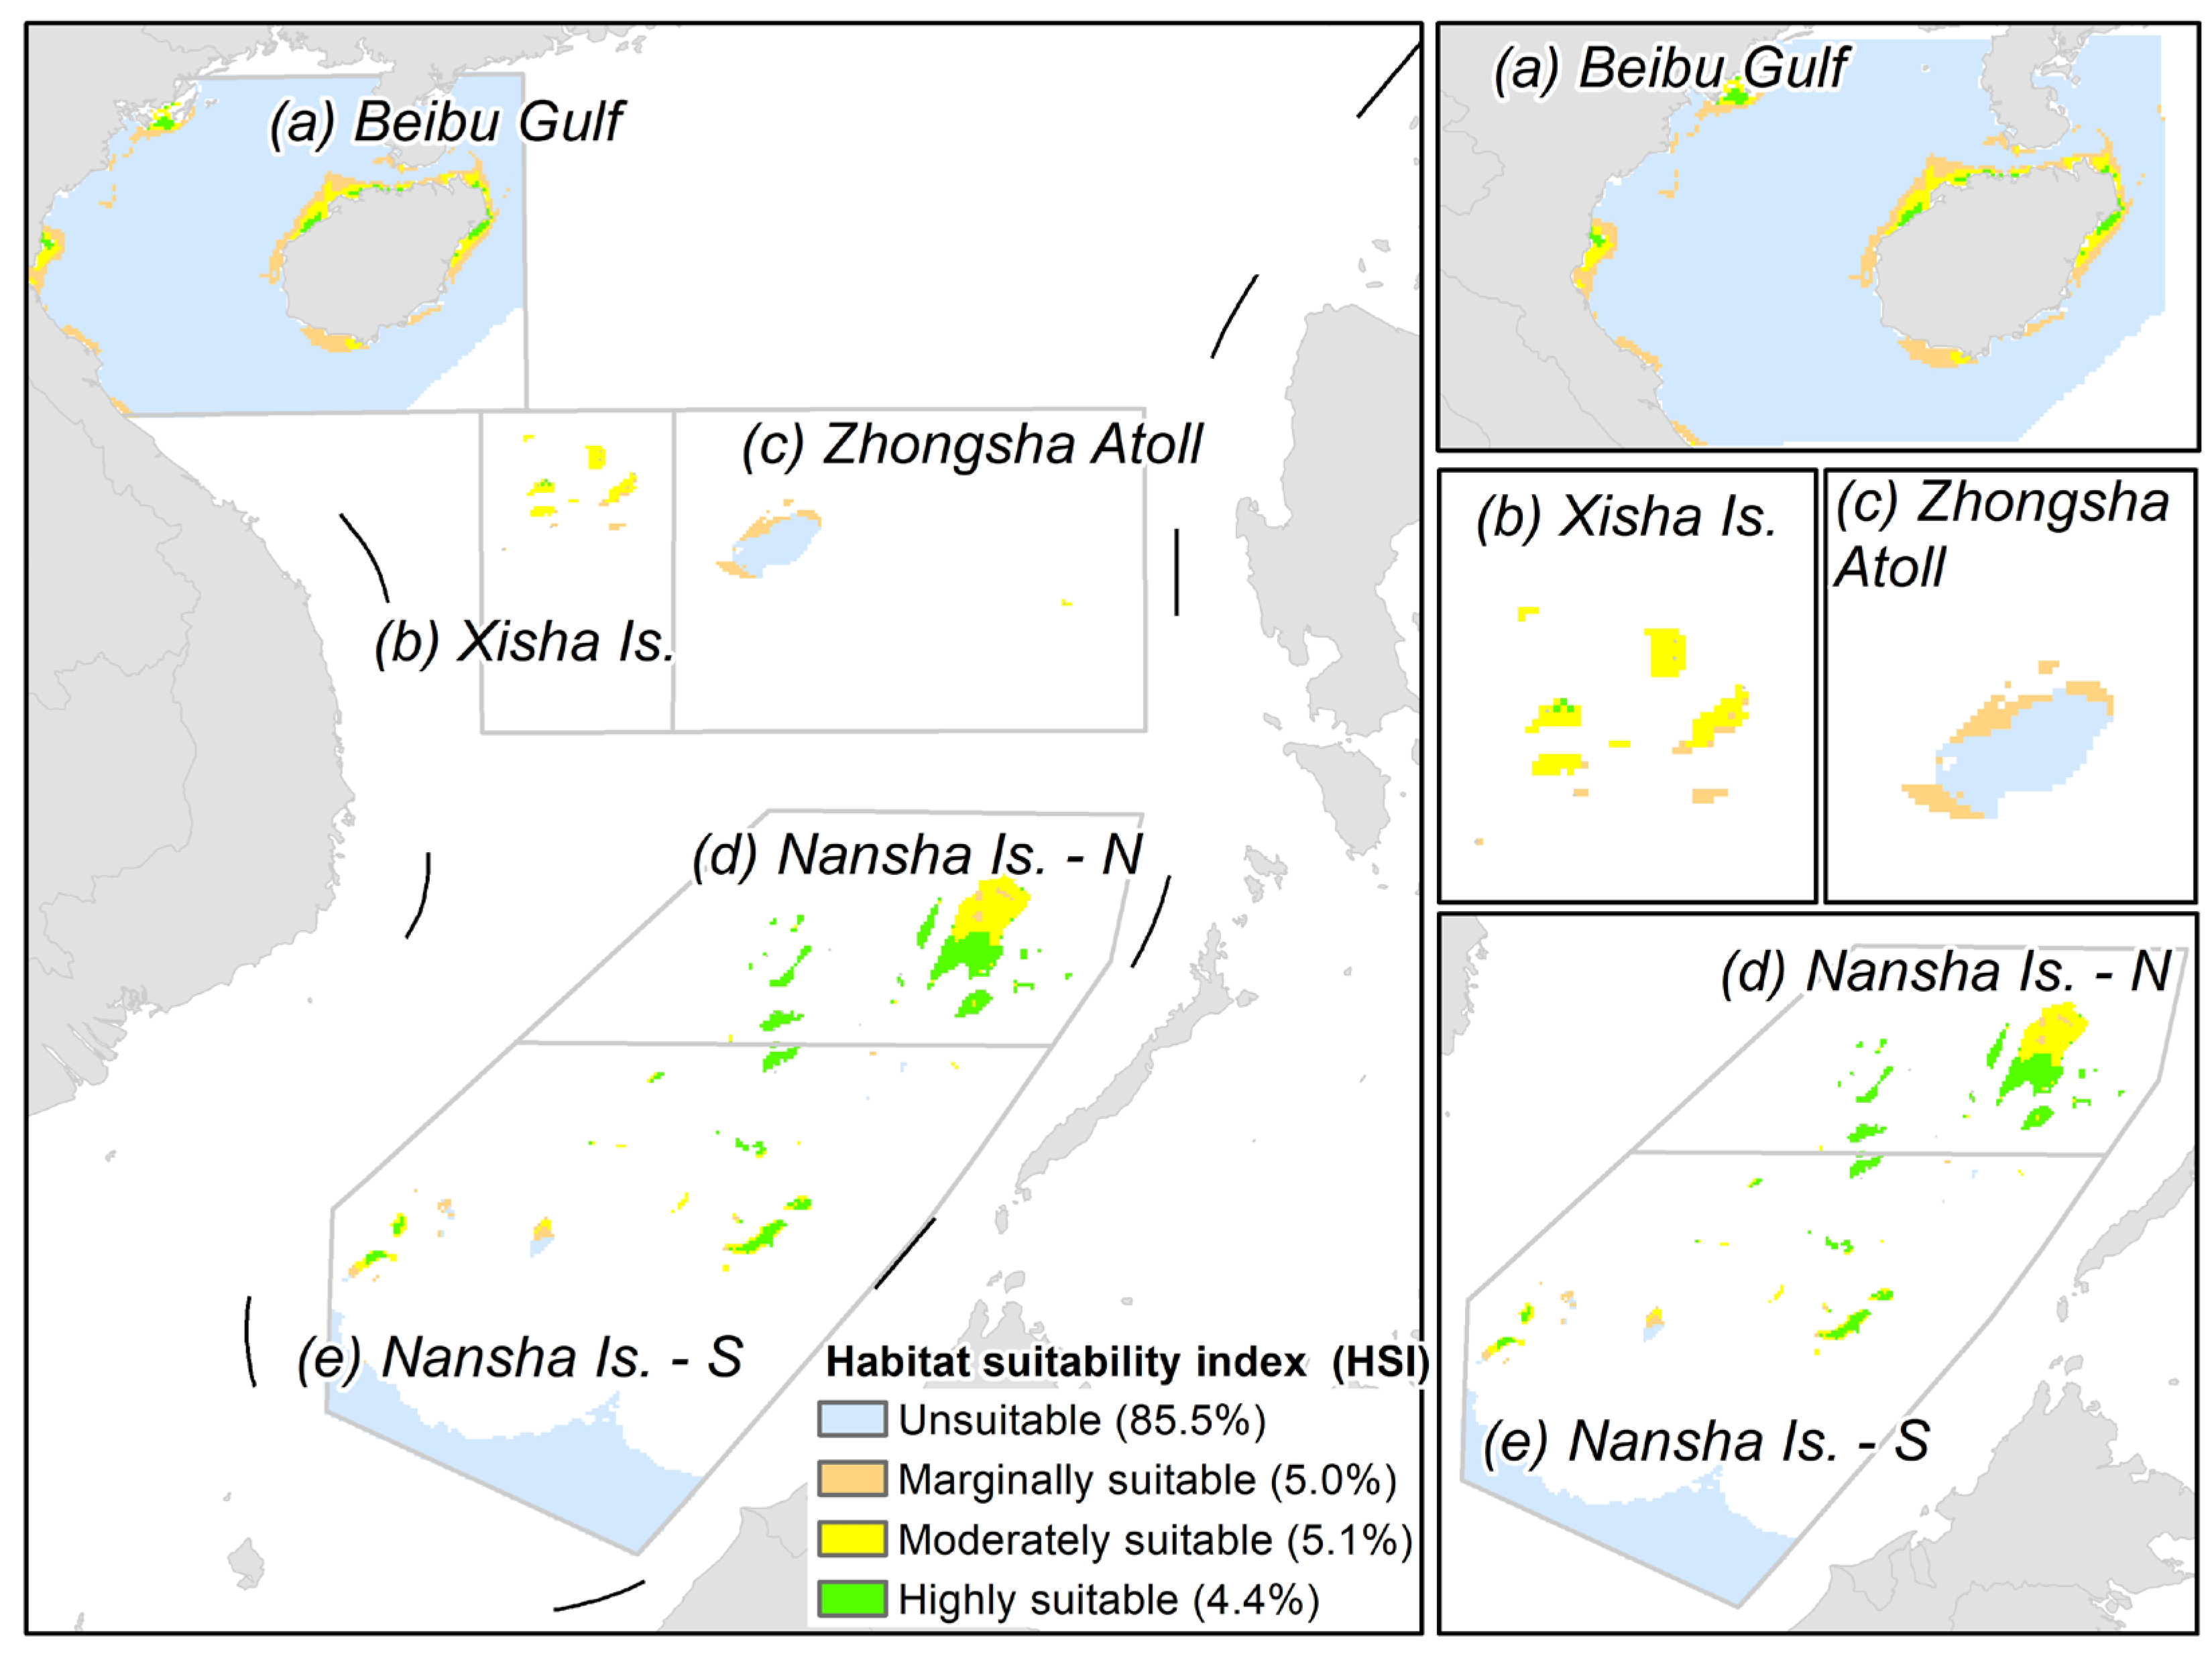
The spatial distribution of habitat suitability for coral reefs in the SCS exhibited a significant heterogeneity pattern (Figure 5). Quantitative analysis of the Habitat Suitability Index (HSI) revealed that Unsuitable areas dominated the study region, accounting for 85.5% of the total area, primarily corresponding to expansive deep-water basins. Among the regions identified with growth potential, Marginally Suitable areas comprised 5.0% and were mainly distributed in a continuous band along the coast of Hainan Island and the nearshore waters of northeastern Vietnam (Figure 5a). Highly Suitable habitats accounted for 4.4% of the region, displaying a distinct “High South, Low North” latitudinal gradient. The distribution of these suitable habitats presented clear regional characteristics: in the Xisha Islands (Figure 5b), highly suitable areas were scattered and restricted to the immediate vicinity of specific reefs, surrounded by vast unsuitable zones. In the Zhongsha Islands (Figure 5c), Huangyan Island stood out as a high-suitability hotspot. Notably, the Nansha Islands exhibited prominent north south differentiation: the northern Nansha Islands (Figure 5d), particularly Reed Tablemount, constituted the most concentrated and continuous area of highly suitable habitats in the entire SCS. In contrast, suitable areas in the southern and central-western Nansha Islands (Figure 5e) were more fragmented, characterized by patchy distributions around isolated islands and reefs.
Figure 5.
Predicted patterns of habitat suitability index of coral reefs in the SCS. The percentages in the legend represent different types of area proportions.
3.3. Influence of Environmental Factors on Coral Reef Distribution
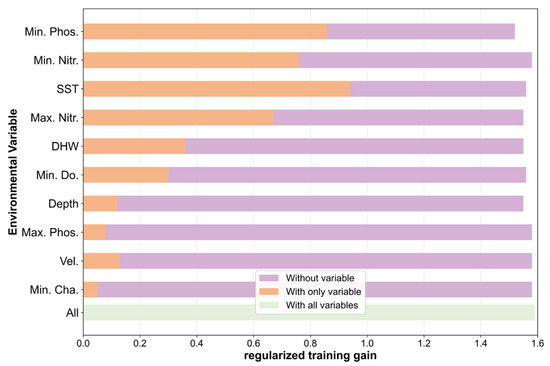
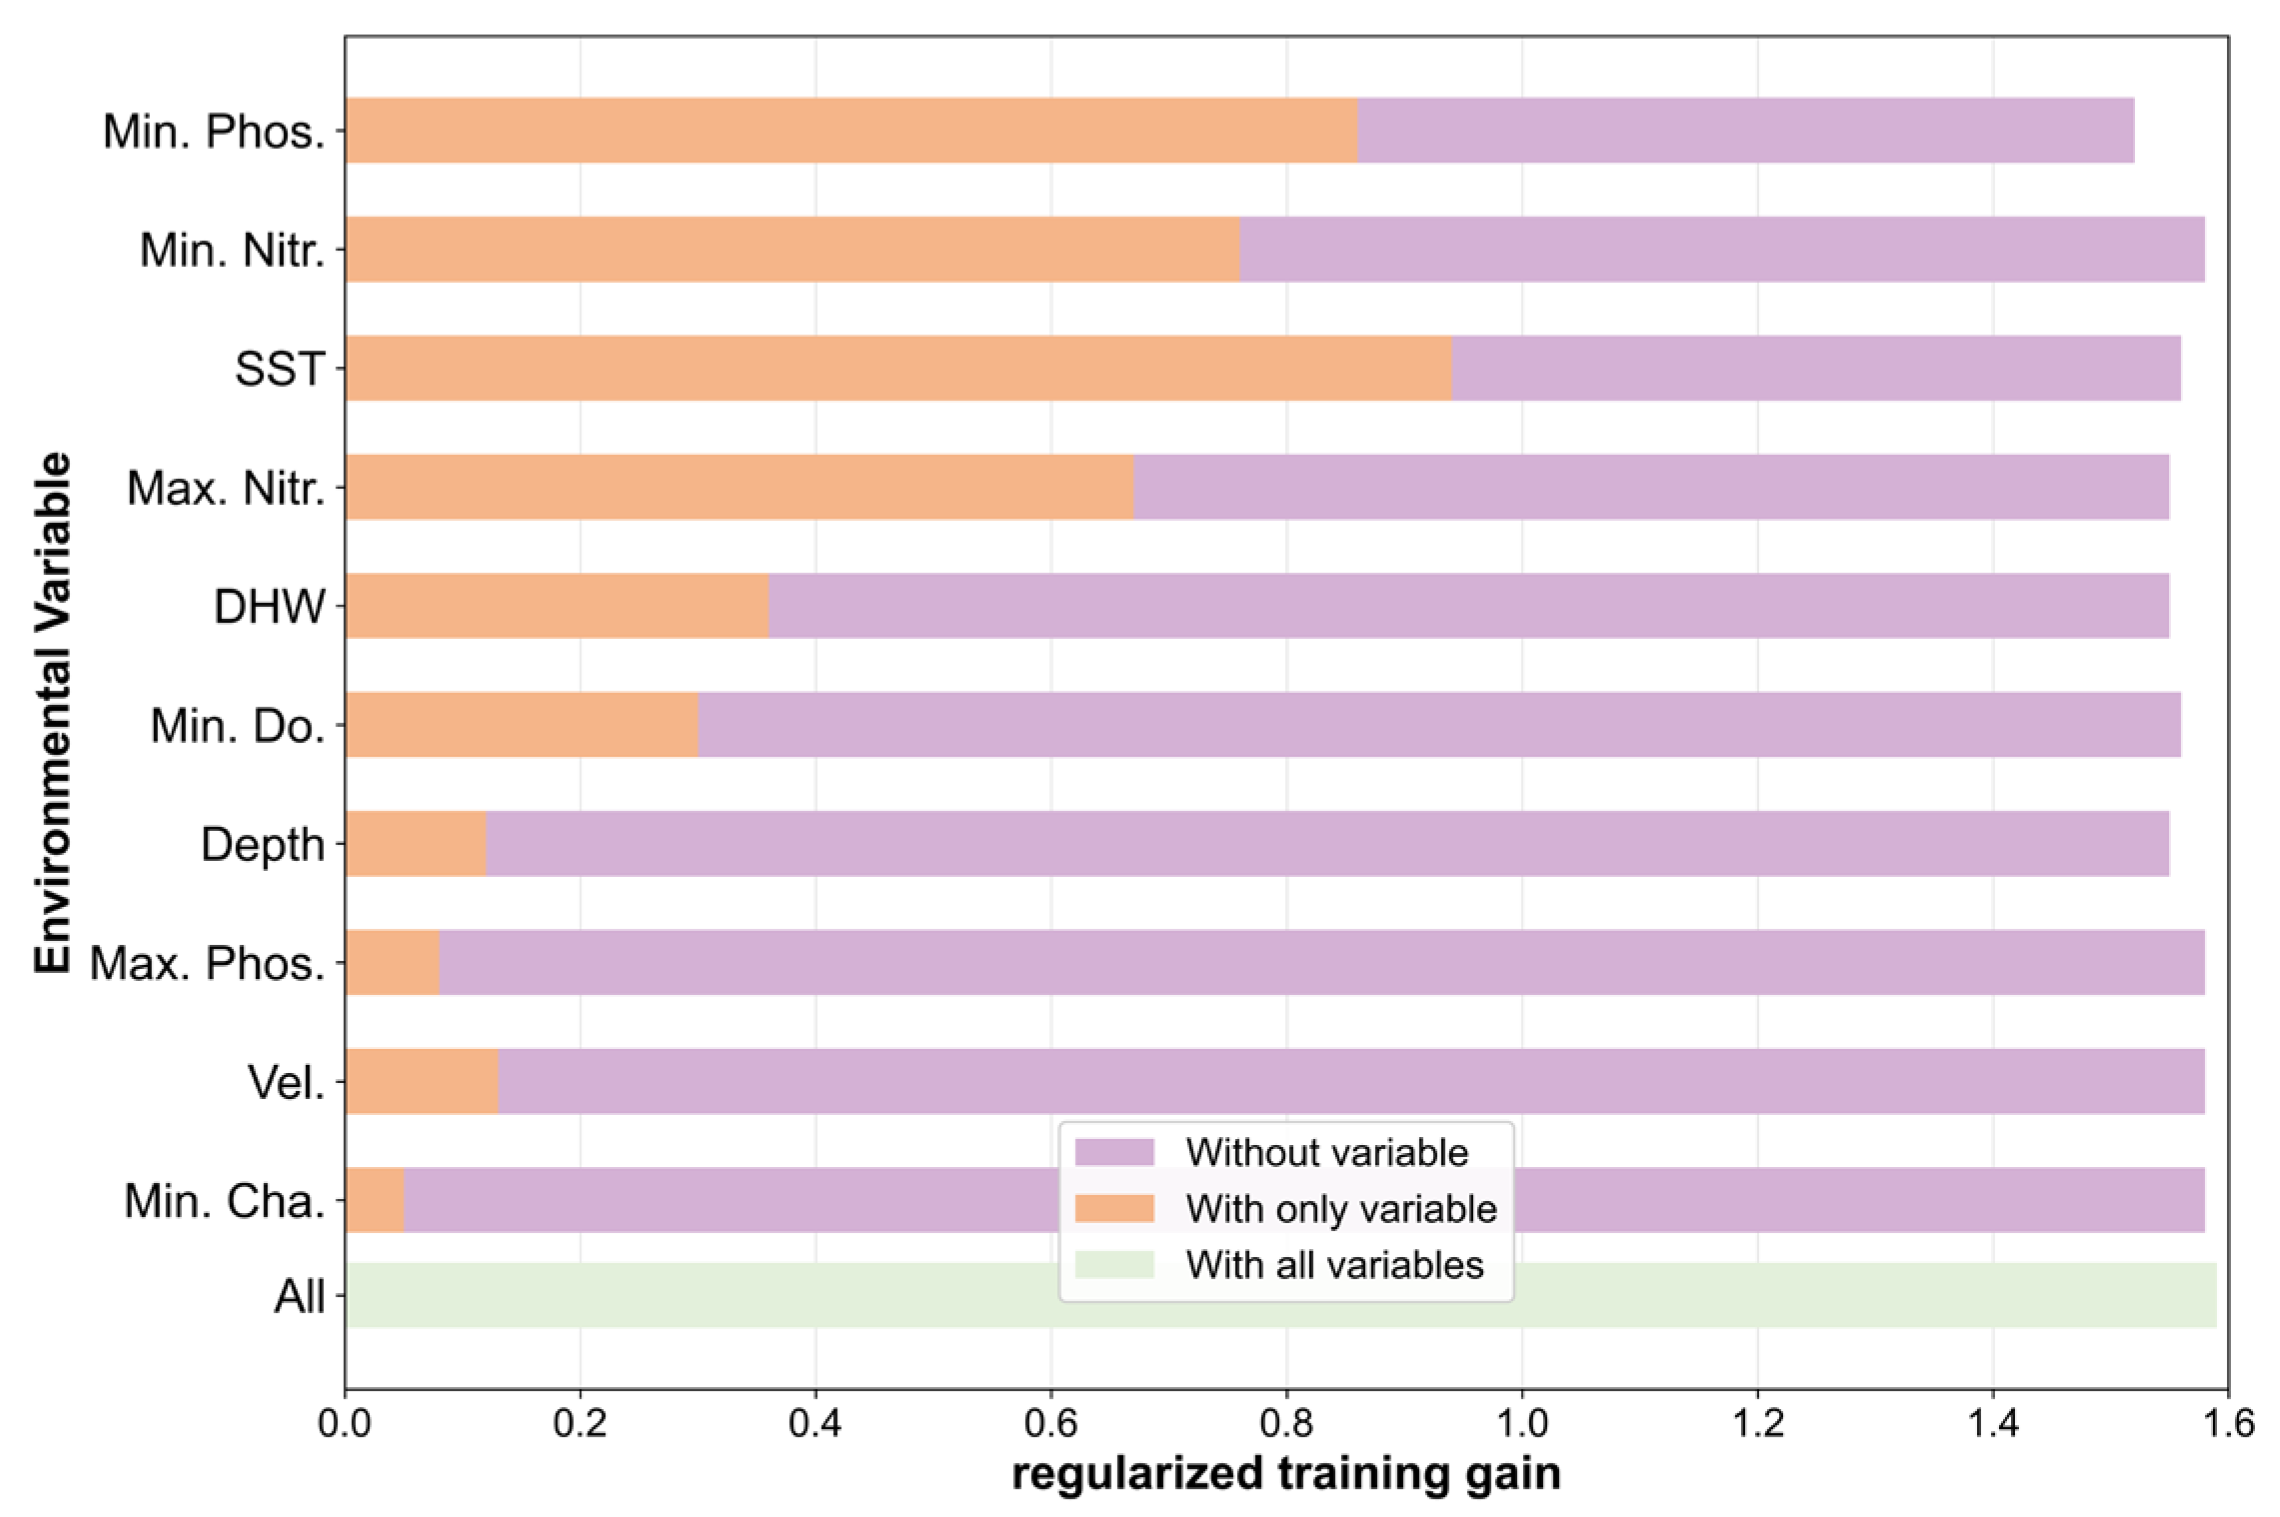
The results indicated that Minimum Phosphate (Min. Phos.) concentration and Sea Surface Temperature (SST) were the core environmental factors determining the distribution of corals in the South China Sea (Figure 5, Figure 6 and Figure 7). Model predictions showed that corals tended to inhabit oligotrophic, clear-water environments characterized by temperatures around 28.52–29.41 °C, water depths shallower than 34 m, and low nutrient concentrations.
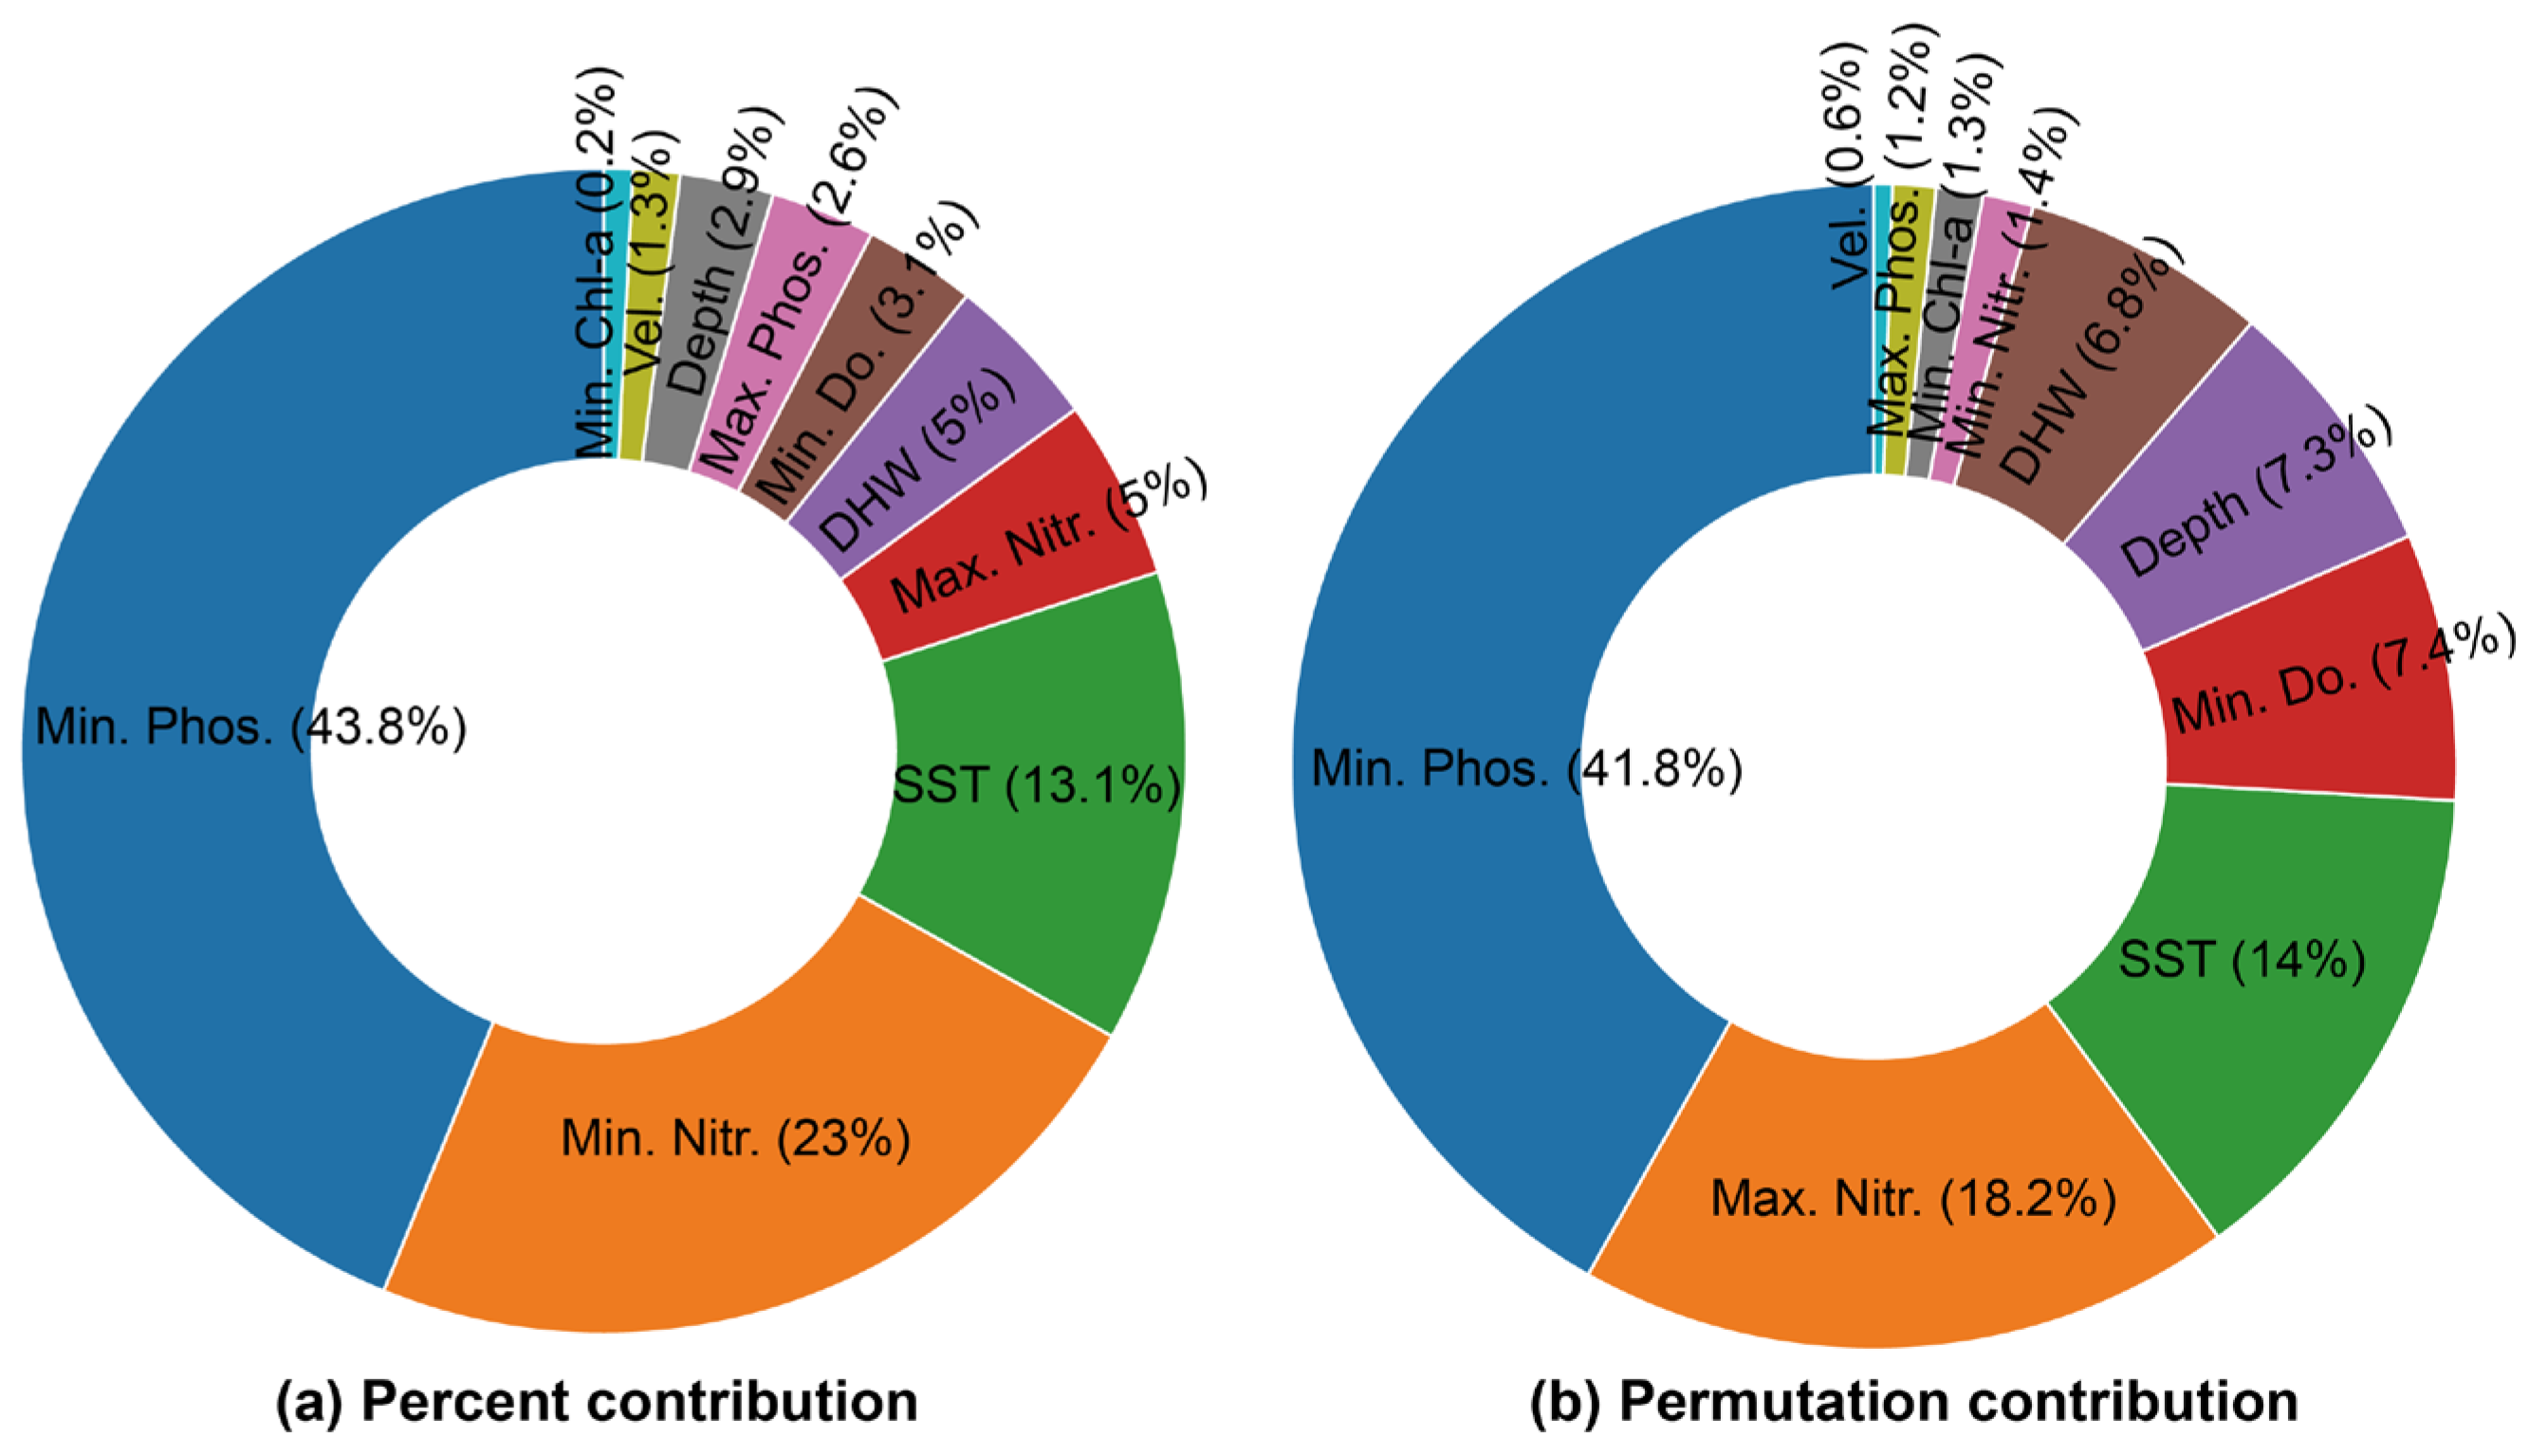
Figure 6.
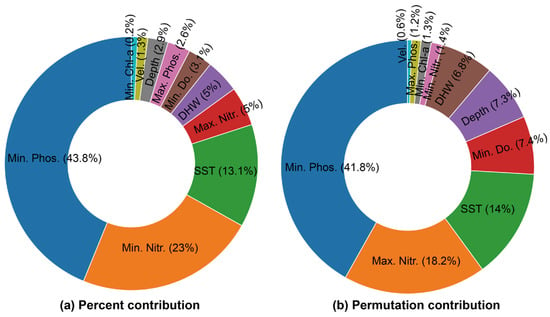
Evaluation of the relative contributions of environmental variables to the MaxEnt model. (a) Percent contribution. (b) Permutation importance. The percent contribution indicates the importance of a specific variable during the model construction process, whereas permutation importance reflects the dependence of the model’s predictive accuracy on each variable. Note: Abbreviations: SST, Sea Surface Temperature; DHW, Degree Heating Weeks; Depth, Water depth (Bathymetry); Vel., Seawater velocity; Min./Max Phos., Minimum/Maximum Phosphate; Min./Max Nitr., Minimum/Maximum Nitrate; Min. Chl-a, Minimum Chlorophyll-a; Min. Do., Minimum Dissolved Oxygen.
Figure 7.
Assessment of the influence of environmental variables on coral distribution using the Jackknife test. The Jackknife test further evaluated the independent influence of each environmental variable on the model. Note: Abbreviations: SST, Sea Surface Temperature; DHW, Degree Heating Weeks; Depth, Water depth (Bathymetry); Vel., Seawater velocity; Min./Max Phos., Minimum/Maximum Phosphate; Min./Max Nitr., Minimum/Maximum Nitrate; Min. Cha., Minimum Chlorophyll-a; Min. Do., Minimum Dissolved Oxygen.
Evaluation of variable contributions (Figure 6) revealed that Min. Phos. played a dominant role in model construction, with a percent contribution of 43.8% and a permutation importance of 41.8%. This indicated that this variable not only held the highest weight during model development but also had the most significant impact on predictive accuracy. Meanwhile, Maximum Nitrate (Max. Nitr.) exhibited a high permutation importance of 18.2%, while SST consistently constrained the suitable distribution range with a contribution of 13.1%, collectively forming the primary environmental framework for coral distribution in the region.
The Jackknife test further elucidated the independent contribution of each environmental variable and the unique information they provided (Figure 6). The results showed that SST was the strongest independent predictor, achieving the highest regularized training gain when used in isolation, which suggested it contained the most useful information for geographical distribution. Concurrently, when Min. Phos. was omitted from the model, the gain decreased most significantly. This demonstrated that the phosphate variable contained unique information that could not be substituted by other factors, making it indispensable for explaining the spatial distribution patterns of corals in the South China Sea.
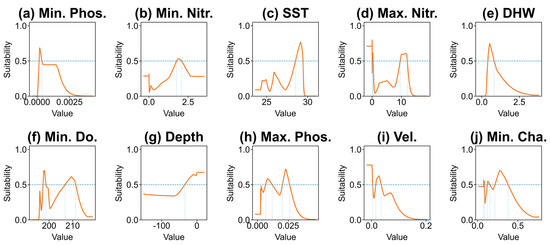
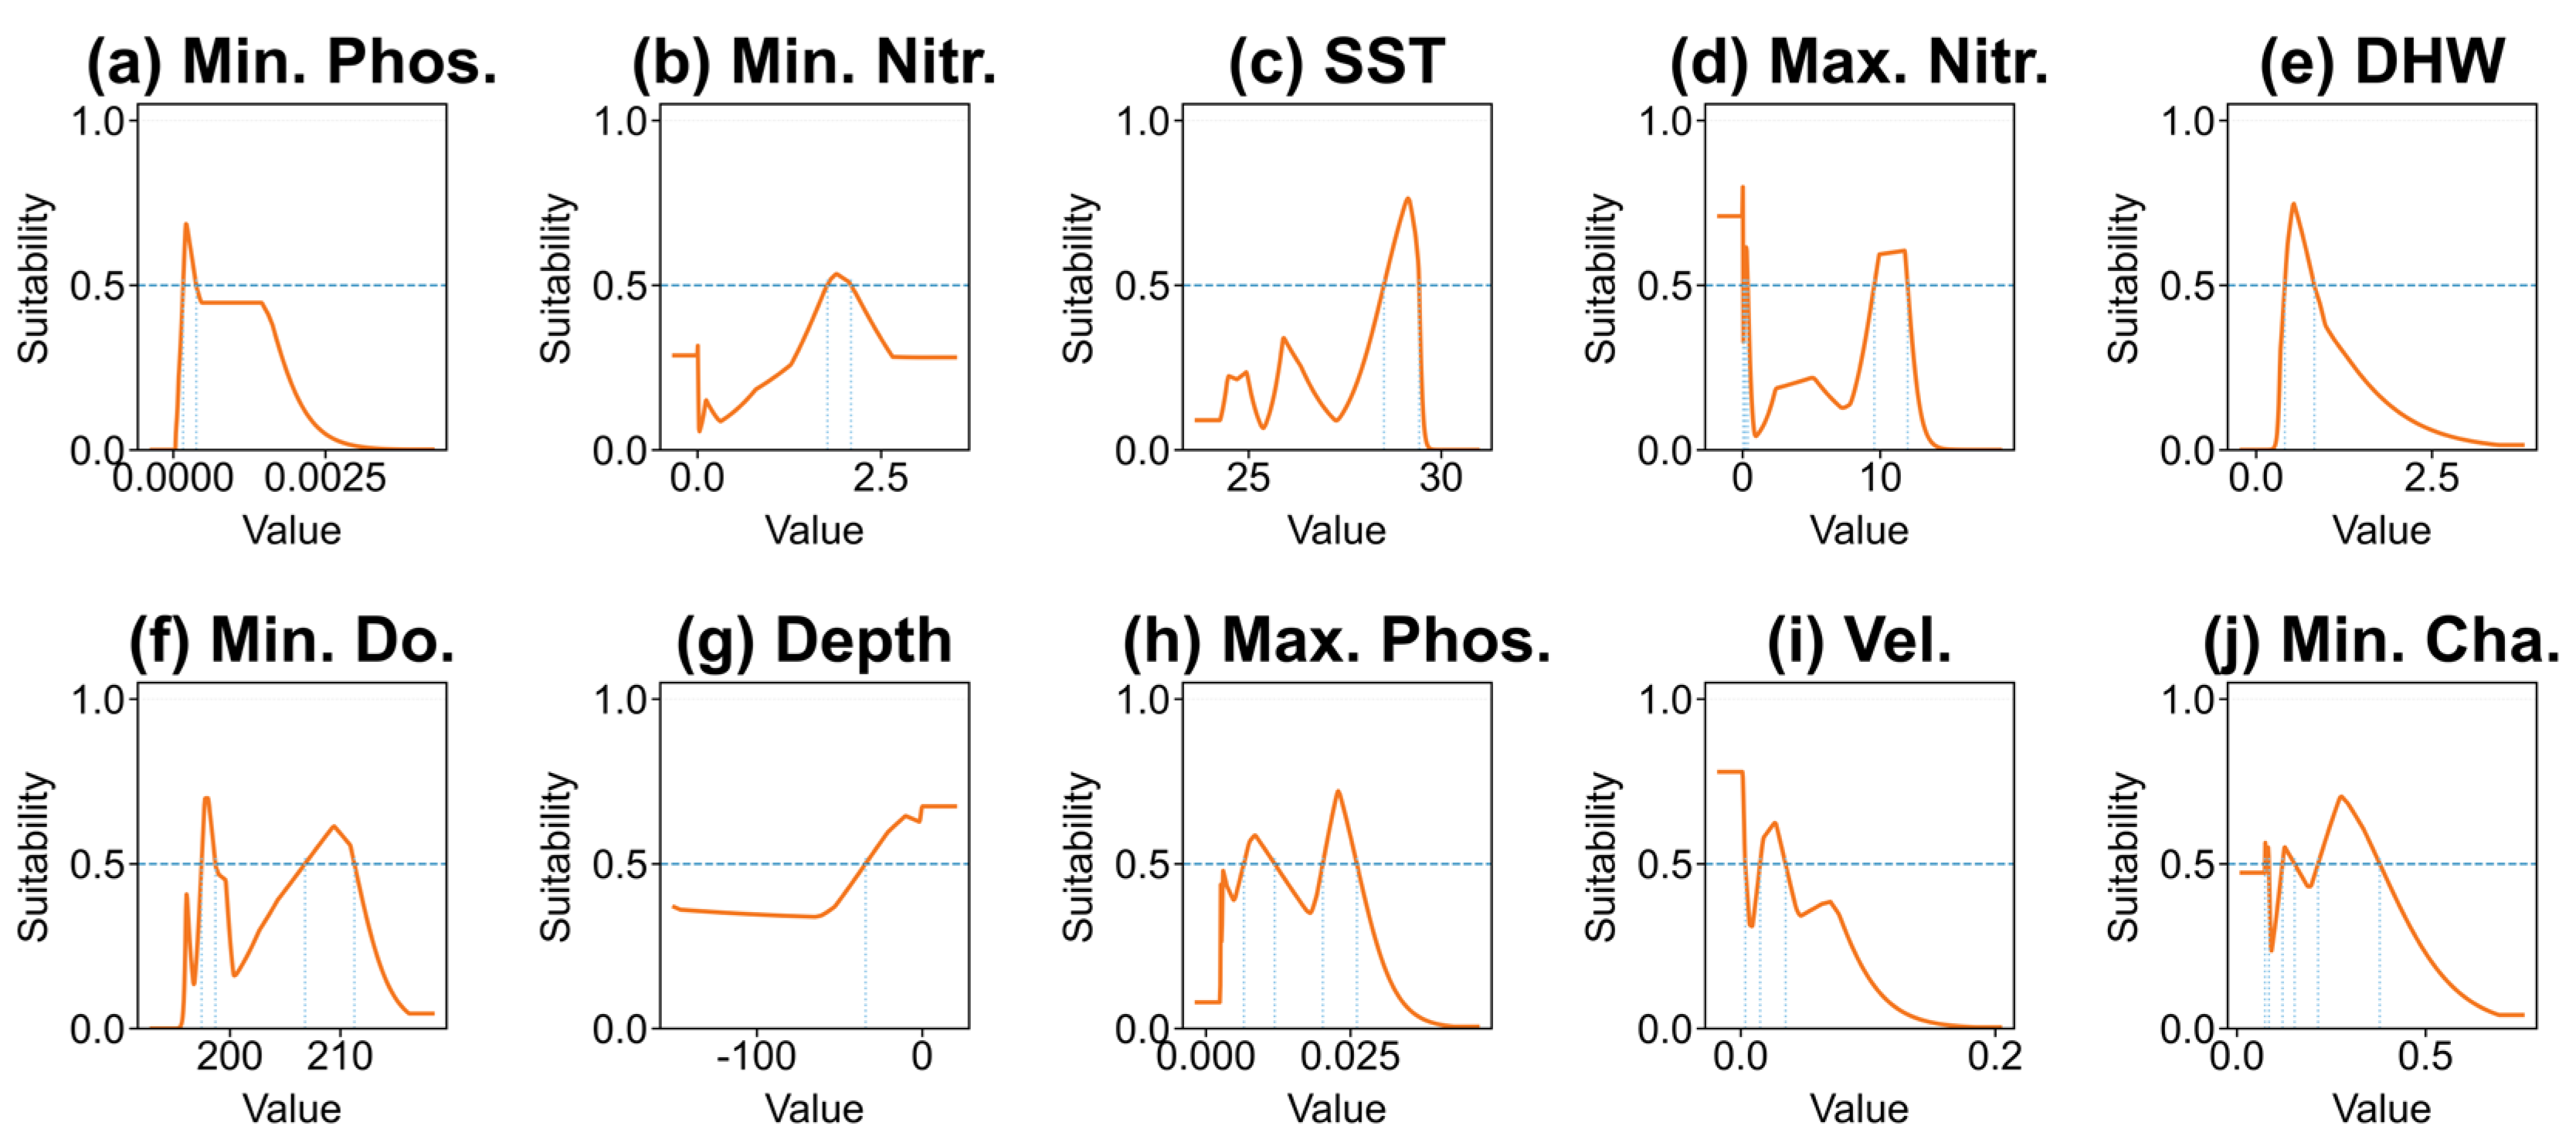
Regarding environmental response characteristics, the univariate response curves (Table 3 and Figure 8) provided a detailed characterization of how each factor influenced coral distribution. Min. Phos. showed peak suitability when approaching zero (0–0.005 mmol/m3), reflecting a typical preference for oligotrophic conditions, while Min. Nitr. indicated a stable adaptation within the 1.77–2.09 mmol/m3 range. The response of SST followed a prominent unimodal shape with an optimal range of 28.52–29.41 °C, whereas Max. Nitr. exhibited multimodal tolerance with a secondary peak observed at 9.61–11.98 mmol/m3. Furthermore, the suitability for Degree Heating Weeks (DHW) dropped sharply once the threshold of 0.83 °C-weeks was exceeded.
Table 3.
Optimal ranges of environmental variables.
Figure 8.
Univariate response curves for environmental variables in the MaxEnt model for South China Sea coral reefs. (a) Min. Phos., (b) Min. Nitr., (c) SST, (d) Max. Nitr., (e) DHW, (f) Min. Do., (g) Depth, (h) Max. Phos., (i) Vel., (j) Min. Cha. Each curve represents the MaxEnt model prediction generated using only the corresponding variable. The vertical axis represents the logistic probability of presence, while the horizontal axis represents the value range of the environmental variable. Note: Abbreviations: SST, Sea Surface Temperature; DHW, Degree Heating Weeks; Depth, Water depth (Bathymetry); Vel., Seawater velocity; Min./Max Phos., Minimum/Maximum Phosphate; Min./Max Nitr., Minimum/Maximum Nitrate; Min. Cha., Minimum Chlorophyll-a; Min. Do., Minimum Dissolved Oxygen. The blue dashed lines indicate the thresholds.
Further analysis of physicochemical and spatial factors showed that Minimum Dissolved Oxygen (Min. Do.) was most favorable for coral respiratory needs in the high-oxygen range of 206.8–211.2 mmol/m3. Water Depth clearly defined a concentrated distribution within the shallow photic zone of 0.33–33.89 m. Sensitivity to nutrient fluctuations was evident as Maximum Phosphate (Max. Phos.) increased, causing significant fluctuations in suitability. Additionally, Seawater Velocity (Vel.) maintained high suitability only in low-energy environments of 0.01–0.03 m/s. Finally, Minimum Chlorophyll-a (Min. Chl-a) showed the highest suitability in the low concentration range of 0.22–0.38 mg/m3, again validating the critical importance of high-water transparency for coral reef ecosystems in the South China Sea.
3.4. Environmental Characteristics of Coral Habitats
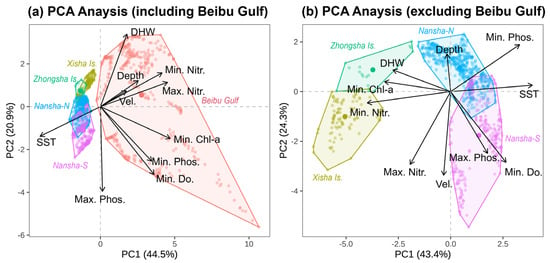
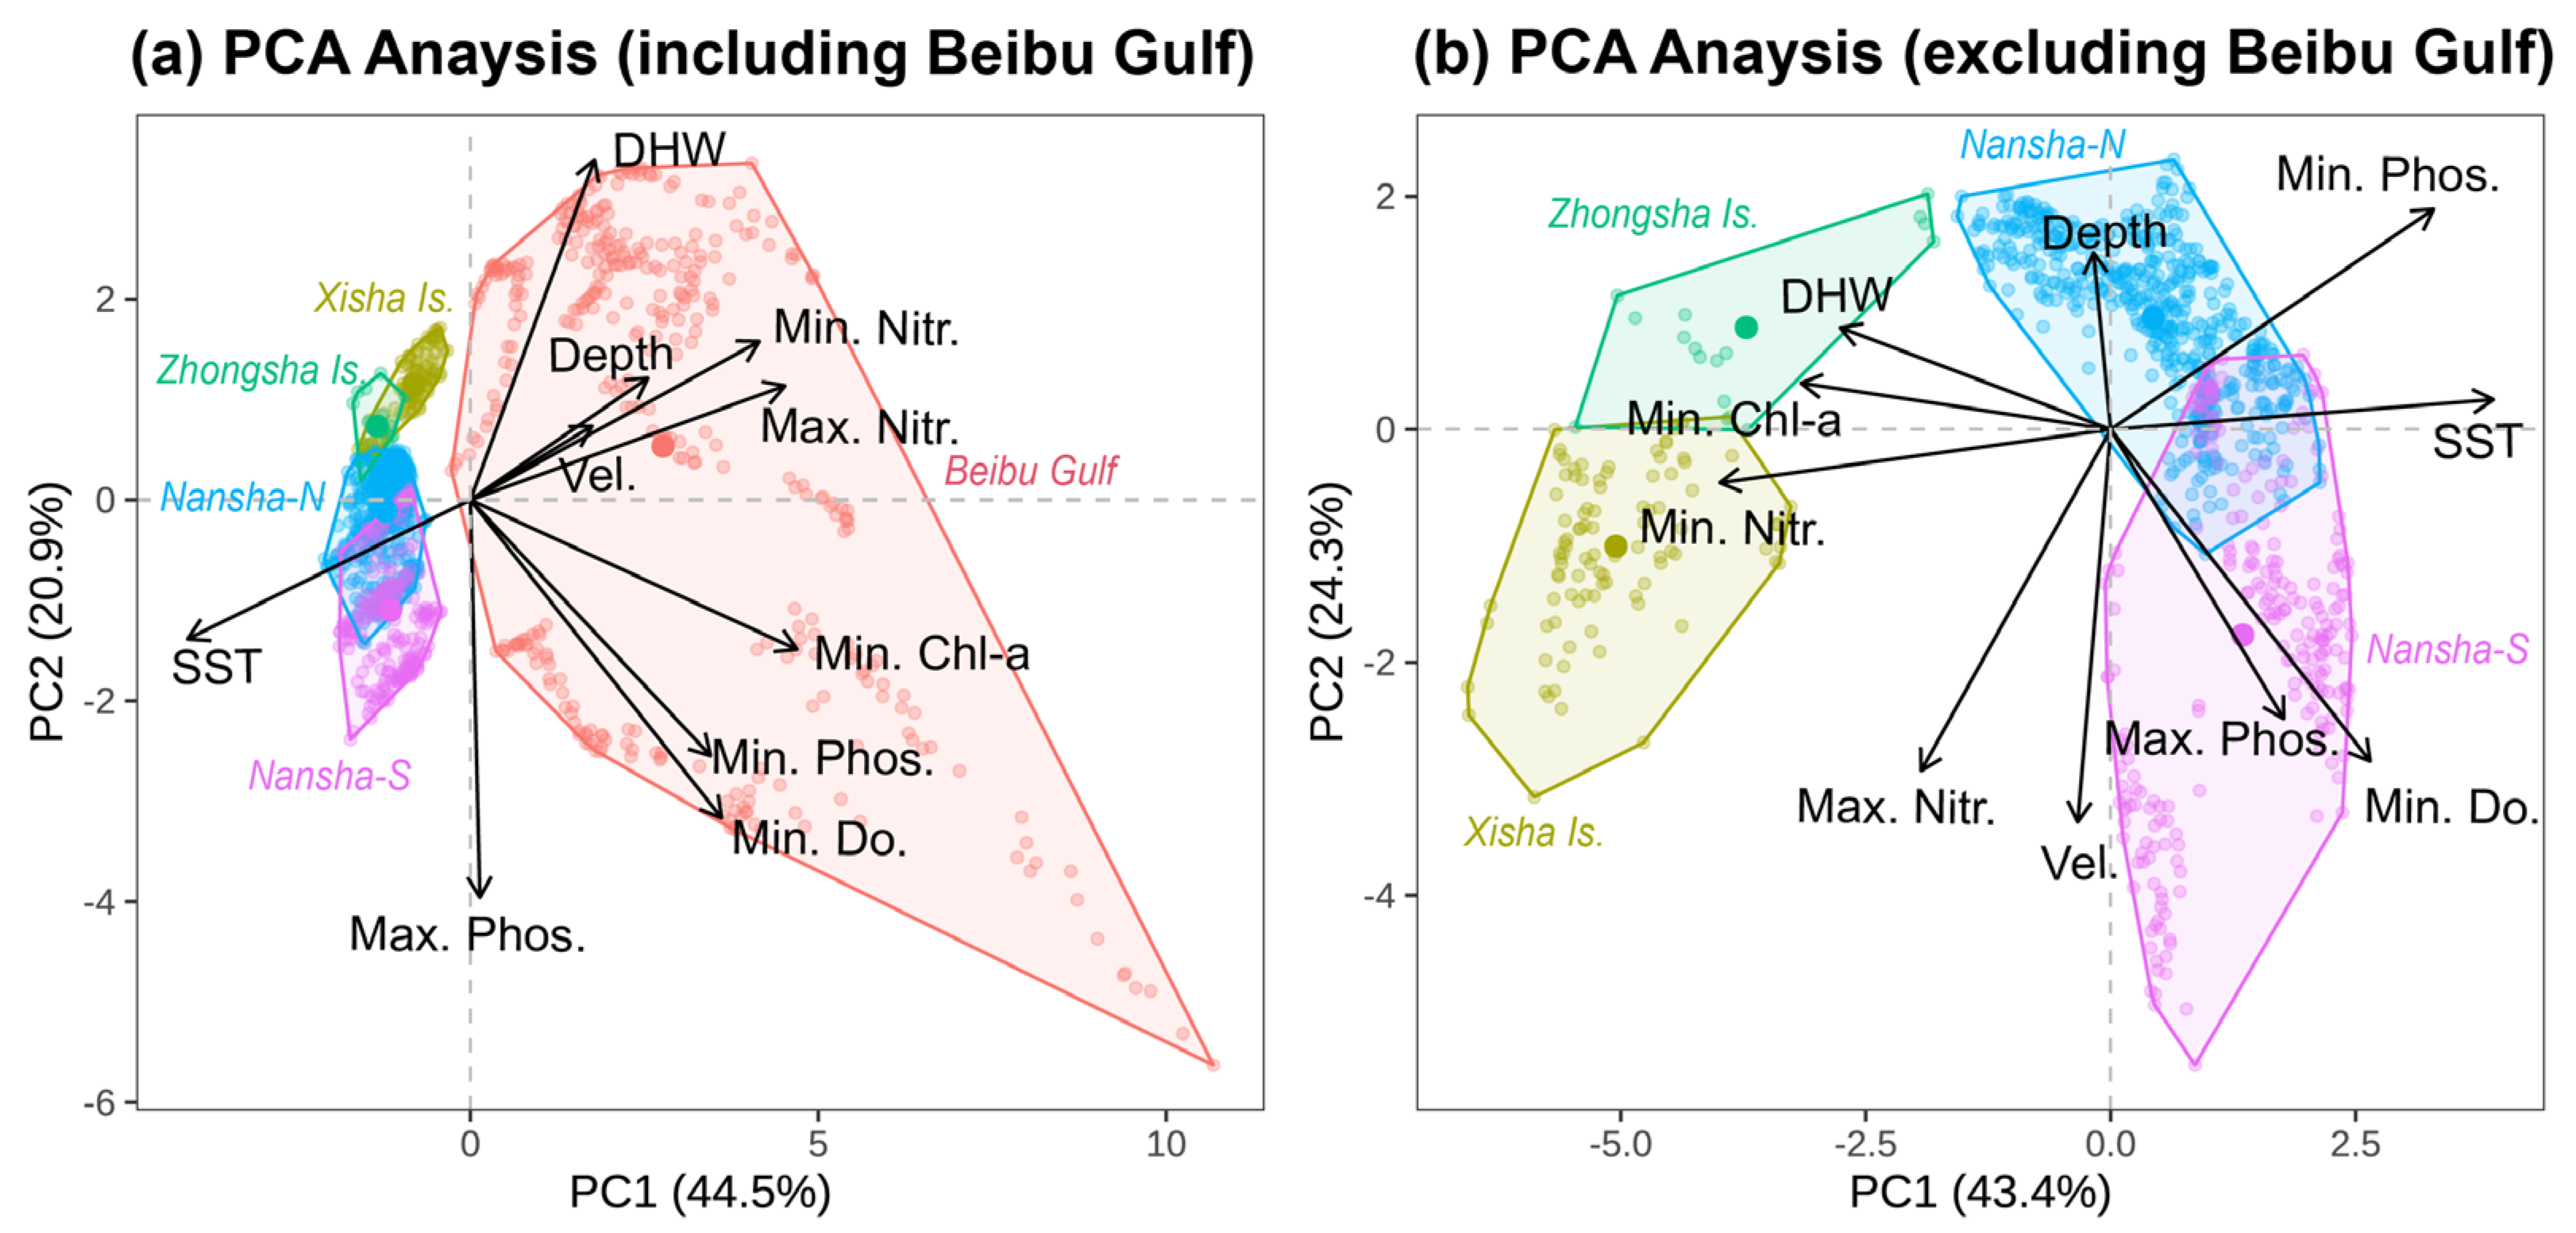
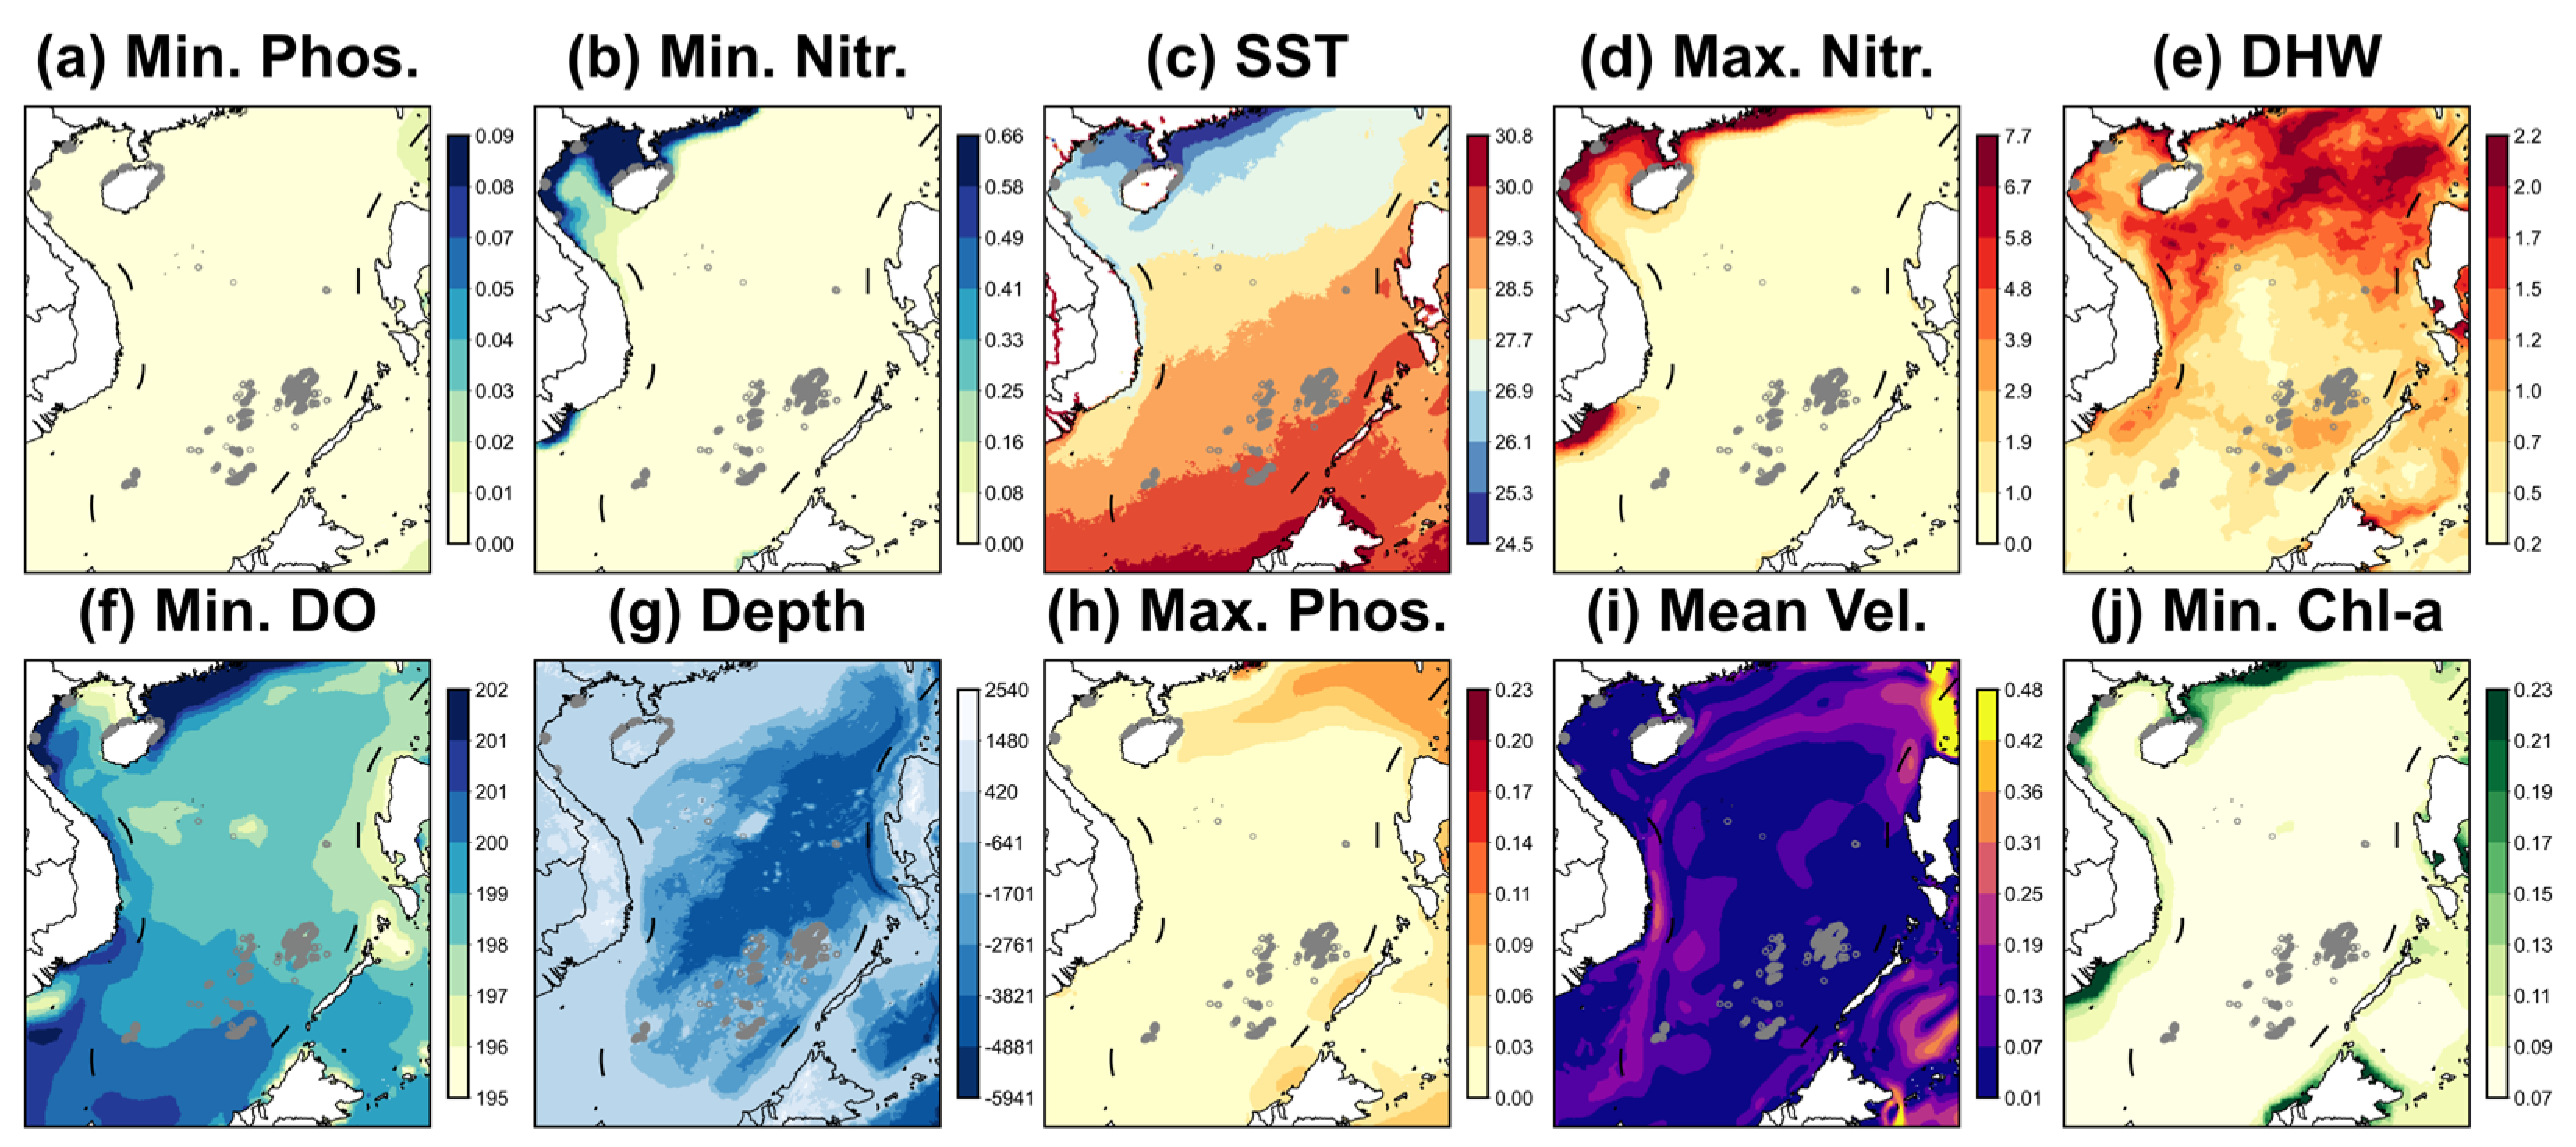
Figure 9, Figure 10 and Figure 11 illustrate that the environmental niches of coral habitats across different regions of the South China Sea exhibited significant spatial heterogeneity and regional clustering, primarily driven by gradients in nutrient concentrations, thermal conditions, and bathymetry. Specifically, the Beibu Gulf was identified as a distinct environmental region characterized by high nutrient loads, lower temperatures, and higher Degree Heating Weeks (DHW). In contrast, the offshore oceanic islands (Xisha, Zhongsha, and Nansha) displayed more similar environmental profiles, defined by oligotrophic conditions and higher temperatures.
Figure 9.
Principal Component Analysis (PCA) of environmental niches across distinct coral reef regions in the SCS. (a) PCA analysis including Beibu Bulf and (b) PCA analysis excluding Beibu Bulf. Note: Abbreviations: SST, Sea Surface Temperature; DHW, Degree Heating Weeks; Depth, Water depth (Bathymetry); Vel., Seawater velocity; Min./Max Phos., Minimum/Maximum Phosphate; Min./Max Nitr., Minimum/Maximum Nitrate; Min. Chl-a, Minimum Chlorophyll-a; Min. Do., Minimum Dissolved Oxygen.
Figure 10.
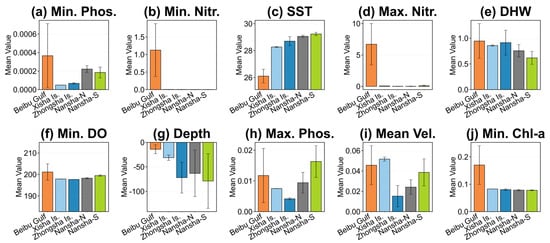
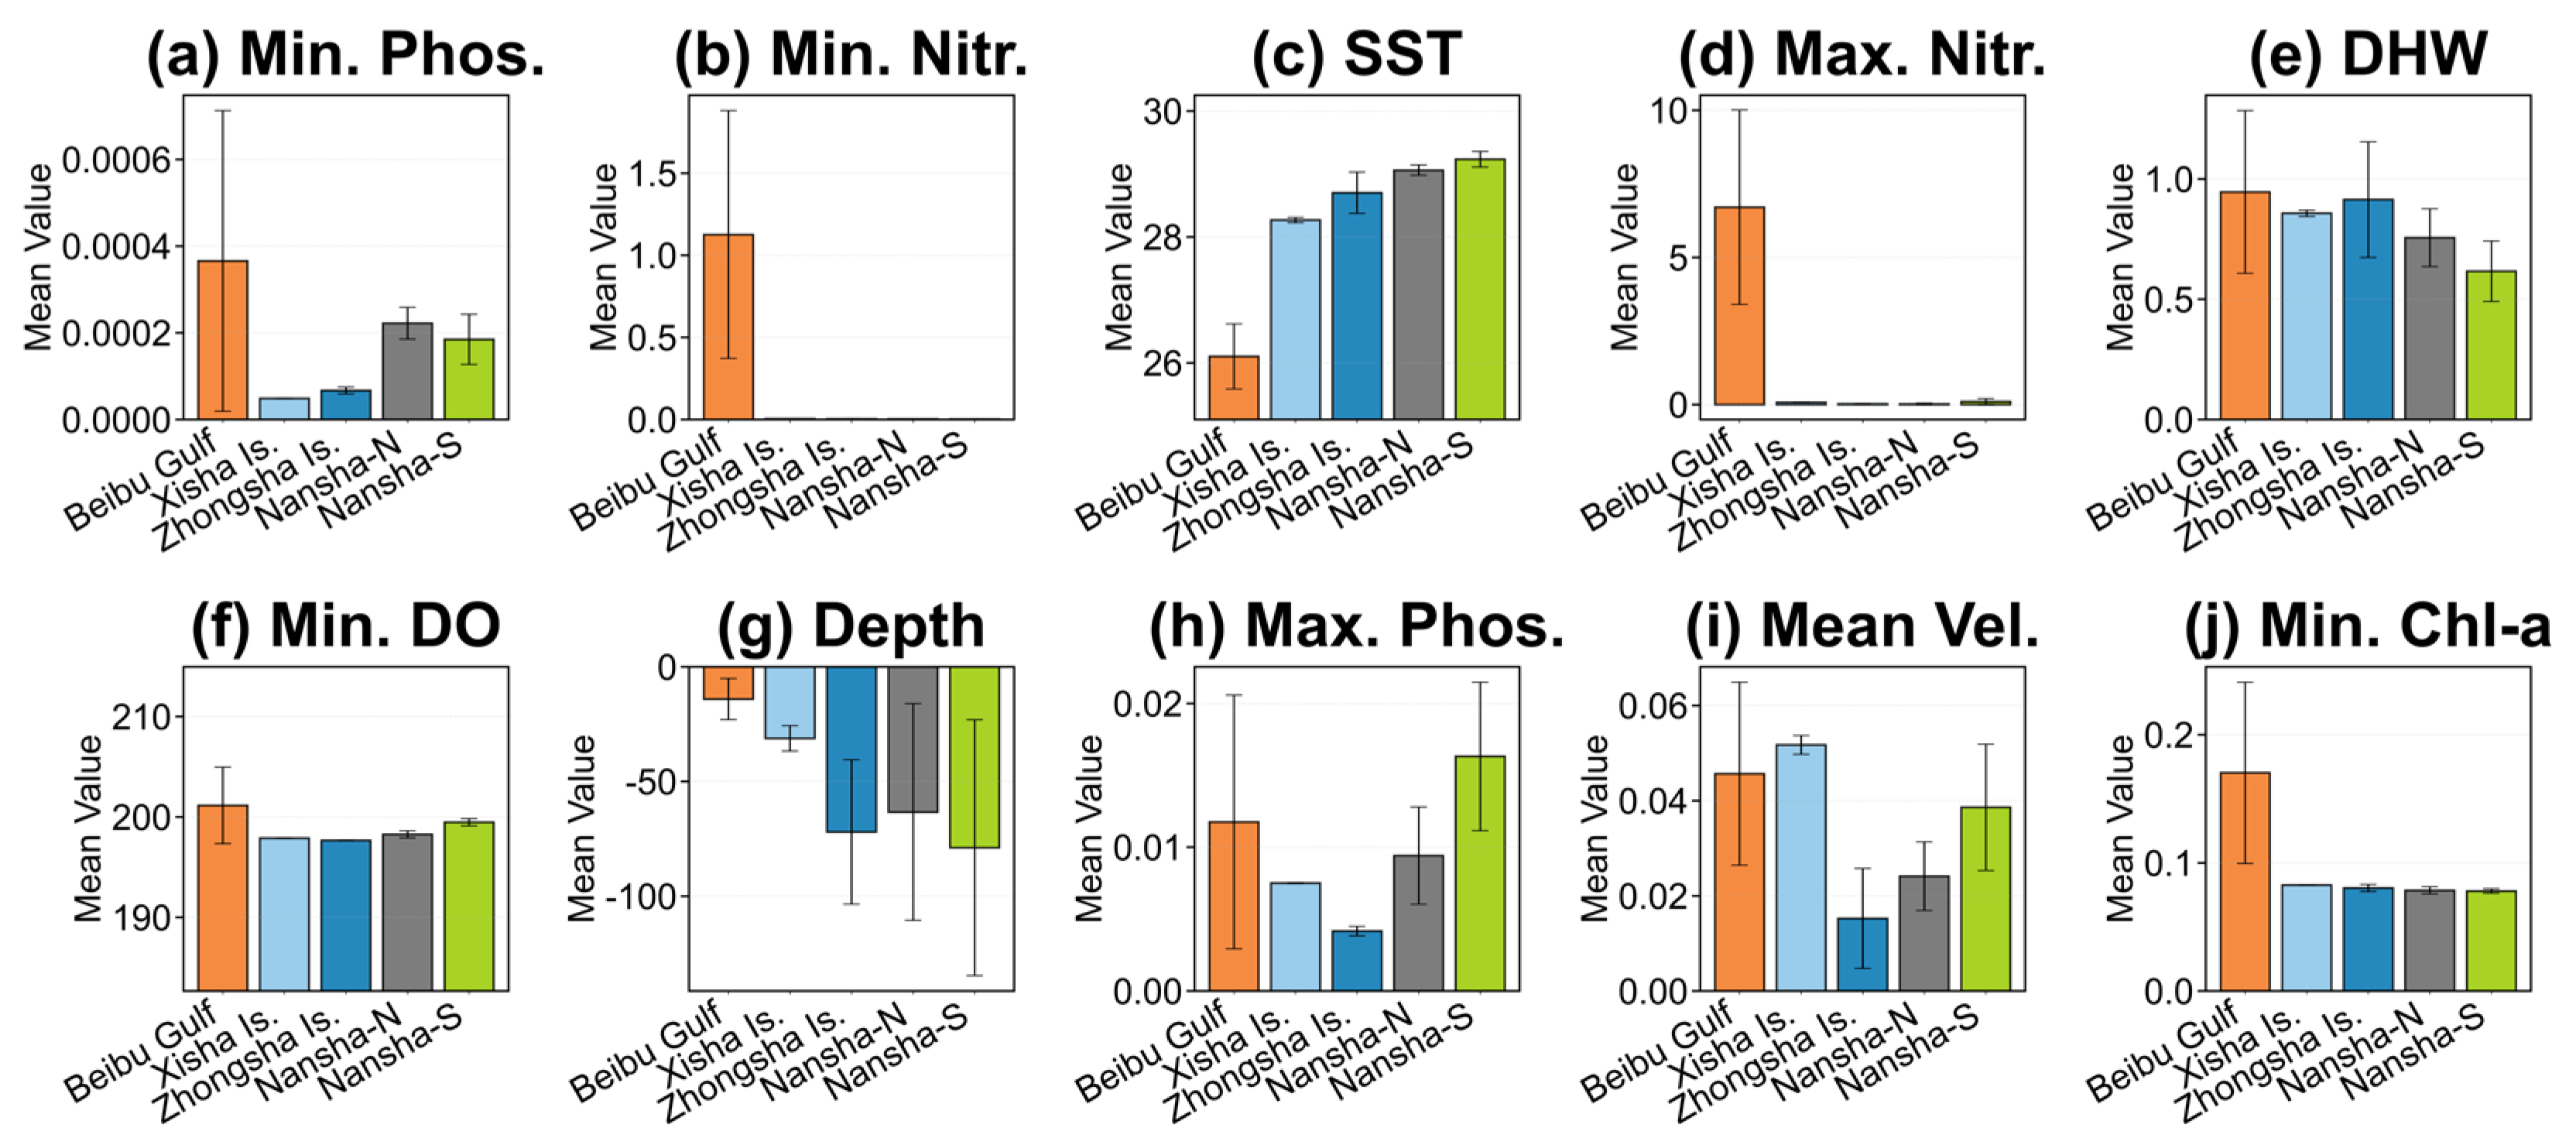
Spatial heterogeneity of key environmental variables across five distinct coral reef regions in the South China Sea. The bar charts display the mean values within suitable habitat areas (Habitat Suitability Index > 0.4). (a) Min. Phos., (b) Min. Nitr., (c) SST, (d) Max. Nitr., (e) DHW, (f) Min. Do., (g) Depth, (h) Max. Phos., (i) Vel., (j) Chl-a. Each curve represents the MaxEnt model prediction generated using only the corresponding variable. The vertical axis represents the logistic probability of presence, while the horizontal axis represents the value range of the environmental variable. Note: Abbreviations: SST, Sea Surface Temperature; DHW, Degree Heating Weeks; Depth, Water depth (Bathymetry); Vel., Seawater velocity; Min./Max Phos., Minimum/Maximum Phosphate; Min./Max Nitr., Minimum/Maximum Nitrate; Min. Chl-a, Minimum Chlorophyll-a; Min. Do., Minimum Dissolved Oxygen.
Figure 11.
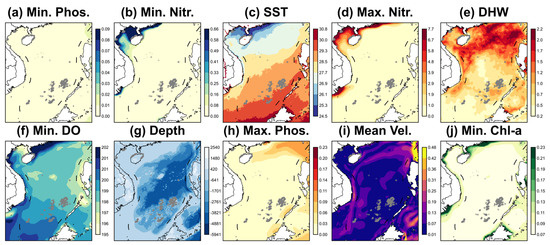
Spatial distribution of the six key environmental variables used in the MaxEnt model. The maps display the background environmental gradients for: (a) Min. Phos., (b) Min. Nitr., (c) SST, (d) Max. Nitr., (e) DHW, (f) Min. Do., (g) Depth, (h) Max. Phos., (i) Vel., (j) Min. Chl-a. Each curve represents the MaxEnt model prediction generated using only the corresponding variable. The vertical axis represents the logistic probability of presence, while the horizontal axis represents the value range of the environmental variable. Note: Gray hollow circles indicate coral reef locations within suitable habitat areas (Habitat Suitability Index > 0.4). Abbreviations: SST, Sea Surface Temperature; DHW, Degree Heating Weeks; Depth, Water depth (Bathymetry); Vel., Seawater velocity; Min./Max Phos., Minimum/Maximum Phosphate; Min./Max Nitr., Minimum/Maximum Nitrate; Min. Chl-a, Minimum Chlorophyll-a; Min. Do., Minimum Dissolved Oxygen.
Principal Component Analysis (PCA) of environmental gradients and regional clustering (Figure 9) revealed that the first two principal components (PC1 and PC2) accounted for over 65% of the total environmental variance. PC1 was primarily defined by nutrient levels (Nitrate and Phosphate) and Chlorophyll-a concentrations, which clearly distinguished the Beibu Gulf from the oceanic island groups in multivariate space. When the Beibu Gulf was excluded from the analysis (Figure 9b), the environmental niches of the Xisha, Zhongsha, and Nansha Islands clustered more tightly, though they remained differentiated by variables such as Sea Surface Temperature (SST), depth, and DHW. Specifically, the Xisha Islands were associated with higher DHW and lower Minimum Nitrate (Min. Nitr.), while the southern Nansha region (Nansha-S) showed a stronger correlation with high SST and high Minimum Dissolved Oxygen (Min. Do.).
Regarding the spatial heterogeneity of nutrients and Chlorophyll-a, statistical analysis found (Figure 10) that the Beibu Gulf possessed the highest mean values of Minimum Phosphate (~0.0004 mmol/m3), Minimum Nitrate (~1.1 mmol/m3), and Maximum Nitrate (~7 mmol/m3), identifying it as a relatively high-nutrient environment. Conversely, nutrient levels across the Xisha, Zhongsha, and Nansha Islands remained at extremely low levels, validating their status as oligotrophic habitats. Similarly, the mean Min. Chl-a in the Beibu Gulf (~0.17 mg/m3) was significantly higher than in the offshore regions (~0.08 mg/m3), reflecting higher productivity and potentially lower water transparency in these nearshore waters.
Thermal conditions, physical dynamics, and bathymetric distribution also exhibited distinct regional differences. SST showed a clear latitudinal gradient, with mean values increasing from the Beibu Gulf (~26.1 °C) southward to Nansha-S (~29.2 °C). In contrast, DHW peaked in the Beibu Gulf (~0.95 °C-weeks) and decreased progressively toward the south, indicating that northern habitats experienced higher cumulative thermal stress during the study period. Furthermore, mean seawater velocity reached its peak in the Xisha Islands (~0.05 m/s). The suitable coral habitats in the Beibu Gulf were located in the shallowest mean depth zones (~−15 m), while offshore islands—particularly the Zhongsha and Nansha-N regions—were associated with deeper suitable areas (mean depths exceeding −60 m). While Min. Do. remained relatively stable across all regions at approximately 200 mmol/m3, the slightly higher mean values in Nansha-S suggested potential support for the higher metabolic demands of corals in warmer southern waters.
4. Discussion
4.1. Driving Mechanisms of Key Environmental Factors on Coral Potential Distribution
Our MaxEnt model results demonstrate that minimum phosphate concentration is the primary driver of coral reef distribution (41.6% contribution), with habitat suitability peaking sharply at extremely low concentrations. This confirms a distinct preference for oligotrophic conditions for coral reef. First, regarding physiological mechanisms, excess phosphate directly inhibits skeletal calcification. For instance, Iijima et al. [47] found that phosphate ions impede aragonite crystallization during the calcification process. While Dunn et al. [48] demonstrated that trace amounts of phosphate can promote symbiotic algal growth; concentrations slightly above the threshold reduce skeletal density, leading to a brittle skeleton and increased mortality risk. Second, from an ecological competition standpoint, corals maintain a competitive advantage over macroalgae only under low-nutrient conditions. Lapointe [49] showed that in nutrient-enriched environments where phosphate exceeds approximately 0.1 mmol/m3, macroalgae begin to replace coral communities. Our study identifies a more stringent optimal phosphate threshold of approximately 0.03 mmol/m3, suggesting even higher water quality requirements for SCS reefs. Third, within the SCS context, recent coral-core evidence [50] confirms that anthropogenic phosphorus loading poses a major threat to reef integrity. Furthermore, Yu et al. [28] systematically elaborated on the sensitivity of SCS corals to environmental shifts, emphasizing that clear, oligotrophic waters are essential for maintaining reef-building communities.
The response curve for nitrate typically exhibits a “low-to-moderate optimum, high-threshold inhibition” pattern. This reflects a delicate balance between nitrate as a survival necessity and a physiological stressor. Excessive nitrate can induce the over-proliferation of zooxanthellae, which depletes the host coral’s energy reserves and heightens sensitivity to high temperature and light [51], leading to bleaching at lower thermal thresholds [52]. Marubini and Davies [53] noted that elevated nitrate levels reduce skeletal growth rates because zooxanthellae consume inorganic carbon for photosynthesis that would otherwise be used for calcification. Similarly to phosphate, excess nitrate also triggers macroalgal blooms [49]. Crucially, Serrano et al. [54] demonstrated that nitrate enrichment reduces coral thermal tolerance. Therefore, local nutrient management, specifically controlling nitrate discharge, is a vital strategy for enhancing the resilience of coral reefs against global warming.
SST is an important factor shaping the spatial distribution of SCS coral reefs. Our results show an optimal SST range for SCS corals (28.52–29.41 °C) that is slightly higher than the global average (25–29 °C), suggesting that these populations may have evolved higher thermal tolerance through long-term natural selection [55]. This provides support for the “Adaptive Bleaching Hypothesis,” where corals may enhance climate resilience through the recombination of symbiotic algae [56]. However, despite this potential adaptability, the Degree Heating Weeks (DHW) response curve shows that suitability declines rapidly after reaching 0.83 °C-weeks. This result identifies a narrower statistical window for optimal coral distribution in the SCS, which may suggest that these habitats are highly sensitive to even minor increments in cumulative heat stress [10,57]. Finally, biochemical factors such as Dissolved Oxygen (DO) and Chlorophyll-a (Chl-a) act as critical mediating filters. The Chl-a threshold identified in this study (0.22–0.38 mg/m3) confirms the preference for oligotrophic environments. Exceeding concentrations are often accompanied by increased turbidity and biological risks (e.g., Acanthaster planci outbreaks). Our findings also support the view of Bell et al. [58], suggesting that the 0.4–0.45 mg/m3 trigger value used by the Great Barrier Reef Marine Park Authority (GBRMPA) may be too high and recommending a revision to 0.2 mg/m3 to better safeguard reef health.
4.2. Spatial Heterogeneity and Refugia Potential of SCS Coral Reefs
In this study, the MaxEnt model predictions revealed significant north south spatial differentiation in habitat suitability across the SCS. The northern Nansha Islands (e.g., Reed Tablemount) were identified as the core suitable area with the best continuity, benefiting from a foundation of deep, stable reef platforms [59]. In contrast, the central waters, such as the Xisha Islands, were influenced by monsoons and complex current systems, resulting in suitable habitats characterized by highly fragmented island-reef patches. This differentiation suggests that spatial planning should adopt differentiated strategies: the southern region should focus on maintaining the integrity of large-scale source populations, while the western and eastern sand archipelagoes should strengthen the protection of corridor connectivity between patches.
Based on regional differences in environmental characteristics, this study identified two distinct mechanisms of potential refugia in the SCS: The first one is high-latitude Marginal Refugia (Marginally Suitable). The Beibu Gulf, identified by the MaxEnt model as mostly marginally suitable, serves as a high-latitude marginal refugium. Its lower annual mean water temperatures (~26.1 °C) offer valuable physical buffering space against global warming. However, this region faces high historical cumulative thermal stress (DHW) and high nutrient loads, exhibiting characteristics of stress-tolerant refugia [12]. Although some studies suggest high-latitude marginal zones may be the first to lose their protective function under warming [26], local high nutrients and turbidity may mitigate the risk of light-induced bleaching by reducing irradiance [60]. The extreme variability of such marginal habitats can be viewed as an acclimatization ground [61], where frequent environmental fluctuations promote natural selection for stress-tolerant genotypes at both physiological [62] and genetic [63] levels.
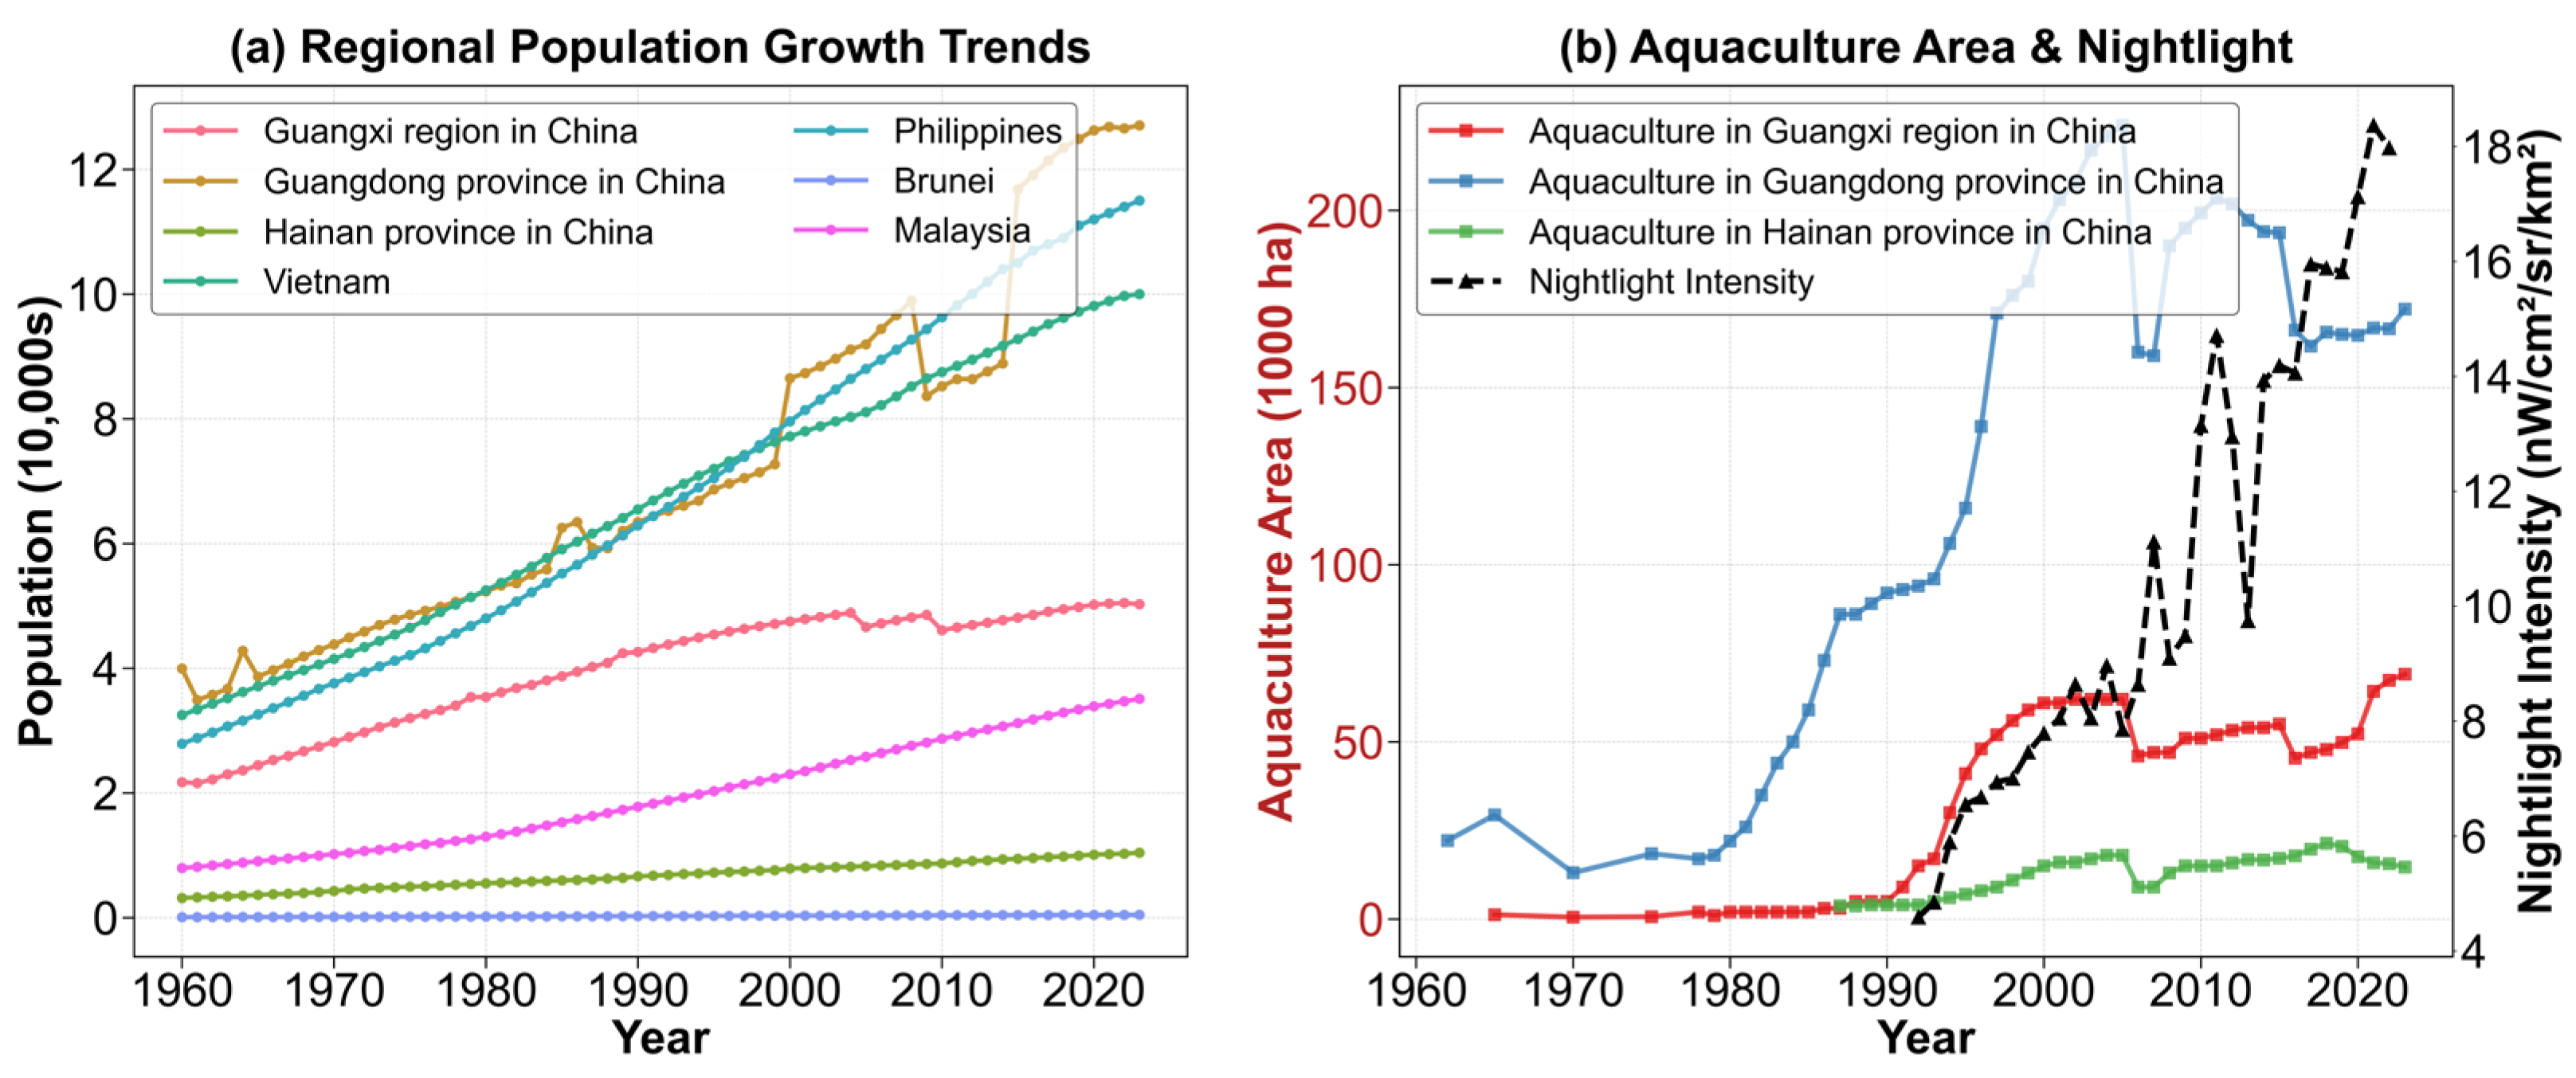
From a conservation management perspective, prioritizing the protection of these areas is not only for preserving cold/stress-tolerant genes but, more critically, because they may serve as indispensable stepping stones for future poleward migration of corals [26]. Therefore, management in the Beibu Gulf and similar regions should focus on enhancing habitat connectivity to facilitate species migration, seeking survival opportunities for coral reef ecosystems amidst irreversible global warming trends. It should be noted that a significant threat to these areas of high refugia potential is the escalating pressure from anthropogenic activities. As illustrated in Figure A1, there has been a steady intensification of population growth, GDP, fishing activities, and nighttime light intensity across regions surrounding the SCS, including three Chinese provinces, Vietnam, and the Philippines. These trends underscore the critical necessity of regulating human activities, particularly by limiting the discharge of pollutants into marine environments.
The second one is latitude thermal refugia (Highly Suitable). We found that the southern Nansha Islands, predicted by the MaxEnt model as mostly highly suitable, exhibited a unique stability characterized by high temperature but low heat accumulation. The extremely low DHW (~0.62 °C-weeks) implied that this region is less disturbed by extreme thermal events and may serve as an evolutionary screening ground preserving heat-tolerant genotypes [64,65,66]. For instance, Tong et al. [18] found that thermally sensitive corals (e.g., Pocillopora) in the southern SCS adapt to thermal stress by associating with heat-tolerant Durusdinium symbionts. Therefore, given its extremely low cumulative thermal pressure and excellent water quality, this region may exhibit greater resilience during global warming-induced bleaching events and should be considered a priority area for germplasm conservation.
4.3. Model Performance and Ecological Implications
In this study, the MaxEnt model demonstrated excellent predictive performance (AUC > 0.9), proving the applicability of an ecological niche model based on multidimensional climate water quality topography variables in the SCS. Specifically, incorporating biochemical factors and DHW compensated for the limitations of traditional models relying solely on SST and depth. This allowed for the accurate exclusion of areas that are thermally suitable but uninhabitable due to water quality stress (e.g., eutrophication). As suggested by Freeman et al. [27], results from habitat suitability models should guide the allocation of limited resources toward persistent refugia that remain environmentally robust over the long term. Furthermore, identifying these stable zones provides scientific site selection advice for controversial managed relocation or rewilding efforts, ensuring that transplanted corals are moved to locations with long-term physicochemical viability.
4.4. Limitations and Future Prospects
It should be noted that the results presented here are intended to identify locations where coral reefs may survive under current climate conditions, rather than as indicators of current reef health status. Despite the model’s robustness, uncertainties remain. First, regarding environmental variables, the model did not fully integrate micro-topography, substrate type, and high-precision flow field data, which may affect prediction accuracy at finer scales. We emphasize the need for enhanced observations of reef-scale topography and fine-scale hydrodynamic processes. Incorporating these high-precision datasets in future studies will be crucial for providing a more detailed mechanistic understanding of coral distribution beyond the current climate-envelope approach. Second, PCA is a descriptive tool for characterizing environmental heterogeneity rather than a direct statistical proof of biological refugia. The effectiveness of these refugia can be validated through long-term monitoring in the future. Thirdly, this study defined the physicochemical envelope of the coral reef ecosystem rather than the distribution of single species. Future research should attempt to construct multi-species SDMs combined with genetic diversity data to further explore the niche overlap and differentiation of different coral functional groups in response to climate change. Finally, the suitability of coral reef habitats under different climate scenarios can be explored based on prediction data of future climate scenarios. However, due to insufficient existing estimated data, there is still great uncertainty in the conduct of future projection [10,11].
5. Conclusions
This study systematically evaluated the potential habitat suitability of coral reefs in the South China Sea (SCS) utilizing high-resolution environmental data and the MaxEnt model. We mapped high-precision suitability distributions, revealing the environmental tolerance ranges of SCS corals and elucidating how multi-scale environmental factors shape the realized niche through mechanisms of baseline control. The main conclusions and management implications are as follows:
- (1)
- Coral reef habitats in the SCS were not uniformly distributed but exhibited significant spatial heterogeneity characterized by a distinct High South, Low North latitudinal gradient. The northern Nansha Islands (particularly around Reed Tablemount) were identified as the core distribution area, possessing the highest suitability, largest area, and best continuity within the entire region.
- (2)
- Minimum Phosphate (Min. Phos.) concentration and Sea Surface Temperature (SST) were identified as the core environmental factors determining the spatial distribution of coral reefs in the South China Sea. The optimal environmental ranges were identified as: SST between 28.52 °C and 29.41 °C, water depth shallower than 34 m, extremely low phosphate (0–0.005 mmol/m3), and low cumulative thermal stress (DHW < 0.83 °C-weeks).
- (3)
- Two potential climate refugia were identified in the South China Sea, challenging the traditional conservation view that relies solely on high-latitude migration. The first is the low-latitude thermal refugia in the southern Nansha Islands, identified as a highly suitable area; it is recommended to prioritize this region for establishing strict Marine Protected Areas (MPAs) to maintain its integrity as a biodiversity source bank. The second is the high-latitude marginal refugia in the Beibu Gulf, characterized by marginal suitability; despite facing high turbidity and nutrient stress, its lower background temperature (about 26.1 °C) offers physical buffering against future global warming, while necessitating targeted efforts to mitigate the risks of habitat degradation and eutrophication driven by intensifying anthropogenic activities. Conservation efforts should focus on protecting its habitat connectivity, ensuring it functions as a critical stepping stone for species migration toward higher latitudes.
Author Contributions
Conceptualization, H.J., W.Q., B.C. and R.H.; methodology, H.J., W.Q., B.C. and R.H.; software, W.Q.; validation, H.J. and W.Q.; formal analysis, H.J. and W.Q.; data curation, H.J.; writing—original draft preparation, H.J., W.Q., B.C. and R.H.; writing—review and editing, H.J., W.Q., B.C. and R.H.; visualization, H.J. and R.H.; supervision, H.J., B.C. and R.H.; project administration, H.J., B.C. and R.H.; funding acquisition, H.J., B.C. and R.H. All authors have read and agreed to the published version of the manuscript.
Funding
This research was funded by Guangxi Natural Science Foundation (Grant No. 2025GXNSFBA069187); 2025 Guangxi Xianghai Economic Talent Training Support Special Project “Guangxi Coral Reef Intelligent Monitoring Technology Research and Development and Talent Cultivation Project” (Project No. 2025XHRC11); Young Scientists Fund (Category C) of the National Natural Science Foundation of China (Project No. 42501364); 2024 Guangxi Higher Education Institutions Young and Middle-Aged Teachers’ Research Capacity Enhancement Program (Project No. 2024KY0022, Recipient: Honglei Jiang); Guangxi First Batch of Young Talent Nurturing Universal Support Policy Research Startup Fund (Recipient: Honglei Jiang); Hainan Province Science and Technology Special Fund (Project No. ZDYF2024SHFZ086).
Data Availability Statement
The data presented in this study are available upon request from the corresponding author, as they are currently being used in an upcoming publication that is not yet released.
Acknowledgments
We give thanks to the Center of High-Performance Computing at Guangxi University. We would also like to thank the three anonymous reviewers for their constructive comments on this manuscript.
Conflicts of Interest
The authors declare no conflicts of interest.
Appendix A
Figure A1.
Spatiotemporal trends of major anthropogenic stressors in regions surrounding the South China Sea (SCS) from 1960 to 2023. (a) Population growth trajectories across seven key coastal regions and nations, showing a steady intensification of demographical pressure. (b) Coupled development of marine economic activities and urbanization, where the left Y-axis (firebrick) denotes the seawater aquaculture area for Guangxi, Guangdong, and Hainan provinces in China, and the right Y-axis (black dashed line) represents the mean nighttime light intensity as a proxy for urbanization and infrastructure expansion. Notes: Population data were downloaded from https://population.un.org/wpp/ (accessed on 15 March 2026). The aquaculture data were from https://data.cnki.net/yearData (accessed on 15 March 2026). The nighttime light intensity is from Huang et al. [67].
References
- Hatcher, B.G. Coral reef primary productivity: A beggar’s banquet. Trends Ecol. Evol. 1988, 3, 106–111. [Google Scholar] [CrossRef] [Scilit]
- Spalding, M.D.; Grenfell, A.M. New estimates of global and regional coral reef areas. Coral Reefs 1997, 16, 225–230. [Google Scholar] [CrossRef] [Scilit]
- Couce, E.; Ridgwell, A.; Hendy, E.J. Environmental controls on the global distribution of shallow-water coral reefs. J. Biogeogr. 2012, 39, 1508–1523. [Google Scholar] [CrossRef] [Scilit]
- Huang, H.; Yu, X.; Huang, L.; Jiang, L. Current status and prospects of coral reef ecology research. J. Trop. Oceanogr. 2024, 43, 3–12. [Google Scholar] [CrossRef]
- Yu, K. Introduction to the Science of Coral Reefs; Science Press: Beijing, China, 2018. [Google Scholar]
- Cai, R.; Guo, H.; Abd-Elgawad, A.; Niu, W. A study on the adaptation and restoration of warm water coral reef ecosystem in the context of global change. J. Appl. Oceanogr. 2021, 40, 12–25. [Google Scholar] [CrossRef]
- Traverso, M.; Neugebauer, S.; Ekener, E.; Schaubroeck, T.; Russo Garrido, S.; Berger, M.; Valdivia, S.; Lehmann, A.; Finkbeiner, M.; Arcese, G. Methodological Sheets for Subcategories in Social Life Cycle Assessment (S-LCA); United Nations Environment Programme (UNEP): Nairobi, Kenya, 2021. [Google Scholar]
- Sundahl, H.; Buhl-Mortensen, P.; Buhl-Mortensen, L. Distribution and suitable habitat of the cold-water corals Lophelia pertusa, Paragorgia arborea, and Primnoa resedaeformis on the Norwegian continental shelf. Front. Mar. Sci. 2020, 7, 213. [Google Scholar] [CrossRef] [Scilit]
- Ellepola, G.; Harischandra, S.; Ranawana, K.B. Spatial analysis of geophysical and environmental factors characterize distinct coral reef habitats around Sri Lanka; implications for management. Ocean Coast. Manag. 2021, 210, 105667. [Google Scholar] [CrossRef] [Scilit]
- Li, T.; Feng, J.; Zhao, L.; Wang, D.; Fan, R. Geographical distribution of coral reefs and their responses to environmental factors in the South China Sea. Ecol. Indic. 2024, 158, 111485. [Google Scholar] [CrossRef] [Scilit]
- Shen, C.; Ruan, X.; Tao, Z.; Xu, C.; Zhu, J. Predicting coral reef habitat distribution in the South China Sea under climate change using MaxEnt modeling. Mar. Pollut. Bull. 2026, 223, 119087. [Google Scholar] [CrossRef] [Scilit]
- Kleypas, J.A.; McManus, J.W.; Meñez, L.A. Environmental limits to coral reef development: Where do we draw the line? Am. Zool. 1999, 39, 146–159. [Google Scholar] [CrossRef] [Scilit]
- Guan, Y.; Hohn, S.; Wild, C.; Merico, A. Vulnerability of global coral reef habitat suitability to ocean warming, acidification and eutrophication. Glob. Change Biol. 2020, 26, 5646–5660. [Google Scholar] [CrossRef] [Scilit]
- McClanahan, T.R.; Azali, M.K. Environmental variability and threshold model’s predictions for coral reefs. Front. Mar. Sci. 2021, 8, 778121. [Google Scholar] [CrossRef] [Scilit]
- Melo-Merino, S.M.; Lira-Noriega, A.; González-Barrios, F.J.; Reyes-Bonilla, H.; Álvarez-Filip, L. Functional divergence from ecological baselines on Caribbean coral reefs. Ecography 2022, 2022, e05811. [Google Scholar] [CrossRef] [Scilit]
- Guisan, A.; Zimmermann, N.E. Predictive habitat distribution models in ecology. Ecol. Model. 2000, 135, 147–186. [Google Scholar] [CrossRef] [Scilit]
- Salcedo-Sanz, S.; Cuadra, L.; Vermeij, M.J. A review of computational intelligence techniques in coral reef-related applications. Ecol. Inform. 2016, 32, 107–123. [Google Scholar] [CrossRef] [Scilit]
- Tong, R.; Purser, A.; Guinan, J.; Unnithan, V. Modeling the habitat suitability for deep-water gorgonian corals based on terrain variables. Ecol. Inform. 2013, 13, 123–132. [Google Scholar] [CrossRef] [Scilit]
- Tittensor, D.P.; Baco, A.R.; Brewin, P.E.; Clark, M.R.; Consalvey, M.; Hall-Spencer, J.; Rowden, A.A.; Schlacher, T.; Stocks, K.I.; Rogers, A.D. Predicting global habitat suitability for stony corals on seamounts. J. Biogeogr. 2009, 36, 1111–1128. [Google Scholar] [CrossRef] [Scilit]
- Phillips, S.J.; Dudík, M.; Schapire, R.E. A maximum entropy approach to species distribution modeling. In Proceedings of the Twenty-First International Conference on Machine Learning, New York, NY, USA, 4–8 July 2004; p. 83. [Google Scholar] [CrossRef] [Scilit]
- Pittman, S.J.; Brown, K.A. Multi-scale approach for predicting fish species distributions across coral reef seascapes. PLoS ONE 2011, 6, e20583. [Google Scholar] [CrossRef] [Scilit] [PubMed]
- Davies, A.J.; Guinotte, J.M. Global habitat suitability for framework-forming cold-water corals. PLoS ONE 2011, 6, e18483. [Google Scholar] [CrossRef] [Scilit]
- Anderson, O.F.; Guinotte, J.M.; Rowden, A.A.; Clark, M.R.; Mormede, S.; Davies, A.J.; Bowden, D.A. Field validation of habitat suitability models for vulnerable marine ecosystems in the South Pacific Ocean: Implications for the use of broad-scale models in fisheries management. Ocean Coast. Manag. 2016, 120, 110–126. [Google Scholar] [CrossRef] [Scilit]
- Hu, W.; Zheng, X.; Li, Y.; Du, J.; Lv, Y.; Su, S.; Xiao, B.; Ye, X.; Jiang, Q.; Tan, H.; et al. High vulnerability and a big conservation gap: Mapping the vulnerability of coastal scleractinian corals in South China. Sci. Total Environ. 2022, 847, 157363. [Google Scholar] [CrossRef] [Scilit]
- da Silveira, C.B.L.; Strenzel, G.M.R.; Maida, M.; Gaspar, A.L.B.; Ferreira, B.P. Coral reef mapping with remote sensing and machine learning: A nurture and nature analysis in marine protected areas. Remote Sens. 2021, 13, 2907. [Google Scholar] [CrossRef] [Scilit]
- Dixon, A.M.; Forster, P.M.; Heron, S.F.; Stoner, A.M.; Beger, M. Future loss of local-scale thermal refugia in coral reef ecosystems. PLoS Clim. 2022, 1, e0000004. [Google Scholar] [CrossRef] [Scilit]
- Freeman, L.A. Robust performance of marginal Pacific coral reef habitats in future climate scenarios. PLoS ONE 2015, 10, e0128875. [Google Scholar] [CrossRef] [Scilit]
- Yu, K. Coral reefs in the South China Sea: Their response to and records on past environmental changes. Sci. China Earth Sci. 2012, 55, 1217–1229. [Google Scholar] [CrossRef] [Scilit]
- Zhao, H. Sovereignty, resources and development of the Nansha Islands. Stud. Mar. Sin. 1997, 12, 169–185. (In Chinese) [Google Scholar]
- Chen, Q. Status and prospect of marine biodiversity in China. Biodivers. Sci. 1997, 5, 142–146, (In Chinese with English Abstract). [Google Scholar] [CrossRef] [Scilit]
- Allen, G.R.; Werner, T.B. Coral reef fish assessment in the ‘coral triangle’ of southeastern Asia. Environ. Biol. Fishes 2002, 65, 209–214. [Google Scholar] [CrossRef] [Scilit]
- Liu, J.; Cao, L.; Xu, W.; Li, G.; Xiang, R.; Su, X.; Luo, Y.; Cheng, J.; Xu, X.; Zhao, Z.; et al. Formation and development of coral reefs in the South China Sea. Palaeogeogr. Palaeoclimatol. Palaeoecol. 2022, 594, 110957. [Google Scholar] [CrossRef] [Scilit]
- UNEP-WCMC; WorldFish Centre; WRI; TNC. Global Distribution of Coral Reefs, Compiled from Multiple Sources Including the Millennium Coral Reef Mapping Project. Version 4.1. 2021. Available online: https://resources.unep-wcmc.org/products/0613604367334836863f5c0c10e452bf (accessed on 9 July 2025).
- Allen Coral Atlas. Imagery, Maps and Monitoring of the World’s Tropical Coral Reefs. 2022. Available online: https://allencoralatlas.org/atlas (accessed on 15 July 2025).
- Zuo, X.L.; Su, F.Z.; Zhao, H.T.; Fang, Y.; Yang, J. Development of a geomorphic classification scheme for coral reefs in the South China Sea based on high-resolution satellite images. Prog. Geogr. 2018, 37, 1463–1472. [Google Scholar] [CrossRef] [Scilit]
- Assis, J.; Tyberghein, L.; Bosch, S.; Verbruggen, H.; Serrão, E.A.; De Clerck, O. Bio-ORACLE v2. 0: Extending marine data layers for bioclimatic modelling. Glob. Ecol. Biogeogr. 2018, 27, 277–284. [Google Scholar] [CrossRef] [Scilit]
- Skirving, W.; Marsh, B.; De La Cour, J.; Liu, G.; Harris, A.; Maturi, E.; Geiger, E.; Eakin, C.M. CoralTemp and the coral reef watch coral bleaching heat stress product suite version 3.1. Remote Sens. 2020, 12, 3856. [Google Scholar] [CrossRef] [Scilit]
- Weatherall, P.; Ferreras, S.C.; Cardigos, S.D.; Cornish, N.; Davidson, S.R.; Dorschel, B.; Drennon, H.; Ferrini, V.; Harper, H.A.; Isler, T.; et al. The GEBCO_2024 Grid—A Continuous Terrain Model of the Global Oceans and Land; NERC EDS British Oceanographic Data Centre NOC: Liverpool, UK, 2024. [Google Scholar]
- Rodriguez, L.; García, J.J.; Tuya, F.; Martínez, B. Environmental factors driving the distribution of the tropical coral Pavona varians: Predictions under a climate change scenario. Mar. Ecol. 2020, 41, 1–12. [Google Scholar] [CrossRef] [Scilit]
- Phillips, S.J.; Anderson, R.P.; Dudík, M.; Schapire, R.E.; Blair, M.E. Opening the black box: An open-source release of Maxent. Ecography 2017, 40, 887–893. [Google Scholar] [CrossRef] [Scilit]
- Kass, J.M.; Muscarella, R.; Galante, P.J.; Bohl, C.L.; Pinilla-Buitrago, G.E.; Boria, R.A.; Soley-Guardia, M.; Anderson, R.P. ENMeval 2.0: Redesigned for customizable and reproducible modeling of species’ niches and distributions. Methods Ecol. Evol. 2021, 12, 1602–1608. [Google Scholar] [CrossRef] [Scilit]
- Sterne, T.K.; Retchless, D.; Allee, R.; Highfield, W. Predictive modelling of mesophotic habitats in the north-western Gulf of Mexico. Aquat. Conserv. Mar. Freshw. Ecosyst. 2020, 30, 846–859. [Google Scholar] [CrossRef] [Scilit]
- Phillips, S.J.; Dudík, M. Modeling of species distributions with Maxent: New extensions and a comprehensive evaluation. Ecography 2008, 31, 161–175. [Google Scholar] [CrossRef] [Scilit]
- Merow, C.; Smith, M.J.; Silander, J.A., Jr. A practical guide to MaxEnt for modeling species’ distributions: What it does, and why inputs and settings matter. Ecography 2013, 36, 1058–1069. [Google Scholar] [CrossRef] [Scilit]
- Fielding, A.H.; Bell, J.F. A review of methods for the assessment of prediction errors in conservation presence/absence models. Environ. Conserv. 1997, 24, 38–49. [Google Scholar] [CrossRef] [Scilit]
- Swets, J.A. Measuring the accuracy of diagnostic systems. Science 1988, 240, 1285–1293. [Google Scholar] [CrossRef] [Scilit]
- Iijima, M.; Yasumoto, J.; Iguchi, A.; Koiso, K.; Ushigome, S.; Nakajima, N.; Kunieda, Y.; Nakamura, T.; Sakai, K.; Yasumoto-Hirose, M.; et al. Phosphate bound to calcareous sediments hampers skeletal development of juvenile coral. R. Soc. Open Sci. 2021, 8, 201214. [Google Scholar] [CrossRef] [Scilit]
- Dunn, J.G.; Sammarco, P.W.; LaFleur, G., Jr. Effects of phosphate on growth and skeletal density in the scleractinian coral Acropora muricata: A controlled experimental approach. J. Exp. Mar. Biol. Ecol. 2012, 411, 34–44. [Google Scholar] [CrossRef] [Scilit]
- Lapointe, B.E. Nutrient thresholds for bottom-up control of macroalgal blooms on coral reefs in Jamaica and southeast Florida. Limnol. Oceanogr. 1997, 42, 1119–1131. [Google Scholar] [CrossRef] [Scilit]
- Guo, N.; Jiang, W.; Yu, K.; Zhao, J.X.; Song, Y.; Feng, Y.X.; Feng, C. Century-long coral evidence of climate and anthropogenic influences on tropical coastal phosphorus cycling in the northern South China Sea. Estuar. Coast. Shelf Sci. 2026, 330, 109720. [Google Scholar] [CrossRef] [Scilit]
- Wiedenmann, J.; D’Angelo, C.; Smith, E.G.; Hunt, A.N.; Legiret, F.E.; Postle, A.D.; Achterberg, E.P. Nutrient enrichment can increase the susceptibility of reef corals to bleaching. Nat. Clim. Chang. 2013, 3, 160–164. [Google Scholar] [CrossRef] [Scilit]
- Donovan, M.K.; Adam, T.C.; Shantz, A.A.; Speare, K.E.; Munsterman, K.S.; Rice, M.M.; Schmitt, R.J.; Holbrook, S.J.; Burkepile, D.E. Nitrogen pollution interacts with heat stress to increase coral bleaching across the seascape. Proc. Natl. Acad. Sci. USA 2020, 117, 5351–5357. [Google Scholar] [CrossRef] [Scilit]
- Marubini, F.; Davies, P.S. Nitrate increases zooxanthellae population density and reduces skeletogenesis in corals. Mar. Biol. 1996, 127, 319–328. [Google Scholar] [CrossRef] [Scilit]
- Serrano, X.M.; Miller, M.W.; Hendee, J.C.; Jensen, B.A.; Gapayao, J.Z.; Pasparakis, C.; Grosell, M.; Baker, A.C. Effects of thermal stress and nitrate enrichment on the larval performance of two Caribbean reef corals. Coral Reefs 2018, 37, 173–182. [Google Scholar] [CrossRef] [Scilit]
- Fitt, W.K.; Brown, B.E.; Warner, M.E.; Dunne, R.P. Coral bleaching: Interpretation of thermal tolerance limits and thermal thresholds in tropical corals. Coral Reefs 2001, 20, 51–65. [Google Scholar] [CrossRef] [Scilit]
- Buddemeier, R.W.; Fautin, D.G. Coral bleaching as an adaptive mechanism. Bioscience 1993, 43, 320–326. [Google Scholar] [CrossRef] [Scilit]
- Berkelmans, R.; Willis, B.L. Seasonal and local spatial patterns in the upper thermal limits of corals on the inshore Central Great Barrier Reef. Coral Reefs 1999, 18, 219–228. [Google Scholar] [CrossRef] [Scilit]
- Bell, P.R.F.; Elmetri, I.; Lapointe, B.E. Evidence of Large-Scale Chronic Eutrophication in the Great Barrier Reef: Quantification of Chlorophyll a Thresholds for Sustaining Coral Reef Communities. Ambio 2014, 43, 361–376. [Google Scholar] [CrossRef] [Scilit]
- ASCOPE Technical Committee. Tertiary Sedimentary Basins of the Gulf of Thailand and South China Sea: Stratigraphy, Structure and Hydrocarbon Occurrences; Ascope Secretariat: Jakarta, Indonesia, 1981. [Google Scholar]
- Mies, M.; Francini-Filho, R.B.; Zilberberg, C.; Garrido, A.G.; Longo, G.O.; Laurentino, E.; Güth, A.Z.; Sumida, P.Y.G.; Banha, T.N.S. South Atlantic coral reefs are major global warming refugia and less susceptible to bleaching. Front. Mar. Sci. 2020, 7, 514. [Google Scholar] [CrossRef] [Scilit]
- Côté, I.M.; Darling, E.S. Rethinking ecosystem resilience in the face of climate change. PLoS Biol. 2010, 8, e1000438. [Google Scholar] [CrossRef] [Scilit]
- Morikawa, M.K.; Palumbi, S.R. Using naturally occurring climate resilient corals to construct bleaching-resistant nurseries. Proc. Natl. Acad. Sci. USA 2019, 116, 10586–10591. [Google Scholar] [CrossRef] [Scilit]
- Barshis, D.J.; Ladner, J.T.; Oliver, T.A.; Seneca, F.O.; Traylor-Knowles, N.; Palumbi, S.R. Genomic basis for coral resilience to climate change. Proc. Natl. Acad. Sci. USA 2013, 110, 1387–1392. [Google Scholar] [CrossRef] [Scilit] [PubMed]
- Oliver, T.A.; Palumbi, S.R. Do fluctuating temperature environments elevate coral thermal tolerance? Coral Reefs 2011, 30, 429–440. [Google Scholar] [CrossRef] [Scilit]
- Oliver, T.A.; Palumbi, S.R. Many corals host thermally resistant symbionts in high-temperature habitat. Coral Reefs 2011, 30, 241–250. [Google Scholar] [CrossRef] [Scilit]
- Yu, X.; Yu, K.; Chen, B.; Liao, Z.; Liang, J.; Yao, Q.; Qin, Z.; Wang, H.; Yu, J. Different responses of scleractinian coral Acropora pruinosa from Weizhou Island during extreme high temperature events. Coral Reefs 2021, 40, 1697–1711. [Google Scholar] [CrossRef] [Scilit]
- Huang, R.; Wu, W.; Yu, K. Building consistent time series night-time light data from average DMSP/OLS images for indicating human activities in a large-scale oceanic area. Int. J. Appl. Earth Obs. Geoinf. 2022, 114, 103023. [Google Scholar] [CrossRef] [Scilit]

Disclaimer/Publisher’s Note: The statements, opinions and data contained in all publications are solely those of the individual author(s) and contributor(s) and not of MDPI and/or the editor(s). MDPI and/or the editor(s) disclaim responsibility for any injury to people or property resulting from any ideas, methods, instructions or products referred to in the content. |
© 2026 by the authors. Licensee MDPI, Basel, Switzerland. This article is an open access article distributed under the terms and conditions of the Creative Commons Attribution (CC BY) license.