


Abstract
To address the challenge of detecting weak targets with small radar cross-sections (RCS), this work explores an integrated framework that leverages cross-level multimodal fusion of radar echoes. This method considers the target’s motion properties via Doppler spectrum and phase sequences (direct physical level), and introduces the Gramian Angular Field (GAF) to map the echo amplitude sequence into two-dimensional (2D) structured images, thereby revealing the dynamic evolution characteristics of echo energy (abstract representation level). This approach integrates direct physical attributes and abstract system evolution features within a unified representation. To accommodate the structural differences among modalities, a heterogeneous branch processing network is designed: the Transformer is employed to capture long-range dependencies in one-dimensional (1D) sequences, while ResNet18 is used to extract spatial texture features from two-dimensional images. A self-attention mechanism is further introduced to achieve adaptive fusion of the multimodal data. Experimental results based on the IPIX dataset suggest that this cross-level strategy provides improved detection performance across various scenarios, as observed in complex marine environments.
1. Introduction
Radar systems, as a critical technology for sea state monitoring, maritime search and rescue, and battlefield warning, are essential for achieving high-performance target detection in complicated and dynamic maritime environments. Sea clutter is the radar backscatter signal from the sea surface, which severely affects radar detection of maritime targets. For weak and small floating targets on the sea surface, in the time domain, their weak echo intensity and low signal-to-clutter ratio (SCR) result from the small radar cross-section, while strong sea clutter such as sea spikes and breaking waves further exacerbates the difficulty of maritime target detection. In the frequency domain, due to the slow motion of floating targets relative to the sea surface, their Doppler features are easily submerged by sea clutter with a wider bandwidth, making them difficult to distinguish effectively. With the improvement of radar resolution, sea clutter exhibits complex characteristics such as non-Gaussian, non-homogeneous, and non-stationary behaviors in both spatial and temporal domains. Traditional large-scale statistical models fail to accurately describe this phenomenon, leading to their poor detection performance [1,2,3]. Moreover, the emergence of various weak and small targets such as stealth ships further increases the difficulty of maritime target detection, making the demand for high-performance target detection algorithms increasingly urgent.
Given that detection methods based on statistical theory fail to meet the requirements for target detection under complicated and dynamic maritime environments, some researchers have proposed detection approaches based on radar echo characteristics. In [4,5,6,7], fractal theory is applied to the analysis of radar echo signals, and detectors based on fractal dimension and the Hurst exponent are proposed. However, when the radar operates in a scanning mode to observe the sea surface, the performance of fractal-based detectors degrades due to the short observation time [6]. In light of this, researchers have begun to integrate multi-dimensional features, transforming the target detection problem into an anomaly detection problem in geometric space by incorporating the convex hull algorithm. For instance, in [8], the authors extracted the relative average amplitude (RAA) from the echo’s amplitude sequence, while simultaneously incorporating two frequency-domain metrics, specifically relative Doppler peak height (RPH) and relative vector-entropy (RVE) from the Doppler spectrum. These indicators provide the foundation for a detection framework that utilizes the geometric properties of a convex hull. In [9], the Smooth Pseudo-Wigner–Ville Distribution (SPWVD) was utilized to characterize the time-frequency (TF) domain characteristics of radar echoes. This approach extracts specialized features, including ridge integration (RI) and the geometric properties of connected regions (such as number and maximal size), to identify target signals amidst intense clutter. In subsequent studies, the feature extraction space of the convex hull algorithm has been further extended to the polarization domain and the phase domain [10,11]. Although detection performance is improved, convex hull algorithms incur an exponential growth in processing overhead relative to the total feature count, making it challenging to implement them in scenarios involving complex feature combinations [12]. Therefore, with the increase in feature dimensionality, machine learning models such as Support Vector Machine (SVM), Decision Tree, and K-Nearest Neighbors (KNN) have been successively applied to radar target detection task [13,14,15]. Although detection accuracy has improved, feature-based detection methods heavily rely on handcrafted features selected based on human expertise. Furthermore, the current mining of echo data remains inadequate, and the chosen multi-dimensional features struggle to capture the distinctive scattering traits that separate target returns from the maritime background under diverse and severe sea states.
With the rapid development of various neural network models, data-driven deep learning has become an important approach in maritime target detection research [16]. Early research in this stage primarily focused on training models using single-modal echo data. For example, in [17], the authors converted radar echo signals into time-Doppler spectrum image via short-time Fourier transform (STFT) and used them as input to the convolutional neural network LeNet5 [18] for the classification and recognition of maritime targets. In [19], the Doppler spectrum sequence of radar echoes was directly fed into the Transformer model [20], where the self-attention mechanism was employed to enhance target signals and suppress noise interference. To further mine the nonlinear dynamic evolution information embedded in the signals, in [21], the Doppler spectrum sequence was encoded into two-dimensional (2D) images using Gramian Angular Field [22] as input to the convolutional neural network EfficientNet [23], and recognition accuracy was improved by incorporating a coordinate attention mechanism. However, given the limitations of single-modal data in complex sea conditions, such as the Doppler characteristics of slow-moving targets are easily submerged by sea clutter, researchers have begun to explore the fusion of different modal data of radar echoes to obtain more comprehensive feature representations, thereby enhancing the model’s robustness in complex maritime scenarios. In [24], the authors used the phase sequence, Doppler spectral entropy sequence, and STFT marginal spectrum sequence of radar echoes as joint inputs for temporal feature learning with a bidirectional Long Short-Term Memory network [25], hereafter referred to as SF(BiLSTM)-Based. In [26], by fusing pseudo-color images generated from three transformation methods, namely continuous wavelet transform, SPWVD, and recurrence plots, an improved EfficientNetV2s target detector was constructed. In [27], the authors proposed a dual-channel convolutional neural network that takes the amplitude sequence and the time-Doppler spectrum image as inputs for parallel feature extraction and fusion. In [28], the Doppler spectrum sequence was further combined with the amplitude sequence and the time-Doppler spectrum image, and the self-attention mechanism was introduced for optimized feature selection. However, since there exists certain modal information redundancy between the Doppler spectrum and the time-Doppler spectrum image. In [29], the authors used the time-Doppler spectrum image, phase sequence, and autocorrelation coefficient sequence as network inputs, employing the squeeze and excitation (SE) attention mechanism [30] to refine the feature vectors. Results from multiple researchers demonstrate that utilizing neural networks for multimodal feature extraction and fusion of radar echoes can effectively enhance the detection accuracy and robustness of models in complex maritime environments.
However, existing work has primarily focused on fusing direct physical level of radar echoes, such as amplitude, phase, or time-Doppler spectrum image. While effective, this paradigm may overlook the nonlinear structural features embedded in the temporal evolution of signals. The fusion of modalities across different abstraction hierarchies remains to be further explored. Consequently, this study explores a cross-level multimodal fusion framework. This architecture utilizes mature technical modules such as GAF, Transformer, and ResNet18, with the design considering the joint utilization of features from different representation levels. Within this structure, GAF is used to capture abstract structural patterns, while the Doppler spectrum and phase provide the direct level attributes reflecting kinematic characteristics. Unlike amplitude which primarily reflects the instantaneous intensity of the echo, GAF abstractly reveal the dynamic temporal evolution by mapping time series into two-dimensional structured space. Meanwhile, compared to other sequence encoding methods, such as recurrence plots [31] or Markov transition fields [32], GAF only require normalization of the raw sequence, eliminating the need for setting additional parameters (such as the distance threshold for recurrence plots and the number of bins for Markov transition fields). This reduces the uncertainty introduced by manual intervention and offers stronger generalizability. In terms of the model, this work adopts a heterogeneous network architecture, utilizing ResNet18 [33] and Transformer to process two-dimensional and one-dimensional modal data, respectively. A self-attention mechanism is introduced to achieve dynamic and adaptive fusion of multimodal feature weights. Experimental evaluations on the IPIX dataset confirm the practical utility of the proposed framework, showing its ability to maintain reliable detection across a range of sea clutter conditions.
The structure of this work is organized as follows: Section 2 introduces the IPIX dataset used in this study, and extracts and illustrates the differences between sea clutter samples and target echo samples across multiple modalities; Section 3 details the composition of the proposed Doppler-Phase-GAF network architecture, which integrates direct physical attributes and abstract representation features, specifically including the feature extraction module, the feature fusion module, and the target detection module; Section 4 presents the experimental results and analysis, demonstrating and discussing multiple groups of comparative experiments. These include the matching between each branch modality and the network model, validation of the performance gain from cross-level multimodal fusion, comparison of the performance of different modality combinations, and comparative analysis with various existing detection methods; Section 5 provides a summary of the full text and prospects for future work.
2. Radar Dataset and Multimodal Extraction and Analysis
2.1. IPIX Dataset
The IPIX (Ice Multiparameter Imaging X-Band Radar) radar echo dataset used in this work was collected in November 1993 by a research team from McMaster University (Hamilton, ON, Canada). Situated on a Nova Scotia (NS) cliffside near Dartmouth, the radar system was positioned at an altitude of roughly 30 m, observing the sea surface with a low grazing angle of less than 1°. The IPIX radar is a fully coherent X-band radar. Operating in dwell mode, it observed the sea surface using four polarization modes: HH, VV, VH, and HV. Its carrier frequency is 9.39 GHz, and the pulse repetition frequency (PRF) is 1000 Hz. Each set of echo data includes 14 range resolution cells with a range resolution of 30 m. The data sampling duration within each range cell is 131.072 s, which corresponds to a time series of length 131,072 [5,6,8]. In this work, the range cell containing the anchored spherical target is defined as the target cell. Adjacent areas affected by the floating target are defined as guard cells, and all other areas are defined as sea clutter cells.
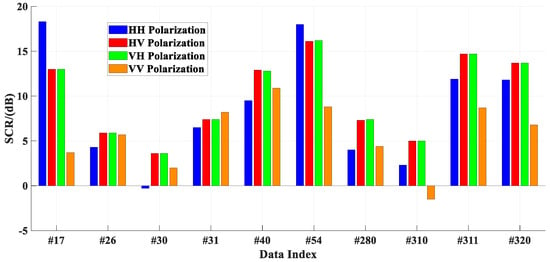
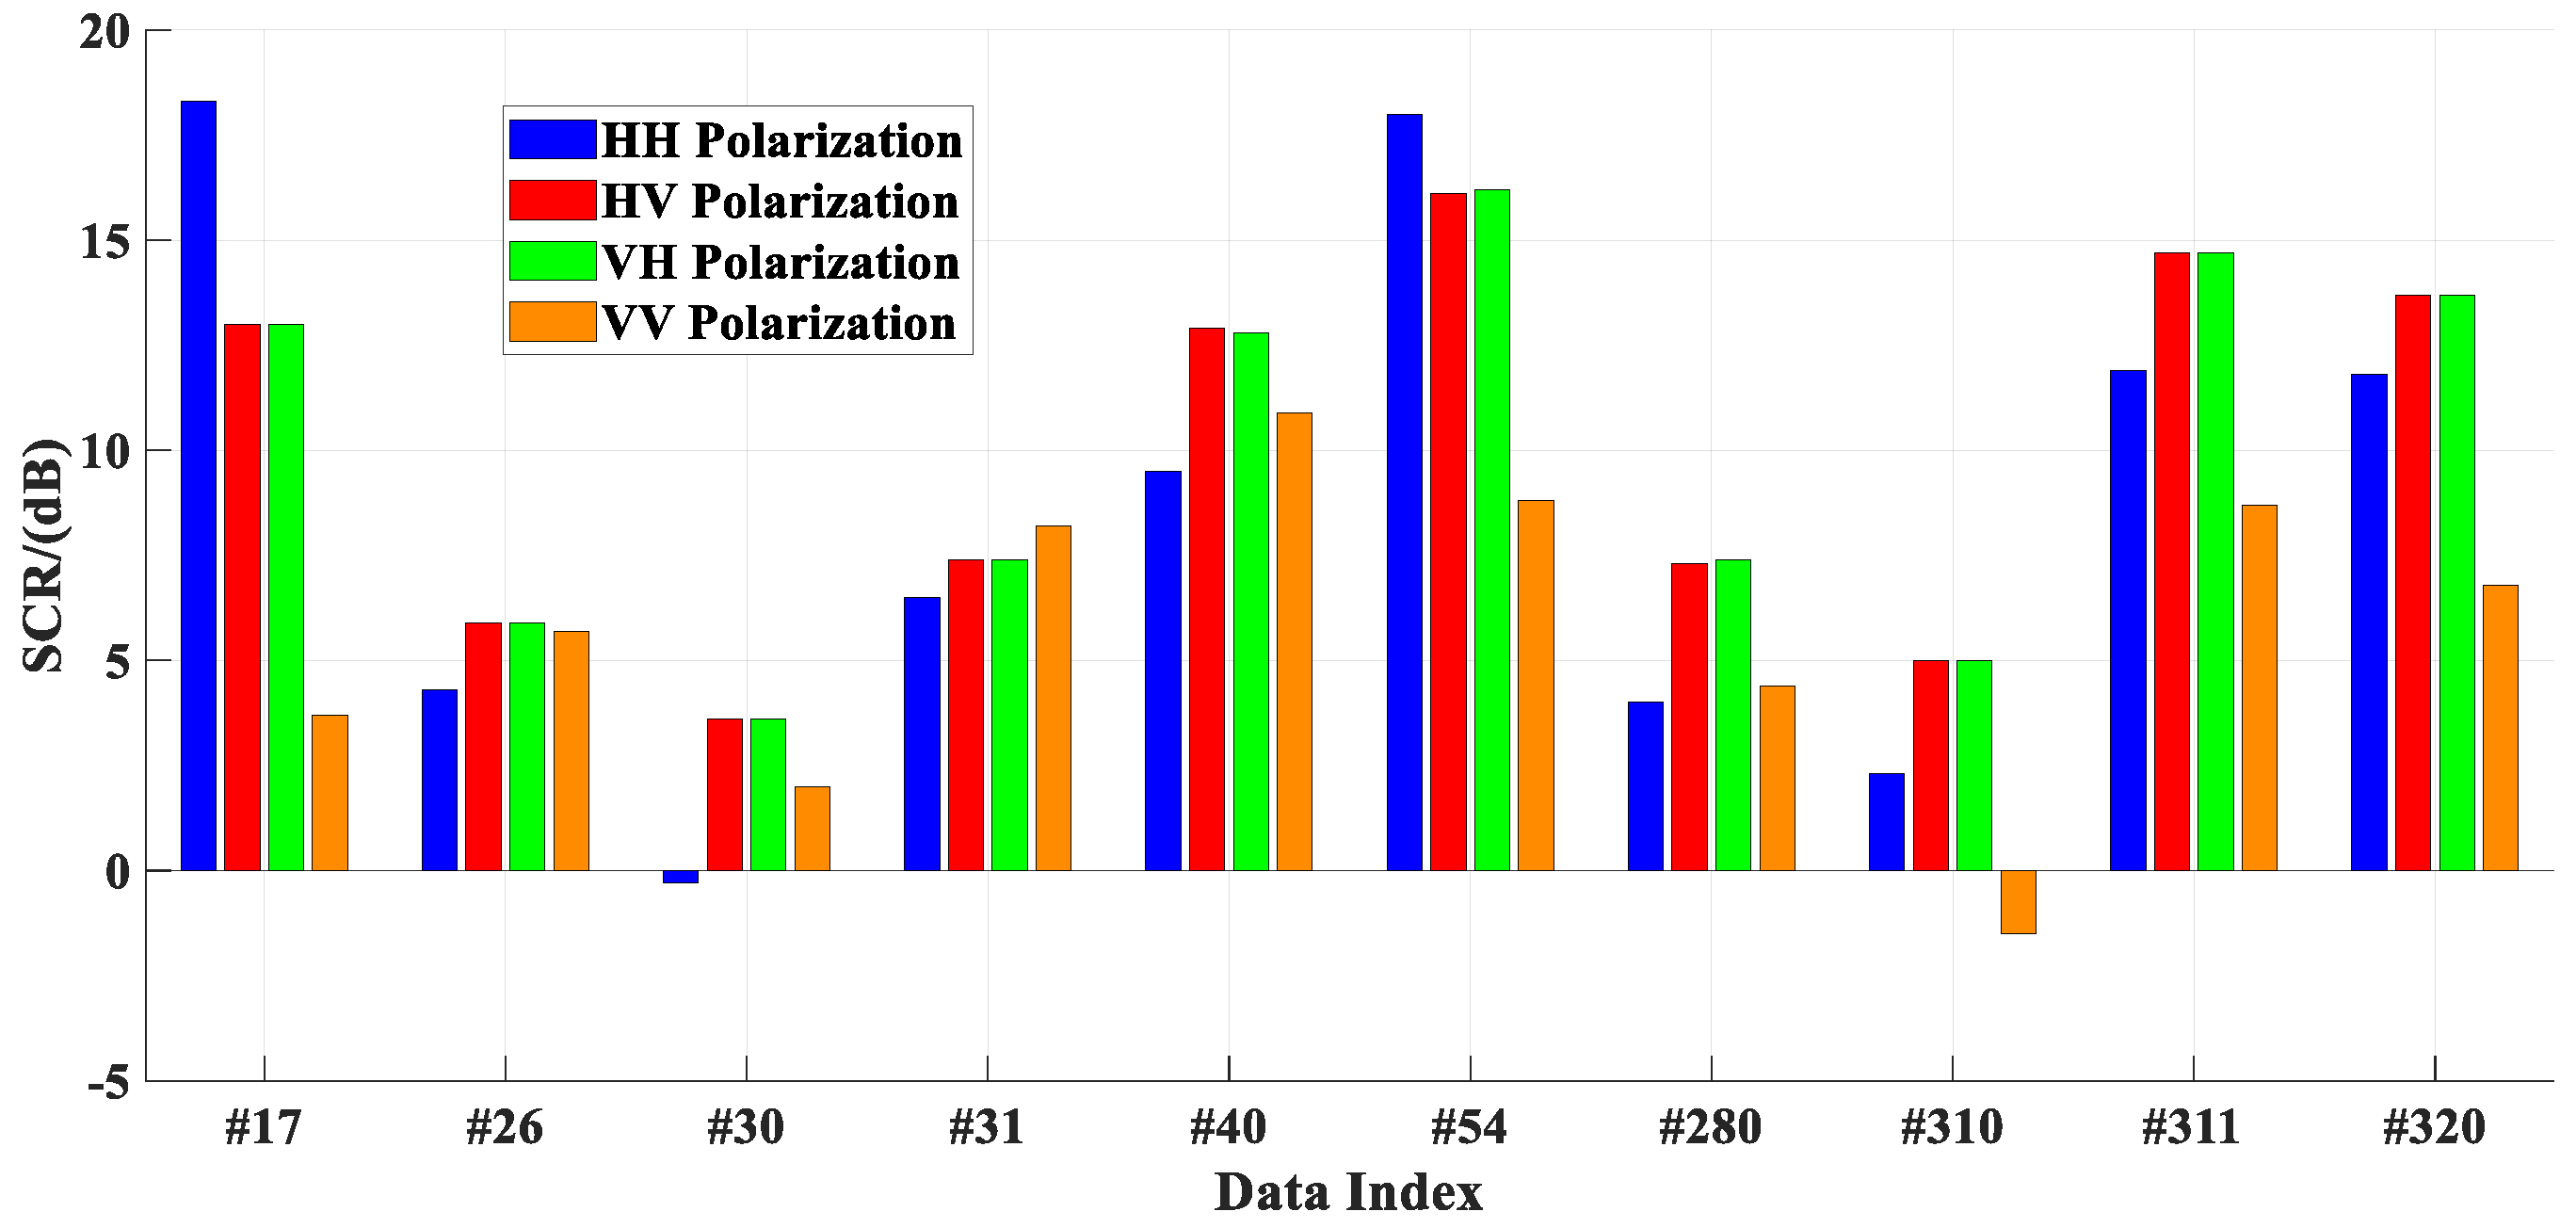
Ten data files from the IPIX dataset measured in 1993 are publicly available; their details are listed in Table 1. Among these ten IPIX datasets, the significant wave height (SWH) varies from 0.7 m to 2.1 m, and the wind speed (WS) varies from 2.5 m/s to 9.2 m/s. The position of the target cell differs across observations. Moreover, due to the complexity of sea conditions and electromagnetic scattering, the number of guard cells also varies. The SCRs of the IPIX dataset can be calculated using Equation (1), where is the echo signal in the target cell, and defines the mean power of all sea clutter cells. As illustrated in Figure 1, the SCRs of the IPIX dataset under four polarizations ranges from −1.5 dB to 18.3 dB.
Table 1.
Description of the IPIX dataset (‘#’ represents the data index).
Figure 1.
SCRs of the IPIX dataset at the four polarization modes.
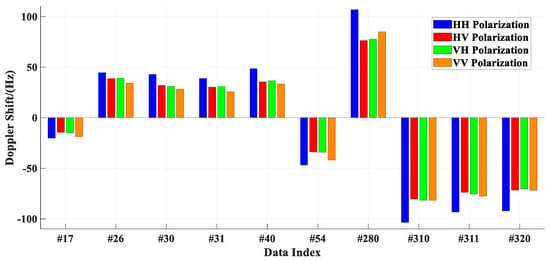
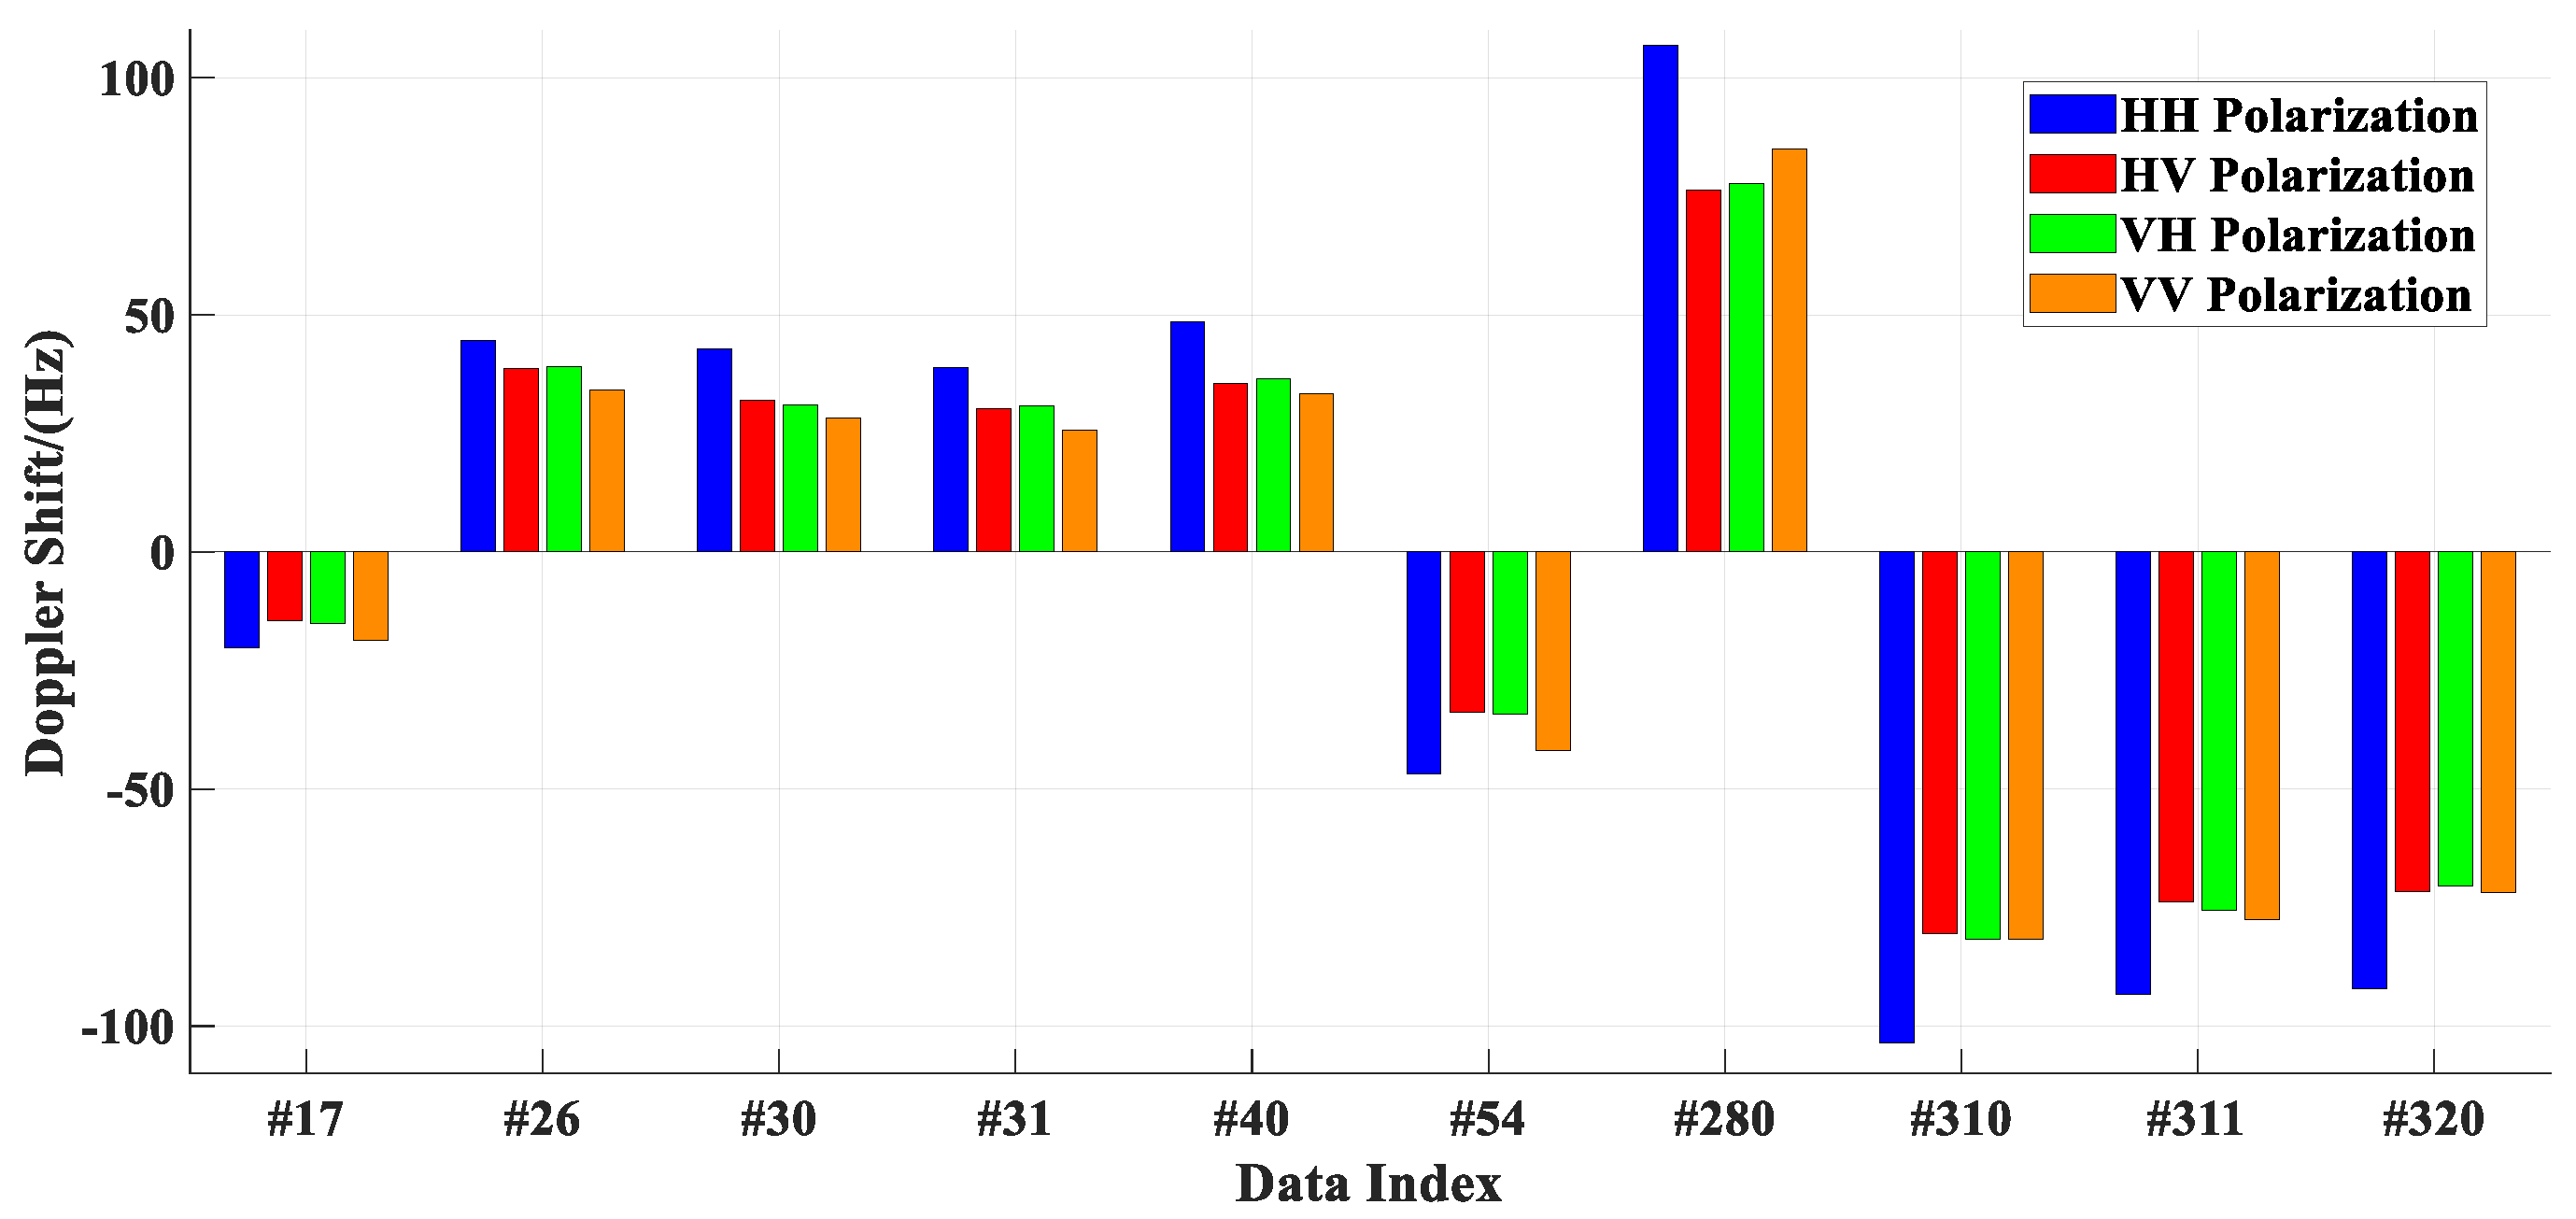
In addition to the SCR, the frequency-domain characteristics of sea clutter also exert a significant impact on detection performance. Figure 2 illustrates the average Doppler shift in sea clutter cells across four polarization modes for ten IPIX datasets. It can be observed that the Doppler shifts vary substantially among different data files, ranging from approximately 20 Hz to over 100 Hz. Notably, the sea clutter in the latter four datasets exhibits more pronounced Doppler shift.
Figure 2.
Average Doppler shift in sea clutter cells of the IPIX dataset at the four polarization modes.
2.2. Extraction and Analysis of Multimodal Radar Echo Data
In this section, the raw radar complex echo signal is preprocessed to extract three types of one-dimensional (1D) sequence modalities with clear physical meanings: the Doppler spectrum sequence, the phase sequence, and the amplitude sequence. Subsequently, based on the amplitude sequence, two types of two-dimensional (2D) image modalities, namely the Gramian Angular Summation Field (GASF) and the Gramian Angular Difference Field (GADF), are generated via the Gramian Angular Field (GAF). GAF represents a polar-coordinate-based encoding method that maps time-series data into an angular space, thereby generating 2D matrices (GASF/GADF) that reflect the temporal dependency and correlation of the original sequence. The aforementioned multiple radar echo modalities will be used as inputs to the subsequent neural network model.
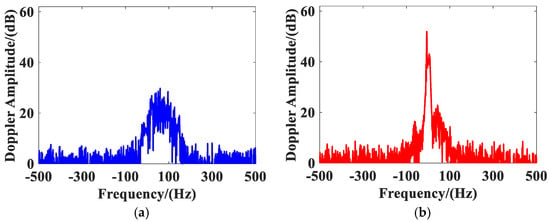
Figure 3 shows the Doppler spectrum sequence of sea clutter and target echo samples from the IPIX #54 dataset under HH polarization mode. is calculated from the radar complex echo signal using Equation (2).
where denotes the Doppler frequency, and and denote the total length of the complex echo sequence and the pulse repetition interval of the radar.
Figure 3.
Doppler spectrum sequence of sea clutter and target echo samples from the HH-polarized IPIX #54 dataset with a radar observation time of 1.024 s: (a) Sea clutter; (b) Target echo.
A contrast between (a) and (b) in Figure 3 reveals that sea clutter displays a broader bandwidth in the Doppler spectrum, with its energy distributed more diffusely and lacking a distinct main peak. This is attributable to the multi-scale nature of ocean wave motion. Conversely, the target-related energy is largely localized around the zero-frequency, displaying a clear main peak. This is because the observation target is an anchored metal sphere, its geometric regularity and relatively stable radial velocity result in a more concentrated reflection energy in the frequency domain. Therefore, the difference in energy distribution within the Doppler spectrum serves as an important physical basis for distinguishing target from sea clutter.
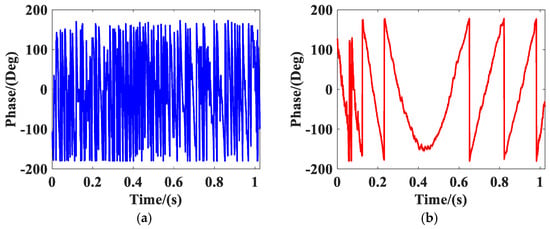
Due to differences in scattering mechanisms and motion states, the evolutionary patterns in the phase modality of sea clutter and target echo also differs. Figure 4 illustrates the instantaneous phase variations for both sea clutter and target echo samples from the IPIX #54 dataset under HH polarization mode. For the radar complex echo signal , the corresponding phase sequence is calculated using Equation (3).
where signifies the mathematical operator employed to extract the phase angle from a complex-valued signal.
Figure 4.
Phase sequence of sea clutter and target echo samples from the HH-polarized IPIX #54 dataset with a radar observation time of 1.024 s: (a) Sea clutter; (b) Target echo.
Comparing (a) and (b) in Figure 4, it can be observed that the phase of sea clutter exhibits rapid and intense variations, demonstrating strong randomness due to the stochastic scattering characteristics of the sea surface. In contrast, the phase of the target echo changes more gently, showing relatively regular periodic variations, which result from the target’s well-defined geometric structure and relatively stable motion trajectory. Therefore, the difference in randomness and regularity of phase evolution can serve as an important physical basis for distinguishing targets from sea clutter.
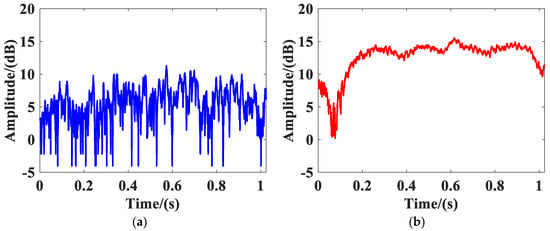
By taking the modulus of the raw radar complex echo signal , the amplitude sequence of the echo can be calculated. As shown in Figure 5a,b, for target echo signals with strong backscattering capability, their amplitude values are generally higher and exhibit relatively smooth variations. In contrast, sea clutter, formed by random scattering from the sea surface, has lower amplitude and undergoes intense fluctuations, demonstrating pronounced non-stationarity.
Figure 5.
Amplitude sequence of sea clutter and target echo samples from the HH-polarized IPIX #54 dataset with a radar observation time of 1.024 s: (a) Sea clutter; (b) Target echo.
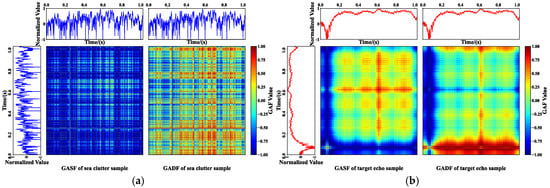
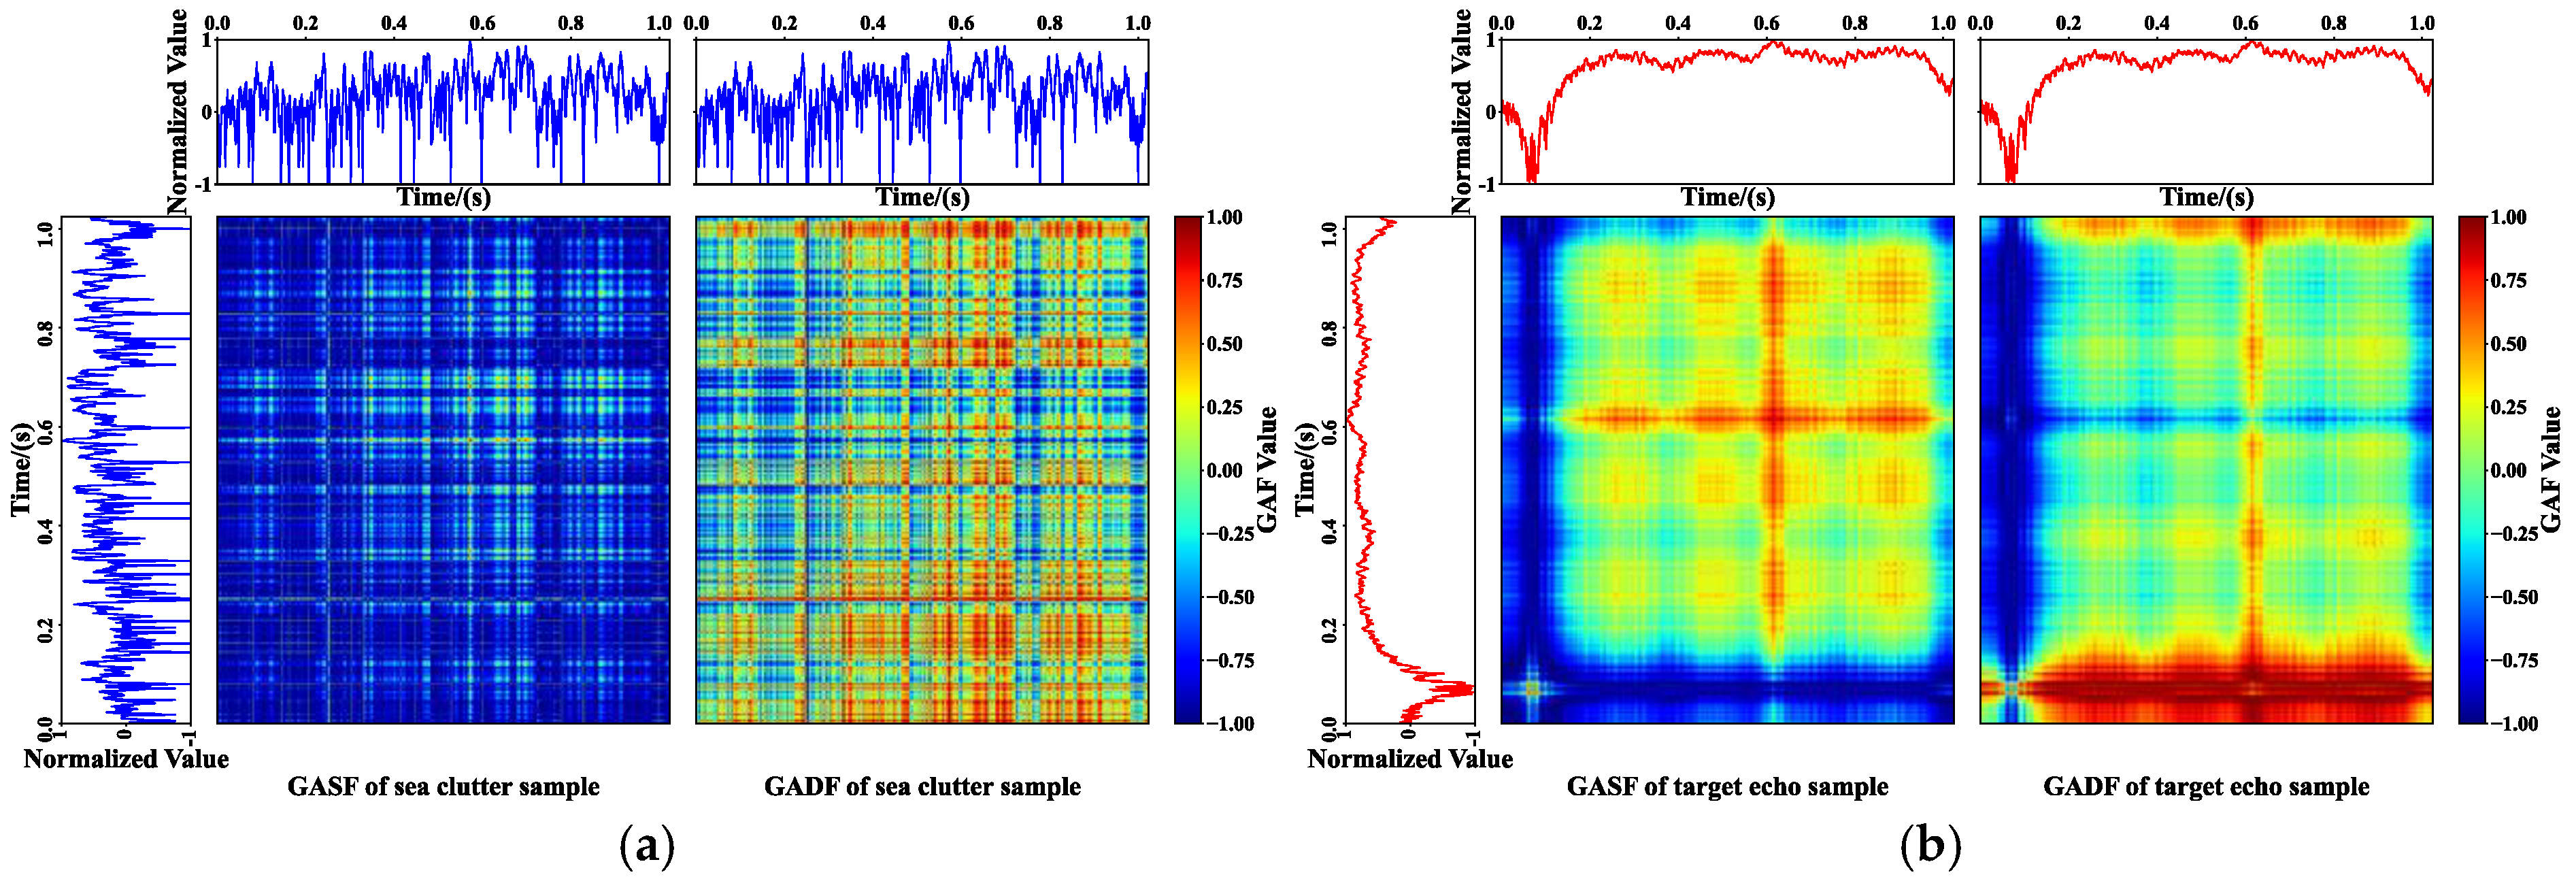
Based on the echo amplitude sequences of the sea clutter and the target echo samples in Figure 5a,b, two types of images are obtained through GAF transformation: the GASF and the GADF. The resulting GAF-encoded images are depicted in Figure 6a,b. By utilizing the GAF approach, 1D signals are reformatted into 2D matrices. This is achieved by assigning each temporal data point a corresponding angle in a polar frame, which then constructs a 2D matrix by calculating the trigonometric relationships between these angles. This 2D matrix is the image generated by encoding the sequence data via the GAF. The specific steps of the GAF transformation are as follows: for 1D data with sequence length , it is first normalized before conversion to angles to avoid numerical overflow. Formula (4) can be used to map the data to the interval [−1, 1].
Figure 6.
GASF and GADF images of sea clutter and target echo samples from the HH-polarized IPIX #54 dataset with a radar observation time of 1.024 s: (a) Sea clutter; (b) Target echo.
Then, the normalized time series is mapped to the polar coordinate system. For each data point , its corresponding polar coordinates are defined as:
where is the timestamp and is the length of the time series.
The GASF and the GADF are constructed by calculating the sum or difference in angles at different timestamps to build an 2D matrix. Their calculation formulas are shown below:
By comparing the two types of GAF images, (a) and (b) for sea clutter and target echo samples in Figure 6, it can be observed that the GASF of sea clutter appears predominantly dark overall, exhibiting a fine grid pattern with sparse bright spots. This is because GASF captures the correlation of the original signal through the cosine of the sum of angles, . The strong randomness of sea clutter leads to significant intensity fluctuations between different time points and ; after summation, the cosine values map to irregular alternations of bright and dark areas in the image. In contrast, the target echo exhibits clear trend and continuity, where the temporal mapping of high-intensity reflections manifests as intersecting bright lines, and its GASF shows large, continuous bright regions, reflecting the high correlation of the target echo signal. The GADF of sea clutter also displays a dense, interlaced grid pattern. This is because GADF captures the differences between states of the original sequence through the sine of the difference in angles, . The non-stationarity of sea clutter causes frequent and irregular abrupt changes in the angular differences at different moments. After mapping by the sine function, these mutations manifest as textures characterized by densely interwoven pixels of various intensities in the image. The GADF of the target echo, however, consists of large, continuous areas of uniform color, reflecting the relatively smooth amplitude changes in the target echo and the greater stability of its angular differences during temporal evolution.
Furthermore, regarding the main diagonal of the GASF (from the bottom-left to the top-right, sequentially corresponding to the start of the amplitude sequence), its cosine value is given by , which constitutes a nonlinear mapping of the amplitude sequence. This allows the GASF to reflect sequence correlations while retaining a considerable amount of the original numerical information. In contrast, the sine value for the main diagonal of the GADF is , which is always zero. This difference in encoding leads the GADF to focus more on the dynamic evolution patterns between different time instances within the amplitude sequence.
3. Construction of Target Detection Model
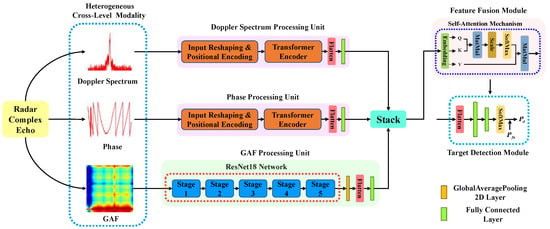
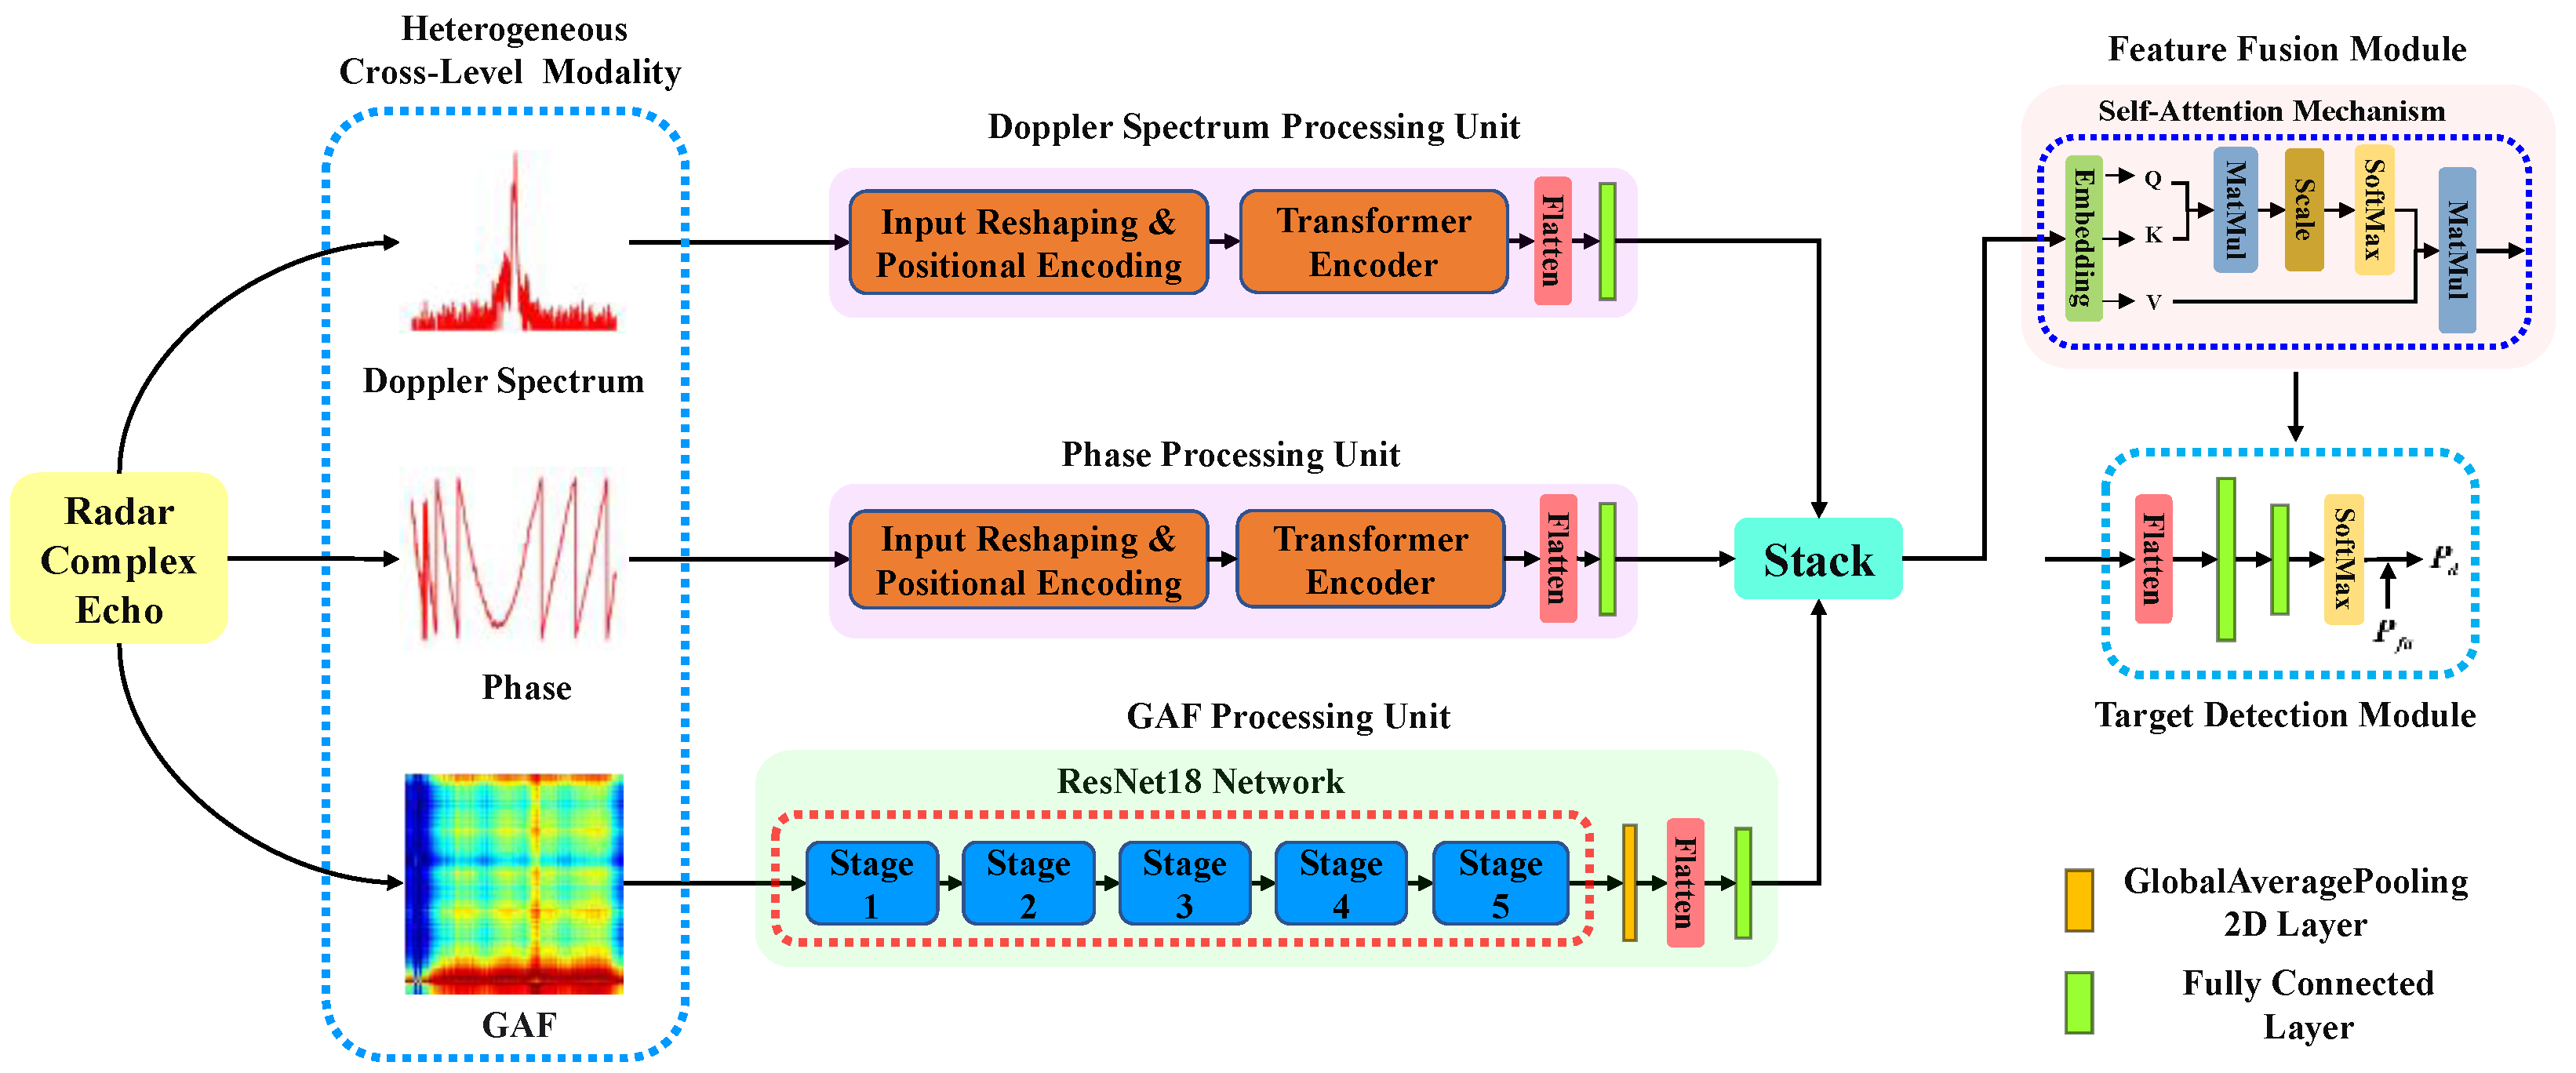
This section provides a detailed introduction to the proposed radar cross-level multimodal fusion model for target detection. The overall framework of the proposed cross-level radar echo multimodal fusion model is illustrated in Figure 7. The corresponding feature extraction module, feature fusion module, and target detection module are introduced in detail in Section 3.1, Section 3.2 and Section 3.3, respectively. First, the raw radar complex echo sample is preprocessed to obtain three types of complementary heterogeneous modalities: the Doppler spectrum sequence, the phase sequence, and the Gramian Angular Field (GAF) images generated from the amplitude sequence. In this work, the length of the selected radar echo sample is 1024; consequently, the sequence lengths of both the Doppler spectrum and the phase are 1024, while the dimensions of the GAF images are uniformly adjusted to [3 × 224 × 224]. Modal data are fed into their corresponding feature extraction modules according to their respective data dimensions. The feature vectors extracted by each branch are first passed through a fully connected layer to unify their feature dimensions. After being stacked, they are fused via a self-attention mechanism to further learn the complex complementary and interactive relationships among features from different modalities. The fused high-dimensional feature vector is then fed into the target detection module, which outputs the predicted probability of the target class for the sample.
Figure 7.
Overall framework of the proposed cross-level radar echo multimodal fusion model.
3.1. Feature Extraction Module
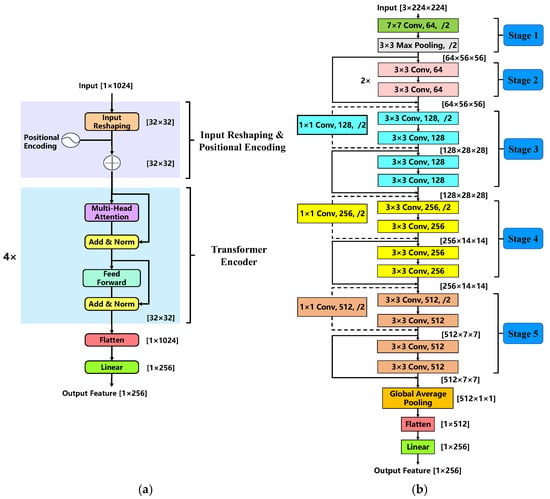
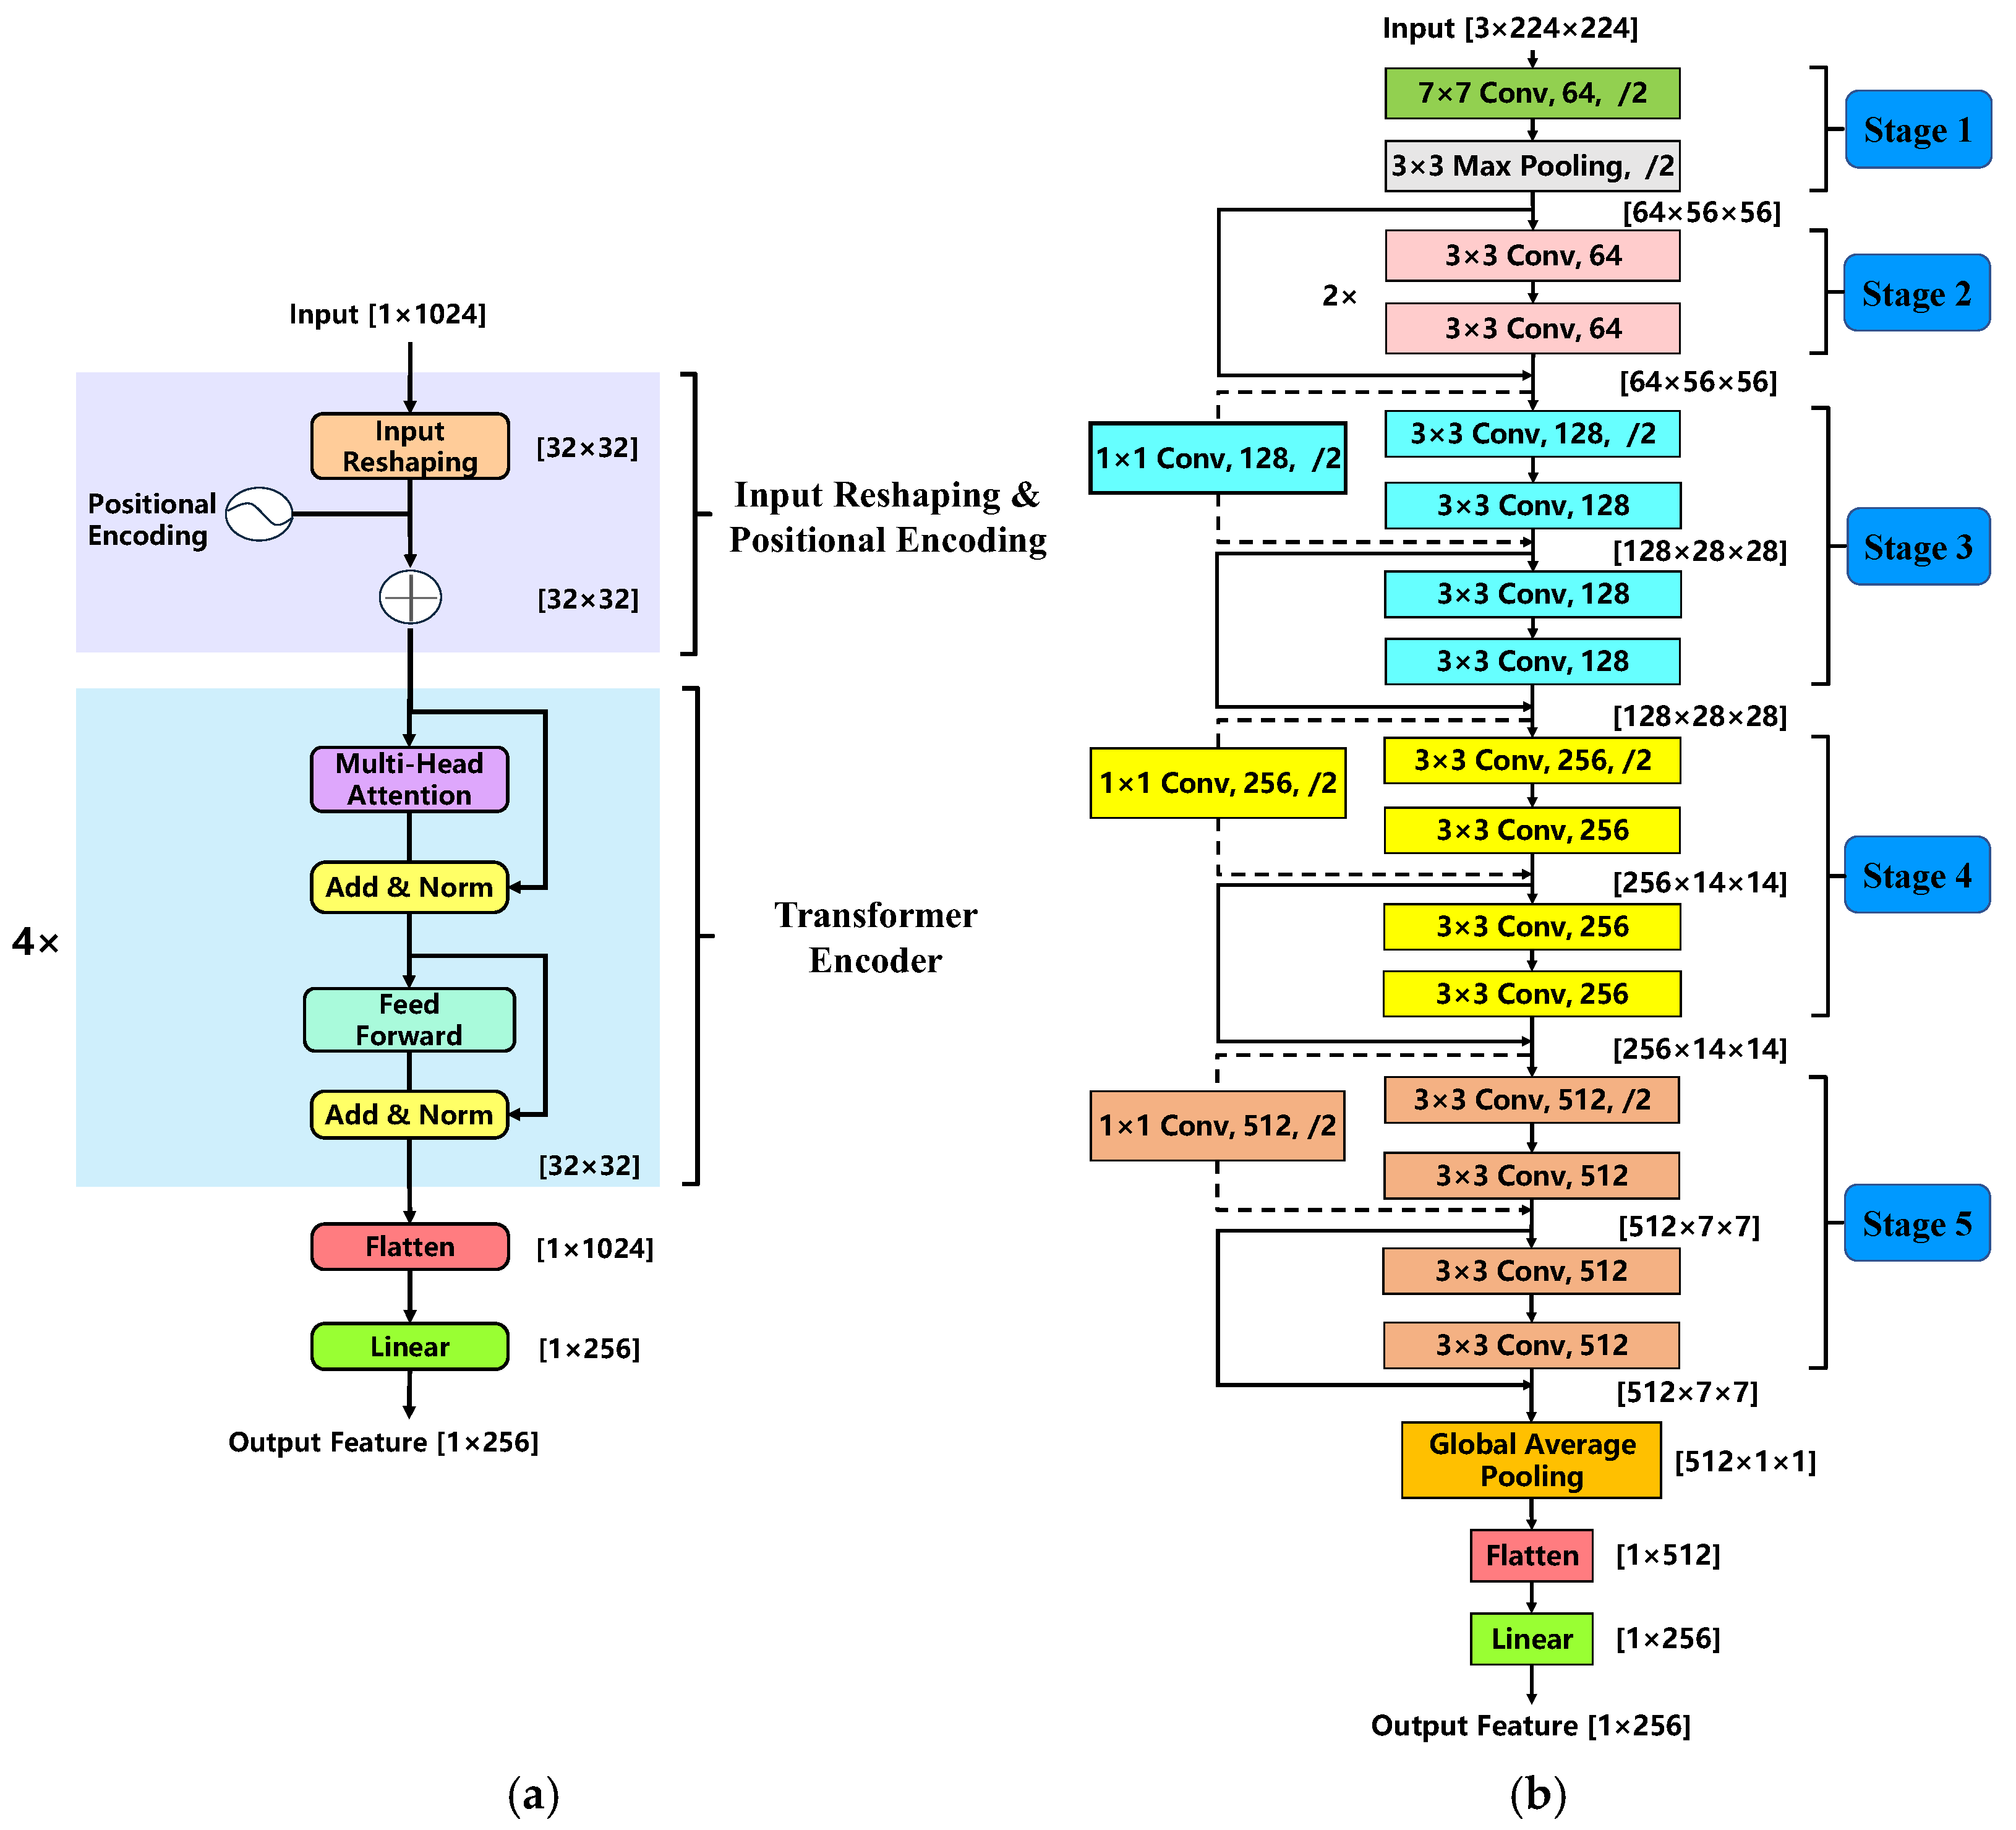
To address the structural characteristics of different modal data, this work designs two distinct neural network models for feature extraction from one-dimensional (1D) sequence modalities and two-dimensional (2D) image modalities, respectively. For the 1D sequence modalities, namely the Doppler spectrum and phase of radar echoes, this work adopts a processing architecture based on the Transformer. Its specific structure is shown in Figure 8a. To adapt to the Transformer’s input specifications and balance computational efficiency, inspired by the Vision Transformer (ViT) [34] which divides images into non-overlapping patches, this work designs a similar reshaping strategy for 1D sequences. For an original sequence of length , it first passes through an Input Reshaping & Positional Encoding module, where it is reshaped into a feature matrix of , where is the total number of non-overlapping temporal segments obtained from partitioning the original sequence, and is the number of sampling points within each segment, representing the feature dimension for each segment in the model. This reshaping method effectively converts the original sequence into 32 non-overlapping temporal segments, with each segment consisting of 32 consecutive sampling points, representing local waveform evolution features. While enhancing the feature representation capability of , it reduces the sequence length from 1024 to 32. Consequently, the computational complexity of the self-attention mechanism with respect to sequence length decreases from to . Moreover, this symmetric design is intended to balance the model’s focus between the sequence length and the feature dimension, potentially enhancing the representation capability of the self-attention mechanism.
Figure 8.
1D sequence processing module and 2D image processing module. (a): the sequence modality processing module based on Transformer; (b): the image modality processing module based on ResNet18.
Since the attention mechanism itself does not incorporate sequential order information, positional encoding is added to the reshaped feature matrix to supplement contextual information regarding the sequence order. The positional encoding in this work is computed as per Equation (7):
where denotes the feature dimension, which is 32 in this work, and represents the position of the current time segment within the sequence.
The feature matrix is then fed into a Transformer Encoder module, which consists of four stacked identical encoder layers. Each encoder layer contains two main sub-layers: the Multi-Head Attention (MHA) mechanism and the Feed-Forward Network (FFN).
The Multi-Head Attention (MHA) mechanism is a core component of the Transformer. It first captures long-range dependencies among temporal segments through scaled dot-product attention, calculated as follows:
By applying linear transformations to the input feature matrix, three distinct feature matrices are obtained: the Query, Key, and Value representations, denoted as Q, K, and V, respectively. By performing a dot-product between Q and K, the relational weights across various segments are established. After normalization by the SoftMax function, it is multiplied with V for weighted aggregation, enabling each temporal segment to incorporate global contextual information. For a given input vector , the SoftMax function is defined as:
In this work, the number of heads for the multi-head attention is set to . This means the original 32-dimensional feature space is mapped into four independent subspaces, each with a feature dimension of . Such an architecture enables the model to learn deep feature representations of sequential data in different representation spaces in parallel. The outputs from all attention heads are finally concatenated and undergo a linear transformation to restore the feature dimension from back to . This allows the model to capture richer global semantic information compared to using a single attention head. The corresponding formula is given by:
where denotes the number of attention heads, is the output of each attention head, and its calculation is defined as . , , are the linear transformation matrices, and is the linear transformation matrix used to integrate the multi-head concatenated features and restore their dimensionality to .
The Feed-Forward Network (FFN) comprises two consecutive fully connected layers with an intermediate Rectified Linear Unit (ReLU) activation function, defined as , which is applied independently to each position. Specifically, the output dimension of the first fully connected layer is set to 4 times to enhance feature representational capacity. After nonlinear mapping by the ReLU activation function, the second fully connected layer compresses the feature dimension back to . This design further improves the model’s ability to express nonlinear features while maintaining the feature dimension.
Each sub-layer (MHA and FFN) is immediately followed by a Residual Connection and Layer Normalization, referred to as the ‘Add & Norm’ operation. The residual connection helps alleviate the vanishing gradient problem in deep neural networks and ensures more efficient information propagation through the network. Layer normalization contributes to stabilizing the training process and accelerating model convergence.
After processing by the 4-layer encoder, the output high-order feature matrix contains rich global semantic information and retains its original dimension of [32 × 32]. Subsequently, it is flattened into a feature vector of size [1 × 1024], which is then further compressed into a [1 × 256] feature vector via a fully connected layer. This vector serves as the input to the subsequent feature fusion module.
For the two-dimensional GAF images generated from the amplitude sequence, this work employs a ResNet18 network as its feature processing unit. ResNet18 is a classic convolutional neural network that introduces skip connections, allowing feature information to bypass one or more convolutional layers and be added directly to the output of subsequent layers. This design enables the model to learn identity mappings more easily, thereby facilitating the construction of deeper networks without performance degradation.
The specific structure of the ResNet18 network is shown in Figure 8b. It consists of an initial convolutional layer followed by a max-pooling layer (Stage 1), and four residual blocks (Stage 2 to Stage 5). Each residual block contains two [3 × 3] convolutional layers, allowing the initial input to be merged with the convolutional output through a direct residual path, thereby facilitating identity mapping within the block. When down-sampling is required (such as from Stage 2 to Stage 3), the skip connection performs down-sampling and channel matching via a [1 × 1] convolutional layer with a stride of 2 to ensure dimensional consistency between input and output. The input to the GAF processing unit is a 2D image of size [3 × 224 × 224]. Preliminary feature extraction and down-sampling are first performed through a [7 × 7] convolutional layer and a [3 × 3] max-pooling layer in Stage 1. Subsequently, Stages 2 to 5 progressively extract higher-level semantic features. At the beginning of each stage, a convolutional layer with a stride of 2 performs down-sampling, gradually reducing the feature map size while increasing the number of channels. At the final stage of ResNet18, the resulting feature map [512 × 7 × 7] is transformed into a 1D vector [512 × 1 × 1] through a global average pooling layer. After flattening, it passes through a fully connected layer to be converted into a fixed-length feature vector of size [1 × 256]. This vector represents the high-level semantic features extracted by ResNet18 from the GAF images, and it will subsequently be fed together with the outputs from the two Transformer branches into the feature fusion module.
3.2. Feature Fusion Module
As shown in Figure 7, the three feature vectors of size [1 × 256] from the Doppler spectrum sequence, phase sequence, and GAF image processing units are stacked to form a multi-modal feature matrix of dimension [3 × 256], which is then fed into the feature fusion module. To address the potential correlation and information redundancy arising from the fact that features from different modalities originate from the same radar echo signal, this work adopts a self-attention mechanism as the feature fusion strategy. Unlike the SE attention mechanism that require a preset dimensionality reduction ratio, the self-attention mechanism can adaptively learn the intrinsic relationships between modalities based entirely on the input data. This enables the screening and integration of multi-modal data, reducing redundancy while enhancing the expression of key features. As detailed in the self-attention logic illustrated in Figure 7, the fusion process is executed through several specific network layers. First, the stacked feature matrix is linearly transformed through an embedding layer to obtain three matrices of equal size: Query(Q), Key(K), and Value(V). Then, Q and K are processed by a matrix multiplication (MatMul) operation to establish the similarity matrix among the different modal features. To prevent gradient vanishing issues during training caused by potentially large feature magnitudes, a scaling operation is performed using a scale factor of , where presents the feature dimension, which is 256 in this work. Subsequently, the similarity matrix is normalized via the SoftMax function (Equation (9)) to generate the weight matrix of the modalities. Finally, this weight matrix is multiplied by V through another MatMul layer to produce the optimized fused feature vector. Its specific computational logic follows Equation (8) described in Section 3.1. The final output is a fused feature vector that integrates the complementary strengths of each modality, providing a more comprehensive and reliable information representation for subsequent target detection.
3.3. Target Detection Module
The feature vector output by the feature fusion module is fed into the target detection module for the final classification decision. This module consists of a flattening layer, two fully connected layers, and a SoftMax network layer. The flattening layer ensures that the fused feature vector can be adapted to the input of the fully connected network layer. Subsequently, the fused feature vector is progressively compressed through two fully connected layers with output dimensions of 256 and 64, respectively. Finally, the SoftMax network layer outputs the predicted probabilities for the sea clutter and target classes. The SoftMax network layer includes a fully connected layer with an output dimension of 2, followed by a SoftMax function. The SoftMax function normalizes the output of the fully connected layer into a probability prediction vector . and represent the predicted probabilities that the sample is classified as sea clutter and target, respectively. If is greater than the classification threshold, the sample is classified as target; otherwise, it is classified as sea clutter.
For maritime target detection task, the most critical evaluation metrics are the false alarm rate () and the detection probability (). The false alarm rate is defined as the probability that a sea clutter sample is incorrectly classified as target, while the detection probability is defined as the probability that a target sample is correctly identified. In typical binary classification tasks, the classification threshold is set to 0.5. However, in order to control the false alarm rate required for target detection tasks, the threshold needs to be adjusted accordingly. Therefore, this work adopts the method proposed in [27] for controlling the false alarm rate: all sea clutter samples in the training set are used for model prediction, resulting in a corresponding target class probability vector , where is the number of sea clutter samples in the training set. The number of false alarms corresponding to the false alarm rate is calculated using Equation (11). The predicted probabilities in are sorted in descending order, and the -th probability value serves as the classification threshold corresponding to , where denotes the ceiling function.
3.4. Model Training Parameter Settings
The training and testing experiments in this work were conducted in a PyTorch-1.12.0 environment. The computer configuration was as follows: an Intel Xeon Silver 4210R CPU, an NVIDIA Quadro Corporation (Santa Clara, CA, USA) RTX 4000 GPU, and 64 GB of computational memory. The training process spanned a total of 100 epochs, with each iteration utilizing a mini-batch size of 64 samples. The classical Adam (Adaptive Moment Estimation) optimizer was employed for model parameter optimization, and the parameter update rule is given below:
where denotes the parameter values after the -th iteration, and is the learning rate, which controls the step size of each parameter update. In this work, is set to 0.0001. is the loss function; the classical cross-entropy function is used as the training loss, and its calculation is defined as follows:
where is the total number of samples used in each training batch, is the true class label of each sample, and is the corresponding class detection probability output by the model. In this work, the sea clutter class label is defined as 0, and the target class label is defined as 1.
4. Experimental Results and Analysis
For the proposed Doppler-Phase-GAF cross-level multimodal fusion architecture in this work, based on the different GAF encoding schemes, the specific configurations in the subsequent experiments are named the Doppler-Phase-GASF model and the Doppler-Phase-GADF model, abbreviated as D-P-GASF and D-P-GADF, respectively. To evaluate the performance of the proposed models, the experimental setup in this chapter is arranged as follows: First, network-matching experiments for each branch are conducted. By comparing the performance of different network models on single-modal data, the optimal feature extraction model for each branch is determined. Second, the multimodal architecture is compared with various single-modal counterparts to verify the performance gain achieved by cross-level multimodal fusion. Third, to evaluate generalization and robustness, comparative experiments against other multimodal fusion methods are conducted across three progressive stages: same-scenario validation, cross-sea-state validation, and cross-polarization validation. Furthermore, different multimodal fusion architectures are analyzed, incorporating paired t-tests for statistical significance and an evaluation of computational complexity. Finally, the proposed model is compared with various existing detection methods to evaluate its performance and stability under complex sea conditions.
4.1. Experimental Dataset Construction
In this work, the IPIX data listed in Table 1 is used to construct the training and test sets. The entire 131,072-point radar sequence for each range unit is first divided into 64 non-overlapping time segments, each with a fixed length of 2048 points. These independent time segments are then randomly shuffled and split into a training set and a test set at an 8:2 ratio, resulting in 50 training segments and 14 test segments. A sliding sampling method, as defined in Equation (14), is applied to the echo signal within the assigned time segments:
where denotes the sample index, is the sliding step between adjacent samples, and is the sequence length of each sample. In this work, the sample length is set to 1024. Given that the IPIX radar has a PRF of 1000 Hz, each sample corresponds to a radar observation time of 1.024 s.
Since the number of sea clutter cells in the IPIX data far exceeds that of target cells, different sampling steps are applied to the target and sea clutter cells to balance the sample quantities of the two classes. The sampling step for sea clutter cells, denoted as , is calculated using Equation (15):
where and represent the total number of sea clutter and target cells in one set of IPIX data, respectively; is preset sample ratio between sea clutter and target, which is set to 2 in this work; and is the sampling step for target cell, set to 10.
Taking IPIX#26 data as an example, this set contains 11 sea clutter cells and 1 target cell. Substituting these values into Equation (15) yields , After sliding sampling, 10,450 sea clutter samples and 5150 target samples are obtained for the training set, while 2926 sea clutter samples and 1442 target samples are generated for the testing set. Each sample in the partitioned dataset is the raw radar complex echo sequence. Following the method described in Section 2, modality extraction is performed to obtain three types of modalities: the Doppler spectrum sequence, the phase sequence, and the GASF/GADF images. The length of each 1D sequence modality is 1024. The 2D image modalities, obtained via pseudo-color mapping, are resized to a dimension of [3 × 224 × 224].
4.2. Branch Network Matching Experiment
To verify the matching performance between different neural network models and the modal data of each branch, this section selects data from three different significant wave height (SWH) and signal-to-clutter ratio (SCR) scenarios under HH polarization for experiments, specifically: IPIX #30 (SWH = 0.9 m, SCR = −0.3 dB), #26 (SWH = 1.0 m, SCR = 4.3 dB), and #17 (SWH = 2.1 m, SCR = 18.3 dB). Experiments are conducted for both 1D sequence modalities and 2D image modalities, involving multiple comparative trials to determine the optimal model for each branch. For the Doppler spectrum and phase sequences, four typical time-series extraction networks are selected for comparison: the temporal LeNet (T-LeNet) [28], LSTM [35], BiLSTM, and Transformer. For the 2D GASF/GADF images, four classical convolutional neural networks are chosen for comparison: LeNet5, AlexNet [36], VGG16 [36], and ResNet18.
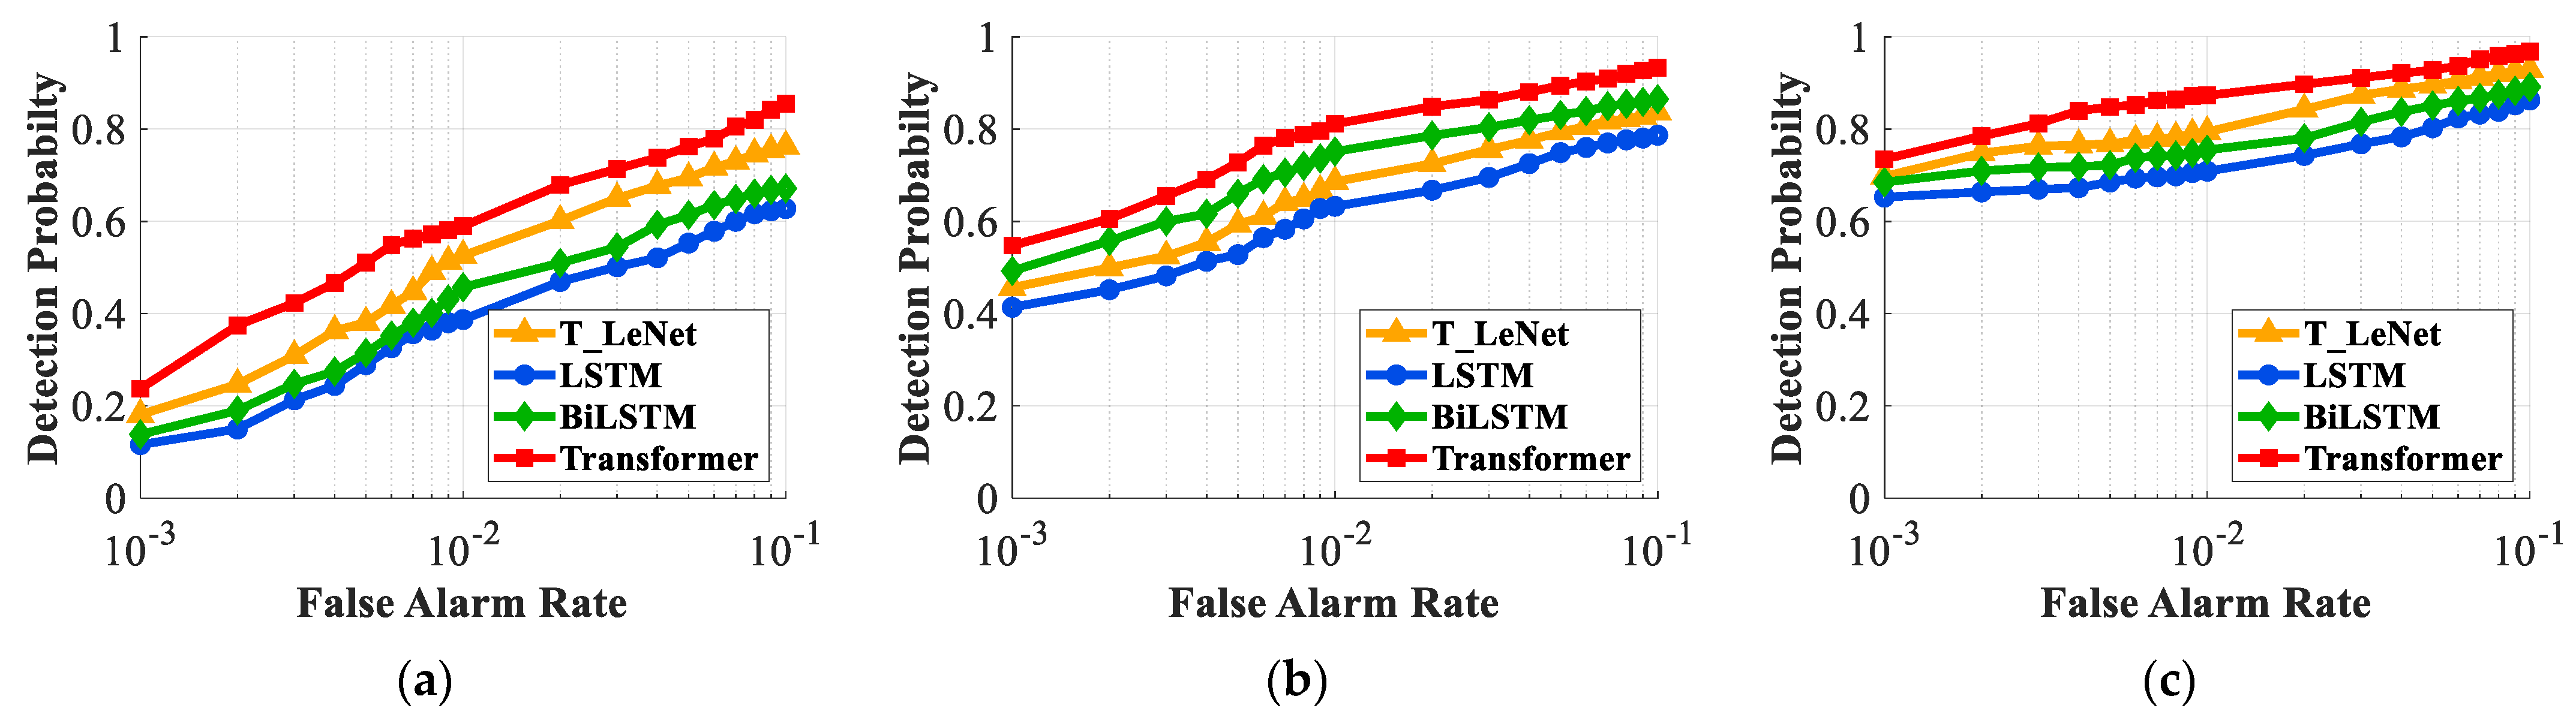
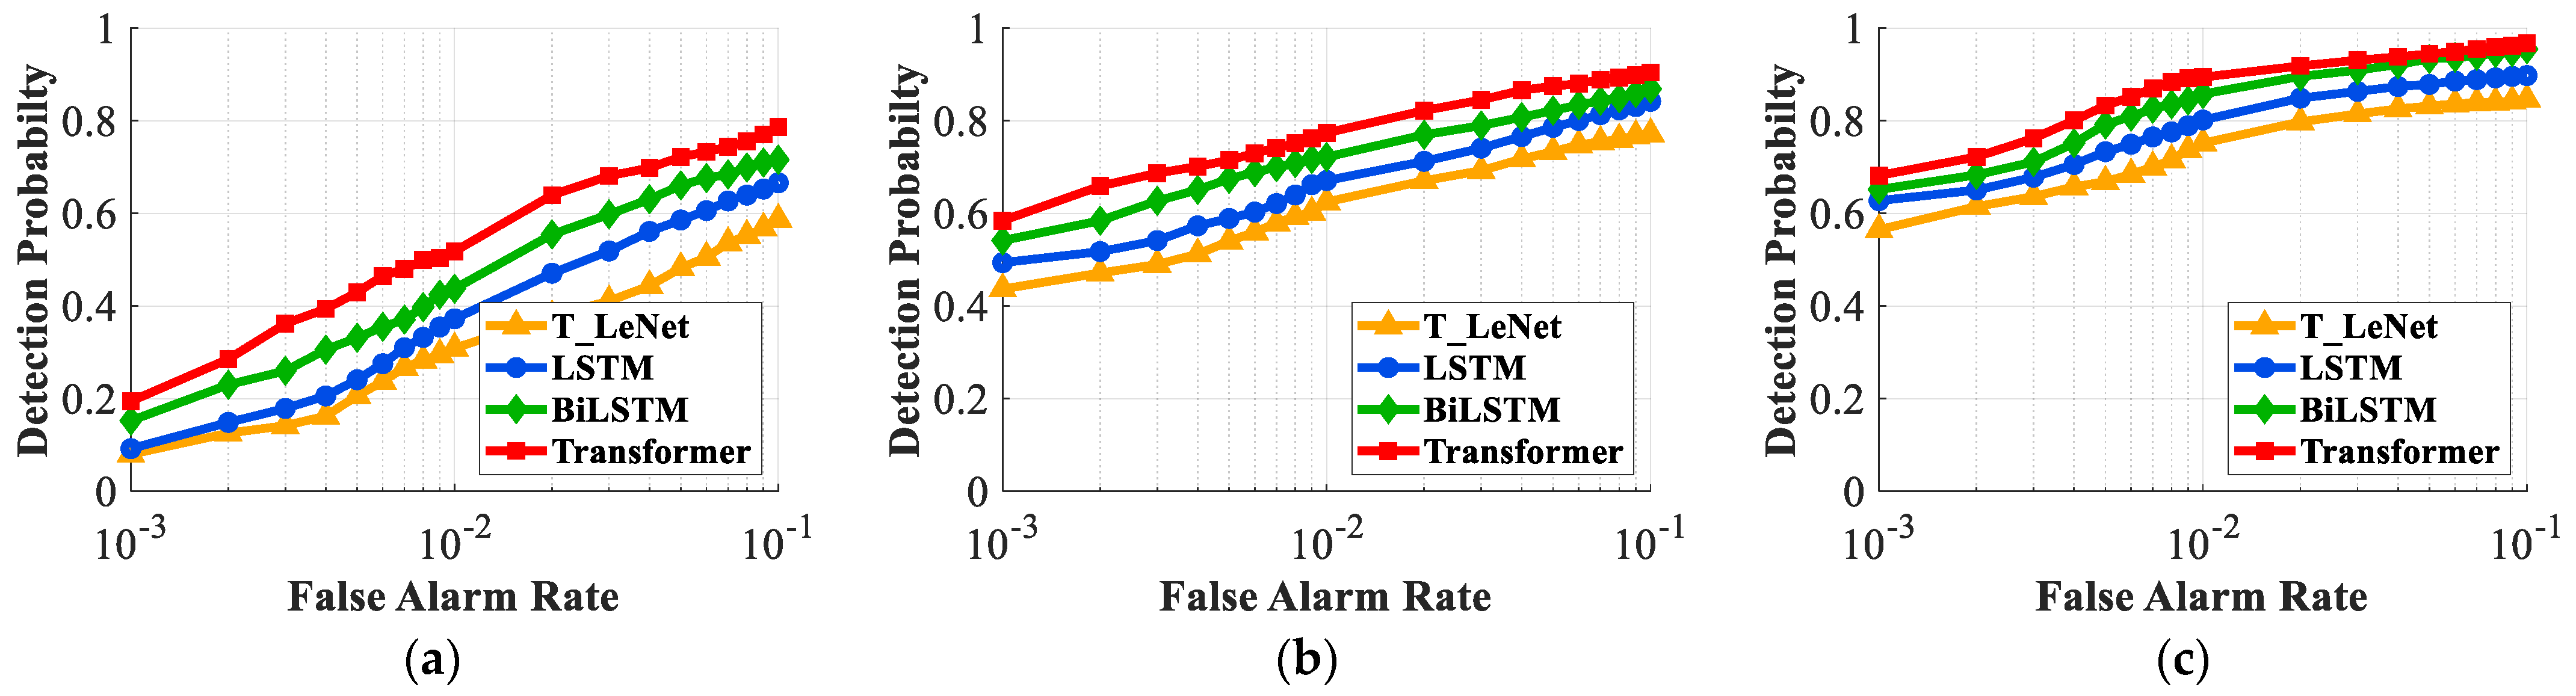
Figure 9 and Figure 10 respectively present the detection results using T-LeNet, LSTM, BiLSTM, and Transformer models based on the Doppler spectrum and phase sequences of radar echoes, where each sub-figure represents a specific sea state and SCR scenario. As defined in Section 3.3, the horizontal axis (false alarm rate) denotes the probability of misclassifying sea clutter as a target, while the vertical axis (detection probability) represents the probability of correctly identifying a true target. The experimental results show that the Transformer model exhibits consistently higher detection performance across the selected sea state scenarios. For instance, in Figure 9a and Figure 10a, when the false alarm rate is 10−3, the detection probabilities for the Doppler spectrum and phase modalities using the Transformer are 0.24 and 0.19, respectively, which are higher than those of the sub-optimal models T-LeNet (0.18) and BiLSTM (0.15). This indicates that the attention mechanism of the Transformer model is superior to the limited local receptive field of T-LeNet or the sequential dependency modeling of LSTM and BiLSTM in capturing long-range dependencies within radar echo signals. Therefore, this work selects the Transformer model as the feature processing unit for both the Doppler spectrum and phase sequences.
Figure 9.
Detection performance comparison of different 1D sequence extraction networks using Doppler spectrum sequence as input under various sea conditions and SCRs: (a) IPIX #30; (b) IPIX #26; (c) IPIX #17.
Figure 10.
Detection performance comparison of different 1D sequence extraction networks using phase sequence as input under various sea conditions and SCRs: (a) IPIX #30; (b) IPIX #26; (c) IPIX #17.
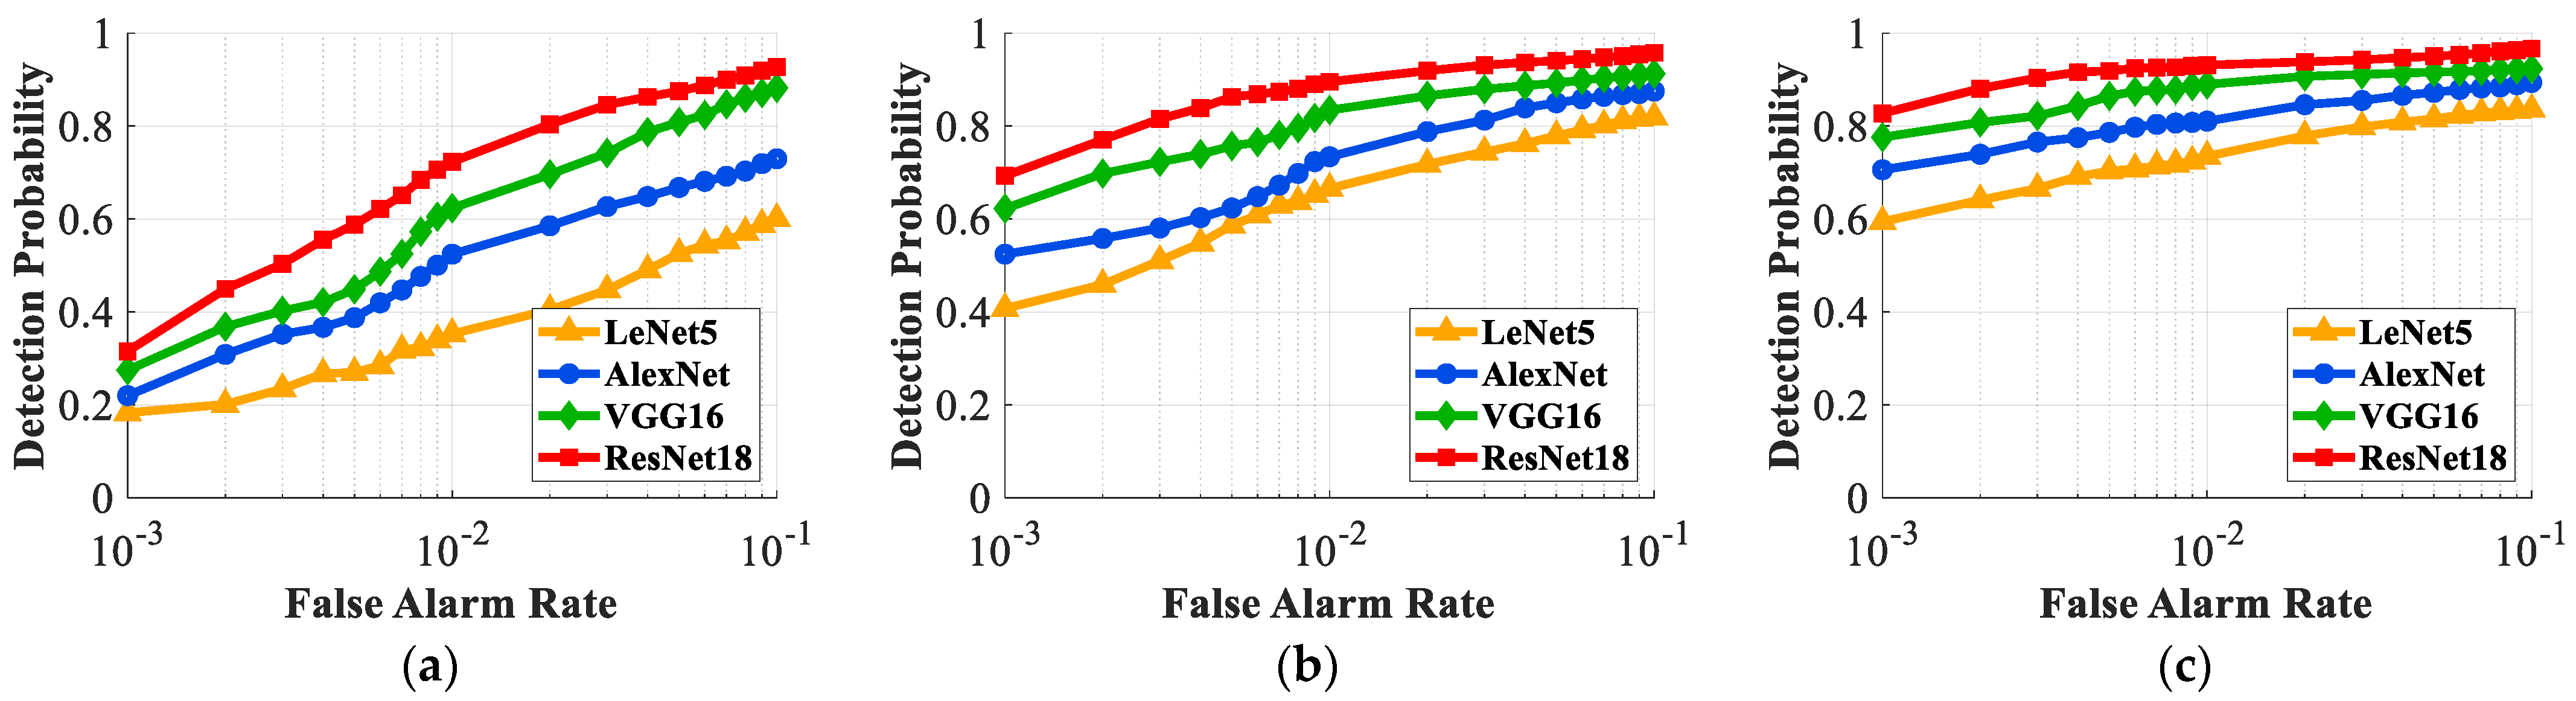
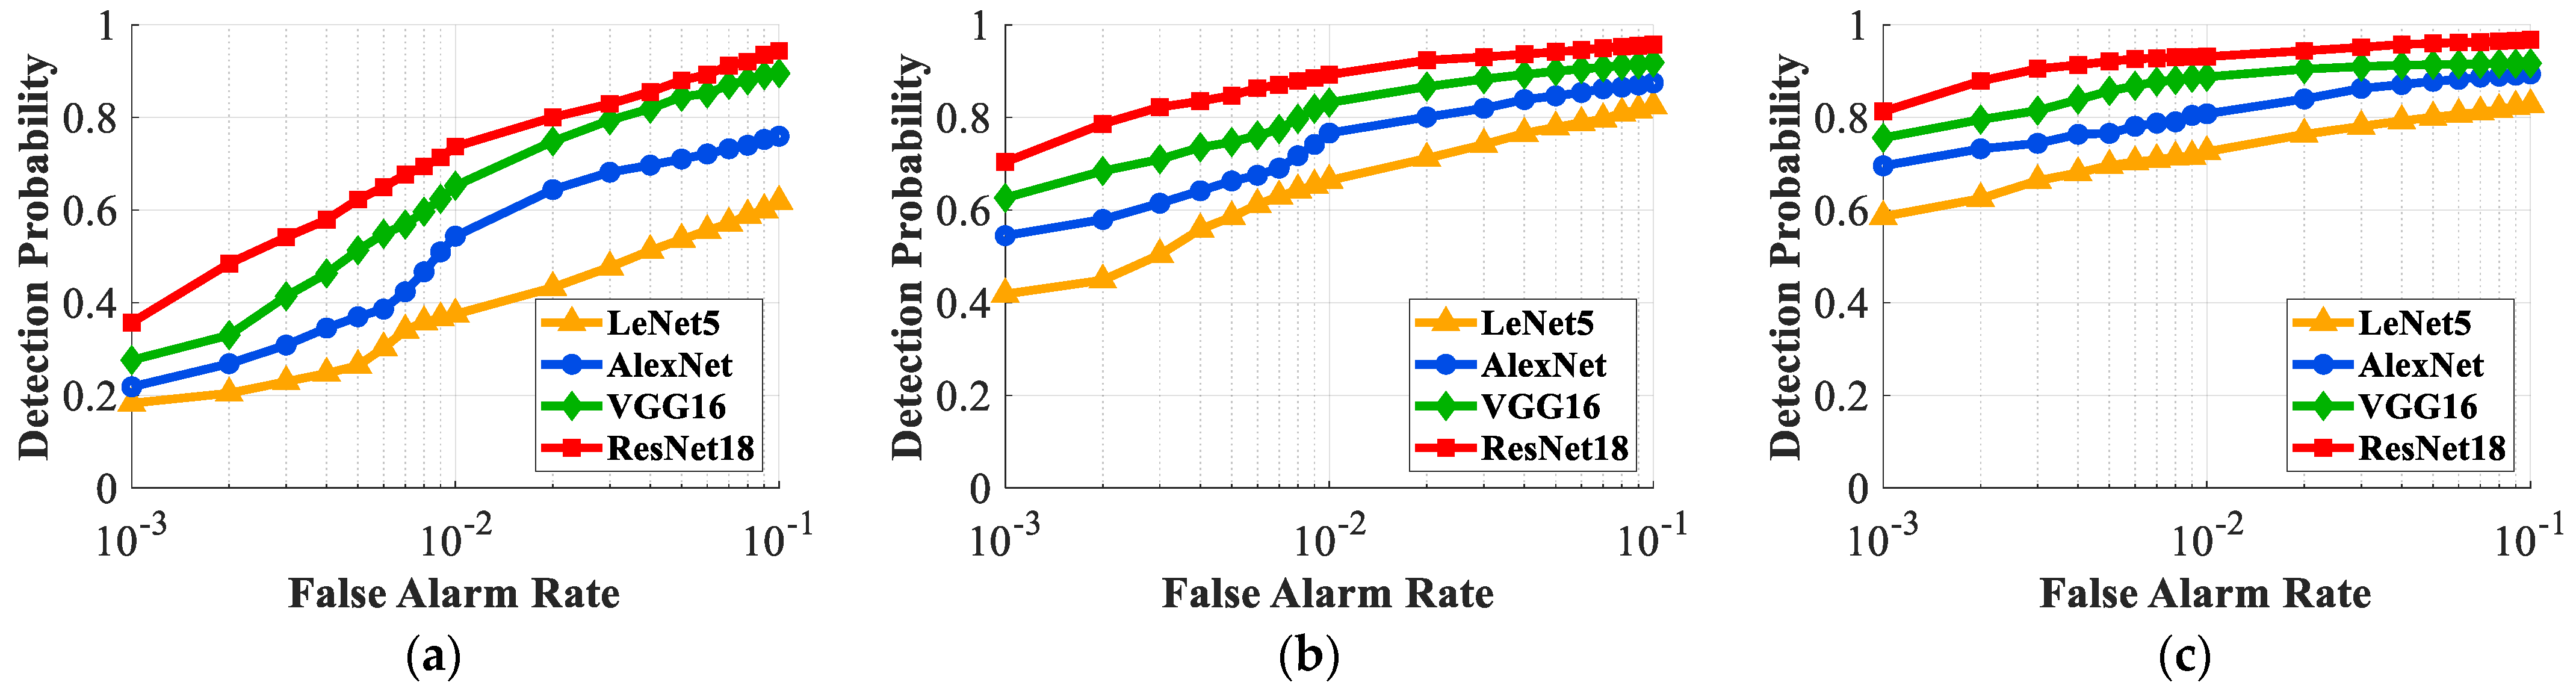
Similarly, Figure 11 and Figure 12 present the detection performance based on GASF and GADF image modalities, respectively, using different convolutional neural networks under three sea state scenarios.
Figure 11.
Detection performance comparison of different CNN models using GASF image as input under various sea conditions and SCRs: (a) IPIX #30; (b) IPIX #26; (c) IPIX #17.
Figure 12.
Detection performance comparison of different CNN models using GADF image as input under various sea conditions and SCRs: (a) IPIX #30; (b) IPIX #26; (c) IPIX #17.
The results indicate that the ResNet18 model shows improved results compared to the other three convolutional neural network models without residual structures in terms of detection probability across all scenarios. For instance, in Figure 11a for the IPIX #30 data, when the false alarm rate is 10−3, the detection probability based on the ResNet18 model is 0.32. In contrast, the detection probabilities for the VGG16, AlexNet, and LeNet5 models are 0.27, 0.22, and 0.18, respectively. This is attributed to the residual structure introduced in ResNet18, which mitigates the feature degradation problem in deep networks, making it more competitive to convolutional neural networks without skip connections in capturing image texture features. Furthermore, ResNet18 replaces the fully connected layers in VGG16 with a global average pooling layer at the final stage, which enhances detection accuracy while effectively reducing the number of model parameters. Therefore, considering both model performance and efficiency, this work selects the ResNet18 model as the feature processing unit for the GASF and GADF image modalities.
4.3. Comparative Analysis of Multimodal Fusion and Individual Modalities
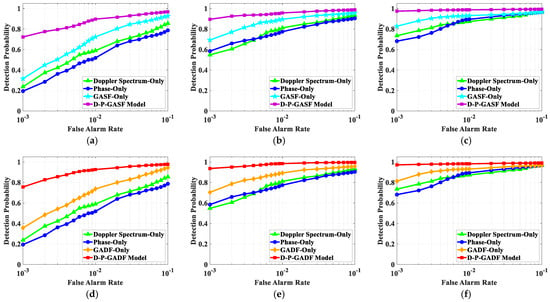
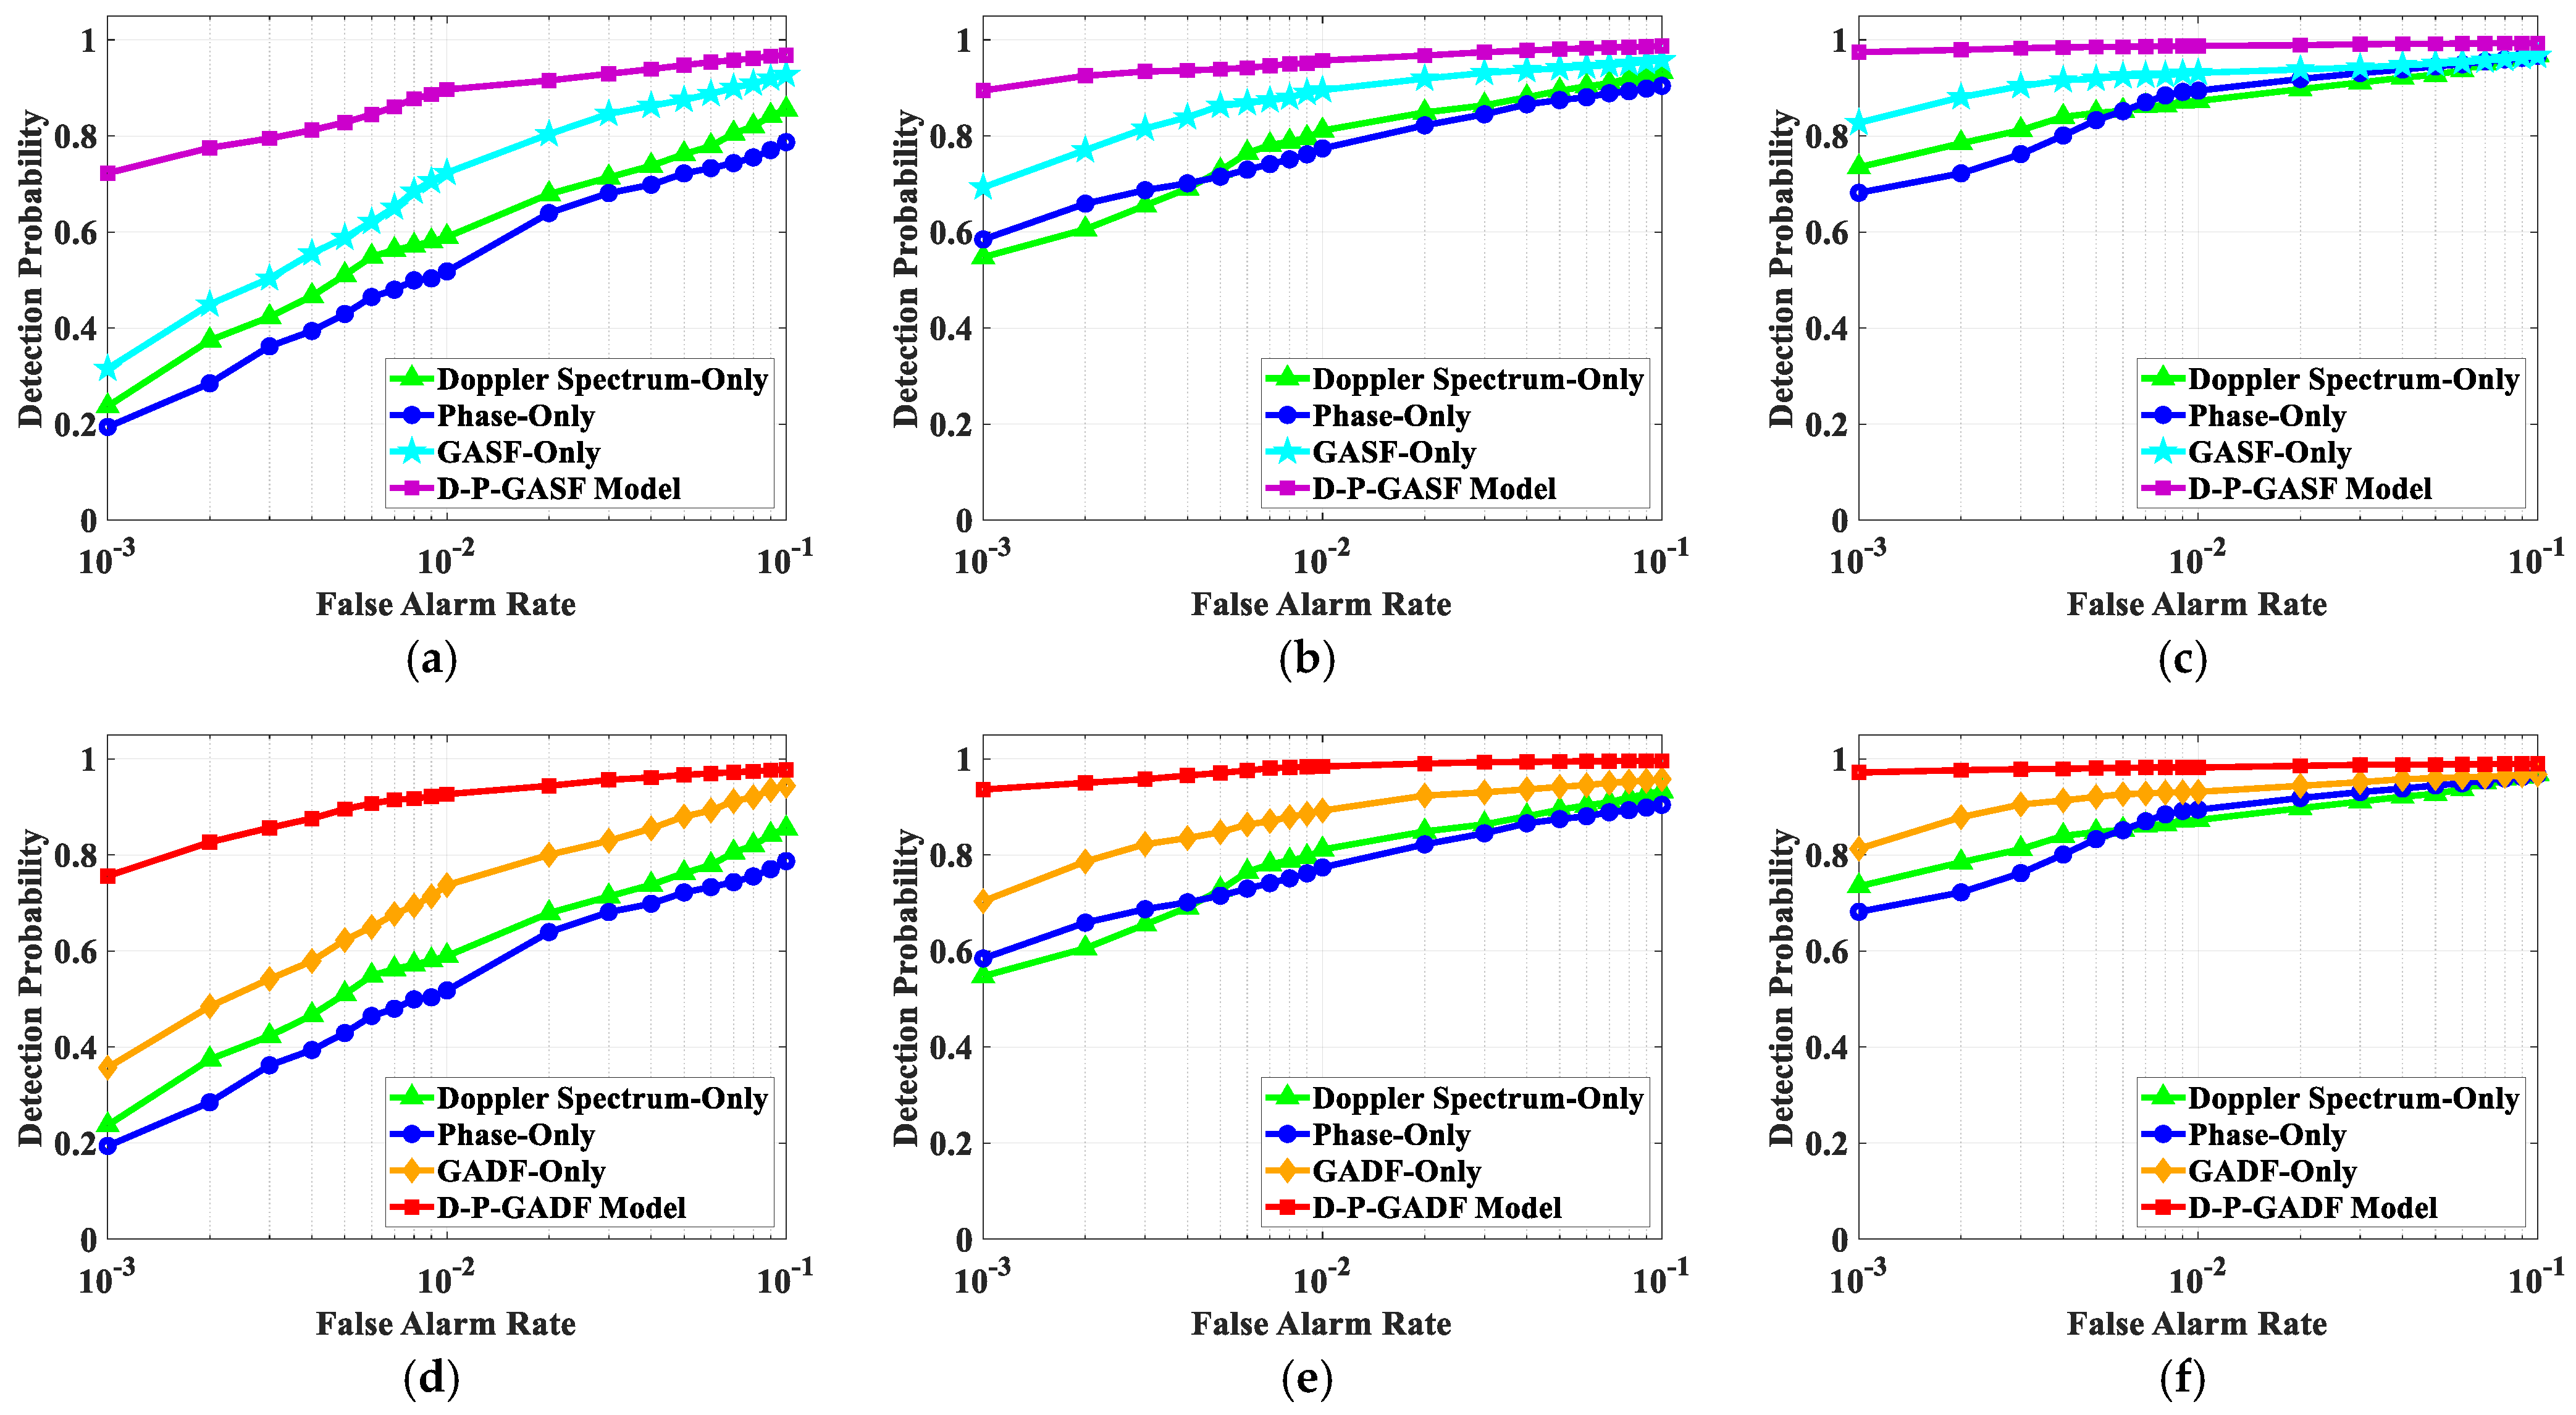
To verify the performance improvement of the proposed cross-level multimodal fusion architecture for sea surface target detection, Figure 13 shows a comparison of the detection performance between the two proposed model configurations and various single-modal counterparts under the aforementioned three representative scenarios.
Figure 13.
Comparison of detection probability between the proposed multimodal fusion models and single-modal counterparts across three typical sea conditions. Rows 1 and 2 correspond to the D-P-GASF and D-P-GADF configurations, respectively. (a,d) IPIX #30; (b,e) IPIX #26; (c,f) IPIX #17.
The experimental results demonstrate that the proposed cross-level multimodal fusion architecture exhibits distinct performance improvements compared to single modal detection method across all experimental scenarios. For example, in Figure 13d using IPIX #30 data, when the false alarm rate is 10−3, the detection probabilities based on the Doppler spectrum sequence and the phase sequence are 0.237 and 0.194, respectively, while that based on GADF alone is 0.357. In contrast, the detection probability of the proposed D-P-GADF model reaches 0.756. This indicates that the Doppler spectrum and phase modalities, which reflect target motion characteristics, and GADF, which reveals the evolution pattern of echo energy, possess inherent feature complementarity. By providing a synergistic multi-dimensional representation of the echo signal, they effectively enhance the model’s ability to distinguish between sea clutter and target echoes. Furthermore, as the SCR increases, the performance of single modal detection methods improves to some extent. However, when the false alarm rate decreases from 10−1 to 10−3, the detection probability of single modal methods shows a sharp decline. In contrast, the proposed D-P-GASF and D-P-GADF models exhibit a much gentler decreasing trend, suggesting improved stability in performance across varying false alarm rates.
4.4. Comparative Analysis of Different Multimodal Fusion Methods
To further evaluate the detection performance and robustness of the proposed architecture, comparative experiments are conducted in this section between the D-P-GASF and D-P-GADF models and the two multimodal fusion models proposed in [28,29]. The specific configurations of each model are shown in Table 2. The design of the comparative experiment consists of three progressive stages to provide a multidimensional evaluation. In the first stage, the detection performance is compared using the aforementioned three typical HH polarization datasets, with both training and testing based on the same IPIX data. In the second stage, a cross-sea-state comparative experiment is conducted to verify the generalization performance of the model across different sea conditions. Specifically, models trained on IPIX #30 data (with relatively low SCR and sea state) are tested on IPIX #17 data (with relatively high SCR and sea state), and vice versa. In the third stage, to examine the robustness under different polarization modes, a cross-polarization comparative experiment is conducted, in which all models are trained on HH polarization data from IPIX #26 and tested on the HV, VH, and VV polarization data from the same dataset.
Table 2.
Configuration information of different multimodal fusion methods.
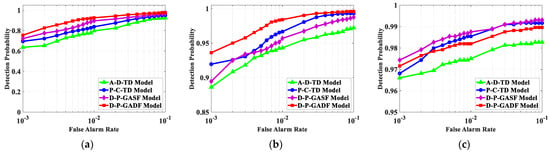
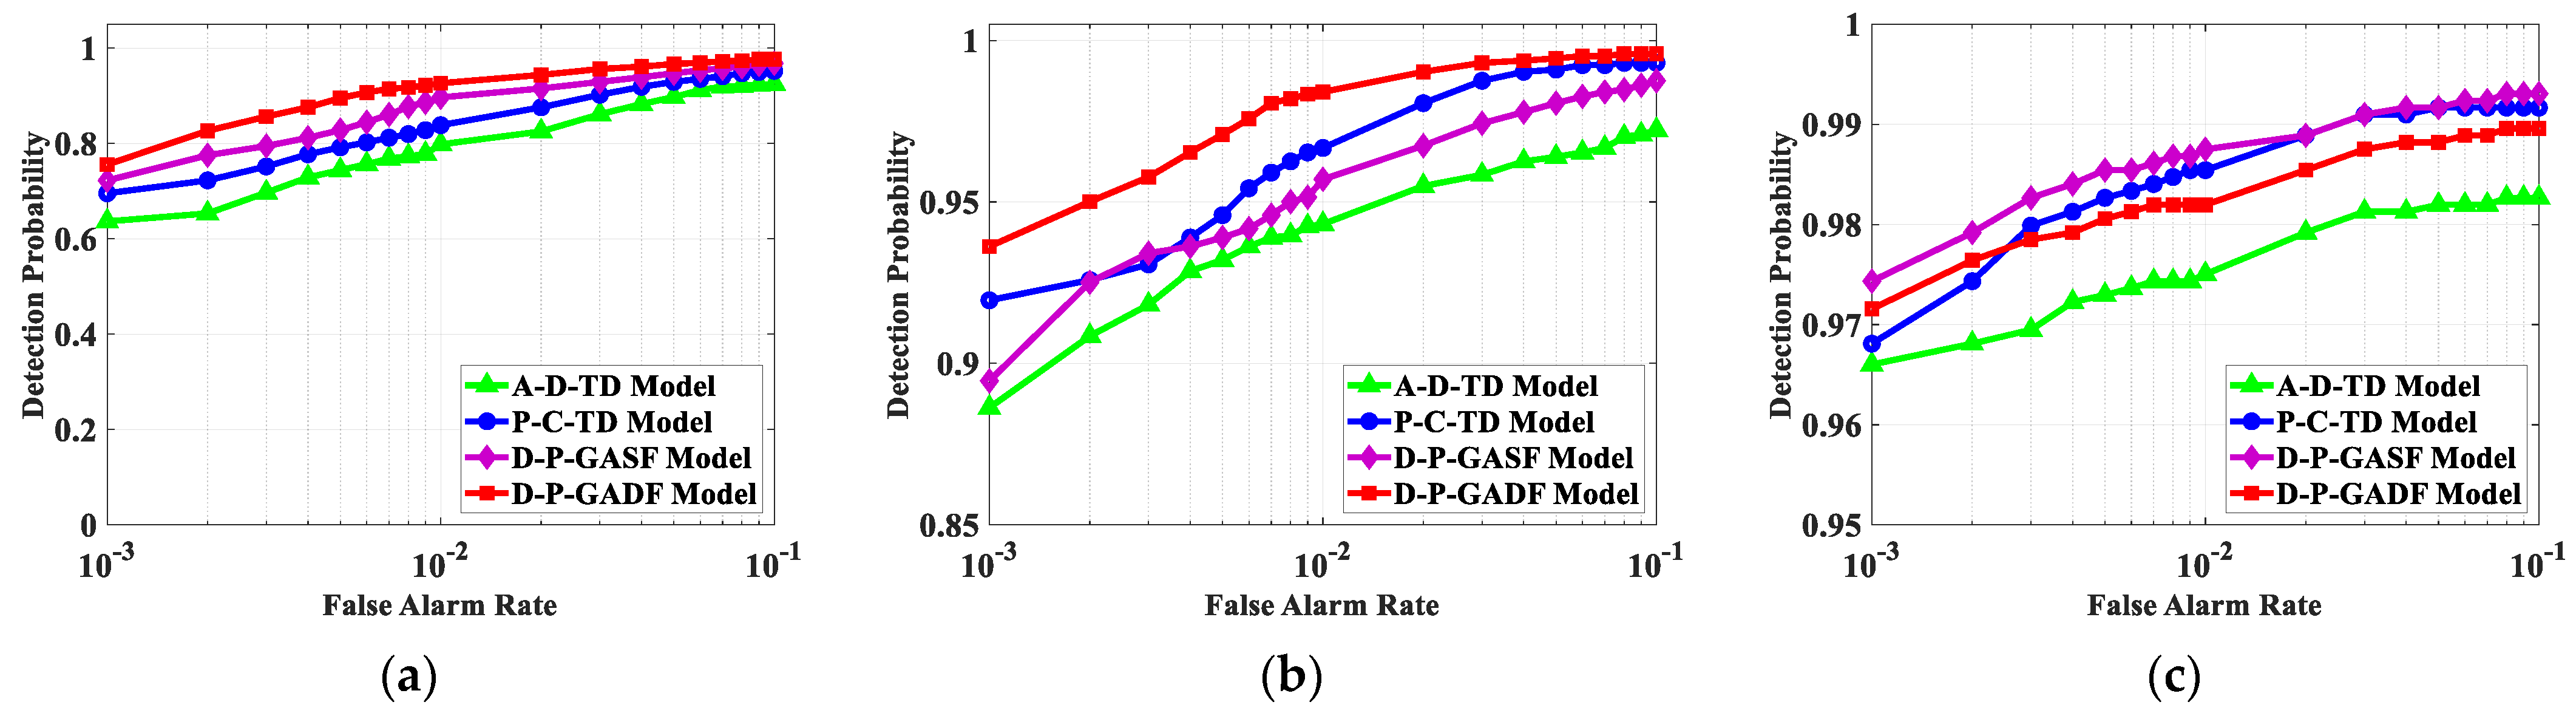
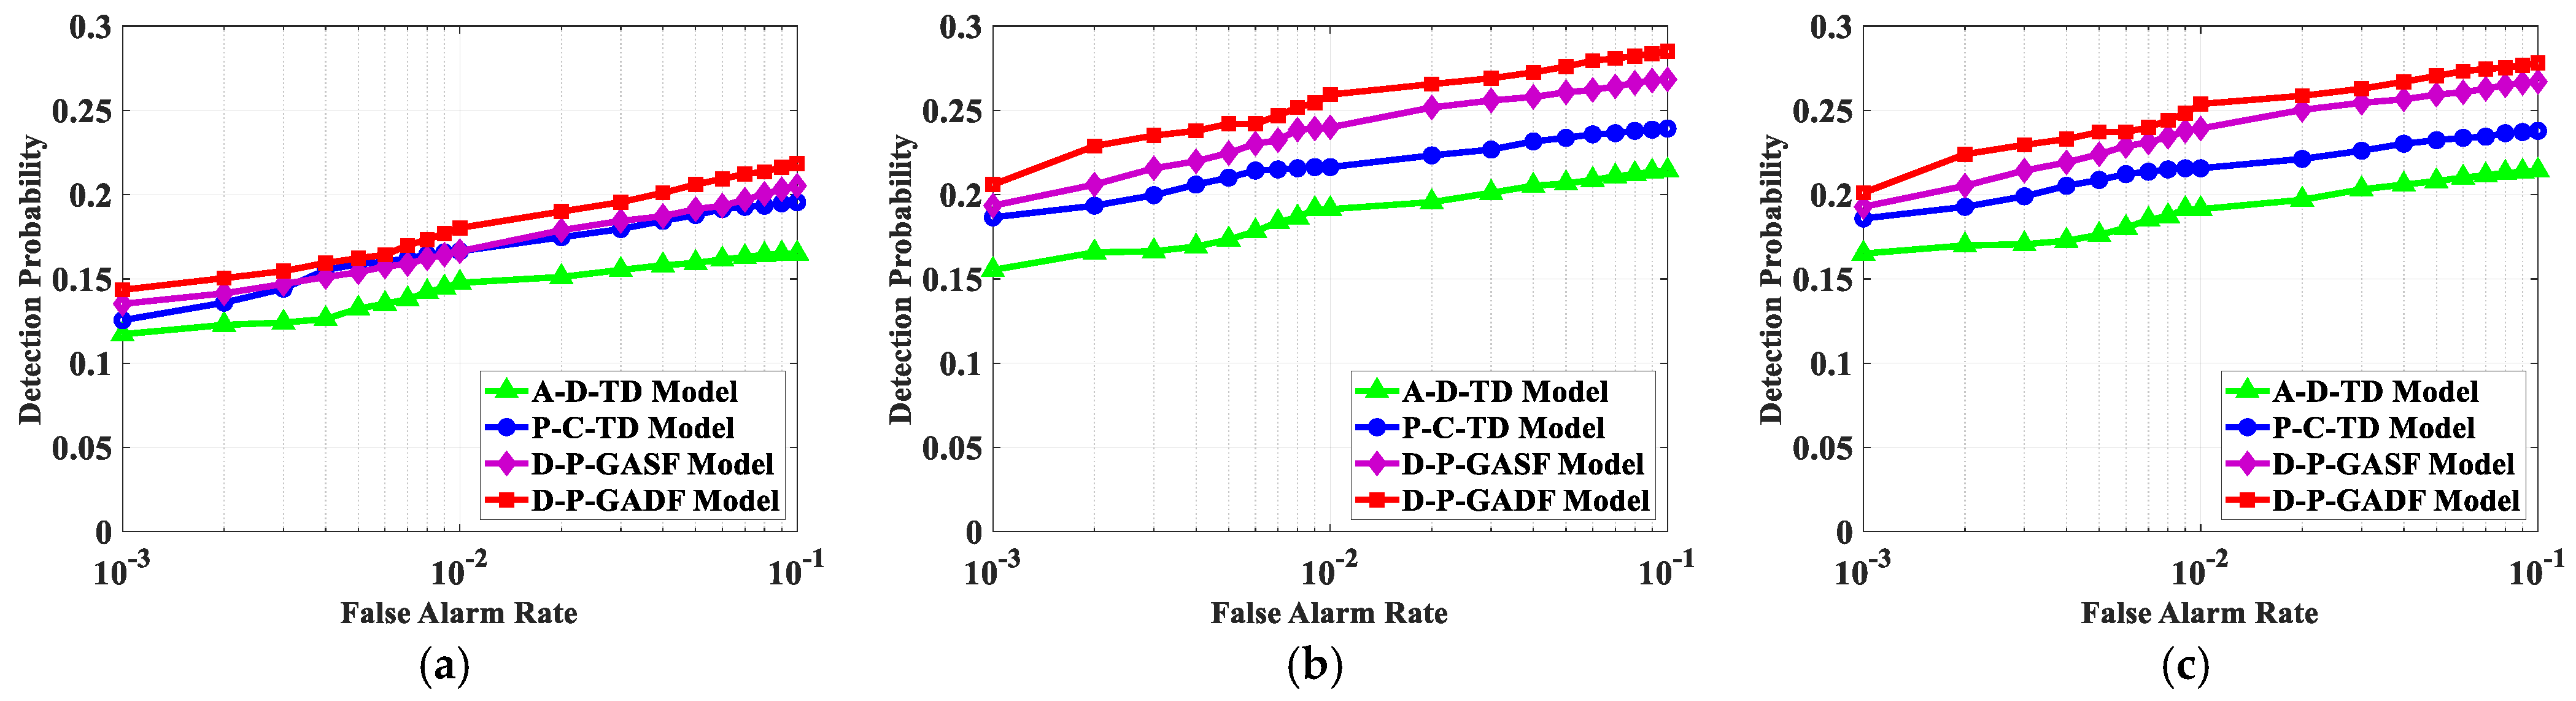
The results for the first stage are presented in Figure 14 and Table 3. The results indicate that the proposed D-P-GADF and D-P-GASF models yield relatively higher detection probabilities across the three typical scenarios. For instance, in the IPIX #30 data (SCR = −0.3 dB), when the false alarm rate is 10−3, the D-P-GADF model achieves the detection probability of 0.756, which is higher than those of P-C-TD (0.696) and A-D-TD (0.637).
Figure 14.
Comparison of Detection Performance of Different Multimodal Fusion Methods under various sea conditions and SCRs: (a) IPIX #30; (b) IPIX #26; (c) IPIX #17.
Table 3.
Detection probability of different multimodal fusion methods under varying false alarm rates.
It is observed that the A-D-TD model exhibits limited performance, which could be attributed to the redundancy between the Doppler spectrum and the time-Doppler im-age. Although the P-C-TD model reduces redundancy by introducing autocorrelation sequences, it remains less effective than the proposed D-P-GAF architecture in these tests. This difference suggests that while the autocorrelation sequence provides a 1D representation of temporal correlation, the GAF transformation maps the amplitude sequence into a 2D structured space, offering an alternative approach to capture the temporal evolution and structural features of the signals. By leveraging ResNet18 for structural images and a Transformer branch for 1D sequences, a synergistic representation is achieved that integrates physical kinematic attributes with abstract structural patterns. Within this framework, the Transformer branch shows an improved ability to capture long-range dependencies in 1D modalities compared to traditional CNN or RNN units, facilitating a more effective characterization of complex radar echoes.
The cross-sea-state validation results of the second stage are presented in Figure 15 and Table 4. To quantitatively evaluate the model’s adaptability to varying environmental conditions, the Generalization Retention Rate (GRR) is introduced, as defined in Equation (16).
where represents the detection probability achieved under cross-scenario testing configurations, such as cross-sea-state or cross-polarization, and denotes the baseline detection probability under the same-scenario configuration when the false alarm rate is 10−3.
Figure 15.
Generalization performance across different sea-states: Detection probability of various methods under cross-SWH test configurations (HH polarization). (a) Train on IPIX #17 and test on IPIX #30; (b) Train on IPIX #30 and test on IPIX #17.
Table 4.
Quantitative comparison of detection probability and Generalization Retention Rate (GRR) under cross-sea-state scenarios.
It is observed that while the absolute detection probability for all methods decreases significantly under unseen sea conditions due to the distinct clutter distribution shifts between IPIX #30 and #17, the proposed D-P-GADF and D-P-GASF models consistently exhibit relatively higher performance levels and GRR values compared to the baseline models. These results suggest that the proposed cross-level fusion strategy offers relatively better adaptability when encountering sea states that differ from the training environment.
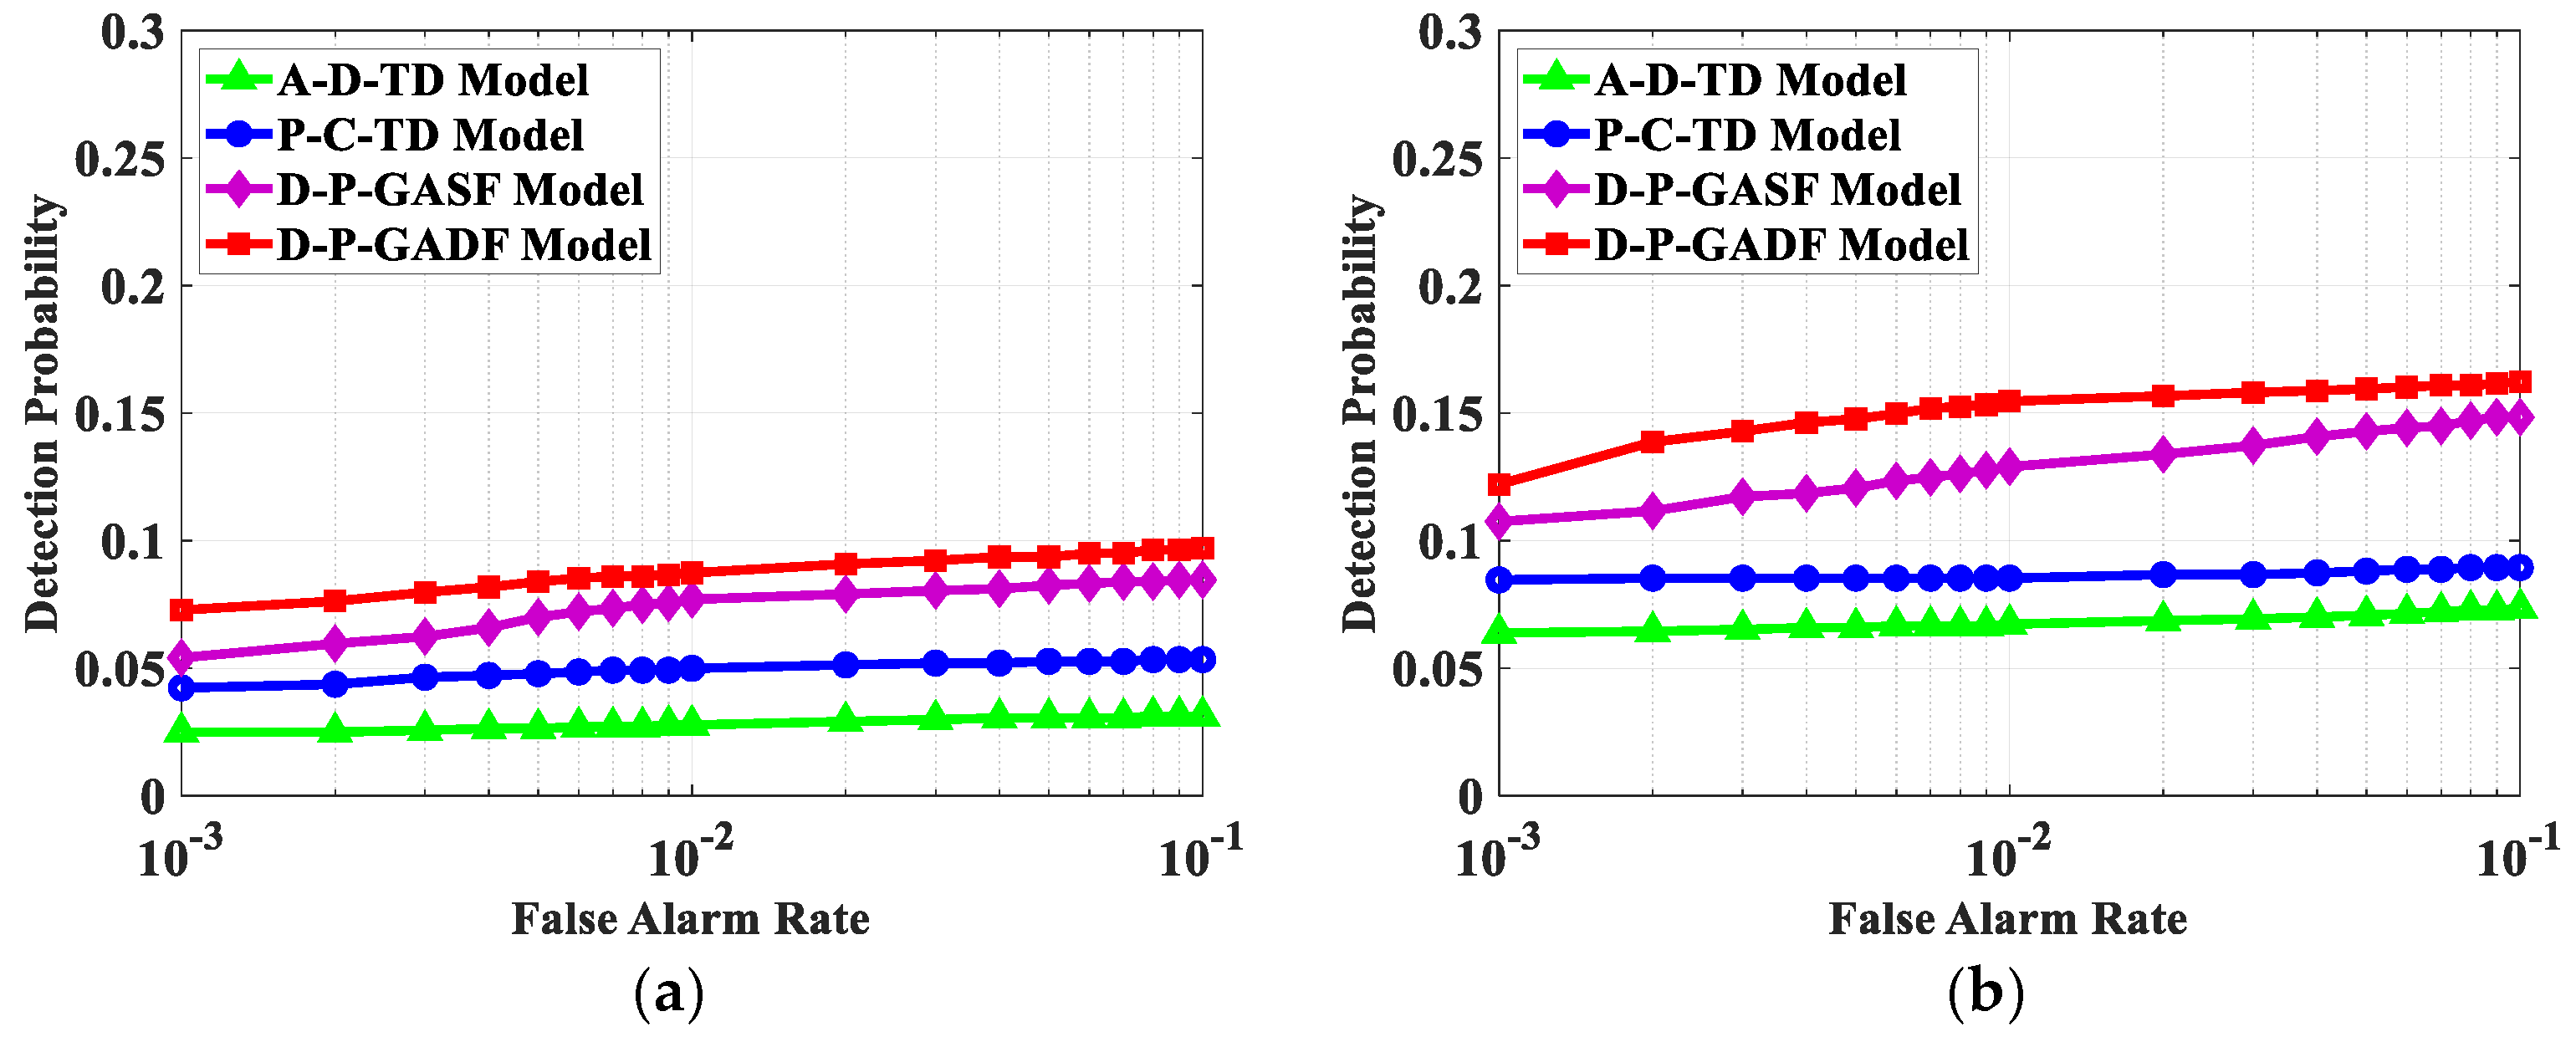
The third stage evaluates the robustness of the synergistic representations across different polarization modes. The results are summarized in Figure 16 and Table 5, showing that training on #26 data of HH and testing on #26 data of other polarizations (HV, VH, VV) results in a noticeable performance decline for all models, due to differences in scattering mechanisms. However, consistent with the findings in previous stages, the proposed D-P-GADF and D-P-GASF models yield relatively higher detection probabilities compared to the A-D-TD and P-C-TD models, indicating that the integration of cross-layer features helps mitigate the impact of polarization-dependent clutter fluctuations to some extent.
Figure 16.
Generalization performance across different polarization modes based on IPIX #26: (a) Train on HH polarization and test on VV polarization; (b) Train on HH polarization and test on HV polarization; (c) Train on HH polarization and test on VH polarization.
Table 5.
Quantitative comparison of detection probability and Generalization Retention Rate (GRR) under cross-polarization scenarios.
4.5. Comparative Analysis of Different Multimodal Fusion Architectures
The experimental results in Section 4.3 verify the effectiveness of the proposed cross-level multimodal fusion architecture. According to the theoretical analysis of GAF in Section 2.2, the main diagonal of GASF is essentially a nonlinear mapping of the original amplitude sequence (, where is the normalized amplitude sequence), while GADF explicitly suppresses instantaneous amplitude information through the setting of a zero diagonal (). To investigate the influence of incorporating raw amplitude data on the overall detection efficacy of the proposed architecture, this section designs five multimodal fusion architectures as shown in Table 6, all of which employ a self-attention mechanism for feature fusion.
Table 6.
Input Modalities and Modal Processing Units of Different Multimodal Fusion Architectures.
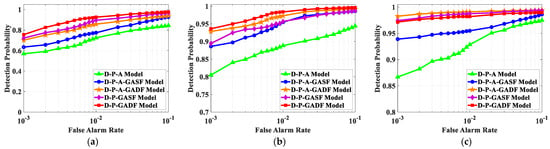
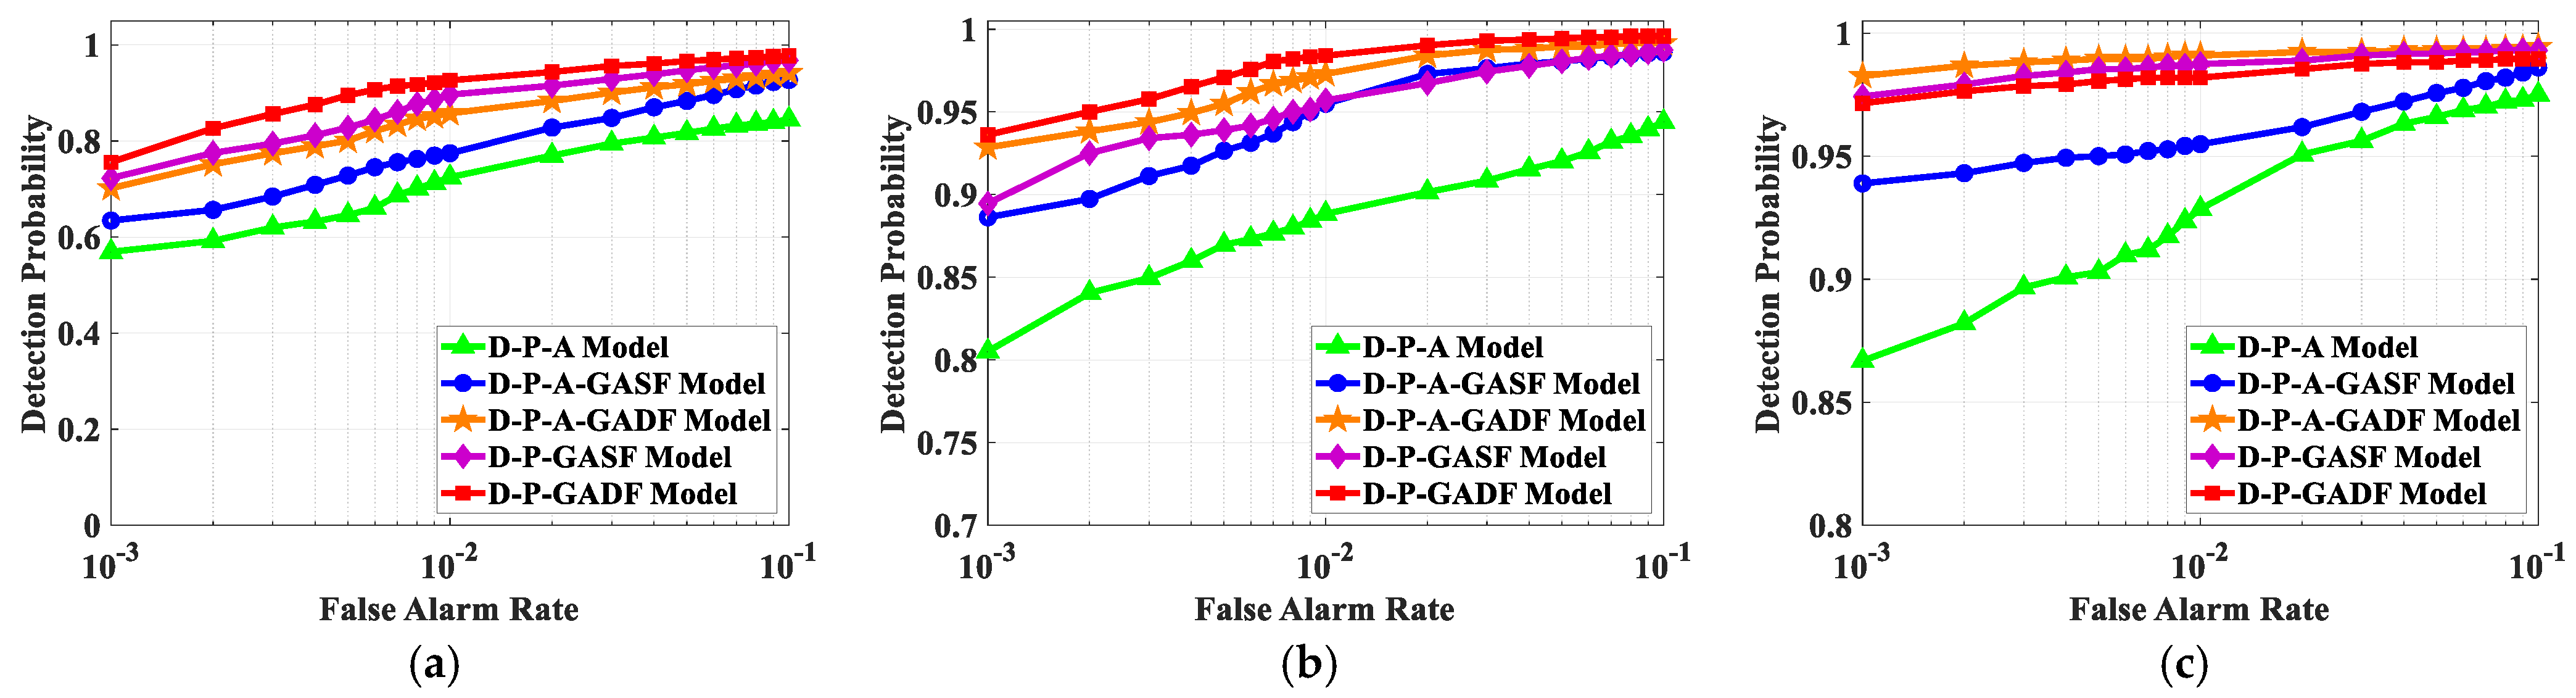
Figure 17 shows the detection performance comparison of the aforementioned five multimodal fusion architectures across three typical scenarios, while Table 7 further presents the detection probabilities of various multimodal fusion methods under different false alarm rates.
Figure 17.
Comparison of Detection Performance of Different Multimodal Fusion Architectures under various sea conditions and SCRs: (a) IPIX #30; (b) IPIX #26; (c) IPIX #17.
Table 7.
Detection probability of different multimodal fusion architectures under varying false alarm rates.
The results from Figure 17 and Table 6 show that the proposed D-P-GASF and D-P-GADF models exhibit improved performance compared to the D-P-A model, which directly uses the amplitude sequence, across all investigated scenarios. For example, when the false alarm rate is 10−3, the detection probabilities of the D-P-GADF model for IPIX #30, #26, and #17 are 0.756, 0.936, and 0.972, respectively, while those of the D-P-A model are 0.569, 0.805, and 0.867, respectively. This indicates that converting the 1D amplitude sequence into structured images through GAF transformation can more comprehensively capture the contrast between backscattered target signals and sea surface clutter. Moreover, this representation yields more evident improvement in detection performance under low SCR scenarios.
For the D-P-GASF model, when the false alarm rate is 10−3, the inclusion of the amplitude sequence causes its detection probabilities to decrease from 0.723, 0.895, and 0.974 to 0.635, 0.886, and 0.939 for IPIX #30, #26, and #17, respectively. This result suggests a degree of information redundancy between the main diagonal of GASF and the amplitude sequence, thereby suppressing the detection performance of the D-P-A-GASF-based architecture. In contrast, for the D-P-GADF model, because the main diagonal of GADF achieves feature decoupling from the amplitude modality, although the addition of the amplitude sequence leads to a decrease in detection probability in the low-SCR IPIX #30 data, as the SCR increases, the amplitude modality provides effective complementary information. This results in a certain performance improvement for the D-P-A-GADF model compared to the D-P-GADF model in IPIX #26 and #17 data, albeit at the cost of additional computational complexity.
Therefore, the impact of incorporating the amplitude sequence into the proposed multimodal fusion architecture needs to be comprehensively considered in light of the SCR and the differences in GAF encoding method. Balancing detection performance and computational efficiency, this work selects the D-P-GASF/GADF model, which does not include the additional amplitude sequence, as the core architecture.
To ensure the statistical reliability of the observed performance variations, 5 independent training runs for 4 multimodal configurations using the IPIX#17 data were conducted. The statistical metrics, including mean detection probability (), standard deviation (Std), 95% confidence intervals (95% CI), are summarized in Table 8.
Table 8.
Statistical significance analysis based on 5 independent runs for IPIX #17. The observation time is 1.024 s and the false alarm rate is 10−3.
The p-values obtained from the Paired t-tests provide statistically empirical evidence regarding the inter-modal dynamics between the amplitude sequence and the GAF encodings. Specifically, the comparison between D-P-A-GADF and D-P-GADF yields a p-value of 2.99 × 10⁻⁴ (p < 0.01), suggesting that the performance improvement from incorporating the amplitude sequence into the decoupled GADF framework is statistically favorable. In contrast, the comparison between D-P-A-GASF and D-P-GASF yields a significantly low p-value of 4.80 × 10⁻⁸, which indicates that the performance degradation observed when adding amplitude to GASF is a consistent effect driven by inter-modal redundancy. Furthermore, the low p-values for the comparisons between the GADF-based and GASF-based configurations underscore that the impact of GAF encoding methods on the detection efficacy within the synergistic framework. These evaluations suggest that the performance trends identified in this study are aligned with the underlying synergistic representation logic. Overall, the t-test results support the observation that the proposed heterogeneous architecture effectively utilizes complementary features for maritime radar applications. the choice of GAF encoding method has a substantial impact on the final detection efficacy within the synergistic framework.
Finally, to evaluate the practical feasibility of the proposed synergistic representation for real-time applications, the computational complexity of the various multimodal fusion configurations discussed were analyzed. The parameters, GFLOPs, and single-sample inference time are summarized in Table 9.
Table 9.
Comparison of computational complexity of different multimodal fusion models.
The results presented in Table 9 suggest that the proposed D-P-GAF architecture achieves an improved balance between detection performance and computational efficiency. As indicated in Table 9, it requires 12.35 million parameters, which represents a notable reduction compared to the heavy A-D-TD model (59.98 million). This parameter efficiency is primarily due to the lightweight heterogeneous branches compared to the deeper backbones (such as ResNet50 as well as the large fully connected layers in T-LeNet) utilized in existing methods. Furthermore, a competitive inference time of 0.5985 ms is achieved on an NVIDIA RTX 4000 GPU. It is noteworthy that while the D-P-GAF model possesses fewer parameters than the P-C-TD and D-P-A-GAF configurations, their GFLOPs and inference times remain relatively comparable. This indicates that the cross-level integration effectively reduces structural redundancy while maintaining the necessary arithmetic operations to ensure high detection accuracy. Overall, the results suggest that the proposed framework provides a feasible alternative for practical implementation.
4.6. Comparative Analysis of Different Detection Methods
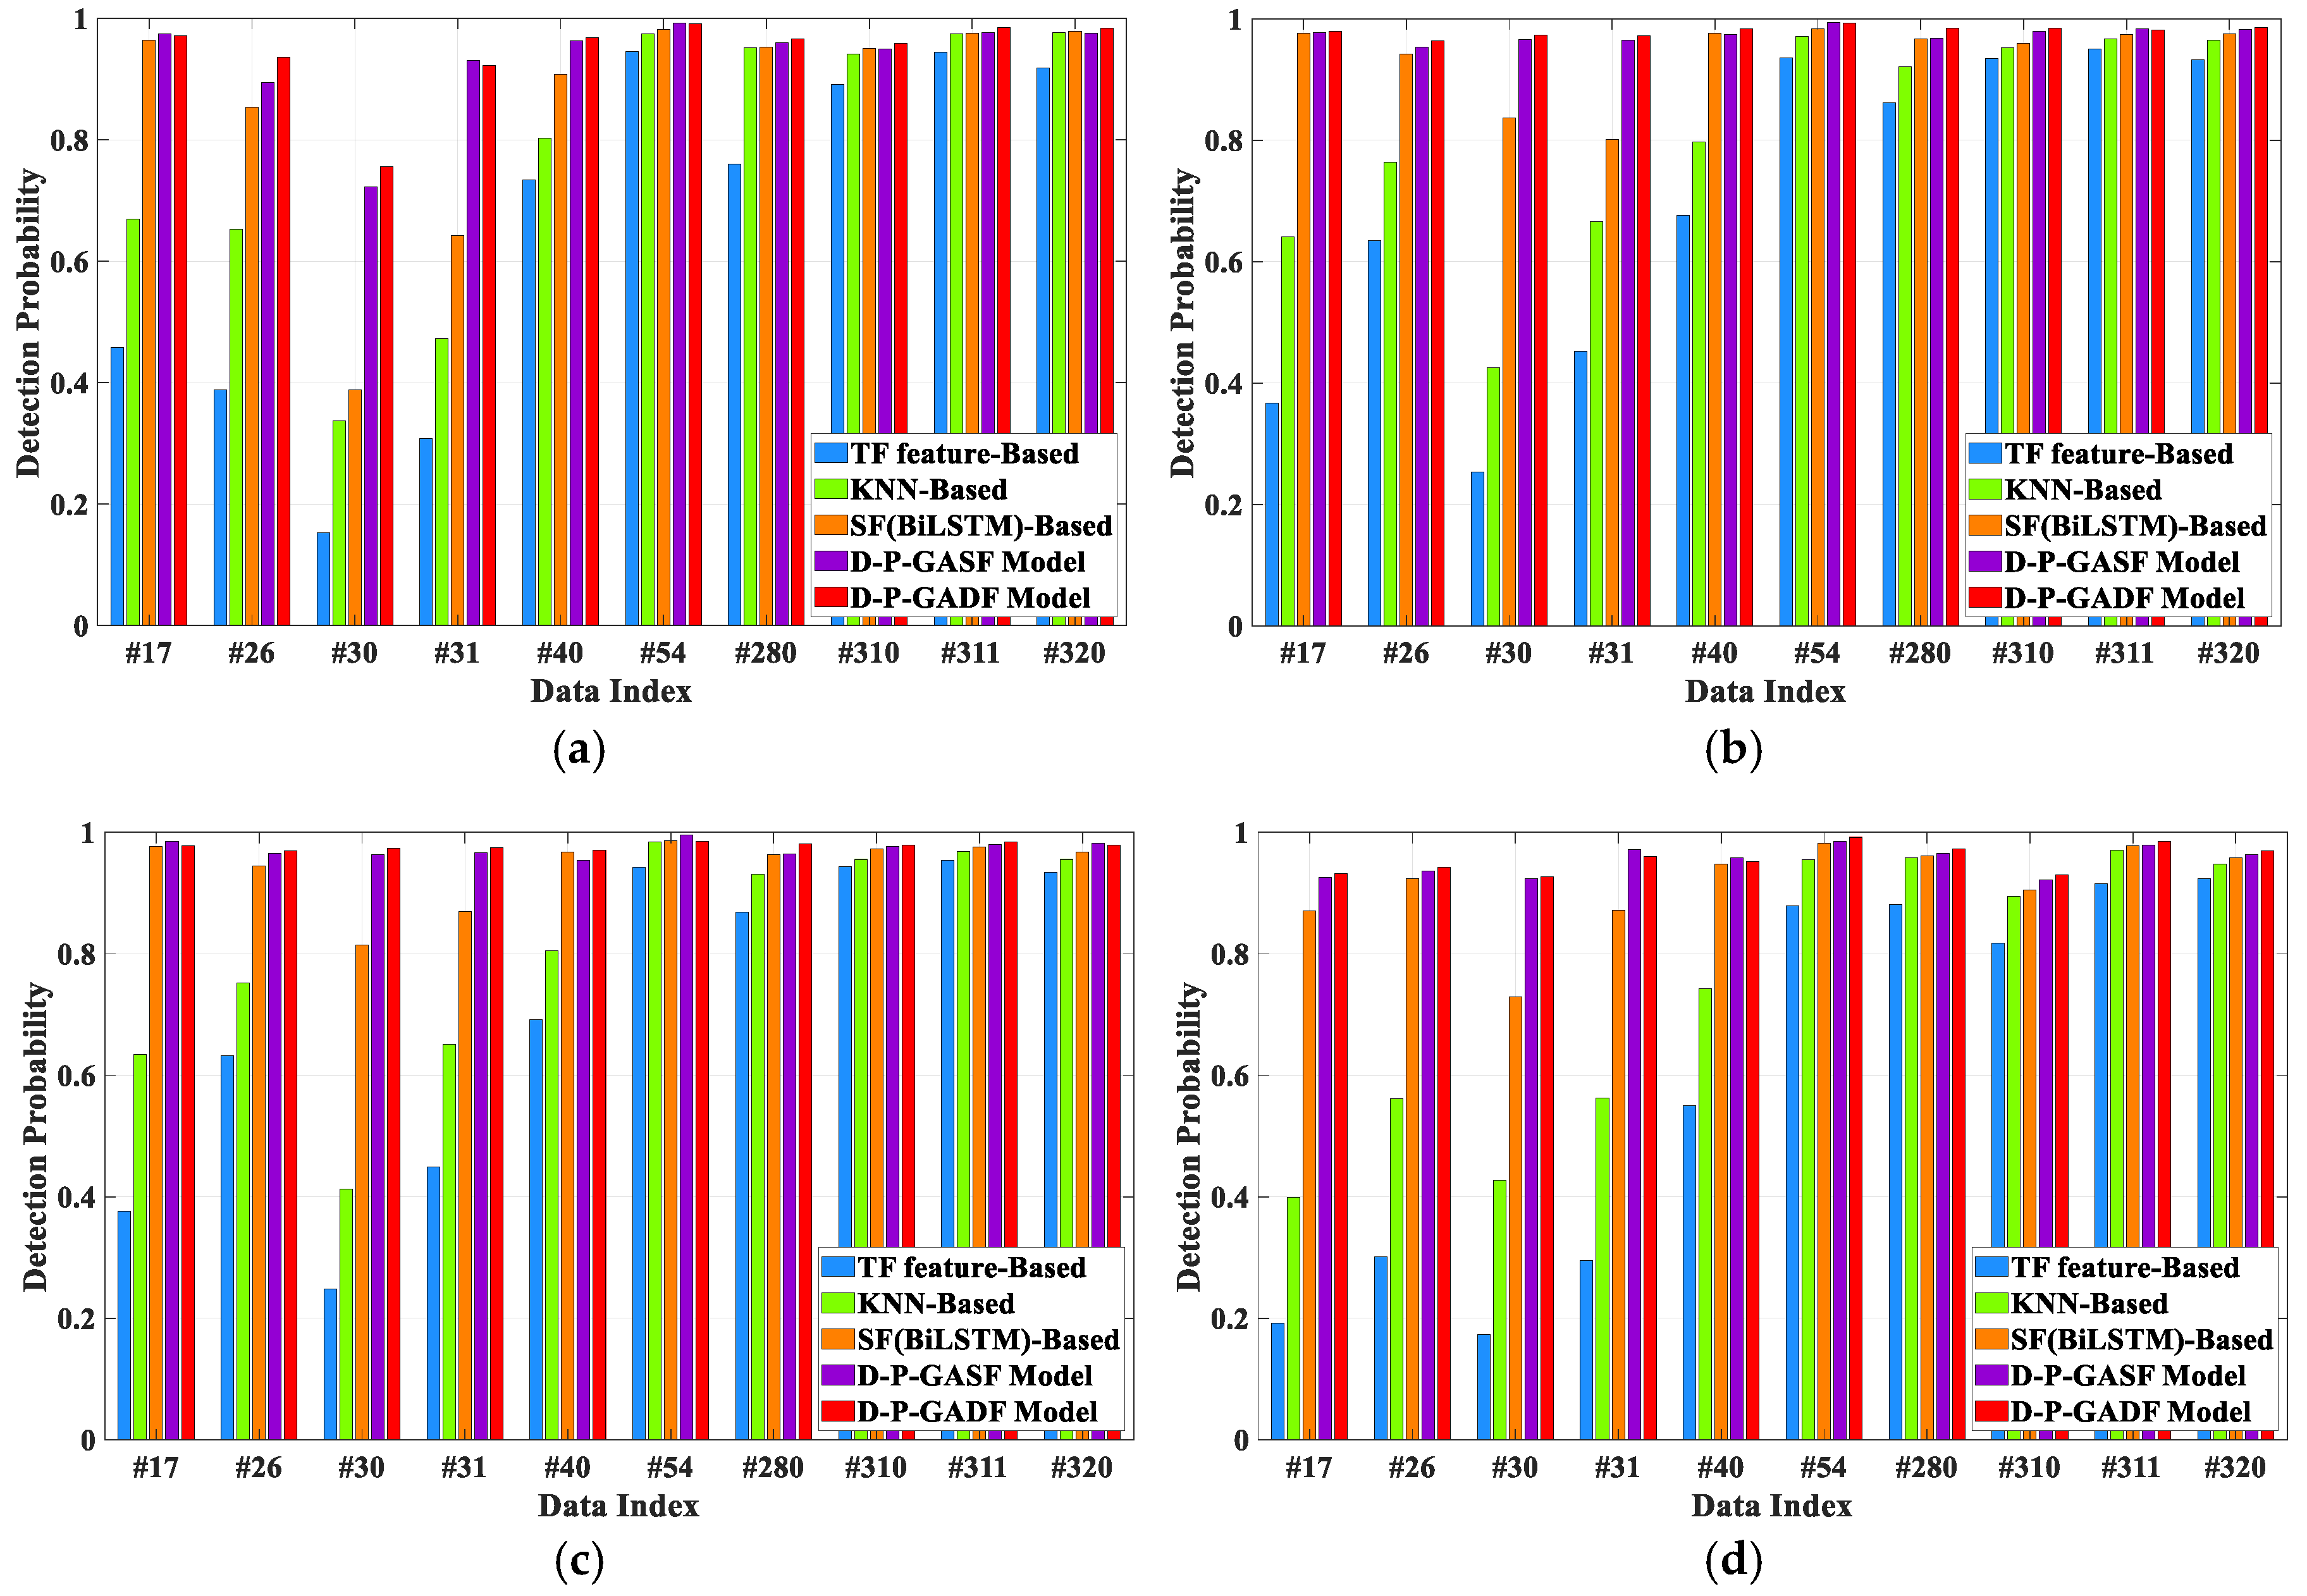
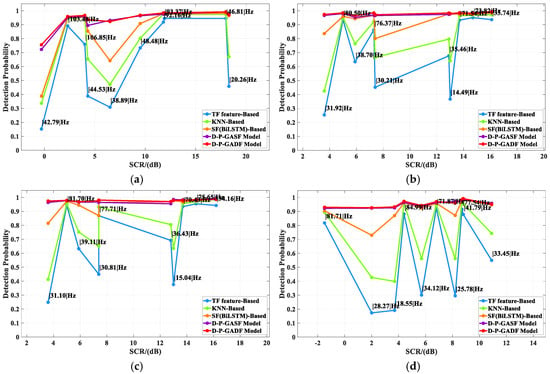
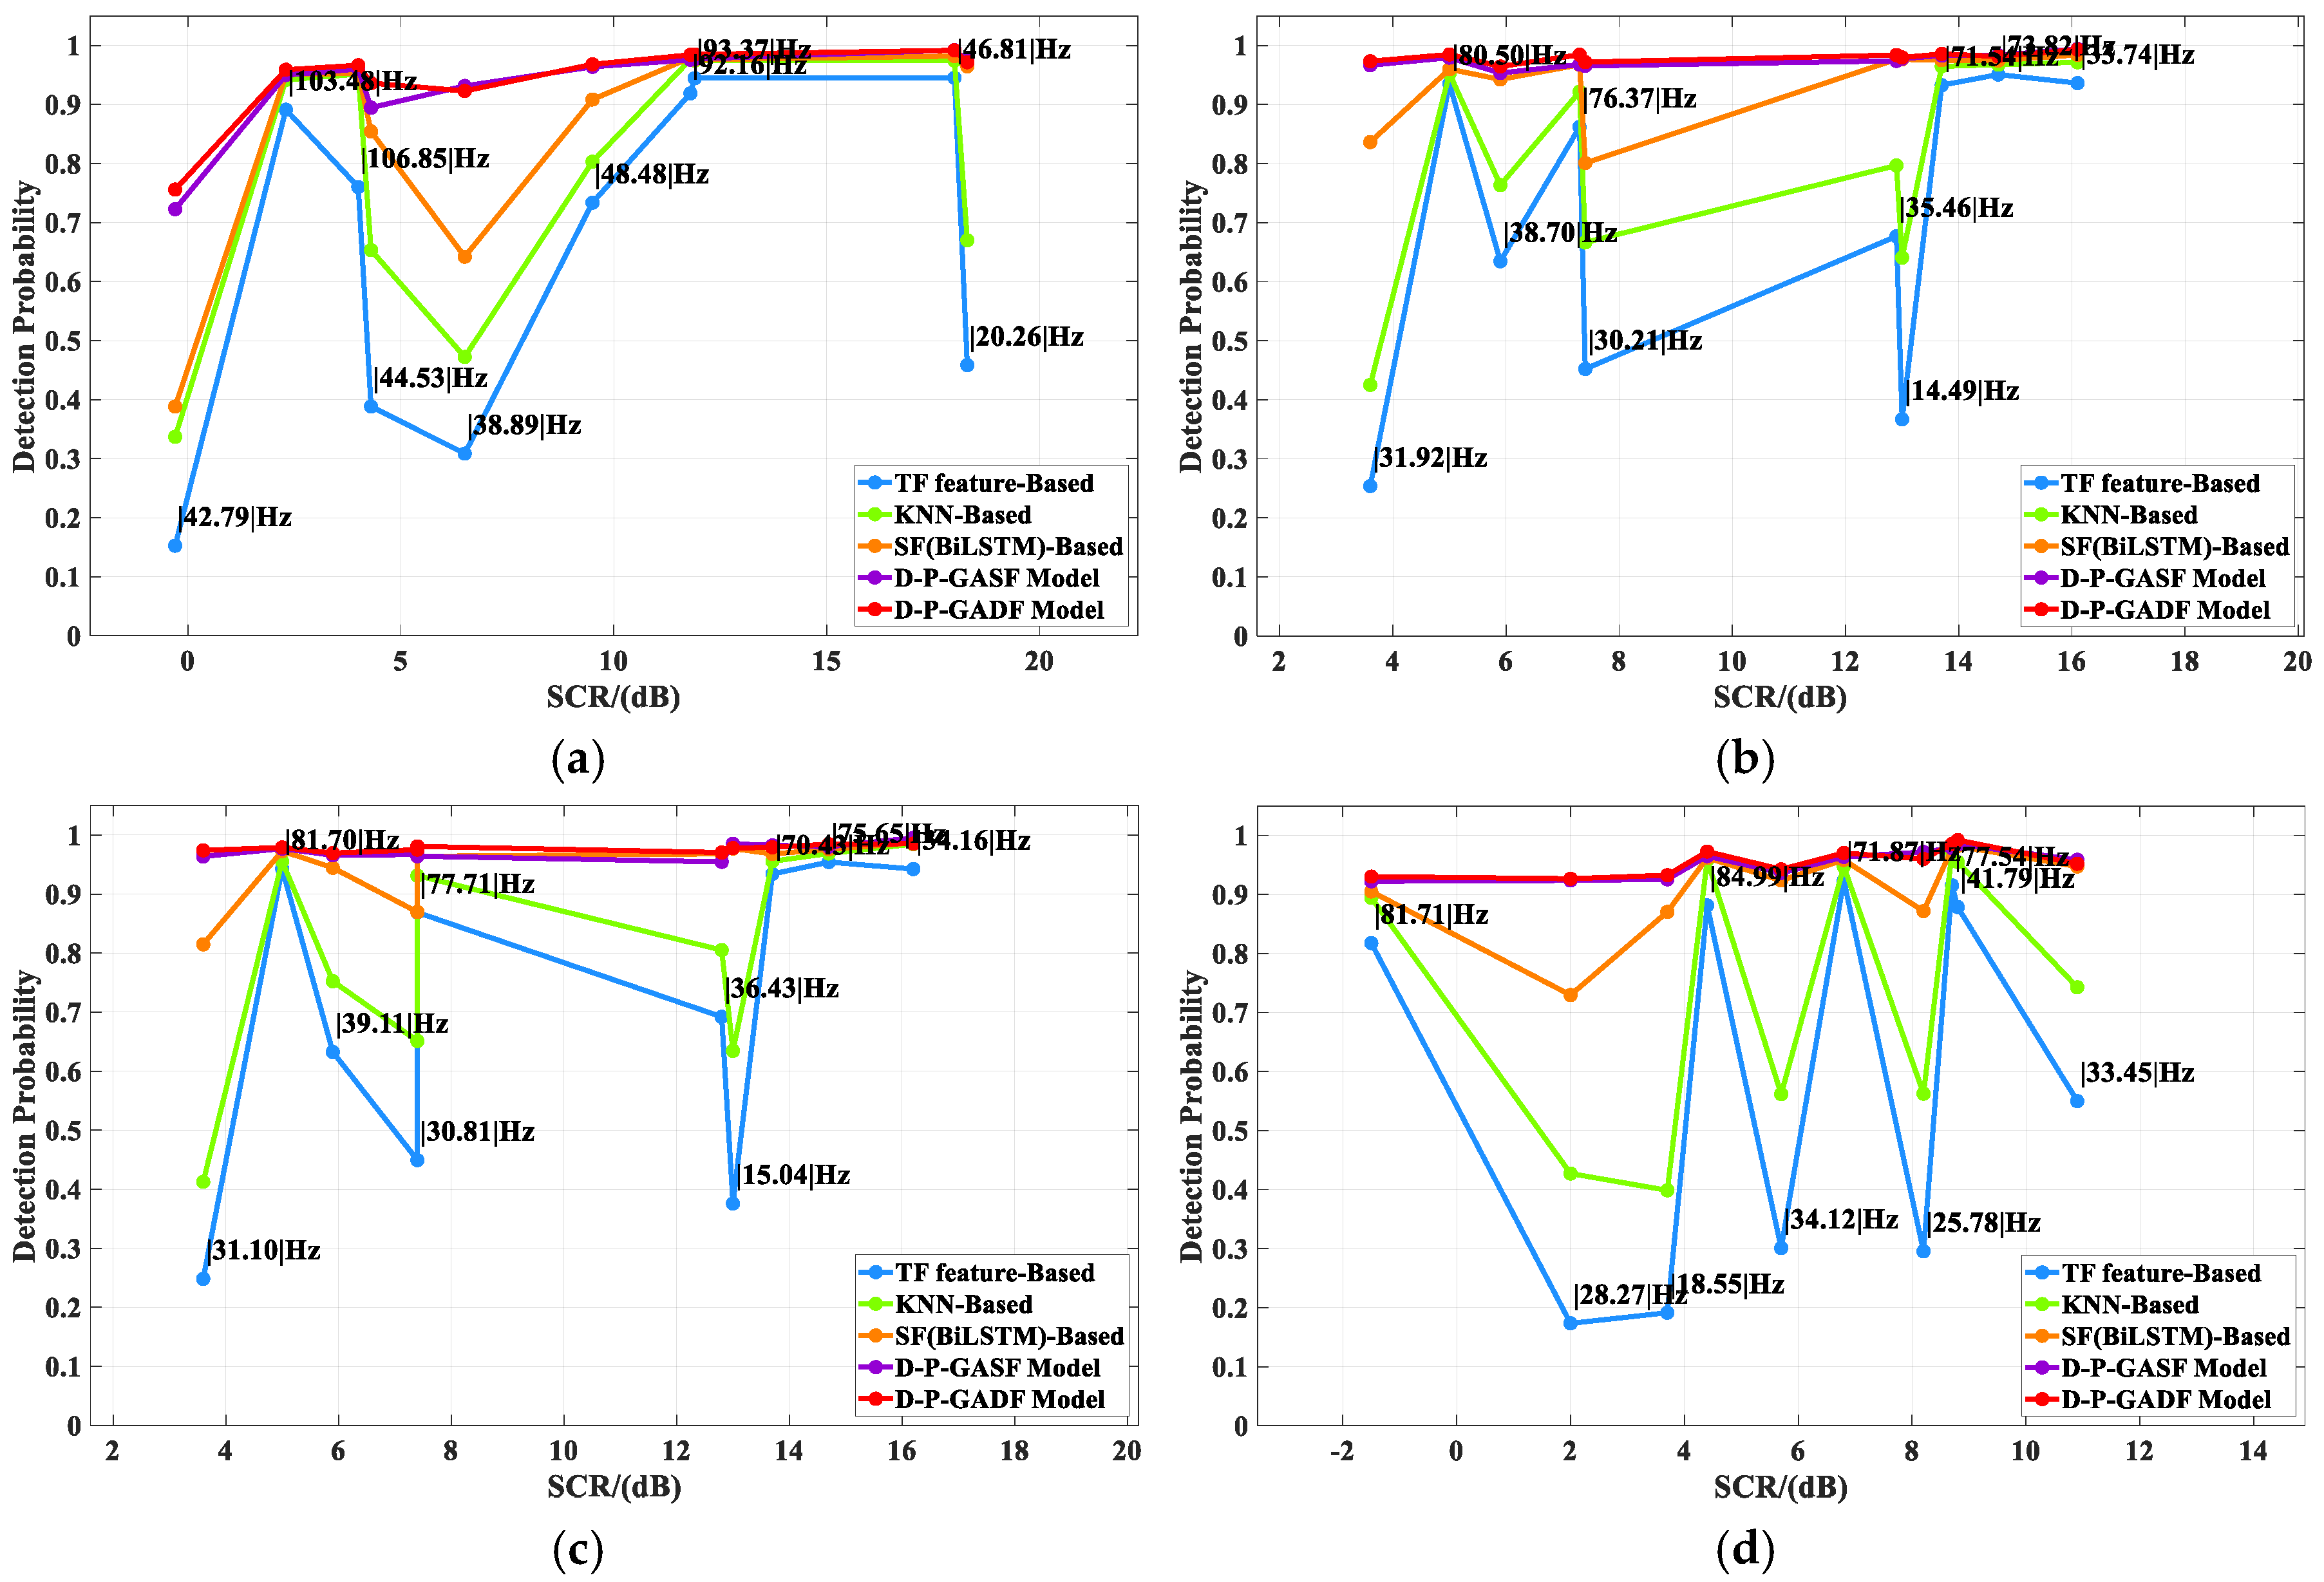
In this section, using 10 sets of IPIX data under four polarization modes, the proposed D-P-GASF and D-P-GADF models are compared in terms of performance with three existing detection methods. These include the TF feature-Based method [9], the KNN-Based method [15], and the SF(BiLSTM)-Based method [24]. The comparison is conducted across different polarization modes, sea states, and SCR conditions to evaluate the effectiveness of the proposed cross-level fusion architecture.
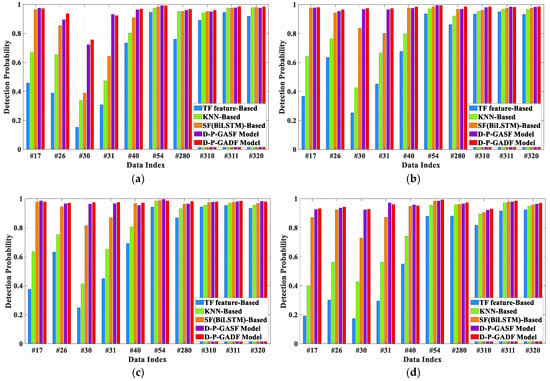
Figure 18 and Table 10 illustrate the detection results of the five compared methods. It can be observed from Figure 18 and Table 10 that the D-P-GASF and D-P-GADF models exhibit improved results under different polarizations, sea states, and SCRs. Their average detection probabilities are 0.965 and 0.959, respectively, which are notably higher than those of other compared methods. Furthermore, the standard deviation of 0.017 for the D-P-GADF model, combined with the narrow 95% confidence intervals, reinforces the stability and consistency of the synergistic cross-level representation across diverse maritime environments.
Figure 18.
Detection performance of different detection methods in IPIX dataset (The observation time is 1.024 s and the false alarm rate is 10−3): (a) HH; (b) HV; (c) VH; (d) VV.
Table 10.
Average detection probabilities of different detection methods across four polarization modes. The observation time is 1.024 s and the false alarm rate is 10−3.
To further investigate the performance variations across different scenarios, Figure 19 illustrates the detection probability as a function of SCR. As observed in Figure 19, detection probability is not strictly monotonic with SCR, particularly in low-SCR regions. This fluctuation can be explained by the absolute Doppler shift in the sea clutter, which is annotated for each scenario. When the target’s Doppler signature is sufficiently separated from the clutter (large Doppler shift), high detection accuracy is maintained even at low SCR. In contrast, even under relatively high SCR conditions, detection methods relying solely on frequency-domain information may still exhibit performance degradation if the absolute Doppler shift in the sea clutter is small.
Figure 19.
Cross-SCR detection performance of different detection methods in IPIX dataset (the observation time is 1.024 s and the false alarm rate is 10−3): (a) HH; (b) HV; (c) VH; (d) VV.
Among the compared models, the TF feature-based method exhibits the most limited performance, with the highest standard deviation (0.052), indicating a lack of stability across varying sea conditions. The KNN-based method, which integrates multi-dimensional domains, achieves an improved average detection probability and a lower standard deviation (0.031) than the TF-based method. This suggests that the inclusion of multi-domain features helps mitigate certain clutter fluctuations, making the KNN-based approach a more reliable method. Furthermore, the SF(BiLSTM)-Based method, which employs a data-driven approach for sequence-feature extraction, provides notable performance gains compared to these classical feature-based methods. However, its detection performance remains relatively low in certain low SCR scenarios. In contrast, the proposed cross-level multimodal fusion architecture effectively leverages radar echo features across multiple dimensions, thereby achieving the highest detection performance among the compared methods across all scenarios. These findings suggest that the synergistic relationship between physical kinematic attributes and structural patterns offers a more robust foundation for maritime surveillance.
5. Conclusions
To address the challenge of detecting weak targets in complex sea clutter environments, this work proposes a detection method based on a heterogeneous network architecture that performs cross-level multimodal fusion of radar echoes. By introducing GAF transformation, the echo amplitude sequence is converted into abstract structured images that reveal the dynamic evolution characteristics of echo energy. These images are then jointly represented with the Doppler spectrum and phase sequences, which reflect direct target motion characteristics. In terms of model design, a heterogeneous branch network is constructed using Transformer and ResNet18, and a self-attention mechanism is introduced to adaptively screen and integrate direct and abstract modal information. Evaluations based on the IPIX dataset indicate that the proposed synergistic representation remains stable across various SCRs and polarization modes, with the D-P-GADF model achieving an average detection probability of 0.965 and a standard deviation of 0.017. Although the individual technical components of this framework have been established, their domain-specific integration provides a robust approach for capturing the multifaceted characteristics of radar echoes in non-stationary marine environments to enhance feature discrimination capabilities.
In summary, the proposed architecture can effectively extract the multi-dimensional discriminative features of radar echoes, offering a viable framework for sea surface target detection with potential utility for practical engineering applications. However, certain limitations remain to be explored. The current study is primarily based on the IPIX database, and further verification using data from modern radar systems, involving moving targets and more complex sea states, will be conducted in the future to examine the model’s adaptability. Additionally, this work primarily utilizes GAF as a representative method for converting 1D sequences into 2D images. Future research will explore other 1D-to-2D transformation methods as comparative benchmarks to identify a more optimal representation modality. Finally, efforts will focus on model lightweighting to further improve detection efficiency for potential real-time applications.
Author Contributions
Conceptualization, J.W.; methodology, J.W.; software, J.W. and Y.W.; validation, Y.W., J.C. and Y.Z.; formal analysis, J.W. and Y.W.; investigation, J.W., Y.W., J.C. and Y.Z.; resources, Y.W. and Y.Z.; data curation, J.W.; writing—original draft preparation, J.W.; writing—review and editing, Y.W., J.C. and Y.Z. All authors have read and agreed to the published version of the manuscript.
Funding
This research was funded by the National Natural Science Foundation of China under Grants No. 42376176 and 62571504.
Data Availability Statement
The IPIX (Ice Multiparameter Imaging X-Band Radar) dataset used in this article can be obtained from the following website: http://soma.ece.mcmaster.ca/ipix/index.html (accessed on 1 December 2020).
Acknowledgments
The authors are grateful for the support of the funding projects listed in the Funding section. The authors also wish to thank the anonymous reviewers for their insightful comments and constructive suggestions that helped improve the quality of this manuscript.
Conflicts of Interest
The authors declare no conflicts of interest.
References
- Conte, E.; De Maio, A.; Galdi, C. Statistical Analysis of Real Clutter at Different Range Resolutions. IEEE Trans. Aerosp. Electron. Syst. 2004, 40, 903–918. [Google Scholar] [CrossRef] [Scilit]
- Chen, X.; Guan, J.; Liu, N.; Zhou, W.; He, Y. Detection of a Low Observable Sea-Surface Target with Micromotion via the Radon-Linear Canonical Transform. IEEE Geosci. Remote Sens. Lett. 2014, 11, 1225–1229. [Google Scholar] [CrossRef] [Scilit]
- Corretja, V.; Meslot, V.; Kemkemian, S.; Montigny, R. Statistical Analysis on Sea Clutter Doppler Properties in X-Band for Low Grazing Angles. In Proceedings of the 2017 IEEE Radar Conference (RadarConf), Seattle, WA, USA, 8–12 May 2017; pp. 1046–1051. [Google Scholar]
- Lo, T.; Leung, H.; Litva, J.; Haykin, S. Fractal Characterisation of Sea-Scattered Signals and Detection of Sea-Surface Targets. IEE Proc. F Radar Signal Process. 1993, 140, 243–250. [Google Scholar] [CrossRef] [Scilit]
- Hu, J.; Tung, W.-W.; Gao, J. Detection of Low Observable Targets within Sea Clutter by Structure Function Based Multifractal Analysis. IEEE Trans. Antennas Propag. 2006, 54, 136–143. [Google Scholar] [CrossRef] [Scilit]
- Xu, X.-K. Low Observable Targets Detection by Joint Fractal Properties of Sea Clutter: An Experimental Study of IPIX OHGR Datasets. IEEE Trans. Antennas Propag. 2010, 58, 1425–1429. [Google Scholar] [CrossRef] [Scilit]
- Guan, J.; Liu, N.-B.; Huang, Y.; He, Y. Fractal Characteristic in Frequency Domain for Target Detection within Sea Clutter. IET Radar Sonar Navig. 2012, 6, 293–306. [Google Scholar] [CrossRef] [Scilit]
- Shui, P.-L.; Li, D.-C.; Xu, S.-W. Tri-Feature-Based Detection of Floating Small Targets in Sea Clutter. IEEE Trans. Aerosp. Electron. Syst. 2014, 50, 1416–1430. [Google Scholar] [CrossRef] [Scilit]
- Shi, S.-N.; Shui, P.-L. Sea-Surface Floating Small Target Detection by One-Class Classifier in Time-Frequency Feature Space. IEEE Trans. Geosci. Remote Sens. 2018, 56, 6395–6411. [Google Scholar] [CrossRef] [Scilit]
- Xu, S.; Zheng, J.; Pu, J.; Shui, P. Sea-Surface Floating Small Target Detection Based on Polarization Features. IEEE Geosci. Remote Sens. Lett. 2018, 15, 1505–1509. [Google Scholar] [CrossRef] [Scilit]
- Xie, J.; Xu, X. Phase-Feature-Based Detection of Small Targets in Sea Clutter. IEEE Geosci. Remote Sens. Lett. 2022, 19, 3507405. [Google Scholar] [CrossRef] [Scilit]
- Khosravani, H.R.; Ruano, A.E.; Ferreira, P.M. A Convex Hull-Based Data Selection Method for Data Driven Models. Appl. Soft Comput. 2016, 47, 515–533. [Google Scholar] [CrossRef] [Scilit]
- Li, Y.; Xie, P.; Tang, Z.; Jiang, T.; Qi, P. SVM-Based Sea-Surface Small Target Detection: A False-Alarm-Rate-Controllable Approach. IEEE Geosci. Remote Sens. Lett. 2019, 16, 1225–1229. [Google Scholar] [CrossRef] [Scilit]
- Zhou, H.; Jiang, T. Decision Tree Based Sea-Surface Weak Target Detection with False Alarm Rate Controllable. IEEE Signal Process. Lett. 2019, 26, 793–797. [Google Scholar] [CrossRef] [Scilit]
- Guo, Z.; Shui, P.; Bai, X.; Xu, S.; Li, D. Sea-Surface Small Target Detection Based on K-NN with Controlled False Alarm Rate in Sea Clutter. J. Radars 2020, 9, 654–663. [Google Scholar] [CrossRef]
- Jiang, W.; Ren, Y.; Liu, Y.; Leng, J. Artificial Neural Networks and Deep Learning Techniques Applied to Radar Target Detection: A Review. Electronics 2022, 11, 156. [Google Scholar] [CrossRef] [Scilit]
- Mou, X.; Chen, X.; Su, N.; Guan, J. Motion Classification for Radar Moving Target via STFT and Convolution Neural Network. J. Eng. 2019, 2019, 6287–6290. [Google Scholar] [CrossRef] [Scilit]
- Lecun, Y.; Bottou, L.; Bengio, Y.; Haffner, P. Gradient-Based Learning Applied to Document Recognition. Proc. IEEE 1998, 86, 2278–2324. [Google Scholar] [CrossRef] [Scilit]
- Tian, S.; Wang, W.; Ding, G.; Zhang, Z. Target Detection in Sea Clutter with Transformer Neural Network. In Proceedings of the 2021 CIE International Conference on Radar (Radar), Haikou, China, 15–19 December 2021; pp. 1436–1440. [Google Scholar]
- Vaswani, A.; Shazeer, N.; Parmar, N.; Uszkoreit, J.; Jones, L.; Gomez, A.N.; Kaiser, Ł.; Polosukhin, I. Attention Is All You Need. In Advances in Neural Information Processing Systems; Guyon, I., Luxburg, U.V., Bengio, S., Wallach, H., Fergus, R., Vishwanathan, S., Garnett, R., Eds.; Curran Associates, Inc.: New York, NY, USA, 2017; Volume 30. [Google Scholar]
- Xi, C.; Liu, R. Detection of Small Floating Target on Sea Surface Based on Gramian Angular Field and Improved EfficientNet. Remote Sens. 2022, 14, 4364. [Google Scholar] [CrossRef] [Scilit]
- Wang, Z.; Oates, T. Imaging Time-Series to Improve Classification and Imputation. arXiv 2015, arXiv:1506.00327. [Google Scholar] [CrossRef] [Scilit]
- Tan, M.; Le, Q. EfficientNet: Rethinking Model Scaling for Convolutional Neural Networks. In Proceedings of the 36th International Conference on Machine Learning; Chaudhuri, K., Salakhutdinov, R., Eds.; PMLR: Cambridge, MA, USA, 2019; Volume 97, pp. 6105–6114. [Google Scholar]
- Wan, H.; Tian, X.; Liang, J.; Shen, X. Sequence-Feature Detection of Small Targets in Sea Clutter Based on Bi-LSTM. IEEE Trans. Geosci. Remote Sens. 2022, 60, 4208811. [Google Scholar] [CrossRef] [Scilit]
- Huang, Z.; Xu, W.; Yu, K. Bidirectional LSTM-CRF Models for Sequence Tagging. arXiv 2015, arXiv:1508.01991. [Google Scholar] [CrossRef] [Scilit]
- Wu, H.; Xing, H.; Li, M.; Hang, C. Multi-Modal Time-Frequency Image Fusion for Weak Target Detection on Sea Surface. J. Mar. Sci. Eng. 2025, 13, 1625. [Google Scholar] [CrossRef] [Scilit]
- Chen, X.; Su, N.; Huang, Y.; Guan, J. False-Alarm-Controllable Radar Detection for Marine Target Based on Multi Features Fusion via CNNs. IEEE Sens. J. 2021, 21, 9099–9111. [Google Scholar] [CrossRef] [Scilit]
- Duan, G.; Wang, Y.; Zhang, Y.; Wu, S.; Lv, L. A Network Model for Detecting Marine Floating Weak Targets Based on Multimodal Data Fusion of Radar Echoes. Sensors 2022, 22, 9163. [Google Scholar] [CrossRef] [Scilit] [PubMed]
- Wang, K.; Wang, Z. A Triple-Channel Network for Maritime Radar Targets Detection Based on Multi-Modal Features. Remote Sens. 2024, 16, 4662. [Google Scholar] [CrossRef] [Scilit]
- Hu, J.; Shen, L.; Sun, G. Squeeze-and-Excitation Networks. In Proceedings of the IEEE Conference on Computer Vision and Pattern Recognition; IEEE: New York, NY, USA, 2018; pp. 7132–7141. [Google Scholar]
- Marwan, N.; Romano, M.C.; Thiel, M.; Kurths, J. Recurrence Plots for the Analysis of Complex Systems. Phys. Rep. 2007, 438, 237–329. [Google Scholar] [CrossRef] [Scilit]
- Campanharo, A.S.; Sirer, M.I.; Malmgren, R.D.; Ramos, F.M.; Amaral, L.A.N. Duality between Time Series and Networks. PLoS ONE 2011, 6, e23378. [Google Scholar] [CrossRef] [Scilit]
- He, K.; Zhang, X.; Ren, S.; Sun, J. Deep Residual Learning for Image Recognition. In Proceedings of the 2016 IEEE Conference on Computer Vision and Pattern Recognition (CVPR), Las Vegas, NV, USA, 27–30 June 2016; pp. 770–778. [Google Scholar]
- Dosovitskiy, A. An Image Is Worth 16x16 Words: Transformers for Image Recognition at Scale. arXiv 2020, arXiv:2010.11929. [Google Scholar]
- Hochreiter, S.; Schmidhuber, J. Long Short-Term Memory. Neural Comput. 1997, 9, 1735–1780. [Google Scholar] [CrossRef] [Scilit]
- Krizhevsky, A.; Sutskever, I.; Hinton, G.E. ImageNet Classification with Deep Convolutional Neural Networks. Commun. ACM 2017, 60, 84–90. [Google Scholar] [CrossRef] [Scilit]

Disclaimer/Publisher’s Note: The statements, opinions and data contained in all publications are solely those of the individual author(s) and contributor(s) and not of MDPI and/or the editor(s). MDPI and/or the editor(s) disclaim responsibility for any injury to people or property resulting from any ideas, methods, instructions or products referred to in the content. |
© 2026 by the authors. Licensee MDPI, Basel, Switzerland. This article is an open access article distributed under the terms and conditions of the Creative Commons Attribution (CC BY) license.