


Abstract
Decarbonizing ocean-going shipping requires decision-grade environmental evidence for propulsion transitions, yet conventional LCA relies on static inventories that inadequately represent dynamic operations and route-dependent renewable generation. This study evaluates well-to-wake (WtW) Global Warming Potential (GWP) for two large container ships operated by a Korean company under four scenarios: conventional diesel main engine, diesel–electric with onboard generator, full battery-electric supplied by shore electricity from the Republic of Korea grid, and battery-electric with a route-resolved solar PV system. A Live-LCA (LLCA) framework couples LCI data with MATLAB/Simulink power and propulsion modeling driven by actual operating profiles and route environmental conditions to generate operational inventories for impact calculation. Diesel–electric operation increases annual WtW GWP by over 26% for both ships versus the baseline of a conventional diesel main engine, whereas shore-electric battery operation is able to reduce WtW GWP by around 40% versus diesel–electric. With limited PV installation, additional reductions are marginal. Depending on electricity profile, it can increase battery-electric GHG emissions by approximately 27%, highlighting sensitivity to electricity evolution. Overall, electric propulsion delivers climate benefits only when paired with low-carbon electricity, and LLCA enables operationally and route-grounded LCA for large container ships.
1. Introduction
1.1. Background
International shipping underpins global trade and economic activity, yet it remains a hard-to-abate sector due to its continued dependence on fossil-derived marine fuels and long asset lifetimes. Recent evidence indicates that the sector’s climate relevance is non-trivial: the Fourth IMO Greenhouse Gas Study 2020 reports that absolute greenhouse gas (GHG) emissions from international shipping increased from 977 Mt in 2012 to 1076 Mt in 2018, and that shipping’s share of global anthropogenic emissions rose from 2.76% to 2.89% during the same time [1].
Beyond GHG emissions, ships contribute substantially to local and regional air pollution through emissions of sulfur oxides (SOx), nitrogen oxides (NOx), and particulate matter (PM), with particularly acute impacts in and around port cities where berthing and maneuvering operations concentrate emissions and exposure. In response to these environmental externalities, the regulatory landscape has tightened in parallel across air-quality and climate domains. For air pollutants, the IMO has implemented increasingly stringent requirements under MARPOL Annex VI, including the global fuel oil sulfur limit of 0.50% (m/m) that took effect in 2020, reinforced by the carriage ban on non-compliant fuel oil for use onboard ships [2]. The establishment and expansion of Emission Control Areas (ECAs) further illustrates the direction of travel toward tighter SOx/PM and NOx controls in designated regions [3].
Climate regulation has progressed from information disclosure to performance standards and, increasingly, market-based measures. At the global level, IMO’s short-term GHG reduction measures—adopted as amendments to MARPOL Annex VI—introduced combined technical and operational requirements, notably the Energy Efficiency Existing Ship Index (EEXI) and the Carbon Intensity Indicator (CII) rating scheme, which entered into force in 2023 [4]. Complementing these requirements, the IMO Data Collection System (DCS) mandates the recording and reporting of fuel oil consumption to support evidence-based policy development and performance monitoring [5].
Strategic ambition has also strengthened. The 2023 IMO Strategy on Reduction of GHG Emissions from Ships sets an overarching direction toward net-zero GHG emissions from international shipping by or around 2050, while articulating interim checkpoints, including at least a 40% reduction in carbon intensity by 2030 (as an average across international shipping) and an enhanced emphasis on the uptake of zero- or near-zero-GHG-emission technologies, fuels, and/or energy sources—targeting at least 5%, and striving for 10%, of energy use by 2030 [6]. These targets signal that incremental operational optimization alone is unlikely to be sufficient, and that deep decarbonization will require structural changes in onboard energy systems and fuel/energy supply chains.
In parallel, regional regulation has accelerated with direct implications for vessel operators calling at major markets. Within the European Union, the MRV framework has provided a foundation for transparent emissions accounting [7], and has been amended to align with the expansion of climate policy scope to additional gases and ship types [8]. The EU Emissions Trading System (EU ETS) has been extended to include maritime transport, introducing carbon pricing signals to shipping companies for covered voyages and emissions [9]. The policy is accompanied by a phase-in schedule for surrender obligations—40% of reported emissions for 2024 (surrender in 2025), 70% for 2025 (surrender in 2026), and 100% from 2026 onward [10]. Moreover, FuelEU Maritime establishes a well-to-wake (WtW) GHG intensity reduction pathway for energy used onboard ships calling at EU ports, thereby explicitly incentivizing fuel/energy shifts rather than solely tank-to-wake improvements [11].
This evolving policy architecture—combining pollutant limits, efficiency requirements, carbon intensity ratings, emissions transparency, carbon pricing, and WtW fuel standards—has elevated the strategic importance of fuel/energy transition in shipping. However, selecting an alternative energy pathway requires careful attention to life cycle impacts to avoid burden shifting across stages (fuel production, transport, conversion, and end use) and categories (climate change versus other environmental indicators). The recent LCA literature emphasizes that the environmental performance of maritime decarbonization options is highly sensitive to upstream electricity and fuel production characteristics, methodological choices, and system boundaries [12,13]. This sensitivity is particularly relevant for energy import-dependent economies, where supply chain emissions and maritime transport of energy commodities can materially affect default WtW values; for example, Ha et al. [14] highlight the need to explicitly account for international logistics and regional supply chains when developing life cycle GHG emission factors for marine fuels in the Republic of Korea context.
Among candidate transition pathways, electrification—via electricity as an energy carrier and electric propulsion as a conversion architecture—has emerged as a high-potential option, particularly for short-sea shipping, ferries, harbor craft, and other duty cycles characterized by predictable routes and frequent port calls. Electric propulsion systems can eliminate onboard exhaust emissions during electric operation, offering immediate local air-quality benefits in ports and coastal communities, and can reduce noise and vibration while improving energy conversion efficiency relative to conventional mechanical drivetrains. Shore power (alternative maritime power supply) further extends electrification benefits by enabling ships to meet hotel loads at berth without running auxiliary engines; the academic literature increasingly recognizes shore power as a pivotal measure for port-side emissions reduction, while also noting persistent adoption constraints that require integrated stakeholder solutions [15].
Nonetheless, electrification is not inherently “zero-impact”; its net climate benefit depends on the carbon intensity of electricity generation, charging strategies, battery manufacturing and replacement cycles, and the counterfactual fuel and engine technologies displaced. Empirical and modeling studies illustrate both the promise and the conditionality of electric and hybrid-electric marine systems. For instance, Jeong et al. [16] applied a life cycle framework to an electric propulsion ship concept and demonstrated that life cycle outcomes depend strongly on the electricity supply profile and operational assumptions. Similarly, Kim et al. [17] reported that hybrid-electric propulsion can reduce emissions, but the magnitude and direction of life cycle benefits can vary by national power generation mix—underscoring the need for context-specific assessment. At fleet scale, Moon et al. [18] showed that retrofitting domestic vessels to battery-electric configurations can deliver substantial GHG reductions when paired with a deeply decarbonized grid, thereby positioning retrofits as a potentially high-leverage, near- to mid-term pathway.
These findings motivate a focused evaluation of electric propulsion as a decarbonization route for existing ships, particularly under real-world constraints where retrofitting may be more rapidly deployable than full fleet replacement. In the Republic of Korea, the policy context for decarbonization is tightening in parallel with international market pressures: Korea has committed to reducing national GHG emissions by 40% by 2030 compared to 2018 levels [19], while maritime decarbonization is increasingly shaped by global IMO targets and region-specific measures affecting Korean-operated fleets in international trades.
Against this background, the present study investigates the environmental implications of transitioning a fossil-fueled ship operated by a company in the Republic of Korea to an electric propulsion configuration, with explicit attention to life cycle system boundaries and the conditions under which electrification provides net environmental benefits. By centering electricity-based propulsion, this research aims to clarify the potential environmental contribution of electric-propulsion ships toward net-zero shipping trajectories, while acknowledging the critical role of upstream electricity decarbonization and technology supply chains in determining overall outcomes.
1.2. Literature Review
Despite the accelerating interest in net-zero shipping pathways, the life cycle evidence base that supports technology-selection decisions for electrifying existing vessels remains fragmented and, in several respects, insufficiently decision-relevant. Recent reviews of maritime-fuel LCAs emphasize that the literature still suffers from limited transparency in key assumptions, incomplete life cycle inventories, and sparse uncertainty treatment, which collectively restrict comparability across studies and hinder robust interpretation for forward-looking transitions [13].
The environmental performance of battery-electric or grid-charged propulsion is inherently coupled to the carbon intensity of electricity, yet many published studies continue to operationalize electricity as a static average (single-year factors or broad regional proxies) even when conclusions are known to be highly electricity-sensitive [20]. This simplification is particularly consequential for the Republic of Korea, where national generation statistics and policy trajectories indicate both a comparatively carbon-intensive baseline and a non-trivial pace of structural change in the power sector [21]. Scenario-based analyses further suggest that materially different Korean decarbonization portfolios can produce divergent future system outcomes, implying that a single fixed grid factor is unlikely to be adequate for evaluating electrification options over a ship’s operational horizon [22]. Consequently, Korea-specific and time-evolving electricity mix coupling within ship electrification LCA remains underdeveloped relative to its importance for well-to-wake conclusions.
In parallel, while the prospects of battery-electric propulsion have been investigated for container shipping in terms of feasibility envelopes and the influence of battery techno-economics [23,24], these contributions do not fully resolve the environmental question of converting large merchant ships under retrofit constraints. Moreover, operational-profile research demonstrates that “representative” cycles derived from real fleet data (e.g., noon reports) can differ substantially from idealized duty cycles and offer more-defensible benchmarks for international-shipping performance assessment [25]. Nevertheless, peer-reviewed LCA evidence quantifying the net environmental advantages of retrofit-oriented electric-propulsion transitions for large merchant ships—when anchored to measured operating profiles and real routes rather than stylized assumptions—remains limited.
Furthermore, route- and schedule-dependence have been explicitly recognized as governing factors for shipboard PV yield and for the associated environmental performance [26]. While case studies have evaluated PV systems for specific ship types and voyages and reported measurable emission reduction potential [27], the dominant evidence base remains concentrated on short-sea or selected routes and does not yet provide a robust life cycle understanding of PV as an additive measure for large merchant ships operating along actual long-distance routes [28]. Thus, the incremental carbon-reduction contribution of PV—when combined with electric-propulsion retrofits and evaluated under route-specific irradiance and operational constraints—remains insufficiently characterized.
In terms of LCA methodology, a cross-cutting methodological limitation is that many shipping LCAs remain essentially static, often applying fixed-background datasets and historical averages that do not reflect time-varying electricity intensity, evolving supply chains, or operational variability. Methodological LCA research has long documented that temporal issues can materially influence LCA outcomes and that temporally differentiated inventories and time-dependent characterization can improve accuracy [29]. In the maritime domain, emerging approaches point toward data-augmented assessments—integrating operational data streams and adaptive modeling—such as digital-twin-enabled real-time life cycle analysis frameworks [30], and methods that explicitly link ship performance prediction with actual operating conditions in LCA applications [31,32]. However, these time- and data-explicit concepts have not yet been widely operationalized for the specific decision context of retrofitting large merchant ships to electric propulsion under a nationally transitioning electricity system.
In response to these gaps, the present study advances a case study-driven framework for the Republic of Korea that couples (i) Korea-specific electricity mix trajectories, (ii) real operating profiles and route information of a large merchant ship operated by a Korean company, and (iii) PV supplementation scenarios evaluated under route-resolved conditions, thereby quantifying the net carbon-mitigation potential of electric-propulsion retrofit pathways toward net-zero shipping.
2. Methodology
2.1. Overview of the Methodological Approach
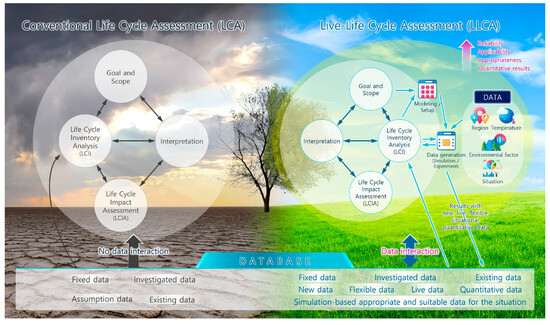
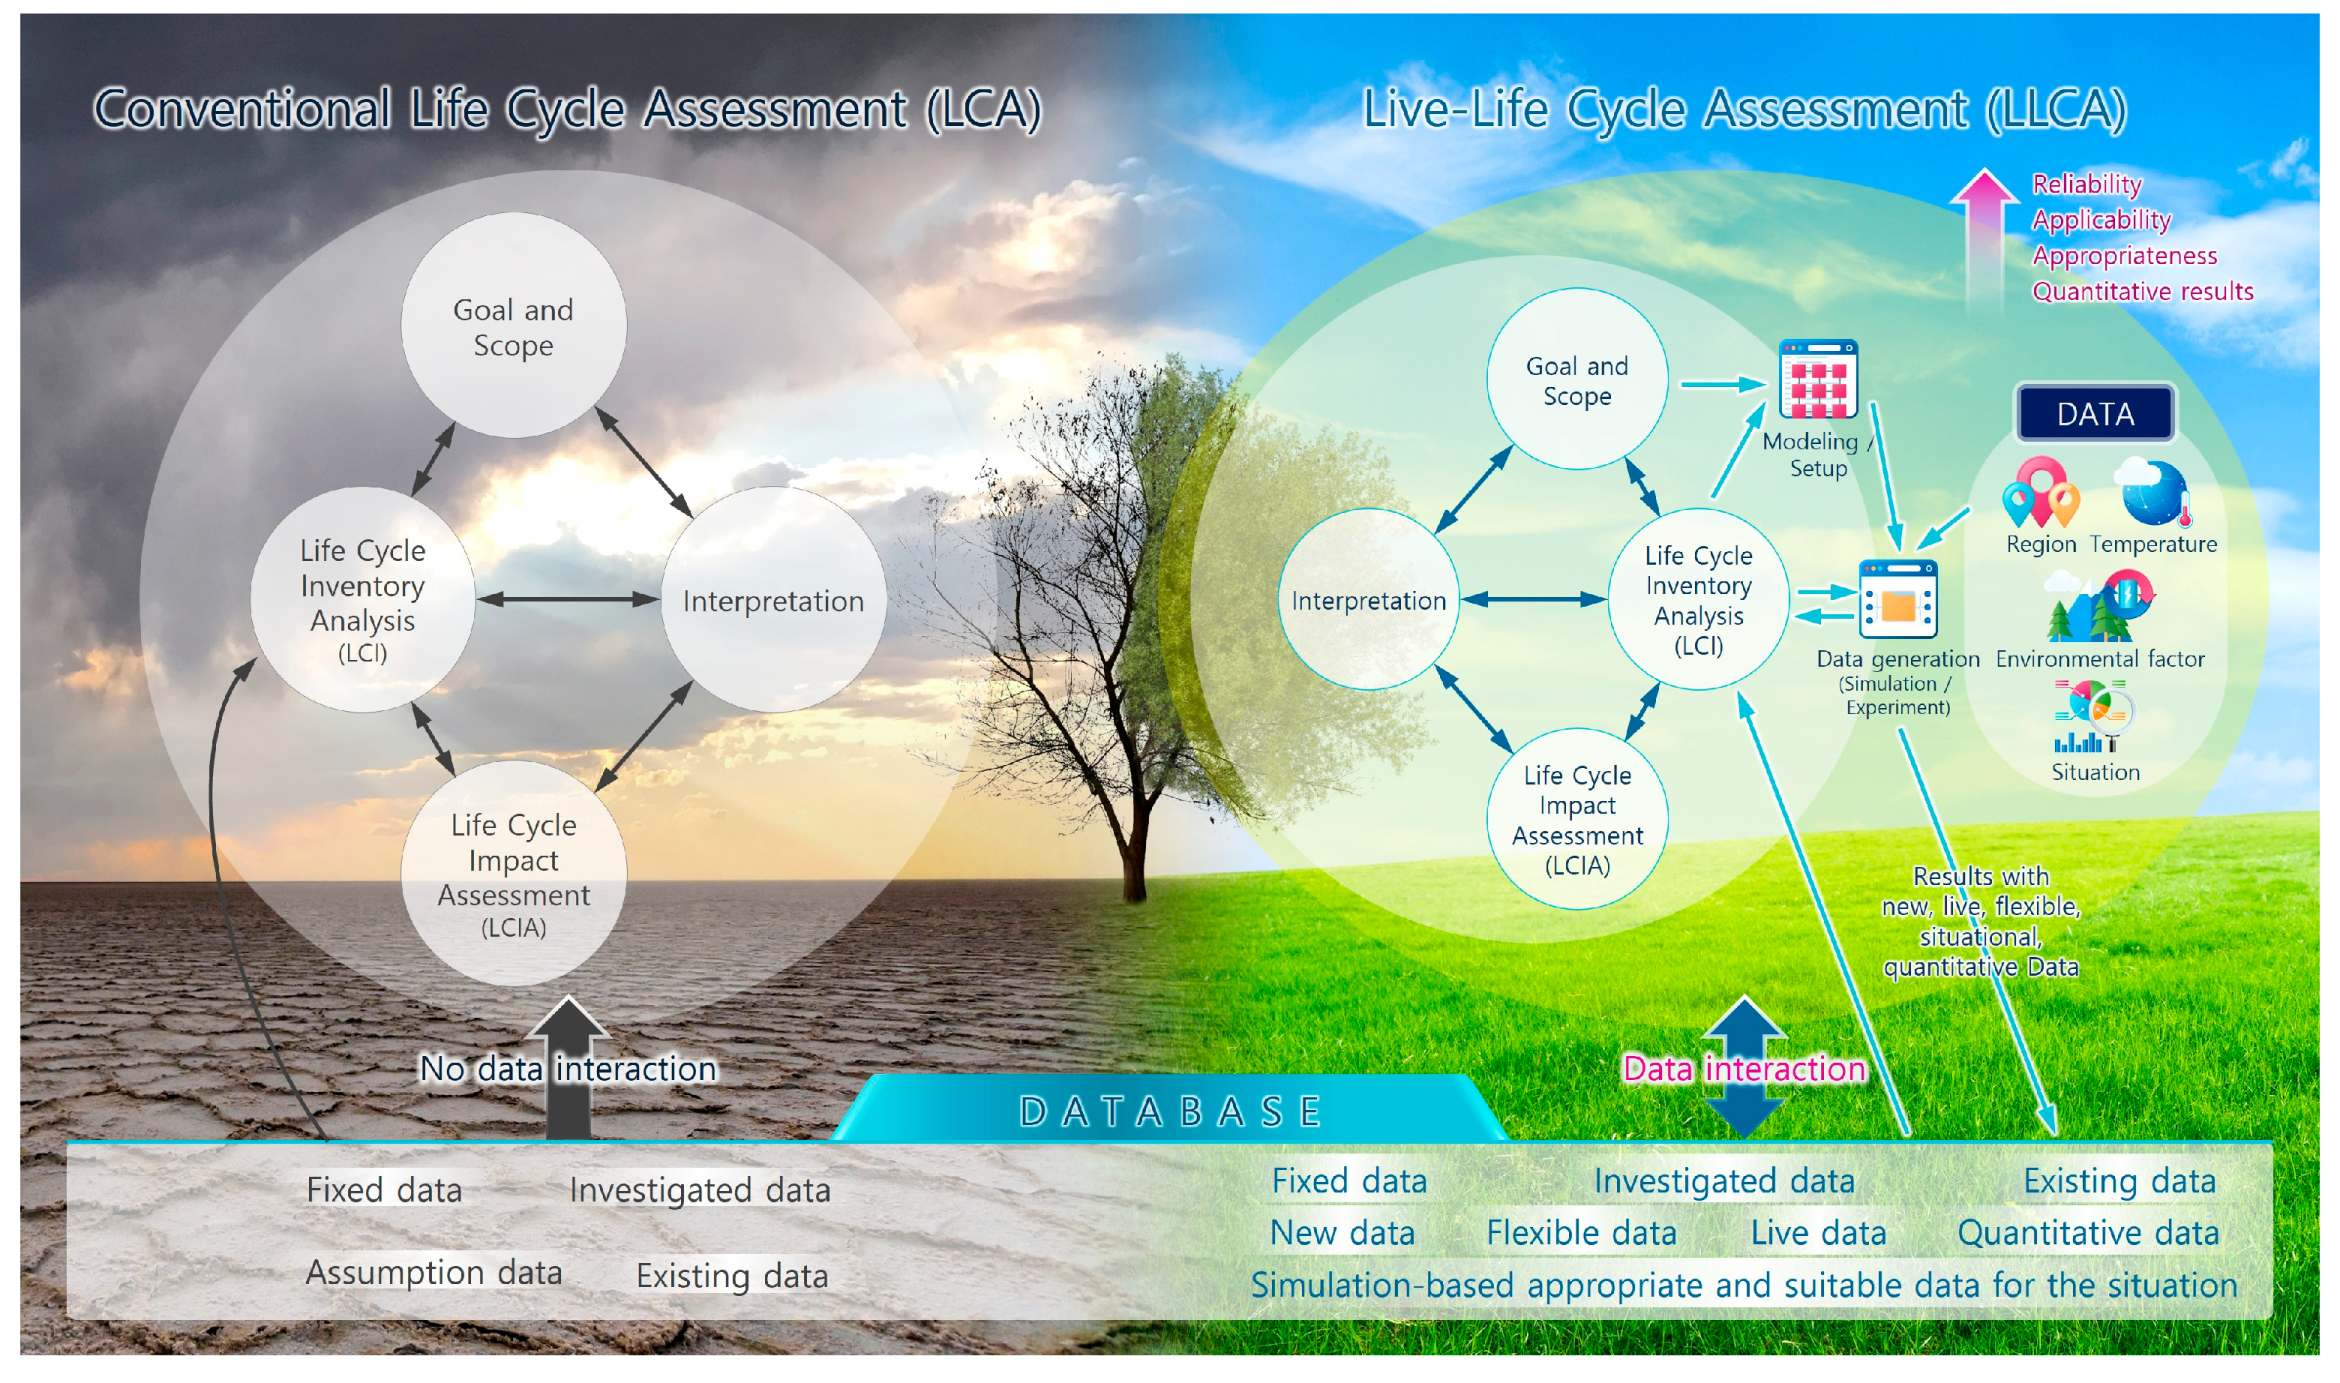
To address the limitations identified in Section 1.2—namely, (i) insufficient coupling between ship electrification impacts and Korea-specific electricity mixes, (ii) limited evidence for retrofit-oriented electrification of large merchant ships, and (iii) inadequate route-resolved assessment of onboard photovoltaic (PV) supplementation—this study applies a Live-Life Cycle Assessment (LLCA) framework. LLCA retains the ISO-aligned LCA structure, while introducing an explicit data interaction layer that continuously generates and assimilates situational operational data into the inventory database.
Conventional LCA practice relies on static-background datasets and fixed operational assumptions, producing a single snapshot of impacts. Such an approach is not well suited to shipping systems whose environmental performance is strongly conditioned by time-varying electricity carbon intensity, route-dependent PV yield, and operational variability. Temporal considerations are frequently lost in aggregated LCI calculations, which can reduce representativeness and amplify uncertainty [29,33]. In response, LLCA in this study is designed as an iterative, simulation-enabled LCA that (a) generates new quantitative operational data under realistic conditions and (b) adds those data to the LCA database so that subsequent assessments remain consistent with evolving contexts.
Figure 1 conceptually contrasts the two paradigms: conventional LCA with limited/no data interaction and LLCA with a modeling setup–data generation–database update loop, aiming to improve reliability, applicability, and quantitative decision support.
Figure 1.
Introduction to the Live-LCA (LLCA) methodology and comparison with conventional LCA.
2.2. ISO-Aligned LCA Framework, Functional Unit, and System Boundary
The baseline methodological structure follows ISO 14040/14044 principles for LCA studies [34,35]. The functional unit is defined to support both intensity-based comparability and decision relevance for retrofit planning. Accordingly, results are reported (i) per unit transport work and (ii) as absolute impacts over an operational period of the case vessel, enabling evaluation of both efficiency and total mitigation potential.
A well-to-wake system boundary is adopted to capture upstream and downstream burdens. The boundary includes, as applicable: (1) energy supply (fuel production and distribution for the baseline; electricity generation and transmission for electrified scenarios), (2) onboard energy use (propulsion and hotel loads), and (3) ship operation route. For PV-assisted scenarios, the PV module and balance-of-system manufacturing burdens are included and allocated over their assumed service life, consistent with established PV-on-ship evaluation practices [26,27].
The objective of this study is to quantify the environmental impacts achievable by converting the energy source of an existing fossil fuel-based vessel to electrical energy, i.e., through the transition to electric propulsion. Given this focus on the energy transition itself, a range of retrofit-relevant hardware requirements (e.g., batteries, power electronics, cabling, propulsion motors, and auxiliary systems) can be identified from an installation and integration perspective. However, because the contribution of these components to the total environmental impact over the vessel’s operational life is expected to be minor relative to the impacts associated with energy supply and use, their environmental burdens are excluded from the system boundary of the present assessment.
2.3. LLCA Concept: Simulation-Based Data Generation and Database Interaction
LLCA operationalizes ‘live’ inventories by embedding simulation into the LCI phase. This design enables continuous data acquisition and model-based inference, allowing for timely environmental-performance estimation and hotspot identification. Building on these directions, LLCA in this study is implemented as a structured loop:
(1) Modeling setup: Establish physics- and data-driven submodels for ship energy demand, electrified powertrain performance, charging behavior, and PV production under route-dependent environmental conditions.
(2) Data generation: Produce time-series/voyage-resolved outputs for effective electricity demand and PV electricity production under specified routes, seasons, and operating states.
(3) Inventory update: Convert generated outputs into LCI flows such as kWh charged from shore, kWh supplied by PV, battery cycling quantities, etc., and store these investigated/live data in a structured database alongside fixed-background datasets.
(4) Impact assessment and interpretation: Re-run LCIA using the updated inventory and compare scenarios.
(5) Iteration: When new operational data, updated route profiles, revised PV layout assumptions, or updated Korean electricity mix trajectories become available, steps (2)–(4) are repeated, and the database grows in coverage and representativeness.
This workflow directly targets the primary methodological limitation of conventional shipping LCAs that apply fixed or historic factors to dynamic systems. By enabling scenario- and route-conditioned data generation, LLCA supports more credible estimation of effective electricity use and effective electricity production.
Because full-scale, deep-sea deployments of many low- and zero-carbon propulsion concepts are still limited, ship energy decarbonization research increasingly needs simulation-based evidence that is anchored in physics and operational constraints—rather than relying on speculative assumptions about energy use, machinery sizing, and emissions outcomes. In this vein, Kistner, Bensmann and Hanke-Rauschenbach [23] quantified the feasibility envelope for battery-electric container ship propulsion by directly comparing diesel engines with multiple marine-battery options across 45 vessel cases, explicitly tracking mass/volume constraints and passage-length sensitivity to derive defensible “where it can work” boundaries from system modeling. Zhang et al. [36] similarly addressed data scarcity for emerging fuels by building a physics-equation propulsion model for a large container ship and applying NSGA-II-based component sizing with a rule-based energy management strategy, benchmarking an ammonia ICE–battery hybrid against an HFO reference using real operation profiles, and reporting substantial modeled CO2 reductions. Collectively, these studies show that simulation can meaningfully substitute for missing field data, but their environmental results remain closely tied to scenario definitions and fixed parameter choices. Building on the same motivation, the Live-LCA approach in this study positions simulation as a live generator of life cycle inventories aligned to retrofit configurations and operating profiles—minimizing the need to fill gaps with static assumptions and enabling GHG outcomes that stay closer to plausible real-world operation.
2.4. Energy Demand Generation Database
The LLCA inventory is driven by an operational energy model anchored to the case vessel’s operating profile. The model resolves total onboard electricity demand as the sum of propulsion demand and auxiliary/hotel loads, accounting for conversion efficiencies in electric-propulsion architectures based on the ship operation record. For each operating segment, the model estimates:
(1) Propulsion power demand using a calibrated speed–power relationship and operating conditions, then maps it to electrical demand at the bus level via drivetrain efficiencies.
(2) Hotel/auxiliary loads as time-dependent demands that may dominate during port stays and low-speed operations.
(3) Battery cycling and charging demand determined by an energy balance that tracks state-of-charge (SoC), charging windows, and charge/discharge efficiencies.
(4) The modeling structure is aligned with ship performance under the actual operating profile.
2.5. Route- and Time-Resolved PV Electricity Production Modeling
For PV-assisted electrification, PV electricity generation is calculated through simulation considering route, time, and environmental conditions. The PV model uses route-resolved relevant meteorological variables to estimate incident irradiance on the PV panel and to derive output using MATLAB Simulink (version R2024b).
Generated PV electricity is stored in batteries to account for the fluctuating power generation characteristic of the energy source, and the system is configured to supply stable power to the motor and load from another set of batteries. Charge/discharge batteries are designed by SoC to increase battery life.
2.6. Korea Electricity Mix Coupling and Time-Evolving Emission Factors
A defining feature of this study is the explicit coupling between electrified ship operation and Korea-specific electricity mix trajectories. Korean electricity statistics from the Ministry of Data and Statistics are used to parameterize historical and current grid characteristics, while forward-looking trajectories are represented via scenario assumptions consistent with published national and international energy outlooks [37]. Rather than applying a single static emission factor, LLCA supports:
- Time-indexed grid intensity (e.g., annual factors reflecting gradual decarbonization), and
- Event-matched grid intensity (optional, where charging time resolution is available), linking charging events to the most appropriate emission factor resolution.
This approach is designed to reduce the structural mismatch between long-lived retrofit decisions and static electricity assumptions, a mismatch that is widely recognized as a source of reduced representativeness in LCA when temporal dynamics are ignored.
2.7. Life Cycle Impact Assessment Method and Reporting
Life cycle impact assessment (LCIA) is conducted using a recognized LCIA method. Global warming impacts are reported using a 100-year Global Warming Potential (GWP100) consistent with contemporary characterization factors based on CML 2001.
Results are reported as scenario comparisons that isolate: (i) baseline fossil fuel operation, (ii) electric-propulsion retrofit with shore electricity, and (iii) electric propulsion retrofit with PV supplementation. LLCA’s iterative inventory updates allow the analysis to be repeated across weather conditions and electricity mix trajectories, thereby producing a more decision-relevant envelope of outcomes than a single static LCA run.
2.8. Sensitivity Analysis, Uncertainty, and Data-Quality Control in LLCA
Given that LLCA introduces new modeled data streams, sensitivity and uncertainty analyses are embedded as part of the iterative loop. Key sensitivity dimensions include: PV installed capacity and electricity mix trajectories. Data-quality control is implemented through (i) model calibration checks against available operational records, (ii) plausibility bounds on simulated energy balances, and (iii) transparent documentation of each iteration’s input datasets and assumptions to maintain reproducibility and comparability across runs.
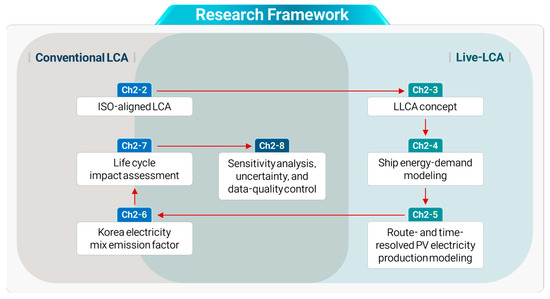
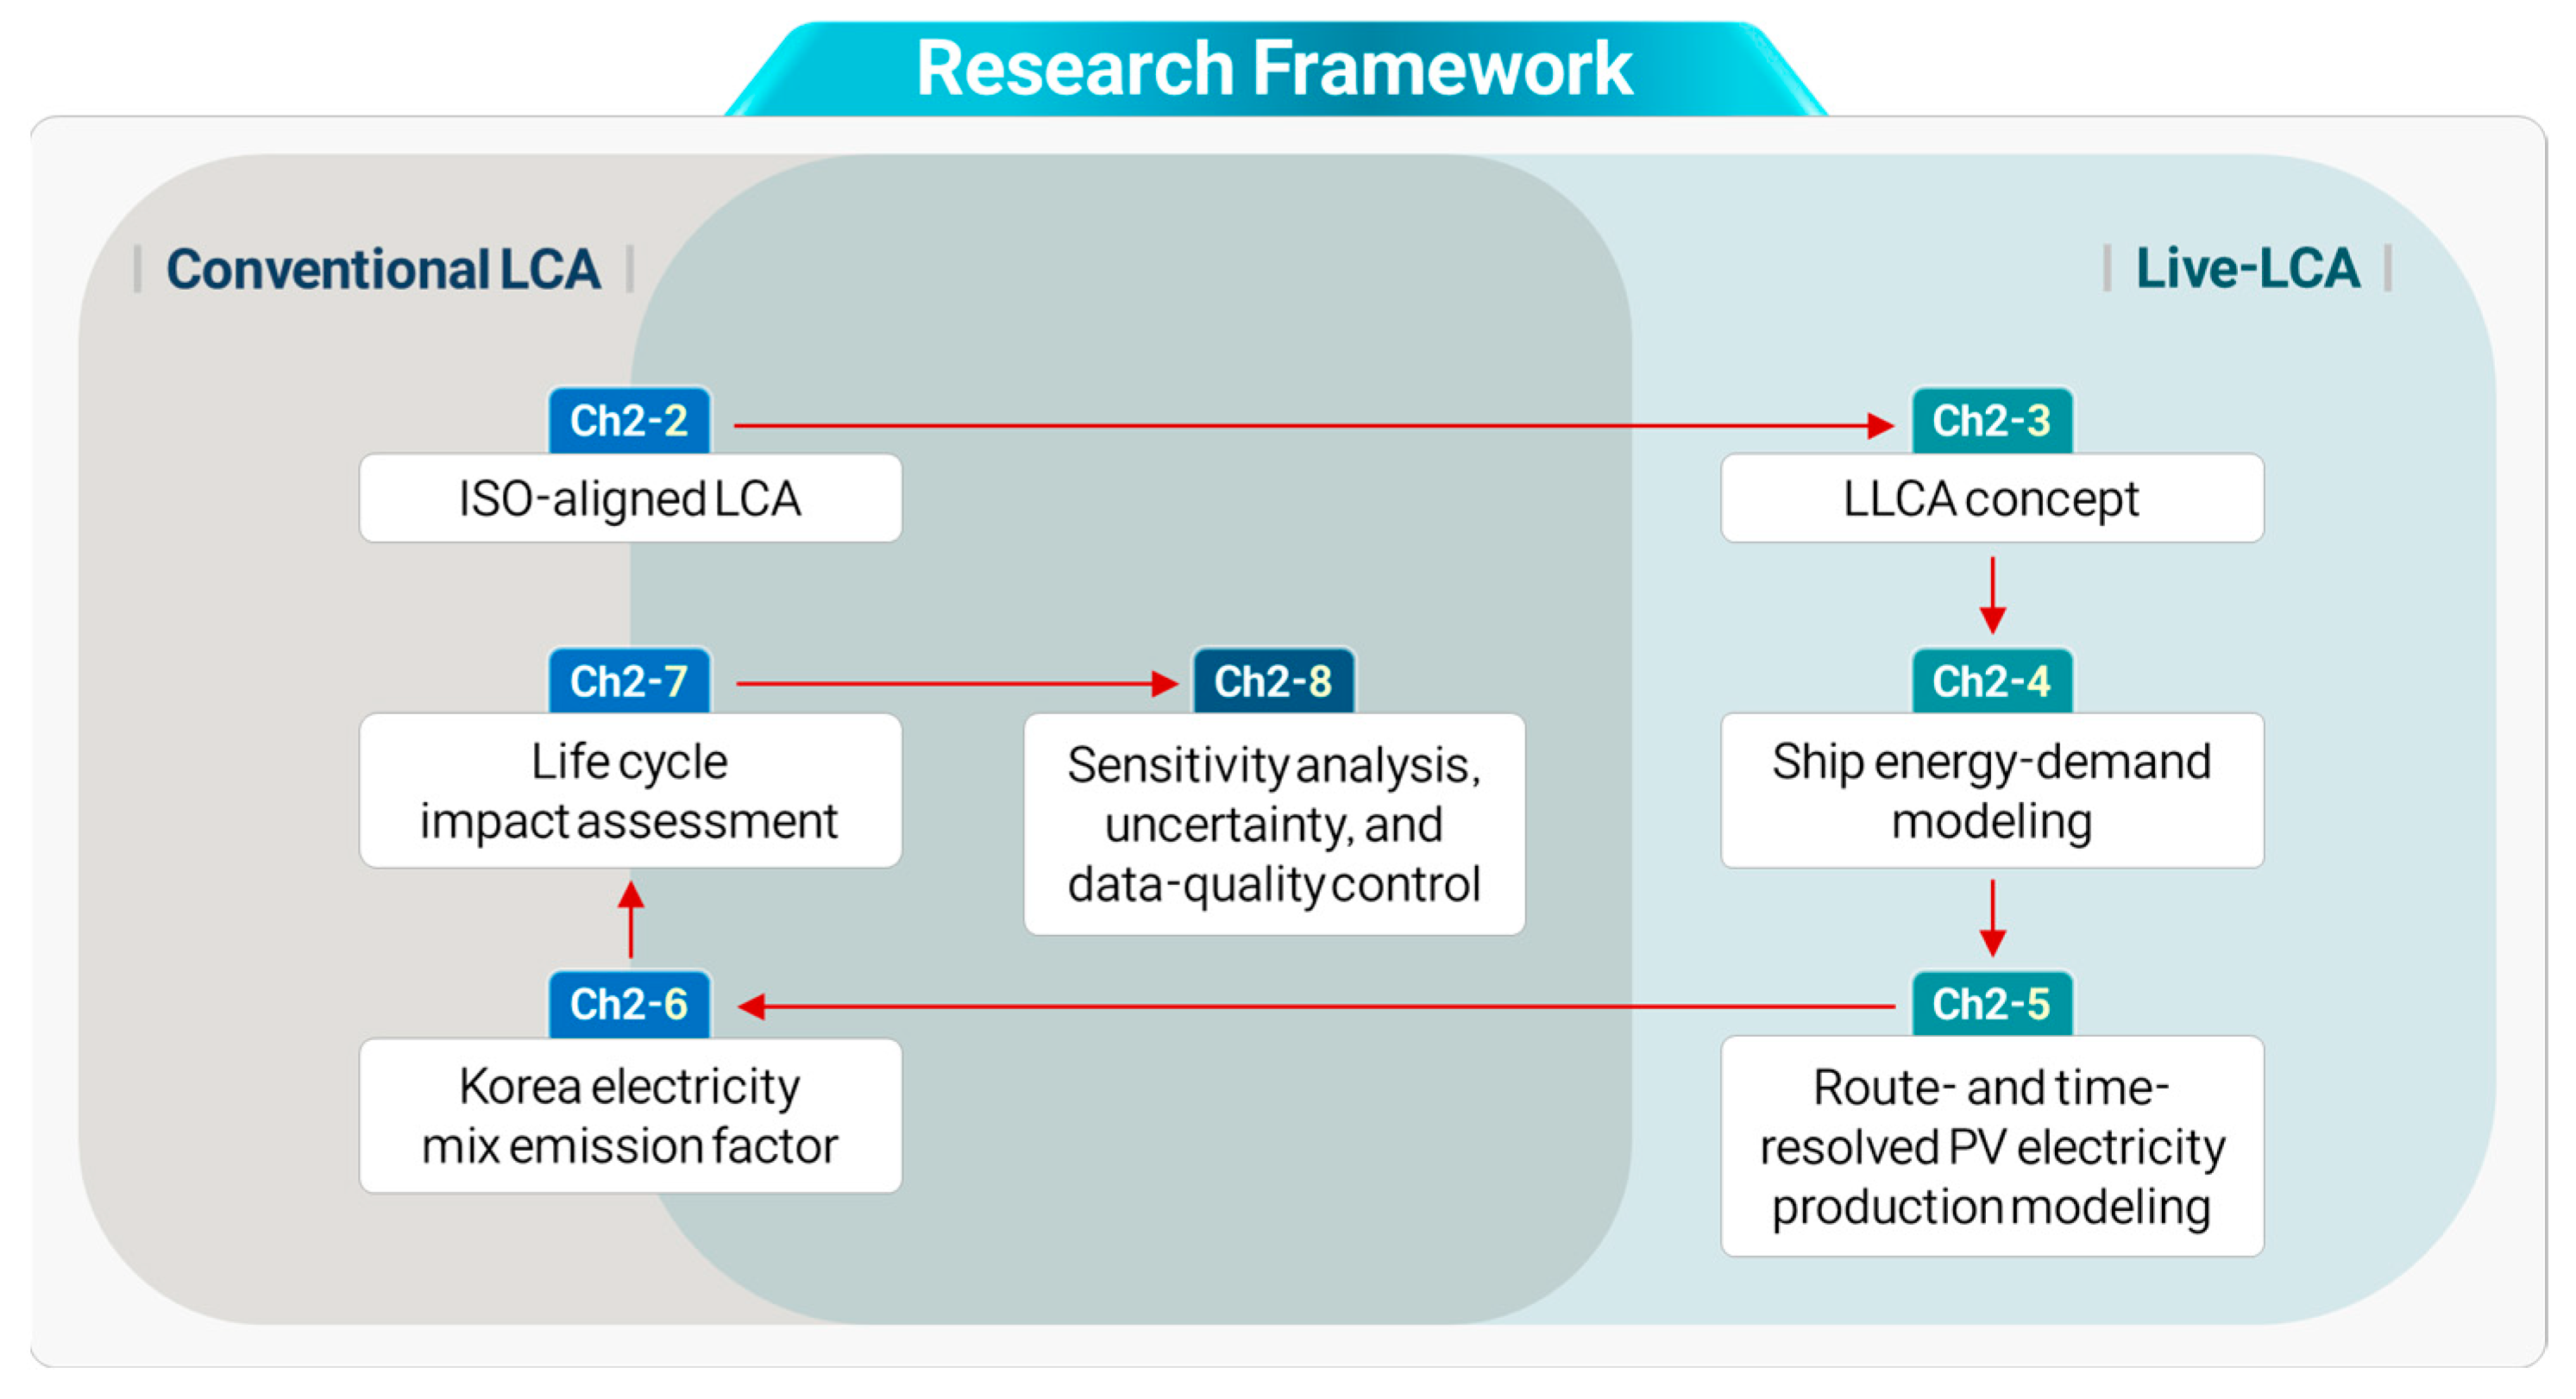
Overall, research has been conducted based on the following research framework, represented in Figure 2.
Figure 2.
Research framework.
3. Analysis and Results
3.1. Case Ship Selection
Two large container ships currently in commercial operation were selected as the case ships for this study. The case ship design was intentionally structured around two vessels—rather than a single representative ship—in order to capture operational variability in real service (e.g., differences in route patterns, port stay durations, and voyage-by-voyage operating conditions) and to enhance the robustness of retrofit sizing and environmental-impact conclusions, shown in Table 1.
Table 1.
Basic data of the case ships.
For each vessel, the empirical basis for the analysis comprised the actual operating route, operating profile, and measured fuel consumption. Fuel consumption data were compiled for the conventional configuration and organized to be consistent with the practice of ship fuel oil consumption recording and reporting.
The use of two vessels enables the subsequent analysis to report not only a single point estimate but also an operationally grounded range of electricity requirements and environmental impacts attributable to large-container-ship electrification under real-world service conditions.
3.2. Electric-Propulsion Ship Configuration
Using the datasets in Section 3.1, the baseline scenario was defined as a conventional diesel-engine container ship operating under its observed service profile. Under the retrofit assumption, the ships were conceptually converted to an electric-propulsion configuration, and the required electrical energy and power were derived from the measured operational and fuel consumption information. Specifically, the route- and profile-resolved activity data were used to determine the time allocation across operating states such as sailing, maneuvering, and port stays, and to quantify the corresponding propulsion and auxiliary energy demands. These demands were then translated into electrical requirements by applying electric propulsion system efficiency assumptions consistent with the LLCA framework established in Chapter 2, producing (i) voyage- and period-level total electricity demand (kWh) and (ii) peak/required power levels (kW) relevant to equipment sizing.
Several technical constraints still limit the immediate applicability of full electric propulsion in large ocean-going merchant vessels. In particular, high-power electric propulsion motors suitable for large commercial ships are not yet widely available at the required power ratings, and the adoption of large-capacity battery systems can substantially increase vessel mass, which may in turn raise the required propulsive power to maintain design speed and operational performance. These engineering feasibility aspects were considered outside the scope of this study and are therefore not explicitly modeled in the Live-LCA framework implemented here. A detailed discussion of these limitations and their implications for future work is provided in Section 4.2.
Based on the resulting electrical demand profile, an electric propulsion system architecture was configured for the case ships, including the major elements required to reproduce the observed operating profile with an electrified drivetrain (e.g., electric propulsion motors, power electronics, energy storage and/or grid interface, and shipboard electrical distribution).
3.2.1. Electric-Propulsion Transition Scenarios
To evaluate the environmental implications of transitioning a conventionally propelled large container ship to electric propulsion, four retrofit scenarios were defined for the case ships. Scenario 1 represents the reference configuration, in which the case ships operate with conventional internal-combustion-based propulsion and onboard power generation.
Based on this reference configuration, the electric propulsion system is defined. In electric-propulsion vessels, the propulsion motor can be configured to provide maneuvering capability comparable to that of a bow thruster; therefore, the number of additional generator sets otherwise installed specifically to supply bow-thruster operations can potentially be reduced.
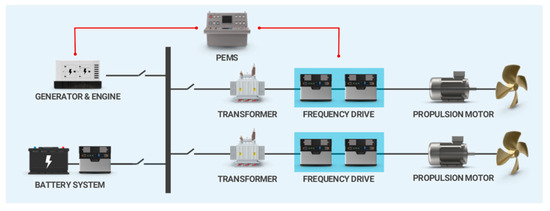
Scenario 2 in Figure 3 represents a hybridized electrification concept in which onboard electricity is supplied by internal-combustion generator sets, while a battery energy storage system (BESS) is introduced as an auxiliary resource to support operational flexibility (e.g., load smoothing and transient power support). Such diesel-electric/hybrid integrated power concepts are widely discussed as practical transitional architectures for ship electrification because they allow gradual replacement of mechanical drivetrains with electrically driven propulsion while retaining onboard generation redundancy. In this scenario, to provide the power capacity required to replace the main engine, case ship A is assumed to be equipped with 4320 kW × 10 generator sets (i.e., the same generator model as the existing installation), while case ship B is assumed to be equipped with 3840 kW × 12 generator sets (also corresponding to the existing generator model).
Figure 3.
Scenario 2 (diesel-battery) for the case ship transition.
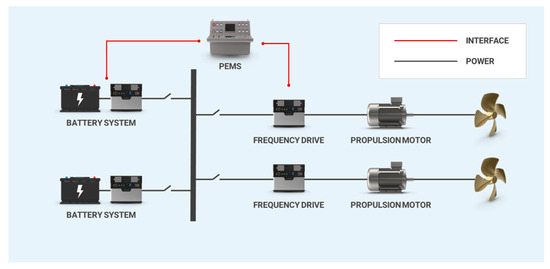
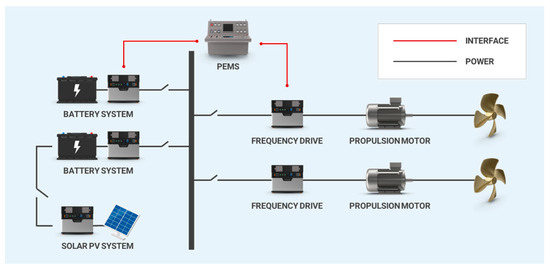
Scenario 3 in Figure 4 assumes a full battery-based energy supply system, where onboard power and propulsion demands are met by electricity supplied through the BESS without the main engine and generators.
Figure 4.
Scenario 3 (full battery) for the case ship transition.
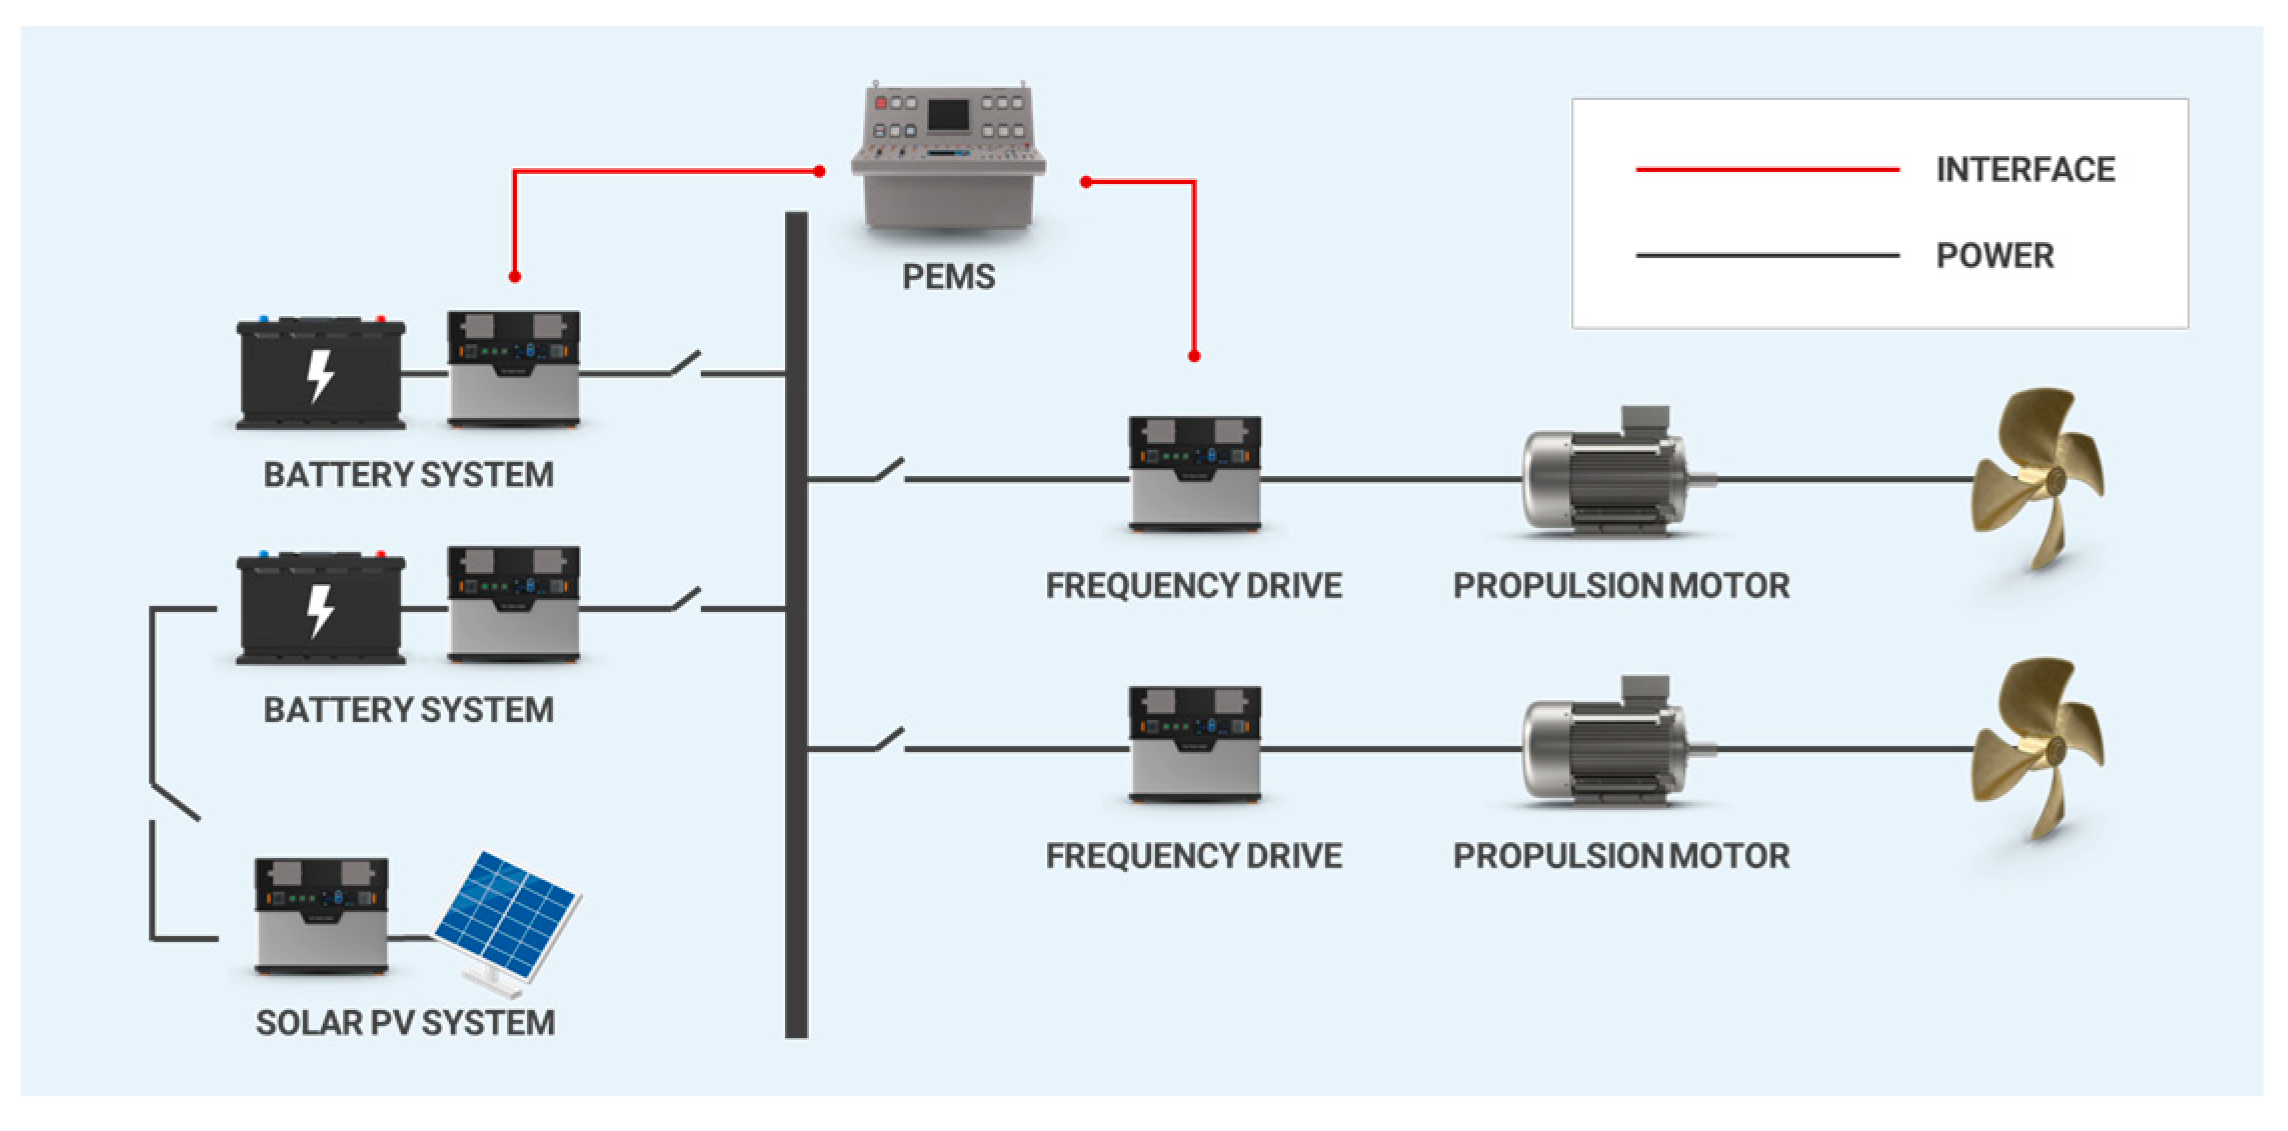
Scenario 4 extends Scenario 3 by adding an auxiliary onboard solar photovoltaic (PV) system. In Figure 5 showing Scenario 4, onboard electricity is supplied primarily by the shore-charged BESS, while the PV system optionally generates additional electricity and provides energy to the battery via power-conditioning interfaces. This scenario is intended to capture the incremental carbon-reduction potential achievable by onboard renewable supplementation under real ship operation and route-dependent environmental conditions.
Figure 5.
Scenario 4 (battery with solar PV) for the case ship transition.
To enable high-fidelity accounting of electricity sources, conversion losses, and multi-source power flow, a distribution architecture compatible with multi-source integration was adopted. Electrified shipboard power systems can be implemented using AC- or DC-centric topologies; however, DC shipboard microgrid concepts are increasingly recognized as advantageous for integrating converter-interfaced resources such as batteries and PV, improving operational flexibility and reducing synchronization constraints [38]. Accordingly, the reference configuration in this study was represented as a converter-interfaced integrated power system, in which propulsion drives and energy storage are coupled through a controlled electrical bus.
3.2.2. Component for the Case Ships
This study prioritizes quantifying the environmental implications and potential benefits of electrifying large, commercially operating container ships, a vessel class for which full electrification remains challenging under current technological and operational constraints. Battery-electric ships can be strongly constrained by the volume and mass requirements of battery energy systems, as well as the associated impacts on ship design and operation. In light of this context, the present work adopts a potential-oriented assessment: the objective is not to validate immediate technical feasibility under today’s integration constraints, but to isolate the environmental signal attributable to an electric-propulsion transition under realistic operational demand.
Accordingly, the battery size, mass, and volumetric integration constraints were defined in a manner that may deviate from practical feasibility, as they were parameterized primarily with respect to the vessel’s operating route and the inter-port distance (i.e., the required endurance range). The resulting parameterization is reported in Section 3.3 (see Table 2). Irrespective of the practical realism of the component-level configuration, the required electrical capacities were derived directly from the empirically reconstructed operating profiles of the case ships and then applied as inputs to the LLCA simulation framework. Specifically, the reconstructed profiles were used to quantify time- and route-resolved energy demand, which was then translated into electrical requirements through assumed electric-propulsion conversion efficiencies.
Table 2.
Configuration of battery and solar panel.
For the battery-based scenarios, the required battery energy capacity (kWh) was determined from the cumulative electrical energy demand between assumed charging opportunities, adjusted for operational constraints at the energy balance level. The rated power capacities (kW) for propulsion drives were determined from the maximum required electrical propulsion power consistent with the observed operating profile. Shore charging was assumed to be available during berthing periods, and port- and country-specific charging infrastructure limitations were not modeled. This assumption allows the analysis to focus on the environmental consequences of electrification under operationally grounded demand, while the infrastructure feasibility implications are treated as outside the scope of the present component-sizing step.
The resulting notional component capacities and inventories—propulsion motor/drive systems, battery energy storage system, shore charging interface, and MPPT (Maximum Power Point Tracking) of the PV system for PV-assisted cases—were used as direct inputs to the life cycle inventory and to subsequent LLCA-based environmental-impact calculations.
3.3. Case Ship Modeling
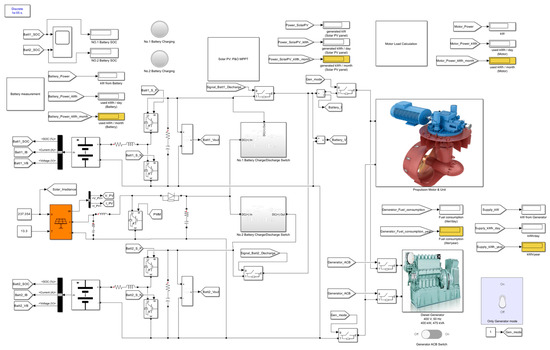
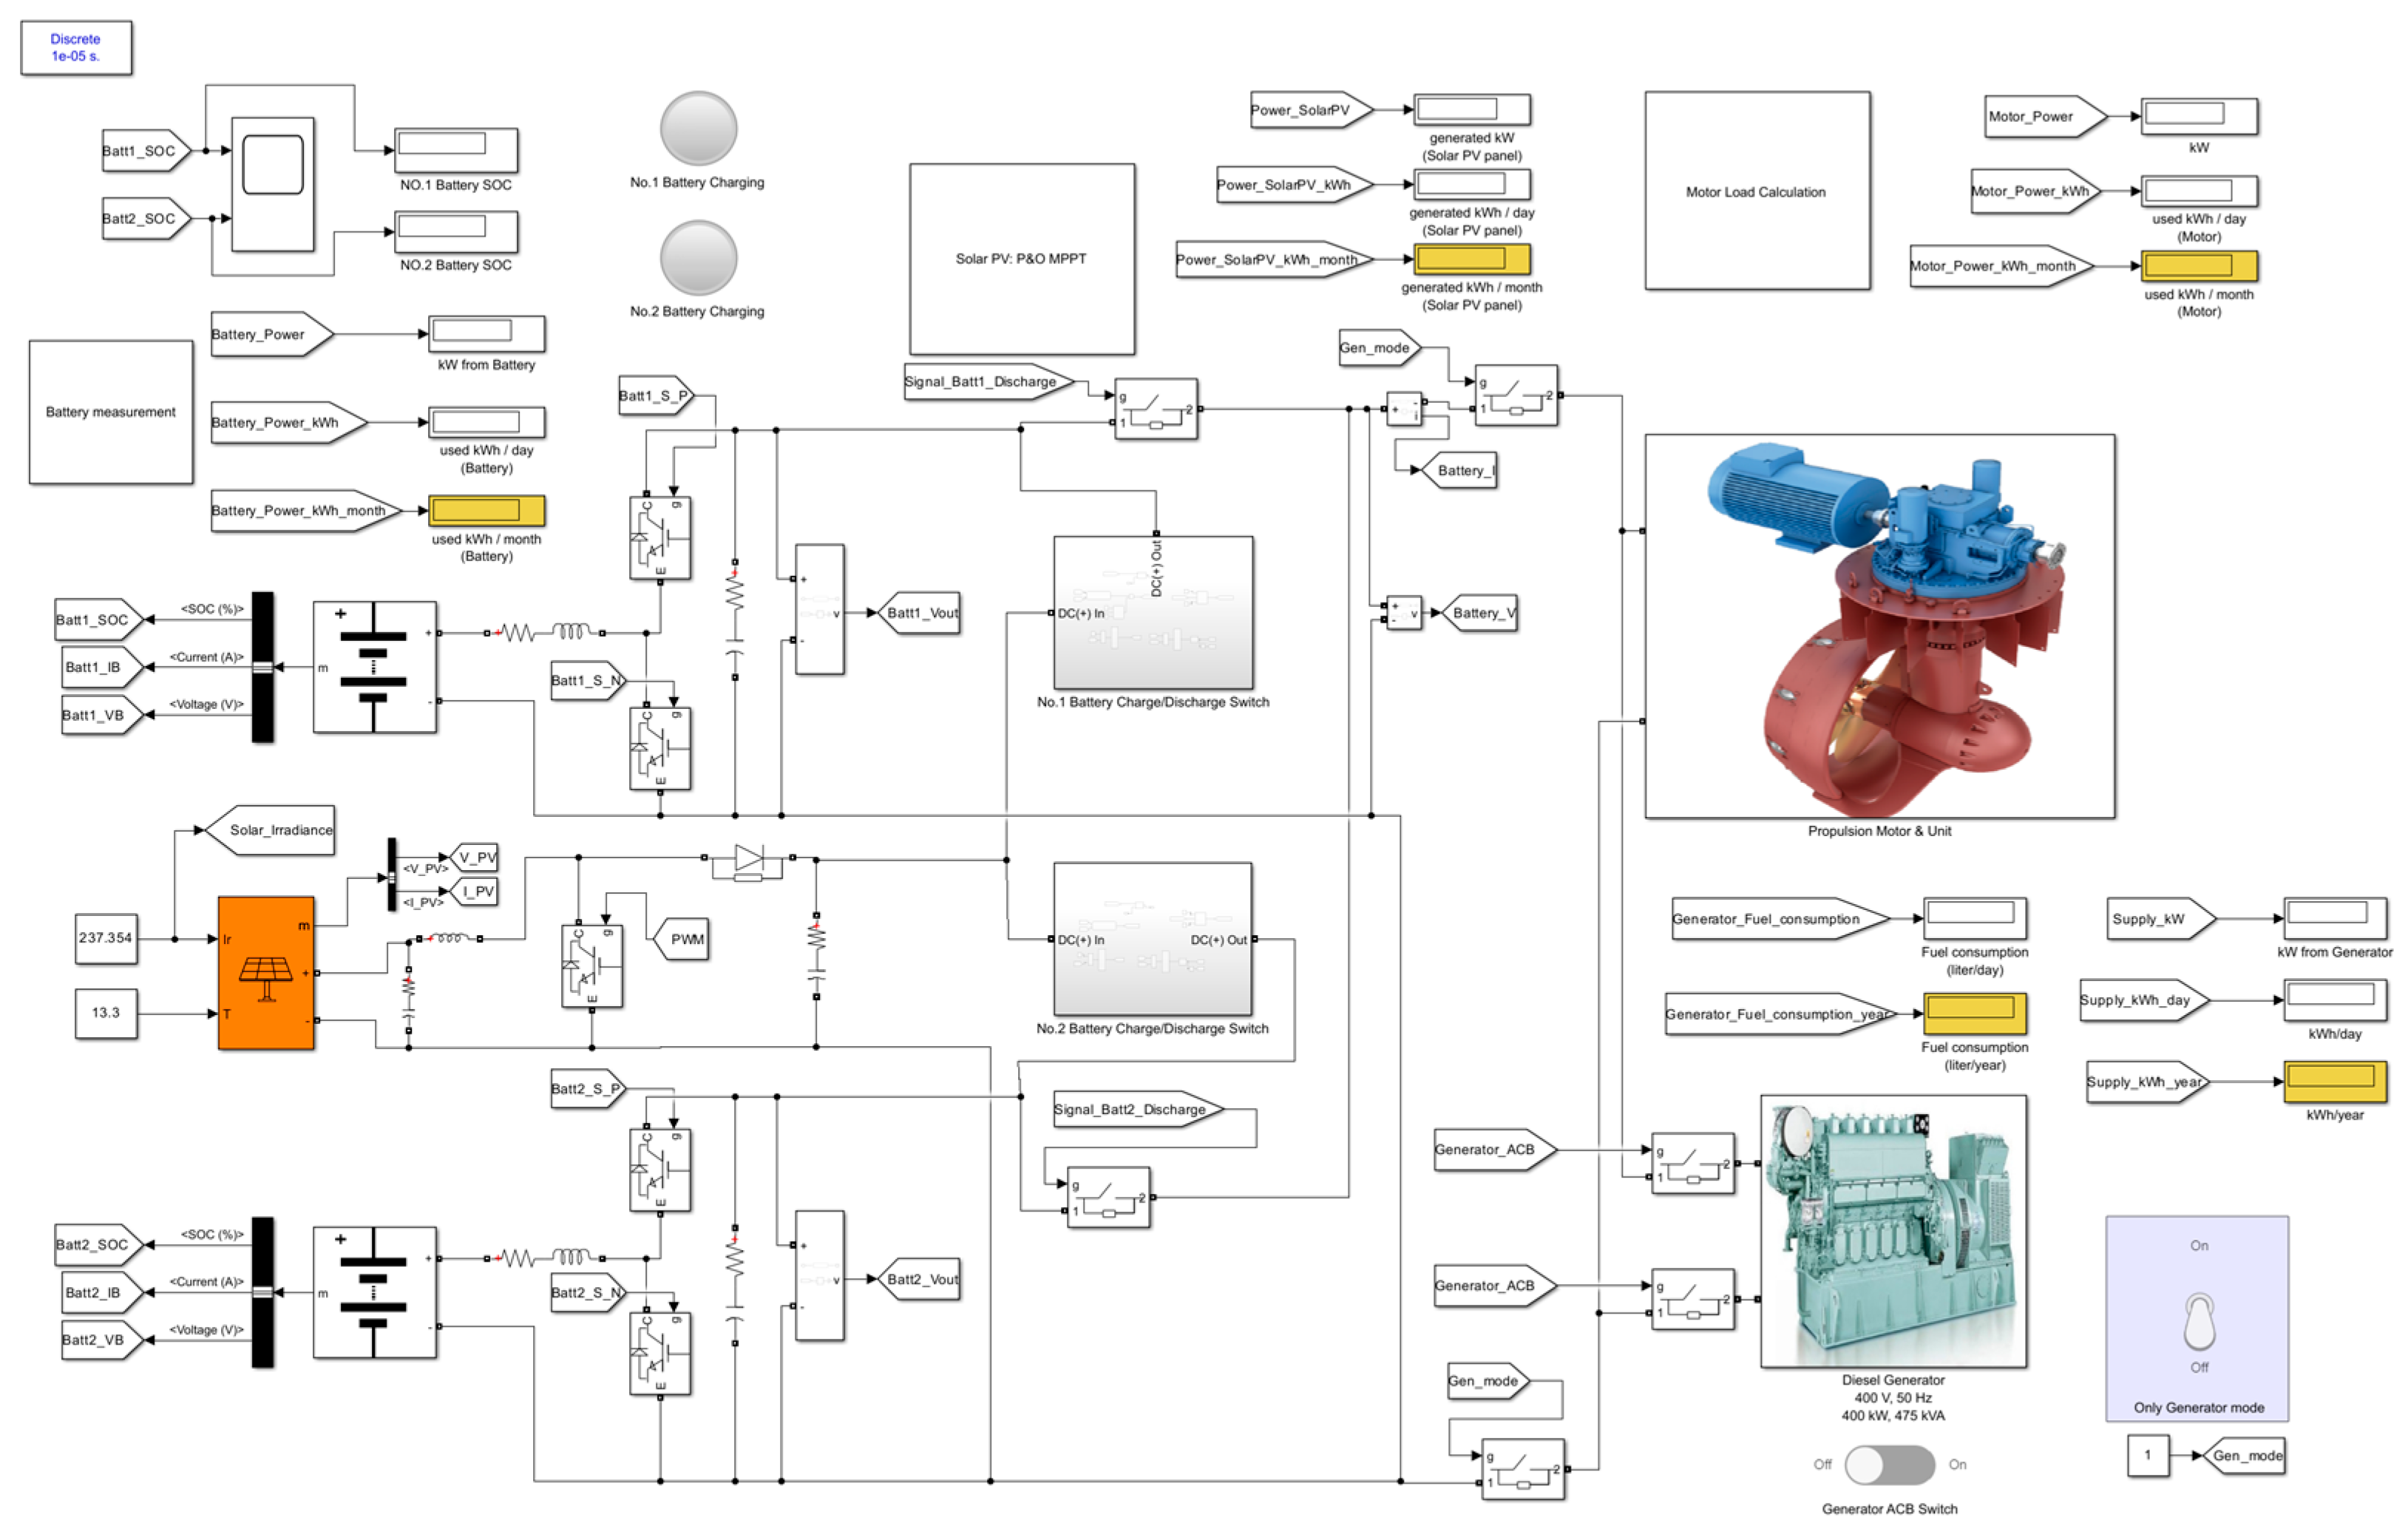
To implement the proposed Live-LCA (LLCA) framework, a scenario-configurable simulation model of the case ships was developed in MATLAB/Simulink (Figure 6). The model was structured as an integrated shipboard electric power and propulsion system to generate time-resolved operational data (power and energy flows) that are required for LLCA inventory updates. In particular, the modeling objective was to represent the electric propulsion power demand derived from the empirical operating profiles and to quantify the electricity supplied from different sources under the defined retrofit scenarios.
Figure 6.
Modeling for case ships by Simulink.
The propulsion subsystem was implemented by installing an electric propulsion motor (and associated drive functionality) sized to reflect the required output level of the case ships. The propulsion load was driven by the reconstructed operating profile such that the simulation reproduces the operationally grounded power demand over voyages and port stays. A modular architecture was adopted so that major power sources and subsystems could be combined consistently according to the scenario definition. Accordingly, a generator subsystem was included to realize Scenario 2 (generator-based supply with battery as an auxiliary resource), a battery energy storage system (BESS) subsystem was included to realize Scenario 3 (full battery-based supply, see Table 2 for configuration), and a solar PV subsystem was modeled to simulate Scenario 4 (battery-based supply with optional PV supplementation). This scenario-switchable configuration enables consistent comparison of power flow, effective electricity use, and source contributions across scenarios under identical operating demand conditions.
For Scenario 3, the battery capacity was determined based on the energy required to complete the longest inter-port leg within the operating route of each case ship. Accordingly, the required battery capacity was calculated and is reported in Table 2. However, for case ship B, the energy demand associated with the longest voyage segment is approximately two times that of Case Ship A, considering the distance, which further confirms that, under current technological and integration constraints, it is not practically feasible to accommodate the full battery capacity required onboard the vessel. Therefore, when considering the conversion of case ship B to an electric-propulsion vessel, it would be necessary to adjust the operating route to reduce the inter-port distance (i.e., endurance requirement). In the present study, this aspect is excluded from the analysis because the primary objective is to evaluate the environmental implications of the energy transition and its relevance to compliance with environmental regulations, rather than to resolve detailed engineering feasibility constraints.
For Scenario 4, the PV subsystem was implemented as an auxiliary electricity source interfaced to the onboard electrical bus through power-conditioning. PV module specifications applied in the model are summarized in Table 2. Importantly, the PV electricity output was not approximated using fixed historical averages; instead, PV production was modeled as a route- and time-dependent power series. Specifically, environmental conditions along the actual operating route of the case ships were used as simulation inputs so that PV electricity generation reflects real operating circumstances (e.g., route, location, and timing). The simulated PV electricity was then accounted for as energy supplied to the BESS, enabling the derivation of practically meaningful PV contribution and net shore electricity demand.
Considering the vessel scale and the cargo-handling and operational characteristics of large container ships, the solar PV system was designed as two physically separated PV array sets installed on (i) the forward deck area near the bow and (ii) the available space above the bridge/superstructure. Each set was electrically configured as 5 modules in series and 40 strings in parallel, and the two sets were operated concurrently within the shipboard power system. This arrangement was selected to reduce interference with container stowage and cargo operations while securing feasible installation areas and maintaining accessibility for maintenance. This electrical configuration was explicitly implemented in the simulation to reflect the array-level voltage/current characteristics (based on the PV module specifications in Table 2) and to compute route-dependent PV power output under the environmental inputs applied to the case ship’s operating route.
The simulation outputs include time-series results for propulsion demand, source-to-load power allocation (generator, BESS, PV), battery state-of-charge evolution, and aggregated energy totals (kWh) over each operating segment. These outputs constitute the “live” operational inventory flows of the LLCA framework and are stored as database entries for subsequent environmental impact calculations. By repeating the simulation whenever updated route, operational, or environmental inputs become available, the LLCA database is progressively expanded, allowing the LCA results to better reflect the dynamic characteristics of shipping operations and onboard renewable-electricity production.
3.4. Results
Following the conventional LCA workflow, the life cycle inventory (LCI) phase was completed to establish the baseline data required for subsequent environmental impact assessment, as Table 3, Table 4 and Table 5.
Table 3.
Database for environmental impact analysis (data from the Ministry of Data and Statistics [37]).
Table 4.
Database for national electricity generation in Korea (data from the Energy GHG Total Information Platform [40]).
Table 5.
Functional units for environmental-impact assessment [14,43].
Building on this, the proposed Live-LCA (LLCA) methodology was applied to address key limitations of static LCA in the maritime context, particularly the inability to represent operational variability and route-dependent renewable generation using fixed historical averages.
Within the LLCA framework, the case ships were virtually converted from the conventional configuration to the defined electric-propulsion configurations through modeling and simulation. Specifically, real operational data (operating profiles and activity patterns) and route-resolved environmental data were used as primary inputs to the simulation model. This approach enabled the derivation of scenario-consistent and operationally grounded energy consumption and energy supply profiles. Rather than relying on simplified assumptions or generic constants for the electrified configurations, the simulation-based workflow produced more rational estimates of energy demand and source contributions that reflect the case ships’ actual operation.
3.4.1. Research on Scenarios
Table 6 summarizes the final dataset compiled for each scenario through a combination of LCI data collection and LLCA simulation outputs. The table consolidates the key energy flows and scenario parameters required for comparative assessment across the four propulsion configurations.
Table 6.
Simulation results (per year).
- (i)
- Scenario 1: Diesel-Main-Engine mode
Scenario 1 represents the conventional configuration of the case ships. It is based on real operational profiles and observed fuel consumption, and it provides the reference baseline for comparative interpretation. The Scenario 1 dataset serves two functions: (1) it establishes the benchmark operational performance and energy use against which electrified scenarios are evaluated, and (2) it provides fundamental inputs for reconstructing the case ships’ propulsion and auxiliary demand characteristics that are subsequently used in the electrified scenario modeling.
- (ii)
- Scenario 2: Diesel–Electric mode
Scenario 2 represents a diesel–electric configuration in which the ship’s energy demand is met through generator-based electricity production, with electrified propulsion enabled by the onboard electrical system. Using the operational profile, the required onboard energy demand was derived, and the corresponding fuel consumption needed to generate that energy was estimated. This scenario, therefore, produces a consistent set of flows linking (i) operational energy demand, (ii) electrical energy supplied through the generator, and (iii) the implied fuel consumption required to satisfy the modeled electricity output under the assumed conversion efficiencies.
- (iii)
- Scenario 3: Full battery mode
Scenario 3 represents a full battery-based electric-propulsion configuration. Under this scenario, the ship is assumed to operate without direct onboard fossil fuel combustion, and propulsion is supplied by electricity sourced from shore power—specifically, electricity supplied through the Republic of Korea power grid. Based on the reconstructed operating profile and the electric propulsion model, total electricity demand (including propulsion and auxiliary loads) was derived as the key operational result. This scenario provides the basis for quantifying the environmental implications of electrified propulsion under a grid-supplied electricity pathway.
- (iv)
- Scenario 4: Full battery with solar PV mode
Scenario 4 builds on Scenario 3 by adding a solar PV system as an auxiliary electricity source. In this configuration, the ship remains primarily battery-powered with shore charging, while the solar PV system enables supplementary electricity production. A defining result of Scenario 4 is that PV electricity generation was not treated as a fixed annual constant; instead, route-resolved environmental characteristics were incorporated into the simulation such that PV electricity production was computed in a manner consistent with the case ship’s actual voyage route. Accordingly, this scenario yields (i) the effective PV electricity generated along the route, and (ii) the corresponding contribution of PV electricity to the ship’s onboard energy balance, enabling a more realistic quantification of how onboard PV supplementation can reduce net shore electricity demand and influence the resulting environmental impact.
3.4.2. Environmental-Impact Assessment
This subsection presents the environmental-impact results derived from the scenario-specific operational energy flows established in Section 3.4.1. The Life Cycle Impact Assessment (LCIA) was conducted to quantify the climate change implications of the baseline diesel operation and the electrified retrofit scenarios for both Case Ship A and Case Ship B. The resulting impact values are reported in Table 7.
Table 7.
Results of LCIA for GWP (kg CO2 eq./year).
The assessment scope was defined as well-to-wake (WtW) for operational energy use, focusing on the global warming impact attributable to fuel and electricity consumption. Within this boundary, the analysis quantifies Global Warming Potential over a 100-year time horizon (GWP100) using the CML 2001 method. Accordingly, Table 7 reports WtW GWP100 outcomes that are directly driven by the operational energy quantities compiled in Table 6.
For the PV-assisted electrification case, PV electricity generation was modeled as route- and environment-dependent and was treated as an operational electricity contribution produced onboard. The PV electricity produced during operation was designed to be stored immediately in the battery energy storage system (BESS) and subsequently used to supply shipboard demand through the modeled electric power system. In order to represent continuous ship operation with concurrent charging and discharging functions, the BESS was configured as two sets: one set supplies electrical power to ship loads while the other set is charged. Under this architecture, the charging source is scenario-dependent—generator charging in Scenario 2 and solar PV charging in Scenario 4—thereby enabling transparent accounting of source-specific energy contributions in the operational energy balance.
Within the operational WtW boundary used in this subsection, the PV contribution is reflected through the scenario energy balance by reducing the required net energy that must be provided via other operational energy pathways. This design ensures that the GWP100 difference between the battery-electric case (Scenario 3) and the PV-assisted battery-electric case (Scenario 4) can be interpreted as the incremental climate change benefit attributable to route-conditioned PV electricity production under otherwise comparable operational demand.
3.4.3. Interpretation
A consistent pattern is observed for both ships: (i) replacing the conventional main-engine propulsion with a generator-based diesel–electric configuration increases GWP, (ii) shifting the energy pathway from fossil fuel-based onboard generation to shore electricity supplied by the Republic of Korea grid yields a marked reduction in GWP, and (iii) the incremental GWP reduction from the solar PV system is marginal under the constrained PV installation considered in this study.
First, the comparison between Scenario 1 (diesel main engine mode) and Scenario 2 (diesel–electric mode) indicates that a transition to electric propulsion without eliminating fossil fuel energy input does not provide a climate benefit for the examined large container ship operations. For Case Ship A, GWP increases from 6.89 × 10⁷ to 8.73 × 10⁷ kg CO2 eq./year (approximately +26.7%), and for Case Ship B, from 1.13 × 10⁸ to 1.46 × 10⁸ kg CO2 eq./year (approximately +29.2%). This outcome suggests that, for long ocean-going segments characterized by high and relatively steady propulsion demand, the efficiency advantage of conventional two-stroke slow-speed main engines over generator-driven configurations—typically relying on four-stroke medium-speed engines—can dominate the overall WtW climate performance. In addition, the diesel–electric pathway introduces additional conversion stages (fuel-to-electricity and electricity-to-propulsion), which can further increase total energy demand when compared to direct mechanical propulsion at comparable operating points.
Second, the comparison between Scenario 2 (diesel–electric mode) and Scenario 3 (full battery mode) demonstrates that the environmental performance of electric propulsion is governed primarily by the energy carrier and supply pathway, rather than by the propulsion architecture alone. When the same electric-propulsion concept is supplied by shore electricity (Republic of Korea grid) instead of onboard fossil fuel-based generation, GWP decreases from 8.73 × 10⁷ to 5.38 × 10⁷ kg CO2 eq./year for Case Ship A and from 1.46 × 10⁸ to 9.00 × 10⁷ kg CO2 eq./year for Case Ship B. These correspond to nearly identical relative reductions of approximately 40% for both ships. Notably, Scenario 3 also achieves a meaningful reduction relative to the conventional baseline (Scenario 1): approximately 21.9% for Case Ship A and 20.4% for Case Ship B. The magnitude of the WtW GWP reduction observed under Scenario 3 indicates that electrification supplied by shore electricity has the potential to deliver reductions on a scale that can contribute substantially toward short-term decarbonization checkpoints of IMIO, provided that comparable transport work is maintained.
Third, the comparison between Scenario 3 (full battery mode) and Scenario 4 (full battery with solar PV mode) shows that the incremental climate benefit from onboard PV supplementation is limited under the constrained PV deployment feasible for the case ships. This marginal effect is consistent with the fundamental scale mismatch between (i) the large propulsion energy demand of ocean-going container ships and (ii) the limited PV installation area that can be accommodated without interfering with container handling and operational constraints. Nevertheless, the PV contribution is expected to be sensitive to practical design and operational decisions (e.g., usable installation area, shading mitigation, module selection, and energy management). In addition, as indicated by segment-level operational results, shown in Table 8, the PV system’s effective contribution can differ between sailing and berthing conditions, suggesting that targeted operational strategies and improved spatial utilization may yield larger mitigation potential than the conservative configuration assessed here. Therefore, while Scenario 4 shows only a minor incremental reduction in the present case, the result should be interpreted as reflecting the limited PV deployment and underscores the need for further investigation into PV placement, operational integration, and system-level optimization for large container ships.
Table 8.
Contribution of solar PV system power production to required output of the electric-propulsion ship.
3.5. Comparative Analysis
This section provides a comparative analysis to contextualize the results presented in Section 3.4 by examining the sensitivity of Scenario 3 outcomes to (i) the temporal evolution of the Republic of Korea’s electricity generation infrastructure and (ii) the country-dependent electricity supply assumed for shore-charged electric propulsion.
3.5.1. Temporal Sensitivity to the Republic of Korea Electricity Pathway
The environmental-impact assessment in Section 3.4 incorporated the ROK electricity generation infrastructure representative of the year 2024. To examine how the choice of the electricity background year affects the well-to-wake (WtW) climate change results, the Scenario 3 calculation was additionally performed using the ROK electricity production infrastructure representative of the year 2018, as summarized in Table 9. The comparison indicates that applying the 2018 electricity pathway would yield approximately 27.7% higher GHG emissions than the 2024-based evaluation. This difference demonstrates that the environmental performance of shore-electricity-based propulsion can change materially as the electricity system evolves, and it further highlights the risk of relying on a static or outdated electricity profile when assessing electrification pathways for long-lived maritime assets.
Table 9.
Functional unit of GWP for electricity based on electricity production ways by country (data from the International Energy Agency [44]).
3.5.2. Cross-Country Comparison of Shore Electricity Supply for Scenario 3
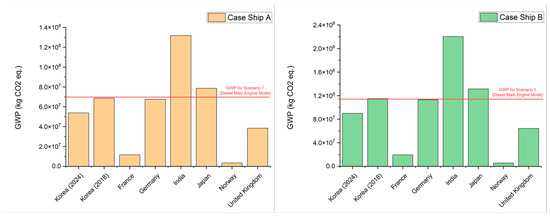
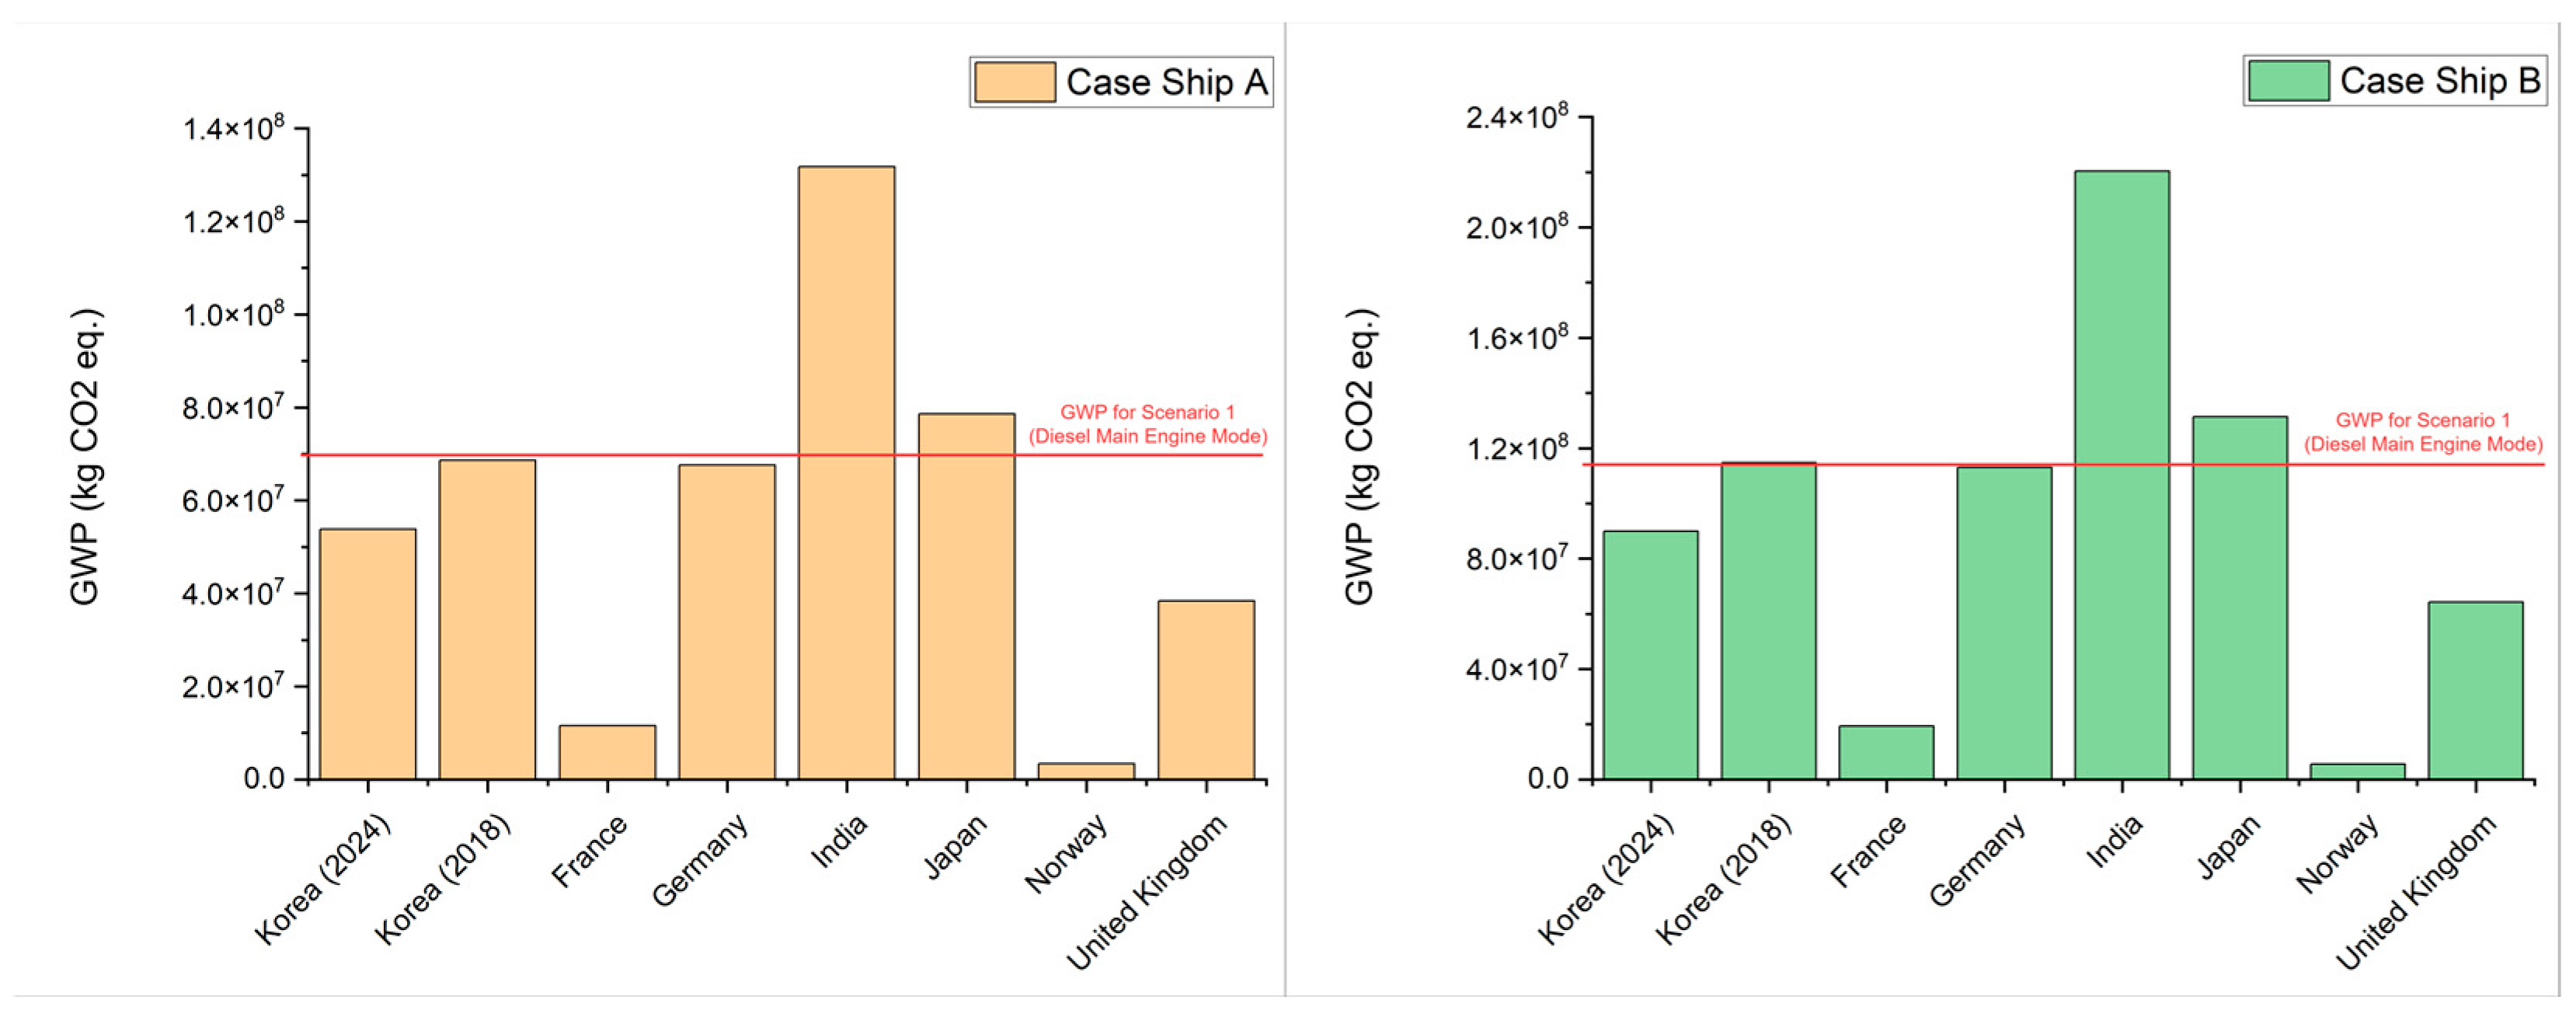
To further illustrate the dependence of electric-propulsion climate performance on the upstream electricity supply, Scenario 3 was recalculated under the assumption that shore electricity is supplied by the national electricity infrastructures of France, Germany, India, Japan, Norway, and the United Kingdom. The resulting cross-country variation in WtW GWP is shown in Figure 7.
Figure 7.
Comparative GWP results for case ships.
The cross-country results demonstrate that Scenario 3 does not represent a single, universal climate outcome; rather, its WtW GWP is strongly conditioned by the carbon intensity of the assumed electricity supply. Low-carbon electricity pathways yield stronger reductions in WtW GWP, whereas more-carbon-intensive electricity pathways diminish the benefit and can approach—or in extreme cases potentially negate—the climate advantage relative to fossil fuel-based baselines. This sensitivity reinforces the central role of electricity supply characteristics as the dominant driver for battery-electric ship operation and underscores the importance of explicitly specifying the electricity pathway used in environmental evaluation.
3.5.3. Implications for Interpreting Section 3.4 Results
Taken together, the temporal (Korea 2018 vs. 2024) and cross-country comparisons provide two important implications. First, the magnitude of climate benefit from shore-electric propulsion is not fixed, even within a single country, because electricity systems evolve over time. Second, the same electric-propulsion configuration can lead to substantially different WtW outcomes across regions depending on the upstream electricity supply. Despite these variations in absolute values, the cross-ship consistency of the relative trends—observed in Section 3.4—supports the robustness of the key conclusion: electric propulsion yields a climate benefit only when paired with low-carbon electricity supply, while generator-based electrification that continues to rely on fossil fuels may worsen WtW GWP for long-distance, high-load container ship operations.
4. Discussion
4.1. Research Novelty
This study contributes to the maritime decarbonization literature by addressing a persistent methodological–empirical mismatch: conventional LCA approaches typically rely on static inventories and fixed operational assumptions, whereas shipping systems are characterized by inherently dynamic operating profiles, route-dependent boundary conditions, and rapidly evolving electricity supply characteristics. In particular, when electrification pathways are assessed using historical or averaged parameters, key drivers such as effective shore electricity demand, operational charging patterns, and onboard renewable electricity production can be misrepresented, leading to impact estimates that are insufficiently representative for decision-making.
To overcome this limitation, the primary methodological novelty of this research is the application of Live LCA (LLCA) to the electrification of large merchant shipping. LLCA extends the conventional LCA workflow by introducing an explicit data-generation and database-enrichment loop, where simulation-derived operational outputs are repeatedly produced and stored as inventory inputs. This structure reduces the extent to which pivotal quantities must be replaced by coarse assumptions, and instead enables the inventory to be populated with operationally grounded energy flows that are consistent with the case ship’s real activity patterns. In this study, LLCA was implemented by coupling ship operational inputs with a scenario-configurable ship power and propulsion system model. As a result, the LCI is informed by simulation outputs that reflect energy balances and conversion losses across the electrified system, enabling environmental impact estimation that is closer to real operational behavior than static, assumption-heavy inventories.
A second novelty lies in the study’s treatment of onboard solar PV integration for large container ships. In many maritime LCA applications, PV electricity generation is either excluded or represented using fixed annual yields, which do not capture the route- and time-dependence that governs onboard PV output in practice. By design, LLCA in this work computes PV electricity production using environmental conditions corresponding to the ship’s actual operating route, thereby enabling the derivation of practically meaningful PV generation and its incremental contribution to the onboard energy balance. This approach directly addresses the limitation that static LCA cannot credibly quantify PV-generated electricity for ship operations without route-resolved modeling.
A third and highly relevant novelty is the explicit focus on large container ships, a vessel segment where full electrification remains technically constrained under current battery technology and integration limits. While many electrification studies have concentrated on short-sea or smaller vessels, this research evaluates the life cycle implications of electrifying two large, commercially operating container ships using their real operating profiles and fuel consumption as the empirical basis. Although feasibility constraints such as battery mass and volume are not the primary focus of this study, the analysis offers value by quantifying the potential life cycle environmental advantages of electrification for large merchant ships under realistic operational demand. This provides a structured, scenario-consistent basis for understanding the magnitude and drivers of environmental benefits that could be realized as enabling technologies and infrastructure mature.
Finally, the study’s novelty is strengthened by its Republic of Korea context, where the electricity supply pathway—and its evolution—can be a decisive determinant of the net environmental outcome of electrified shipping. By structuring the LCI around operationally grounded electricity demand and PV generation, the LLCA framework provides a scalable methodological foundation for evaluating electrification under changing national electricity characteristics, rather than treating grid electricity as a static background parameter.
Collectively, these contributions position the present work as a methodological and empirical step toward decision-relevant environmental assessment of electrifying large merchant ships: LLCA provides a mechanism to translate real operation and route conditions into LCI flows, enabling more defensible life cycle impact estimation for electric propulsion with onboard renewable supplementation.
4.2. Direction of Future Works
While this study demonstrates the utility of the Live-LCA (LLCA) framework for deriving operationally grounded well-to-wake (WtW) climate impacts for electrified large-container-ship scenarios, several research extensions are required to advance the work from a “potential-oriented” environmental assessment toward feasibility-aware, design-ready decision support.
First, future work should incorporate battery mass- and volume-driven feasibility constraints and quantify the associated secondary effects on ship operation. In full battery ships, the integration of high-capacity battery systems can increase displacement and alter trim and stability, potentially affecting resistance, propulsion power demand, and cargo-carrying capability. These naval-architectural implications can introduce additional energy penalties that are not captured when battery sizing is treated only as an energy-balance parameter. A next-step research direction is therefore to couple the electric propulsion and energy management model with a naval architecture module that explicitly represents battery mass/volume, structural integration, and any payload displacement. This would enable the LLCA framework to quantify how “electrification hardware” changes the operating point of the vessel itself and how those changes propagate into life cycle impacts.
Second, a more realistic assessment of onboard solar PV requires enhanced representation of installation feasibility and operational constraints beyond conservative area assumptions. Although this study modeled PV generation using route-dependent environmental conditions, the installed PV capacity was intentionally limited to avoid interference with cargo operations. Future work should explore PV deployment with higher fidelity, including: feasible mounting geometries, structural reinforcement requirements, shading and soiling effects (especially under container stacking and port crane operations), corrosion and maintenance constraints, degradation, and inverter/MPPT limitations (e.g., clipping). Such refinements would allow the analysis to move from “PV as an auxiliary conceptual contributor” to “PV as a practically engineered subsystem,” and would improve confidence in the incremental mitigation potential of PV supplementation—especially when combined with optimized power allocation rules (e.g., PV-to-hotel loads versus PV-to-battery charging depending on operational state).
Finally, future work can strengthen decision relevance by transitioning from a WtW operational boundary to a broader life cycle scope where appropriate. This includes explicitly representing the manufacturing and end-of-life burdens of batteries, power electronics, PV balance-of-system, and charging infrastructure, and by evaluating sensitivity to replacement cycles and recycling assumptions. In addition, incorporating time-evolving electricity mix scenarios and charging-time alignment (where data are available) would further improve the realism of electrification assessments under changing grid conditions. Together, these enhancements would enable LLCA to function not only as an operationally grounded impact calculator, but also as a scalable framework for feasibility-aware, multi-technology pathway evaluation for net-zero shipping.
5. Conclusions
This study evaluated the well-to-wake (WtW) climate change implications of transitioning large, commercially operating container ships to electric propulsion toward net-zero shipping, using a case study of two ships operated by a company in the Republic of Korea. To overcome the limitations of conventional LCA in representing dynamic maritime operation and route-dependent renewable generation, the Live-LCA framework was applied. LLCA enabled simulation-driven inventory generation using real operating profiles and route-resolved environmental inputs, thereby reducing reliance on simplified assumptions and producing operationally grounded energy flows for life cycle impact assessment.
Within the WtW boundary, the results demonstrate three principal findings.
(1) Electrification that continues to rely on fossil fuel energy through onboard generator-based electricity production does not provide a climate benefit for long-distance, high-load container ship operation. For Case Ship A, the diesel–electric configuration (Scenario 2) increased GWP from 6.89 × 10⁷ to 8.73 × 10⁷ kg CO2-eq./year (approximately +26.7%), and for Case Ship B from 1.13 × 10⁸ to 1.46 × 10⁸ kg CO2-eq./year (approximately +29.2%), relative to conventional main-engine operation (Scenario 1). This outcome indicates that, under sustained high-power ocean-going conditions, the inherent efficiency advantage of conventional two-stroke main-engine propulsion and the avoidance of additional conversion stages can outweigh any expected operational benefits of a generator-based electric propulsion arrangement.
(2) The transition from fossil fuel-based onboard generation to shore-supplied electricity is possible to yield a strong reduction in WtW GWP for electric propulsion. When electricity supplied through the Republic of Korea grid is used to operate the full battery-electric configuration (Scenario 3), the GWP decreases approximately 40%, relative to diesel–electric operation (Scenario 2), confirming that the upstream electricity pathway is a dominant determinant of climate performance even when the propulsion architecture is the same.
(3) The incremental benefit of onboard solar PV supplementation is marginal under the constrained installation considered in this study. With limited PV area deployed to reflect container ship operational constraints, the PV-assisted battery-electric configuration (Scenario 4) resulted in only small additional reductions relative to Scenario 3, approximately 0.23~0.29% of total energy consumption. These findings highlight the scale mismatch between the propulsion energy demand of large ocean-going ships and the limited PV installation potential under realistic cargo-handling constraints. Nevertheless, the route-resolved PV modeling implemented in LLCA provides a foundation for future optimization studies, as the PV contribution can vary between sailing and port stay conditions and may increase with improved spatial utilization and system integration strategies.
A comparative analysis further indicates that conclusions are sensitive to the electricity background and its temporal evolution. Specifically, applying a Republic of Korea electricity production infrastructure representative of 2018 rather than 2024 leads to approximately 27% higher GHG emissions for the shore-electric case, demonstrating that static or outdated electricity assumptions can materially distort electrification outcomes. Cross-country comparisons for Scenario 3 similarly underscore that electric propulsion is climate-beneficial only when paired with a sufficiently low-carbon electricity supply.
Funding
This research was supported by the Korea Institute of Marine Science & Technology Promotion (KIMST), funded by the Ministry of Oceans and Fisheries (RS-2025-02219107). And also, this work was supported by the National Korea Maritime & Ocean University Research Fund in 2025.
Data Availability Statement
The original contributions presented in this study are included in the article. Further inquiries can be directed to the corresponding author.
Conflicts of Interest
The author declares no conflicts of interest.
Abbreviations
The following abbreviations are used in this manuscript:
| BESS | Battery Energy Storage System |
| CO2 | Carbon Dioxide |
| FO | Fuel Oil |
| GHG | Greenhouse Gases |
| GWP | Global Warming Potential |
| IGCC | Integrated Gasification Combined Cycle |
| IMO | International Maritime Organization |
| LCA | Life Cycle Assessment |
| LCI | Life Cycle Inventory |
| LCIA | Life Cycle Impact Assessment |
| LNG | Liquefied Natural Gas |
| MGO | Marine Gas Oil |
| MPPT | Maximum Power Point Tracking |
| PV | Photovoltaic |
| WtW | Well-to-Wake |
References
- IMO. Fourth Greenhouse Gas Study 2020; IMO: London, UK, 2020. [Google Scholar]
- IMO. IMO 2020—Cutting Sulphur Oxide Emissions. Available online: https://www.imo.org/en/mediacentre/hottopics/pages/sulphur-2020.aspx (accessed on 3 December 2025).
- IMO. Emission Control Areas (ECAs) Designated Under MARPOL Annex VI; IMO: London, UK, 2024. [Google Scholar]
- IMO. Improving the Energy Efficiency of Ships. Available online: https://www.imo.org/en/ourwork/environment/pages/improving%20the%20energy%20efficiency%20of%20ships.aspx?utm_source=chatgpt.com (accessed on 3 December 2025).
- IMO. IMO Data Collection System (DCS). Available online: https://www.imo.org/en/ourwork/environment/pages/data-collection-system.aspx?utm_source=chatgpt.com (accessed on 3 December 2025).
- IMO. 2023 IMO Strategy on Reduction of GHG Emissions from Ships. Available online: https://www.imo.org/en/ourwork/environment/pages/2023-imo-strategy-on-reduction-of-ghg-emissions-from-ships.aspx?utm_source=chatgpt.com (accessed on 3 December 2025).
- European Union. Regulation (EU) 2015/757 on the Monitoring, Reporting and Verification of Carbon Dioxide Emissions from Maritime Transport; European Union: Luxembourg, 2015. [Google Scholar]
- European Union. Regulation (EU) 2023/957 Amending Regulation (EU) 2015/757 (MRV) to Support Inclusion of Maritime Transport in the EU ETS and MRV of Additional GHGs; European Union: Luxembourg, 2023. [Google Scholar]
- European Union. Directive (EU) 2023/959 Amending Directive 2003/87/EC Establishing a System for Greenhouse Gas Emission Allowance Trading Within the Union; European Union: Luxembourg, 2023. [Google Scholar]
- European Commission. Reducing Emissions from the Shipping Sector (EU ETS Phase-In for Maritime); European Commission: Luxembourg, 2024. [Google Scholar]
- European Union. Regulation (EU) 2023/1805 on the Use of Renewable and Low-Carbon Fuels in Maritime Transport (FuelEU Maritime); European Union: Luxembourg, 2023. [Google Scholar]
- Kanchiralla, F.M.; Brynolf, S.; Malmgren, E.; Hansson, J.; Grahn, M. Life-cycle assessment and costing of fuels and propulsion systems in future fossil-free shipping. Environ. Sci. Technol. 2022, 56, 12517–12531. [Google Scholar] [CrossRef] [Scilit]
- Roux, M.; Lodato, C.; Laurent, A.; Astrup, T. A review of life cycle assessment studies of maritime fuels: Critical insights, gaps, and recommendations. Sustain. Prod. Consum. 2024, 50, 69–86. [Google Scholar] [CrossRef] [Scilit]
- Ha, S.; Jeong, B.; Jang, H.; Park, C.; Ku, B. A framework for determining the life cycle GHG emissions of fossil marine fuels in countries reliant on imported energy through maritime transportation: A case study of South Korea. Sci. Total Environ. 2023, 897, 165366. [Google Scholar] [CrossRef] [Scilit] [PubMed]
- Wang, J.; Li, H.; Yang, Z.; Ge, Y.-E. Shore power for reduction of shipping emission in port: A bibliometric analysis. Transp. Res. Part E Logist. Transp. Rev. 2024, 188, 103639. [Google Scholar] [CrossRef] [Scilit]
- Jeong, B.; Jang, H.; Lee, W.; Park, C.; Ha, S.; Kim, D.K.; Cho, N.-K. Is electric battery propulsion for ships truly the lifecycle energy solution for marine environmental protection as a whole? J. Clean. Prod. 2022, 355, 131756. [Google Scholar] [CrossRef] [Scilit]
- Kim, S.; Jeon, H.; Park, C.; Kim, J. Lifecycle environmental benefits with a hybrid electric propulsion system using a control algorithm for fishing boats in Korea. J. Mar. Sci. Eng. 2022, 10, 1202. [Google Scholar] [CrossRef] [Scilit]
- Moon, H.S.; Park, W.Y.; Hendrickson, T.; Phadke, A.; Popovich, N. Exploring the cost and emissions impacts, feasibility and scalability of battery electric ships. Nat. Energy 2025, 10, 41–54. [Google Scholar] [CrossRef] [Scilit]
- Republic of Korea. The Republic of Korea’s Enhanced Update of its First Nationally Determined Contribution; UNFCCC: Bonn, Germany, 2021.
- Wang, H.; Boulougouris, E.; Theotokatos, G.; Zhou, P.; Priftis, A.; Shi, G. Life cycle analysis and cost assessment of a battery powered ferry. Ocean. Eng. 2021, 241, 110029. [Google Scholar] [CrossRef] [Scilit]
- IEA. Korea 2025: Energy Policy Review; IEA: Paris, France, 2025. [Google Scholar]
- Choo, H.; Kim, Y.-G.; Kim, D. Power sector carbon reduction review for South Korea in 2030. Renew. Sustain. Energy Rev. 2024, 196, 114348. [Google Scholar] [CrossRef] [Scilit]
- Kistner, L.; Bensmann, A.; Hanke-Rauschenbach, R. Potentials and limitations of battery-electric container ship propulsion systems. Energy Convers. Manag. X 2024, 21, 100507. [Google Scholar] [CrossRef] [Scilit]
- Kim, S.; Yoon, K.-K.; Park, S.-K. Simulation Study on a fuel cell/battery hybrid electric propulsion system for ships. J. Adv. Mar. Eng. Technol. 2025, 49, 206–214. [Google Scholar] [CrossRef] [Scilit]
- Godet, A.; Panagakos, G.; Barfod, M.B.; Lindstad, E. Operational cycles for maritime transportation: Consolidated methodology and assessments. Transp. Res. Part D Transp. Environ. 2024, 132, 104238. [Google Scholar] [CrossRef] [Scilit]
- Qiu, Y.; Yuan, C.; Tang, J.; Tang, X. Techno-economic analysis of PV systems integrated into ship power grid: A case study. Energy Convers. Manag. 2019, 198, 111925. [Google Scholar] [CrossRef] [Scilit]
- Karatuğ, Ç.; Durmuşoğlu, Y. Design of a solar photovoltaic system for a Ro-Ro ship and estimation of performance analysis: A case study. Sol. Energy 2020, 207, 1259–1268. [Google Scholar] [CrossRef] [Scilit]
- Martínez-López, A.; Ballester-Falcón, P.; Mazorra-Aguiar, L.; Marrero, A. Solar photovoltaic systems for the Short Sea Shipping’s compliance with decarbonization regulations in the European Union. Sustain. Energy Technol. Assess. 2023, 60, 103506. [Google Scholar] [CrossRef] [Scilit]
- Lueddeckens, S.; Saling, P.; Guenther, E. Temporal issues in life cycle assessment—A systematic review. Int. J. Life Cycle Assess. 2020, 25, 1385–1401. [Google Scholar] [CrossRef] [Scilit]
- Kim, H. A real-time lifecycle analysis model with digital twin and novel control method for enhancing the environmental performance of electric/hybrid propulsion ships. Ocean. Eng. 2025, 329, 121195. [Google Scholar] [CrossRef] [Scilit]
- Hossein Arabnejad, M.; Thies, F.; Yao, H.-D.; Ringsberg, J.W. Life Cycle Assessment Method for Ship Fuels Using a Ship Performance Prediction Model and Actual Operation Conditions—Case Study of Wind-Assisted Cargo Ship. Energies 2025, 18, 4559. [Google Scholar] [CrossRef] [Scilit]
- Kwon, B.-j.; Jeong, B.-u.; Lee, S.-b.; Park, Y.-m.; Oh, S.-j.; Shin, S.-c. Comparative analysis of EU ETS, FuelEU maritime and IMO carbon pricing regulations: Strategic and economic implications for the shipping industry. J. Adv. Mar. Eng. Technol. 2025, 49, 224–238. [Google Scholar] [CrossRef] [Scilit]
- Beloin-Saint-Pierre, D.; Albers, A.; Hélias, A.; Tiruta-Barna, L.; Fantke, P.; Levasseur, A.; Benetto, E.; Benoist, A.; Collet, P. Addressing temporal considerations in life cycle assessment. Sci. Total Environ. 2020, 743, 140700. [Google Scholar] [CrossRef] [Scilit] [PubMed]
- ISO 14040:2006; Environmental Management—Life Cycle Assessment—Principles and Framework. ISO: Geneva, Switzerland, 2006.
- ISO 14044:2006; Environmental Management—Life Cycle Assessment—Requirements and Guideline. ISO: Geneva, Switzerland, 2006.
- Zhang, Y.; Chen, P.; Wu, D.; Hao, X.; Yang, T.; Cairns, A. Advancing maritime decarbonisation: Design and optimisation of ammonia-fuelled propulsion systems. J. Clean. Prod. 2025, 535, 147145. [Google Scholar] [CrossRef] [Scilit]
- Ministry of Data and Statistics. Current Status of Power Generation by Energy Source. Available online: https://www.index.go.kr/unity/potal/main/EachDtlPageDetail.do?idx_cd=1339 (accessed on 8 December 2025).
- Xu, L.; Guerrero, J.M.; Lashab, A.; Wei, B.; Bazmohammadi, N.; Vasquez, J.C.; Abusorrah, A. A review of DC shipboard microgrids—Part I: Power architectures, energy storage, and power converters. IEEE Trans. Power Electron. 2021, 37, 5155–5172. [Google Scholar] [CrossRef] [Scilit]
- Jeong, B.; Jeon, H.; Kim, S.; Kim, J.; Zhou, P. Evaluation of the lifecycle environmental benefits of full battery powered ships: Comparative analysis of marine diesel and electricity. J. Mar. Sci. Eng. 2020, 8, 580. [Google Scholar] [CrossRef] [Scilit]
- Energy GHG Total Information Platform. Renewable Energy Generation. Available online: https://tips.energy.or.kr/statistics/statistics_view0403.do (accessed on 9 December 2025).
- Dong, D.T.; Schönborn, A.; Christodoulou, A.; Ölcer, A.I.; González-Celis, J. Life cycle assessment of ammonia/hydrogen-driven marine propulsion. Proc. Inst. Mech. Eng. Part M J. Eng. Marit. Environ. 2024, 238, 531–542. [Google Scholar] [CrossRef] [Scilit]
- Petrescu, L.; Cormos, C.-C. Environmental assessment of IGCC power plants with pre-combustion CO2 capture by chemical & calcium looping methods. J. Clean. Prod. 2017, 158, 233–244. [Google Scholar] [CrossRef] [Scilit]
- Park, C.; Jeong, B.; Zhou, P.; Jang, H.; Kim, S.; Jeon, H.; Nam, D.; Rashedi, A. Live-Life cycle assessment of the electric propulsion ship using solar PV. Appl. Energy 2022, 309, 118477. [Google Scholar] [CrossRef] [Scilit]
- International Energy Agency. Monthly OECD Electricity Statistics; IEA: Paris, France, 2020. [Google Scholar]

Disclaimer/Publisher’s Note: The statements, opinions and data contained in all publications are solely those of the individual author(s) and contributor(s) and not of MDPI and/or the editor(s). MDPI and/or the editor(s) disclaim responsibility for any injury to people or property resulting from any ideas, methods, instructions or products referred to in the content. |
© 2026 by the author. Licensee MDPI, Basel, Switzerland. This article is an open access article distributed under the terms and conditions of the Creative Commons Attribution (CC BY) license.