


Abstract
Using computational fluid dynamics (CFD) coupled with the volume of fluid (VOF) method, we developed an analytical framework to quantify free-surface suction around ship hulls. The DTMB 5415 benchmark hull was employed to investigate the mechanisms by which underwater tail fins influence surface wake dynamics. We systematically evaluated the effects of tail-fin span on hydrodynamic drag and free-surface suction across the investigated speed range. Within the Froude number range of 0.05–0.45, underwater tail fins reduced air entrainment by optimizing hull attitude and attenuating stern waves. Free-surface suction capacity exhibited a positive correlation with vessel speed and a negative correlation with tail-fin span length. At Fr = 0.45, the free-surface suction capacity of the bare hull was 13.78 times greater than that at Fr = 0.15. At this speed, the L4 tail-fin configuration achieved a 13.292% reduction in free-surface suction. In contrast, the L2 tail-fin configuration provided a suction reduction of only 9.98%. The optimal tail-fin span represents a trade-off between drag reduction and wake suppression, as longer spans do not necessarily yield superior performance. Under cruise conditions (Fr = 0.25–0.35), the L2 tail-fin configuration exhibited optimal performance, achieving a 5.292% reduction in drag and a 13.492% reduction in free-surface suction. Across the tested Froude number range of 0.05–0.45, underwater tail fins simultaneously improved hydrodynamic performance and reduced free-surface suction, thereby effectively suppressing bubble wake formation.
1. Introduction
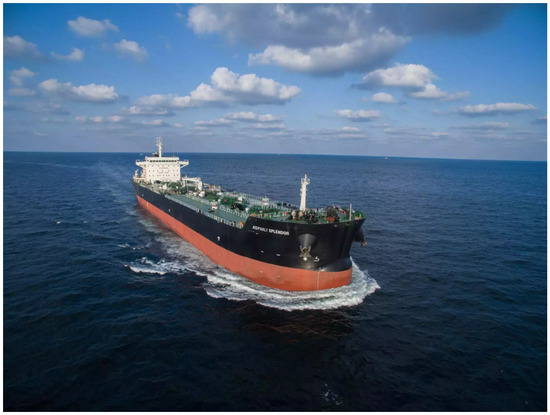
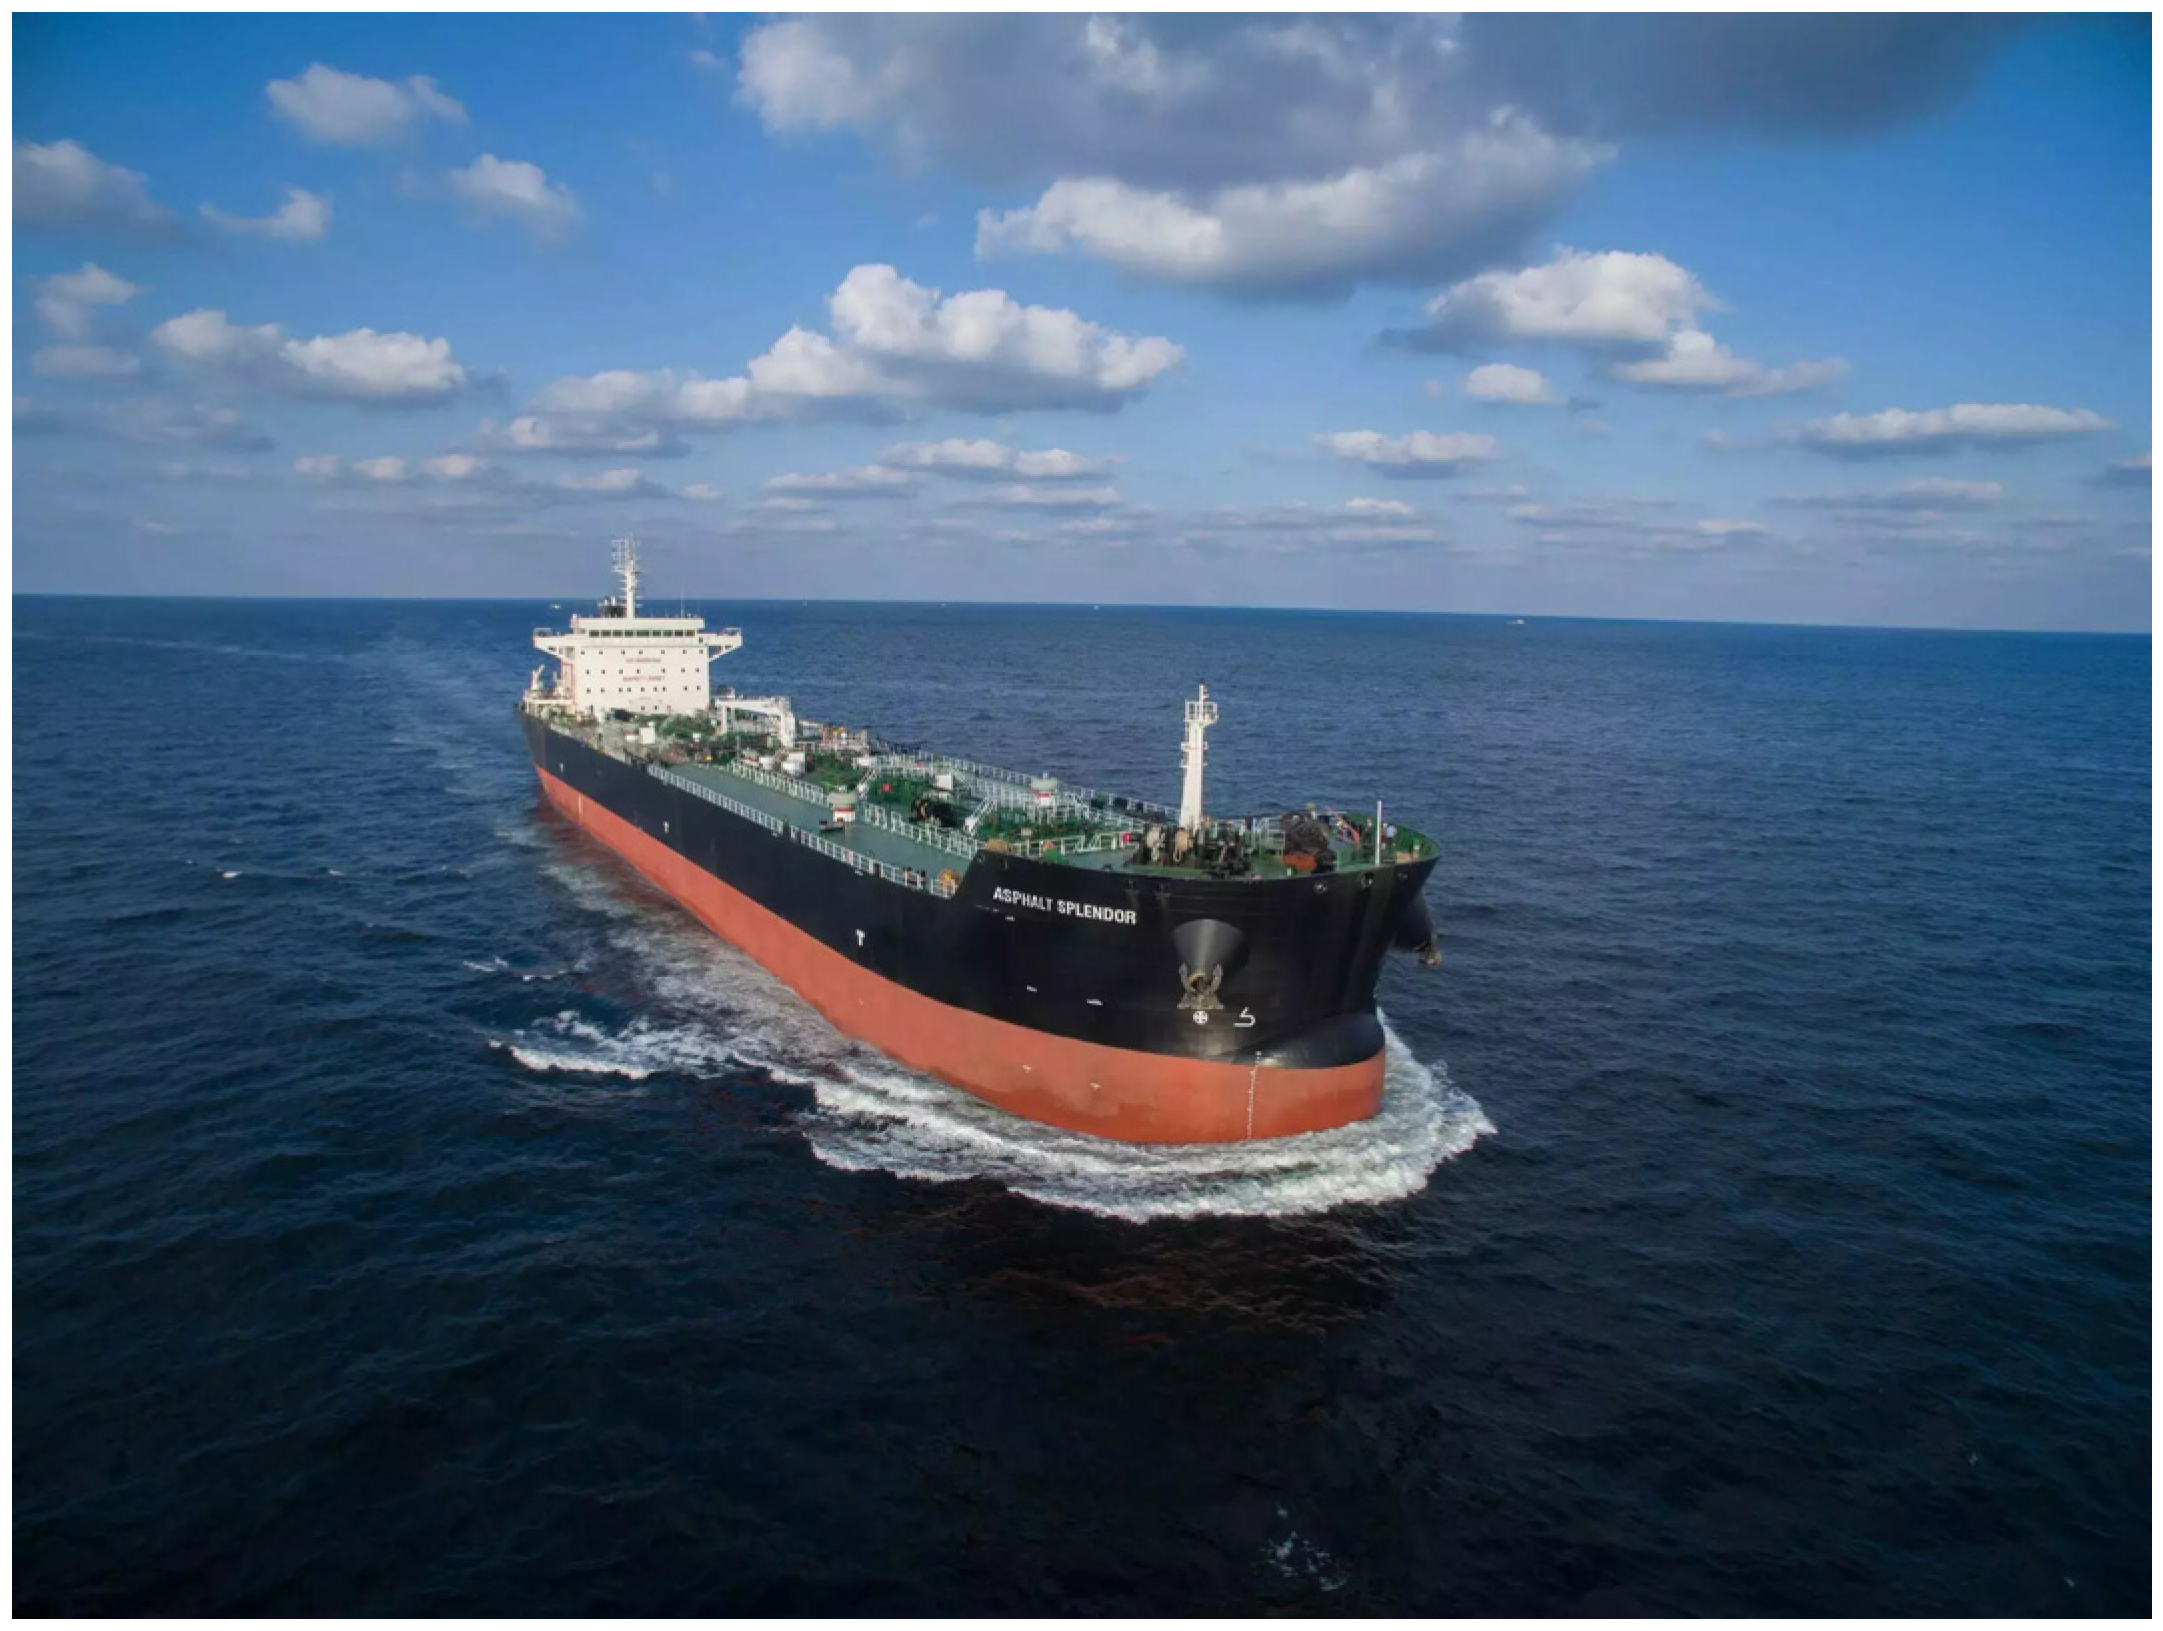
The relative motion between the hull and the surrounding seawater induces intense free-surface disturbances, including wave rolling and breaking. At high speeds, bow-generated wave crests break apart, while turbulent flow around the hull entrains a substantial volume of air into the water. This phenomenon, referred to as air entrainment, constitutes a critical aspect of fluid–structure interaction at the free surface. Air entrainment generates a bubbly wake behind the vessel (see Figure 1), in which rising bubbles accumulate at the surface and form a visible white foam streak. This foam alters the optical properties of the sea surface and enhances radar backscattering, rendering the ship’s wake detectable by optical, infrared, and radar sensors. In military applications, such wake signatures significantly degrade a vessel’s stealth performance and increase its susceptibility to enemy detection. Consequently, investigating free-surface air entrainment mechanisms and developing effective suppression strategies are crucial for enhancing naval stealth performance.
Figure 1.
Bubbly ship wake.
In recent years, numerical simulation techniques have been widely used to investigate the relationship between air entrainment near the ship hull and bubble gas-phase formation. As summarized below, numerous studies have explored this phenomenon. Over the past several decades, significant progress has been made in predicting bubble flow around the water surface using Euler–Euler and Euler–Lagrange multiphase flow models [1,2,3,4,5]. Recently, direct numerical solution methods for two-phase flow equations for ship hull configurations have also been attempted [6]. Nevertheless, quantitative validation against experimental data remains limited, partly due to the lack of reliable and accurate sub-grid-scale air entrainment models. Therefore, the spatial distribution and velocity of air entrainment are crucial to the accuracy of multiphase flow simulations. Moraga et al. [3] proposed a sub-grid air entrainment model and applied it to the simulation of flow around surface ships. This model assumes that bubble generation sites are distributed along the free surface, and entrainment occurs when the local downward liquid velocity exceeds the bubble rising velocity. However, this model overlooks the situation where air entrainment does not occur when the free surface descends at the same velocity as the liquid. In addition, while this model only predicts the location of air entrainment, the entrainment rate has to be determined empirically. Several entrainment rate models have been developed for standard flows such as plunging jets [7,8,9] and hydraulic jumps [8]. Although applicable to local regions around surface ships, none of them can capture all bubble sources simultaneously.
More recently, a sub-grid air entrainment model [10,11] was developed based on the assumption that turbulence creates a rough air–liquid interface with cavities of characteristic size. These cavities are entrained into the liquid when the downward liquid velocity exceeds the interface descent velocity. This assumption yields a simple formulation for both the location and rate of air entrainment, with the rate proportional to the local turbulent kinetic energy and the downward velocity gradient of the liquid. The model has been incorporated into a two-fluid framework for bubbly flows [4,5] and applied to canonical cases including plunging jets and hydraulic jumps. In both cases, the model demonstrated good agreement with experimental observations [10,11].
At present, scholars at home and abroad have conducted extensive research on energy-saving attachment devices for ships. Trimulyono et al. (2023) [12] carried out a double-stage hull design, which significantly reduced the ship’s resistance by lowering frictional resistance. However, there are still risks of design complexity and stability in the navigation state. Avci et al. (2023) [13] optimized the position of the transverse single stage of the high-speed boat to achieve energy savings by reducing frictional resistance. However, the selection of the stage position is highly sensitive to the longitudinal tilt and stability of navigation. Improper design can offset the energy-saving benefits and damage the navigation performance. Sahin et al. (2023) [14] effectively optimized the hull attitude to reduce drag and achieve energy conservation by dynamically controlling the longitudinal inclination energy of the glider through interceptors. However, the energy-saving effect highly depends on the precise response of the real-time control system to the navigation conditions. Romani et al. (2025) [15] pointed out that conducting uncertainty quantification and global sensitivity analysis of turbulence model coefficients in cavitation flows can enhance the prediction accuracy of ship hull hydrodynamic design, thereby theoretically supporting better energy-saving designs. However, this method is computationally costly and heavily dependent on professional analytical capabilities, making it difficult to be directly applied to conventional engineering practices.
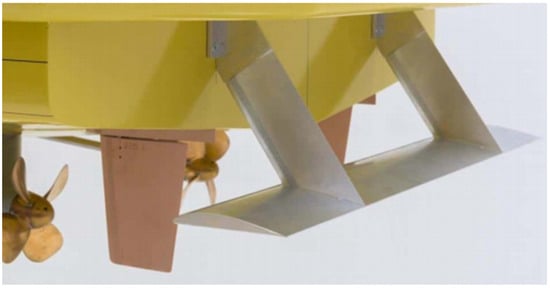
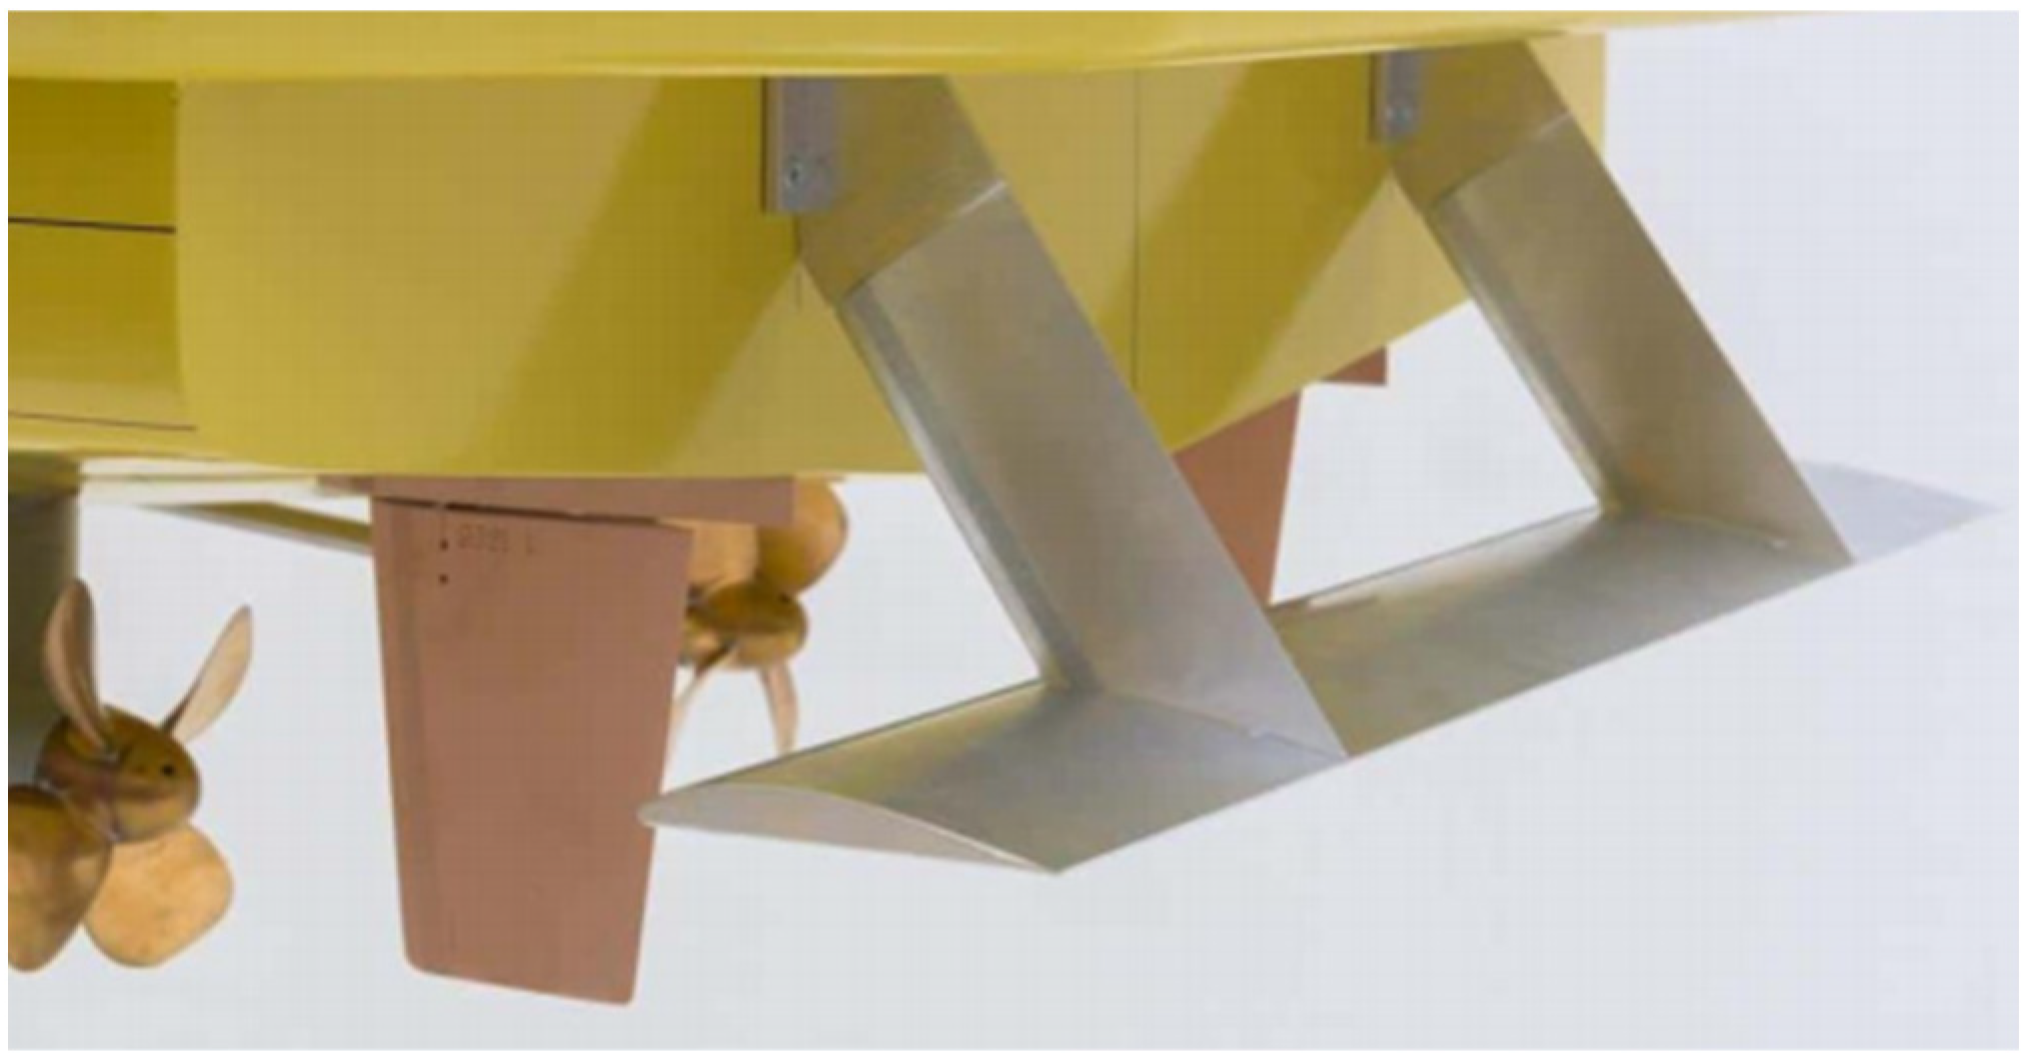
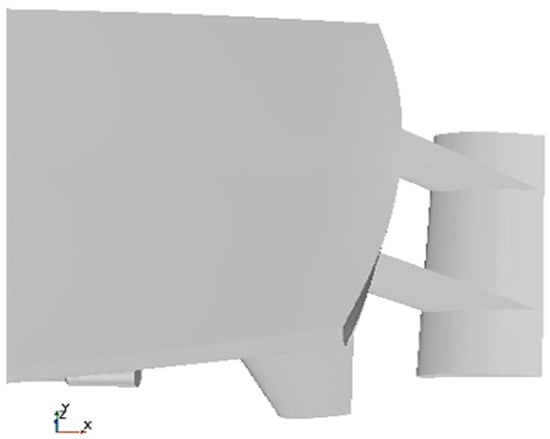
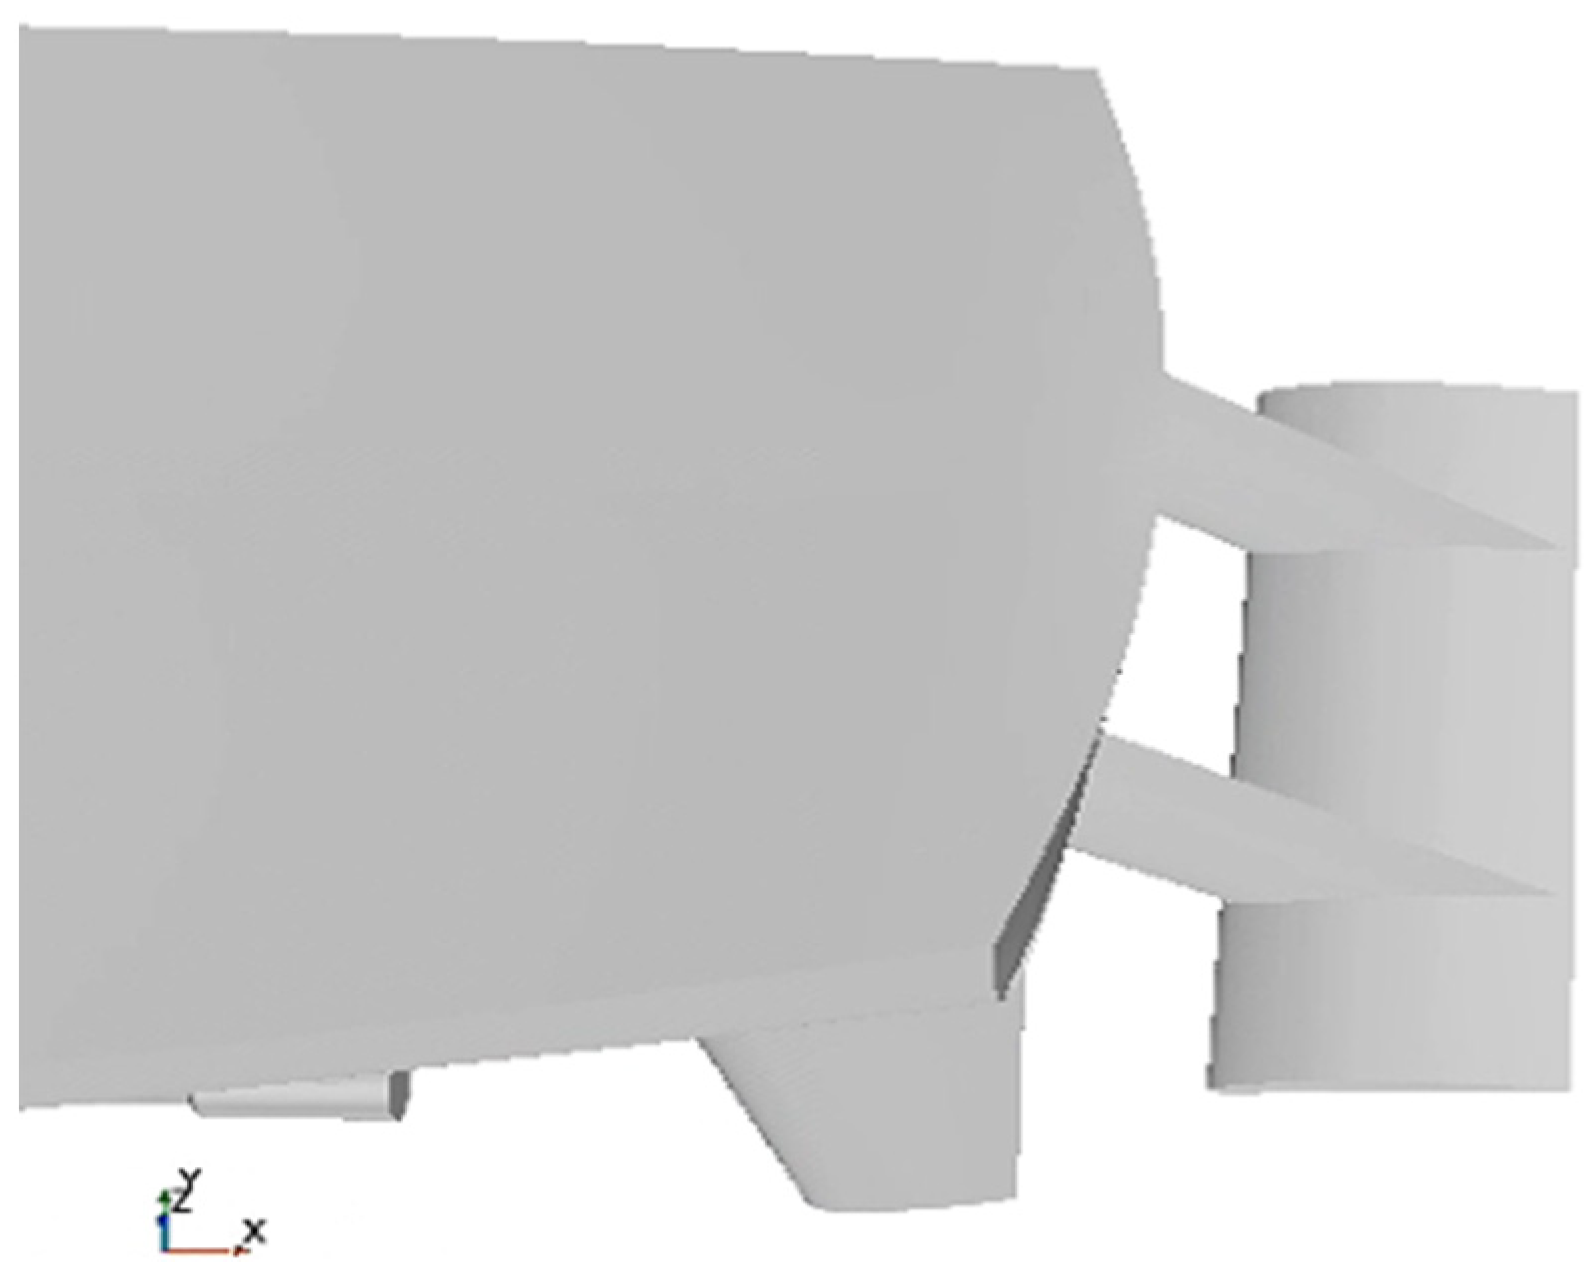
To improve ship energy efficiency and reduce emissions, Van Oossanen et al. [16,17] investigated the application of underwater stern foils at the stern (see Figure 2). Previous studies have shown that underwater stern foils can reduce hydrodynamic resistance and mitigate pitch motion. The independent installation of hydrofoils at the stern dates back to 1992, when it was first applied to a catamaran. Following the first patent application in 2002, research activity in this area increased markedly. Uithof et al. [18,19] analyzed a 50 m AMECRC patrol vessel and reported that the HullVane system achieved a 32.4% drag reduction over speeds from 8.6 to 34.4 knots compared with the original stern configuration. In addition, the system also reduced roll motion and associated added resistance. Dwiputera et al. [20] conducted numerical simulations using CFDSOF to examine stern fins at attack angles of 0°, 1°, 2°, and 5°. Their results showed that for Froude numbers between 0.5 and 0.75, drag reductions of 9–26% were achieved. Kiryanto et al. [21] investigated the use of a NACA 2415 airfoil as a stern hydrofoil. Their results indicated that a single hydrofoil reduced vessel drag, whereas a biplane configuration increased drag. Budiyantowsr et al. [22] combined experiments and numerical simulations to assess the effectiveness of stern fins on a patrol boat. They found that at Froude numbers of 0.6–1.3 and attack angles of 0–3°, total drag was reduced by approximately 26.7%. At an attack angle of 0° and Fr = 0.9, they further identified the optimal hydrofoil installation position for maximizing drag reduction. Murdianto et al. [23] conducted a dedicated investigation into the integration of a rear wing on a high-speed full-draft patrol boat.
Figure 2.
The underwater tail fin.
However, previous studies have focused primarily on the hydrodynamic effects of tail fins, with comparatively little attention given to their influence on ship wake characteristics. In this study, computational fluid dynamics (CFD) is employed to develop a quantitative method for assessing free-surface air entrainment near the hull. Free-surface flow fields with and without tail fins are analyzed using the DTMB 5415 standard hull [24], thereby elucidating their effects on wake formation. In addition, the effects of tail-fin span on hydrodynamic resistance and air entrainment are systematically evaluated over a wide range of speeds. The results of this evaluation, together with the wake analysis, provide preliminary guidance for future tail-fin design optimization studies. Further studies are required to explore a wider range of angles of attack and tail-fin geometries in order to establish robust design criteria.
2. Numerical Calculation Method
The air entrainment volume at the hull’s free surface represents the primary determinant of surface wake intensity. Consequently, the air entrainment volume is employed as the key parameter for quantifying surface foam wake strength. By integrating volume of fluid (VOF) method with an air entrainment model, an analytical framework for free-surface air entrainment quantification was developed, which facilitates the evaluation of wake suppression effectiveness of underwater appendages. The numerical methodology incorporates the following fundamental theories:
2.1. Fluid Control Equations
The fluid around the hull is an incompressible flow based on the RANS equation used to solve the Navier–Stokes equations, as expressed in Equations (1) and (2):
where ui and uj are the averaged Cartesian components of the velocity vector; ρ P μ are the water density, mean pressure, and kinematic viscosity of water, respectively; xi and xj are the spatial coordinate components; t is the time; is the Reynolds stresses. To account more accurately for the effects of wave generation on the hydrodynamic properties of ships, the volume of fluid (VOF) method was used to capture the interface and treat the water surface.
2.2. Volume of Fluid (VOF) Method
The volume of fluid (VOF) method employs the phase volume fraction (α) to distinguish between gas (α = 1), liquid (α = 0), and the gas–liquid interface (0 < α < 1) [25]. By solving the volume fraction transport equation, this method reconstructs and tracks the evolving phase interface based on the computed volume fraction values.
Where the continuity equation is
where Sm,i is volumetric mass source term [kg/(m3·s)], ρi is phase density (kg/m3). At the interface, the physical properties (e.g., density and dynamic viscosity) are determined by volume averaging:
In the VOF method, a single momentum equation and energy equation are solved, and the resulting velocity and temperature fields are shared between phases.
The momentum equation is
where u is speed; p is pressure; the continuous surface tension model (CSF) proposed by Brackbill [20] is as follows:
Interface curvature:
2.3. Air Entrainment Model
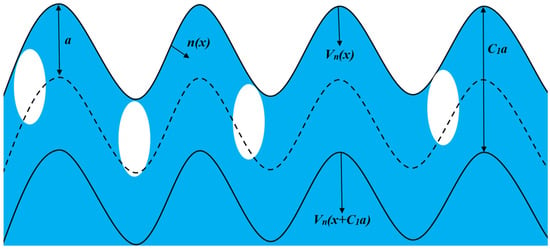
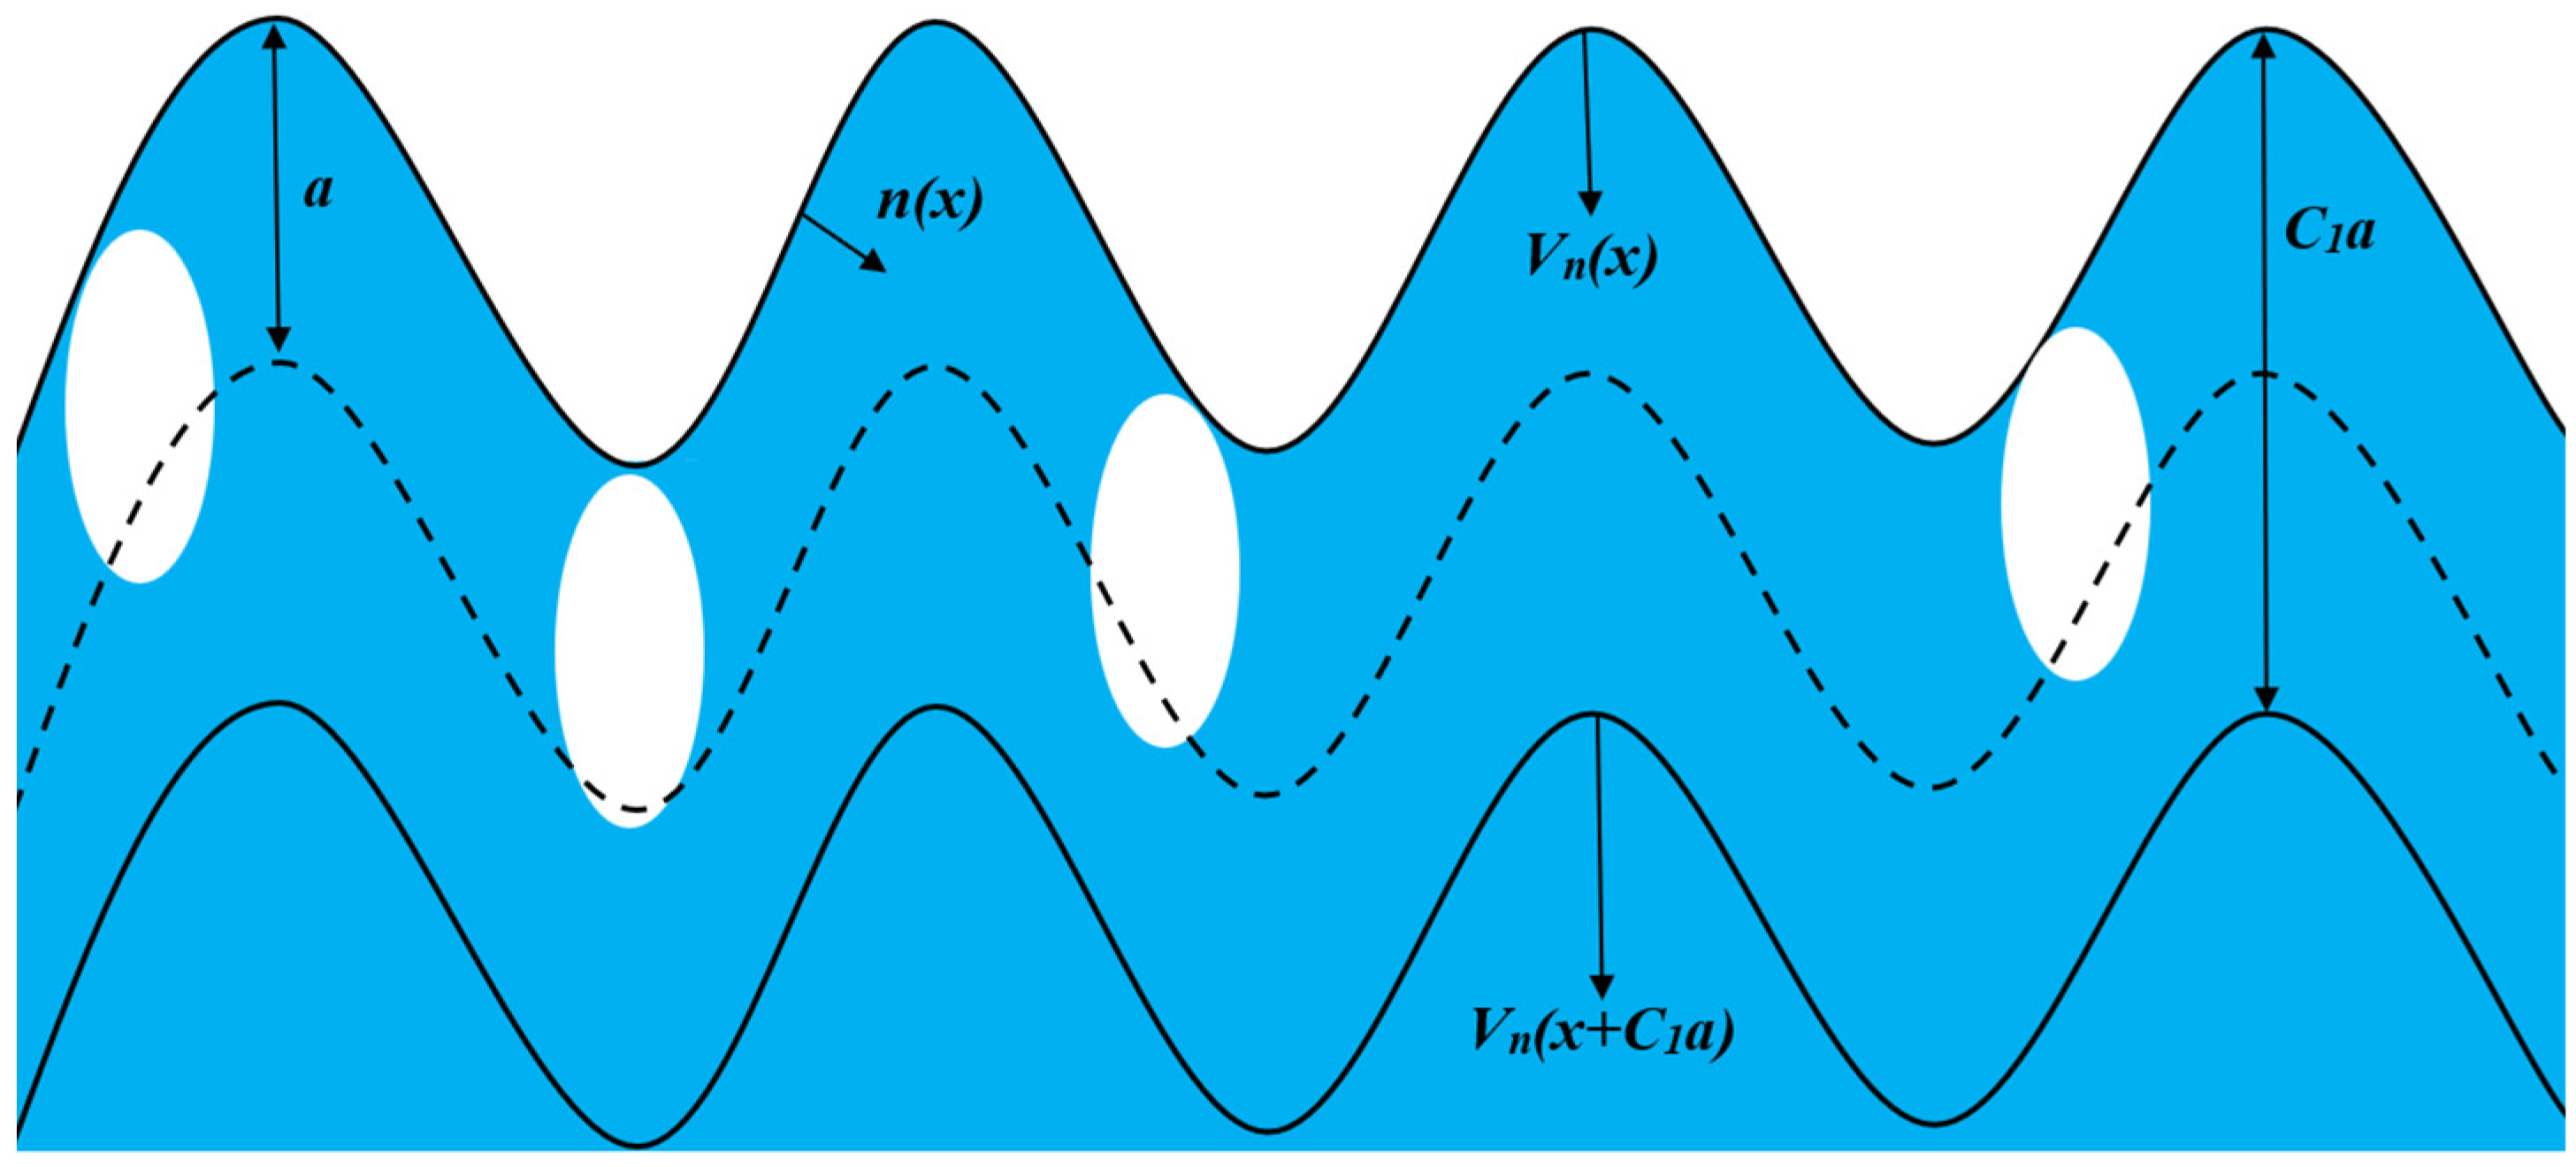
Building upon the air entrainment model for ship flow fields developed by Ma et al. [26] and its CFD implementation by Wan et al. [27], this study performs numerical simulations of free-surface air entrainment around the ship hull. Furthermore, in this paper, the distribution and quantitative numerical simulation of the air entrainment at the free liquid level of ships are achieved by adding the UDF function of the air entrainment model in Star-CCM+. Figure 3 illustrates the mean position of the rough gas–liquid interface. The theoretical framework comprises the following components:
Figure 3.
Air entrainment at the gas–liquid interface.
Each point on this averaged interface is defined by coordinate x, representing the inward-pointing unit normal vector. The normal component of the mean liquid velocity at the interface is denoted as un(x). Liquid turbulence creates rough interfacial fluctuations, generating air cavities with mean size a(x). Entrained air cavities are transported by the liquid flow and rapidly fragment into bubbles. Air entrainment occurs within an interfacial flow layer of thickness where cavity formation takes place. An imaginary surface (dashed line) within the flow layer moves relative to the interface, enabling measurement of the gas flux. The air entrainment rate per unit area and time is given by
The upper horizontal line indicates the population mean. Here, denotes the normal velocity gradient at the free surface, defined as positive when directed from air to water and zero otherwise.
Following a first-order approximation [17], the parameter A is defined as k/g, where k represents the turbulent kinetic energy and g denotes gravitational acceleration. This yields
In this model, entrained air is distributed as a volumetric source within a liquid layer of thickness, where represents the entrainment height. Consequently, the air entrainment rate per unit volume and time is expressed as
3. Results
3.1. Computational Model
This study investigates wake suppression using underwater stern appendages, employing the DTMB 5415 hull—a scaled model of the U.S. Navy’s DDG-51 destroyer. The hull features a bulbous bow and transom stern configuration. With a scale ratio of 1:24.824, Table 1 compares principal dimensions between prototype and model, while Figure 4 illustrates the 3D geometry.
Table 1.
DTMB 5415 geometry.
Figure 4.
The model of the DTMB 5415.
The underwater stern foil is an appendage structure extending aft of the ship beneath the tail fins seal plate. The airfoil section length is termed chord length (l), while the tail fins length along the ship’s beam is designated as span length (L) [28]. Typically, the aft span of a square tail fins is marginally smaller than the tail fins seal plate width, with an aspect ratio ranging between 3 and 5. Accordingly, this study investigates four underwater tail fins fin configurations with varying lengths: 395 mm, 445 mm, 495 mm, and 545 mm—the latter being slightly less than the tail fins seal plate width. Reference [16] elaborately discusses the influence of the length of the underwater tail fins fin and the angle of attack on the drag of a ship, and determines that when the angle of attack is 2°, the underwater tail fins fin have the best drag reduction effect on the ship [28]. These lengths correspond to 6.91%, 7.78%, 8.65%, and 9.53% of the ship’s length, respectively. The airfoil employs a NACA 4406 profile, with positive angle of attack defined as the leading edge being lower than the trailing edge. Figure 5 illustrates the installation configuration, Figure 6 depicts the airfoil profile, and Table 2 summarizes the key parameters.
Figure 5.
Model of the tail fin of DTMB 5415.
Figure 6.
Tail fin profile of NACA 4406.
Table 2.
Parameters of The Underwater Tail Fin Model for The Ship.
3.2. Mesh Resolution
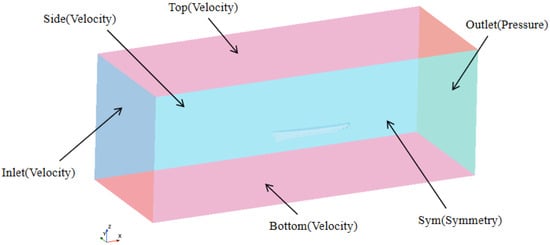
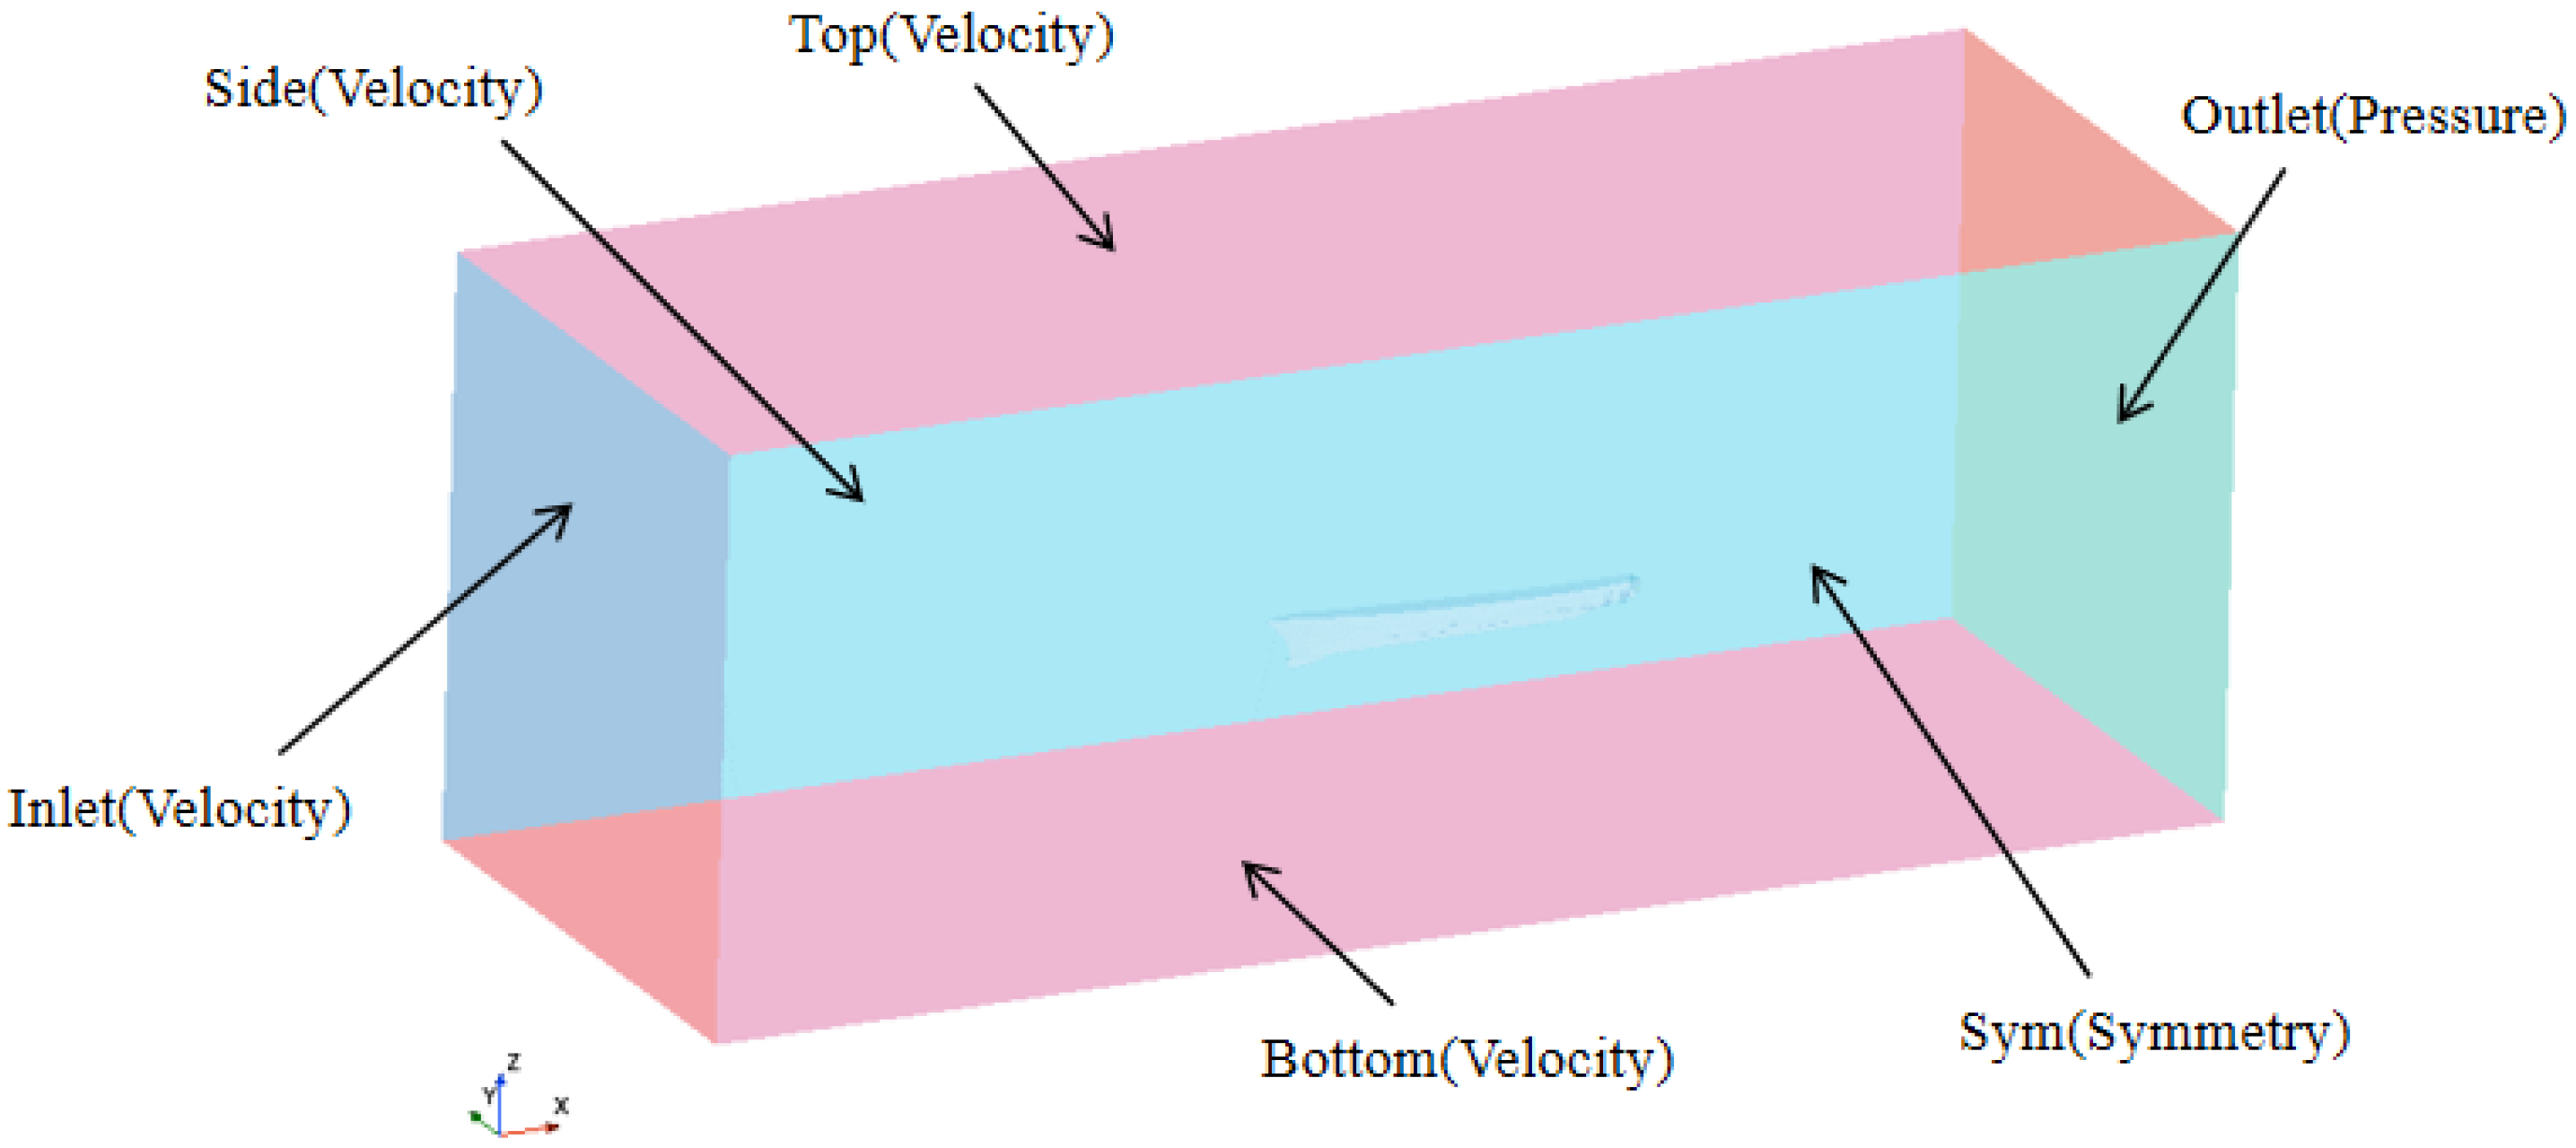
Considering the symmetry of the ship model, only the half side ship model installed with underwater stern foil is meshed–divided in this paper, and the dimensions of each side’s upward calculation domain are as follows: −1.5 < x/Lpp < 2.5, −1.5 < y/Lpp < 0, −2.0 < z/Lpp < 0.5. As shown in Figure 7, the boundary conditions of the calculation domain are Inlet, Top, Sym, and Bottom are set as velocity inlet. Side is set as symmetric planes; the Outlet is set to the pressure outlet.
Figure 7.
Computational domain and boundary conditions.
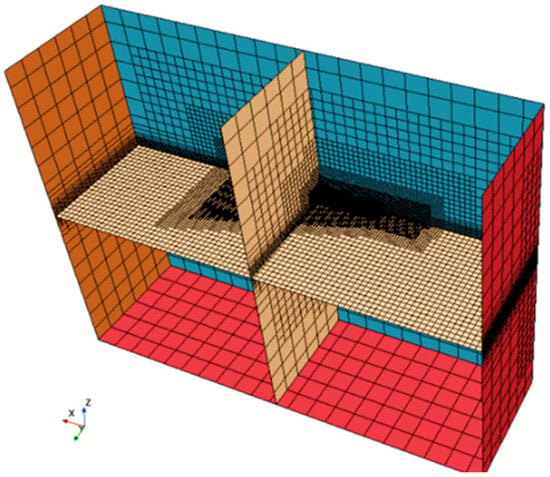
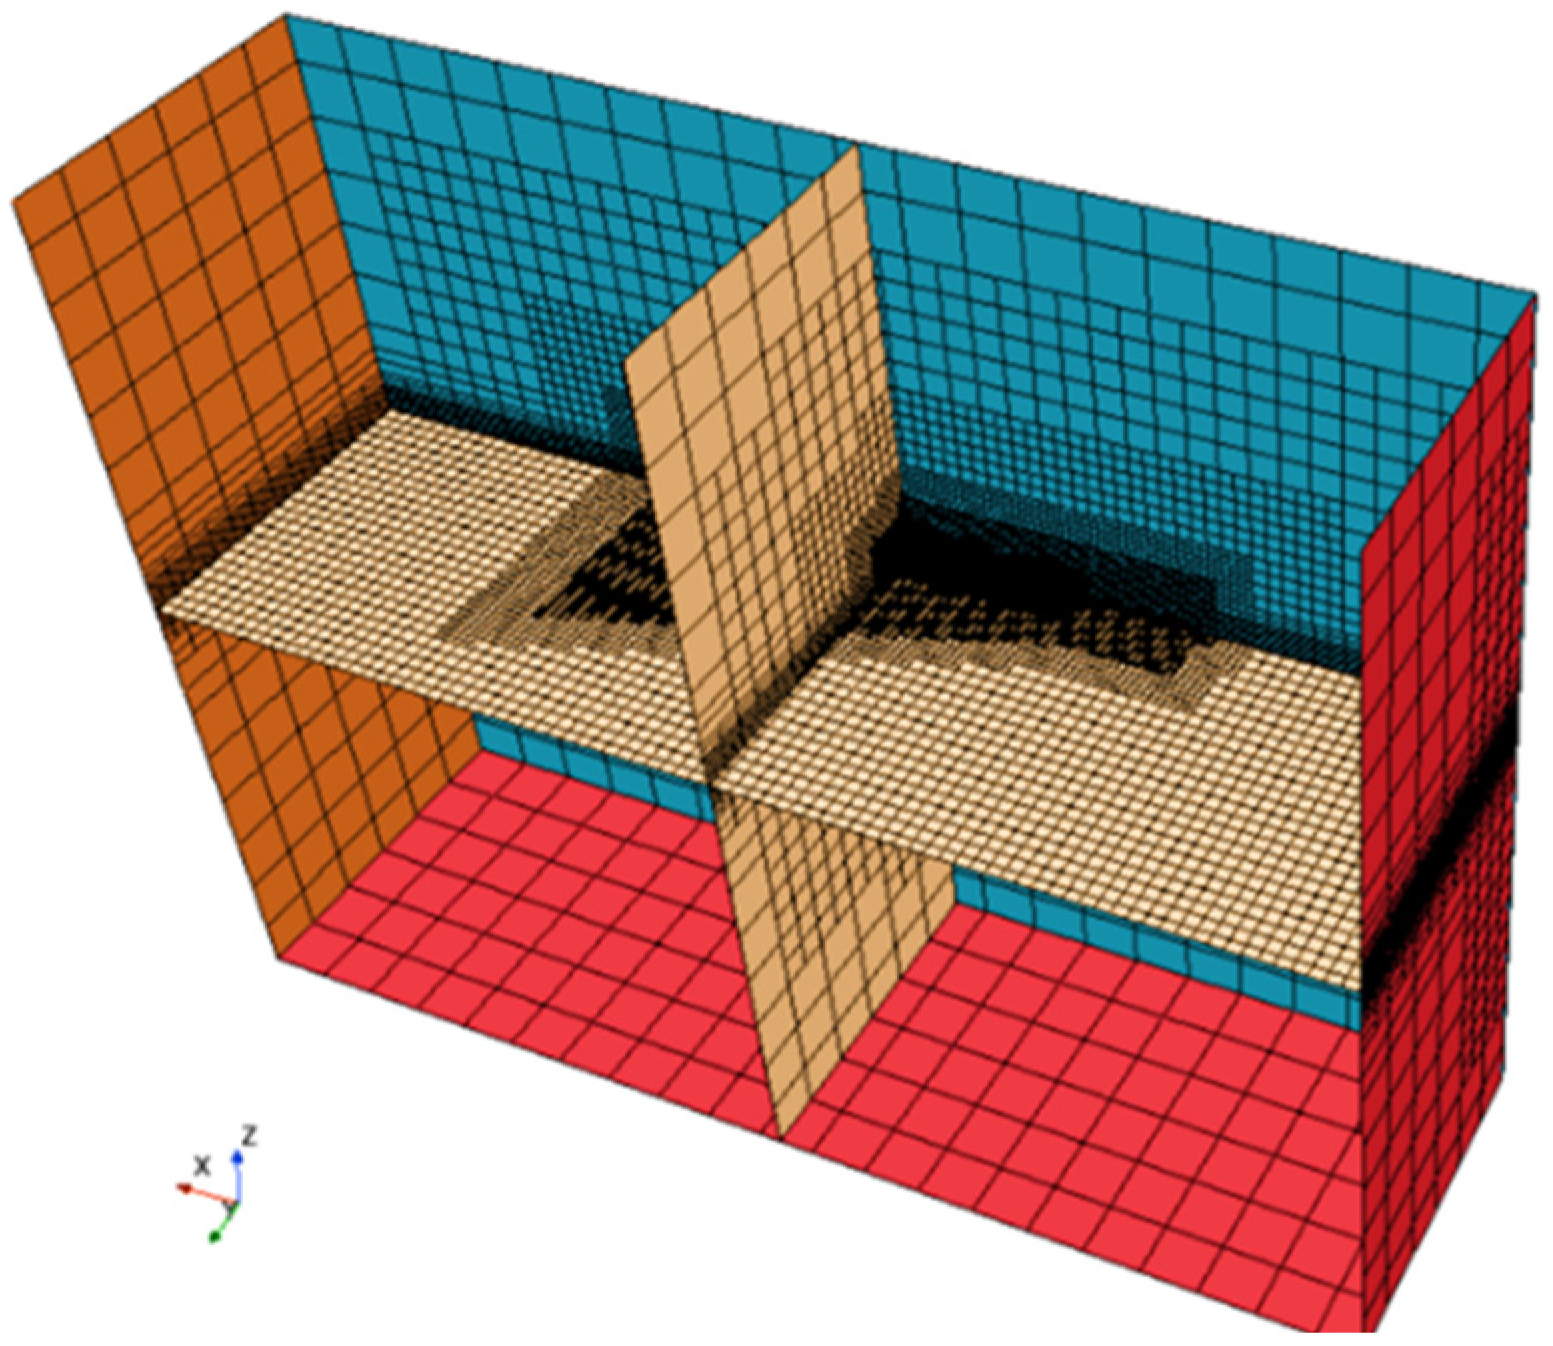
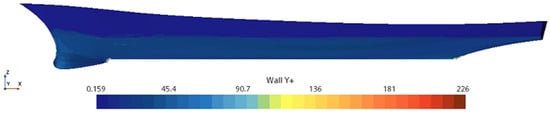
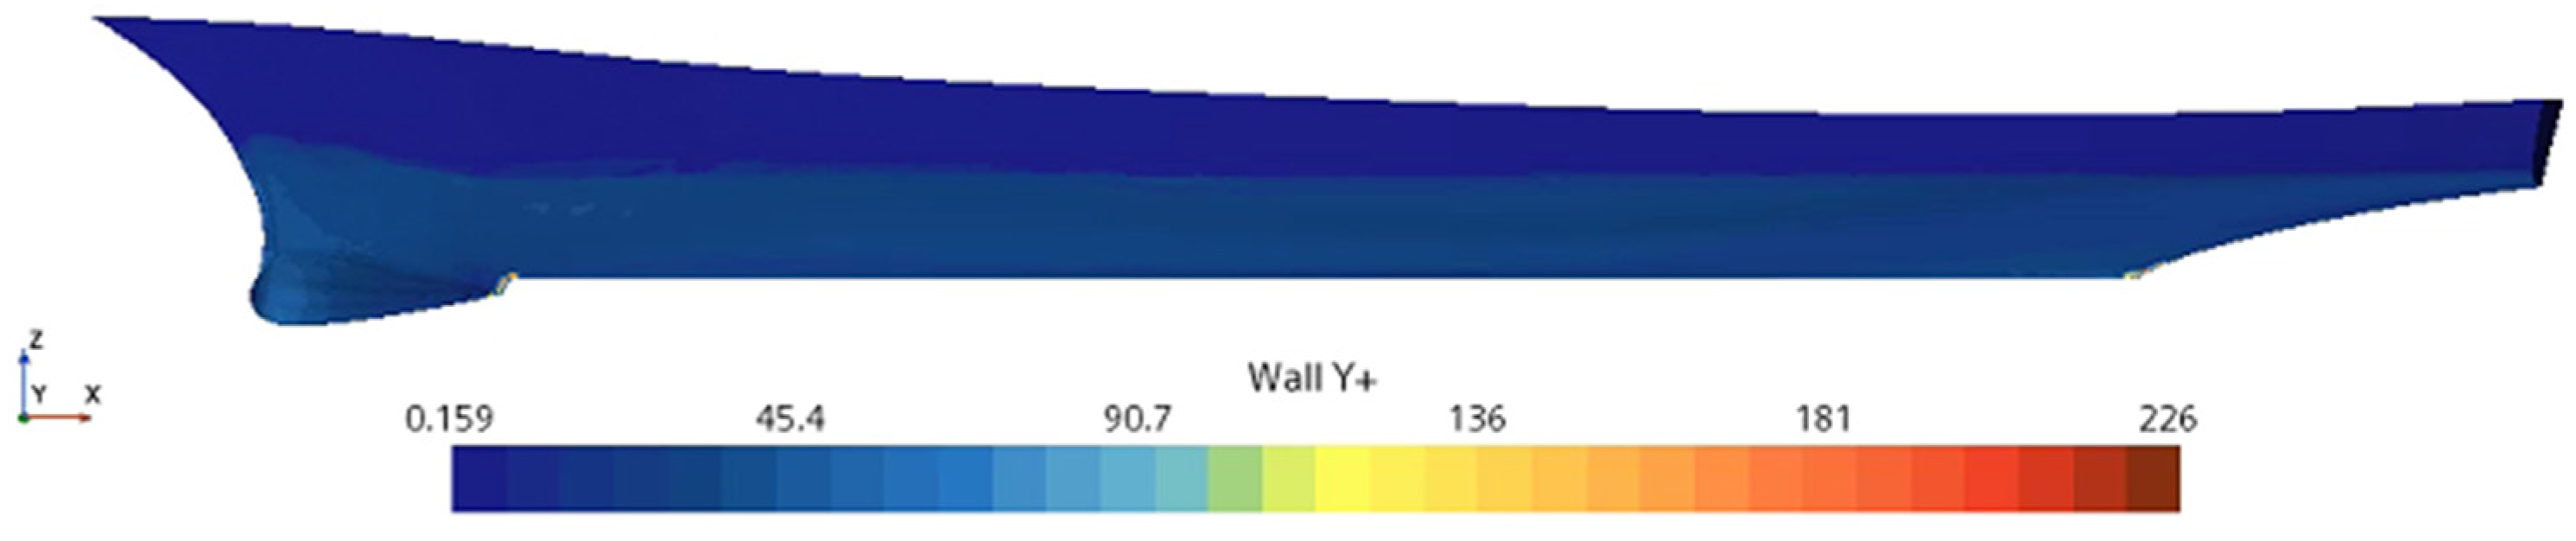
STAR-CCM+(16.01) software was used to reconstruct the surface mesh of the hull and the underwater tail fins model, and a well-triangular surface mesh was generated. Based on the surface mesh, a body mesh containing prismatic layer and cut body mesh was generated, and areas such as the bow, underwater tail fins, free liquid surface, and Kelvin wave system were refined. The total thickness of the boundary layer mesh is 7.05 mm, the number of prism layers within the boundary layer is eight. The overall grid division is shown in Figure 7 and Figure 8. The y+ value is controlled within 30~100 (see Figure 9).
Figure 8.
Computational domain and grid division.
Figure 9.
The distribution of y+ along the hull.
3.3. Validation of Numerical Simulation
To validate the grid topology and assess the computational domain discretization quality, three grid sets (G1–G3) with identical topology were generated for the DTMB 5415 ship model. At Fr = 0.28, the resistance coefficient (CT) and the free-surface air entrainment (Q) were computed for the DTMB 5415 hull. The results are presented in Table 3. It shows good agreement between numerical and experimental resistance coefficients, with errors decreasing as grid density increases. The G2 and G3 grids achieve errors below 1%. For the three grid solutions (S1–S3), the convergence ratio RG = (S2 − S1)/(S3 − S2) yields 0.4383 for both resistance coefficient and air entrainment. The condition 0 < RG < 1 confirms monotonic grid convergence [29]. At Fr = 0.28, all three grid sets demonstrate acceptable computational errors. Based on computational efficiency and accuracy trade-offs, the G2 grid (4.95 million cells) was selected for subsequent analyses.
Table 3.
Grid independence study results.
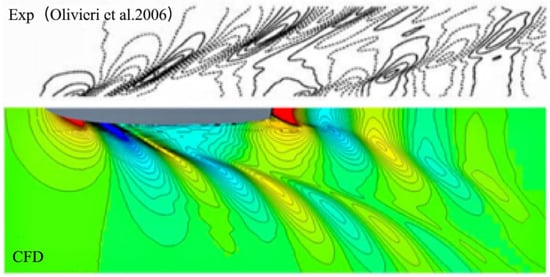
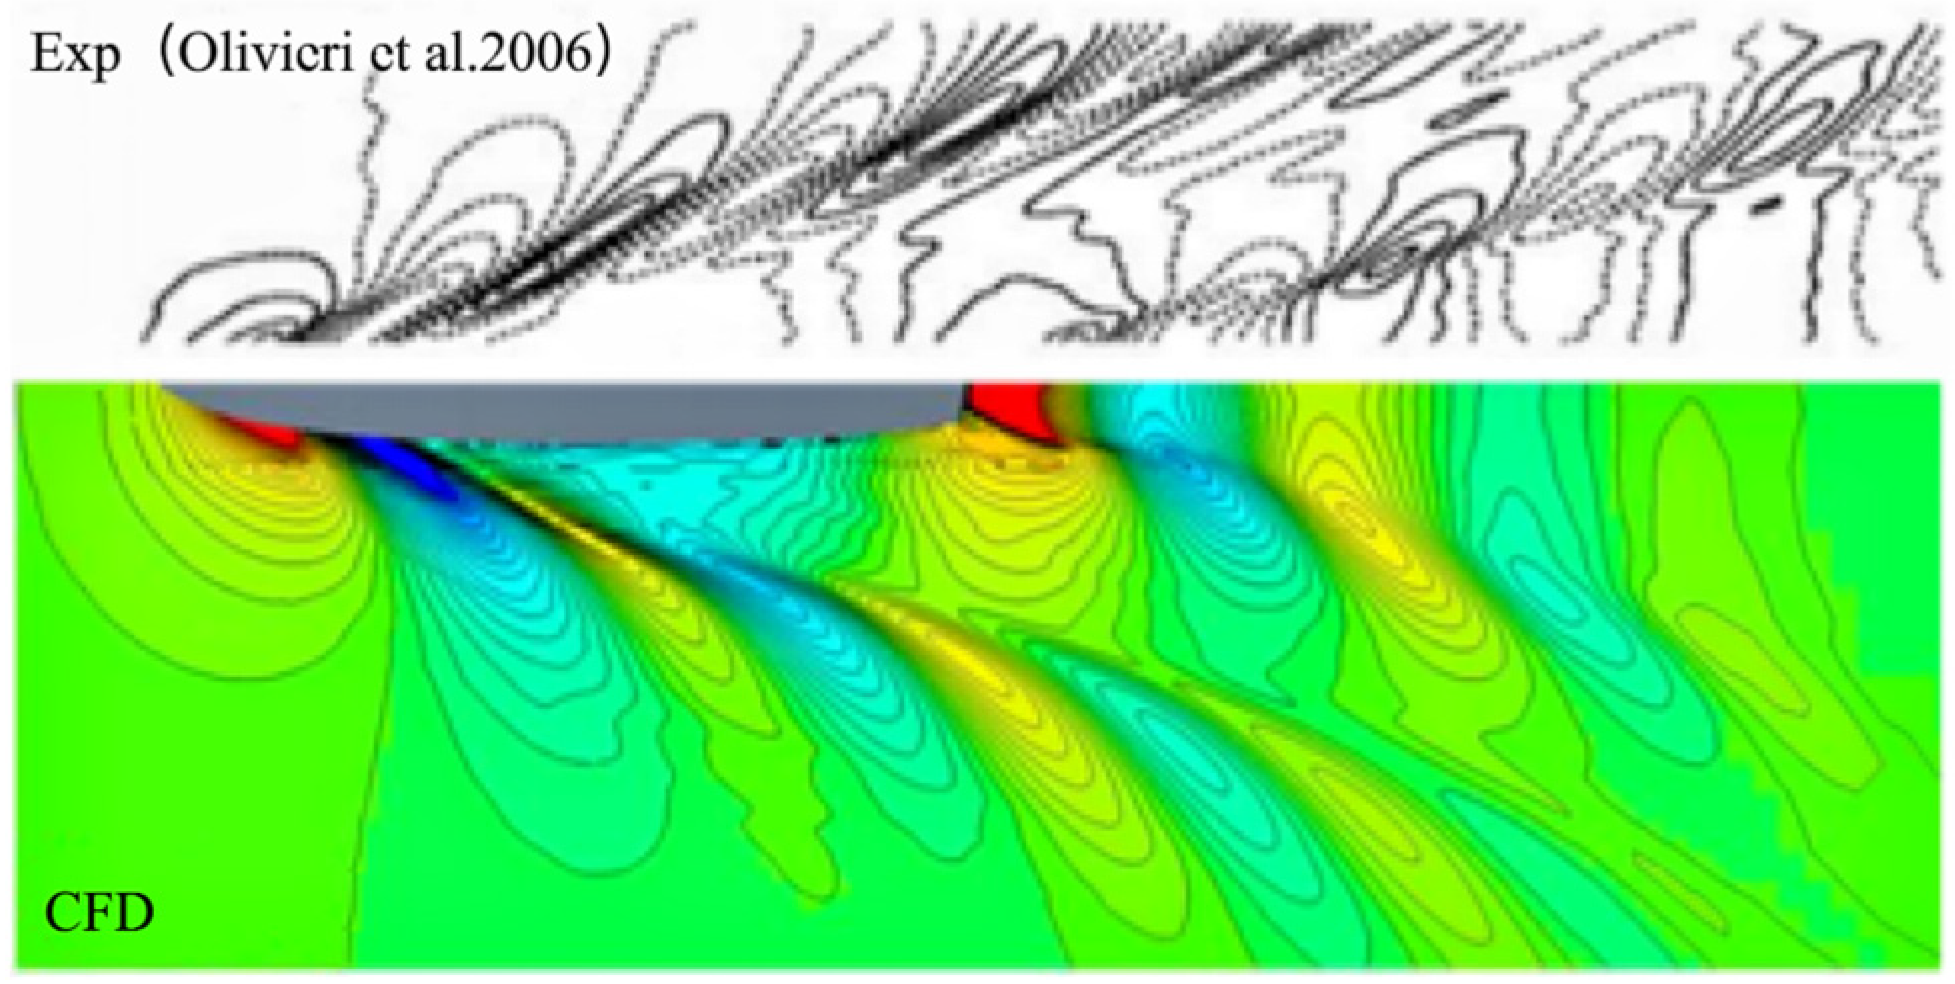
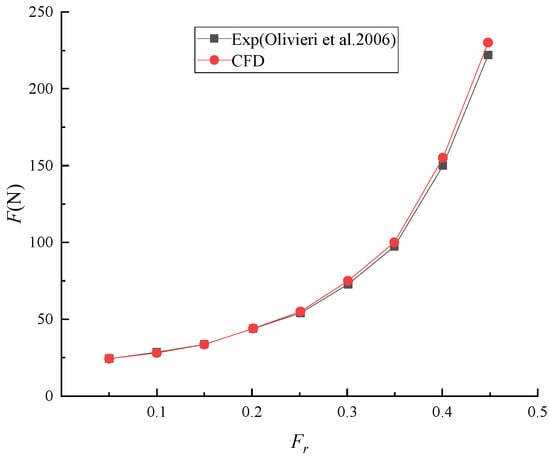
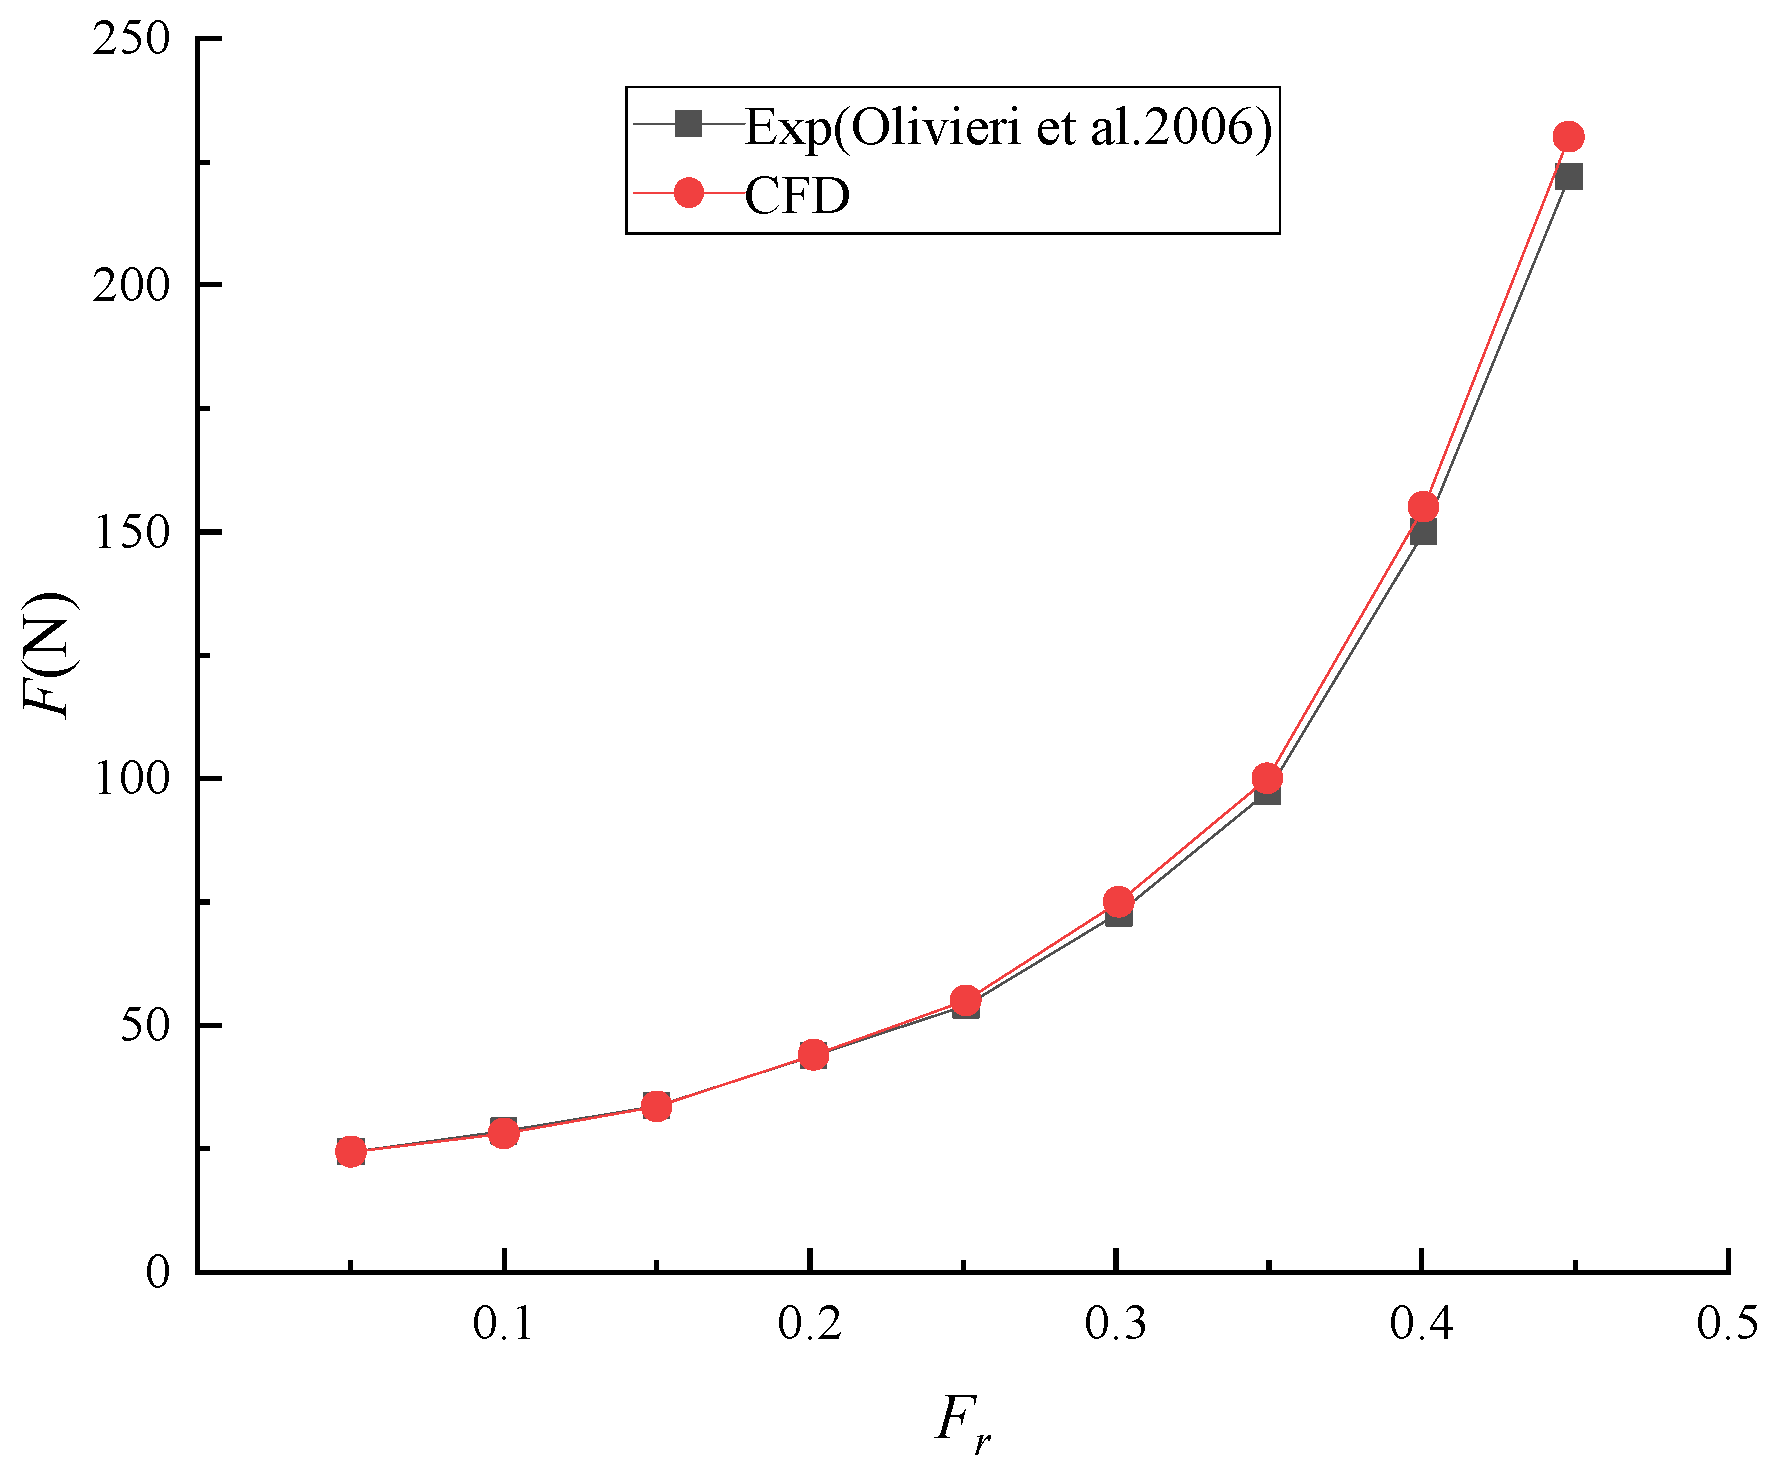
The contours of the DTMB5415 ship model at cruising speed were obtained by the measuring equipment of the relevant free liquid surface waveform in ITTC Pool [30]. The comparison between the contours of the free liquid surface calculated by the three sets of grids, respectively, at cruising speed and the measured results of the ITTC pool is shown in Figure 10. Direct measurement of air volume proves challenging in model-scale testing. To validate the numerical methodology, this study compares and analyses resistance data obtained from both numerical simulations and experimental tests. The benchmark experimental data for numerical validation were obtained from ITTC towing tank tests [24,30], with detailed comparisons presented in Figure 11. It demonstrates good agreement between numerical and experimental resistance trends, with calculated values consistently slightly higher than measured values. Quantitative analysis reveals, at cruising speeds (Fr = 0.25–0.35), the discrepancy is approximately 1.2%. This difference shows an increasing trend with speed but remains below 5%. Thus, the numerical results demonstrate sufficient accuracy for ship model resistance prediction.
Figure 10.
Waveform contours when Fr = 0.28 [24].
Figure 11.
Resistance coefficient comparison when Fr = 0.28 [24].
4. Discussion
4.1. Investigation of Ship Speed Effects on Air Entrainment Volume
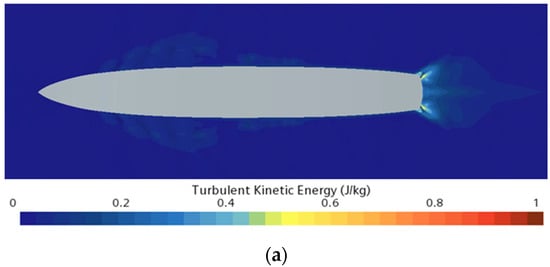
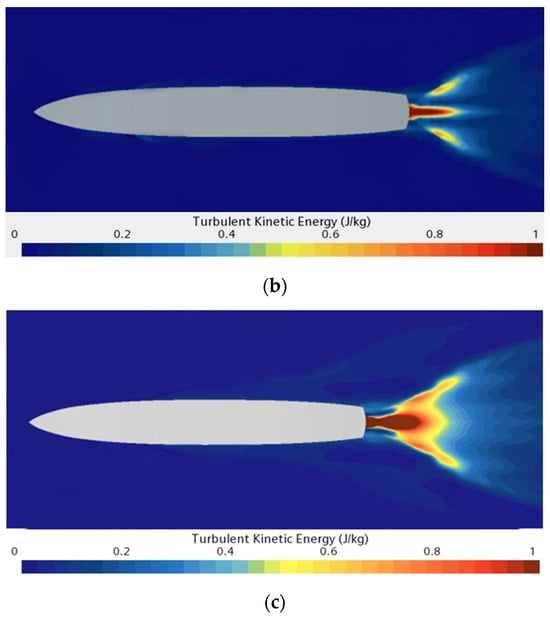
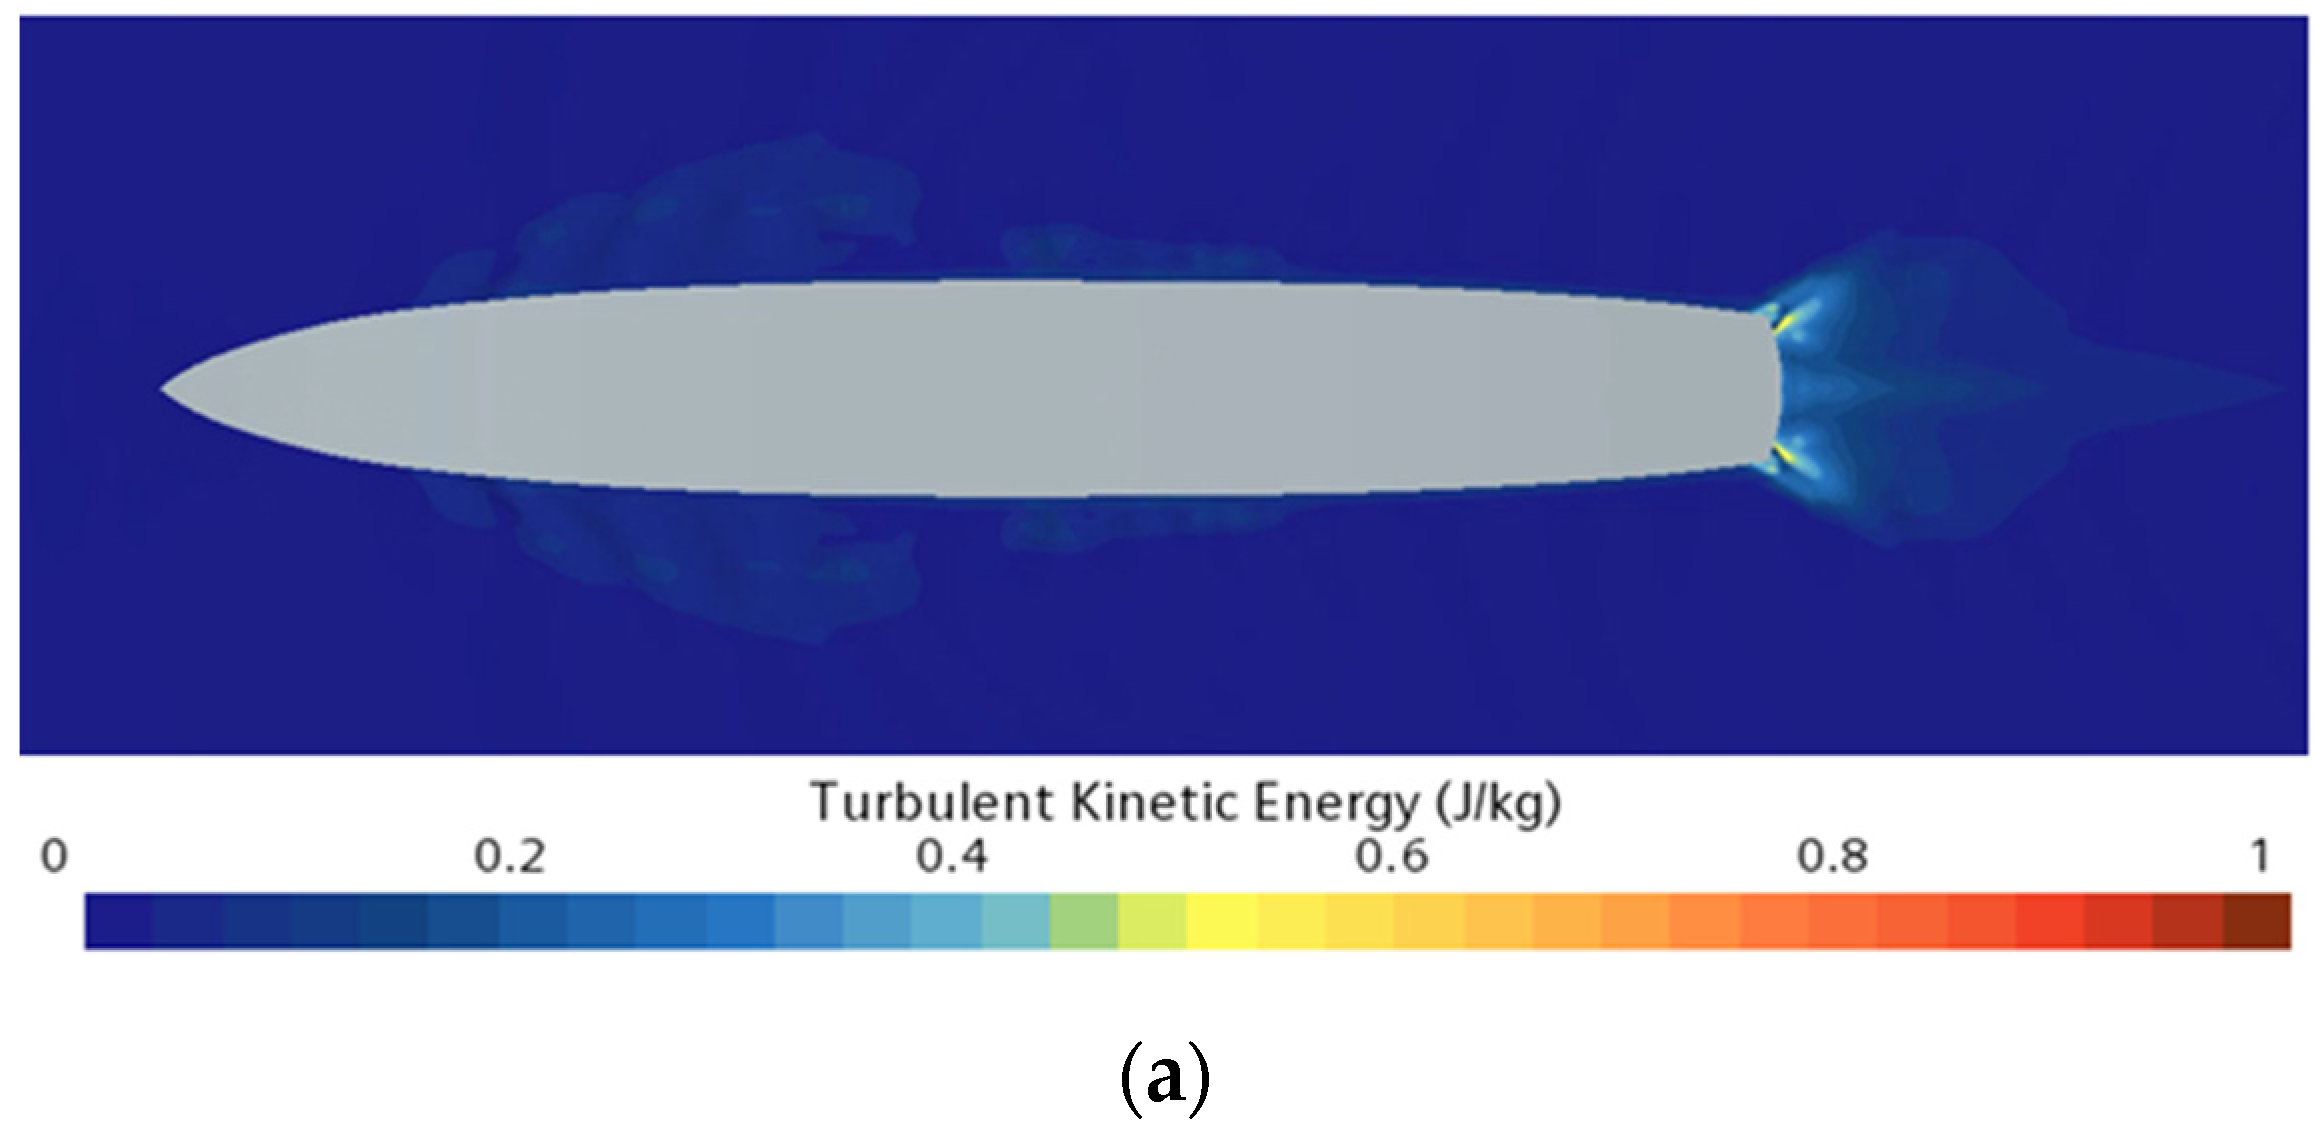
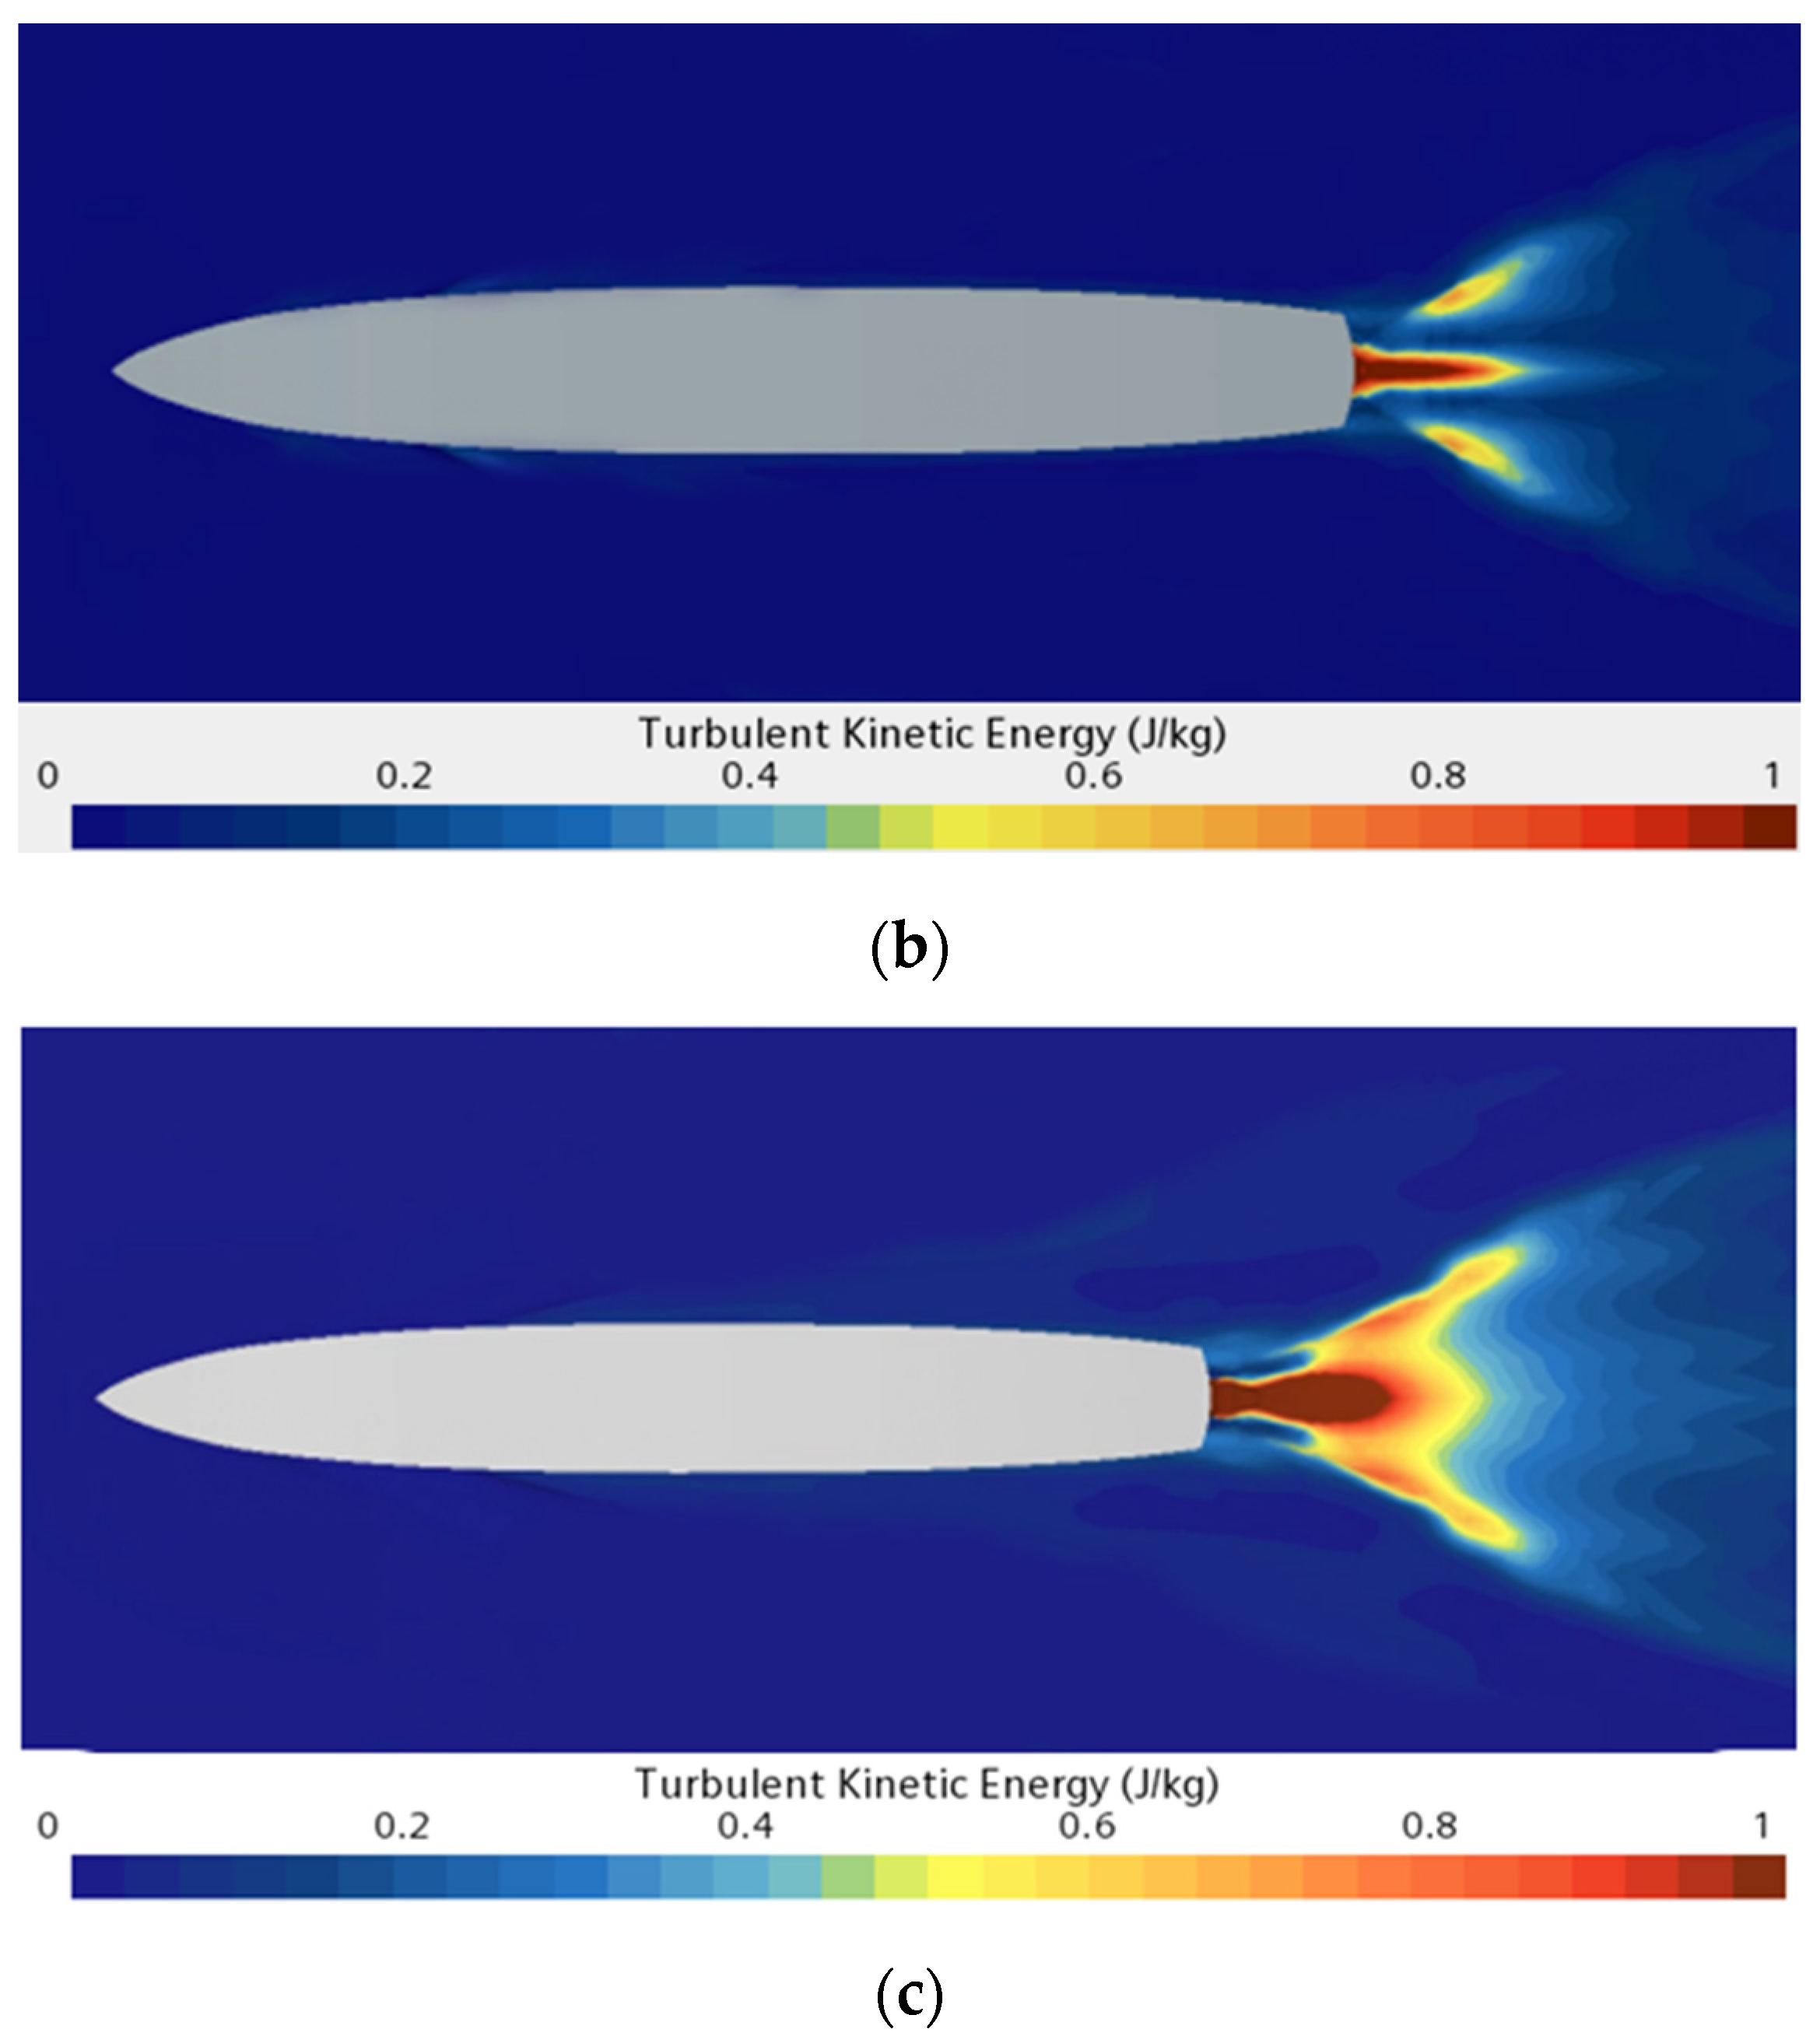
This study numerically investigates free-surface dynamics and air entrainment characteristics at various ship speeds. Three Froude numbers (Fr = 0.15, 0.28, and 0.45) were selected for analysis. Figure 12 presents the free-surface turbulent kinetic energy distributions near the hull at different speeds. The turbulent kinetic energy predominantly concentrates near the stern region. As speed increases, both the magnitude and spatial extent of turbulent kinetic energy near the stern exhibit significant enhancement. The air entrainment rate Q per unit volume–time demonstrates strong dependence on turbulent kinetic energy. A positive correlation exists between air entrainment and turbulent kinetic energy. Consequently, higher speeds promote air entrainment at the stern, resulting in more pronounced foam wakes.
Figure 12.
Free-surface turbulent kinetic energy distributions at varying ship speeds. (a) Fr = 0.15, (b) Fr = 0.28, (c) Fr = 0.35.
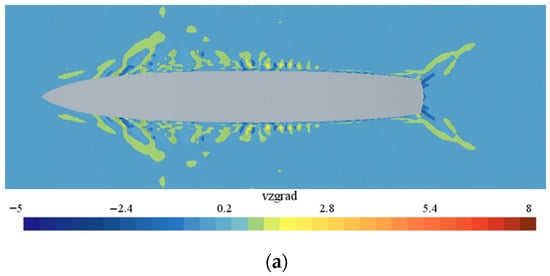
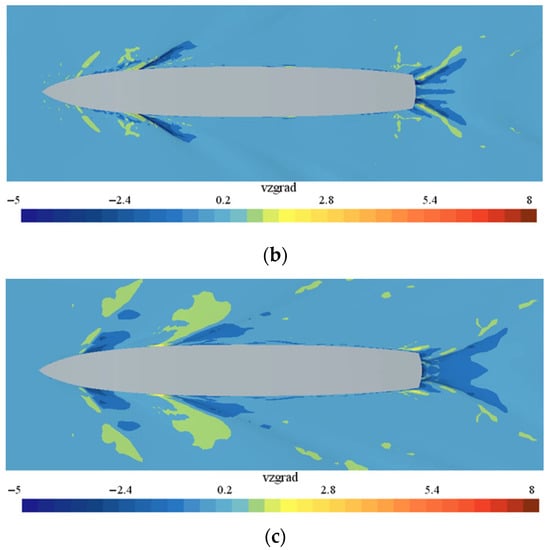
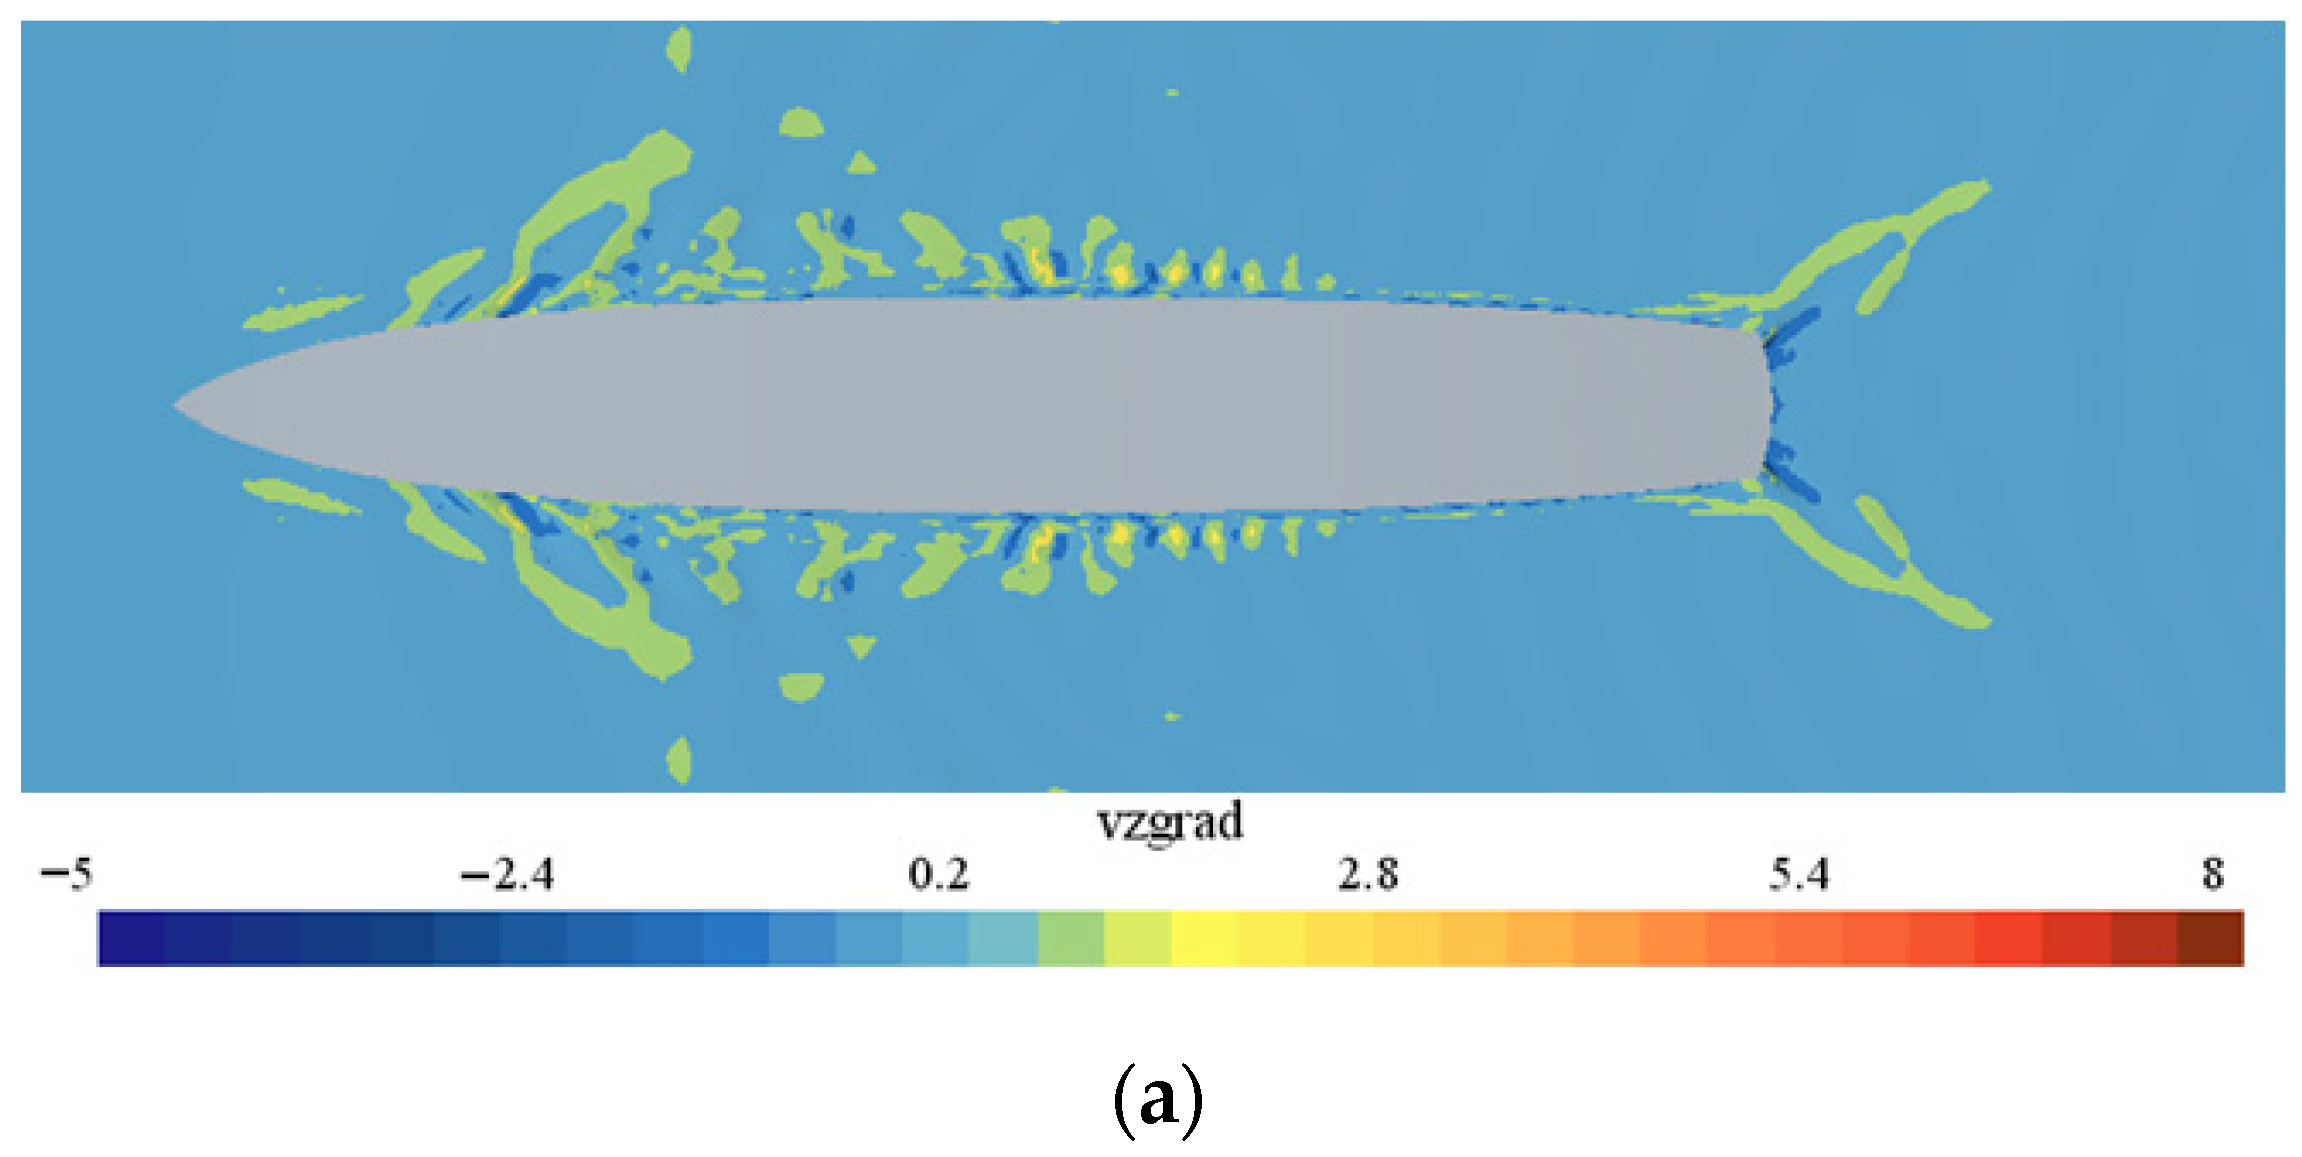
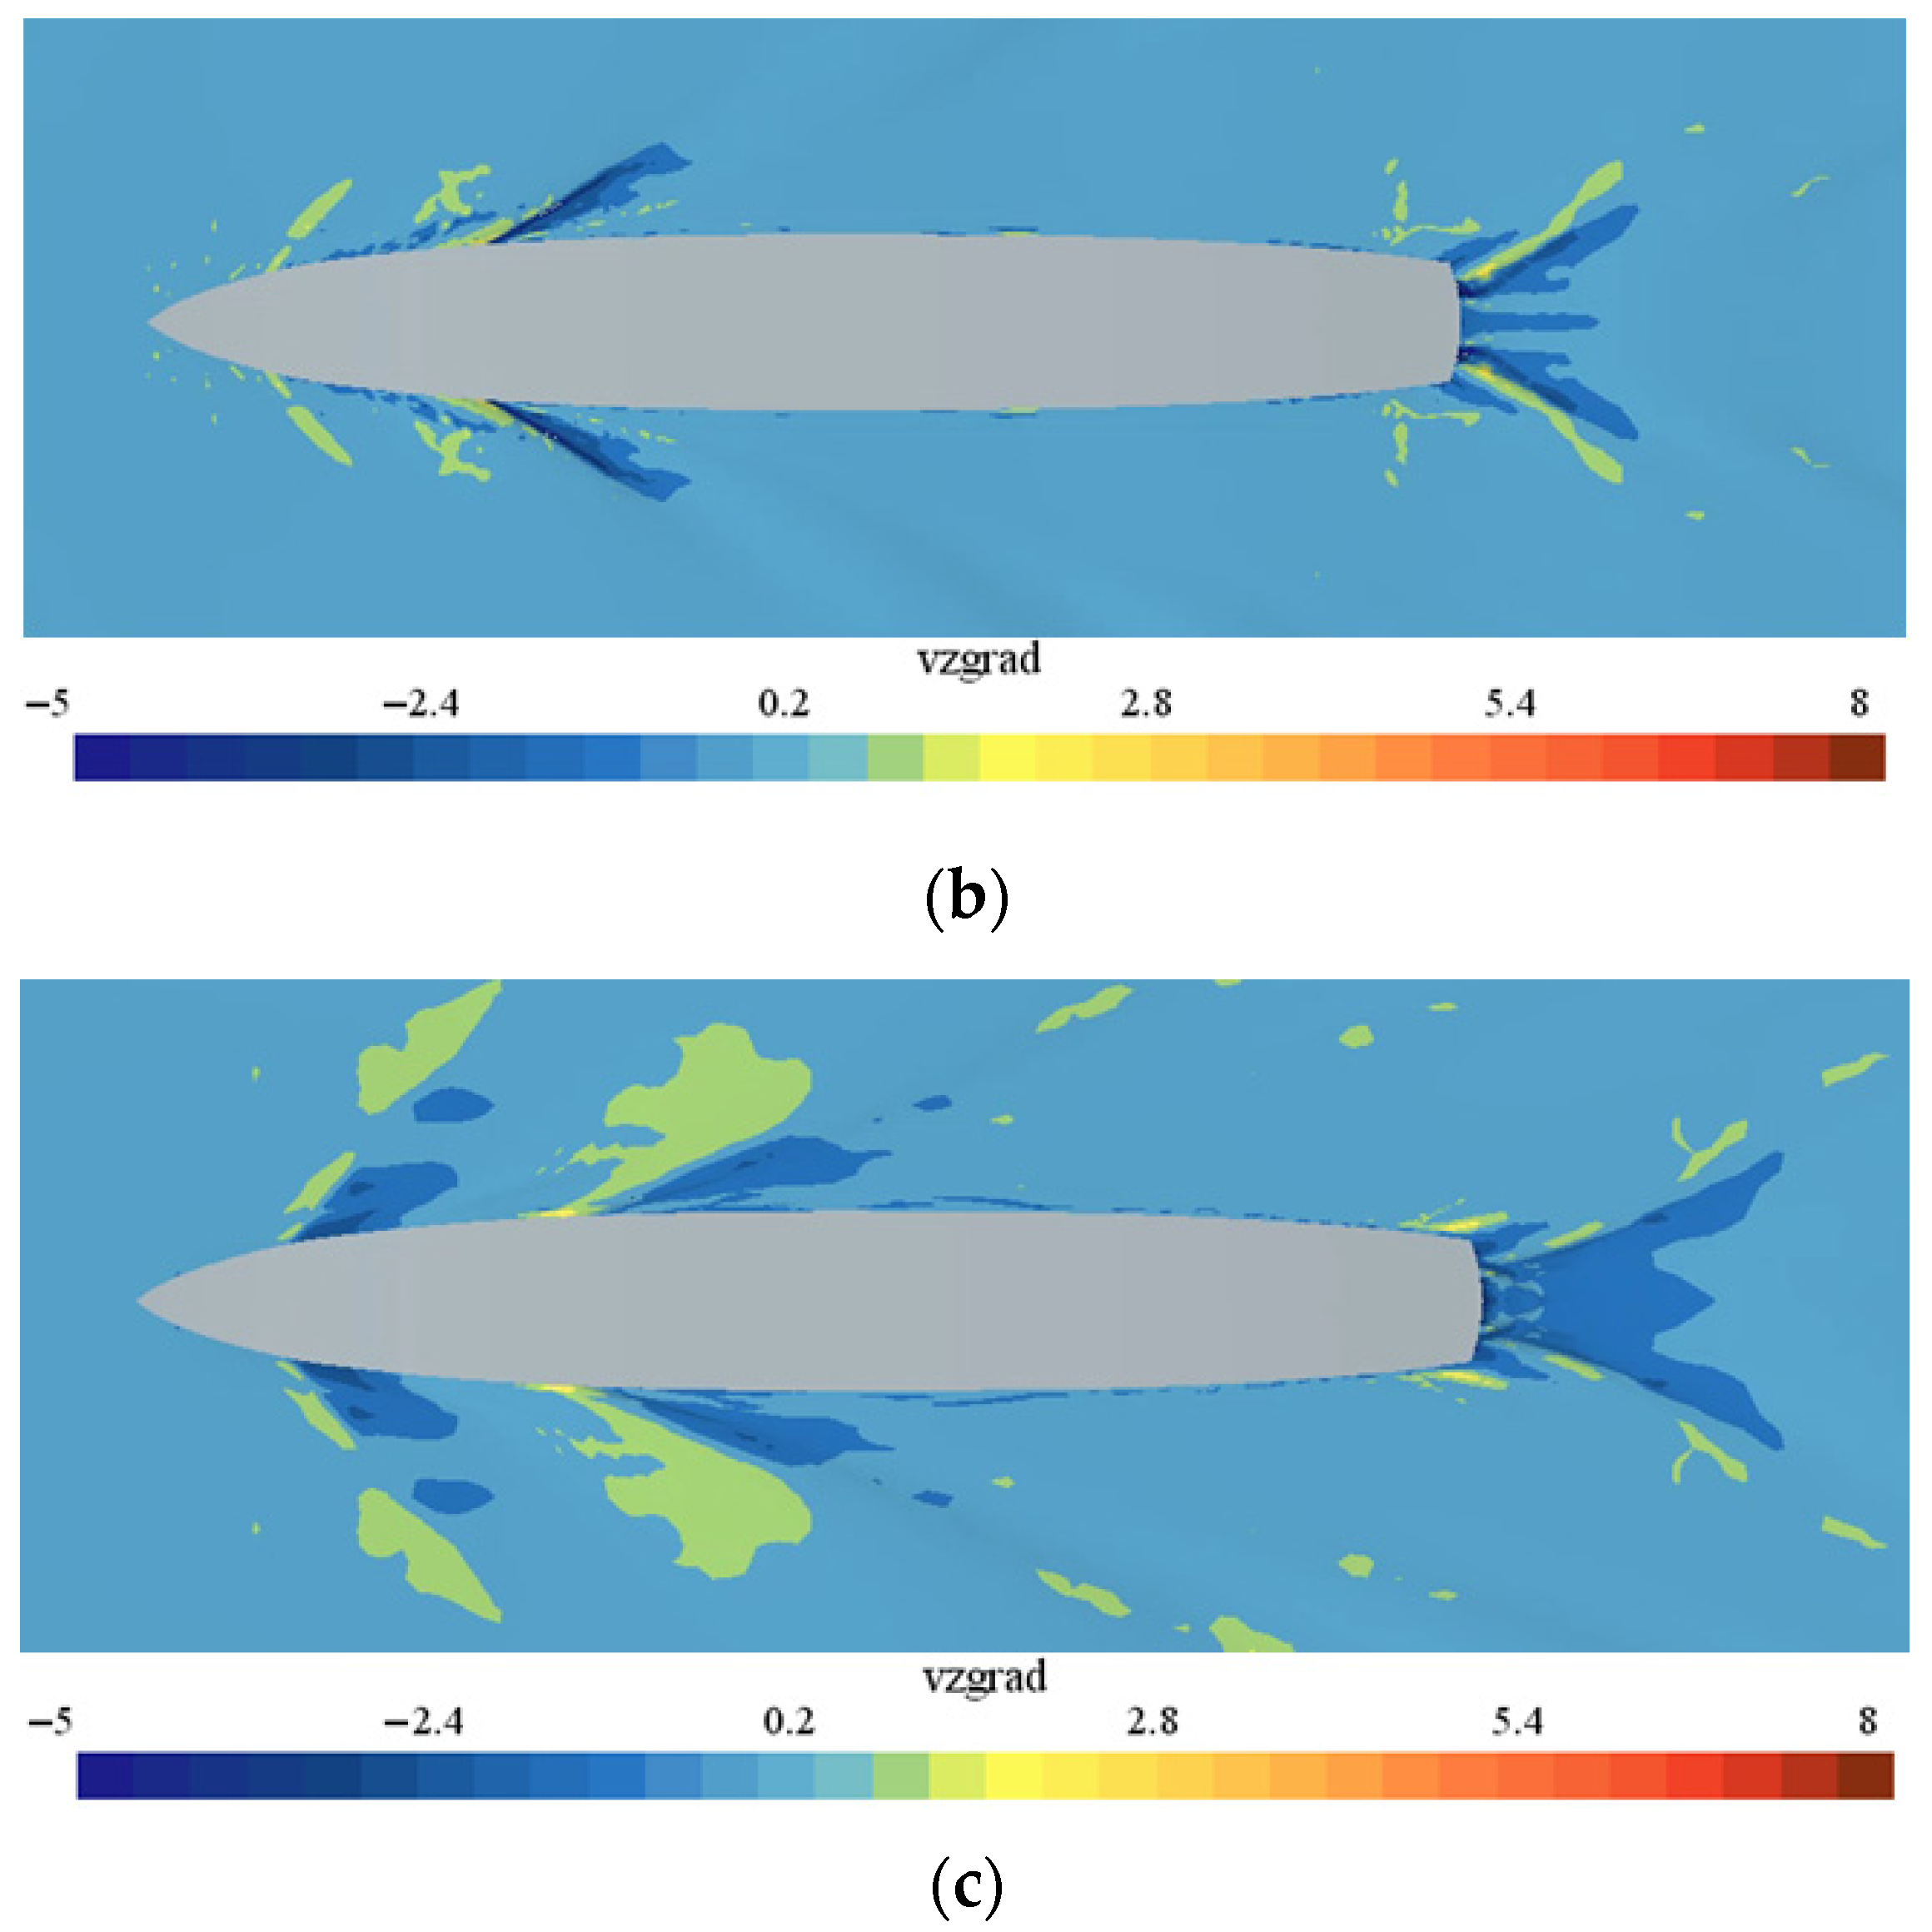
Figure 13 presents the vertical velocity gradient distributions along the free surface at various speeds. For all three speeds, regions with negative vertical velocity gradients exhibit greater spatial extent than positive gradient regions. Negative values indicate downward-directed gradients (air-to-water direction) in the reference coordinate system, corresponding to air entrainment. Thus, negative gradient regions represent downward air-entraining flows. These downward flows entrain air into the water column, promoting foam wake formation. Furthermore, both bow and stern entrainment regions expand markedly with increasing speed, demonstrating strong speed dependence.
Figure 13.
Free-surface downward velocity gradient distributions at varying ship speeds. (a) Fr = 0.15, (b) Fr = 0.28, (c) Fr = 0.35.
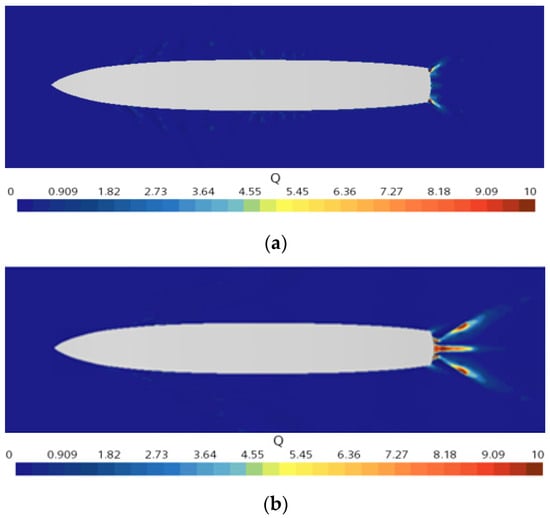
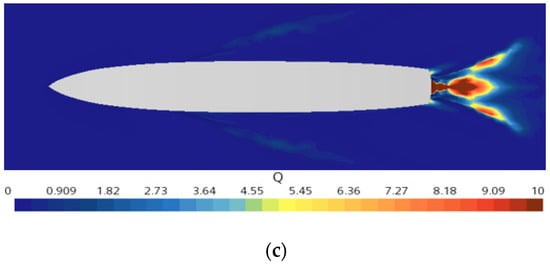
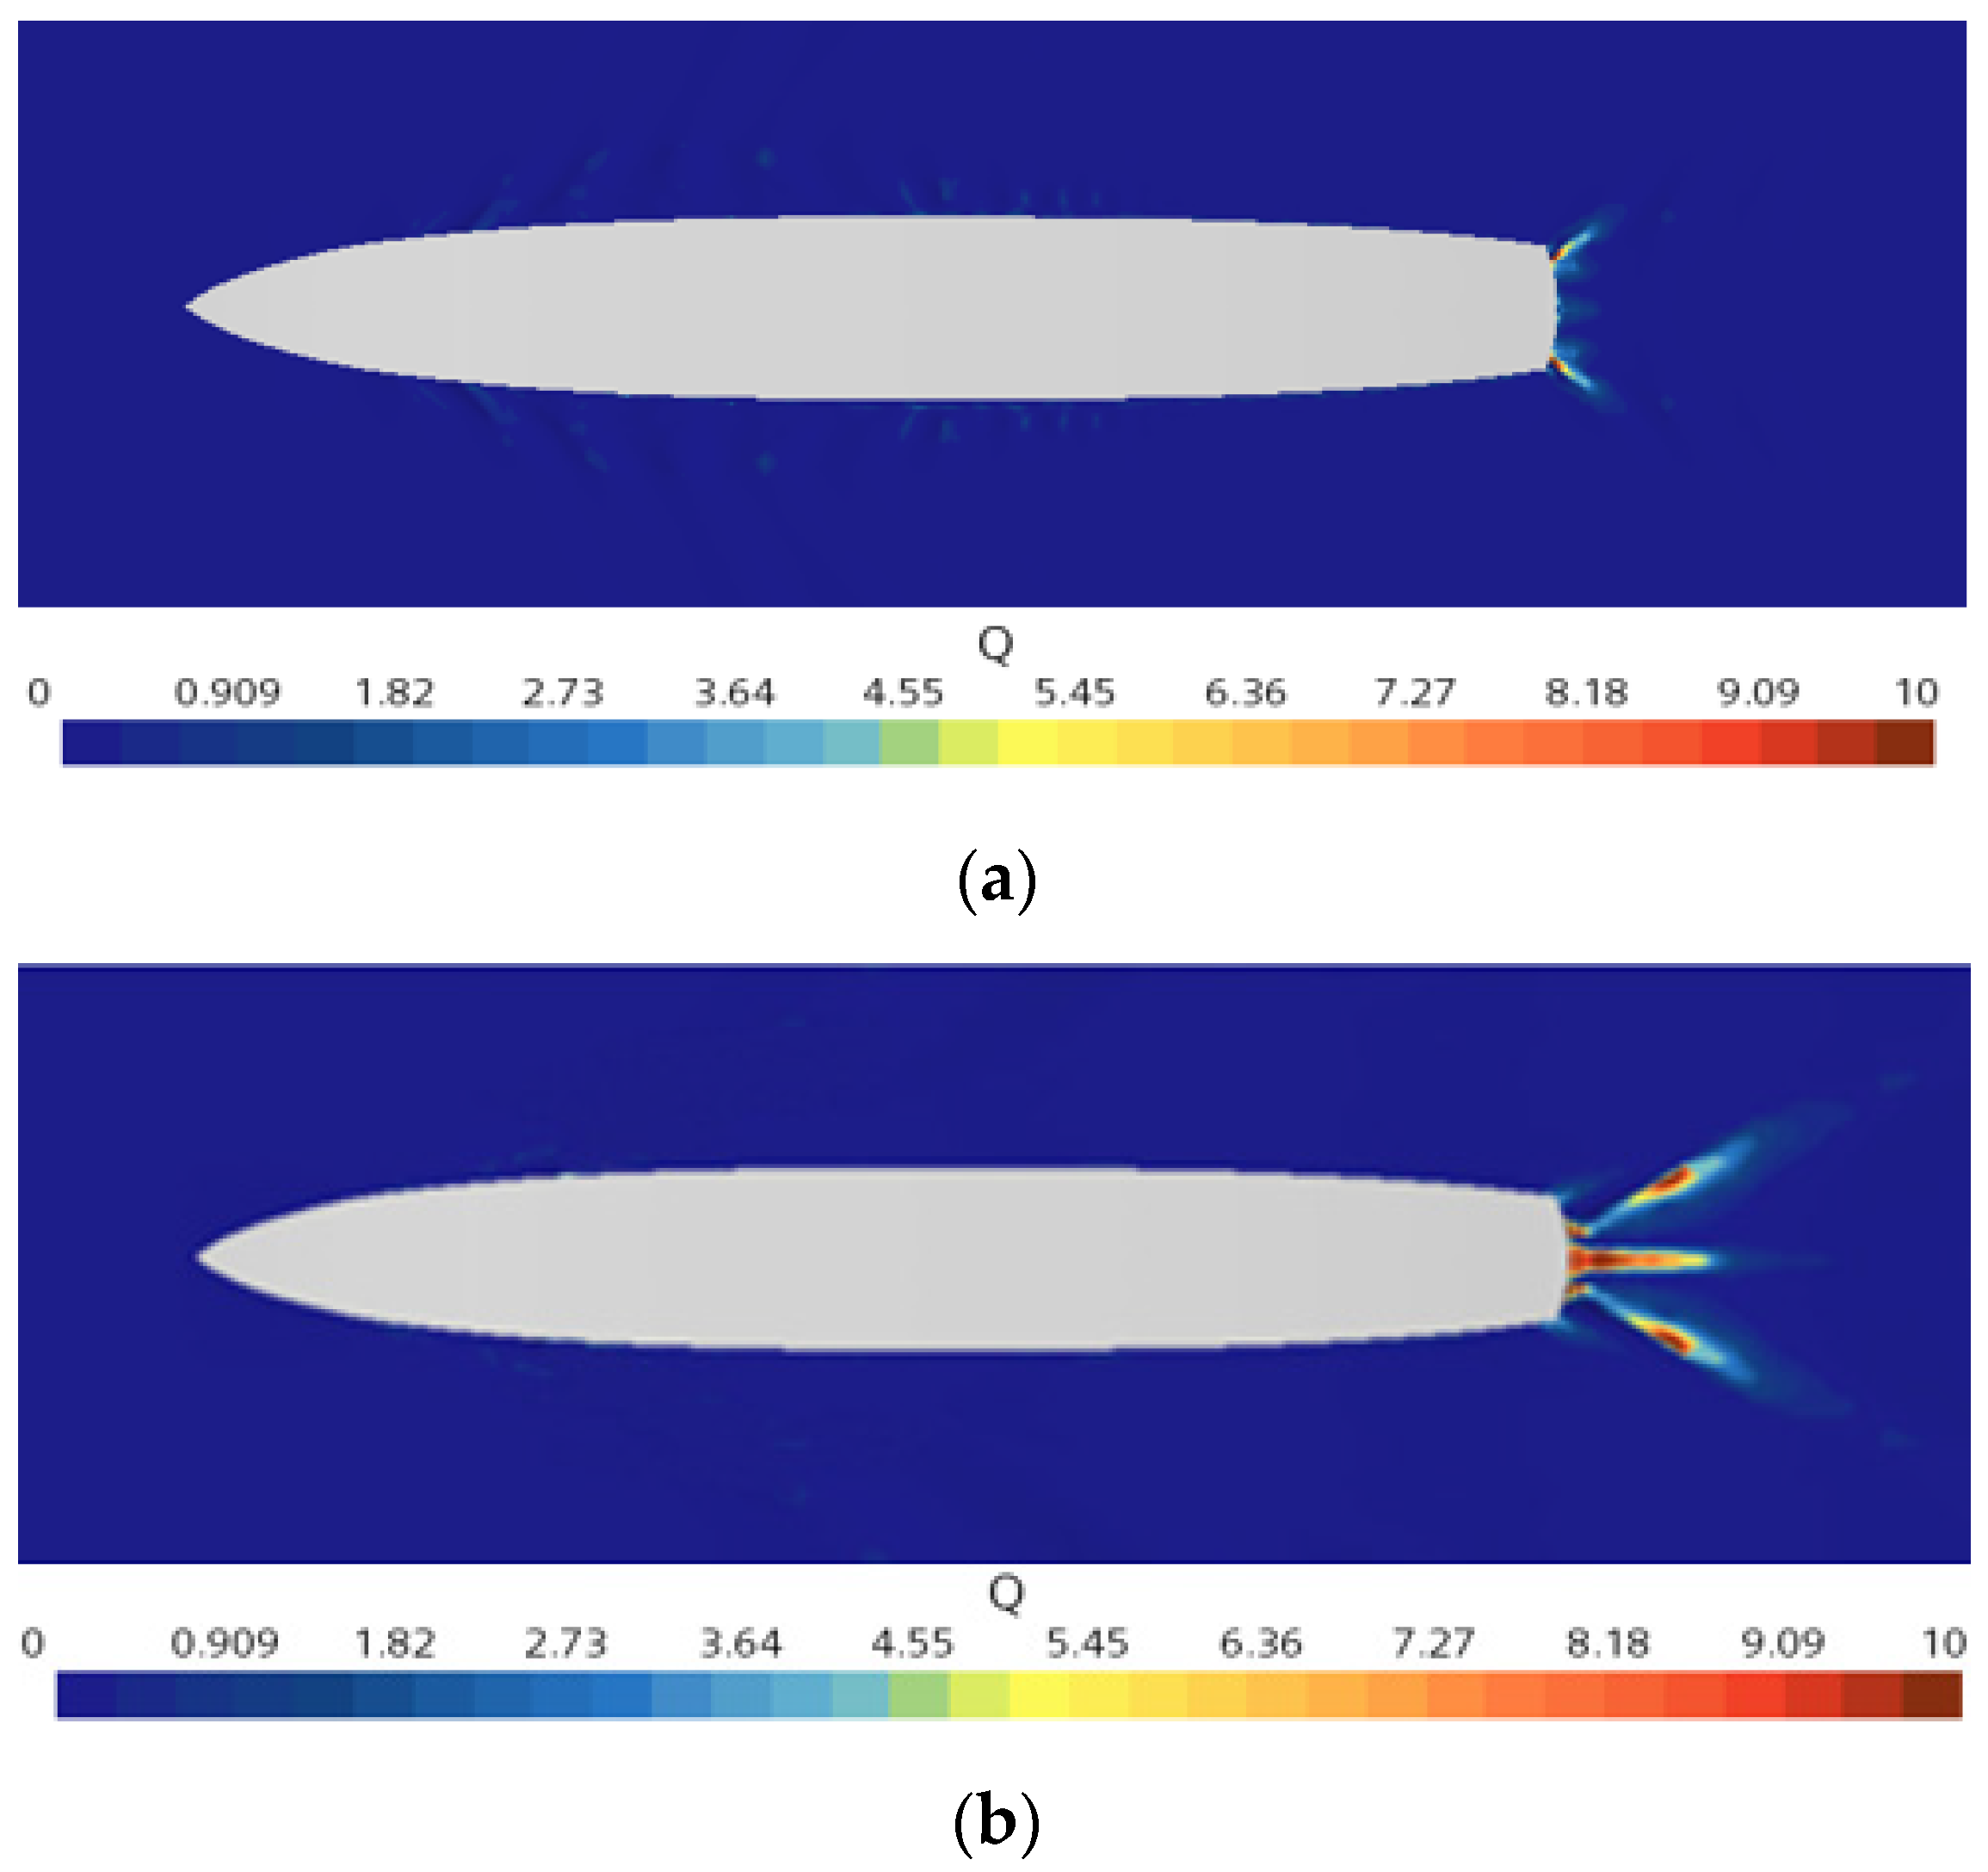
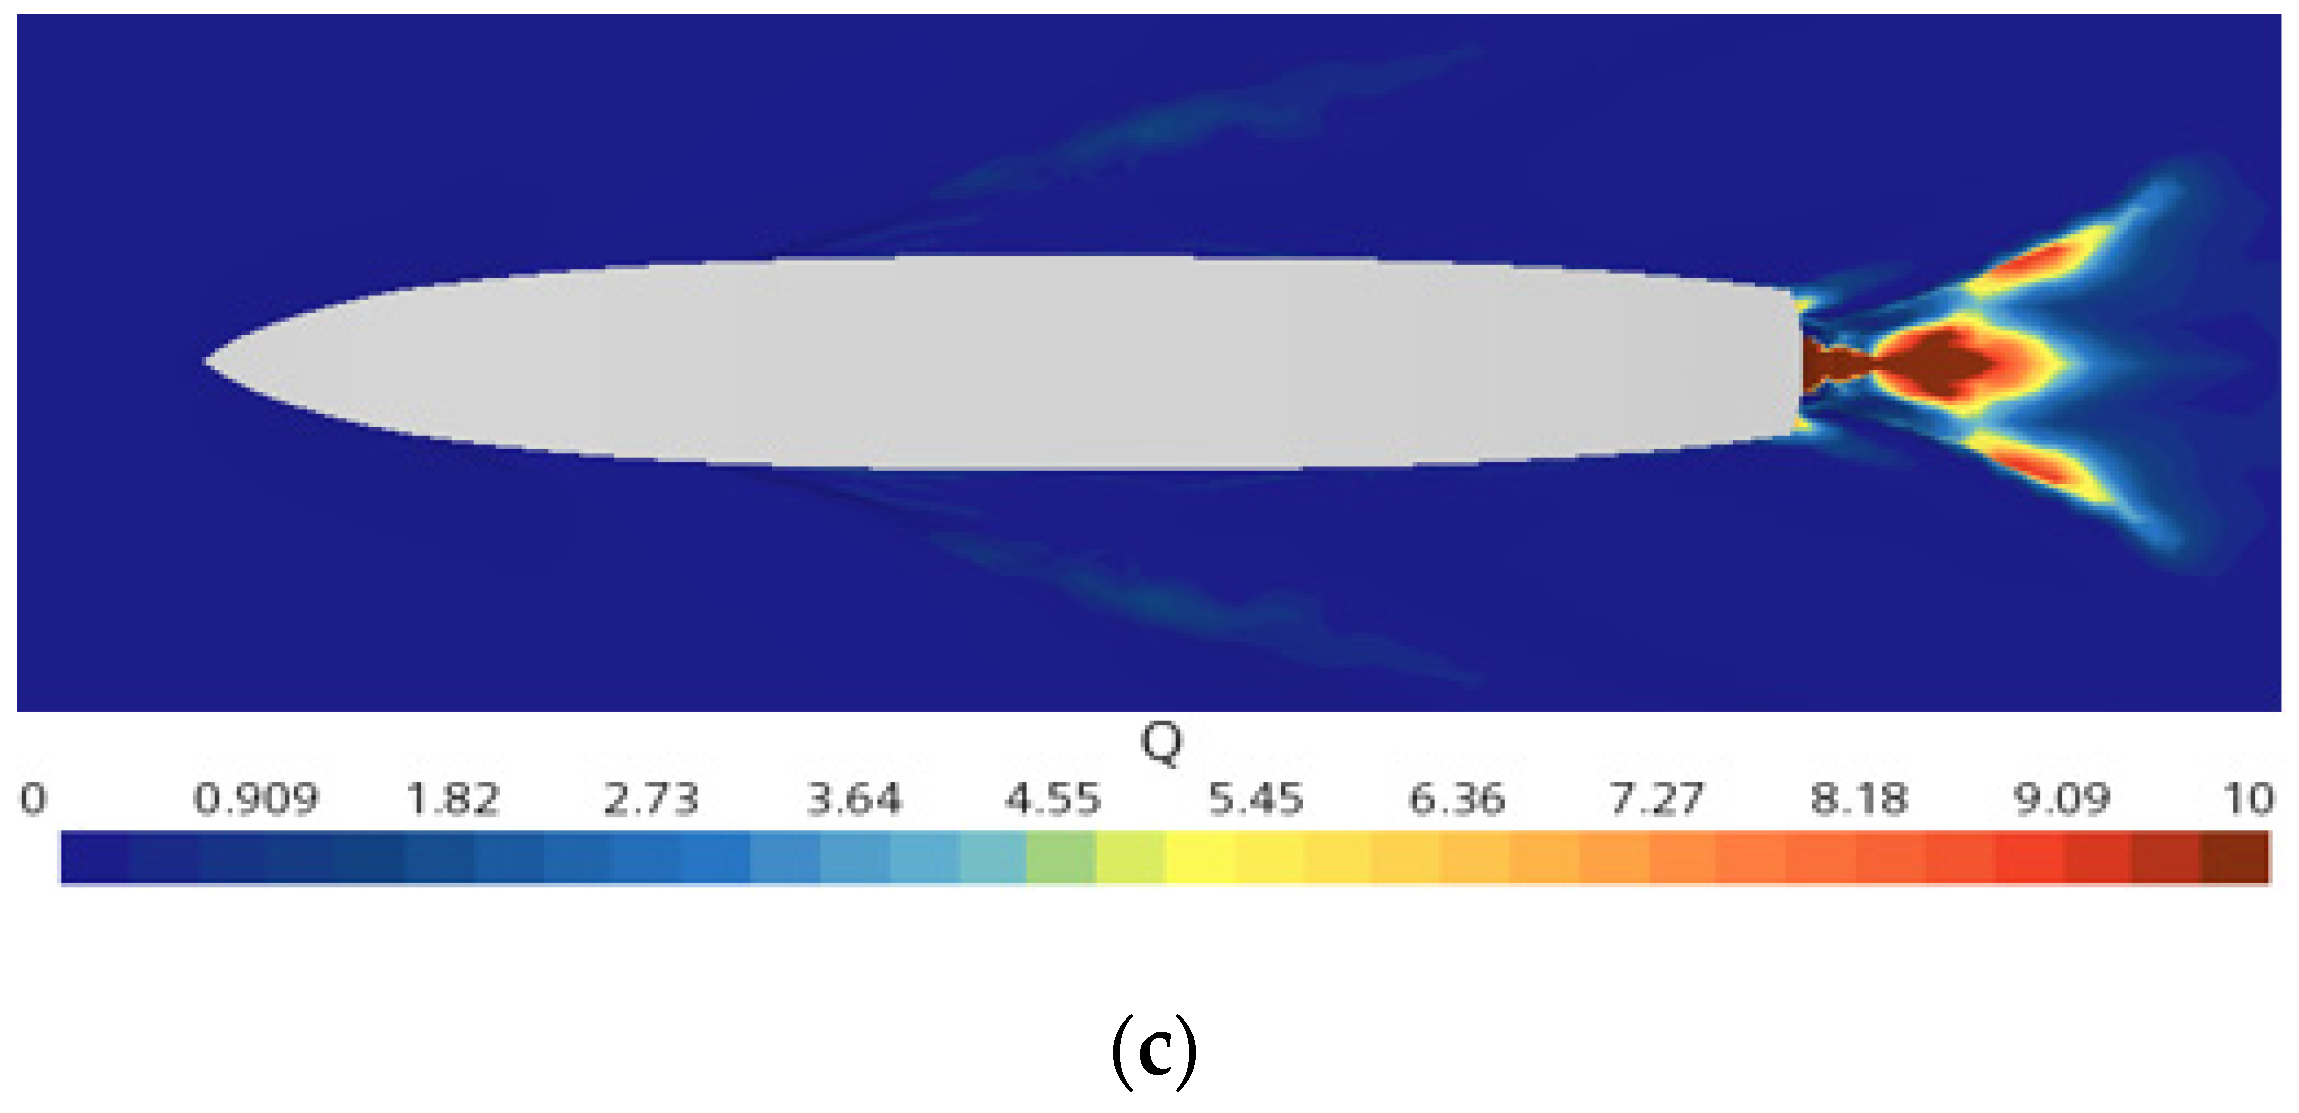
Figure 14 presents the air entrainment volume distribution across three surface vortices at varying ship speeds. The results demonstrate that air entrainment increases with ship speed, with peak values occurring near the stern. The high-entrainment region expands progressively with increasing speed. Secondary entrainment zones appear along the hull sides, though with significantly lower magnitudes than stern regions. These findings reveal preferential air entrainment at the stern, with substantially greater intensity and spatial extent compared to side regions.
Figure 14.
Free-surface air entrainment distributions at varying ship speeds. (a) Fr = 0.15, (b) Fr = 0.28, (c) Fr = 0.35.
4.2. Investigation of Air Entrainment Suppression Using Ship Stern Appendages
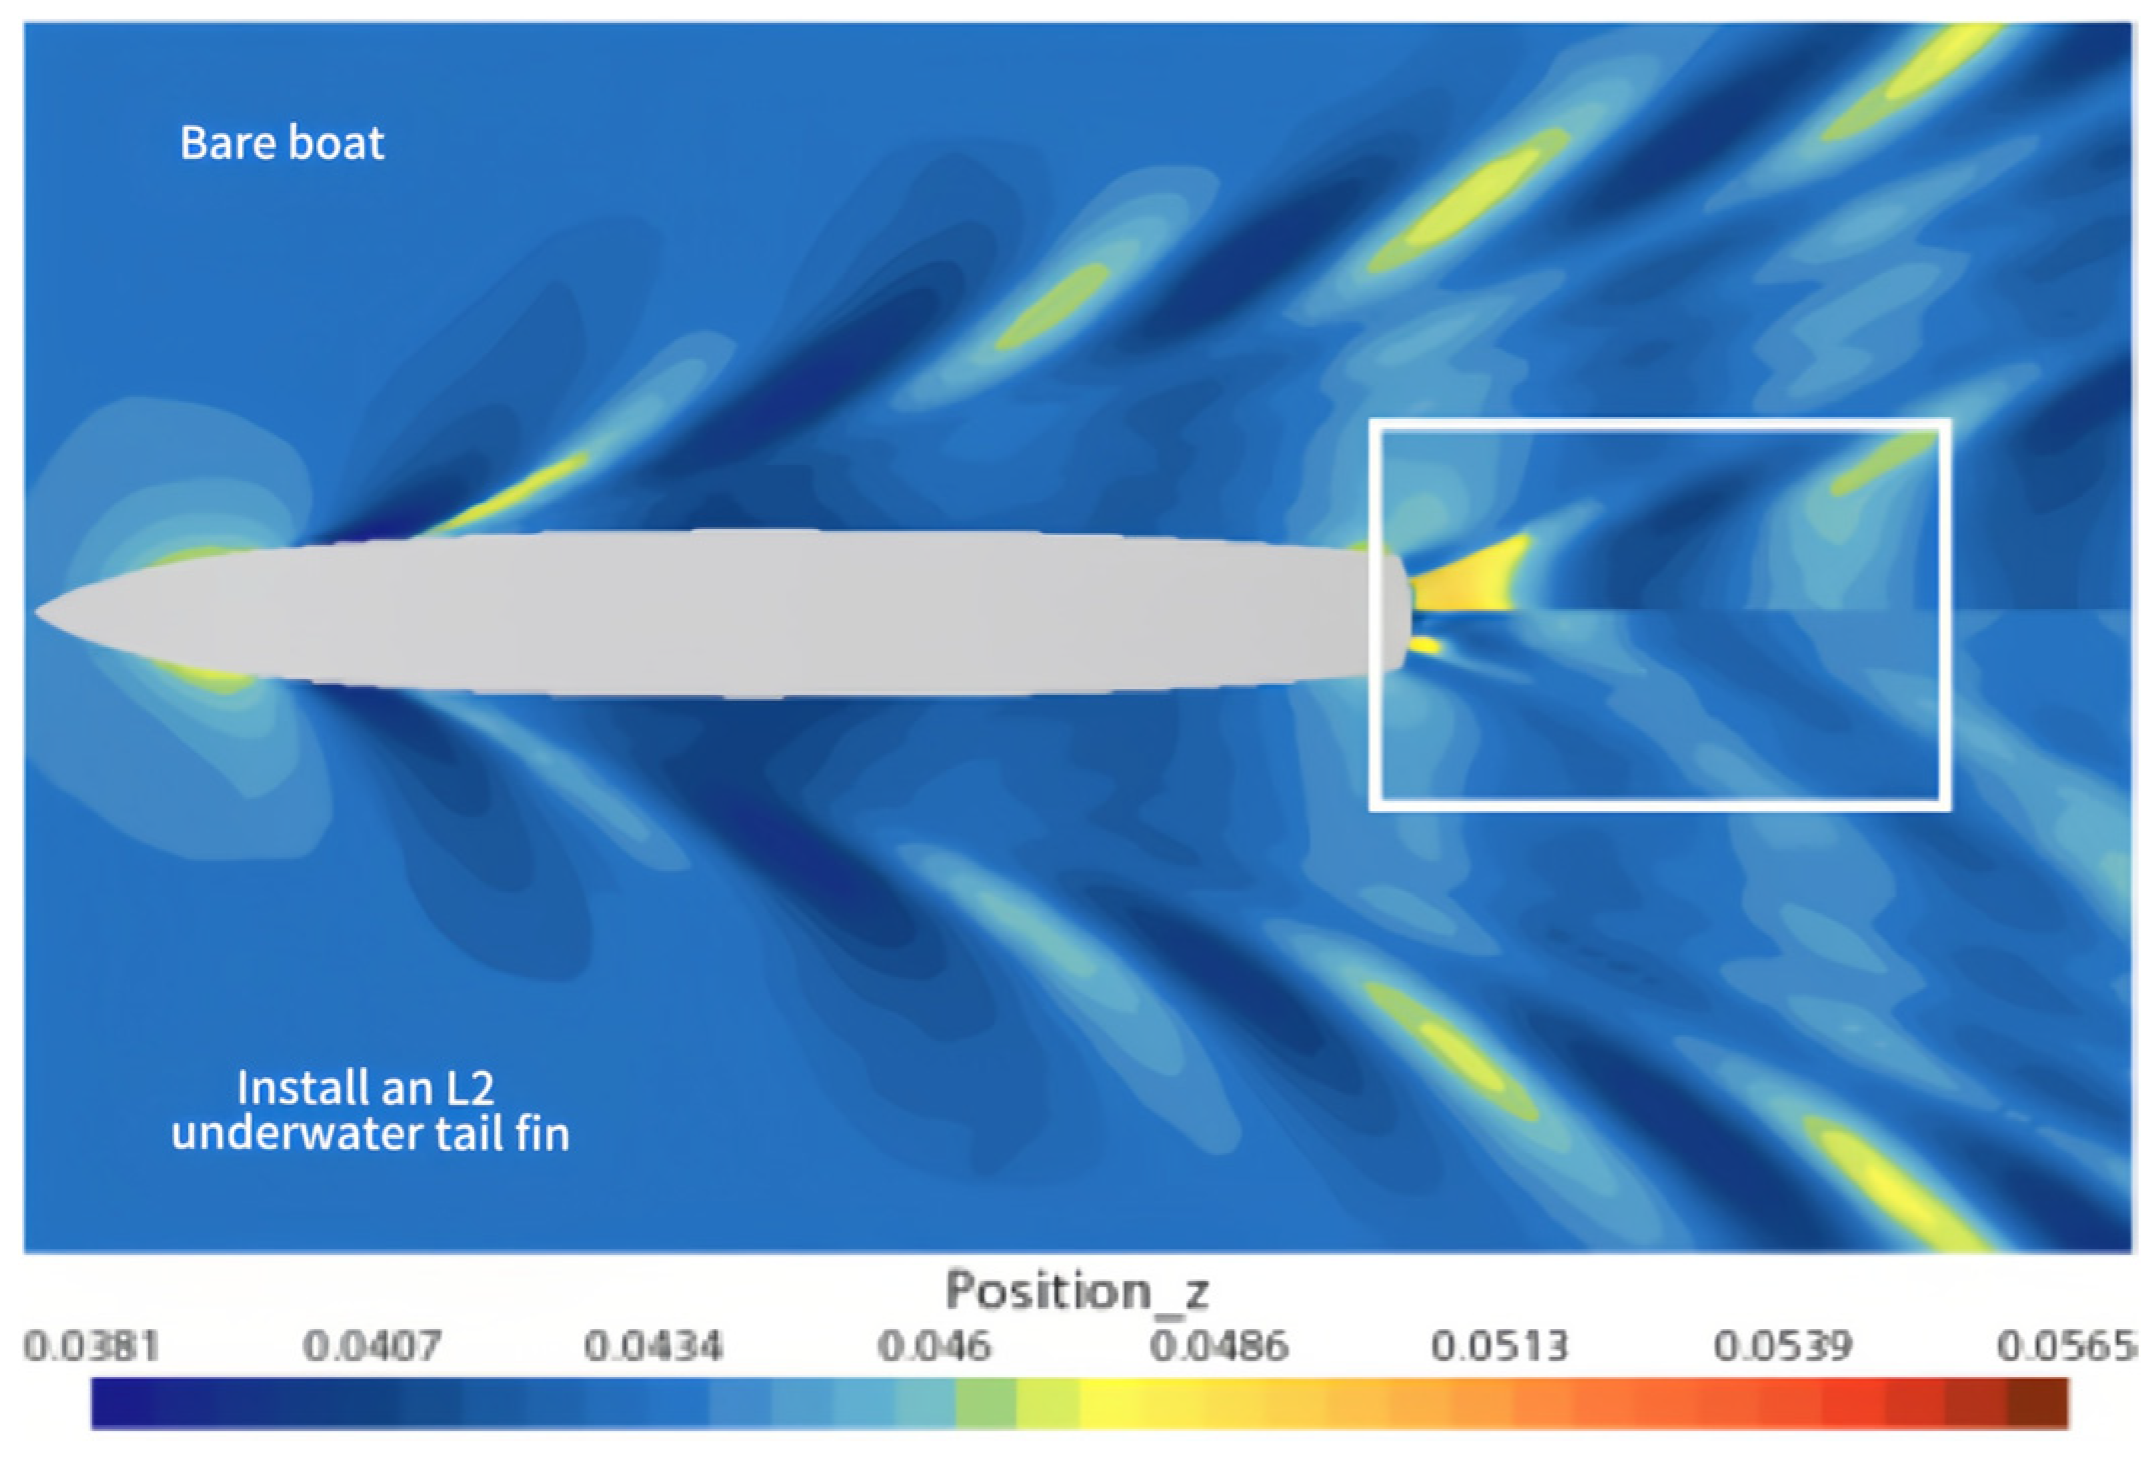
Surface wave curling induces downward air entrainment at the air–water interface, facilitating air entrapment. Stern appendages significantly modify hull wave patterns and navigation dynamics. Figure 15 demonstrates their effect on wave formation characteristics. The figure compares free-surface wave patterns between a bare hull and one equipped with L2 appendages at Fr = 0.28. The L2 appendage effectively attenuates stern wave amplitudes and reduces rooster tail fins height. Wave interference theory indicates beneficial phase cancelation between appendage-generated and stern waves. This wave suppression represents energy recovery [19], decreasing stern-wave-induced surface disturbances.
Figure 15.
The influence of underwater tail fins’ fins on ship wave formation (Fr = 0.28).
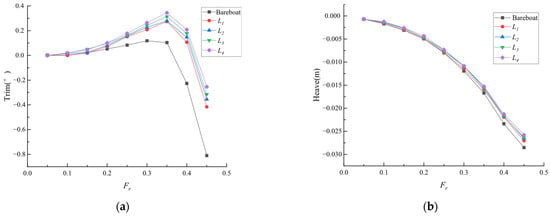
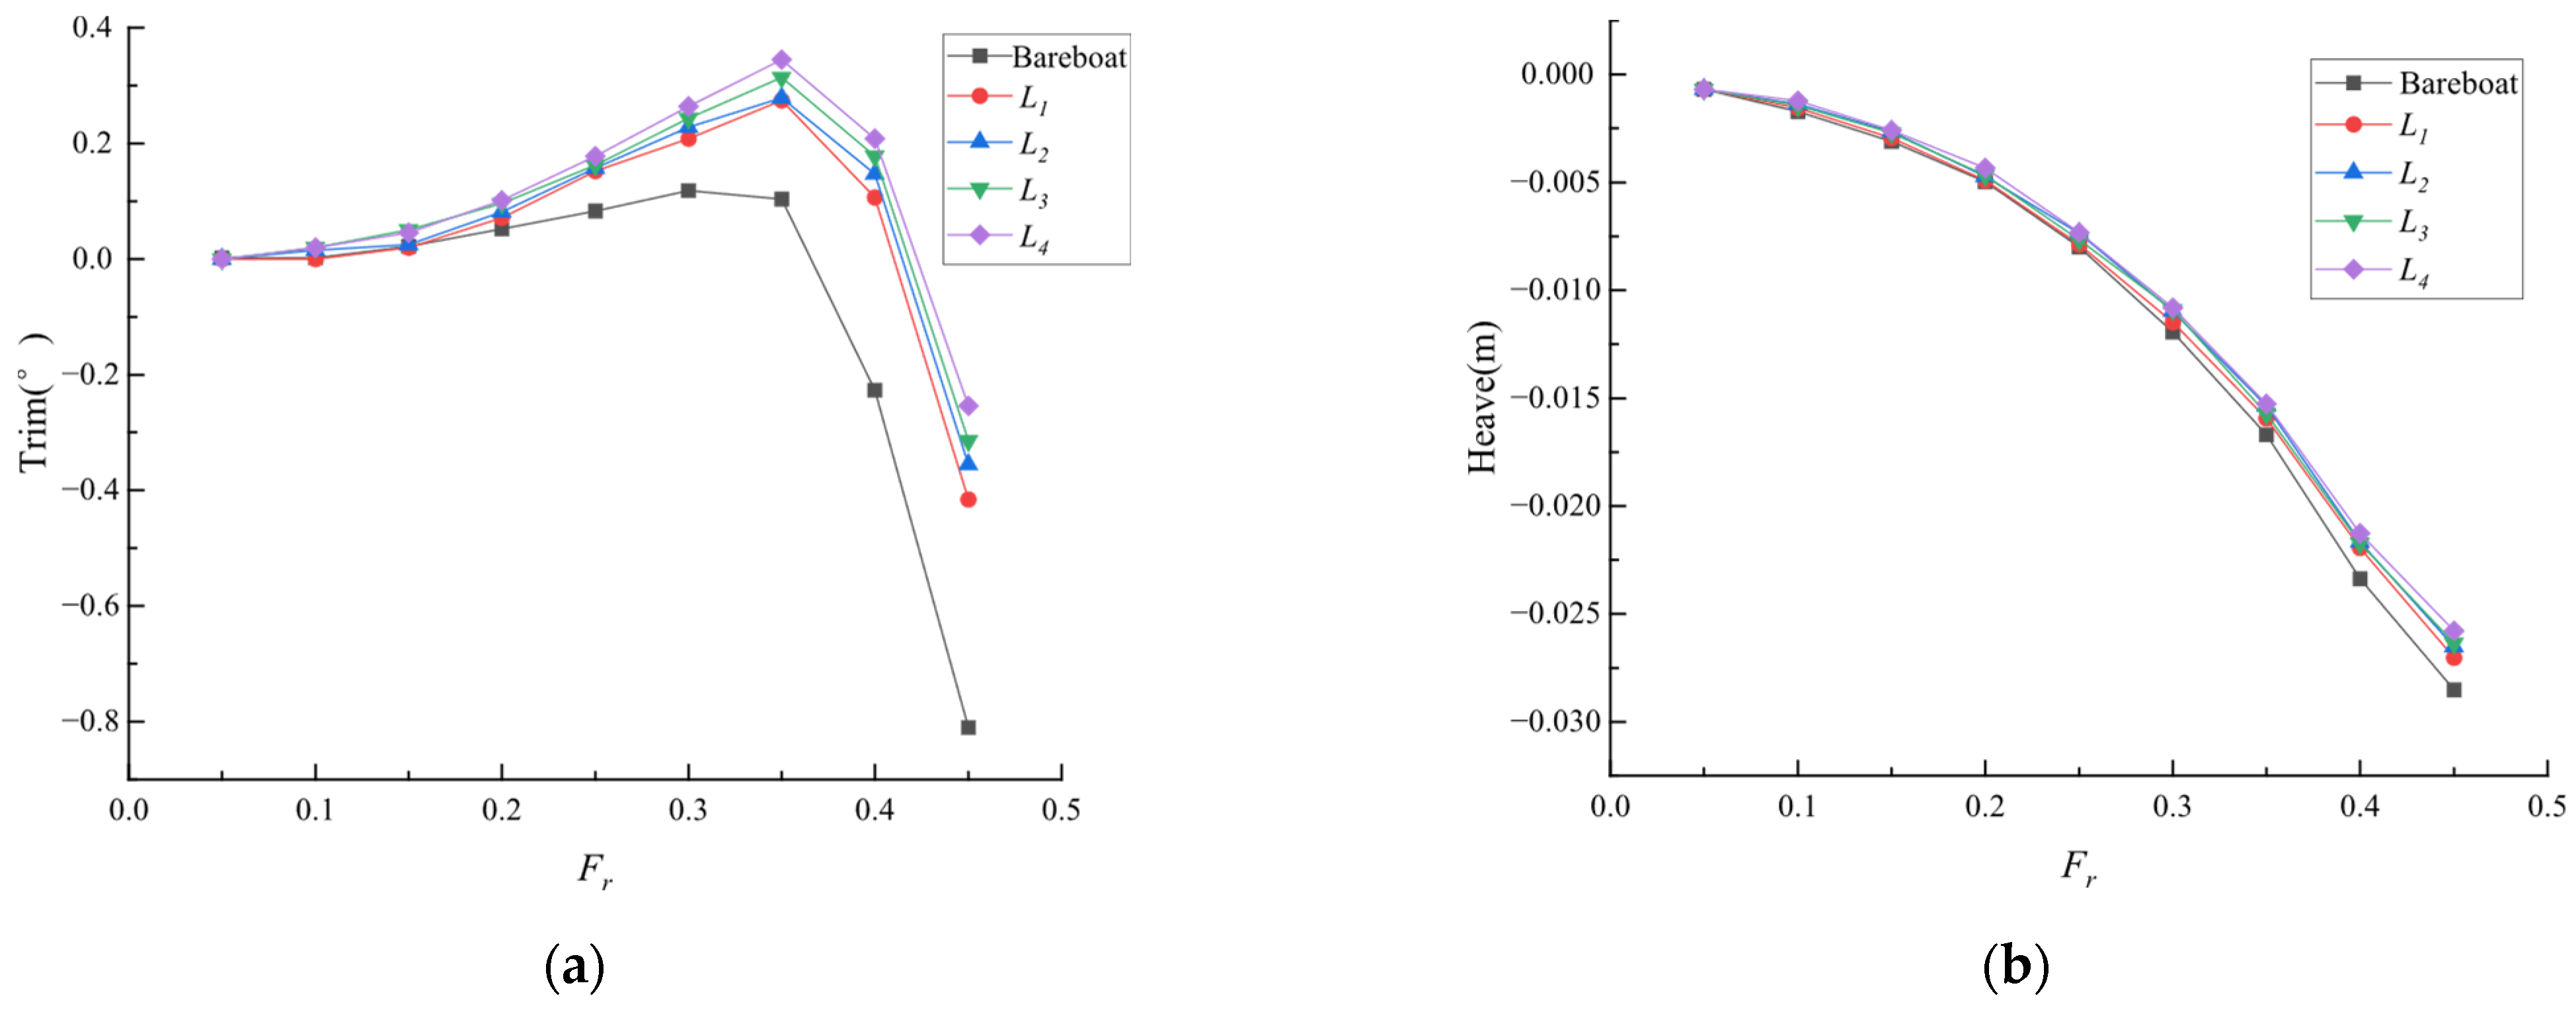
Additionally, appendage-generated lift reduces hull squat and stern trim, mitigating hull–fluid interactions. Figure 16 shows appendages reduce stern trim and squat amplitudes under positive lift conditions. Motion optimization suppresses peripheral air entrainment during high-speed operation.
Figure 16.
The influence of underwater tail fins’ fins on ship wave formation (Fr = 0.28): (a) longitudinal tilt; (b) rise and fall.
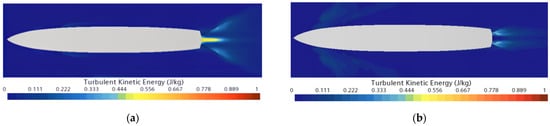
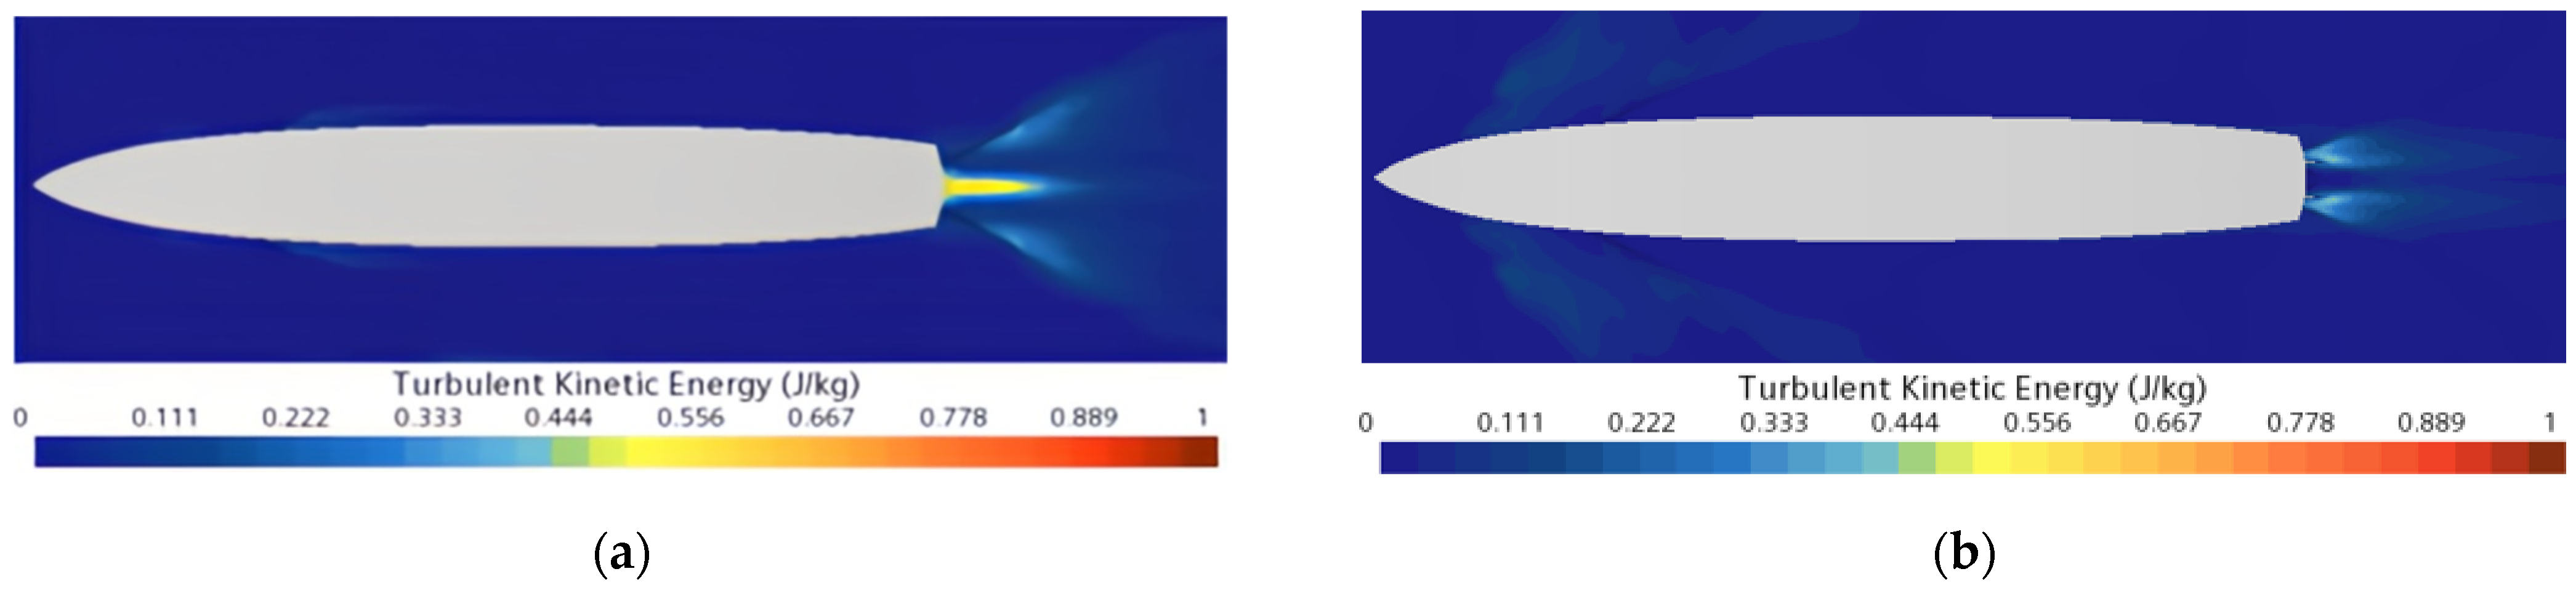
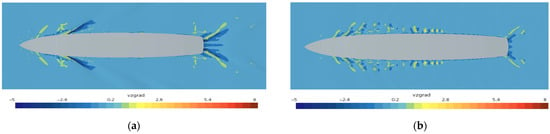
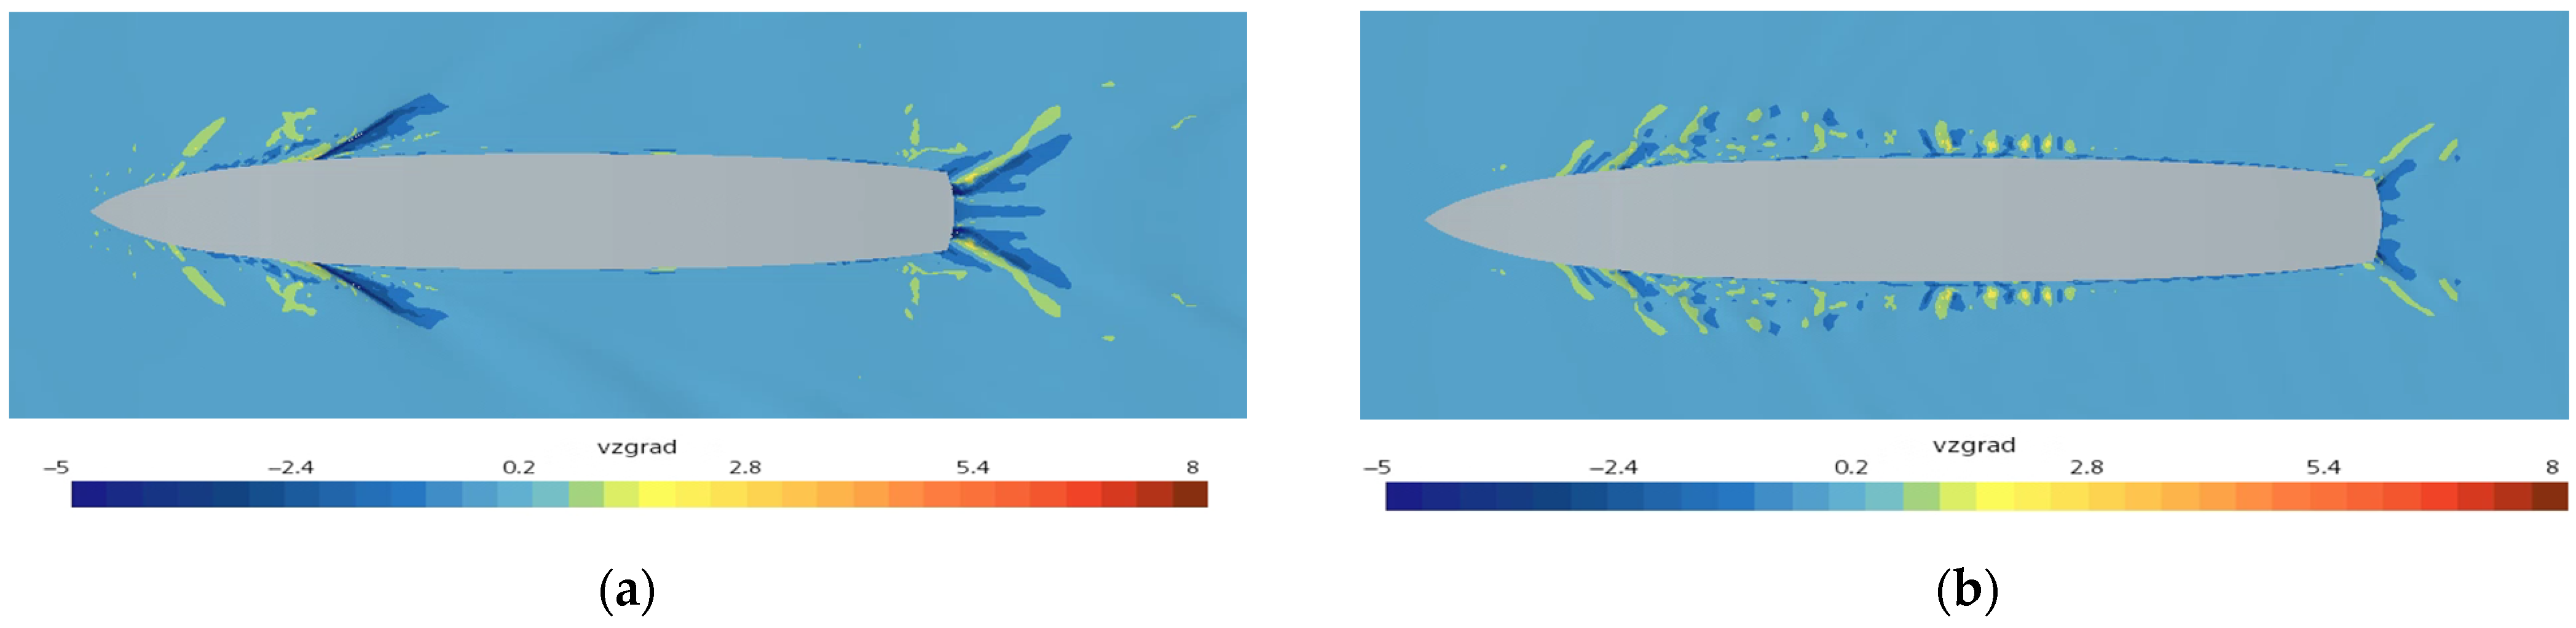
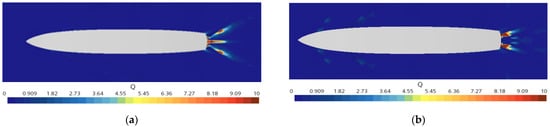
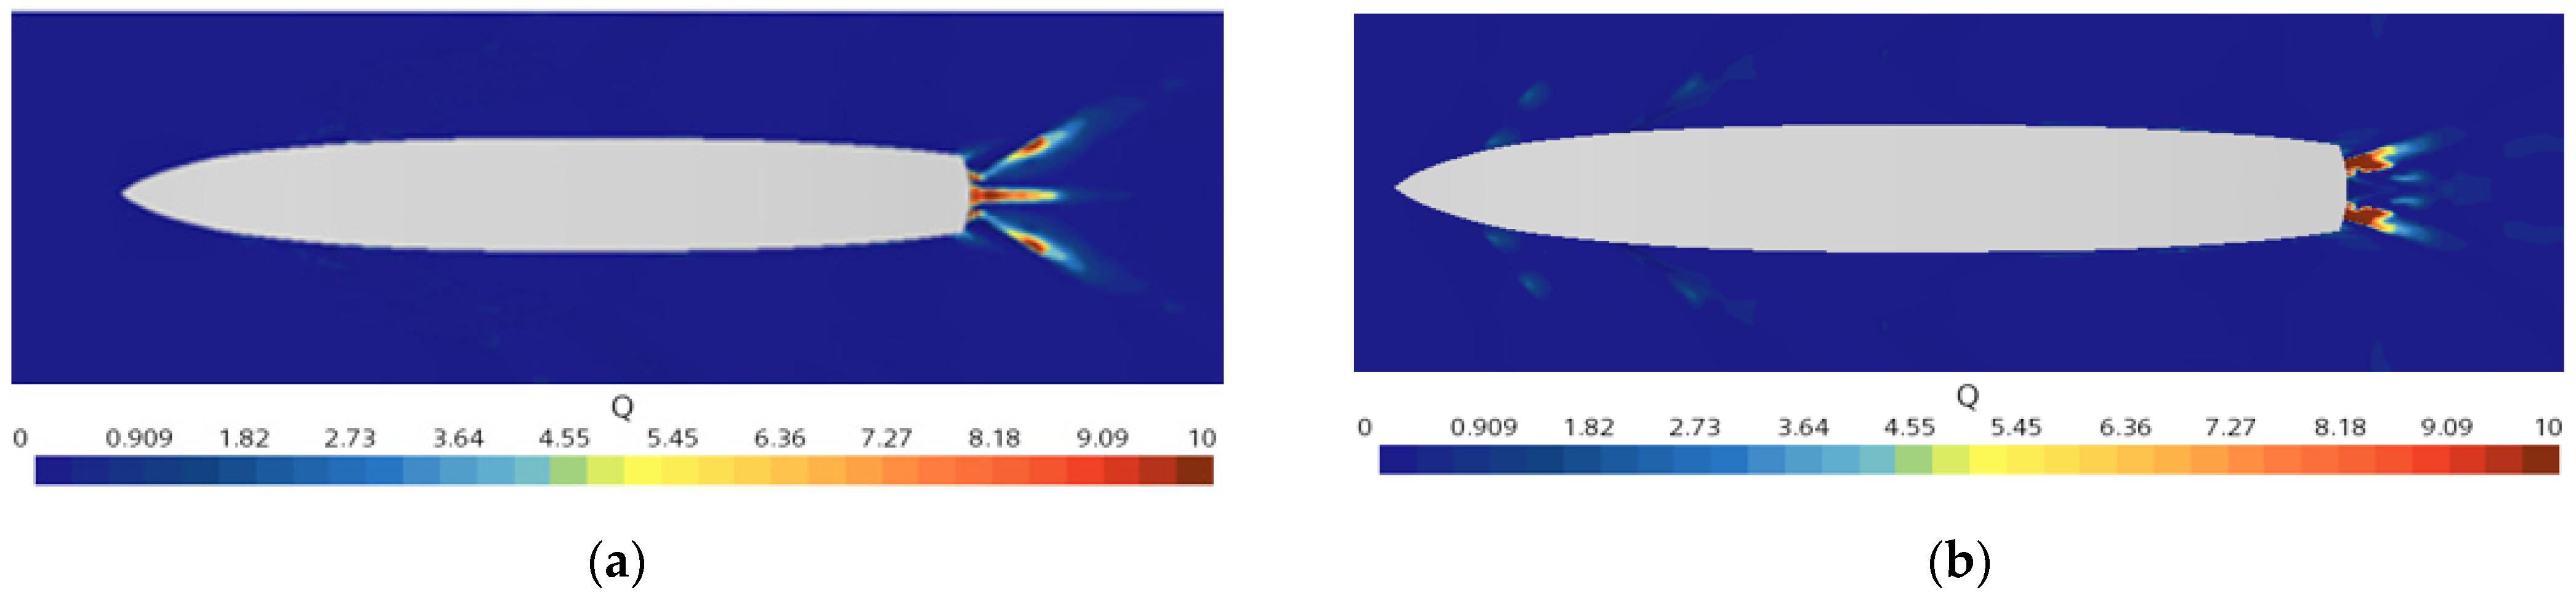
The air entrainment volume in surface vortices quantifies wake intensity. Equation (5) reveals turbulent kinetic energy and vertical velocity gradient as primary determinants of surface vortex entrainment. Turbulent kinetic energy governs entrainment magnitude, whereas vertical velocity gradients define spatial occurrence regions. Figure 17, Figure 18 and Figure 19 present DTMB 5415’s free-surface flow field comparisons with/without stern appendages at Fr = 0.28. The appendages reduce stern turbulence intensity, as quantified in the figures. Downward velocity gradient regions (air-to-water direction) contract and localize nearer the hull. Maximum entrainment persists at the stern, though reduced in magnitude. Stern appendages decrease peak entrainment and reduce affected area. Thus, stern appendages suppress free-surface air entrainment, effectively mitigating wake formation.
Figure 17.
The influence of underwater tail fins’ fins on turbulent kinetic energy distributions (Fr = 0.28): (a) the underwater tail fins’ fin is not installed; (b) the underwater tail fins’ fin is installed.
Figure 18.
The influence of underwater tail fins’ fins on downward velocity gradient distributions (Fr = 0.28): (a) the underwater tail fins’ fin is not installed; (b) the underwater tail fins’ fin is installed.
Figure 19.
The influence of underwater tail fins’ fins on air entrainment distributions (Fr = 0.28): (a) the underwater tail fins’ fin is not installed; (b) the underwater tail fins’ fin is installed.
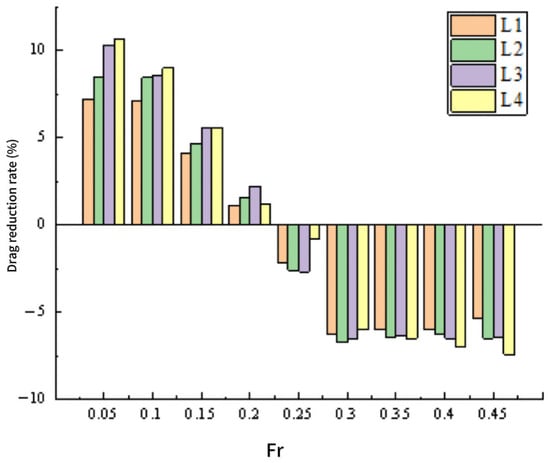
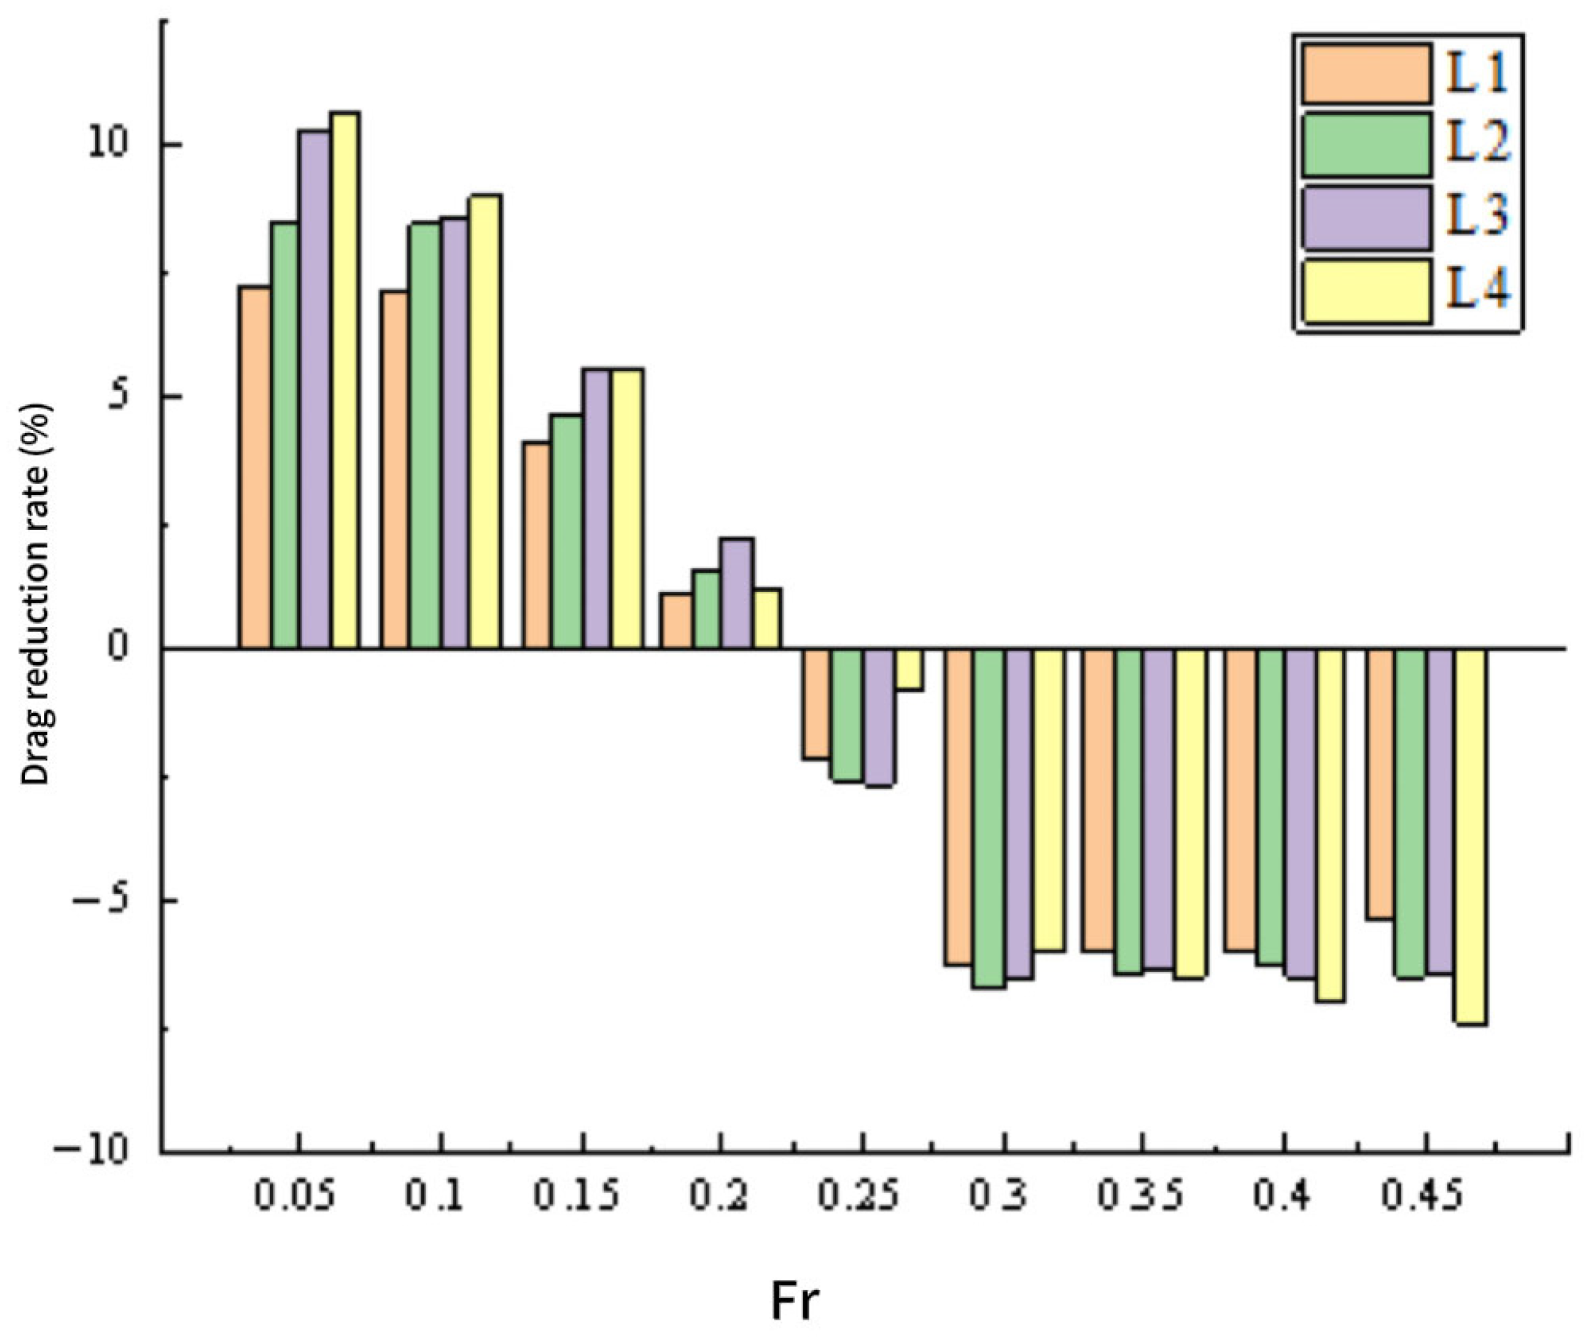
Table 4 and Figure 20 show the drag reduction rate of the ship model under the full speed condition after installing underwater tail fins’ fins of different extensions (the ratio of drag change to bare hull drag). It can be seen from the figure that for the four underwater tail fins’ fins of different extensions, their drag reduction effects will change with the change in speed. When the extension length of the underwater tail fins’ fin is too small, the drag reduction effect of the ship at high speed is not good. However, the installation of an overly extended underwater tail fins’ fin will not only reduce the drag reduction rate of the ship at medium speed, but also increase the drag value of the ship at low speed significantly. Therefore, it is believed that the drag reduction performance of the underwater tail fins’ fin with an extension length of L2 is the best.
Table 4.
The percentage increase in resistance for installing ship models with different lengths of tail fins’ wings under different numbers of Froude.
Figure 20.
The drag reduction efficiency of submerged tail fins’ fins with varying span lengths was quantitatively evaluated.
Table 5 presents the effects of tail fins’ fins span variations on free-surface air entrainment volume across the operational speed range of DTMB 5415 model. When Fr = 0.25, the air intake at the free liquid surface without the addition of an underwater tail fin’s fin is 28.43. Across the tested speed range (Fr = 0.05–0.45), all tail fins’ fins configurations demonstrated significant suppression of free-surface air entrainment. Linear regression analysis revealed a strong positive correlation between fin span length and air entrainment reduction within the Fr 0.05–0.45 range. During typical cruising conditions (Fr = 0.25–0.35), the mean air entrainment reduction reached 7.73%. It can be known by analyzing the drag reduction rate of tail fins’ fins of different lengths and the reduction in air intake volume at the free liquid surface, an optimal fin span length (L2 configuration) that balanced hydrodynamic performance with structural integrity requirements. The L2 fin configuration (Figure 14 and Figure 20) achieved maximum drag reduction (12.4%) during cruising speeds, simultaneously suppressing free-surface air entrainment by 8.2% and wake generation by 15.3% compared to the baseline.
Table 5.
The percentage increase in resistance for installing ship models with different lengths of tail fins under different numbers of Froude.
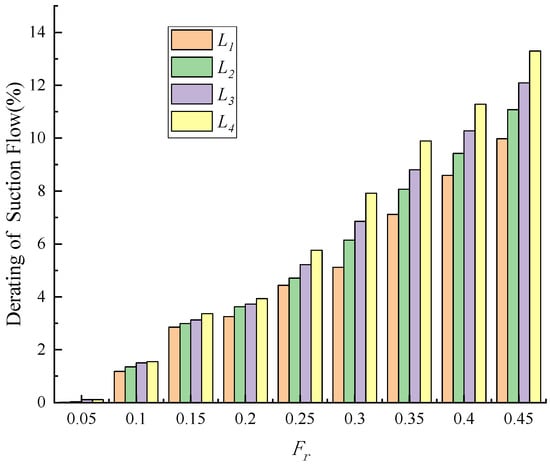
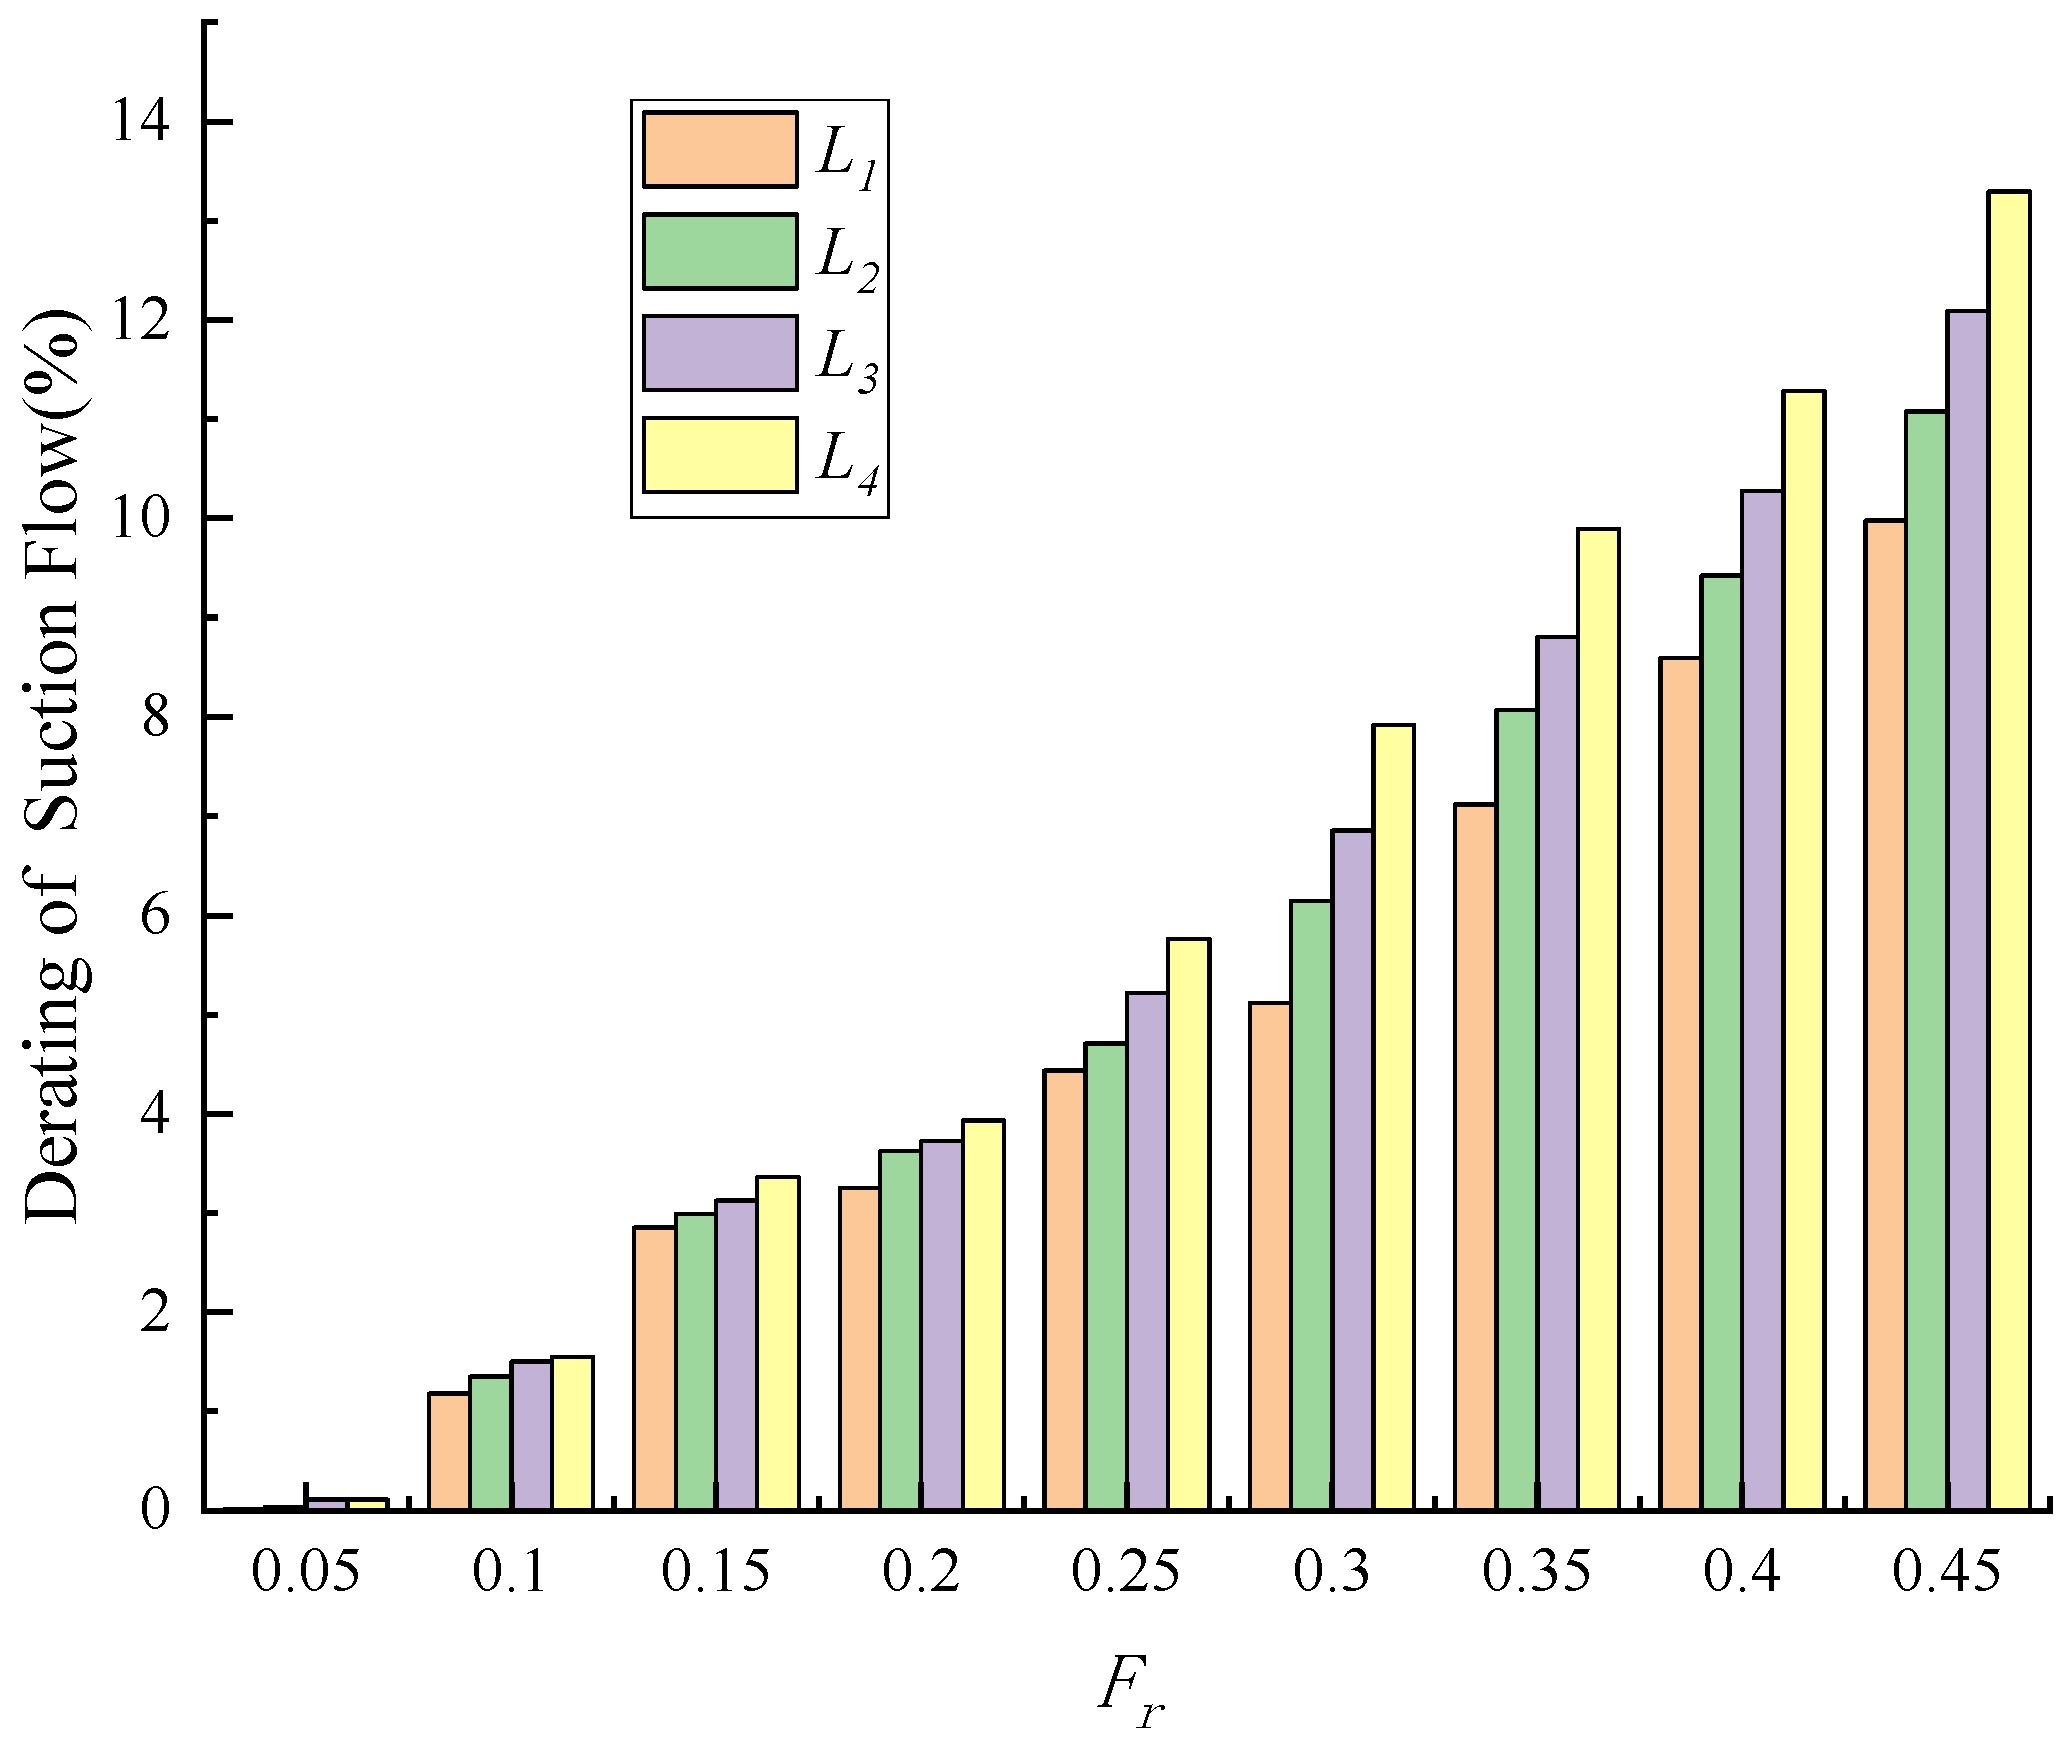
Figure 21 shows the reduction in the free liquid surface intake volume (the ratio of the intake volume change to the intake volume of the bare ship) when installing tail fins’ fins of different extensions. As can be seen from the figure, within the full speed range of the ship, the installation of the ship’s tail fins’ wing can suppress air entrapment, and the suppression effect is better as the wingspan increases.
Figure 21.
The reduction in air entrainment for underwater tail fins’ fins with different lengths of tail fins.
To sum up, when the underwater tail fins’ fin simultaneously plays the role of reducing drag and energy conservation as well as suppressing the wake, there exists an optimal value for the lengths of tail fins’ fin. If the lengths of tail fins’ fin is too large or too small, it cannot exert its best performance. For the DTMB5415 ship model used in this article, considering the drag reduction, energy saving and tail fins flow suppression effects near the cruising speed, it is recommended that its optimal extended length be 445 mm (L2), approximately 7.78% of the ship length between perpendiculars and 80% of the stern cover width.
5. Conclusions
The swirling intake volume at the free surface near the hull is the primary factor governing the intensity of a ship’s surface wake. Using the DTMB 5415 standard ship model as a case study, this study adopts air entrainment as a quantitative indicator of surface foam wake intensity. A numerical investigation was conducted to evaluate the effectiveness of underwater stern fins in suppressing the ship’s surface wake, leading to the following conclusions.
- (1)
- Ship speed significantly affects air entrainment at the free surface, with the entrained air volume increasing as speed increases.
- (2)
- Underwater stern fins improve the ship’s navigational attitude, reduce stern ripples, and suppress stern wave curling. After installation of the stern fins, the peak turbulent kinetic energy at the stern decreases, accompanied by a reduction in suction volume.
- (3)
- The installation of underwater stern fins results in a significant drag reduction for the DTMB 5415 model ship. Within the cruising speed range (Fr = 0.25–0.35), the DTMB 5415 model ship is recommended to adopt an underwater stern fin with an extended length of L2 (456 mm, 7.87% Lpp). Under this configuration, the average drag reduction rate reaches an optimal value of 5.292%.
- (4)
- The extended length of the underwater stern fin shows a positive correlation with the reduction in air entrainment volume. When the extended length reaches L4 (545 mm, 9.53% Lpp), the maximum reduction in air entrainment volume reaches 13.492%.
Considering both drag reduction and air entrainment suppression, the underwater stern fin with an extended length of L2 (456 mm, 7.87% Lpp) provides the best overall performance within the cruising speed range. Specifically, this configuration achieves an average drag reduction of 5.292% and an average air entrainment reduction of 7.733%.
Author Contributions
Conceptualization, T.Z., P.Y. and Z.Y.; Methodology, T.Z., P.Y. and Z.Y.; Software, T.Z. and Y.L.; Validation, T.Z.; Formal analysis, Z.Y.; Investigation, Z.Y. and Y.L.; Resources, P.Y. and Z.Y.; Data curation, Y.L.; Writing—original draft, T.Z.; Writing—review & editing, T.Z., Z.Y. and Y.L.; Supervision, P.Y. and Z.Y.; Project administration, P.Y. and Z.Y.; Funding acquisition, P.Y. All authors have read and agreed to the published version of the manuscript.
Funding
The work is supported by the Ministry of Industry and Information Technology “High tech Ship Project” (Grant No. CBZ03N23-03), and the Shanghai Ship Engineering Key Laboratory Fund (Grant No. SE202301).
Data Availability Statement
As the research project has not yet concluded, the data is temporarily not available for open sharing.
Conflicts of Interest
The authors declare no conflict of interest.
References
- Carrica, P.; Drew, D.; Bonetto, F.; Lahey, R., Jr. A polydisperse model for bubbly two phase flow around a surface ship. Int. J. Multiph. Flow 1999, 25, 257–305. [Google Scholar] [CrossRef] [Scilit]
- Hyman, M.; Moraga, F.J.; Drew, D.A.; Lahey, R.T., Jr. Computations of the unsteady two-phase flow around a maneuvering surface ship. In Proceedings of the Proceedings 26th symposium on naval hydrodynamics, Rome, Italy, 17–22 September 2006. [Google Scholar]
- Moraga, F.; Carrica, P.; Drew, D.; Lahey, R., Jr. A sub-grid air entrainment model for breaking bow waves and naval surface ships. Comput. Fluids 2008, 37, 281–298. [Google Scholar] [CrossRef] [Scilit]
- Drew, D.; Passman, S. Theory of Multicomponent Fluids; Springer: Berlin/Heidelberg, Germany, 1999. [Google Scholar]
- Lahey, R.T., Jr. On the computation of multiphase flow. J. Nucl. Technol. 2009, 167, 29–45. [Google Scholar] [CrossRef] [Scilit]
- Yang, J.; Stern, F. Sharp interface immersed-boundary/level-set method for wave-body interactions. J. Comput. Phys. 2009, 228, 6590–6616. [Google Scholar]
- Bin, A. Gas entrainment by plunging liquid jets. Chem. Eng. Sci. 1993, 48, 3585–3630. [Google Scholar] [CrossRef] [Scilit]
- Chanson, H. Air Bubble Entrainment in Free-Surface Turbulent Shear Flows; Academic Press: Cambridge, MA, USA, 1996. [Google Scholar]
- Ma, J.; Oberai, A.; Drew, D.; Lahey, R., Jr.; Moraga, F. A quantitative sub-grid air entrainment model for bubbly flows-plunging jets. Comput. Fluids 2010, 39, 77–86. [Google Scholar] [CrossRef] [Scilit]
- Ma, J.; Oberai, A.; Drew, D.; Lahey, R., Jr.; Hyman, M. A comprehensive subgrid air entrainment model for Reynolds-averaged simulations of free-surface bubbly f lows. In APS DFD Meeting Abstracts; American Physical Society: College Park, MD, USA, 2009. [Google Scholar]
- Ma, J.; Oberai, A.; Drew, D.; Lahey, R., Jr.; Hyman, M. A comprehensive sub-grid air entrainment model for RaNS modeling of free-surface bubbly flows. J. Comput. Multiph. Flow 2011, 3, 41–56. [Google Scholar] [CrossRef] [Scilit]
- Trimulyono, A.; Hakim, M.L.; Ardhan, C.; Ahmad, S.T.P.; Tuswan, T.; Santosa, A.W.B. Analysis of the double steps position effect on planing hull performances. Brodogradnja 2023, 74, 41–72. [Google Scholar] [CrossRef] [Scilit]
- Avci, A.G.; Barlas, B. Investigation of the optimum longitudinal single transverse step location for a high-speed craft. Brodogradnja 2023, 74, 47–70. [Google Scholar] [CrossRef] [Scilit]
- Sahin, O.S.; Kahramanoglu, E.; Cakici, F.; Pesman, E. Control of dynamic trim for planing vessels with interceptors in terms of comfort and minimum drag. Brodogradnja 2023, 74, 1–17. [Google Scholar] [CrossRef] [Scilit]
- Romani, S.; Morgut, M.; Parussini, L.; Piller, M. Uncertainty quantification and global sensitivity analysis of turbulence model closure coefficients for sheet cavity flow around a hydrofoil. Brodogradnja 2025, 76, 76105. [Google Scholar] [CrossRef] [Scilit]
- Uithof, K.; van Oossanen, P.; Moerke, N.; van Oossanen, P.G.; Zaaijer, K.S. An update on the development of the hull vane. In Proceedings of the International Conference on High-Performance Marine Vehicles, Athens, Greece, 3–5 December 2014. [Google Scholar]
- van Oossanen, P.; Heimann, J.; Henrichs, J.; Hochkirch, K. Motor Yacht Hull Form Design for the Displacement to Semi-Displacement Speed Range. In Proceedings of the 10th International Conference on Fast Sea Transportation, Athens, Greece, 5–8 October 2009. [Google Scholar]
- Uithof, K.; Hagemeister, N.; Bouckaert, B. A systematic comparison of the influence of the Hull Vane®, interceptors, trim, wedges, and ballasting on the performance of the 50m AMECRC SERIES #13 Patorl Vessel. In Proceedings of the Advanced Technologies in Naval Design, Construction, & Operation, London, UK, 15–16 June 2016; pp. 1–7. [Google Scholar]
- Uithof, K.; van Oossanen, P.G.; Bergsma, F. The feasibility and performance of a trimaran yacht concept, equipped with a Hull Vane. In Proceedings of the Design & Construction of Super & Mega Yachts, Genoa, Italy, 13–14 May 2015; pp. 1–9. [Google Scholar]
- Dwiputera, H.; Prawira, N.Y.; Andira, M.A.; Budiyanto, M.A. Effect of angle of attack variation of stern foil on high-speed craft on various speed with computational fluid dynamics method. Int. J. Technol. Febr. 2020, 11, 1359–1369. [Google Scholar] [CrossRef] [Scilit]
- Budiarto, U.; Firdhaus, A. Analysis of the effect of hull vane on ship resistance using CFD methods. IOP Conf. Ser. Earth Environ. Sci. 2021, 649, 012051. [Google Scholar]
- Budiyanto, M.A.; Murdianto, M.A.; Syahrudin, M.F. Study on the resistance reduction on high-speed vessel by application of stern foil using CFD simulation. CFD Lett. 2020, 12, 35–42. [Google Scholar] [CrossRef] [Scilit]
- Murdianto, M.A.; Budiyanto, M.A.; Syahrudin, M.F. Application of stern foil on full draft patrol vessel at high speed condition using computational fluid dynamics (CFD)method. In AIP Conference Proceedings; AIP Publishing LLC: Melville, NY, USA, 2020; Volume 2255, pp. 1–7. [Google Scholar]
- Olivieri, A.; Pistani, F.; Avanzini, A.; Stern, F.; Penna, R. Towing Tank Experiments of Resistance, Sinkage and Trim, Boundary Layer, Wake, and Free Surface Flow Around a Naval Combatant. In Proceedings of the SNAME 26th American Towing Tank Conference, Glen Cove, NY, USA, 23–24 July 2001. INSEAN 2340 Model. [Google Scholar]
- Ma, J.; Oberai, A.; Drew, D.; Lahey, R., Jr. A two-way coupled polydispersed simulation of bubbly flow beneath a plunging liquid jet. In Proceedings of the ASME 2010 3rd Joint US–European Fluids Engineering Summer Meeting & 8th International Conference On Nanochannels, Microchannels, and Minichannels, Montreal, QC, Canada, 1–5 August 2010. [Google Scholar]
- Ma, J.; Oberai, A.A.; Hyman, M.C.; Drew, D.A.; Lahey, R.T., Jr. Two-fluid modeling of bubbly flows around surface ships using a phenomenological subgrid air entrainment model. Comput. Fluids 2011, 52, 50–57. [Google Scholar] [CrossRef] [Scilit]
- Wan, P.-C.; Fu, H.-p. A numerical method to simulate ship bubbly wake. J. Shanghai Jiao Tong Univ. 2013, 47, 25–30. [Google Scholar]
- Bouckaert, B.; Uithof, K.; Moerke, N.; van Oossanen, P.G. Hull vane(R) on 108m Holland Class OPVs: Effects on fuel consumption and seakeeping. In Proceedings of the MAST 2016, Amsterdam, The Netherlands, 21–23 June 2016. [Google Scholar]
- Manninen, M.; Taivassalo, V.; Kallio, S. On the Mixture Model for Multiphase Flow; VTT Publications 288; Technical Research Centre of Finland: Espoo, Finland, 1996. [Google Scholar]
- Stern, F.; Longo, J.; Penna, R.; Olivieri, A.; Ratcliffe, T.; Coleman, H. International Collaboration on Benchmark CFD Validation Data for Surface Combatant DTMB Model 5415. In Proceedings of the Symposium on Naval Hydrodynamics, Val de Reuil, France, 17–22 September 2000. [Google Scholar]





Disclaimer/Publisher’s Note: The statements, opinions and data contained in all publications are solely those of the individual author(s) and contributor(s) and not of MDPI and/or the editor(s). MDPI and/or the editor(s) disclaim responsibility for any injury to people or property resulting from any ideas, methods, instructions or products referred to in the content. |
© 2026 by the authors. Licensee MDPI, Basel, Switzerland. This article is an open access article distributed under the terms and conditions of the Creative Commons Attribution (CC BY) license.