


Abstract
Very-high-resolution (VHR) satellite imagery has expanded the scale at which researchers can monitor marine mammals in remote regions and improved monitoring efforts in data-deficient areas. Relatively little is known about beluga whale (Delphinapterus leucas) distribution in their wintering grounds, due partly to the unpredictability of sea ice formation and limited accessibility. VHR satellite imagery has been used successfully to estimate the abundance of summering beluga whales; however, the feasibility of tasking VHR satellite imagery in the winter and determining the detectability of beluga whales amongst sea ice have not been formally assessed. Our objective was to assess the feasibility of acquiring VHR satellite imagery in the winter and whether beluga whales could be reliably distinguished from sea ice in the imagery. Our study focused on beluga whale populations that are winter residents within James Bay and Cumberland Sound, occupying nearshore open water and ice leads in the winter. Two images were collected in Cumberland Sound covering known beluga whale wintering grounds in February and March 2022 encompassing 745 km2, with ice covering >75% of the image, and three images were acquired within James Bay from January to March 2024 spanning over 5700 km2, with ice covering >86% of the survey area. We observed 0 certain and 294 uncertain detections, suggesting that current satellite imagery resolutions are too low for confidently detecting beluga whales amongst densely packed ice. High-definition sharpening to 15 cm reduced the number of uncertain detections, but we were still unable to identify any certain whales. Continued advancements in imagery resolution are required to distinguish beluga whales from sea ice and improve year-round beluga whale monitoring.
1. Introduction
Advancements in very-high-resolution (VHR) satellite imagery have expanded the range and scale at which researchers can monitor marine mammal populations in remote regions of the Arctic and sub-Arctic. Conventional monitoring efforts, such as visual or photographic aerial surveys conducted from manned aircraft [1,2,3,4], are often costly and may disrupt the natural behavior of the studied species [5]. Obtaining full-coverage population surveys of Arctic cetaceans, which are distributed over large spatial scales, can also be logistically challenging with current aerial survey methods [6]. VHR satellite imagery offers a large-scale, non-invasive alternative that addresses many of these issues and has been utilized to detect or estimate the abundance of walrus (Odobenus rosmarus) [7], cetaceans such as narwhals (Monodon monoceros) [8,9], and beluga whales (Delphinapterus leucas) [10] while in their summering grounds. VHR imagery has the potential to support the monitoring of whales on their wintering grounds and may be more logistically feasible than manned aerial surveys at that time; however, to date, no study has investigated the utility of using satellite imagery to monitor Arctic cetaceans in the winter.
Most beluga whale populations make annual migrations from coastal summering estuaries to open-water polynyas in the winter [11]. Due to their site fidelity to summering estuaries [12,13], beluga whale abundance and distribution surveys are typically carried out during the summer months [3,4,14]. As such, relatively little is known about beluga whale distribution in their wintering grounds, and what is known comes from the few satellite telemetry tags deployed on whales in the summer that continue to transmit through the winter months [15,16] or from year-round passive acoustic monitoring [17]. The unpredictability of sea ice formation and the limited accessibility to beluga whale wintering grounds make monitoring logistically challenging at this time of year. However, in winter, beluga whales require open-water polynyas to survive and these polynyas may provide an opportune area to survey distinct populations that are geographically isolated and aggregated [18]. VHR satellite imagery offers a promising alternative for surveying beluga whales in their winter habitat as satellites can theoretically survey large swaths of areas to locate open-water polynyas with limited effort.
The practicality of utilizing VHR satellite imagery for monitoring mammals in Arctic sea ice has not been studied; it comes with financial limitations and other weather-related limitations [19]. Tasking satellite imagery is expensive and shapefiles of tasking regions are typically required days in advance of target dates for tasking [20]. This makes tasking small areas over primarily ice-covered waters challenging, especially when strong wind events move sea ice, quickly changing concentrations of sea ice dramatically [21], which can then impact where whales congregate. Furthermore, reduced sunlight hours in winter, cloud cover, and fog can also reduce the effectiveness of optical satellite imagery [19]. Another limiting factor for utilizing VHR imagery to survey beluga whales in winter is the difficulty of distinguishing beluga whales from similarly sized broken pieces of sea ice given their similarity in color, which also limits multispectral separation [22]. The detectability of beluga whales in VHR satellite imagery during the winter amongst sea ice has not yet been formally assessed.
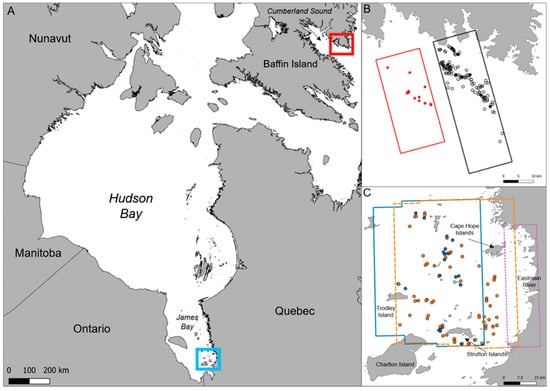
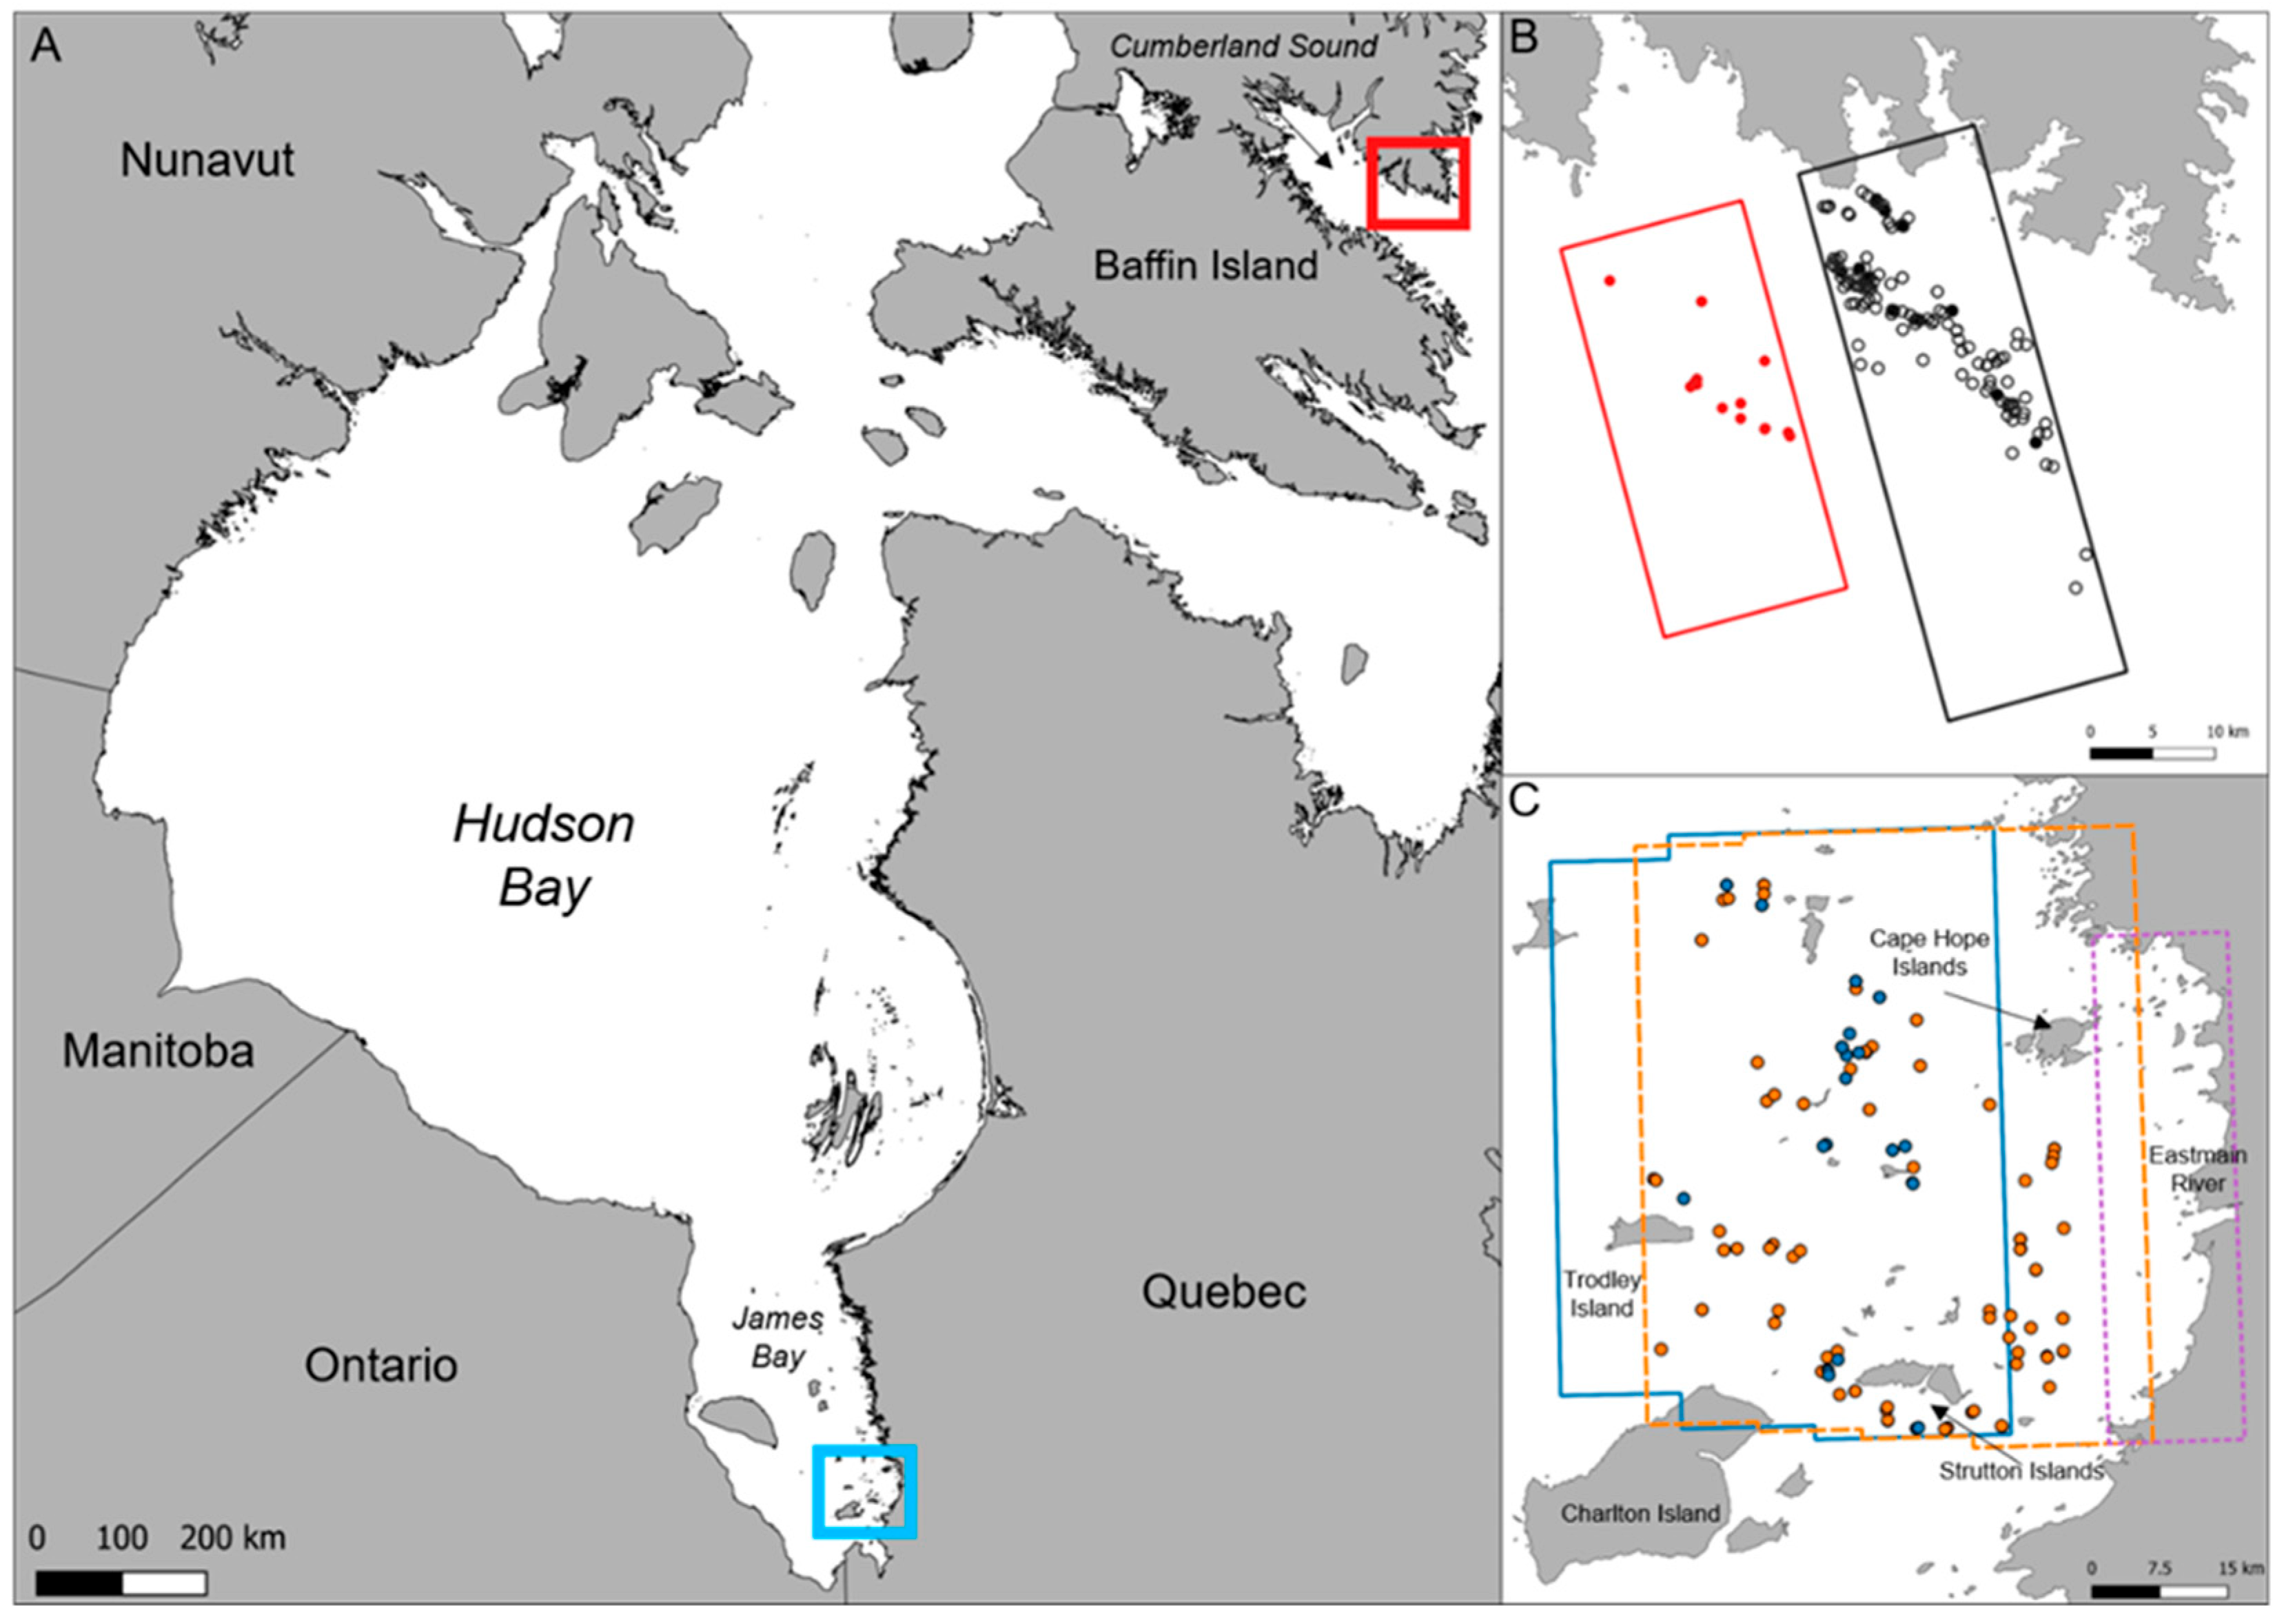
Our objective was to assess the feasibility of (1) acquiring VHR satellite imagery in winter and (2) detecting beluga whales among ice. We focused our tasking of VHR satellite imagery to Cumberland Sound and James Bay, Nunavut, Canada (Figure 1), where beluga whales are known to congregate in winter. The Cumberland Sound beluga whale population is estimated to be less than 2000 individuals [10,23]. They have a small annual migration and are believed to remain within Cumberland Sound year-round [15]. The last telemetry data collected for this population was in 2008, and it indicated that these whales overwinter approximately December through March in the southeast polynya of Cumberland Sound along the Cumberland Peninsula [15]. Although this information is outdated, it is the only available information on the wintering region of Cumberland Sound beluga. Harp seals are present in the area but are distinguishable from beluga whales in summer imagery primarily based on their size [10]. James Bay beluga whales are estimated at approximately 11,500 whales [23], and telemetry tags equipped in 2007–2009 indicate that beluga whales occupy open water and leads surrounding the Charlton and Cape Hope Islands [16,24] (Figure 1). Although this telemetry data is >15 years old, beluga whale vocalizations were also detected in the region in winter 2022 and 2023 using passive acoustic monitoring (A. Long pers. comm.). No other cetacean species regularly inhabit James Bay during the winter; however, several pinniped species are present [25], but they are distinguishable from beluga whales in VHR satellite imagery given their differences in size and coloration. Beluga whales in close proximity to conspecifics may be more distinguishable from sea ice if they are synchronized in their orientation; however, individual whales may be more difficult to discern from broken ice. We hypothesized that we would be able to detect beluga whales and distinguish them from ice in 31 cm resolution satellite imagery and expected that high-definition sharpening of optical satellite imagery would improve resolution and increase detection confidence. The results of this study provide important information on the use of VHR satellite imagery to monitor beluga whales year-round.
Figure 1.
(A) Satellite imagery acquired in Cumberland Sound (red) and James Bay (blue). (B) Foot prints of 31 cm very-high-resolution (VHR) satellite imagery from 5 February 2022 (red) and 14 March 2022 (black) in Cumberland Sound and (C) 29 January 2024 (solid blue), 22 February (dashed orange), and 5 March 2024 (dotted purple) in James Bay. Points indicate locations of uncertain detections in 31 cm resolution imagery. Open and closed points indicate uncertain detections in 31 cm and 15 cm resolution imagery, respectively.
2. Materials and Methods
A WorldView3 satellite (WV3; Maxar Technologies Inc., Westminster, CO, USA) was tasked to collect 31 cm resolution images near the mouth of Cumberland Sound between late-January and March 2022 and of southern James Bay encapsulating Charlton Island, Trodley Island, Strutton Islands, and the Eastmain River estuary between January and March 2024 (Figure 1; Table 1), with preference for images with less than 15% cloud cover. Cumberland Sound was imaged on 5 February and 14 March 2022 covering 243 km2 and 502 km2, respectively (Table 1). The Cumberland Sound image collected on 14 March 2022 was also HD-sharpened to 15 cm resolution using Maxar’s proprietary sharpening algorithm; both the 31 cm and 15 cm images were analyzed. Maxar’s sharpening algorithm sharpens edges within the image but does not add any spatial information. In James Bay, images were collected on 29 January, 22 February, and 5 March 2024 covering 832–3557 km2 (Table 1). Beluga whales were detected on the panchromatic band (black and white). Beaufort Sea State (BSS) in open-water areas was visually assessed from white caps in the imagery (https://www.weather.gov/pqr/beaufort (accessed on 12 September 2025) (Table 1).
Table 1.
Optical satellite images collected by the Worldview 3 satellite at 31 cm resolution of two known wintering regions for beluga whales in the Canadian Arctic (see Figure 1). The Cumberland Sound 14 March 2022 image was also HD-sharpened to 15 cm resolution by Maxar using their proprietary sharpening algorithm. Beaufort Sea State (BSS) was visually assessed from white caps in the imagery.
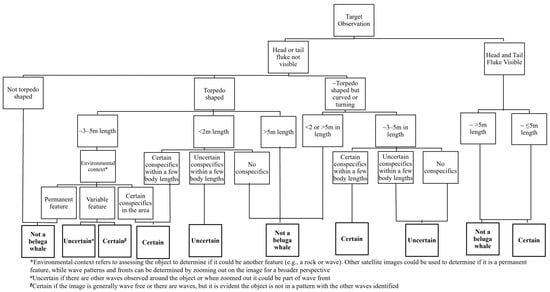
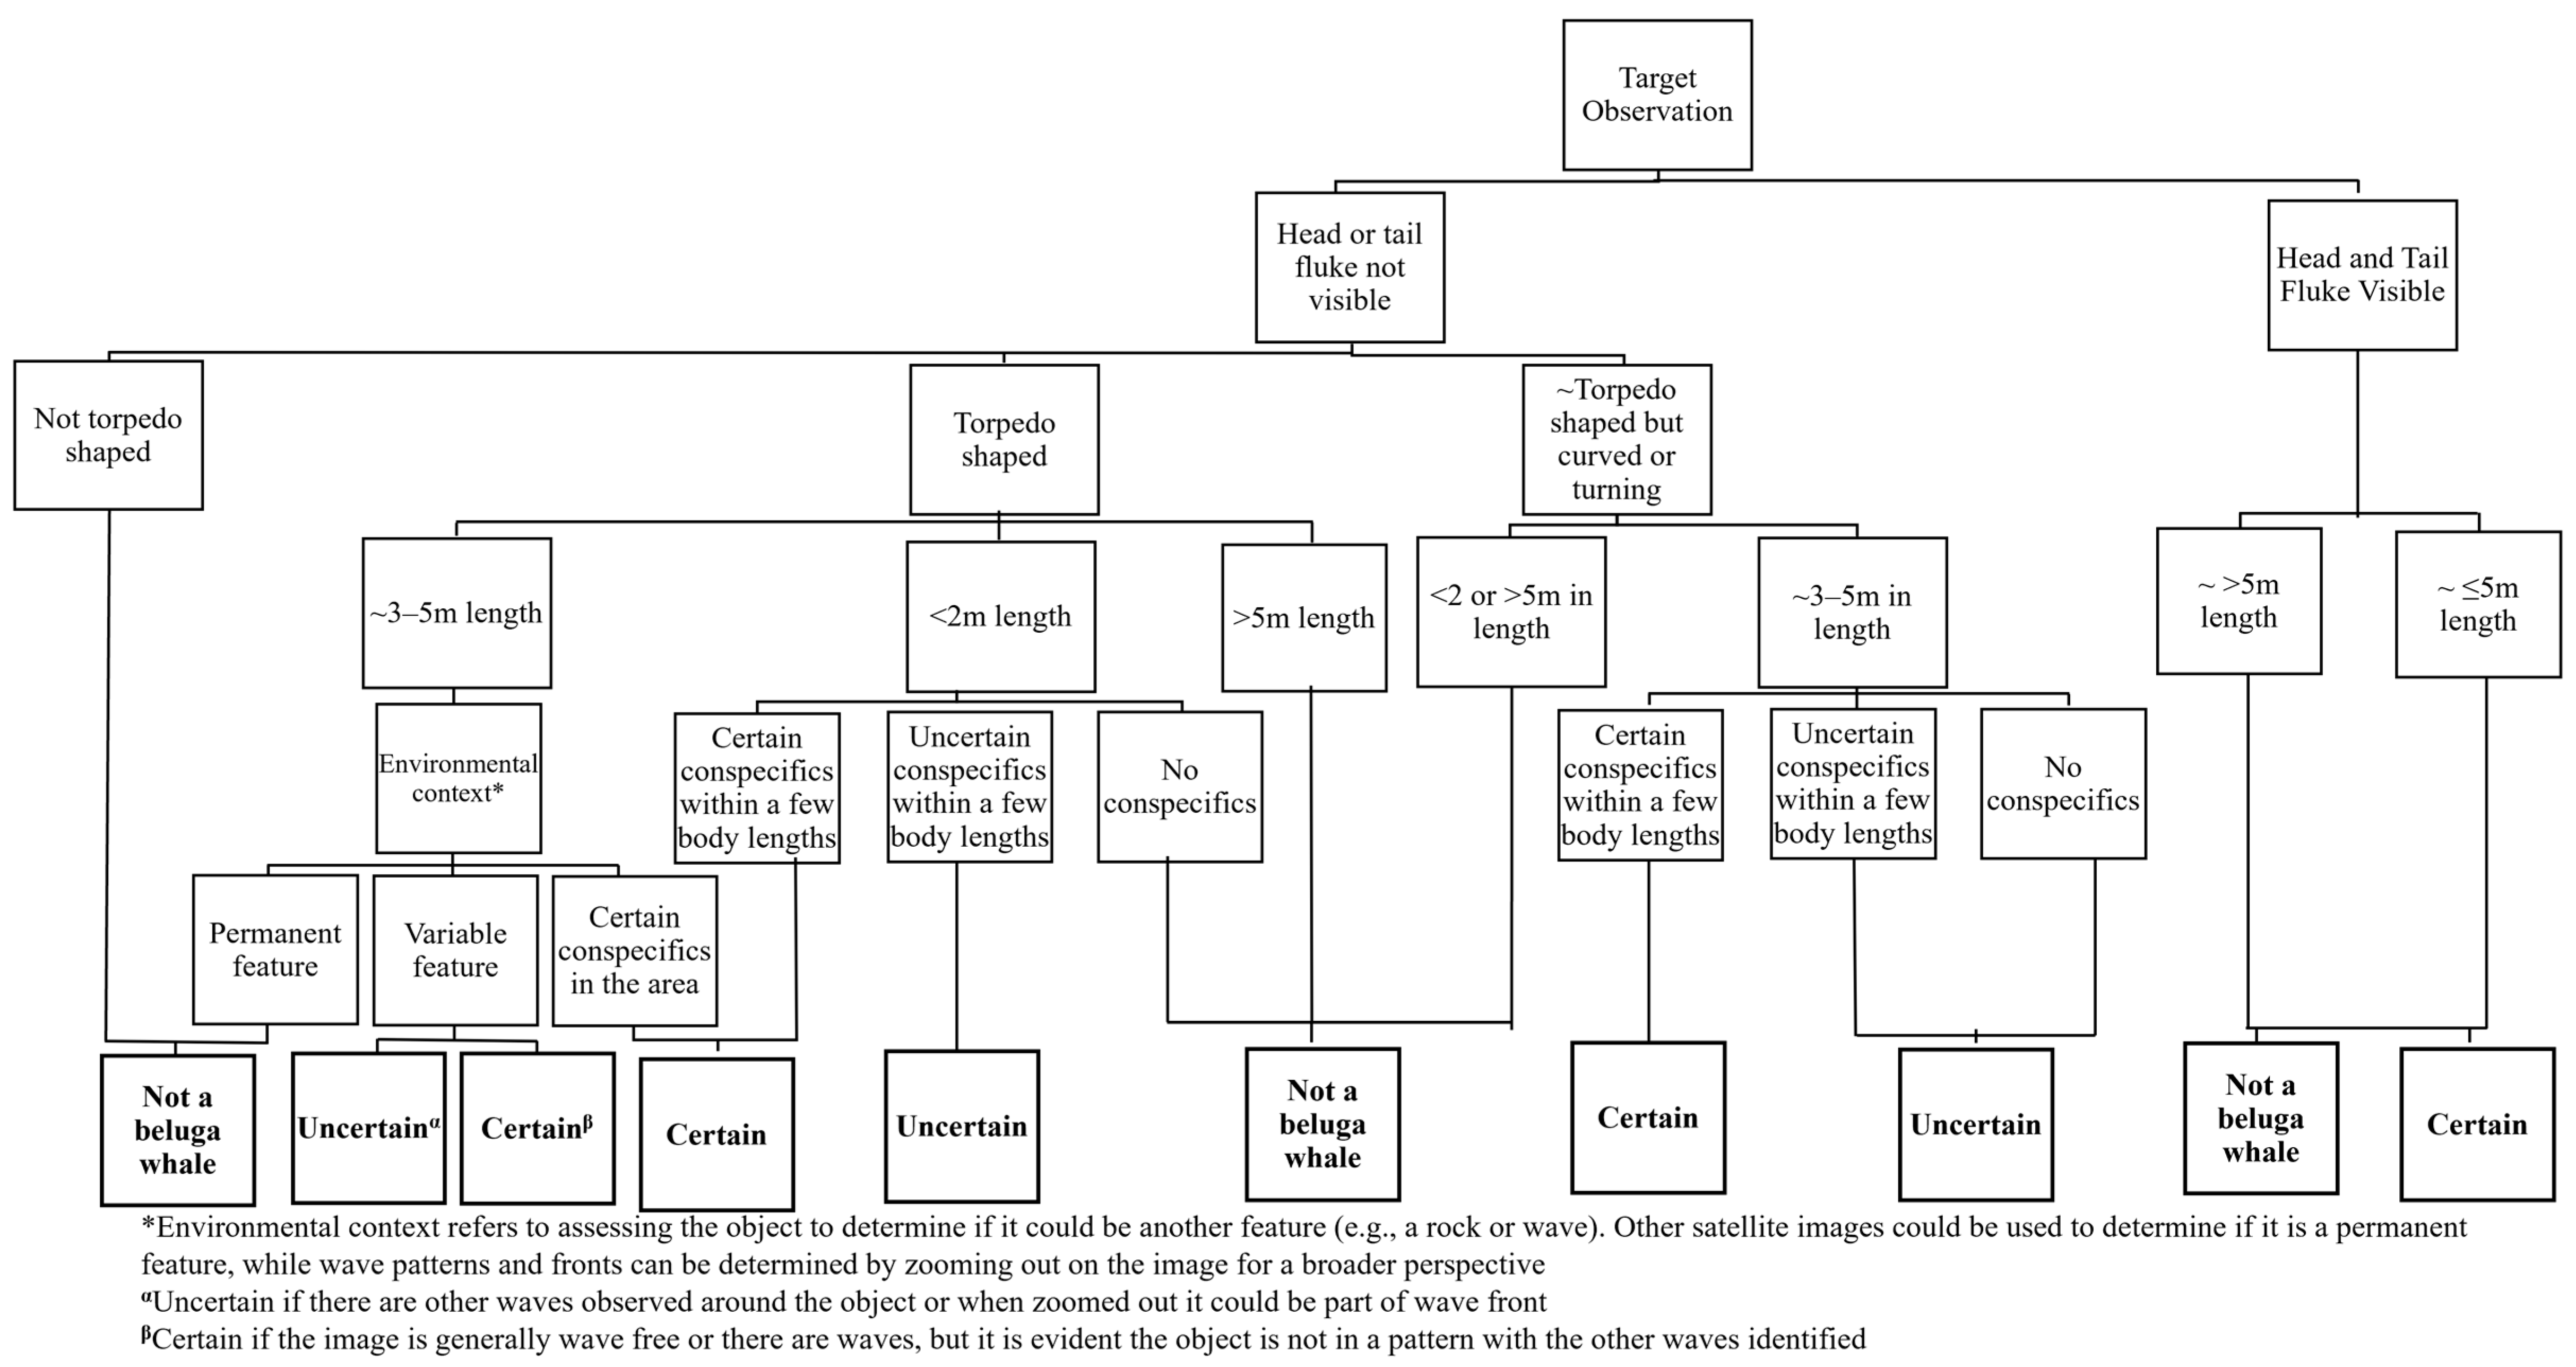
VHR satellite images were interpreted using GIS software (ArcGIS Pro 2.9.8 and QGIS 3.40.7). Three experienced observers manually read individual images and recorded potential beluga whales (targets) as georeferenced data points by scanning 250 × 250 m square grids which were overlaid on the image. Each target observation was scored with a confidence of “uncertain” or “certain” depending on the presence of beluga whale features (e.g., body length, body shape, visible tail flukes, and/or head) or spatial context (e.g., proximity to other certain whale targets; Figure 2 [11,12]). Uncertain detections are effectively objects of interest that appear beluga-like but cannot be confirmed as beluga whales (see Figure 2), and thus they cannot be used to assert the presence of beluga whales. Body length vectors were measured directly from the orthorectified images and were added from the approximate start and end of each beluga target using “Generate Points Along Lines”, “Points Along Geometry”, or “Ruler” tools depending on the GIS software. There was no correction applied to account for off-nadir images as these were only approximations [14]. Disagreements among readers for certain whale targets are usually adjudicated by all readers to reach consensus; however, no certain targets were identified (see Section 3). Initial percent agreement between readers for beluga whale detections prior to consensus is estimated at ~85% [10].
Figure 2.
Decision tree to determine whether manually detected targets are certain or uncertain beluga whale detections in very-high-resolution satellite imagery.
3. Results
3.1. Feasibility of Tasking
Competition for tasking with other entities was not an issue in the winter months, which meant that our tasked regions were the priority. In James Bay from January to March, light was not a limiting factor in the winter; nine images were collected between 29 January and 5 February 2024 with <15% cloud cover. The images were acquired on three days and had >85% ice cover; three images (one from each day) were purchased. Tasking in southern Cumberland Sound was light-restricted until the third week of January, and due to rapidly shifting ice (as interpreted qualitatively from NASA Worldview website (https://worldview.earthdata.nasa.gov/, accessed on 18 February 2026)), multiple shapefiles had to be submitted to try to capture open water. Four images were collected with <15% cloud cover, and the two images with the most open water (~40%) were selected for purchase.
3.2. Feasibility of Whale Detection
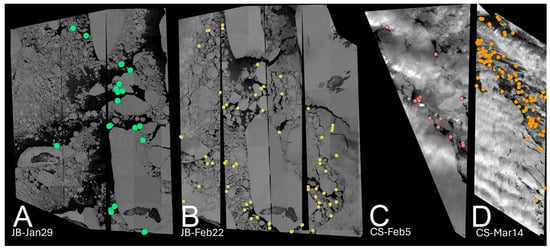
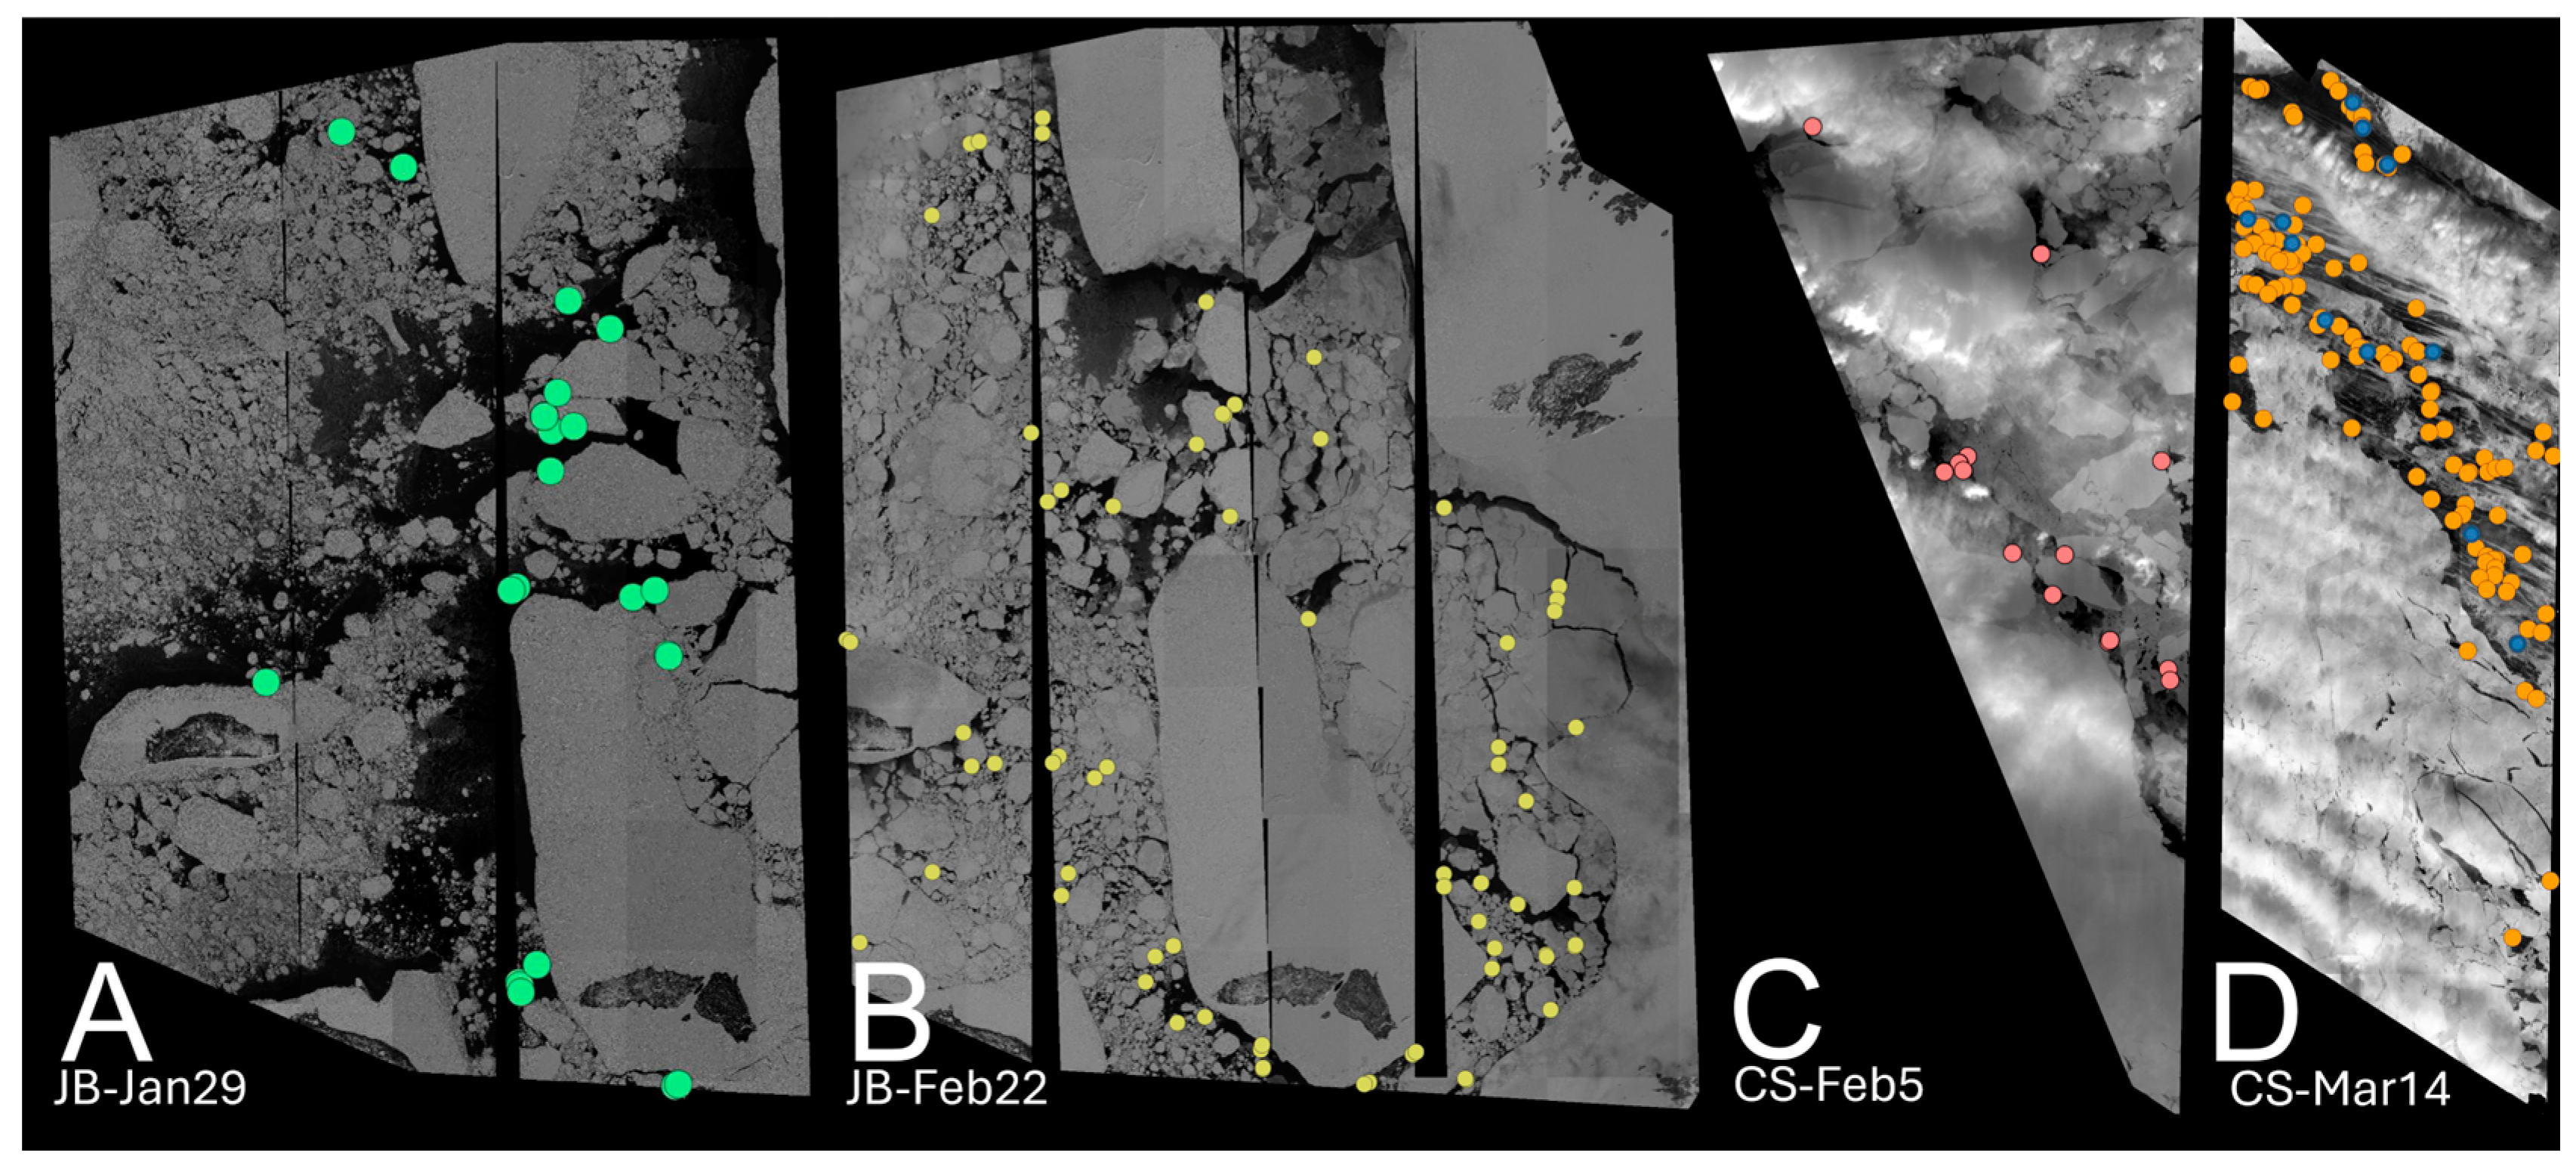
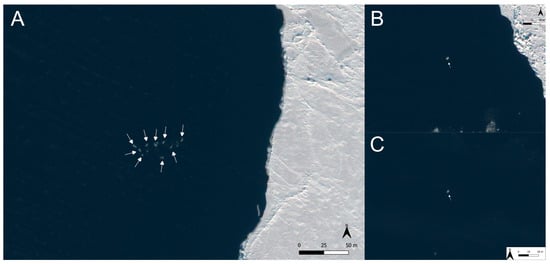
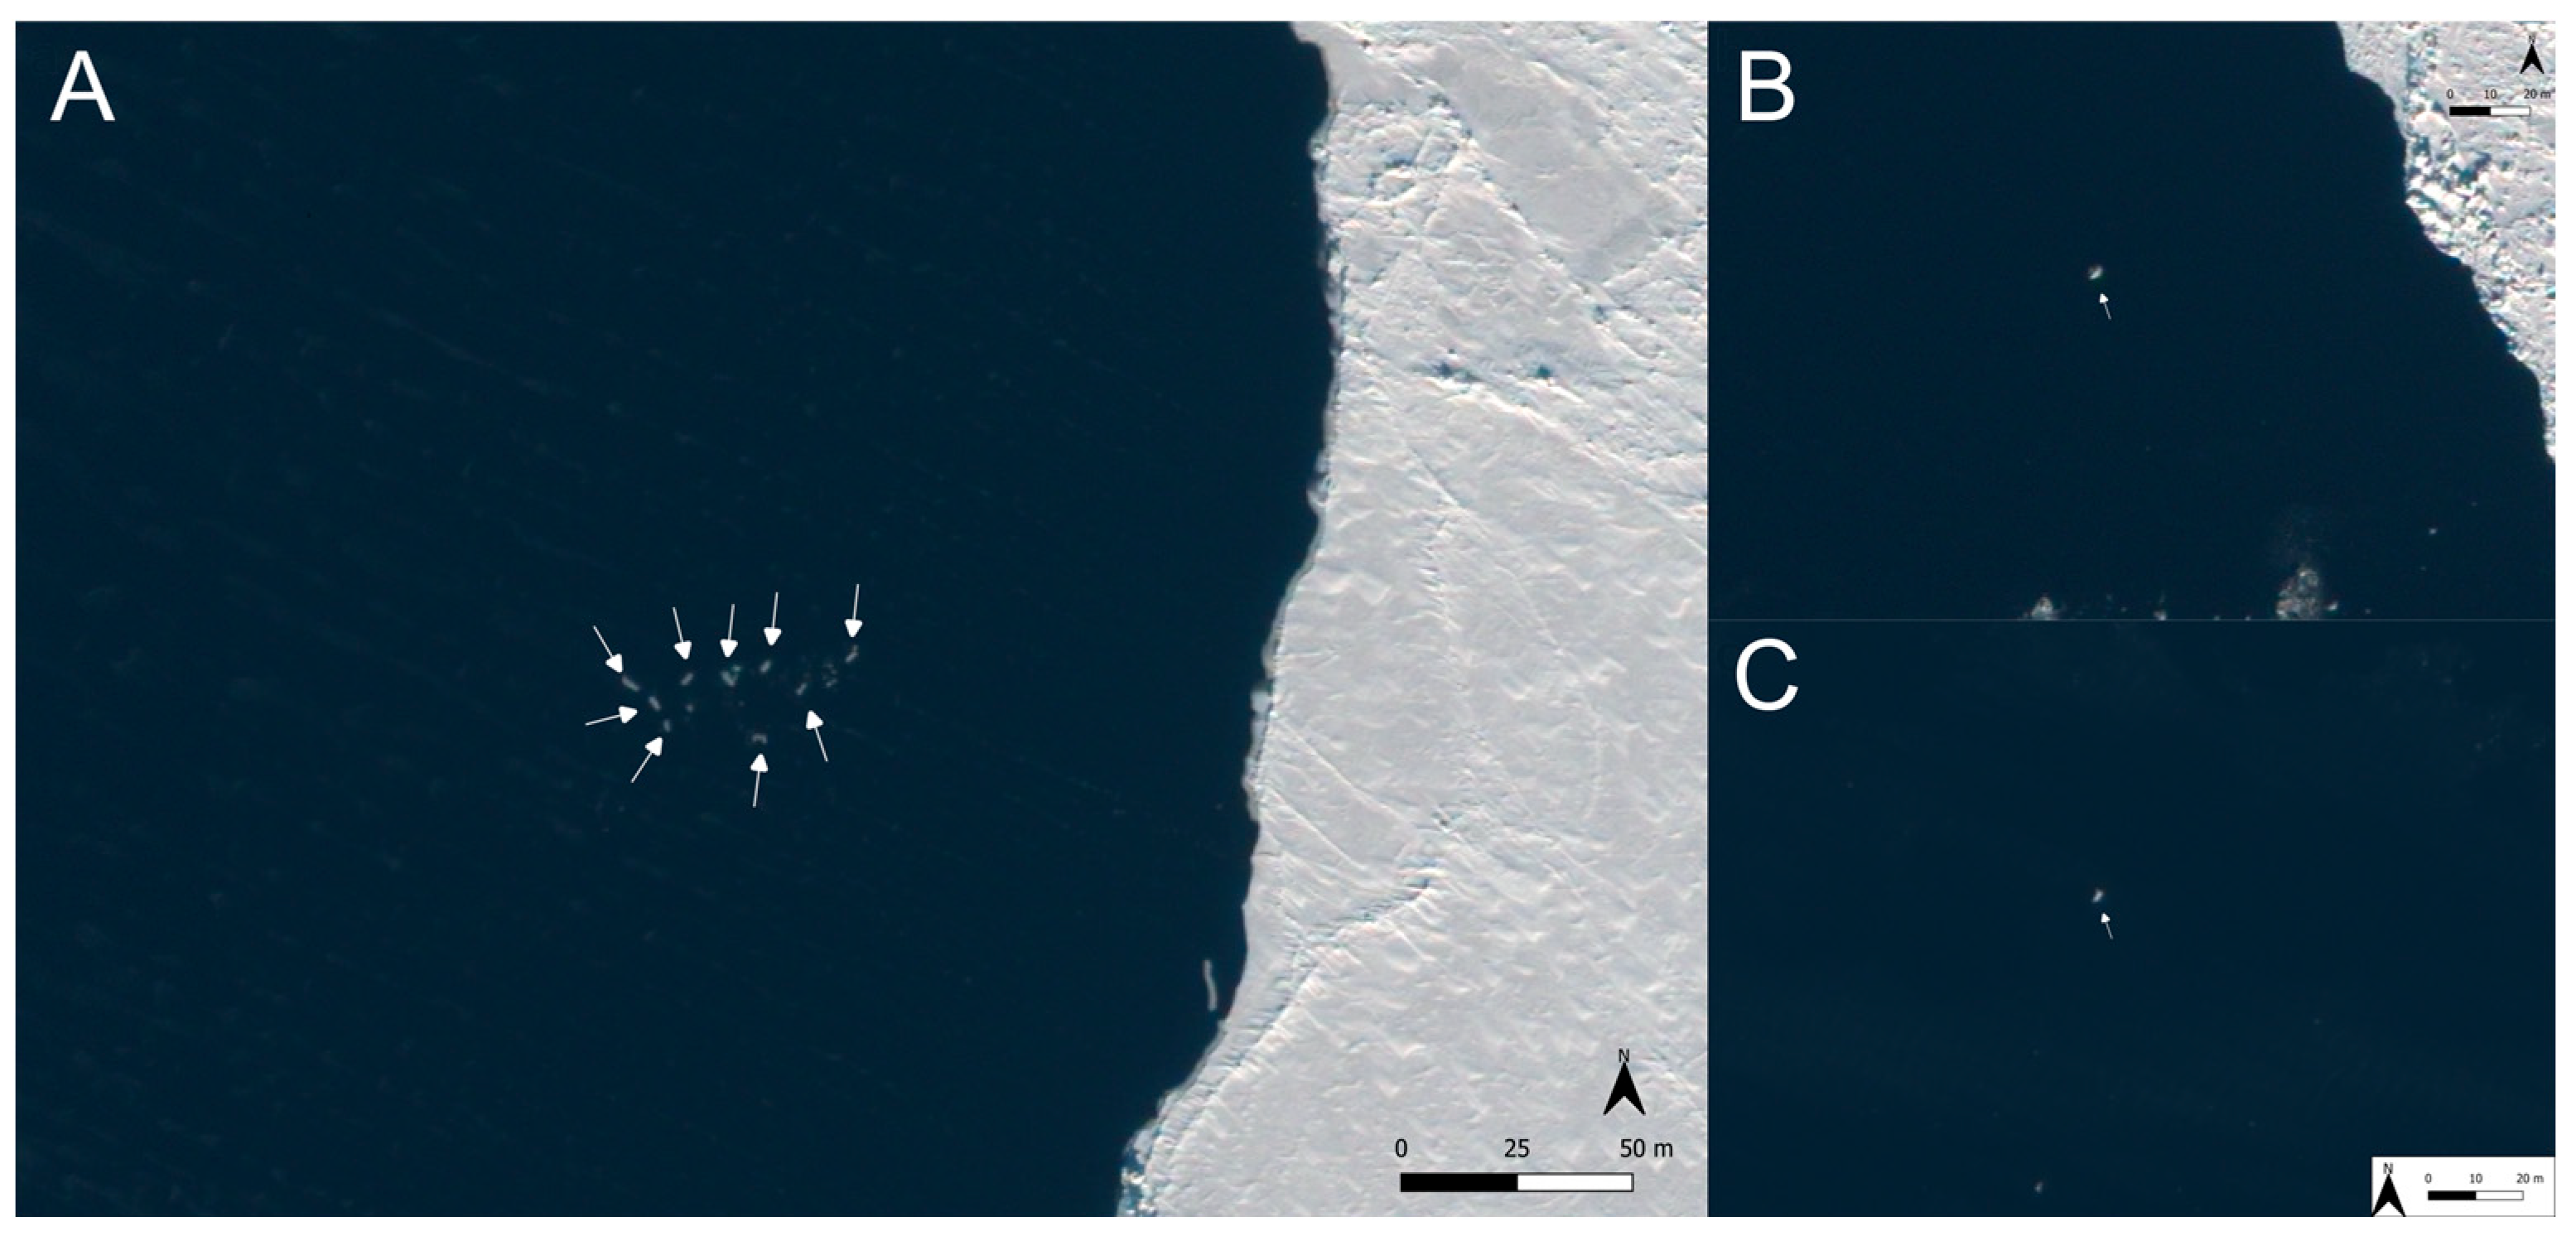
Experienced imagery readers are required to come to a consensus on discrepancies among certain detections; however, no reader identified any certain detections in the winter imagery. We observed 0 certain and 124 uncertain beluga whales in ~736 km2 of open water in James Bay and 0 certain and 170 uncertain beluga whales in ~111 km2 of open water in Cumberland Sound in 31 cm resolution VHR satellite imagery (Figure 3; Supplementary Data). The greater number of uncertain detections in Cumberland Sound may have resulted from it having a higher BSS than James Bay, resulting in white caps being perceived as uncertain detections. In the Cumberland Sound image collected on 14 March 2022 that was HD-sharpened to 15 cm resolution, we observed 0 certain and 12 uncertain beluga whales compared to 0 certain and 144 uncertain beluga whales in the 31 cm version (Figure 3; Supplementary Data). This reduction resulted from the sharpening of uncertain detections that resulted in them becoming “not a beluga whale”. However, even with sharpening, we were unable to identify any certain targets and thus unable to determine if the sharpening increased detection confidence for certain detections. We did not observe any beluga whales, and most uncertain detections vaguely resembled beluga whale body shapes and sizes (i.e., ~3–5 m in length), but could not be discerned from sea ice (e.g., head and/or tail fluke not visible, no certain conspecifics near, etc.; Figure 2 and Figure 4).
Figure 3.
Uncertain whale detections in James Bay on (A) 29 January (green points) and (B) 22 February (yellow), 2024 and in Cumberland Sound on (C) 5 February (red) and (D) 14 March (orange), 2022 in 31 cm resolution imagery. The image on 14 March was also HD-sharpened using Maxar’s proprietary sharpening algorithm, which reduced uncertain detections (blue).
Figure 4.
Examples with arrows pointing to (A) 9 and (B) and (C) single uncertain detections (measured at 1–4 m in length but not confidently distinguished from ice (see Figure 2 for key)) in 31 cm resolution satellite imagery. Observations are from 29 January 2024 imagery with a mean off-nadir angle of 28.5°, mean ground sampling distance of 38.9 cm, and mean sun azimuth of 168.4°.
4. Discussion
Although imagery acquisition in the winter months is challenging, it is feasible; however, our results suggest that beluga whales cannot be confidently detected amongst dense sea ice in wintering grounds with current imagery resolutions using manual detection methods. In contrast, beluga whales were successfully detected in winter aerial surveys in Cook Inlet, Alaska [25], and in Western Greenland [18,26], which were conducted with visual observers. VHR satellite imagery at resolutions as low as 50 cm have been used to detect and estimate beluga whale abundance and distribution for several populations across Arctic and sub-Arctic regions [10,27]. All of the current published work, however, has been conducted during summer months with little or no sea ice present in the imagery. Given the lack of certain detections in the winter imagery, it is likely that a resolution of 31 cm is too low to confidently distinguish between sea ice and beluga whales. In summer, when there is no ice present, the full body of a beluga whale does not necessarily need to be visible to confidently identify the whale as context clues allow for greater confidence in identifying beluga whales. However, in winter imagery, a beluga-shaped object could just as easily be ice, and therefore the ability to identify it as a beluga whale decreases, making it virtually impossible to detect beluga whales at the current resolution if the full body is not at the surface. In contrast, narwhals, which are similar in size, were distinguished from ice by their torpedo shape, gray shade, and tail fluke when visible in 31 cm resolution satellite imagery in May 2022 with ice cover between 14 and 79% [9]. The easier distinction between narwhals and sea ice could also be due to the whales’ behavior at the time of image acquisition.
When whales are making deep dives, it is assumed they are foraging [28], and deep diving in the winter has been seen for both the James Bay [16] and Cumberland Sound beluga populations [29]. Beluga whales in these populations dive significantly more [16] and significantly deeper in the winter months compared to summer [16,29]. When deep diving, whales are less likely to be at the surface and thus their heads or tail flukes may be less visible because of their posture (not streamlined) when they are about to take a dive. Foraging at the surface can also result in the animal’s path to have increased tortuosity [30], which may make their body position less streamlined and more difficult to identify from sea ice. Fretwell et al. [27] found that beluga whales in images from the Kara Sea exhibited two different behaviors: travelling, which resulted in streamlined beluga whale bodies, and in this position tail flukes were quite easy to identify, and what they interpreted as foraging behavior, where their tail flukes were often not visible (see Figure 3 in [27]). However, these two behaviors were identified in images with different resolutions, and therefore this warrants further study. Regardless, it is possible that the behavior of the whales in James Bay and Cumberland Sound in the winter, mixed with the possibility of misidentification with ice, presents low confidence for beluga whale detection in optical satellite imagery in winter. There are other non-optical sources of satellite imagery that have potential for advancing whale detection in the winter. For instance, thermal infrared satellite imagery can be used to detect emitted heat radiation [31], and infrared imagery from aircraft have been useful to detect seals from aircraft [32] and whales from drones [33]. However, whales just under the surface of the water do not emit the same signature heat signal, and whether whales can be detected using thermal infrared satellite imagery has not been investigated to the best of our knowledge. Synthetic aperture radar (SAR) imagery can image through cloud cover, which would help to improve the feasibility of tasking [34]. SAR imagery has shown promise in the detection of large whales by identifying ocean features that can be associated with whales [35], but currently there are no feasibility studies for using SAR imagery for medium-sized whales that rely on prey at depth.
Continued advancements in VHR imagery may one day allow for beluga whales to be detected amongst sea ice, and confident detections can be adjusted for whales that are too deep to be seen in the imagery (known as availability bias) to obtain an estimate of abundance [9,10]. For example, the recently launched Albedo satellite can deliver a resolution of 10 cm [20]. Pansharpened imagery, the combination of high-resolution panchromatic imagery with lower-resolution multispectral imagery, has proven to be effective in the detection of several cetacean species [36,37], but it is unlikely to greatly improve the detections of beluga whales in winter due to the similar coloration of ice and beluga whales. Additionally, panchromatic imagery was shown to be as effective as pansharpened imagery at detecting beluga whales [8]. We also cannot rule out the possibility that beluga whales were not present at the time of our imagery captures given that we did not observe any “certain” detections. While beluga whales have previously been observed in both study areas during a similar time of the year [15,16,24], those observations are over at least a decade old. The presence of beluga whales in James Bay in winter has been confirmed by hydrophones deployed in winter 2022 and 2023, with the 2023 detections being within the imaged area (A. Long pers. comm.), but this does not rule out the possibility that they were elsewhere in James Bay at the time of imaging. In Cumberland Sound, only one beluga whale was detected during a March 2023 Fisheries and Oceans Canada photographic aerial survey (unpublished data), and given the heavy ice observed in the satellite imagery and aerial survey in both years, it is possible the Cumberland Sound whales now overwinter in a different region than was identified from the tagging data acquired almost 20 years ago [15]. Continuing to improve our ability to monitor beluga whales in their wintering distribution may become increasingly important given current and future changes to Arctic sea ice duration and extent [38], which increases the risk of ice entrapment or can alter overwintering distributions [39,40].
The feasibility assessment we present only pertains to high-ice-cover areas with brash ice. Larger open-water polynyas that are present in the winter, such as the North Water Polynya [18], or areas where there is a defined floe edge with little presence of brash ice would likely result in increased detection confidence. However, obtaining VHR satellite imagery in winter amongst shifting sea ice is challenging, and we found that higher-resolution imagery (<30 cm) is required to confidently detect beluga whales in areas with high ice cover, especially in brash ice.
Supplementary Materials
The following supporting information can be downloaded at https://www.mdpi.com/article/10.3390/jmse14040397/s1, CS_20220205.shp, CS_20220314_15cm.shp, CS_20220314_30cm.shp, JamesBay.shp.
Author Contributions
Conceptualization, J.B.S., C.A.W. and M.M.; methodology, J.B.S., B.A.H.S. and A.M.B.; formal analysis, J.B.S., B.A.H.S. and A.M.B.; writing—original draft preparation, J.B.S. and C.A.W.; writing—review and editing, J.B.S., C.A.W., B.A.H.S., A.M.B. and M.M.; supervision, C.A.W.; funding acquisition, C.A.W. All authors have read and agreed to the published version of the manuscript.
Funding
This research was funded by Fisheries and Oceans Canada Species at Risk Program and Crown Indigenous Relations and Northern Affairs Canada (CIRNAC).
Institutional Review Board Statement
Not applicable.
Informed Consent Statement
Not applicable.
Data Availability Statement
The imagery used in this article cannot be made available due to copyright agreements with Maxar Technologies. The image catalogue identifiers are outlined in Table 1. Shapefiles of detections are found in the Supplementary Materials.
Acknowledgments
Thank you also to Maxar technologies for the imagery, with special thanks to J. Roos, V. Wu, and M. She for technical support. We also thank Whale Seeker for assistance with providing reference imagery annotations. Thank you to two anonymous reviewers whose comments improved the final version of this paper.
Conflicts of Interest
The authors declare no conflicts of interest.
References
- Gosselin, J.-F.; Hammill, M.O.; Mosnier, A. Indices of abundance for beluga (Delphinapterus leucas) in James Bay and eastern Hudson Bay in summer 2015. DFO Can. Sci. Advis. Sec. Res. Doc. 2017. 2017/067. iv + 25 p. [Google Scholar]
- George, J.C.; Zeh, J.; Suydam, R.; Clark, C. Abundance and population trend (1978–2001) of western Arctic bowhead whales surveyed near Barrow, Alaska. Mar. Mammal Sci. 2004, 20, 755–773. [Google Scholar] [CrossRef] [Scilit]
- Hobbs, R.C.; Rugh, D.J.; Demaster, D.P. Abundance of belugas, Delphinapterus leucas, in Cook Inlet, Alaska, 1994–2000. Mar. Fish. Rev. 2000, 62, 37–45. [Google Scholar]
- Innes, S.; Heide-Jørgensen, M.P.; Laake, J.L.; Laidre, K.L.; Cleator, H.J.; Richard, P.; Stewart, R.E.A. Surveys of belugas and narwhals in the Canadian High Arctic in 1996. NAMMCO Sci. Publ. 2002, 4, 169–190. [Google Scholar] [CrossRef] [Scilit]
- Patenaude, N.J.; Richardson, W.J.; Smultea, M.A.; Koski, W.R.; Miller, G.W.; Würsig, B.; Greene, C.R. Aircraft sound and disturbance to bowhead and beluga whales during spring migration in the Alaskan Beaufort Sea. Mar. Mammal Sci. 2002, 18, 309–335. [Google Scholar] [CrossRef] [Scilit]
- Dawson, S.; Wade, P.; Slooten, E.; Barlow, J. Design and field methods for sighting surveys of cetaceans in coastal and riverine habitats. Mammal Rev. 2008, 1, 19–49. [Google Scholar] [CrossRef] [Scilit]
- Cubaynes, H.C.; Forcada, J.; Kovacs, K.M.; Lydersen, C.; Downie, R.; Fretwell, P.T. Walruses from space: Walrus counts in simultaneous remotely piloted aircraft system versus very high-resolution satellite imagery. Remote Sens. Ecol. Conserv. 2024, 10, 563–667. [Google Scholar] [CrossRef] [Scilit]
- Charry, B.; Tissier, E.; Iacozza, J.; Marcoux, M.; Watt, C.A. Mapping Arctic cetaceans from space: A case study for beluga and narwhal. PLoS ONE 2021, 16, e0258238. [Google Scholar] [CrossRef] [Scilit] [PubMed]
- Sherbo, B.A.H.; Marcoux, M.; Watt, C.A. Use of optical satellite imagery to estimate abundance of narwhal (Monodon monoceros) in Makinson Inlet in the Canadian high Arctic. Ecol. Info. 2025, 92, 103525. [Google Scholar] [CrossRef] [Scilit]
- Sherbo, B.A.H.; Belanger, A.M.; Charry, B.; Watt, C.A. Using satellite imagery to estimate abundance of Cumberland Sound beluga whales (Delphinapterus leucas) in 2021. Front. Mar. Sci. 2024, 11, 1422907. [Google Scholar] [CrossRef] [Scilit]
- COSEWIC. Designatable Units for Beluga Whales (Delphinapterus leucas) in Canada; Committee on the Status of Endangered Wildlife in Canada: Ottawa, ON, Canada, 2016; Available online: https://cosewic.ca/images/cosewic/pdf/beluga_whale_dus_en.pdf (accessed on 18 February 2026).
- Turgeon, J.; Duchesne, P.; Colbeck, G.J.; Postma, L.D.; Hammill, M.O. Spatiotemporal segregation among summer stocks of beluga (Delphinapterus leucas) despite nuclear gene flow: Implications for the endangered belugas in eastern Hudson Bay (Canada). Conserv. Genet. 2012, 13, 419–433. [Google Scholar] [CrossRef] [Scilit]
- Hauser, D.D.W.; Laidre, K.L.; Suydam, R.S.; Richard, P.R. Population-specific home ranges and migration timing of Pacific Arctic beluga whales (Delphinapterus leucas). Polar Biol. 2014, 37, 1171–1183. [Google Scholar] [CrossRef] [Scilit]
- Gosselin, J.-F.; Doniol-Valcroze, T.; Hammill, M.O. Abundance estimate of beluga in eastern Hudson Bay and James Bay, summer 2011. DFO Can. Sci. Advis. Sec. Res. Doc 2013. 2013/016. vii + 20 p. [Google Scholar]
- Richard, P.R.; Stewart, D.B. Information Relevant to the Identification of Critical Habitat for Cumberland Sound Belugas (Delphinapterus leucas); Fisheries and Oceans Canada: Ottawa, ON, Canada, 2008; Available online: https://waves-vagues.dfo-mpo.gc.ca/library-bibliotheque/336597.pdf (accessed on 18 February 2026).
- Bailleul, F.; Lesage, V.; Power, M.; Doidge, D.W.; Hammill, M.O. Differences in diving and movement patterns of two groups of beluga whales in a changing Arctic environment reveal discrete populations. Endang. Species Res. 2012, 17, 27–41. [Google Scholar] [CrossRef] [Scilit]
- Giard, S.; Simard, Y.; Roy, N. Decadal passive acoustics time series of St. Lawrence estuary beluga. J. Acoustic. Soc. Am. 2020, 147, 1874–1884. [Google Scholar] [CrossRef] [Scilit]
- Heide-Jørgensen, M.P.; Sinding, M.H.S.; Nielsen, N.H.; Rosing-Asvid, A.; Hansen, R.G. Large numbers of marine mammals winter in the North Water polynya. Polar Biol. 2016, 39, 1605–1614. [Google Scholar] [CrossRef] [Scilit]
- Clarke, P.J.; Cubaynes, H.C.; Jackson, J.A.; Taylor, N.L.; Johnston, D.W.; de Vos, A.; Fretwell, P.T.; Skachkova, A.; Jones, G. Talking about the weather: The feasibility of using Very High-Resolution optical satellite imagery to monitor live and stranded cetaceans around the UK and UK Overseas territories. Mar. Mammal Sci. 2025, 42, e70074. [Google Scholar] [CrossRef] [Scilit]
- Khan, C.B.; Goetz, K.T.; Cubaynes, H.C.; Robinson, C.; Murnane, E.; Aldrich, T.; Sackett, M.; Clarke, P.J.; LaRue, M.A.; White, T.; et al. A Biologist’s Guide to the Galaxy: Leveraging Artificial Intelligence and Very High-Resolution Satellite Imagery to Monitor Marine Mammals from Space. J. Mar. Sci. Eng. 2023, 11, 595. [Google Scholar] [CrossRef] [Scilit]
- Wang, X.; Zhang, Z.; Wang, X.; Vihma, T.; Zhou, M.; Yu, L.; Uotila, P.; Sein, D.V. Impacts of strong wind evens on sea ice and water mass properties in Antarctic coastal polynyas. Clim. Dyn. 2021, 57, 3505–3528. [Google Scholar] [CrossRef] [Scilit]
- Iacozza, J.; Sherbo, B.; Watt, C. A semi-automated method using object-based image analysis (OBIA) to detect and enumerate beluga whales in summer from very high-resolution (VHR) satellite imagery. PLoS ONE 2024, 19, e0307716. [Google Scholar] [CrossRef] [Scilit]
- Sauvé, C.; Mosnier, A.; Gosselin, J.-F. Abundance Estimates for Beluga (Delphinapterus leucas) in James Bay and the Belcher Islands-Eastern Hudson Bay Area in Summer 2024. DFO Can. Sci. Advis. Sec. Res. Doc. 2025. 2025/053. v + 67 p. [Google Scholar]
- Schwartz, F.H. Inuit land use in Hudson Bay and James Bay. In Inuit Land Use and Occupancy Report; Freeman, M.M.R., Ed.; Department of Indian and Northern Affairs: Ottawa, ON, Canada, 1976; Volume 1, pp. 115–120. Available online: https://publications.gc.ca/collections/collection_2018/aanc-inac/R2-46-1976-1-eng.pdf (accessed on 18 February 2026).
- Smith, T.G. Ringed Seals in James Bay and Hudson Bay: Population Estimates and Catch Statistics. J. Arct. Inst. N. Am. 1976, 28, 153–228. [Google Scholar] [CrossRef] [Scilit]
- Hansen, D.J.; Hubbard, J.D. Distribution of Cook Inlet Beluga Whales (Delphinapterus leucas) in Winter; US Department of the Interior, Minerals Management Service: Washington, DC, USA, 1999. [Google Scholar]
- Fretwell, P.T.; Cubaynes, H.C.; Shpak, O.V. Satellite image survey of beluga whales in the southern Kara Sea. Mar. Mammal Sci. 2023, 39, 1204–1214. [Google Scholar] [CrossRef] [Scilit]
- Martin, A.R.; Smith, T.G. Deep diving in wild, free-ranging beluga whales, Delphinapterus leucas. Can. J. Fish. Aquat. Sci. 1992, 49, 462–466. [Google Scholar] [CrossRef] [Scilit]
- Watt, C.A.; Orr, J.; Ferguson, S.H. A shift in foraging behaviour of beluga whales Delphinapterus leucas from the threatened Cumberland Sound population may reflect a changing Arctic food web. Endang Species Res. 2016, 31, 259–270. [Google Scholar] [CrossRef] [Scilit]
- Austin, D.; Bowen, W.D.; McMillan, J.I.; Iverson, S.J. Linking movement, diving, and habitat to foraging success in a large marine predator. Ecology 2006, 87, 3095–3108. [Google Scholar] [CrossRef] [Scilit]
- Price, J.C. On the analysis of thermal infrared imager: The limited utility of apparent thermal inertia. Remote Sens. Environ. 1985, 18, 59–73. [Google Scholar] [CrossRef] [Scilit]
- Young, B.G.; Yurkowski, D.J.; Dunn, J.B.; Ferguson, S.H. Comparing infrared imagery to traditional methods for estimating ringed seal density. Wild. Soc. Bull. 2019, 43, 121–130. [Google Scholar] [CrossRef] [Scilit]
- Matern, W.A.; Fleishman, A.B.; Gilbert, I.; Wilson, X.; Beddow, J.M.; Garfield, I.; Ornela, A.; McKown, M.; Robinson, P.W.; Beltran, R.S. Evaluating the efficacy of drone-based thermal images for measuring wildlife abundance and physiology. Mar. Mammal Sci. 2025, 41, e70019. [Google Scholar] [CrossRef] [Scilit]
- Asiyabi, R.M.; Ghorbanian, A.; Tameh, S.N.; Amani, M.; Jin, S.; Mohammadzadeh, A. Synthetic aperture radar (SAR) for ocean: A review. IEEE J. Select. Top. Apple. Earth Observ. Remote Sens. 2023, 26, 9106–9138. [Google Scholar] [CrossRef] [Scilit]
- Perrie, W.; Shen, H.; Tao, J.; Danielson, R.E. A Physical Index Towards Real Time Monitoring of Potential Whale Habitats from Space. Can. Tech. Rep. Fish. Aquat. Sci. 2023. 3533: v + 35 p. [Google Scholar]
- Fretwell, P.T.; Staniland, I.J.; Forcada, J. Whales from space: Counting southern right whales by satellite. PLoS ONE 2014, 9, e88615. [Google Scholar] [CrossRef] [Scilit] [PubMed]
- Hodul, M.; Knudby, A.; McKenna, B.; James, A.; Mayo, C.; Brown, M.; Durette-Morin, D.; Bird, S. Individual North Atlantic right whales identified from space. Mar. Mammal Sci. 2023, 39, 220–231. [Google Scholar] [CrossRef] [Scilit]
- Serreze, M.C.; Stroeve, J. Arctic sea ice trends, variability and implications for seasonal ice forecasting. Phil. Trans. R. Soc. 2015, 373, 20140159. [Google Scholar] [CrossRef] [Scilit]
- Heide-Jørgensen, M.P.; Laidre, K.L.; Borchers, D.; Marques, T.A.; Stern, H.; Simon, M. The effect of sea-ice loss on beluga whales (Delphinapterus leucas) in West Greenland. Polar Res. 2010, 29, 198–208. [Google Scholar] [CrossRef]
- Laidre, K.L.; Stirling, I.; Lowry, L.F.; Wiig, Ø.; Heide-Jørgensen, M.P.; Ferguson, S.H. Quantifying the sensitivity of arctic marine mammals to climate-induced habitat change. Ecol. Appl. 2008, 18, 97–125. [Google Scholar] [CrossRef] [Scilit]

Disclaimer/Publisher’s Note: The statements, opinions and data contained in all publications are solely those of the individual author(s) and contributor(s) and not of MDPI and/or the editor(s). MDPI and/or the editor(s) disclaim responsibility for any injury to people or property resulting from any ideas, methods, instructions or products referred to in the content. |
© 2026 by the authors. Licensee MDPI, Basel, Switzerland. This article is an open access article distributed under the terms and conditions of the Creative Commons Attribution (CC BY) license.