


Abstract
The swimming tilt angle of fish is one of the key factors influencing the estimation of target strength (TS). Therefore, understanding how TS varies with changes in swimming tilt angle is essential. This study employed the Kirchhoff-ray-mode (KRM) model to estimate TS and examine variations in the swimming tilt angle of sardines under flowing water conditions. Swimming tilt angles were measured at flow velocities of 30 and 50 cm/s. The KRM model was utilized to estimate TS for 17 sardine samples (total length: 13.0–24.6 cm) across four frequency bands (38, 70, 120, and 200 kHz). At a flow velocity of 30 cm/s, sardines swimming against the flow exhibited a mean swimming tilt angle of 4.0° ± 14.0°, with normalized mean TScm values of −64.7 dB at 38 kHz, −65.7 dB at 70 kHz, −66.4 dB at 120 kHz, and −66.9 dB at 200 kHz. At a flow velocity of 50 cm/s, sardines swimming against the flow showed a mean swimming tilt angle of −2.2° ± 10.1°, with normalized mean TScm values of −62.9 dB at 38 kHz, −63.7 dB at 70 kHz, −64.3 dB at 120 kHz, and −64.8 dB at 200 kHz. Considering the results of this study and the swimming behavior of sardines against the flow, the target strength of sardines swimming with the flow may be of less concern. Therefore, when conducting acoustic surveys, it is more efficient to account for flow velocity conditions rather than swimming direction.
1. Introduction
The sardine (Sardinops sagax) is a clupeid fish belonging to the order Clupeiformes and family Clupeidae, and it is primarily distributed in the southern and eastern waters of South Korea [1]. The sardine occupies a mid-trophic position in the marine food web, linking primary producers (phytoplankton and zooplankton) to top predators such as marine mammals, squids, and mackerels. Therefore, it is considered to be a biologically valuable species in South Korea’s coastal ecosystems [2,3]. The sardine is an important global fishery resource. It is commercially valuable as it is widely used as an alternative to anchovies in aquaculture feed, fermented seafood products, and other applications [4,5]. In Korea, the catch of sardines has shown a steady increase, rising from 2500 metric tons in 2011 to 44,000 metric tons in 2023 [6]. To ensure the sustainable utilization of this resource, appropriate fishery management strategies and continuous monitoring based on scientific research are essential.
Acoustic surveys are one of the scientific methods used to monitor fishery resources. This approach employs scientific echosounders mounted on research vessels to survey the entire water column of a study area within a short period of time, and because it does not cause harm to marine organisms, it is one of the most widely used methods in many countries around the world [7,8,9,10,11,12]. To estimate the density and abundance of target organisms using acoustic survey methods, it is necessary to determine the characteristic target strength (TS) of the species [10,12,13,14,15,16,17]. Several methods have been used to estimate the TS of marine organisms. These include measuring TS at various angles by anesthetizing or tethering individual samples; observing freely swimming fish in a tank; in situ measurements using scientific echosounders, such as dual-beam or split-beam systems; and theoretical modeling approaches, such as the Kirchhoff-ray-mode (KRM) model and the Distorted-Wave Born Approximation (DWBA) model [3,12,16]. Among these, acoustic scattering theory model allows for a relatively rapid estimation of the TS of marine organisms compared to other methods. This approach is particularly effective in regions such as South Korea’s coastal water, which is characterized by a high diversity of fish species [12,18].
The TS of marine organisms is influenced by factors such as body length, swimming tilt angle, depth, and frequency. When using an acoustic scattering theory model to estimate the TS of a target organism, parameter values such as body shape and swim bladder geometry, density and sound speed contrasts, the presence or absence of a swim bladder, and swimming tilt angle are required [10,12,15,18,19,20]. Among various factors, the swimming tilt angle of marine organisms has the most significant influence on the TS. Therefore, understanding how the TS varies with changes in the swimming tilt angle is critical [10,21,22,23,24].
Active swimmers such as sardines may exhibit variations in their swimming tilt angles depending on flow velocity conditions. However, most previous studies measured the swimming tilt angle and TS in static tank environments, which limited their ability to reflect changes in TS under flow velocity conditions similar to those in natural marine habitats. Therefore, in this study, the swimming tilt angles of sardines were measured in tank experiments at different flow velocities (30 and 50 cm/s). Also, the target strength of sardines was estimated using the KRM model. In contrast to previous studies, a comparative analysis of the mean TS values was performed by incorporating swimming tilt angles obtained from flow velocity experiments and the representative swimming tilt angles of fish reported in previous studies.
2. Materials and Methods
2.1. Measurement of the Swimming Angle
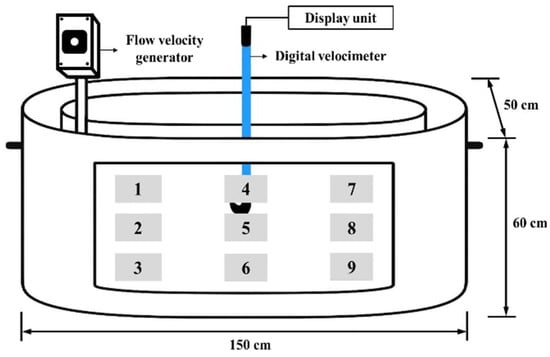
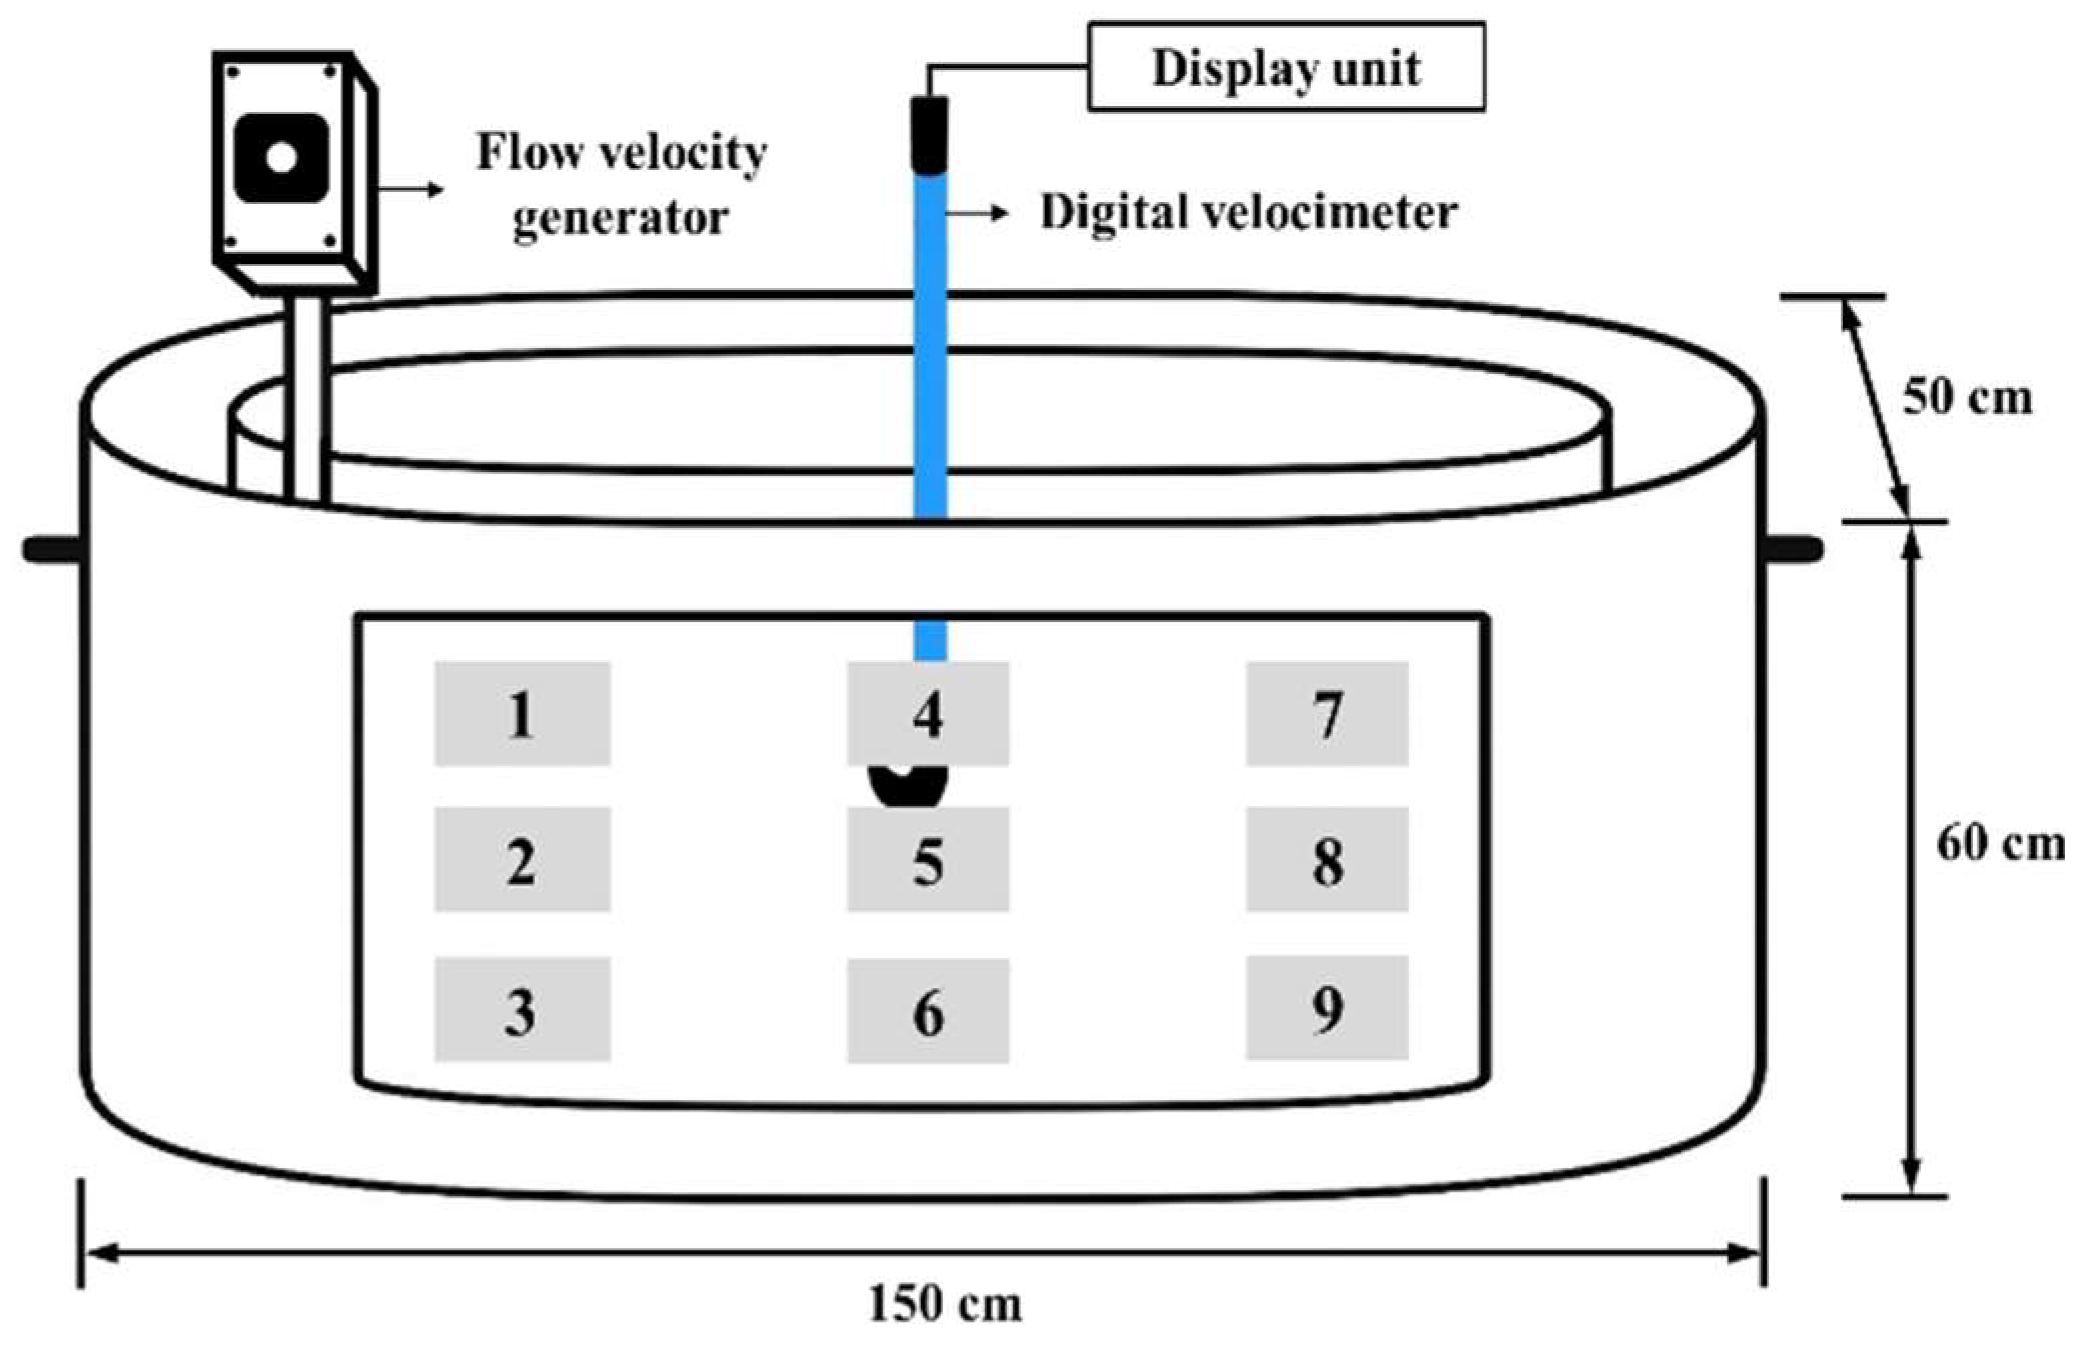
The swimming tilt angles of sardines were measured in a recirculating tank measuring 150 cm in length, 50 cm in width, and 60 cm in height. To generate flow within the tank, a flow velocity generation device was developed (Figure 1).
Figure 1.
Circulating water tank schematic; flow velocity measurement experiments using a digital velocimeter; flow velocity measurement points in the circulating water tank. Data were collected for 5 min at each of 9 measurement points with different flow velocities.
The flow velocity generator featured a lever allowing the adjustment of the flow velocity across 8 levels, ranging from 10 to 50 cm/s. Nine measurement points (St. 1~St. 9) were established to measure the flow velocity in the surface, mid, and bottom layers of the circulating water tank. The flow velocity at each point was recorded for 5 min using a digital velocimeter (FLOWATCH, JDC, Switzerland) (Table 1). Based on the flow velocity measurement data, sardine size, and typical swimming speed (cruising speed), the swimming tilt angles of sardines were measured at flow velocities of 30 cm/s and 50 cm/s.
Table 1.
Results of peak flow velocity at each measurement point according to flow velocity generator speed.
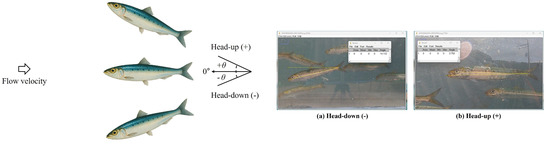
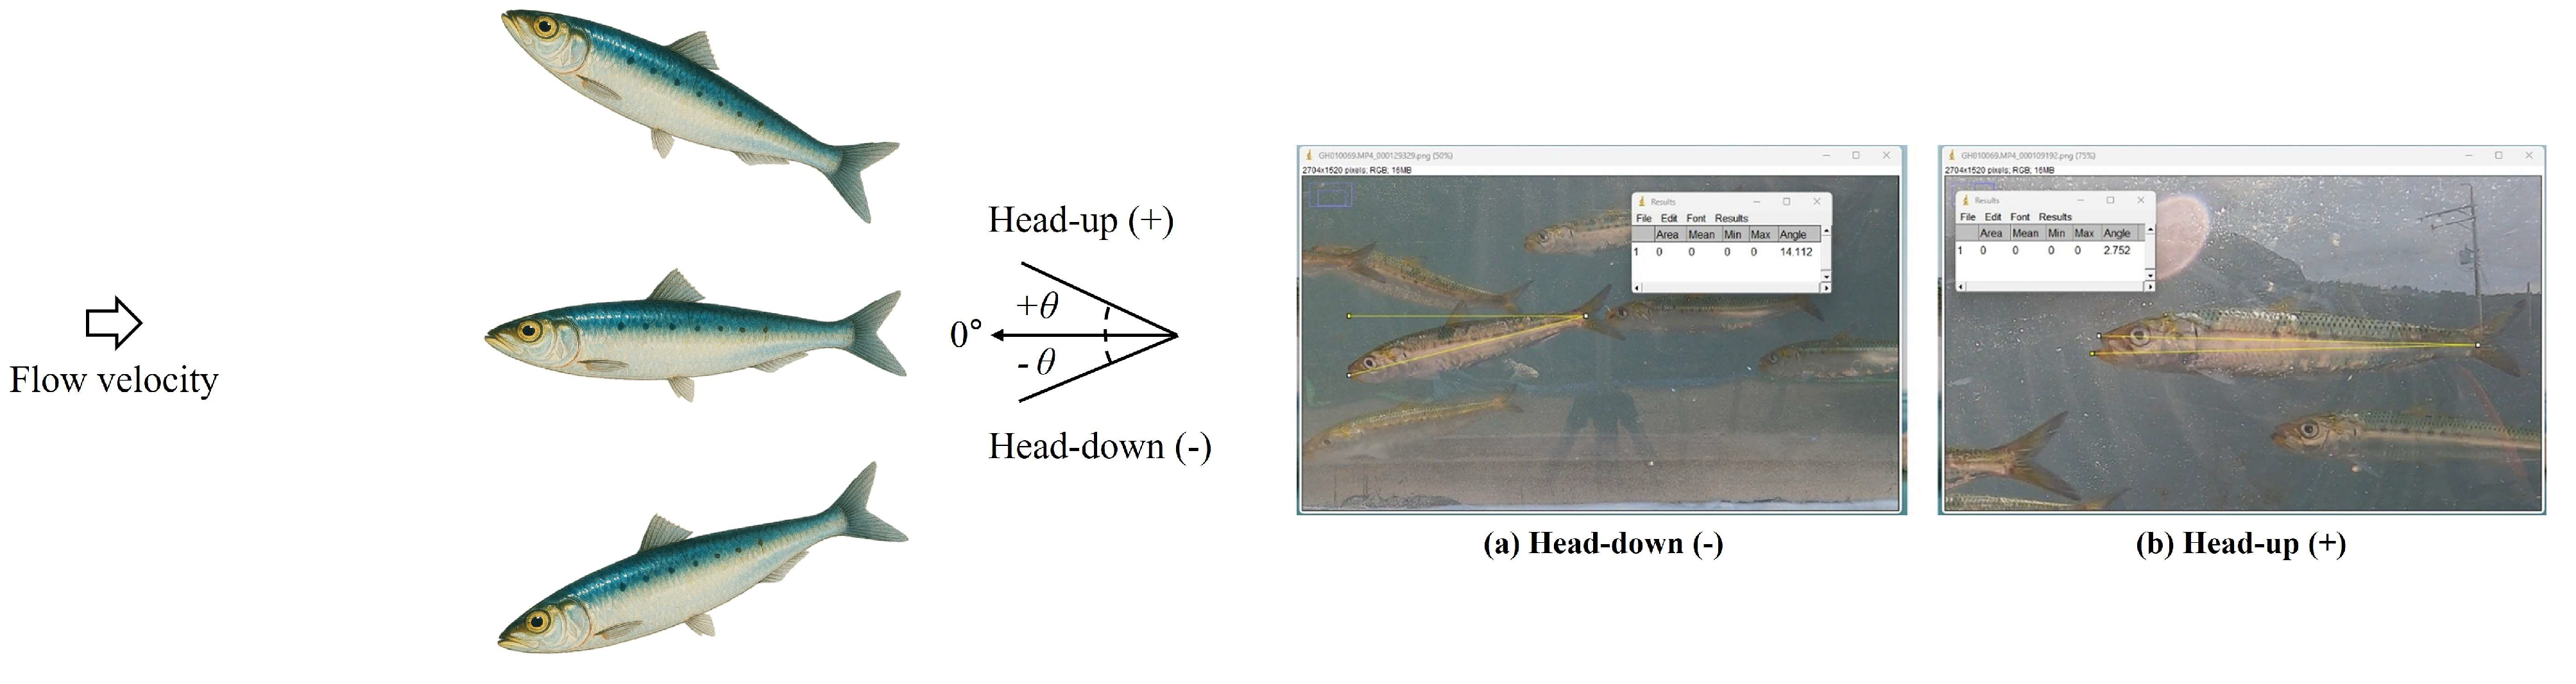
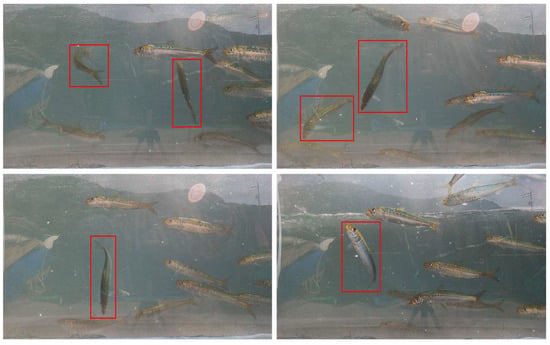
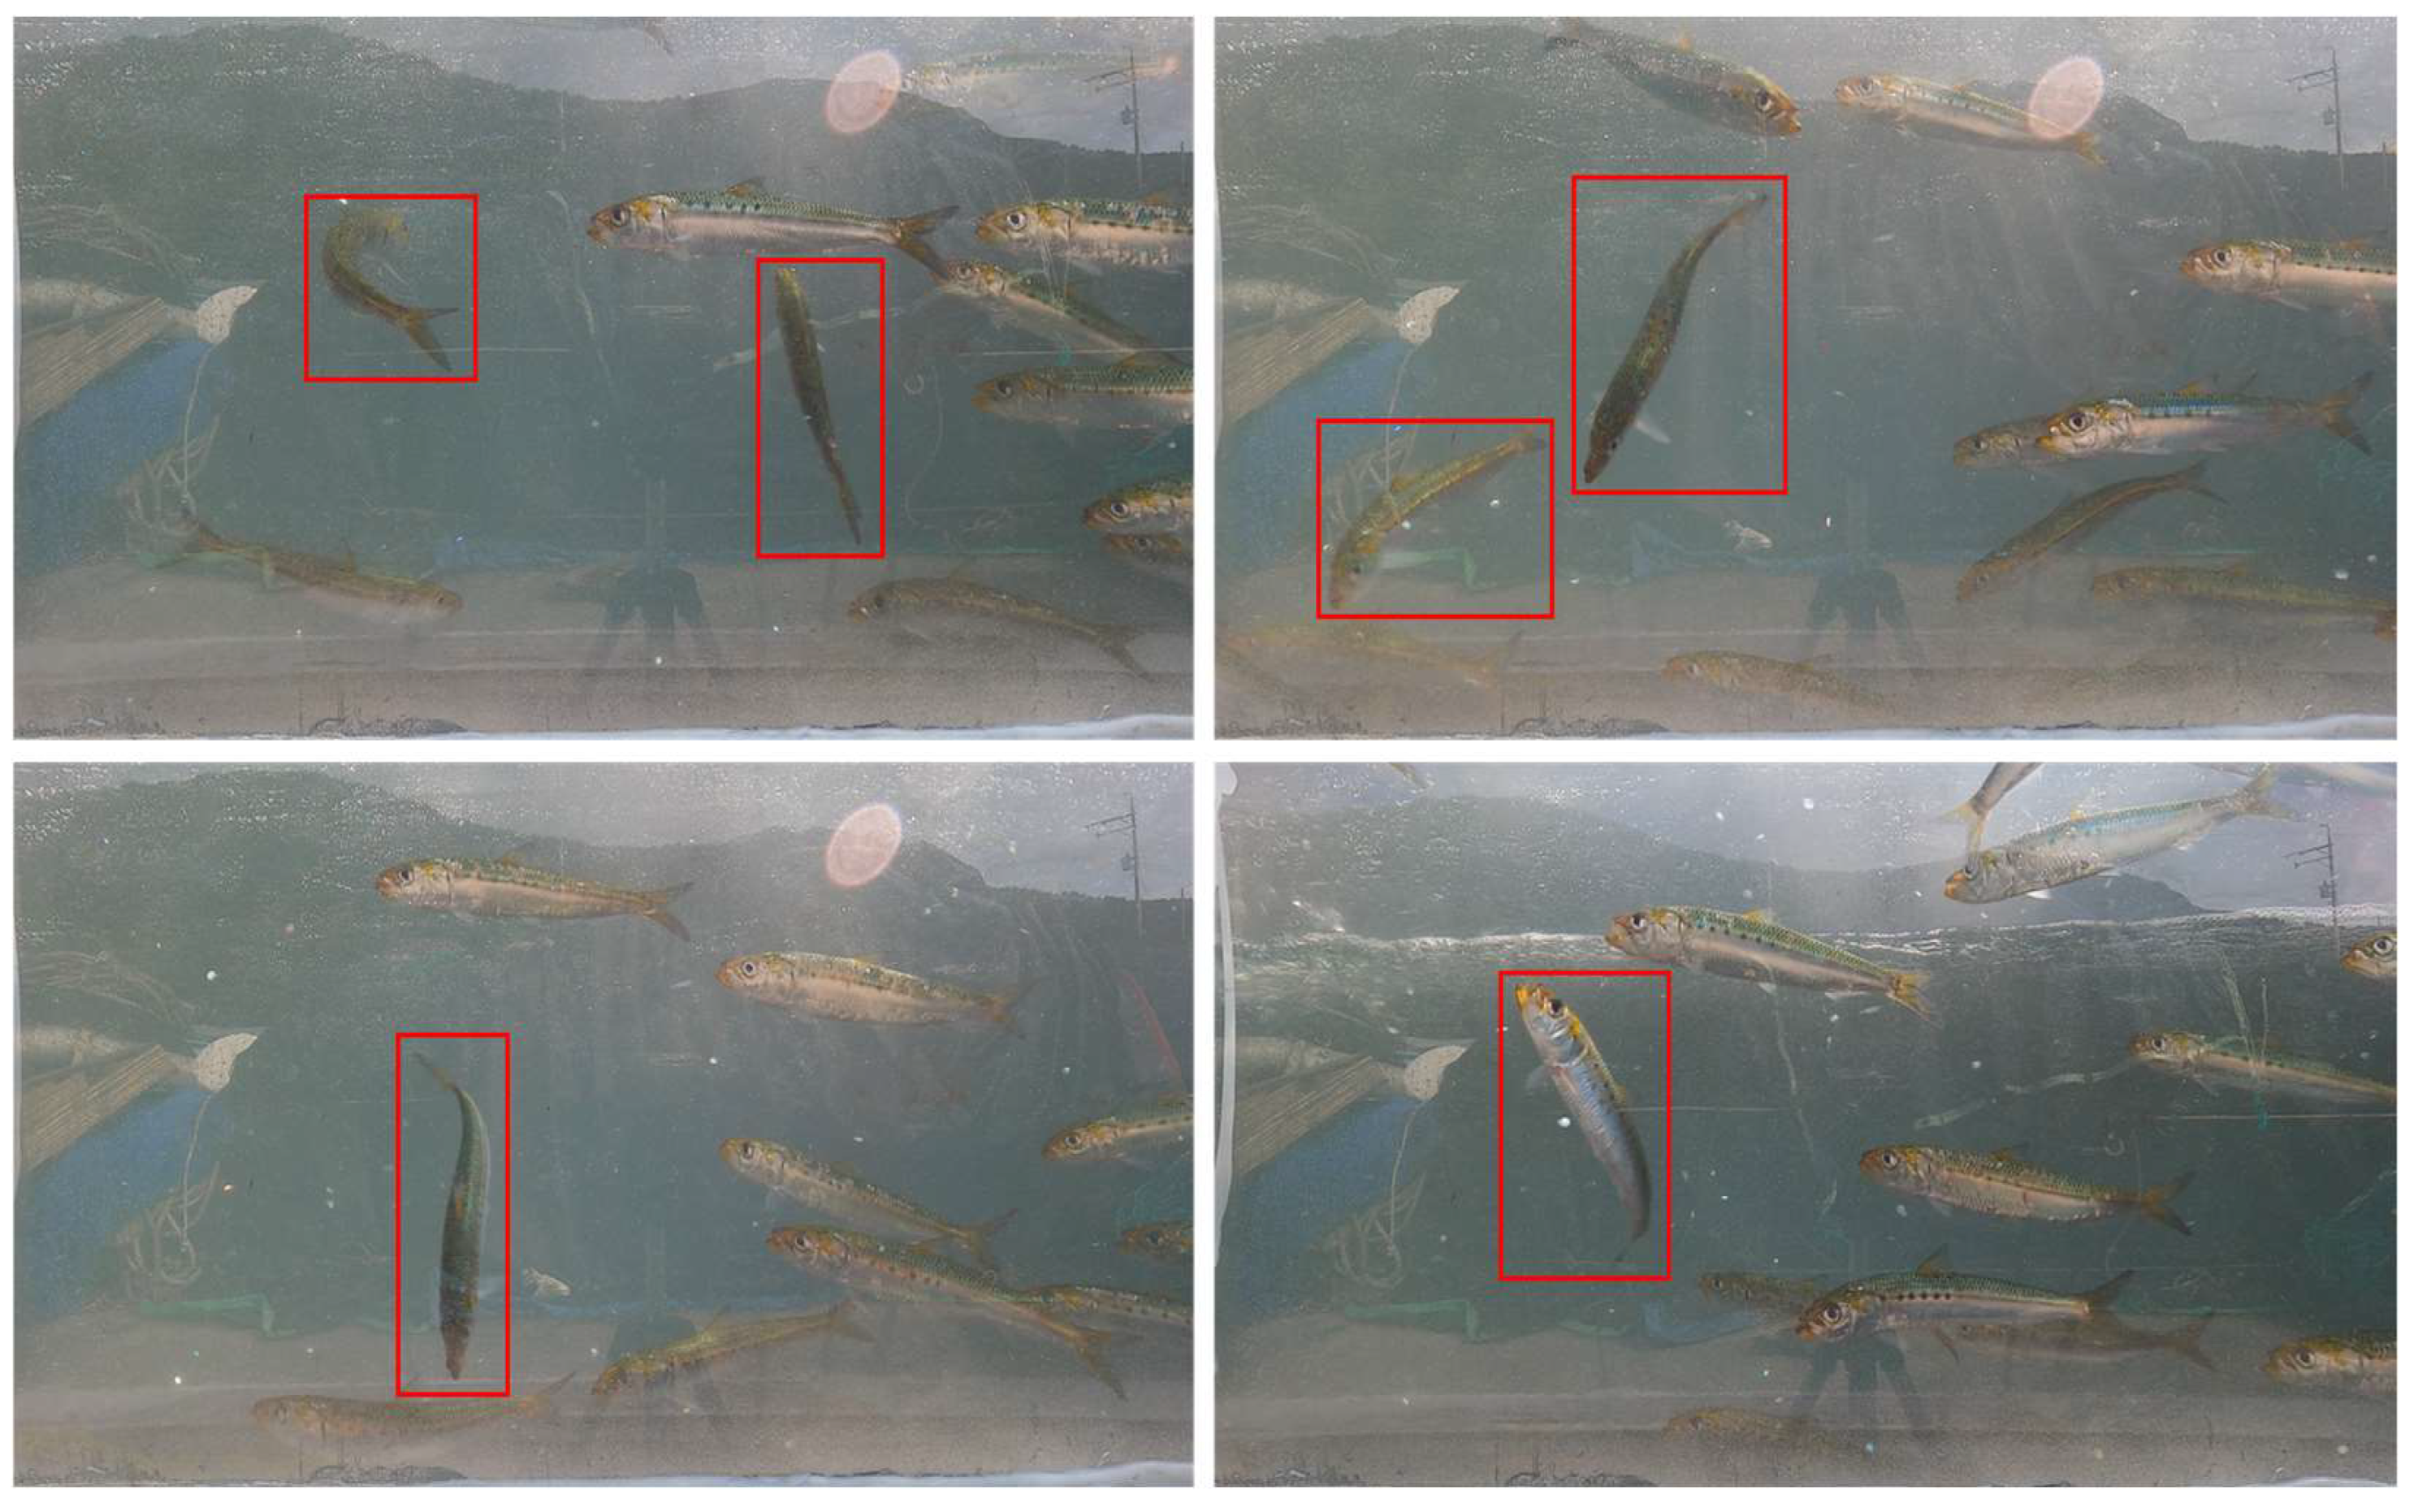
All experimental procedures involving live sardines were conducted by personnel who had completed prior training in animal ethics and welfare. The experiments followed institutional guidelines for the care and use of aquatic organisms, and all efforts were made to minimize stress and potential harm to the fish during handling and measurements. Sardines used in the experiments were collected from the Masan set net fishery in March and July. After transfer to the circulating water tank, their swimming tilt angles at different flow velocities were recorded using a GoPro camera (Gopro Hero 5, San Mateo, CA, USA). To allow sardines to acclimate to the flow velocity, the first 10 min of footage for each flow velocity condition were excluded from analysis. In addition, continuous video recordings were conducted for more than 1 h under each flow velocity condition to quantitatively characterize the distribution of sardine swimming tilt angles. Frames extracted at 1 s intervals from the recorded videos were used for subsequent tilt angle analysis. The recorded videos were analyzed using image analysis software (ImageJ V 1.54, Bharti Airtel Ltd., USA). The swimming tilt angles of sardines were measured by assigning a ‘+’ sign when the sardine’s head was oriented upward (head-up) and a ‘−’ sign when the sardine’s head was oriented downward (head-down) (Figure 2). In addition, to ensure data reliability, sardines exhibiting tail bending, sudden downward or upward movements, or those that were dead and floating were excluded from the measurements (Figure 3).
Figure 2.
Measurement of swimming tilt angle of sardines according to head direction and flow velocity; (a,b) represent measurements of the swimming tilt angle, distinguished as ‘−’ and ‘+’ according to the head direction of the sardines.
Figure 3.
Sample of sardines excluded from the measurement of swimming tilt angle. Red box: Sardines exhibiting tail bending, sudden downward or upward movements, or those that were dead and floating were excluded from the measurements.
2.2. Acoustic Scattering Theory Model
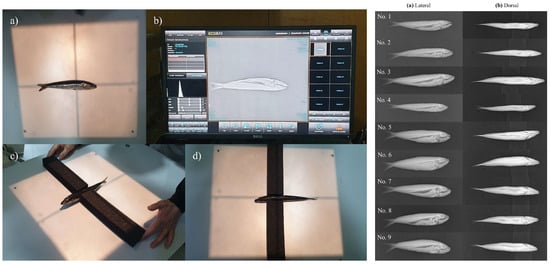
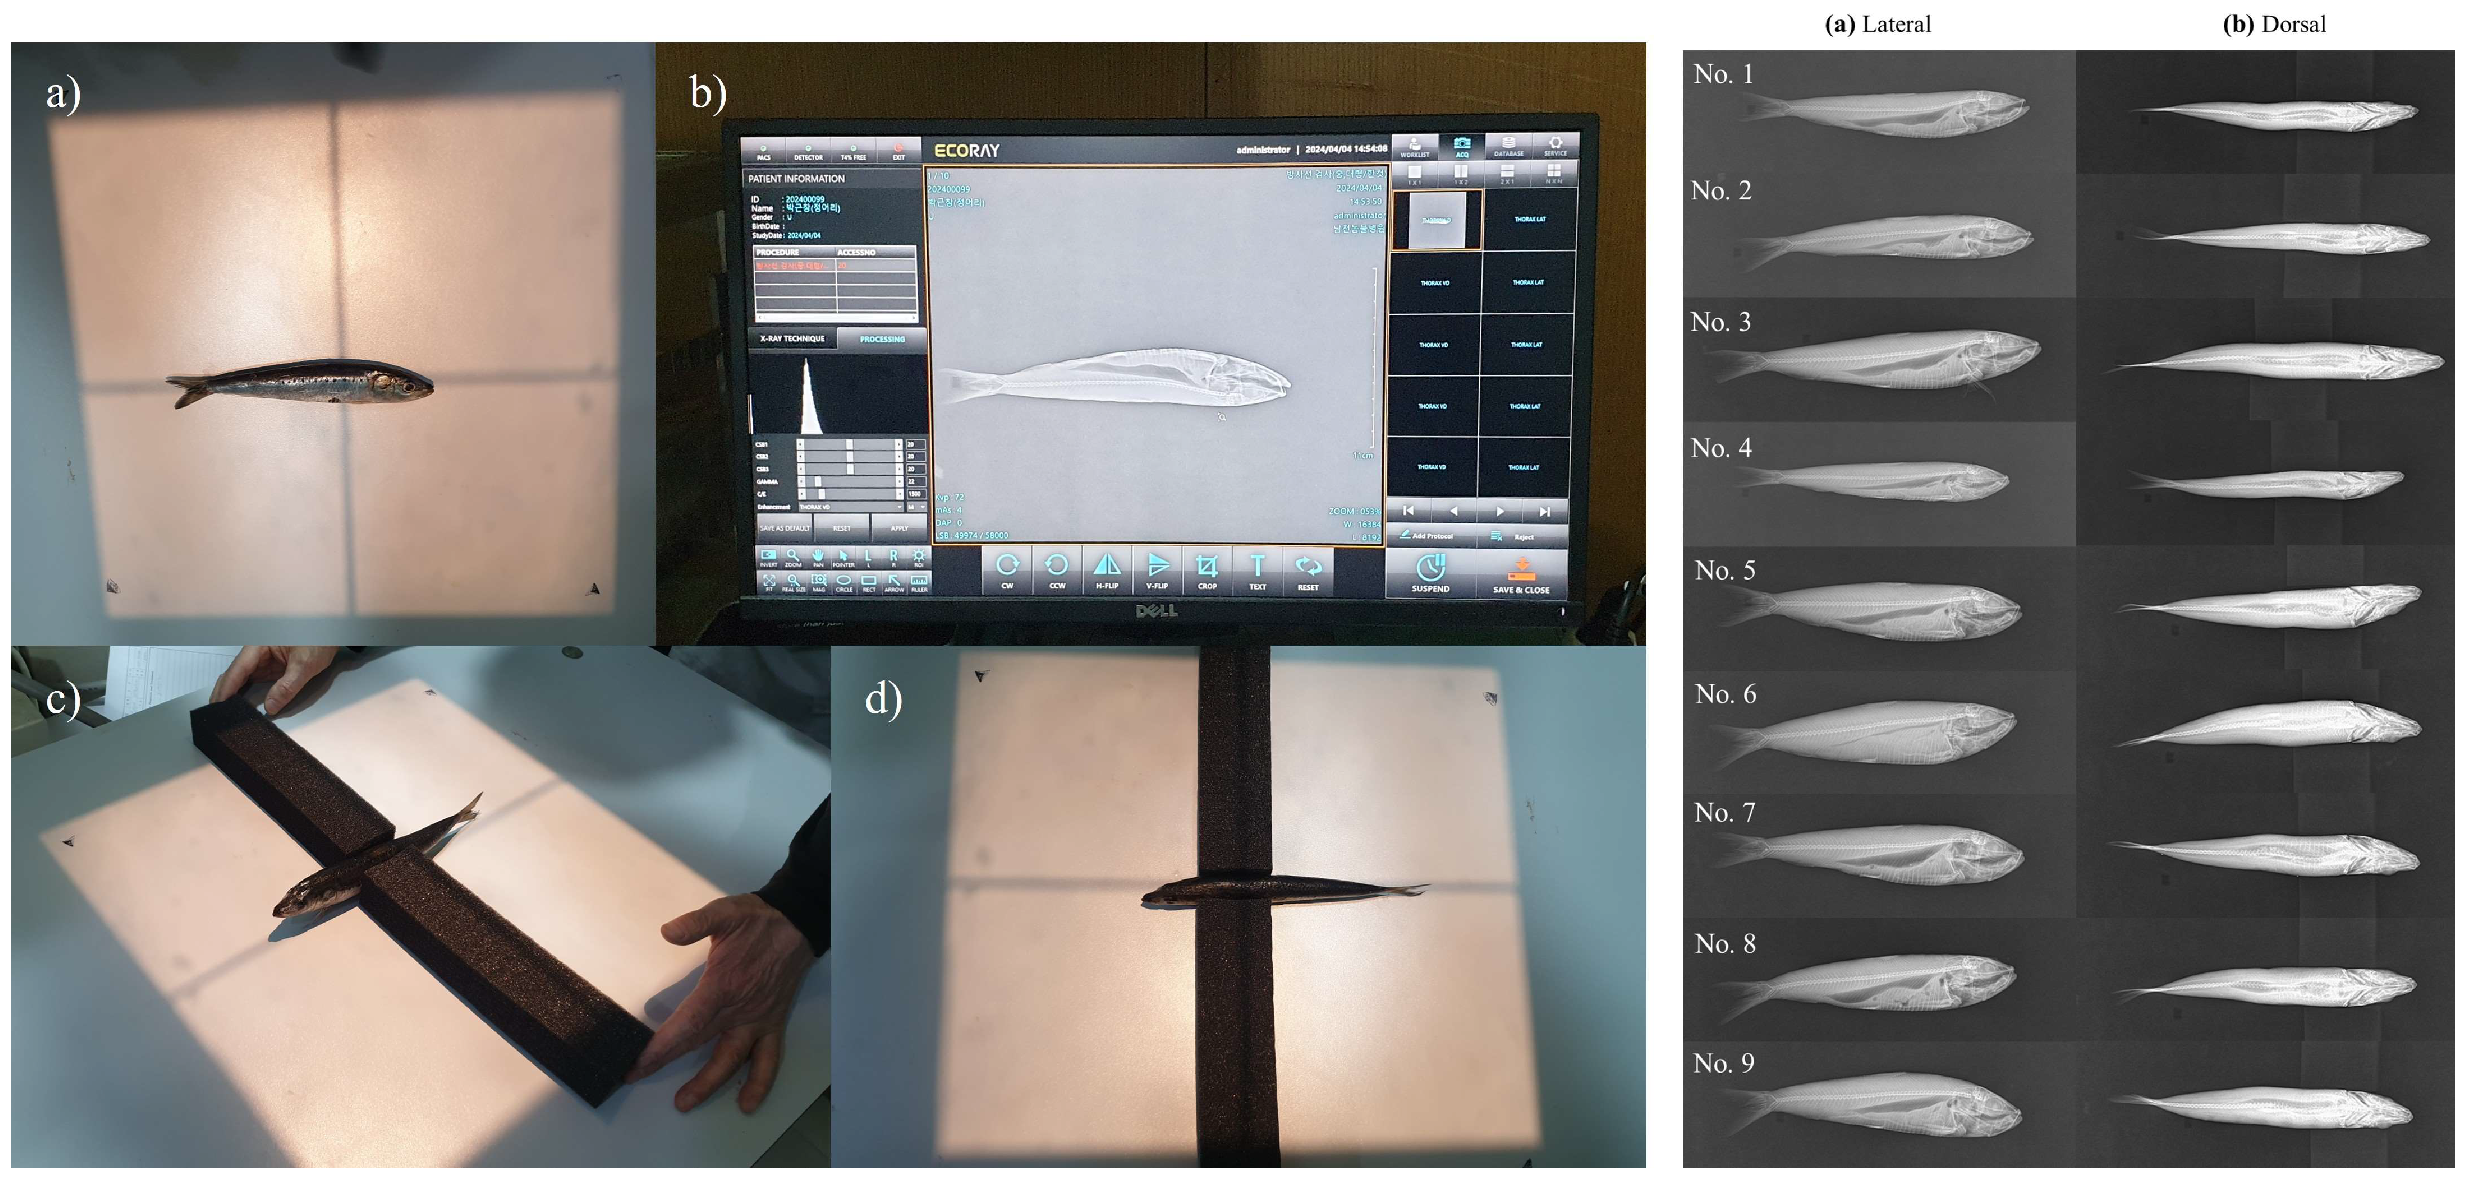
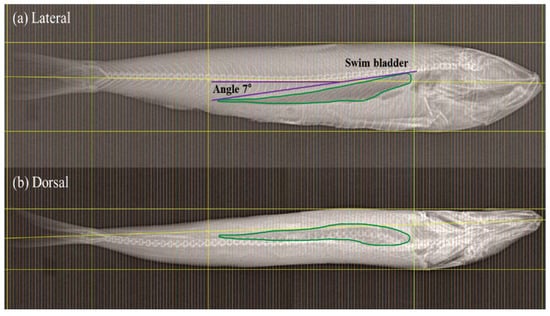
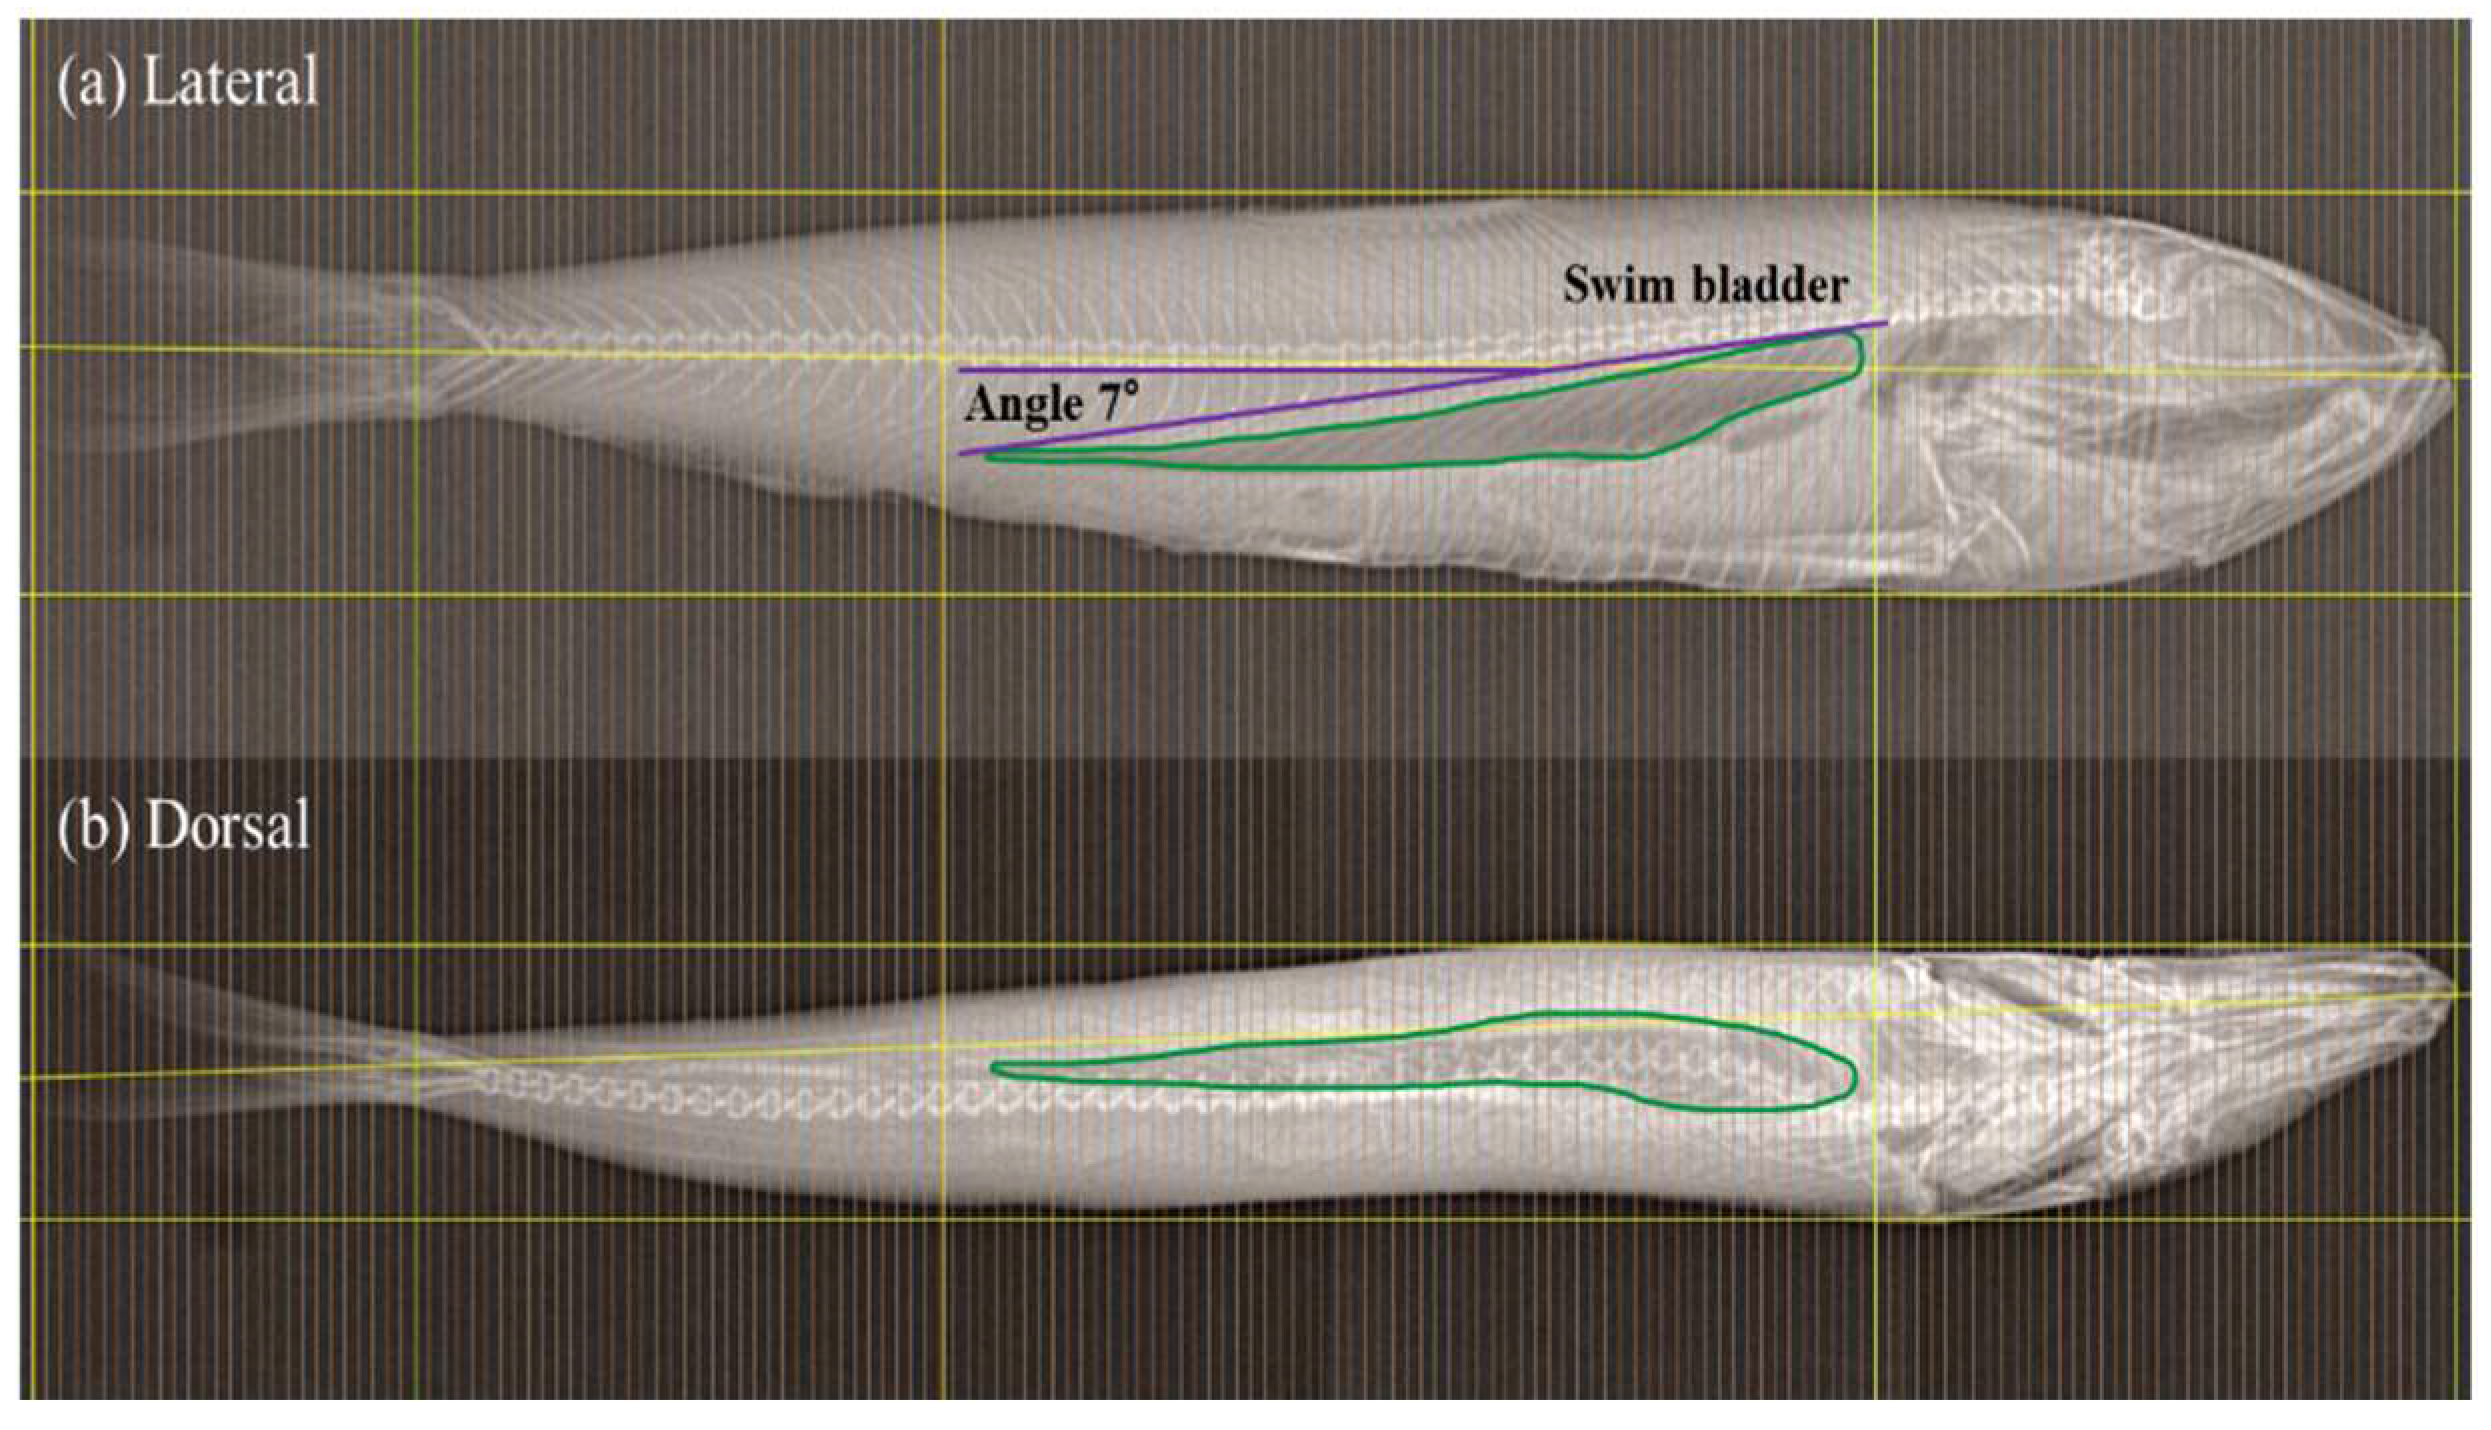
Information on the shape of the sardine’s body and swim bladder is required to estimate the TS of sardines using an acoustic scattering theory model. The sardines used in the experiments were collected from the Masan set net fishing area. The samples were rapidly frozen using alcohol and subsequently subjected to X-ray imaging on the dorsal and lateral sides (Figure 4). The X-ray images of the sardines were digitized using Getdata Graph Digitizer software (Getdata Graph Digitizer V 2.26.0.20, Getdata Pty Ltd., Germany) to approximate the shape of the sardine’s body and swim bladder (Figure 5). Subsequently, MATLAB (Version 9.13) was employed to analyze the approximate shape of the sardine’s body and swim bladder. The total length of the sardines used in the experiments ranged from 13.0 to 24.6 cm, with an average length of 18.4 cm (Table 2).
Figure 4.
Examples of X-ray imaging and X-ray images of sardines used in the experiment: a) lateral X-ray imaging setup; b) X-ray image from the lateral view; c) sample fixation for dorsal X-ray imaging; d) dorsal X-ray imaging setup; (a) Lateral, (b) Dorsal.
Figure 5.
An example of the X-ray image of a sardine and measurement of the size, body shape and swim bladder angle.
Table 2.
Morphological information of 17 individual sardines used in the KRM model.
The TS of the sardines was estimated using the KRM model [25]. The KRM model approximates the fish body and swim bladder as cylinders or cones to calculate the individual acoustic scattering components, which are then combined to estimate the overall acoustic scattering value of the fish [10,12]. Equation (1) is used to estimate the acoustic scattering component of the sardine swim bladder.
Here, denotes the number of swim bladder cylinders; is the imaginary unit; and are the wavenumbers in seawater and within the fish body, respectively; represents the amplitude with respect to ; and is the phase adjustment for . The parameters , , and can be calculated using Equations (2)–(5).
Here, is the phase coefficient; is the reflection coefficient at the interface between the fish body and seawater; and denote the density and sound speed of the fish body, respectively; and and represent the density and sound speed of seawater, respectively. Equation (6) is used to estimate the acoustic scattering component of the sardine’s body.
Here, denotes the number of cylinders representing the fish body and is the reflection coefficient at the interface between the fish body and swim bladder. can be calculated using Equation (7), where g and h represent the density ratio and sound speed ratio, respectively.
As the TS of an organism is calculated as the sum of the acoustic scattering components from the swim bladder and fish body, the backscattering component of the organism () can be expressed as shown in Equation (8).
Therefore, the TS of the organism is given by Equation (9).
In this study, the TS of sardines was calculated across frequency bands of 38, 70, 120, and 200 kHz with swimming tilt angles ranging from −60° to 60° in 1° increments. The mean TS and maximum TS values of the sardines were estimated. The mean TS was derived by assuming the probability density function (PDF) of sardine swimming tilt angles based on four values obtained from the circulating water tank experiments (−2.29° ± 10.19°, 4.09° ± 14.09°) and the typical fish swimming tilt angle distribution, with a mean of −5.00° and a standard deviation of ±15.00° [12,15,17,26]. The average TS values were calculated using Equations (10) and (11).
Here, represents the backscattering cross-section at each swimming tilt angle and denotes the occurrence frequency for each swimming tilt angle. The TS corresponding to the body length of a sardine can be calculated using Equations (12) and (13), where Equation (13) assumes that the TS is proportional to the square of the body length.
To estimate the TS using the KRM model, the sound speed and density of both the fish body and swim bladder, as well as those of the seawater, are required. In this study, values from previous research were used: sound speed and density of the fish body were set to 1570 m/s and 1070 kg/m3, respectively; sound speed and density of the swim bladder were set to 345 m/s and 1.24 kg/m3, respectively; and sound speed and density of seawater were set to 1490 m/s and 1030 kg/m3. These values were applied in the KRM model to estimate TS [10,17,25,27,28,29,30,31,32].
3. Results
3.1. Sardine Swimming Tilt Angle in Relation to Flow Velocity
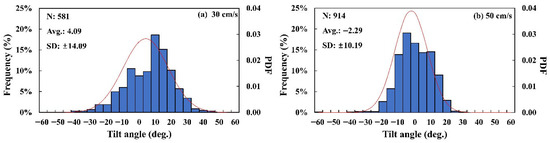
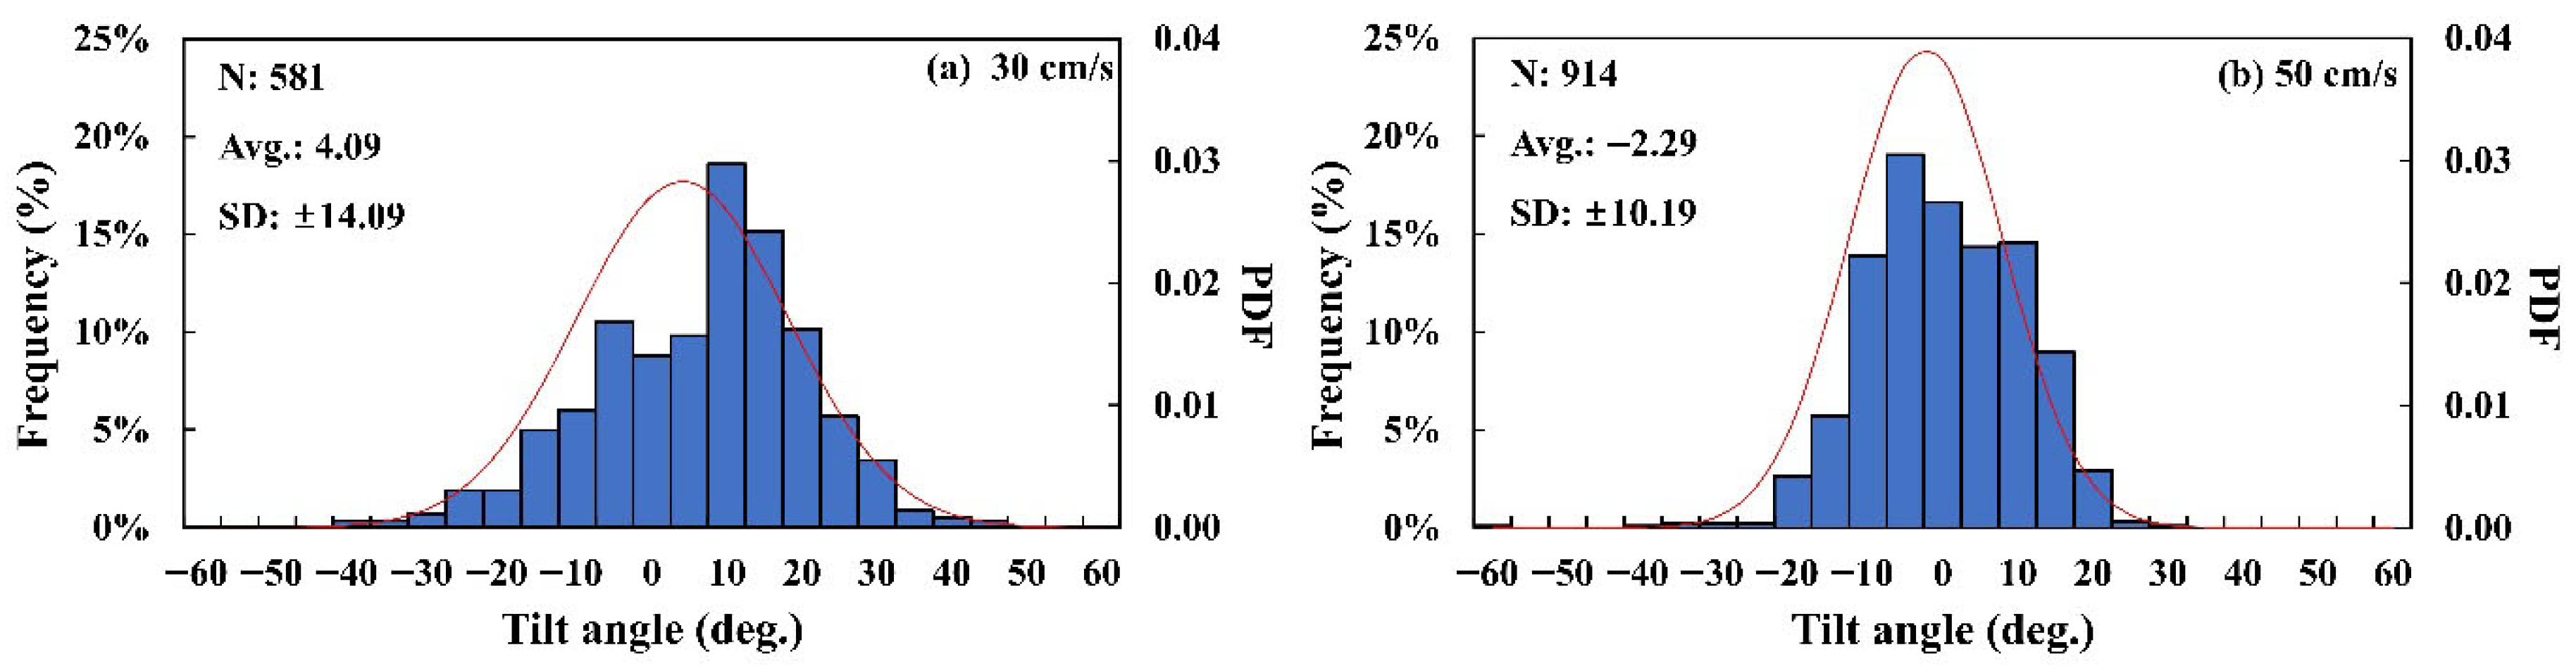
To measure the swimming tilt angles of sardines, experiments were conducted at flow velocities of 30 cm/s and 50 cm/s. Flow velocities were determined based on measurements taken at nine points within the circulating water tank, along with the total length of the collected sardine samples and their typical swimming speed (cruising speed). A total of 1804 swimming tilt angle data points were extracted according to the set flow velocities. When the flow velocity was set to 30 cm/s, the mean swimming tilt angle of sardines was 4.09°, with a standard deviation of ±14.09°. As the flow velocity increased to 50 cm/s, the mean swimming tilt angle decreased to −2.29°, and the standard deviation was measured at ±10.19° (Figure 6).
Figure 6.
Swimming tilt angles of sardines at different flow velocities.
3.2. Target Strength of Sardine According to Swimming Tilt Angle
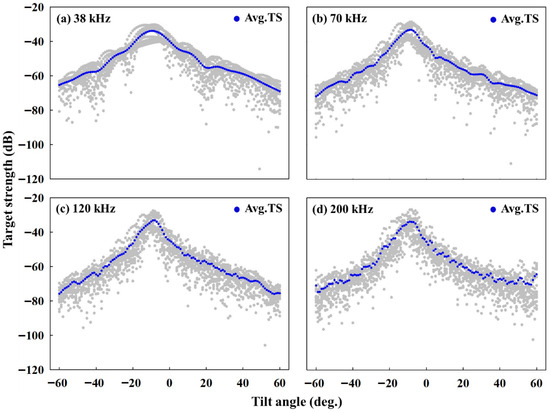
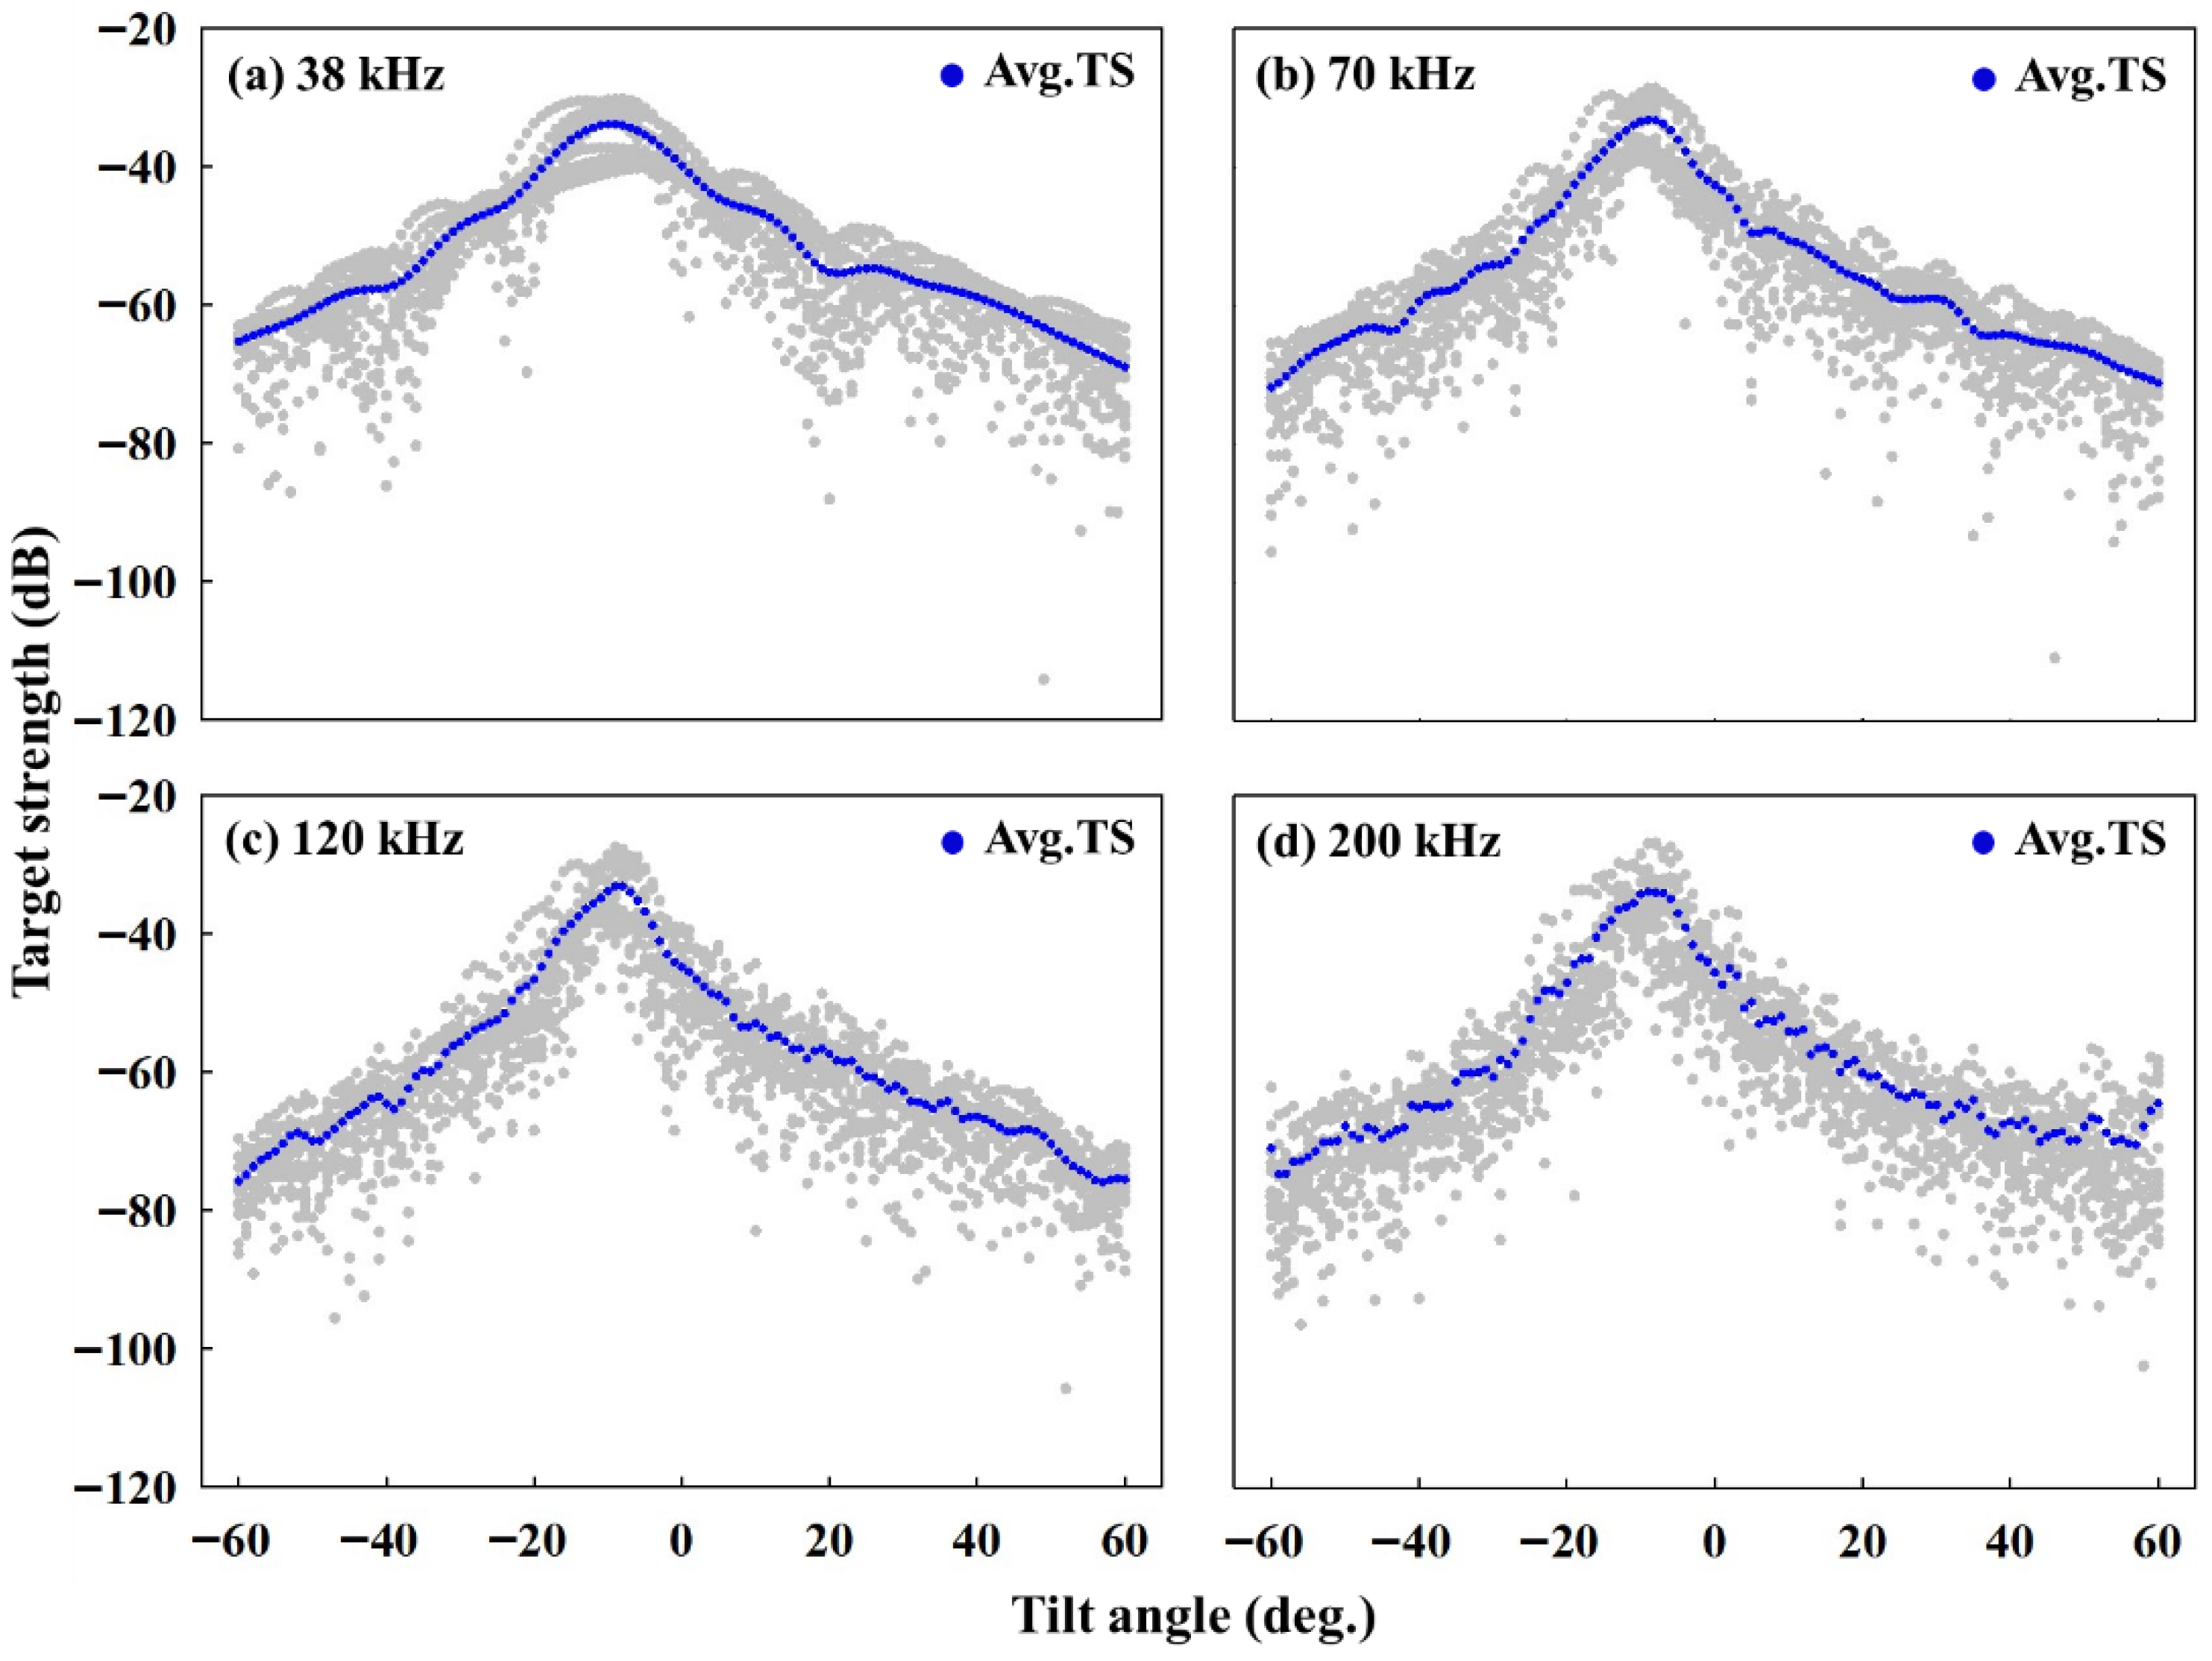
Using the KRM model, changes in the TS across frequencies (38, 70, 120, and 200 kHz) were analyzed according to the swimming tilt angles of sardines. The TS was calculated for the 17 sardine samples across swimming tilt angles ranging from −60° to 60° in 1° increments, and the results are presented for each frequency band (Figure 7). The range of TS for the 17 sardine samples across swimming tilt angles at 38 kHz was between −114.2 and −30.2 dB, with the highest value of −30.2 dB observed at a swimming tilt angle of −8°. The average TS ranged from −69.0 to −33.9 dB, with the highest value of −33.9 dB observed at a swimming tilt angle of −10°. At 70 kHz frequency, the TS of the 17 sardine samples across swimming tilt angles ranged from −111.0 to −28.7 dB, with the highest value of −28.7 dB observed at a swimming tilt angle of −8°. The average TS ranged from −71.9 to −33.2 dB, with the highest value of −33.2 dB observed at a swimming tilt angle of −9°. At 120 kHz frequency, the TS of the 17 sardine samples across swimming tilt angles ranged from −105.8 to −27.5 dB, with the highest value of −27.5 dB observed at a swimming tilt angle of −9°. The average TS ranged from −75.9 to −33.1 dB, with the highest value of −33.1 dB observed at a swimming tilt angle of −9°. At 200 kHz frequency, the TS of the 17 sardine samples across swimming tilt angles ranged from −102.4 to −26.9 dB, with the highest value of −26.9 dB observed at a swimming tilt angle of −8°. The average TS ranged from −74.7 to −33.8 dB, with the highest value of −33.8 dB observed at a swimming tilt angle of −9°. The average TS of the 17 sardine samples was highest at swimming tilt angles between −10° and −9°, where the sardines’ heads were oriented slightly downward from the horizontal position (0°).
Figure 7.
Target strength (TS) patterns of 17 sardines according to swimming tilt angle. Blue indicates the average TS value. The blue line indicates the mean TS value, while the gray dots represent the TS values of the 17 samples.
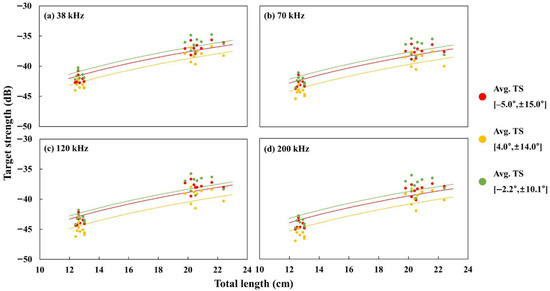
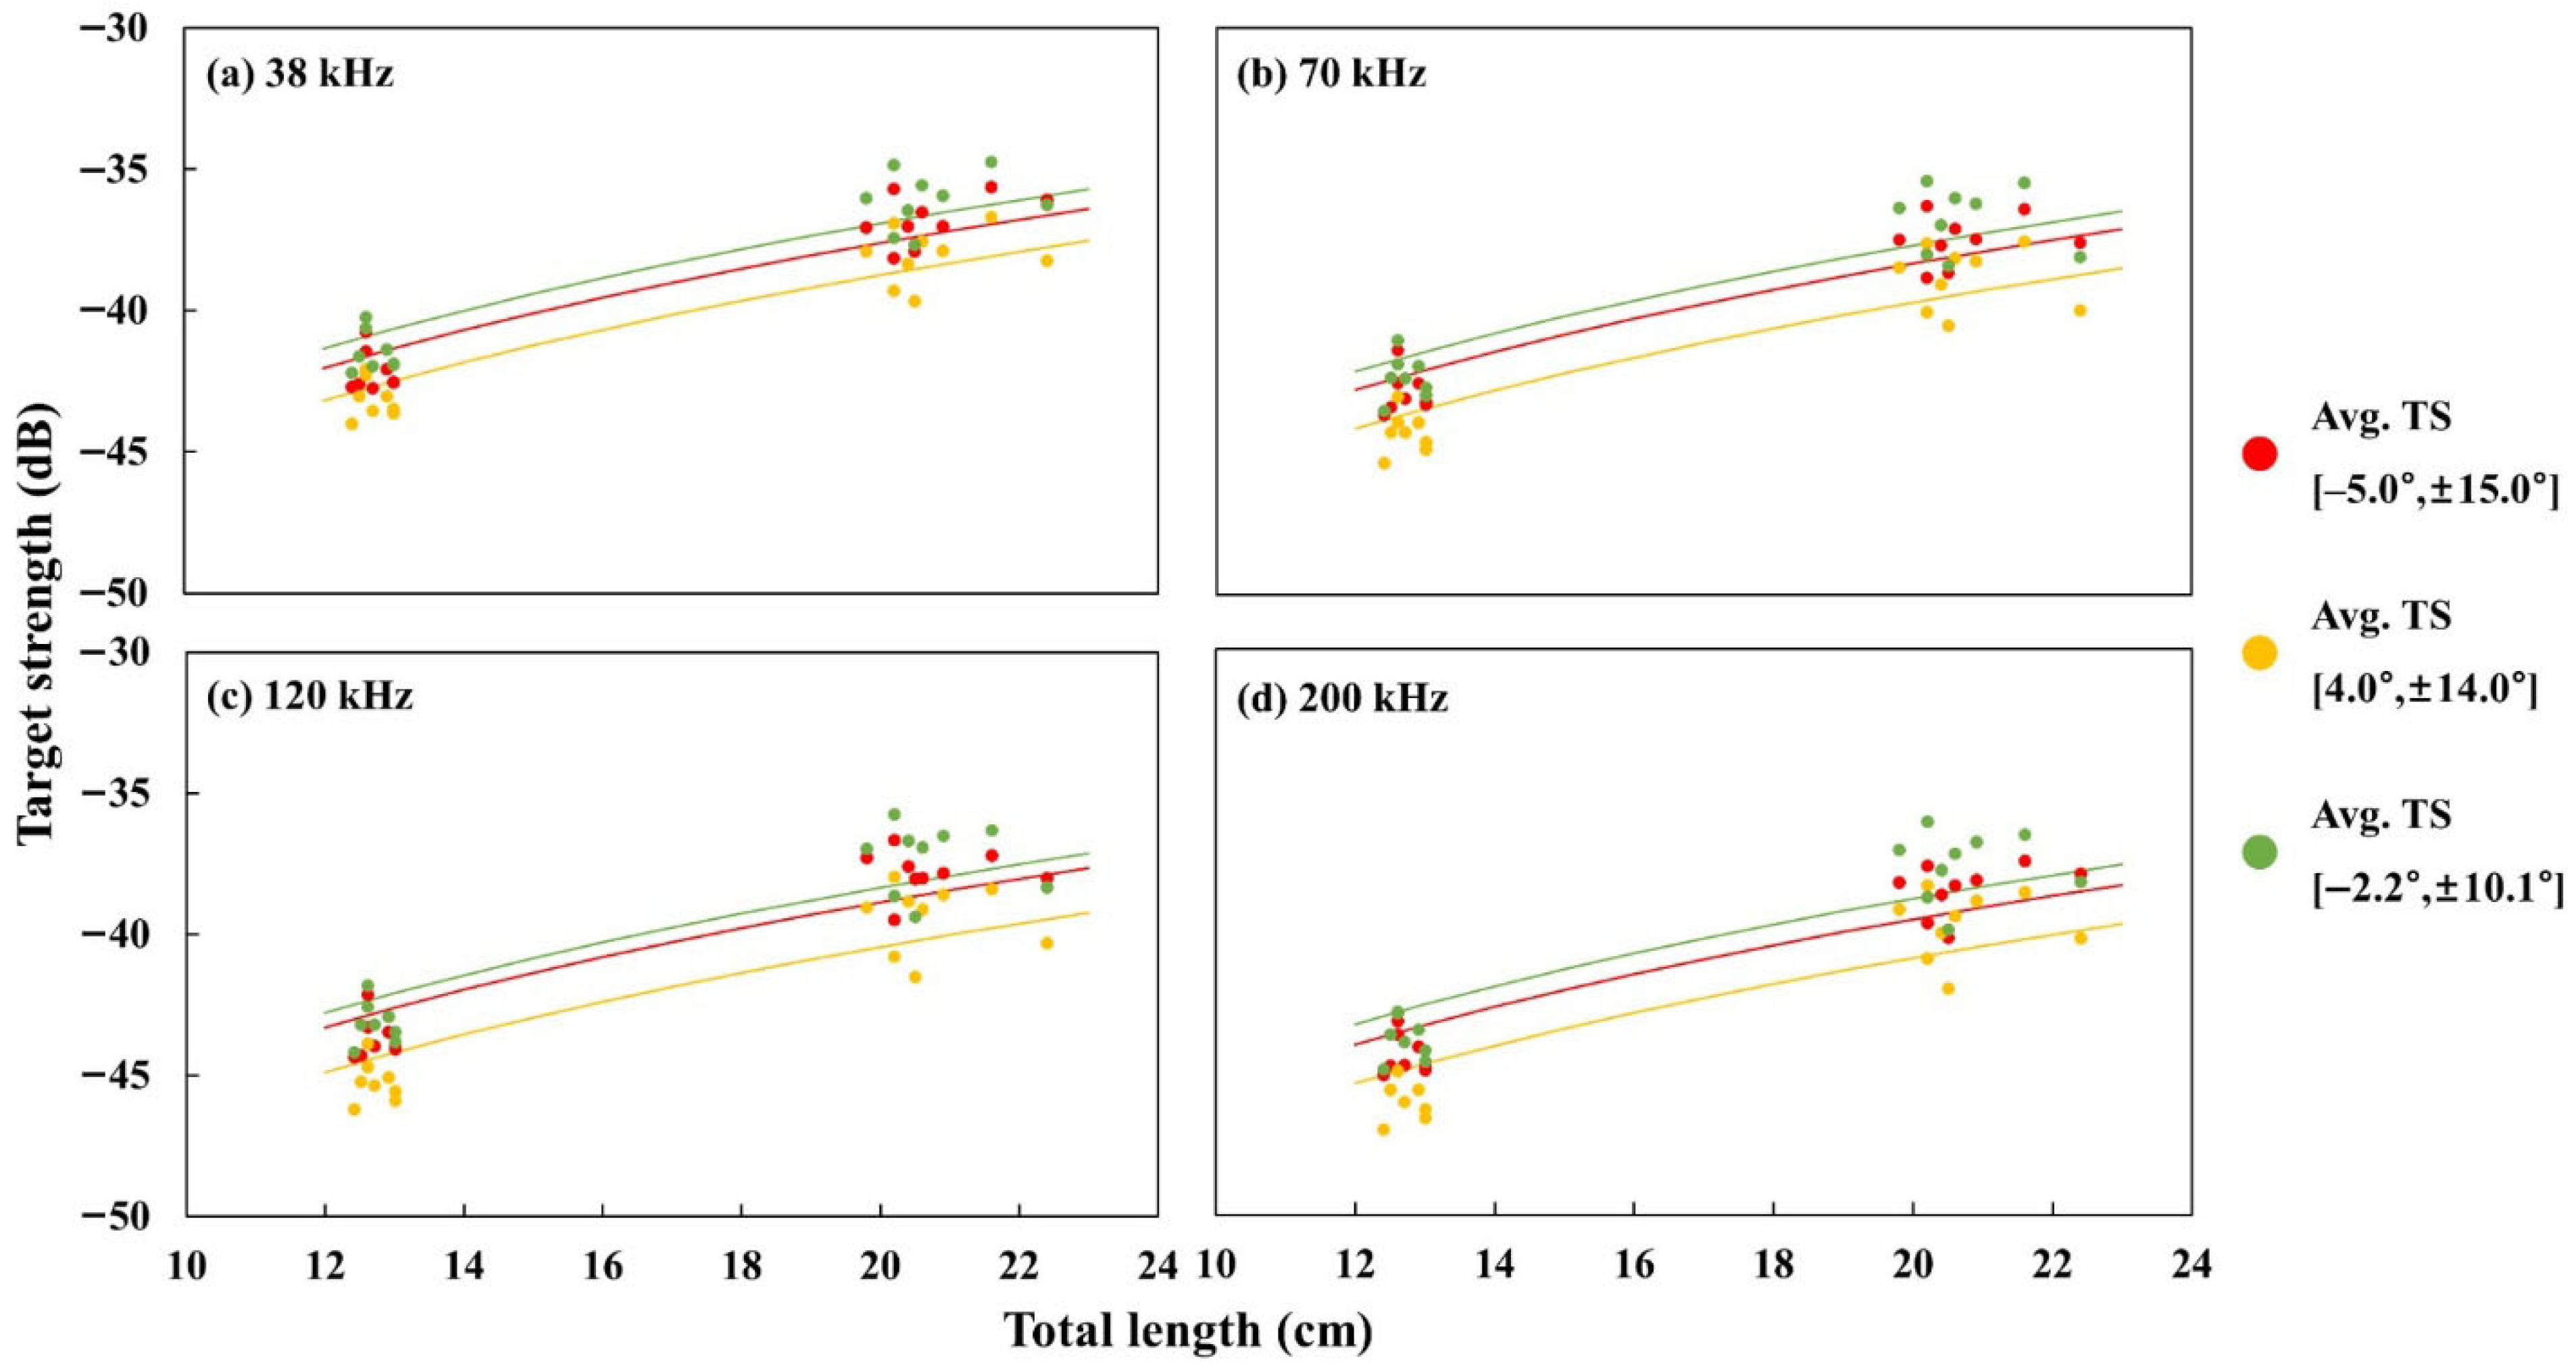
Using the KRM model, the mean TS across frequencies (38, 70, 120, and 200 kHz) was estimated for the 17 sardine samples based on their total length (TL) and swimming tilt angles at different flow velocities (Figure 8). The relationship between sardine total length and mean TS at the average swimming tilt angle for typical fish (−5.0° ± 15.0°) was expressed as follows:
Figure 8.
Target strength (TS) of sardines according to total length. Red indicates the mean TS at a swimming tilt angle of −5.0° ± 15.0°; yellow indicates the mean TS at 4.0° ± 14.0°; green indicates the mean TS at −2.2° ± 10.1°.
38 kHz: TS = 25.4log(TL) − 70.2 (R2 = 0.93); 70 kHz: TS = 25.2log(TL) − 70.7 (R2 = 0.92); 120 kHz: TS = 27.3log(TL) − 73.8 (R2 = 0.93); 200 kHz: TS = 27.5log(TL) − 74.7 (R2 = 0.93). The normalized mean TScm values were −63.6 dB at 38 kHz, −64.3 dB at 70 kHz, −64.8 dB at 120 kHz, and −65.5 dB at 200 kHz.
At a flow velocity of 30 cm/s and a mean swimming tilt angle of 4.0° ± 14.0°, the relationship between total length and mean TS was expressed as follows: 38 kHz: TS = 23.8log(TL) − 69.3 (R2 = 0.90); 70 kHz: TS = 25.2log(TL) − 72.1 (R2 = 0.88); 120 kHz: TS = 27.0log(TL) − 75.0 (R2 = 0.88); 200 kHz: TS = 28.4log(TL) − 77.2 (R2 = 0.90). The normalized mean TScm values were −64.7 dB at 38 kHz, −65.7 dB at 70 kHz, −66.4 dB at 120 kHz, and −66.9 dB at 200 kHz.
At a flow velocity of 50 cm/s and a mean swimming tilt angle of −2.2° ± 10.1°, the relationship between total length and mean TS was expressed as follows: 38 kHz: TS = 25.1log(TL) − 69.2 (R2 = 0.90); 70 kHz: TS = 25.8log(TL) − 70.8 (R2 = 0.88); 120 kHz: TS = 27.1log(TL) − 73.0 (R2 = 0.88); 200 kHz: TS = 28.6log(TL) − 75.3 (R2 = 0.89). The normalized mean TScm values were −62.9 dB at 38 kHz, −63.7 dB at 70 kHz, −64.3 dB at 120 kHz, and −64.8 dB at 200 kHz (Table 3).
Table 3.
Summary of linear regression of TS vs. body length of sardines at frequencies of 38, 70, 120, 200 kHz; the values in the horizontal column are the average swimming tilt angle and standard deviation of the fish.
4. Discussion
4.1. Swimming Behavior of Sardine According to Swimming Tilt Angle
Although slight differences in swimming tilt angles were observed depending on flow velocity, in most cases, the sardines exhibited positive (‘+’) angles, with their head tilted upward (head-up). Fish regulate buoyancy through their swimming tilt angle, maintain constant depth during vertical movement, and minimize energy expenditure. In addition, fish can significantly enhance the performance and efficiency of their swimming behavior by adjusting their swimming speed [33]. Sardines are a schooling species, and as flow velocity increases, changes in swimming behavior occur within the school. Individuals tend to maintain similar swimming tilt angles, which enhances energy efficiency and locomotor performance in response to currents or eddies [34]. In addition, fish generate vertical lift while swimming. When the flow velocity is low, swimming speed also decreases, prompting fish to adopt a greater swimming tilt angle to regulate buoyancy and compensate for reduced lift. As the flow velocity increases, lift is naturally enhanced, allowing fish to reduce their swimming tilt angle [35,36]. Therefore, as demonstrated in the results of this study, a decrease in the swimming tilt angle with increasing flow velocity is considered an adaptive strategy to enhance swimming efficiency.
Although this study measured the swimming behavior of sardines using a circulating water tank experiment, the measured values may differ from the swimming behavior of sardines in natural marine environments due to the limitations inherent to tank-based experiments. Therefore, future studies should conduct experiments under conditions similar to those in natural marine environments or perform in situ field experiments to quantitatively compare the mean swimming tilt angles obtained from circulating tank experiments with those observed in actual marine environments.
4.2. Target Strength of Sardine According to Swimming Tilt Angle
In this study, the TS of the sardine (Sardinops sagax) was estimated using the KRM model. However, as studies estimating the TS for the same sardine species are relatively limited, the results were compared to those of previous studies on similar species. Among previous studies estimating the TS of sardines, reference [37] estimated the TS at 38 kHz frequency using an in situ method. Reference [38] estimated the TS of European sardine (Sardina pilchardus) at 38 kHz frequency using an in situ method. Reference [22] employed the Prolate-Spheroid model (PSM) to estimate the TS of European sardine (Sardina pilchardus) and round sardinella (Sardinella aurita) at frequencies of 38 and 120 kHz (Table 4). Compared with the present results, most previous studies reported higher b20 values at low frequencies, except for [37] and [38], who conducted experiments at a single frequency. When comparing TS, differences of 2.0 to 6.9 dB were observed between the present and other studies estimating TS using in situ methods, while differences of 1.2 to 2.6 dB were found between the present and model-based studies. These differences are attributed not only to variations in modeling approaches (KRM, Prolate-Spheroid) and experimental methods (in situ, modeling) but also to species- and individual-specific characteristics. In particular, field experiments may yield lower estimates of TS owing to environmental factors such as school, depth, and swimming behavior. TS is influenced by several factors, with the swim bladder playing a particularly significant role. The swim bladder accounts for over 90% of the TS in fish detection using acoustic methods [18,21,22,26,39,40,41]. Therefore, because both the present and previous studies involved sardine species possessing swim bladders, the differences arose from the methods used to measure the swim bladder. In this study, the swim bladder size and angle were precisely approximated and measured using X-ray images. However, reference [22] dissected sardines and measured the swim bladder size directly with digital calipers, which did not allow the capture of detailed three-dimensional swim bladder morphology. In addition, the swim bladder angles used in their study were obtained from other studies. Therefore, the differences in the measured swim bladder morphology applied to the models likely led to variations in the estimated TS values. Reference [37] used an in situ method to measure freely swimming sardine schools in the field and estimated the TS by identifying a single individual within the school. Reference [22] employed an acoustic scattering theory model to arbitrarily set the horizontal angles and head-down angles for the sardine swimming tilt angle to estimate the TS. In this study, swimming tilt angles were obtained by measuring active swimming sardines in the circulating water tank. Therefore, differences in the applied swimming tilt angles and swimming behaviors likely contribute to variations in the estimated TS values.
Table 4.
Summary of TS estimates by previous studies for sardine.
In this study, sardine swimming tilt angles were measured at flow velocities of 30 cm/s and 50 cm/s in a circulating water tank experiment to investigate changes in TS according to swimming tilt angle. Owing to the lack of prior research on sardine swimming tilt angles at varying flow velocities, the results were compared with those of a previous study measuring swimming tilt angles and TS of anchovies, a species similar to sardines [41]. A comparison of the results is presented in Table 5. Reference [41] measured the swimming tilt angles of 200 anchovy juveniles at different flow velocities and estimated TS at frequencies of 38 and 120 kHz using the DWBA model. The results showed that although swimming tilt angles increased with flow velocity, there was no significant difference between the regression lines for 1–3 cm/s and 5 cm/s. Changes in flow velocity influenced the swimming tilt angles of anchovy juveniles but had little effect on their TS. In this study, the swimming tilt angle decreased as the flow velocity increased and swimming tilt angle was found to have a significant impact on the TS. This suggests that the TS of adult fish is influenced more by swimming tilt angle than by that of juveniles. Considering that anchovy juveniles exhibited larger swimming tilt angles than sardines even at lower flow velocities, a smaller body length makes fish more susceptible to the effects of flow velocity on the swimming tilt angle. Another previous study investigated the changes in TS according to body length, frequency, and swimming tilt angle. Reference [32] estimated the TS of 14 mackerel samples using an ex situ method across a frequency range of 24 to 84 kHz. Each sample was fixed and rotated at swimming tilt angles ranging from −40° to 40° without active swimming. After measurement, X-ray imaging was performed to analyze the shape of the fish body and swim bladder, and the KRM model was applied to estimate TS values at frequencies of 38, 50, and 70 kHz for specific swimming tilt angles (−5° ± 10°, −5° ± 15°, 0° ± 10°, 0° ± 15°). Consistent with this study, the previous study showed that TS was relatively higher when the head was slightly tilted downward and that TS tended to be higher when swimming tilt angles were small or ‘−’ values. In contrast, larger swimming tilt angles and greater standard deviations in the swimming tilt angle were associated with lower TS. In other words, fish swimming closer to the horizontal plane (with smaller swimming tilt angles) exhibited higher TS, whereas larger swimming tilt angles corresponded to lower values. These findings support the conclusion of this study that the swimming tilt angle significantly influences the TS.
Table 5.
Summary of TS measurements by flow velocity and body length in previous research.
5. Conclusions
In this study, we estimated the target strength of sardines, a globally important fishery resource with high biological and commercial value. We measured the swimming tilt angle of sardines as a function of flow velocity and estimated frequency bands target strength as a function of swimming tilt angle. Using a recirculating flume, flow was set to 30 and 50 cm/s, and the swimming tilt angles of sardines were recorded. At 30 cm/s, the mean swimming tilt angle was 4.09° ± 14.09°, whereas at 50 cm/s it was −2.29° ± 10.19°. At a flow velocity of 30 cm/s, sardines swimming against the flow exhibited a mean swimming tilt angle of 4.0° ± 14.0°, with normalized mean TScm values of −64.7 dB at 38 kHz, −65.7 dB at 70 kHz, −66.4 dB at 120 kHz, and −66.9 dB at 200 kHz. At a flow velocity of 50 cm/s, sardines swimming against the flow showed a mean swimming tilt angle of −2.2° ± 10.1°, with normalized mean TScm values of −62.9 dB at 38 kHz, −63.7 dB at 70 kHz, −64.3 dB at 120 kHz, and −64.8 dB at 200 kHz.
The estimation of target strength based on the results of this study has potential applications across various fields such as acoustic resource surveys, fish behavior analysis, modeling, and species classification. It is expected to enable more precise resource assessments and better interpretation of acoustic data. Moreover, sardines exhibit a range of swimming tilt angles within schools and may undergo rapid changes in posture due to evasive behaviors. Such behavioral variations can influence acoustic target strength, indicating that the findings of this study could also be valuable for analyzing swimming behavior. As shown in the regression distribution graphs of mean target strength according to flow velocity and body length, sardines swimming against the flow demonstrated an upward shift in regression lines with increasing flow velocity, resulting in higher mean target strength values. Considering the results of this study and the swimming behavior of sardines against the flow, the target strength of sardines swimming with the flow may be of less concern.
In this study, the swimming tilt angles of sardines were measured using a circulating water tank, and the mean target strength of sardines was estimated based on these measurements. However, due to the limitations inherent to tank-based experiments, the swimming tilt angles measured in the circulating tank may differ from those of sardines swimming in natural marine environments. Therefore, future studies should either create experimental conditions similar to those in the open sea or conduct in situ field experiments to measure the swimming tilt angles of sardines and quantitatively compare them with those obtained from circulating tank experiments. Furthermore, the mean swimming tilt angles derived under various environmental conditions will be used to estimate more reliable mean TS values for sardines.
Author Contributions
Conceptualization, K.L.; methodology, G.P., J.K. and S.C.; software, G.P. and J.K.; validation, G.P. and J.K.; formal analysis, G.P. and J.K.; investigation, G.P.; resources, K.L.; data curation, G.P.; writing—original draft preparation, G.P.; writing—review and editing, G.P., J.K., S.C., H.Y. and K.L.; visualization, G.P.; supervision, K.L.; project administration, K.L.; funding acquisition, K.L. All authors have read and agreed to the published version of the manuscript.
Funding
This research was supported by Korea Institute of Marine Science & Technology Promotion (KIMST) funded by the Ministry of Oceans and Fisheries (Grant RS-2025-02307389/RS-2025-02219912).
Data Availability Statement
Data are contained within the article.
Conflicts of Interest
Author Hyunsuk Yoon was employed by the company Korea Western Power. The remaining authors declare that the research was conducted in the absence of any commercial or financial relationships that could be construed as a potential conflict of interest.
References
- NIFS. Website on Fishing Condition and Oceanic Condition. 2024. Available online: https://www.nifs.go.kr/board/actionBoard0014List.do (accessed on 6 January 2026).
- Sarr, O.; Kindong, R.; Tian, S. Knowledge on the biological and fisheries aspects of the Japanese sardine, Sardinops melanostictus (Schlegel, 1846). J. Mar. Sci. Eng. 2021, 9, 1403. [Google Scholar] [CrossRef] [Scilit]
- Park, J.H.; Kim, H.J.; Jeong, J.M.; Lee, J.H.; Shin, D.H. Food resource of Sardine Sardinops melanostictus on the Southern Coast of Korea in summer and autumn revealed by stable isotope and stomach content analyses. Korean J. Fish. Aquat. Sci. 2023, 56, 419–427. [Google Scholar] [CrossRef]
- Shimose, T.; Watanabe, H.; Tanabe, T.; Kubodera, T. Ontogenetic diet shift of age-0 year Pacific bluefin tuna Thunnus orientalis. J. Fish Biol. 2012, 82, 263–276. [Google Scholar] [CrossRef] [Scilit]
- NIFS. Website on Research Project Information. 2025. Available online: https://www.nifs.go.kr/portal/pw/rschB/actionInduprViewPopup.do?rsltpubSeq=20957 (accessed on 6 January 2026).
- KOSIS. Website on Statistics by Fishery, by Species, by Fishing Method. 2024. Available online: https://kosis.kr/statHtml/statHtml.do?sso=ok&returnurl=%20https%3A%2F%2Fwww.kosis.kr%3A443%2FstatHtml%2FstatHtml.do%3Flist_id%3DK2_7%26obj_var_id%3D%26seqNo%3D%26tblId%3DDT_1EW0005%26vw_cd%3DMT_ZTITLE%26orgId%3D101%26path%3D%252FstatisticsList%252FstatisticsListIndex.do%26conn_path%3DMT_652ZTITLE%26itm_id%3D%26lang_mode%3Dko%26scrId%3D%26 (accessed on 6 January 2026).
- Jones, D.; Wilson, C.D.; Robertis, A.D.; Rooper, C.; Weber, T.C.; Butler, J.L. Evaluation of rockfish abundance in untrawlable habitat: Combining acoustic and complementary sampling tools. Fish Bull. 2012, 110, 332–343. [Google Scholar]
- Yang, Y.S.; Lee, K.H.; Hwang, B.K.; Lee, H.B.; Kim, I.O.; Kim, S.H. Backsscattering strength and vertical distribution of dominant fishes in inland waters by Hydroacoustics. J. Korean Soc. Fish. Ocean. Technol. 2014, 50, 476–486. [Google Scholar] [CrossRef] [Scilit]
- Han, I.S.; Oh, W.S.; Yoon, E.A.; Suh, Y.S.; Lee, K.H.; Sin, H. The relationship between fish and zooplankton in south–western region of the East Sea using hydroacoustics. J. Korean Soc. Fish. Ocean. Technol. 2017, 53, 376–385. [Google Scholar] [CrossRef] [Scilit]
- Yoon, E.A.; Kim, K.S.; Lee, I.T.; Jo, H.J.; Lee, K.H. Target strength estimation by tilt angle and size dependence of rockfish (Sebastes schlegeli) using ex–situ and acoustic scattering model. J. Korean Soc. Fish. Ocean. Technol. 2017, 53, 152–159. [Google Scholar] [CrossRef] [Scilit]
- Liu, J.M.; Setiazi, H.; So, P.Y. Fisheries hydroacoustic assessment: A bibliometric analysis and direction for future research towards a blue economy. Reg. Stud. Mar. Sci. 2023, 60, 102838. [Google Scholar] [CrossRef] [Scilit]
- Park, G.C.; Oh, W.S.; Lee, Y.W.; Lee, H.B.; Lee, K.H. Target strength of anchovy Engraulis japonicaus by theoretical acoustic scattering model. Korean J. Fish. Aquat. Sci. 2024, 57, 302–309. [Google Scholar] [CrossRef]
- Hwang, B.K.; Shin, H.O.; Lee, D.J.; Lee, Y.W. Examination of Theoretical Acoustic Scattering Models for Copepods in an Acoustical Zooplankton Biomass Survey. Korean J. Fish. Aquat. Sci. 2010, 43, 380–385. [Google Scholar] [CrossRef] [Scilit]
- Yoon, E.A.; Hwang, D.J.; Hirose, M.; Kim, E.H.; Mukal, T.; Park, B.S. Characteristics of acoustic scattering according to pulsation of the large jellyfish Nemopilema nomurai. Korean J. Fish. Aquat. Sci. 2010, 43, 551–556. [Google Scholar] [CrossRef] [Scilit]
- Hwang, K.S.; Lee, K.H.; Hwang, B.K. Verification and application of Target Strength for Japanese anchovy (Engraulis japonicas) by theoretical acoustic scattering model. J. Korean Soc. Fish. Ocean. Technol. 2012, 48, 487–494. [Google Scholar] [CrossRef] [Scilit]
- Lee, S.A.; Oh, W.S.; La, H.S.; Son, W.J.; Kim, J.H.; Lee, K.H. Target strength of juvenile Antarctic silverfish (Pleuragramma antarcticum). J. Korean Soc. Fish. Ocean. Technol. 2022, 58, 345–351. [Google Scholar] [CrossRef] [Scilit]
- Park, G.C.; Oh, W.S.; Oh, S.Y.; Lee, K.H. Acoustic scattering characteristics of chub mackerel (Scomber japonicus) by KRM model. J. Korean Soc. Fish. Ocean. Technol. 2022, 58, 32–38. [Google Scholar] [CrossRef] [Scilit]
- Lee, H.B.; Lee, K.H.; Yoon, E.A.; Hwang, K.S.; Choi, J.H.; Park, T.G. Target strength characteristics of sailfin sandfish (Arctoscopus japonicus) using ex situ experiment and acoustic model. J. Korean Soc. Fish. Ocean. Technol. 2015, 51, 405–413. [Google Scholar] [CrossRef] [Scilit]
- Mukai, T.; Iida, K. Depth dependence of target strength of live kokanee salmon in accordance with Boyle’s law. ICES J. Mar. Sci. 1996, 53, 245–248. [Google Scholar] [CrossRef] [Scilit]
- Sawada, K.; Takao, Y.; Miyanohana, Y.; Kinacigil, H.T. Introduction of the precise TS measurement for fisheries acoustics. Turk. J. Vet. Anim. Sci. 2002, 26, 209–214. [Google Scholar]
- Hazen, E.L.; Horne, J.K. A method for evaluating the effects of biological factors on fish target strength. ICES J. Mar. Sci. 2003, 60, 555–562. [Google Scholar] [CrossRef] [Scilit]
- Ayoubi, S.E.; Mamza, K.; Fujino, T.; Abe, K.; Amakasu, K.; Miyashita, K. Estimation of target strength of Sardina pilchardus and Sardinella aurita by theoretical approach. Fish. Sci. 2016, 82, 417–423. [Google Scholar] [CrossRef] [Scilit]
- Kang, D.H.; Sadayasu, K.; Mukai, T.; Iida, K.; Hwang, D.J.; Sawada, K.; Miyashita, K. Target strength estimation of black porgy Acanthopagrus schlegeli using acoustic measurements and a scattering model. Fish. Sci. 2004, 70, 819–828. [Google Scholar] [CrossRef] [Scilit]
- Tanoue, H.; Komatsu, T.; Natheer, A.; Mitani, I.; Watanabe, S.; Watanabe, Y.; Hamano, A.; Miyazaki, N. Measurement of Diurnal Body Tilt Angle Distributions of Threeline Grunt Parapristipoma trilineatum Using Micro-Acceleration Data Loggers. J. Mar. Sci. Eng. 2013, 1, 3–9. [Google Scholar] [CrossRef] [Scilit]
- Clay, C.S.; Horne, J.K. Acoustic models of fish: The Atlantic cod (Gadus morhua). J. Acoust. Soc. Am. 1994, 96, 1661–1668. [Google Scholar] [CrossRef] [Scilit]
- Hwang, B.K.; Lee, Y.W.; Jo, H.S.; Oh, J.K.; Kang, M.H. Visual census and hydro–acoustic survey of demersal fish aggregations in Uiju small scale marine ranching area (MRA), Korea. J. Korean Soc. Fish. Ocean. Technol. 2015, 51, 16–25. [Google Scholar] [CrossRef] [Scilit]
- Gastauer, S.; Scoulding, B.; Fässler, M.S.; Benden, P.D.; Parsons, M. Target strength estimates of red emperor (Lutjanus sebae) with Bayesian parameter calibration. Aquat. Living Resour. 2016, 29, 301. [Google Scholar] [CrossRef] [Scilit]
- Yasuma, H.; Sawada, K.; Takao, Y.; Miyashita, K.; Aoki, I. Swimbladder condition and target strength of myctophid fish in the temperate zone of the Northwest Pacific. ICES J. Mar. Sci. 2010, 67, 135–144. [Google Scholar] [CrossRef] [Scilit]
- Fässler, S.M.M.; O’Donnell, C.; Jech, J.M. Boarfish (Capros aper) target strength modelled from magnetic resonance imaging (MRI) scans of its swimbladder. ICES J. Mar. Sci. 2013, 70, 1451–1459. [Google Scholar] [CrossRef] [Scilit]
- Gauthier, S.; Horne, J.K. Acoustic characteristics of forage fish species in the Gulf of Alaska and Bering Sea based on Kirchhoff–approximation models. Can. J. Fish. Aquat. Sci. 2004, 61, 1839–1850. [Google Scholar] [CrossRef] [Scilit]
- Choi, J.H.; Oh, W.S.; Yoon, E.A.; Im, Y.J.; Lee, K.H. Target Strength according to tilt angle and length of black seabream Acanthopagrus schlegeli at 200 kHz–frequency. Korean J. Fish. Aquat. Sci. 2018, 51, 566–570. [Google Scholar] [CrossRef]
- Hasegawa, K.; Yan, N.; Mukai, T.; Fukuda, Y.; Yamamoto, J. Broadband Characteristics of Target Strength of Pacific Chub Mackerel. Fishes 2025, 10, 51. [Google Scholar] [CrossRef] [Scilit]
- Weihs, D. Energetic advantages of burst swimming of fish. J. Theor. Biol. 1974, 48, 215–229. [Google Scholar] [CrossRef] [Scilit]
- Liao, J.C.; Beal, D.N.; Lauder, G.V.; Triantafyllou, M.S. Fish Exploiting Vortices Decrease Muscle Activity. Science 2003, 302, 1566–1569. [Google Scholar] [CrossRef] [Scilit]
- Arakeri, J.H. Fluid Mechanics of Fish Swimming. Resonance 2009, 14, 32–46. [Google Scholar] [CrossRef] [Scilit]
- Membiela, F.A.; Erba, M.G. A hydrodynamic analytical model of fish tilt angle: Implications for the modelling of the acoustic target strength. Cornell Univ. Phys. Fluid Dyn. 2017, 1–23. [Google Scholar] [CrossRef] [Scilit]
- Barange, M.; Hampton, I.; Soule, M. Empirical determination of in situ target strengths of three loosely aggregated pelagic fish species. ICES J. Mar. Sci. 1996, 53, 225–232. [Google Scholar] [CrossRef] [Scilit]
- Svellingen, I.; Ona, E. A summary of target strength observations on fishes from the shelf off West Africa. J. Acoust. Soc. Am. 1999, 105, 1049. [Google Scholar] [CrossRef] [Scilit]
- Foote, K.G. Importance of the swimbladder in acoustic scattering by fish: A comparison of gadoid and mackerel target strengths. J. Acoust. Soc. Am. 1980, 67, 2084–2089. [Google Scholar] [CrossRef] [Scilit]
- Kim, H.S.; Cho, S.H.; Kim, M.R.; Kim, S.H.; Kang, D.H. Acoustic Target Strength According to Different Growth Stages of Japanese Anchovy (Engraulis japonicus): A Comparison of Juvenile and Adult Fish. J. Mar. Sci. Eng. 2023, 11, 1575. [Google Scholar] [CrossRef] [Scilit]
- Ito, Y.; Yasuma, H.; Masuda, R.; Minami, K.; Matsukura, R.; Morioka, S.; Miyashita, K. Swimming angle and target strength of larval Japanese anchovy (Engraulis japonicus). Fish. Sci. 2011, 77, 161–167. [Google Scholar] [CrossRef] [Scilit]

Disclaimer/Publisher’s Note: The statements, opinions and data contained in all publications are solely those of the individual author(s) and contributor(s) and not of MDPI and/or the editor(s). MDPI and/or the editor(s) disclaim responsibility for any injury to people or property resulting from any ideas, methods, instructions or products referred to in the content. |
© 2026 by the authors. Licensee MDPI, Basel, Switzerland. This article is an open access article distributed under the terms and conditions of the Creative Commons Attribution (CC BY) license.