


Abstract
Evaluation of gas hydrate stability in marine sediments is commonly conducted assuming pure methane systems, although increasing drilling and logging evidence indicates that natural gas hydrates frequently contain minor amounts of heavier hydrocarbons. In the northern South China Sea, the presence of ethane has been widely reported, yet its influence on hydrate phase equilibrium and the distribution of the gas hydrate stability zone (GHSZ) remains insufficiently quantified. The results show that ethane is preferentially incorporated into large cages and promotes structure II hydrate stability, leading to lower dissociation pressures and higher stability temperatures compared with pure methane hydrates. Incorporation of as little as 1 mol% ethane systematically deepens the predicted base of the GHSZ and enlarges the hydrate-free gas coexistence interval beneath the bottom-simulating reflector (BSR). These effects indicate that conventional pure CH4 models underestimate both the thickness of the hydrate stability zone and the potential extent of hydrate occurrence. At the regional scale, composition-dependent stability provides a coherent explanation for discrepancies between seismic BSR depths and hydrate predictions. This study establishes a composition-sensitive framework for regional GHSZ evaluation, demonstrating that even trace hydrocarbons must be considered to reliably assess hydrate occurrence, resource potential, and associated geohazards in continental margin settings.
1. Introduction
Natural gas hydrate is a crystalline compound in which water molecules form cage-like structures that encapsulate gas molecules such as CH4 and C2H6 under low-temperature and high-pressure conditions [1,2,3]. These hydrates are primarily found in marine sediments and permafrost regions [4], where they represent a significant potential source of energy and have attracted growing interest for future exploitation. Beyond their energy potential, natural gas hydrates are also crucial in geological, environmental, and engineering studies [5,6,7,8,9,10]. However, challenges such as inefficient extraction methods, high costs, and environmental concerns continue to hinder large-scale commercial production [11]. One of the key challenges in gas hydrate research is accurately predicting the location and extent of the gas hydrate stability zone (GHSZ), as these predictions directly impact drilling safety, resource estimation, and site selection for extraction tests.
While much of the existing research on natural gas hydrates focuses on pure methane systems, natural gas hydrates in real-world settings often contain trace amounts of heavier hydrocarbons, such as ethane [12,13,14]. These multicomponent gas systems, especially CH4-C2H6 mixtures, are common in marine environments and significantly alter hydrate phase behavior [15,16]. This phenomenon has been observed in various locations, including the Manila Trench, the New Zealand Hikurangi Subduction Zone, the NW Sabah continental margin, and the Pearl River Mouth Basin [17,18,19,20,21,22,23]. Ethane preferentially occupies the larger cages in the hydrate lattice, stabilizing structure II hydrates (sII) and lowering dissociation pressures compared to pure methane hydrates. As a result, the GHSZ becomes deeper and more extensive than predicted by traditional models based solely on methane. This makes it clear that the inclusion of ethane and other trace hydrocarbons is essential for accurately predicting the thickness and distribution of the GHSZ, particularly in regions like the Shenhu Area in the northern South China Sea, where ethane has been frequently observed in hydrate samples.
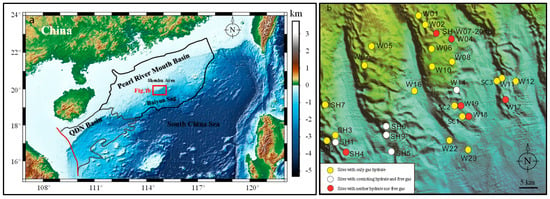
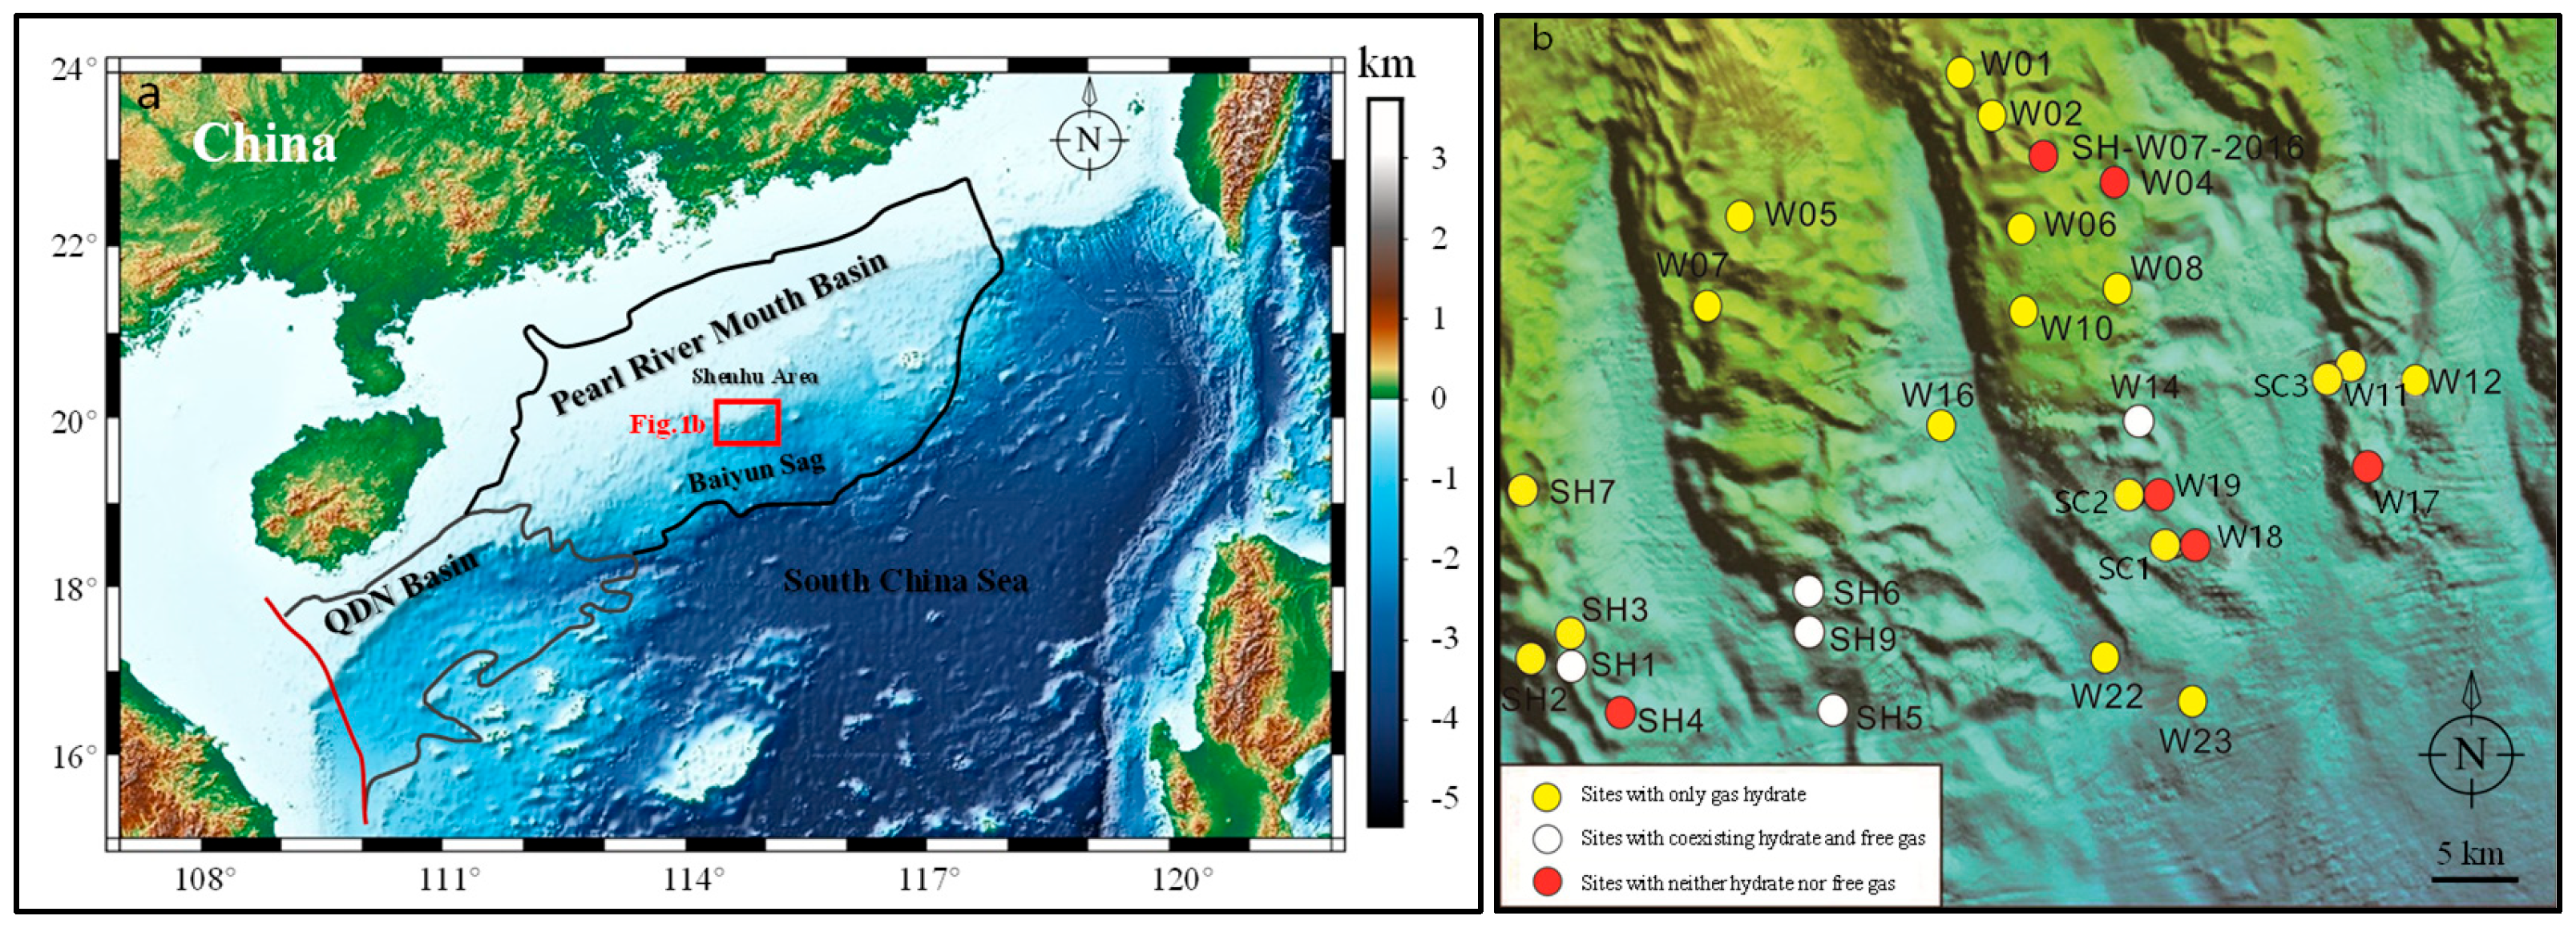
In the northern South China Sea (Figure 1), extensive drilling and logging campaigns have provided valuable insights into the distribution of gas hydrates under varying geological and thermal conditions. The region is characterized by complex geological structures, including active faults and variations in geothermal gradients, which directly influence hydrate stability. Notably, the Shenhu Area, located in the Qiongdongnan Basin, has emerged as a key site for gas hydrate research due to its diverse geological features, such as a significant geothermal gradient (ranging from 54.9 °C/km) and varying water depths (approximately 1252 m). These factors play a crucial role in determining the thickness and extent of the GHSZ, making the region an ideal location for studying the influence of multicomponent gas systems on hydrate stability.
Figure 1.
Location of the study area in the northern South China Sea, showing major tectonic units and borehole locations discussed in this study. (a) Major geomorphological features along the northern continental margin of the South China Sea. (b) Distribution of the drilling sites in the Shenhu Area. Modified after Huang et al. [24].
To address these complexities, this study combines high-pressure phase-equilibrium experiments with Raman spectroscopy to constrain the stability, structure, and guest distribution of CH4-C2H6 hydrates. The experimental results are then used to calibrate and validate a van der Waals-Platteeuw (vdW-P) model, which is integrated with regional parameters such as water depth, seafloor temperature, and geothermal gradient. This model enables the quantification of composition-dependent GHSZ geometry, offering a more accurate regional GHSZ assessment. In doing so, it improves the interpretation of hydrate-free gas zoning beneath the bottom-simulating reflector (BSR) in the northern South China Sea.
2. Methods
2.1. Experimental Simulation Design
2.1.1. Experimental Apparatus and Materials
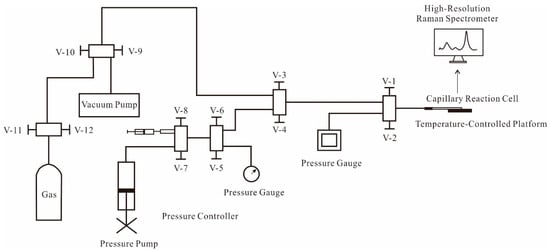
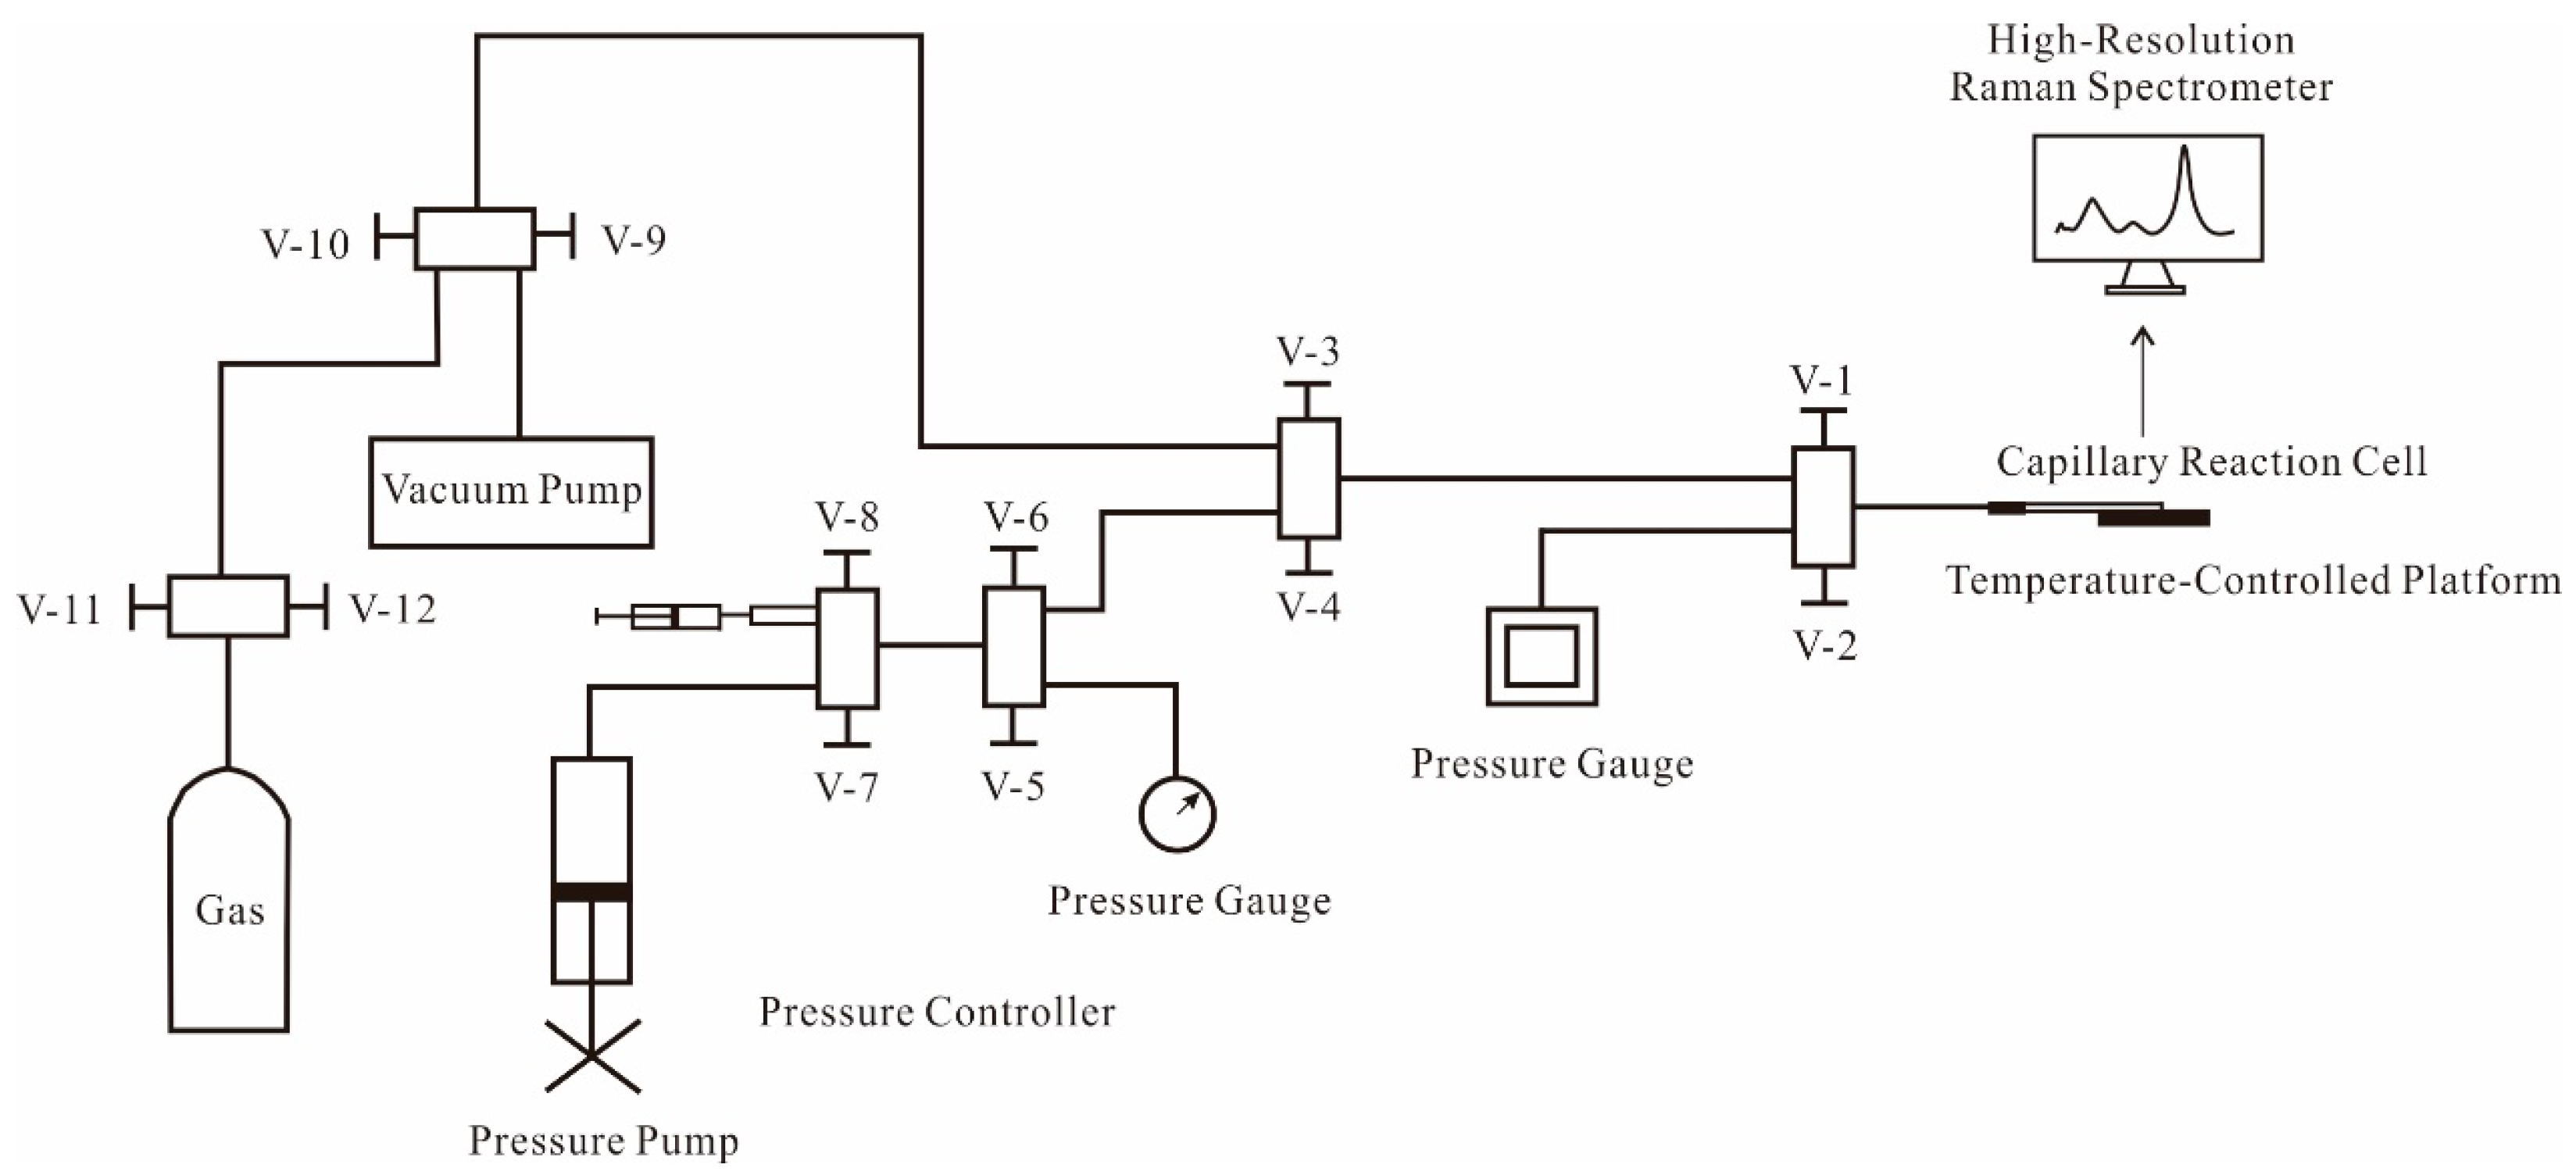
The experimental setup consists of a Raman spectrometer, a high-pressure transparent quartz capillary reactor, a temperature control system, a pressurization system, and a vacuum system (Figure 2). The Raman spectrometer used in this study is a LabRam-010 (Jobin Yvon, Longjumeau, France), equipped with a microscopic confocal system and CCD signal detection. It has an optical resolution of 1.5 cm−1 and utilizes a 532 nm laser for excitation. Prior to the experiments, the instrument was calibrated using a silicon wafer with a Raman peak at 520.7 cm−1. The high-pressure quartz capillary reactor (Polymicro Technologies, Phoenix, AZ, USA) has an inner diameter of 299 μm and an outer diameter of 658 μm, capable of withstanding the high-pressure conditions required for hydrate experiments. The temperature control system is based on a CAP500 cryostat (Linkam, Salfords, UK), which allows for precise temperature regulation from −195 °C to 500 °C with an accuracy of 0.1 °C. The capillary reactor is placed in a dedicated holder with a minimal temperature gradient, ensuring precise temperature measurements. A manual pressure pump, SYB-2 (Chuanghua, Haian, China), is used to generate pressures up to 40 MPa, with continuous pressure monitoring provided by a PX91NO-30KVS pressure sensor (OMEGA, Stamford, CT, USA) and a precision pressure gauge (Setra, Boxborough, MA, USA). The system is also equipped with a vacuum system, which includes a vacuum pump, vacuum gauge, and vacuum buffer bottle to remove any air from the system before introducing gases.
Figure 2.
Schematic of the experimental apparatus.
2.1.2. Experimental Methodology
The experimental procedure for gas hydrate formation was carried out in situ, using a series of carefully controlled steps to ensure accurate results. The first step involved the preparation of the quartz capillary. The capillary was pretreated by flame-cleaning to remove any organic contaminants, followed by epoxy sealing at both ends to ensure airtightness. The capillary was then subjected to vacuum degassing to remove any air trapped inside, preparing it for the introduction of the experimental gases.
After preparing the capillary, the system underwent cyclic gas purging. This process involved 5 to 6 vacuum and gas-fill cycles to ensure that all air was removed from the capillary, leaving only the desired gas mixture. The gas mixture consisted of CH4 and C2H6, which were introduced into the capillary reactor under controlled conditions. The system was then pressurized gradually using a SYB-2 hand pump to reach pressures between 5 MPa and 25 MPa, with liquid water used as the pressure medium. This pressurization was essential for creating the conditions necessary for gas hydrate formation.
Next, the temperature of the system was controlled using a Linkam CAP500 cryostat. The system underwent temperature cycling between 243 K and 283 K to initiate hydrate nucleation while avoiding ice formation. Specifically, the temperature was lowered to 243 K to promote hydrate formation, and then gradually increased to temperatures up to 283 K in a controlled manner to maintain hydrate stability.
During the experiment, Raman spectroscopy was used to monitor the formation of gas hydrates in situ. A 532 nm laser was employed, with an integration time of 10 s and 3 scans, to capture the Raman spectra. Isothermal holds were conducted at 25 predefined temperature-pressure conditions, ranging from 275.15 K to 283.15 K and 5 MPa to 25 MPa. Phase transitions within the hydrate structure were identified by the characteristic vibrational peaks in the C-H stretching region (2900–3000 cm−1). The temperature and pressure were maintained with a precision of ±0.1 K and ±0.05 MPa, respectively, ensuring reliable phase equilibrium measurements throughout the experiment.
2.2. Numerical Simulation
2.2.1. Development of Numerical Models
Experimental data for the multicomponent systems hydrate system under the typical seabed hydrate formation temperature and pressure conditions (5~40 MPa and 2~25 °C) remain scarce [25,26]. Predictions from widely used thermodynamic modeling software, such as CSMGem v1.0, exhibit significant deviations, especially at elevated pressures [27,28]. Reliable data constraining the coexistence region of sII hydrates and free gas under comparable pressure conditions at the site of Shenhu Area are lacking. Extensive experimental investigations and refined thermodynamic model optimizations are required to elucidate the thermodynamic conditions governing phase equilibria in multicomponent natural gas–water–hydrate systems within seabed sediments.
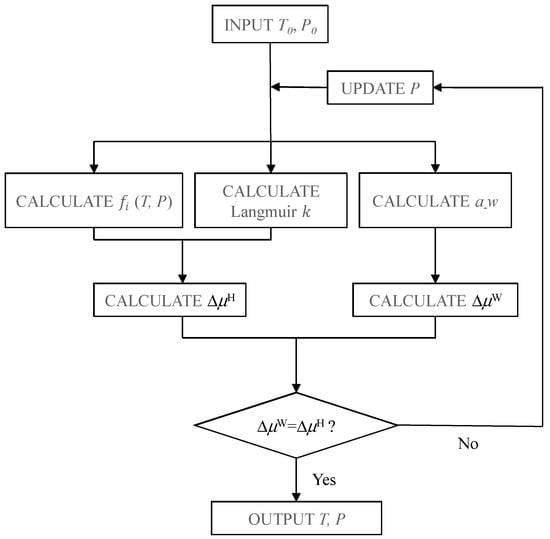
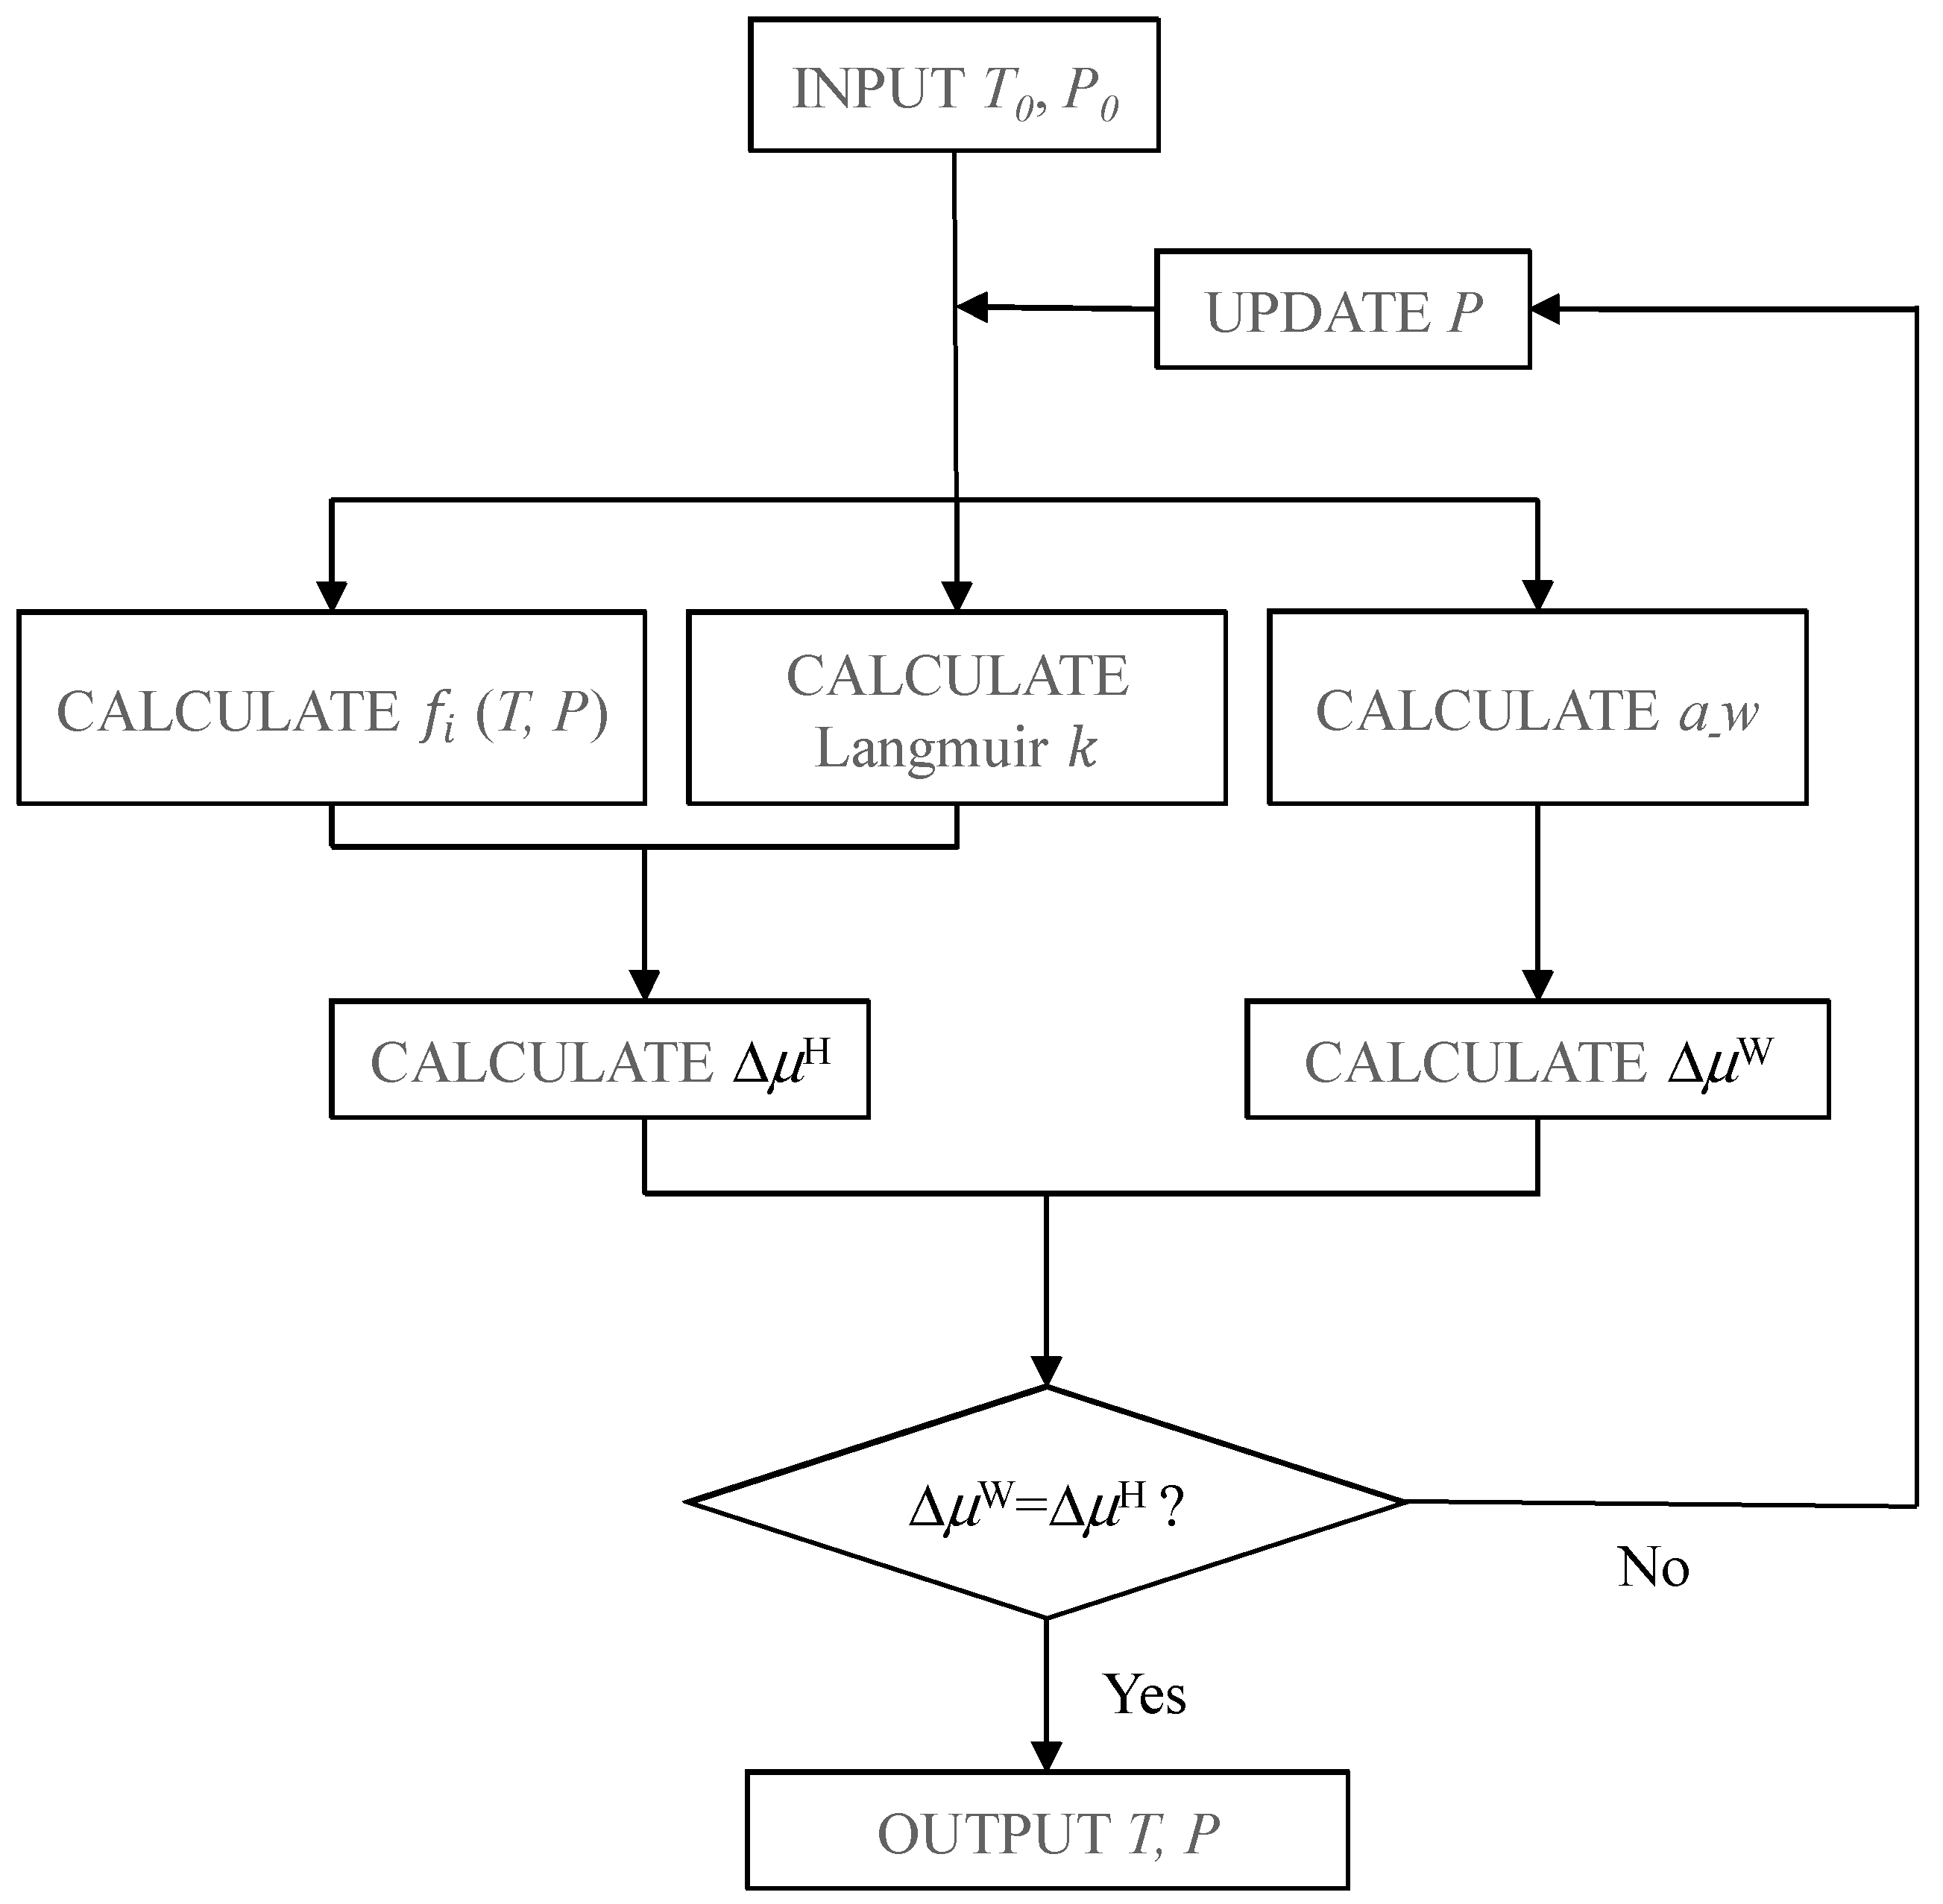
The model employed in this study was solved using the gradient search method. Thermodynamic stability conditions of gas hydrates were established by evaluating the chemical potential of water across coexisting phases (hydrate, aqueous liquid, and/or ice). For example, to determine the hydrate formation pressure at a specified temperature (T0), the calculation begins by assuming an initial pressure (P0). Iterative computations comparing the free energy of water in the hydrate phase with that in the liquid phase (Figure 3) yield the corresponding pressure (P). A similar algorithm is employed to determine the hydrate formation temperature at a specified pressure.
Figure 3.
Software solution method and flowchart. T represents the absolute temperature, and P denotes the equilibrium pressure, the principal output of the calculation. The process begins with the input of an initial pressure (P0) and temperature (T0). The method computes parameters such as Henry’s constant (), the Langmuir constant (), water activity (a_w), and the chemical potentials of hydrate (ΔμH) and water (ΔμW). The algorithm iteratively updates the pressure until the changes in chemical potential for both hydrate and water converge, yielding the final equilibrium pressure and temperature (T, P).
Gas hydrate phase equilibrium was described using the vdW-P statistical thermodynamic model, in which hydrate stability is determined by the chemical potential difference between water in the hydrate phase and the reference phase, as well as by the cage occupancies of guest molecules. Accordingly, the equilibrium pressure is expressed as a function of temperature, gas composition, and cavity occupancies:
where denotes the equilibrium pressure at which gas, water, and hydrate phases coexist, and is the absolute temperature. The term represents the mole fraction of component in the gas phase (), while the vector specifies the overall gas composition. The variable denotes the fractional occupancy of cavity type in the hydrate lattice (0 ≤ ≤ 1), and describes the occupancy state of all cavities. For example, sI hydrates contain small cages (512) and large cages (51262), whereas sII hydrates contain small cages (512) and larger cages (51264).
The vdW-P model accounts for the specific interactions between guest molecules and the host water framework by incorporating a potential that reflects the energy of these interactions. The guest molecule interactions are described by a statistical thermodynamic potential, which can be written as follows:
where is the chemical potential of guest in the hydrate phase, is the chemical potential in the reference phase (usually the gas phase), is the universal gas constant, and is the absolute temperature. The term is the fractional occupancy of guest in cavity type , which is determined by the Langmuir adsorption model.
The fractional occupancy of guest in cavity type is given by the Langmuir adsorption model:
where is the fractional occupancy of the guest in cavity , is the temperature-dependent Langmuir constant, and is the fugacity of component determined from the chosen equation of state (e.g., Peng–Robinson). The total occupancy of cavity type is then obtained by
Thus, Equation (1) provides a concise thermodynamic description that links macroscopic variables (P, T, ) with microscopic cage occupancies (), thereby enabling reliable prediction of hydrate phase equilibrium in multicomponent gas systems. This approach is rigorously validated for natural gas systems and adaptable to multicomponent or inhibitor-containing systems.
2.2.2. Reliability of Numerical Models
The reliability of numerical models in predicting gas hydrate phase equilibria is essential for accurate resource evaluation and exploration. To assess the reliability of the vdW-P model, we directly compared its predictions with experimental data, encompassing both pressure–temperature conditions and gas compositions (Table 1 and Table 2), thereby validating the agreement between theoretical and experimental results. Table 1 and Table 2 are included to benchmark the general performance of the vdW-P implementation for representative multicomponent gas hydrates using well-established literature datasets; the model consistency for the target CH4-C2H6 system is further evaluated against our experimental equilibrium results in Section 3.1.4.
Table 1.
Experimental vs. calculated formation conditions for multicomponent gas hydrate (10.74% N2 + 89.26% CH4).
Table 2.
Experimental vs. calculated formation conditions for multicomponent gas hydrate (5% CO2 + 0.03% N2 + 94.97% CH4).
For hydrates composed of 10.74% N2 + 89.26% CH4 and 5% CO2 + 0.03% N2 + 94.97% CH4, the deviations between measured and calculated dissociation pressures were generally below 5%. The model predictions for gas distribution exhibited excellent agreement with experimental observations, thereby validating its capability to accurately represent guest-molecule dynamics in hydrate structures.
The close agreement between the model predictions and experimental data underscores the reliability of the vdW-P model. The model’s capacity to accurately predict both equilibrium pressures and gas distribution demonstrates its robustness in simulating gas hydrate formation, particularly in multicomponent gas systems such as CH4-C2H6 mixtures. This reliability further emphasizes the model’s utility for resource evaluation and exploration, where precise predictions of hydrate stability and behavior are essential.
2.3. Uncertainty Quantification and Sensitivity Analysis
2.3.1. Site-Specific Boundary Conditions and Parameter Ranges
For site-scale and regional GHSZ calculations, the required boundary conditions include water depth, seafloor temperature, geothermal gradient, pore–water salinity, and gas composition. Water depth, seafloor temperature, and site-specific geothermal gradients for SC-01, SC-02, W18, and W19 were compiled from published logging-based datasets (Table 3), and the W17 parameters (1252 m water depth, 3 °C seafloor temperature, and 54.9 °C/km geothermal gradient) were adopted from the Shenhu drilling constraint used in this study [30,31]. Pore–water salinity was treated as constant at 3.45 wt% for regional calculations, consistent with the weak salinity variability reported for deep-water masses in the northern South China Sea.
Table 3.
Vertical zonation of sI and sII hydrates in the Shenhu Area derived from field data and thermodynamic modeling.
Gas composition scenarios were evaluated using endmembers and representative mixtures (100% CH4, 99% CH4 + 1% C2H6, 90% CH4 + 10% C2H6, and 100% C2H6), allowing compositional variability to be propagated into predicted BGHSZ depths and the I-BGHSZ to II-BGHSZ offset.
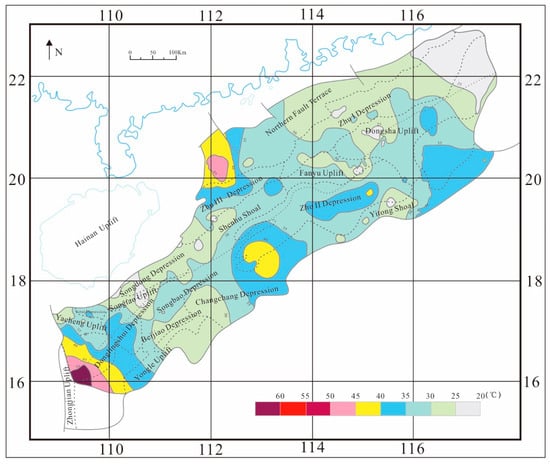
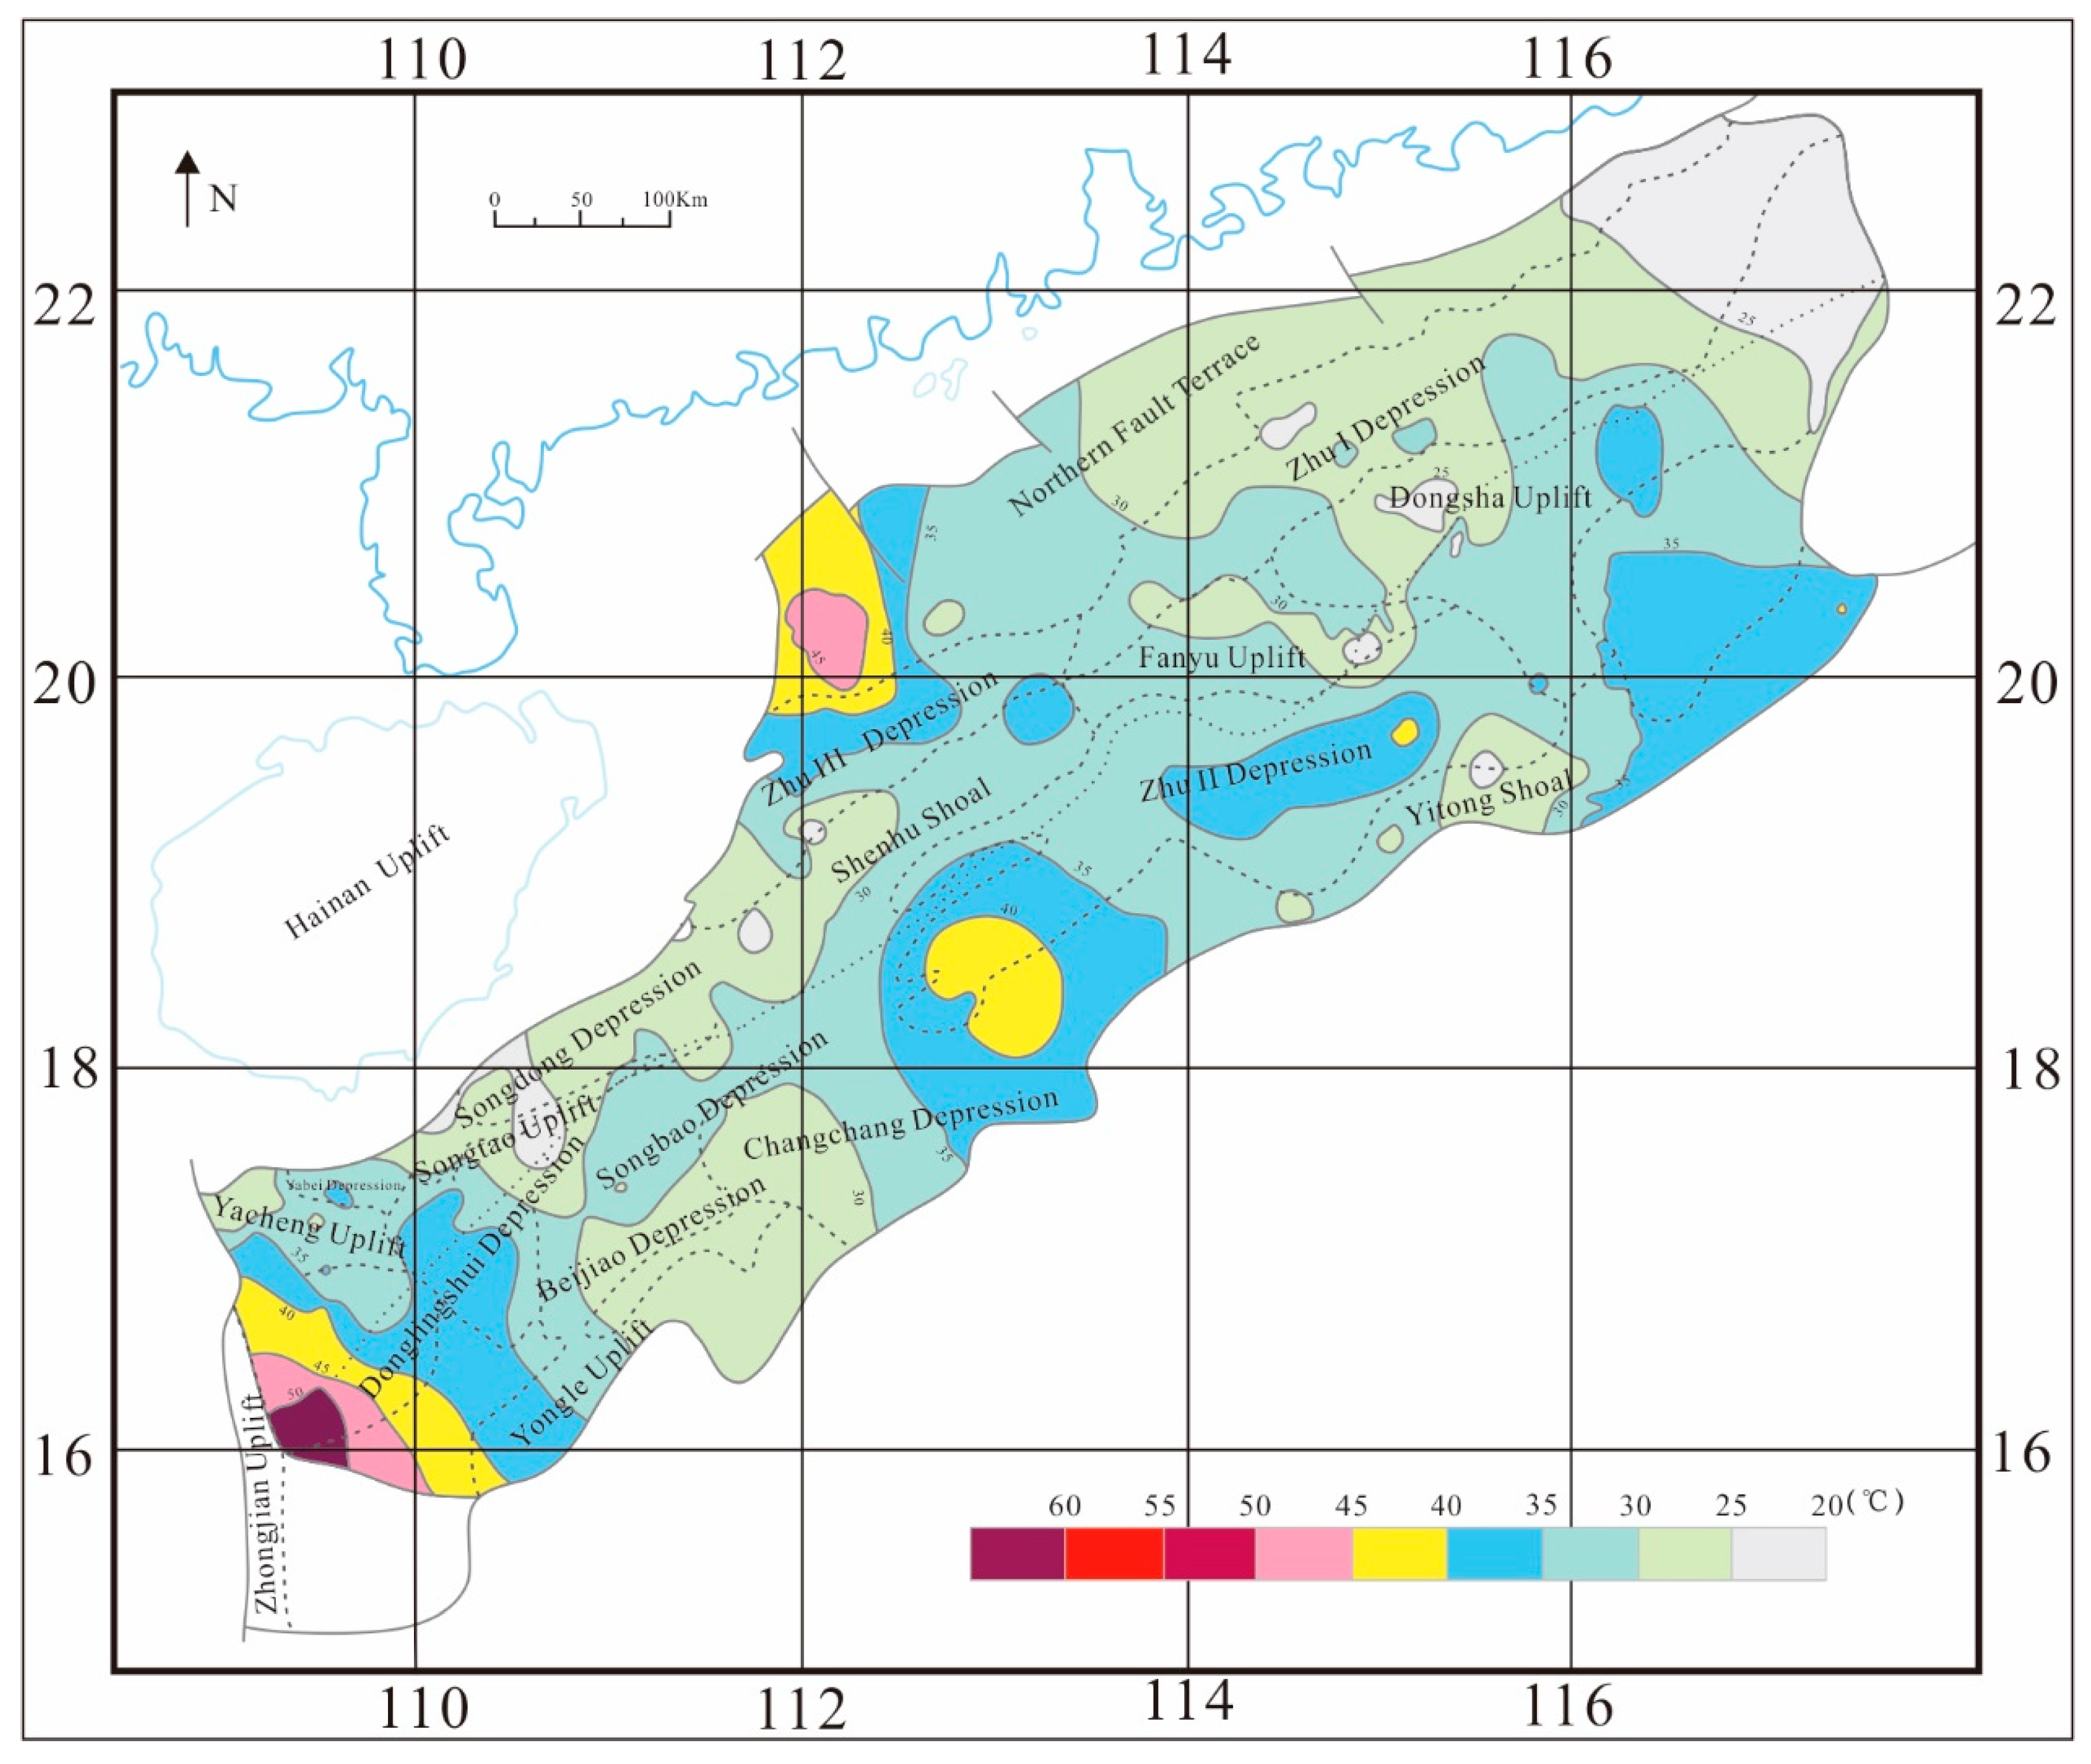
For regional-scale mapping, spatially varying geothermal gradients were implemented as a primary thermal boundary condition. A geothermal-gradient grid was constructed for the northern South China Sea based on published heat-flow/geothermal-gradient compilations and regional interpolation (Figure 4). The resulting map indicates pronounced spatial heterogeneity across major tectonic units, with gradients generally spanning 17.8–52.4 °C/km. In the Qiongdongnan Basin, gradients range from 24.2 to 52.4 °C/km (mean 32.1 ± 6 °C/km), whereas the Pearl River Mouth Basin typically exhibits 24.2–48.7 °C/km (mean 31.8 ± 5.6 °C/km) [33]. These values were used as the baseline geothermal gradient field for regional GHSZ thickness calculations.
Figure 4.
Isoline Map of Geothermal Gradient in the Northern South China Sea.
To ensure consistency between site-scale and regional calculations, site-level geothermal gradients (Table 3) were treated as point constraints and used to check the reasonableness of the regional gradient field at borehole locations. Uncertainty ranges for geothermal gradient and seafloor temperature were propagated in Section 2.3.2 to derive confidence intervals for BGHSZ depth predictions.
2.3.2. Error Propagation and Confidence Intervals for BGHSZ Depth
Uncertainty in predicted BGHSZ depth arises from measurement and interpolation errors in boundary conditions as well as from compositional variability. To quantify uncertainty, we propagated parameter uncertainties through the BGHSZ calculation using a first-order approach and verified the relative importance of each source using one-at-a-time sensitivity tests. For a linear geothermal profile, the BGHSZ depth can be expressed as , where is the equilibrium temperature at the BGHSZ, is the seafloor temperature, and is the geothermal gradient. Under the assumption of independent errors, the uncertainty of is approximated by
where , , and denote uncertainties in seafloor temperature, geothermal gradient, and ethane fraction, respectively. In practice, was evaluated numerically by perturbing the ethane fraction within the composition scenarios and recomputing the BGHSZ intersection using the same vdW-P workflow as the baseline calculations.
2.3.3. Sensitivity Metrics and Source Attribution
We quantified sensitivity using normalized sensitivity coefficients for each input parameter , which enables direct comparison among parameters with different units. In addition, we decomposed the total variance of into fractional contributions from each uncertainty source to identify the dominant controls on confidence intervals. This framework provides (i) 95% confidence intervals for I-BGHSZ and II-BGHSZ depth predictions at each site, and (ii) a ranked sensitivity diagnosis that highlights which parameters most strongly control prediction uncertainty.
2.4. Density Functional Theory Calculations
To provide a molecular-level rationale for the Raman-inferred cage occupancy trends and the observed sI-sII structural preference with varying C2H6 fraction, we performed DFT calculations on representative guest-cage configurations.
Under identical pressure–temperature conditions, differences in molecular size and geometry between CH4 and C2H6 may lead to distinct guest-host interactions and, consequently, different hydrate structural preferences. To examine these effects at the molecular scale, cluster-level DFT calculations were conducted to evaluate the relative stability of CH4 and C2H6 bearing hydrate cages.
Based on density functional theory, the Gaussian quantum chemistry software (Gaussian 16, Gaussian, Inc., Wallingford, CT, USA) was employed to simulate the formation processes of small and large cages in sI and sII hydrates. Formation energy, encapsulation energy, and fusion energy were calculated for single-cage and double-cage systems containing C2H6 as the guest molecule. These results were compared with those obtained for CH4 under identical conditions to evaluate their relative stabilization effects. Relevant computational data are presented in Table 4.
Table 4.
Calculated thermodynamic parameters for CH4 and C2H6 hydrates.
The calculated energetic descriptors for CH4 and C2H6 bearing cage models (including formation energy, encapsulation/capture energy, and fusion energy for single-cage and multi-cage assemblies) are reported in Table 3. These quantities are used as molecular-scale indicators to compare guest-host stabilization across cage types and guest species under consistent computational settings. The DFT-derived energetic metrics are not used as direct inputs to the vdW-P thermodynamic model; instead, they serve as independent molecular-level constraints supporting the interpretation of cage preference and structural tendency inferred from Raman observations and thermodynamic calculations.
3. Results
3.1. Experimental Observations and Raman-Derived Cage Occupancy
3.1.1. Growth Morphology and Kinetic Features in Capillary Experiments
Hydrate formation in CH4-C2H6 mixed-gas systems shows reproducible crystal-growth behavior under the investigated temperature-pressure conditions. In both the 80% CH4 + 20% C2H6 and 90% CH4 + 10% C2H6 systems, hydrate crystals preferentially developed from the capillary tail toward the gas–liquid interface (Figure 5). This directional growth pattern indicates that gas diffusion and local gas supply exert strong control on nucleation and subsequent crystal growth in the capillary geometry. The observed morphology provides a macroscopic basis for interpreting guest-molecule partitioning during hydrate formation.
Figure 5.
Hydrate crystals of 80% CH4 + 20% C2H6 and 90% CH4 + 10% C2H6 grown in capillaries.
3.1.2. Experimental Phase Boundary Trend for CH4-C2H6 Hydrates
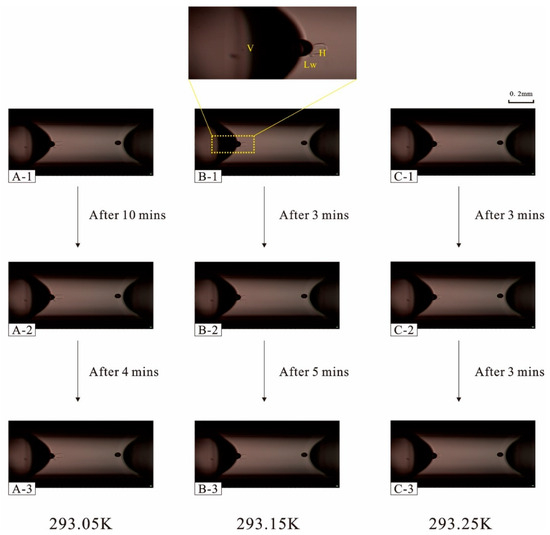
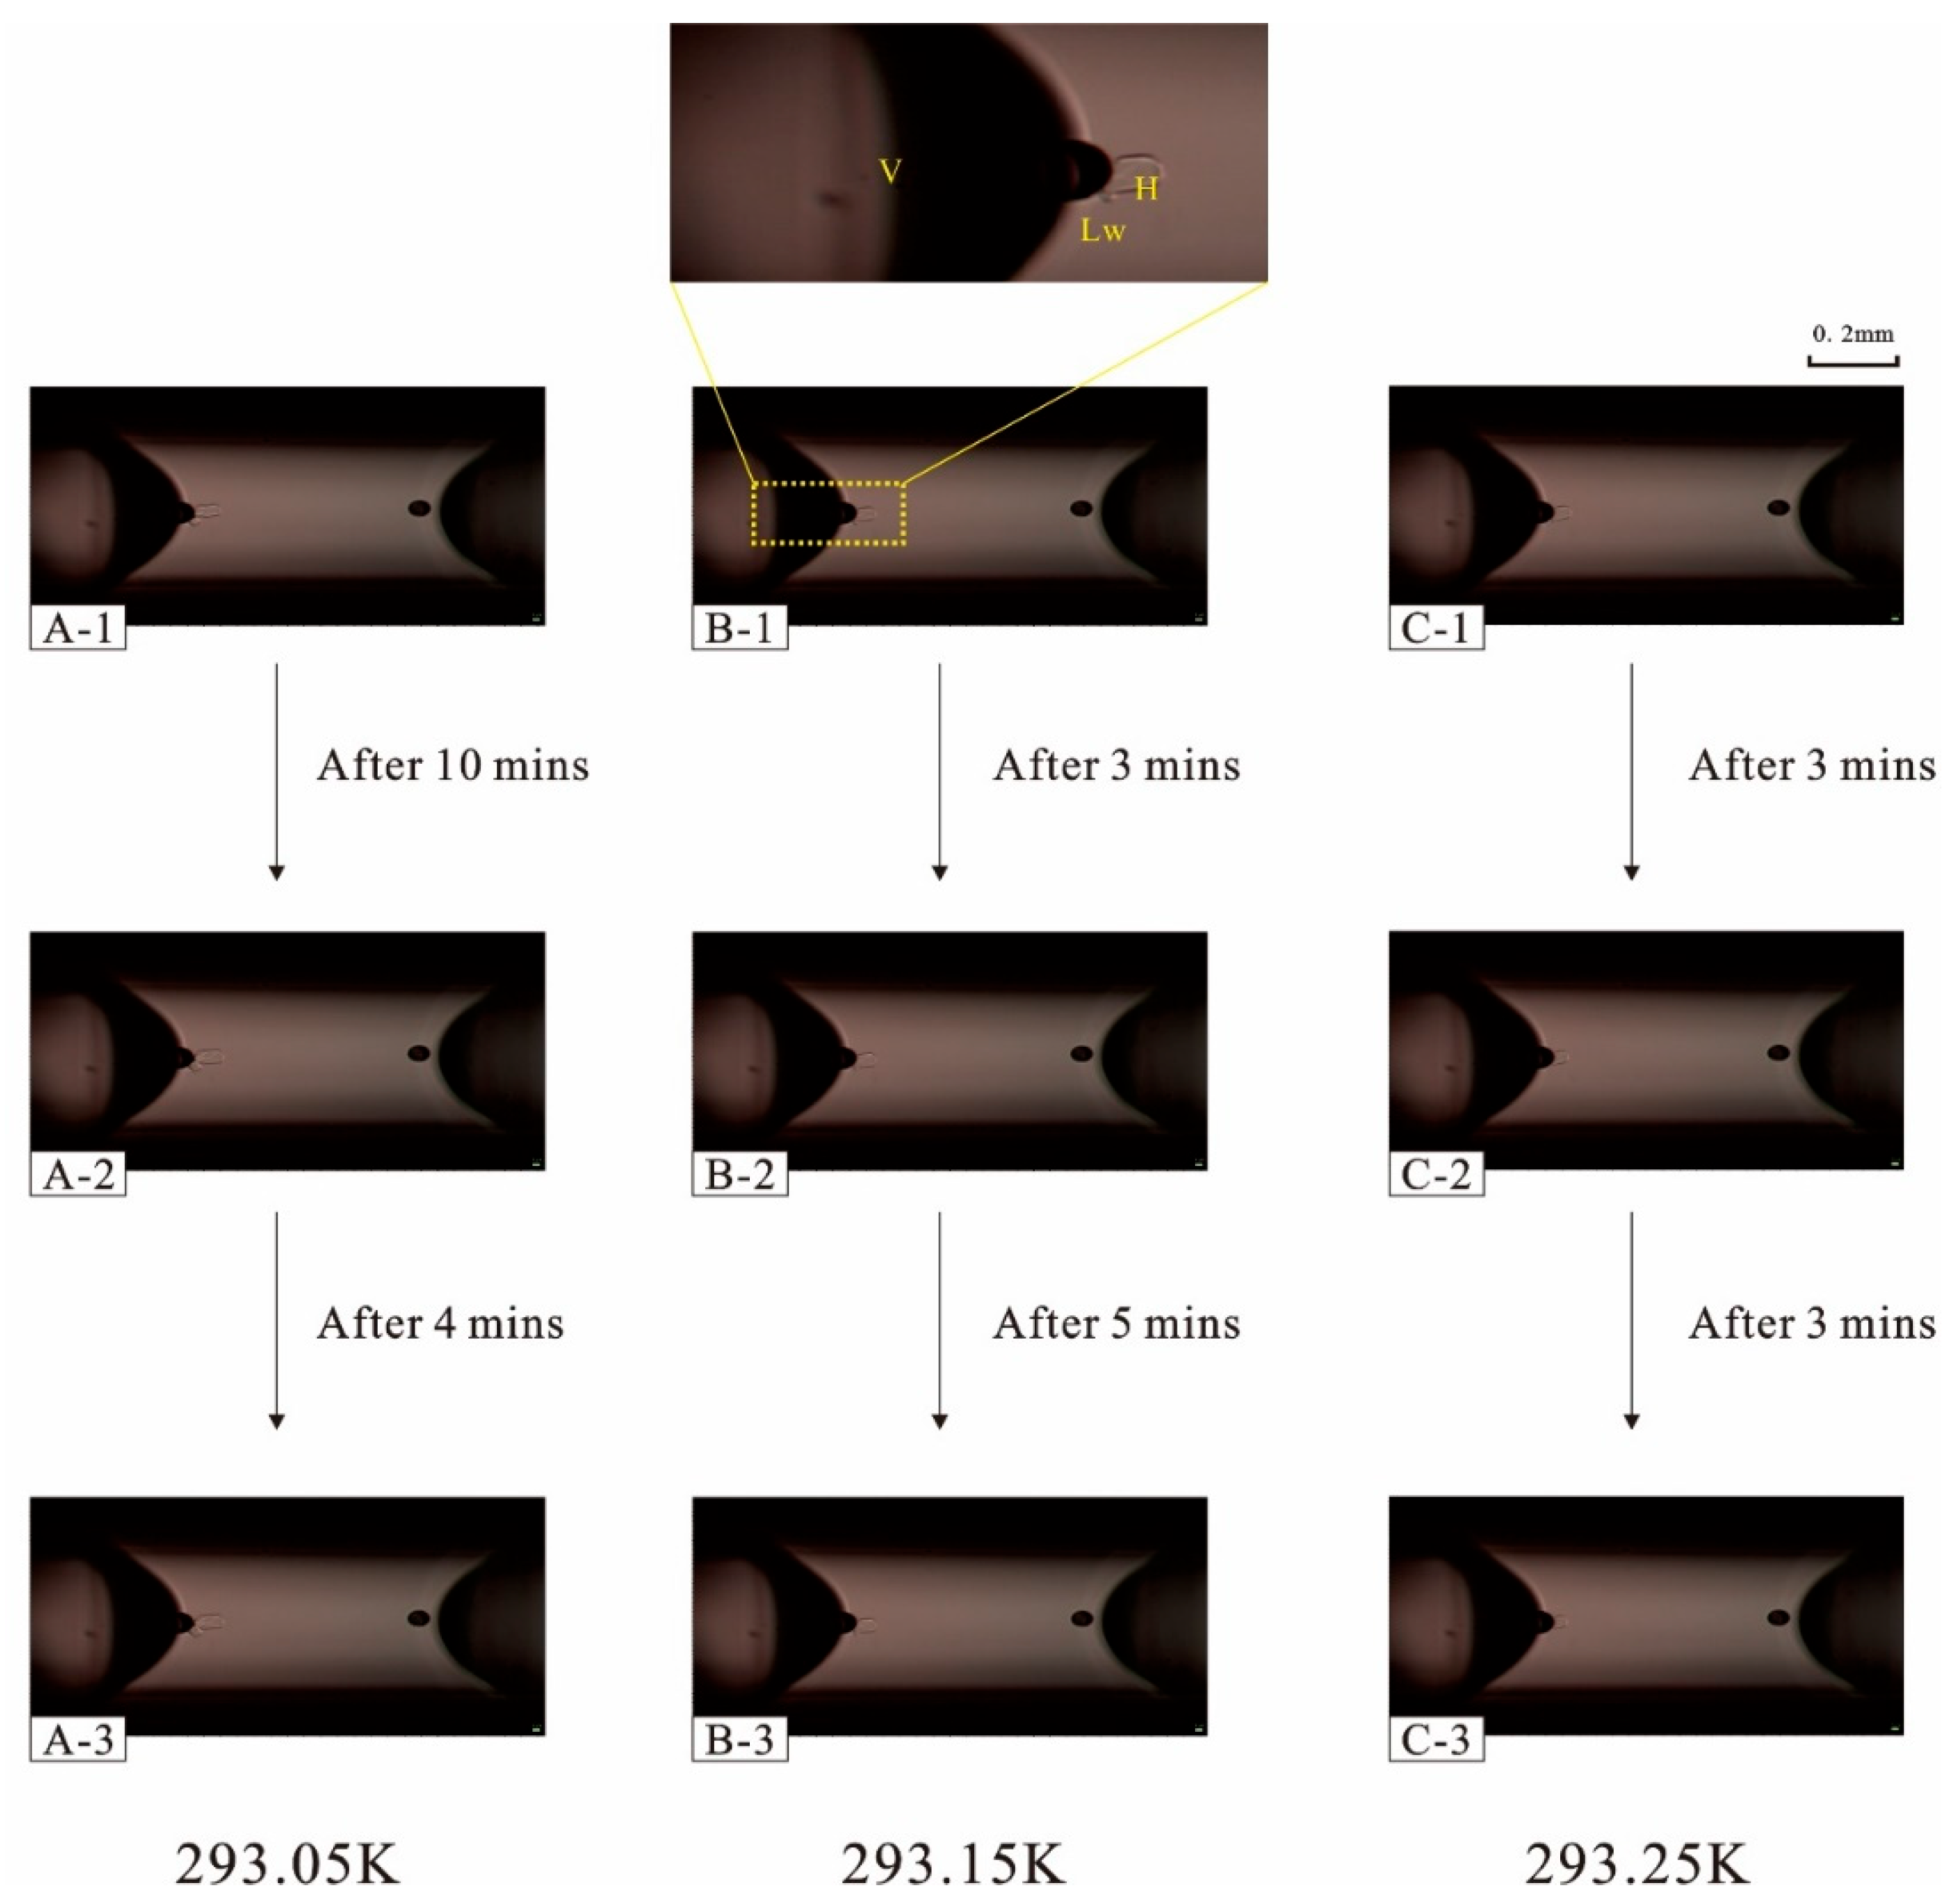
The experimental phase diagram (Figure 6) constrains the temperature-pressure dependence of hydrate stability for CH4-C2H6-H2O systems. Dissociation pressure increases nonlinearly with increasing temperature, consistent with the expected exponential-type response of hydrate equilibrium curves. In addition, the phase boundary shifts systematically with gas composition, reflecting the role of ethane in stabilizing hydrate phases relative to pure methane. These experimental constraints provide direct benchmarks for subsequent thermodynamic modeling and for interpreting compositional effects on hydrate stability.
Figure 6.
Experimentally observed phase diagram of the CH4-C2H6-H2O hydrate system, and the pressure required for hydrate stability increases exponentially with temperature. (A-1) Initial state of the capillary at 293.05 K before hydrate formation; (A-2) hydrate growth after 10 min at 293.05 K; (A-3) further hydrate development after an additional 4 min at 293.05 K. (B-1) Initial state of the capillary at 293.15 K, with the dashed box indicating the magnified observation region; (B-2) hydrate formation after 3 min at 293.15 K; (B-3) hydrate growth after an additional 5 min at 293.15 K. (C-1) Initial state of the capillary at 293.25 K; (C-2) hydrate formation after 3 min at 293.25 K; (C-3) hydrate morphology after an additional 3 min at 293.25 K. The scale bar corresponds to 0.2 mm.
3.1.3. Raman Spectral Signatures of sI/sII Coexistence and Guest Distribution
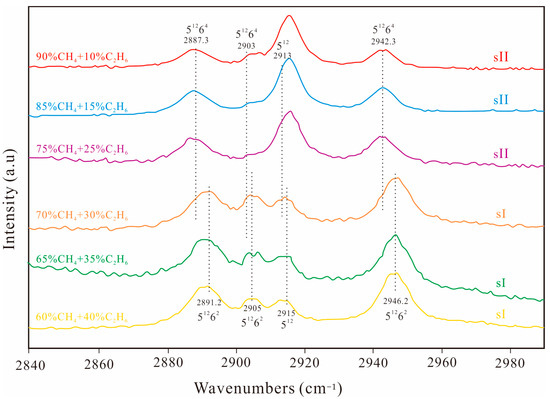
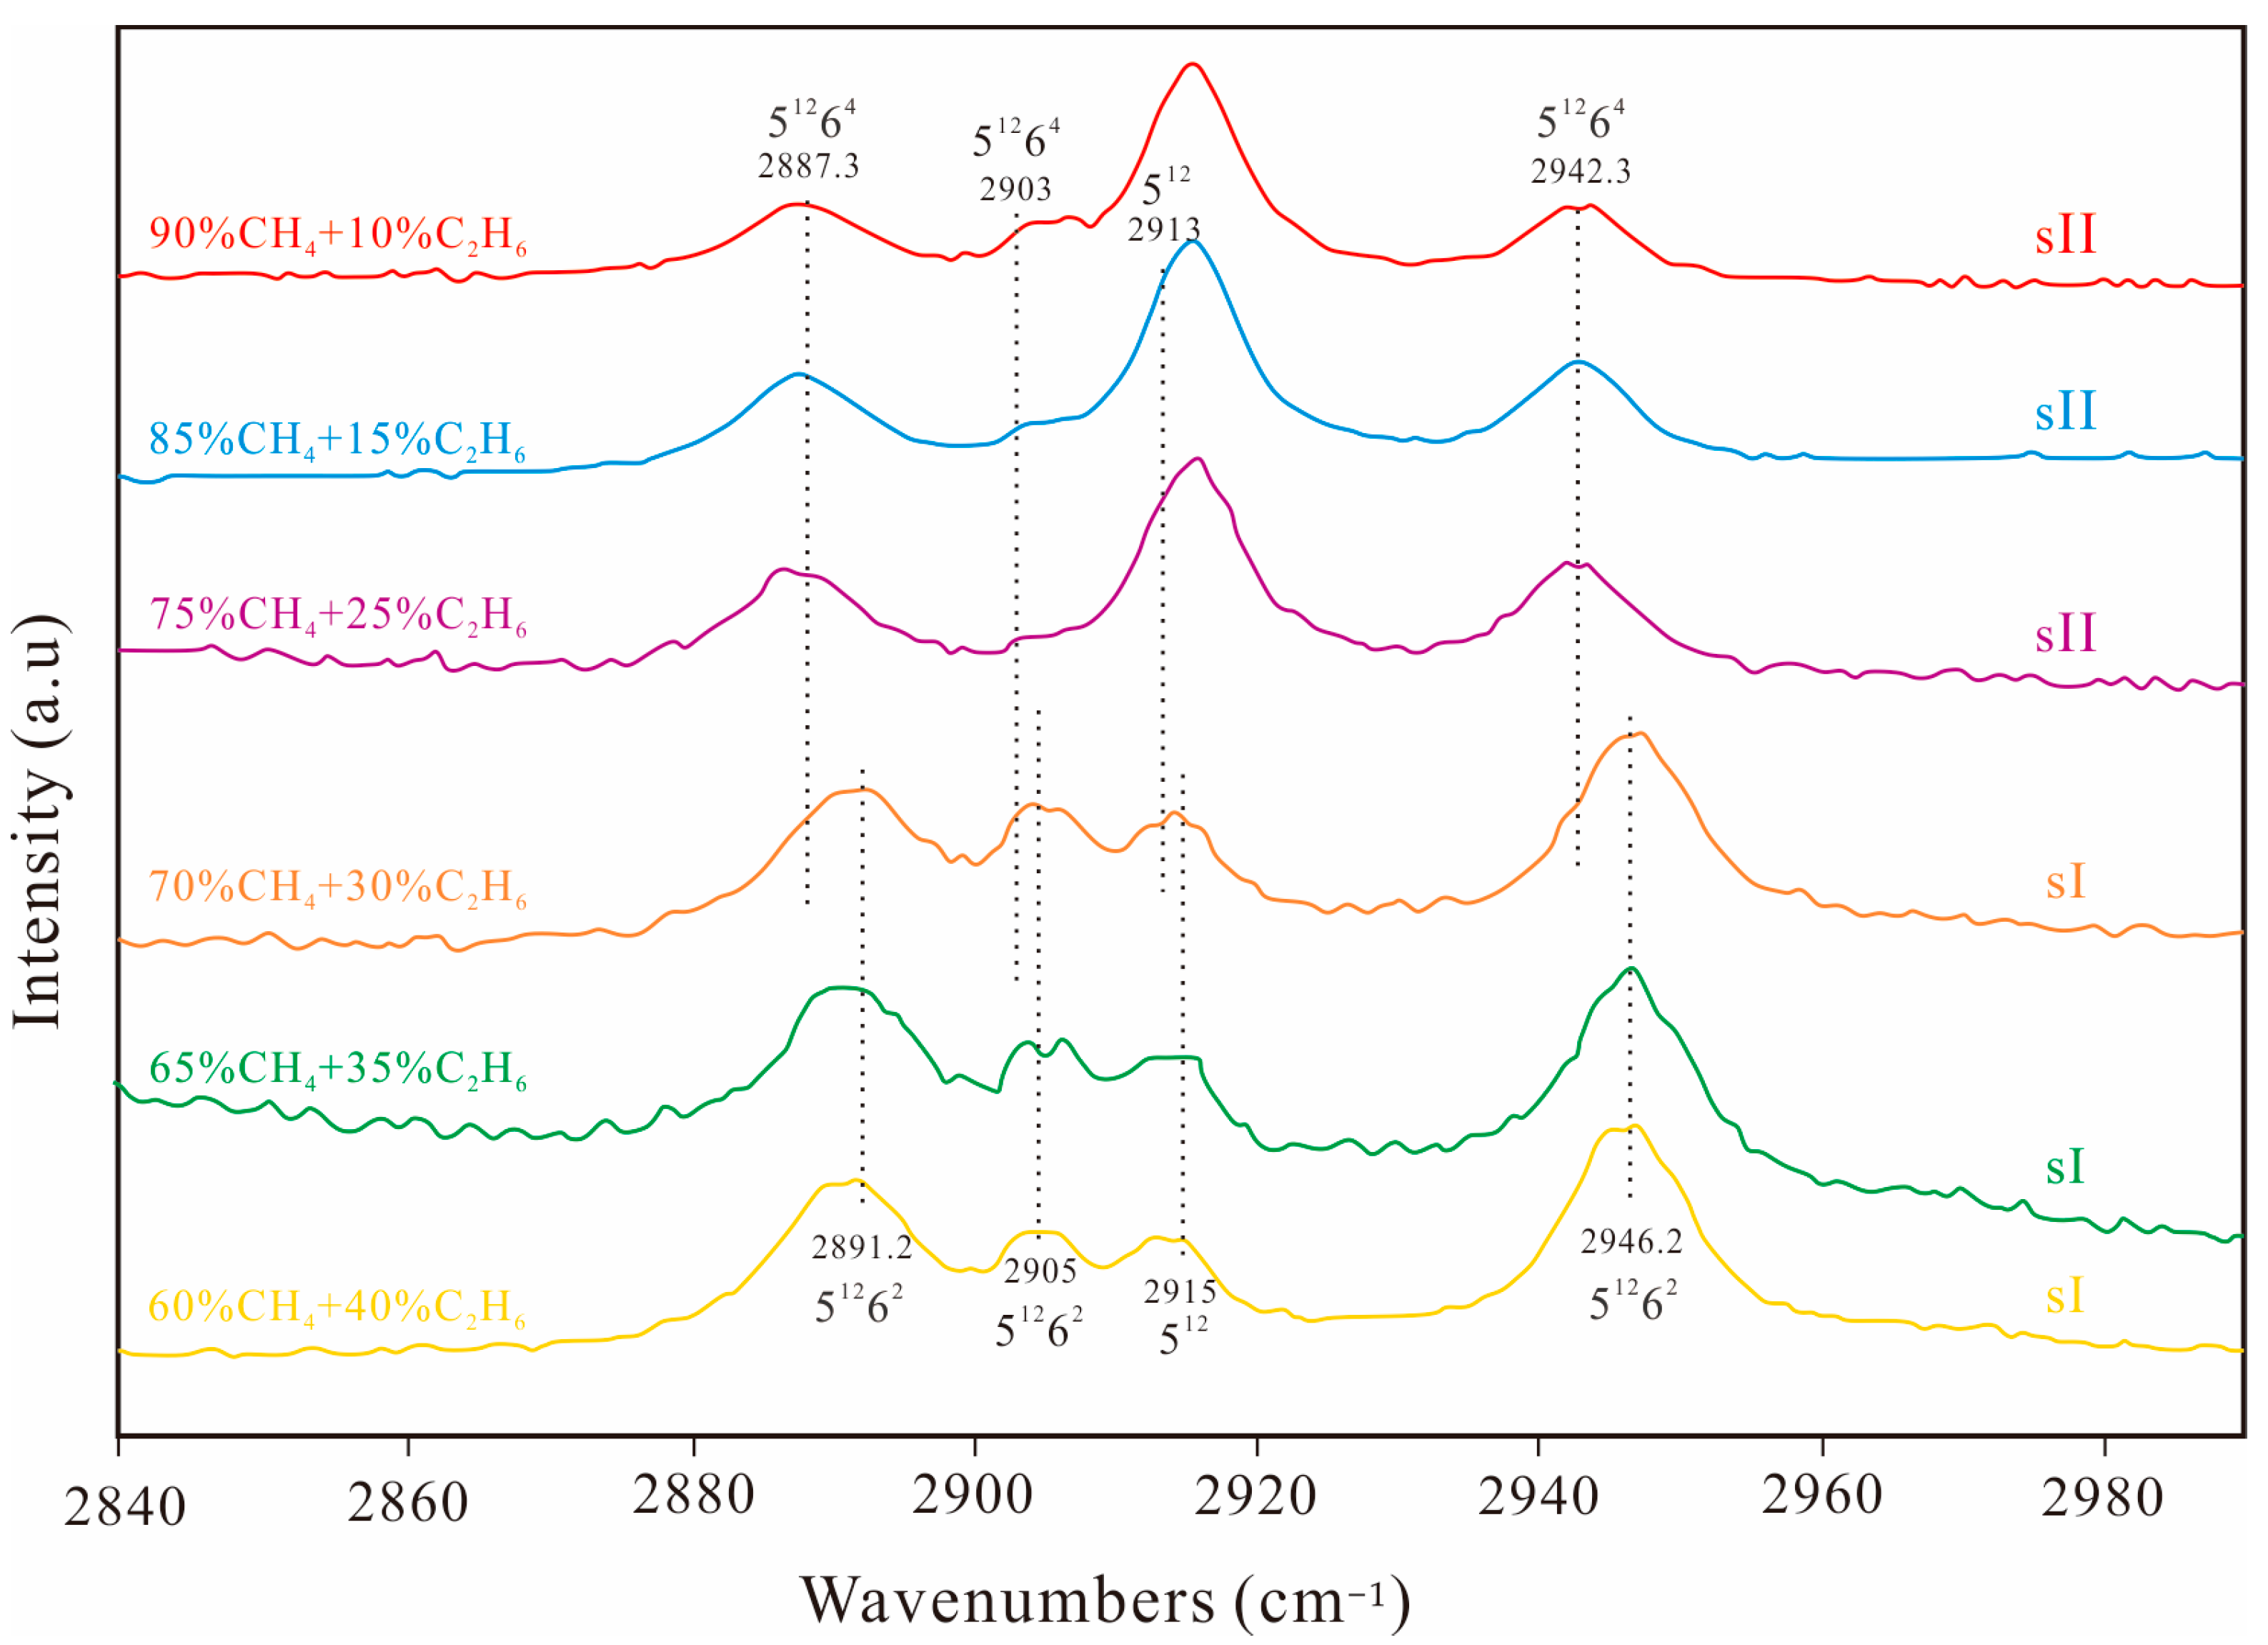
Characteristic peaks of CH4 and C2H6 are identified, indicating the coexistence of sI and sII hydrates depending on gas composition. The CH4 ν1 doublet at ~2905 cm−1 (large cage, 51262) and ~2915 cm−1 (small cage, 512) is observed for sI, whereas for sII the peaks shift to ~2903 cm−1 and ~2913 cm−1. C2H6 in sI shows bands at ~2891 cm−1 and ~2946 cm−1, while in sII, the bands appear at ~2887 cm−1 and ~2942 cm−1. The dotted lines indicate the characteristic peak positions for sI and sII hydrates.
Raman spectra of hydrates formed at different CH4/C2H6 ratios exhibit characteristic CH4 and C2H6 vibrational bands in the 2880~2960 cm−1 region (Figure 7). Methane symmetric stretching modes are observed near 2915 cm−1 (large cages) and 2917 cm−1 (small cages), whereas ethane bands occur at 2887 cm−1, 2891 cm−1, 2942 cm−1, and 2946 cm−1, indicating occupancy in different cage environments.
Figure 7.
Raman spectra of CH4-C2H6 hydrates formed at different gas compositions. Adapted from [16].
The spectra reveal composition-dependent hydrate structure. At relatively low ethane fractions (10~25%), spectral features consistent with sII hydrates are dominant (e.g., the 2942 cm−1 band). At higher ethane fractions (30~40%), additional bands associated with sI hydrates become apparent (including peaks near 2891 cm−1 and 2946 cm−1). These observations confirm that CH4-C2H6 systems can form both sI and sII hydrates, and that the relative contribution of each structure depends strongly on gas composition.
3.1.4. Peak Fitting and Temperature-Dependent Cage Partitioning
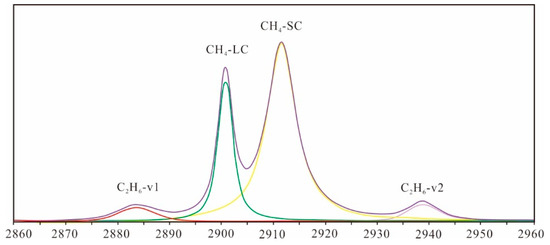
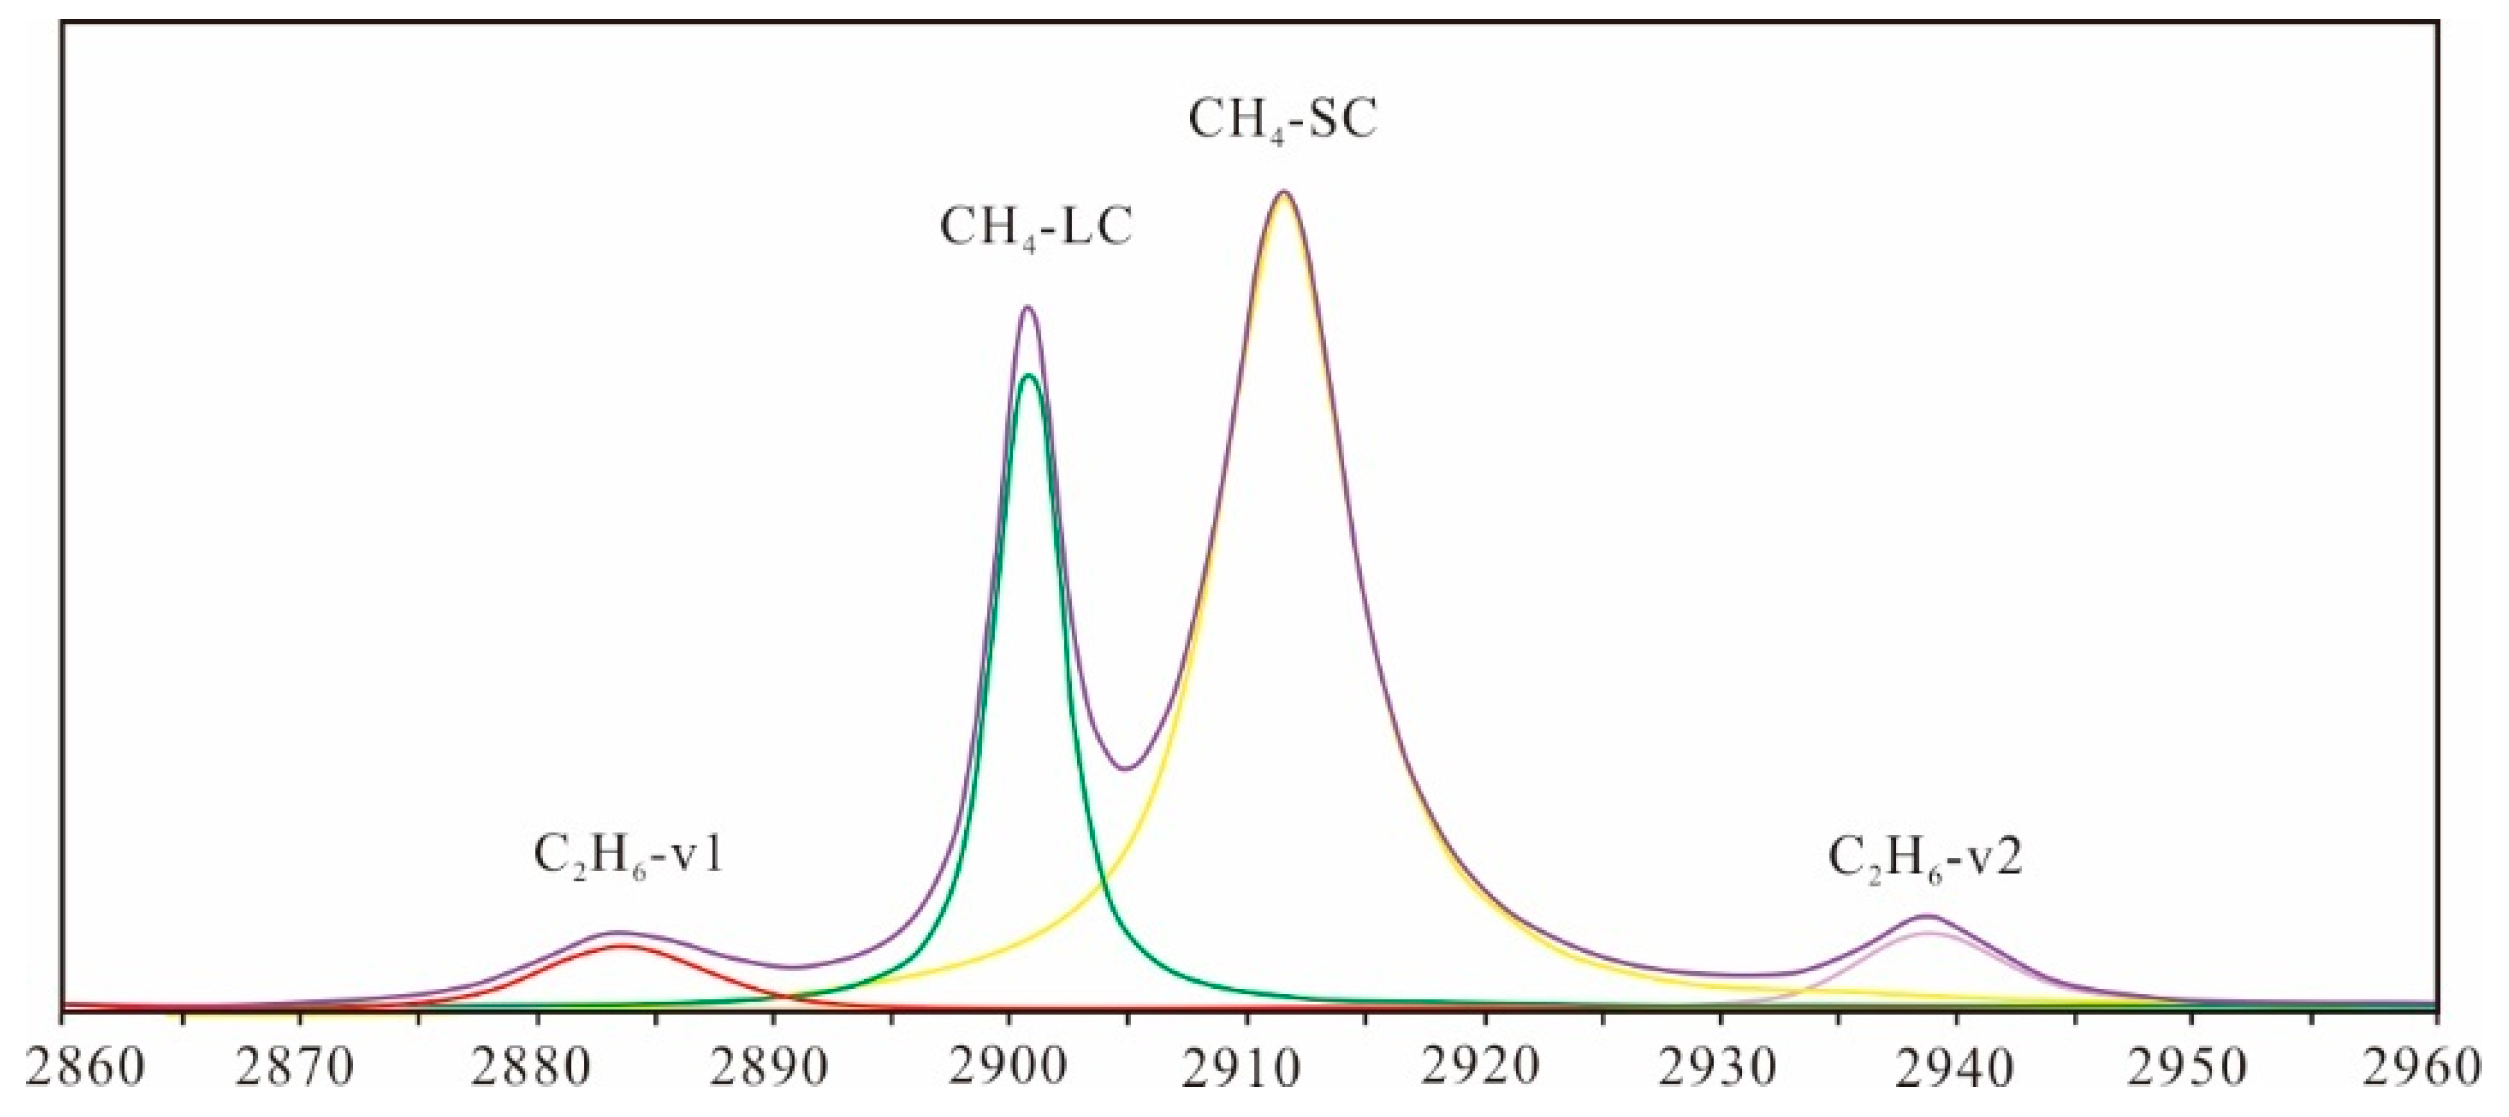
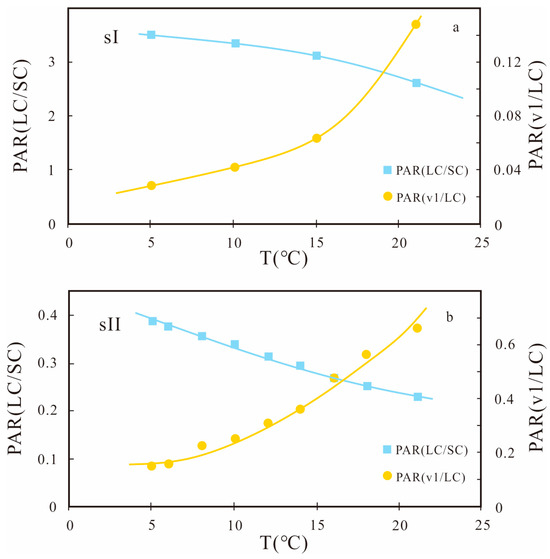
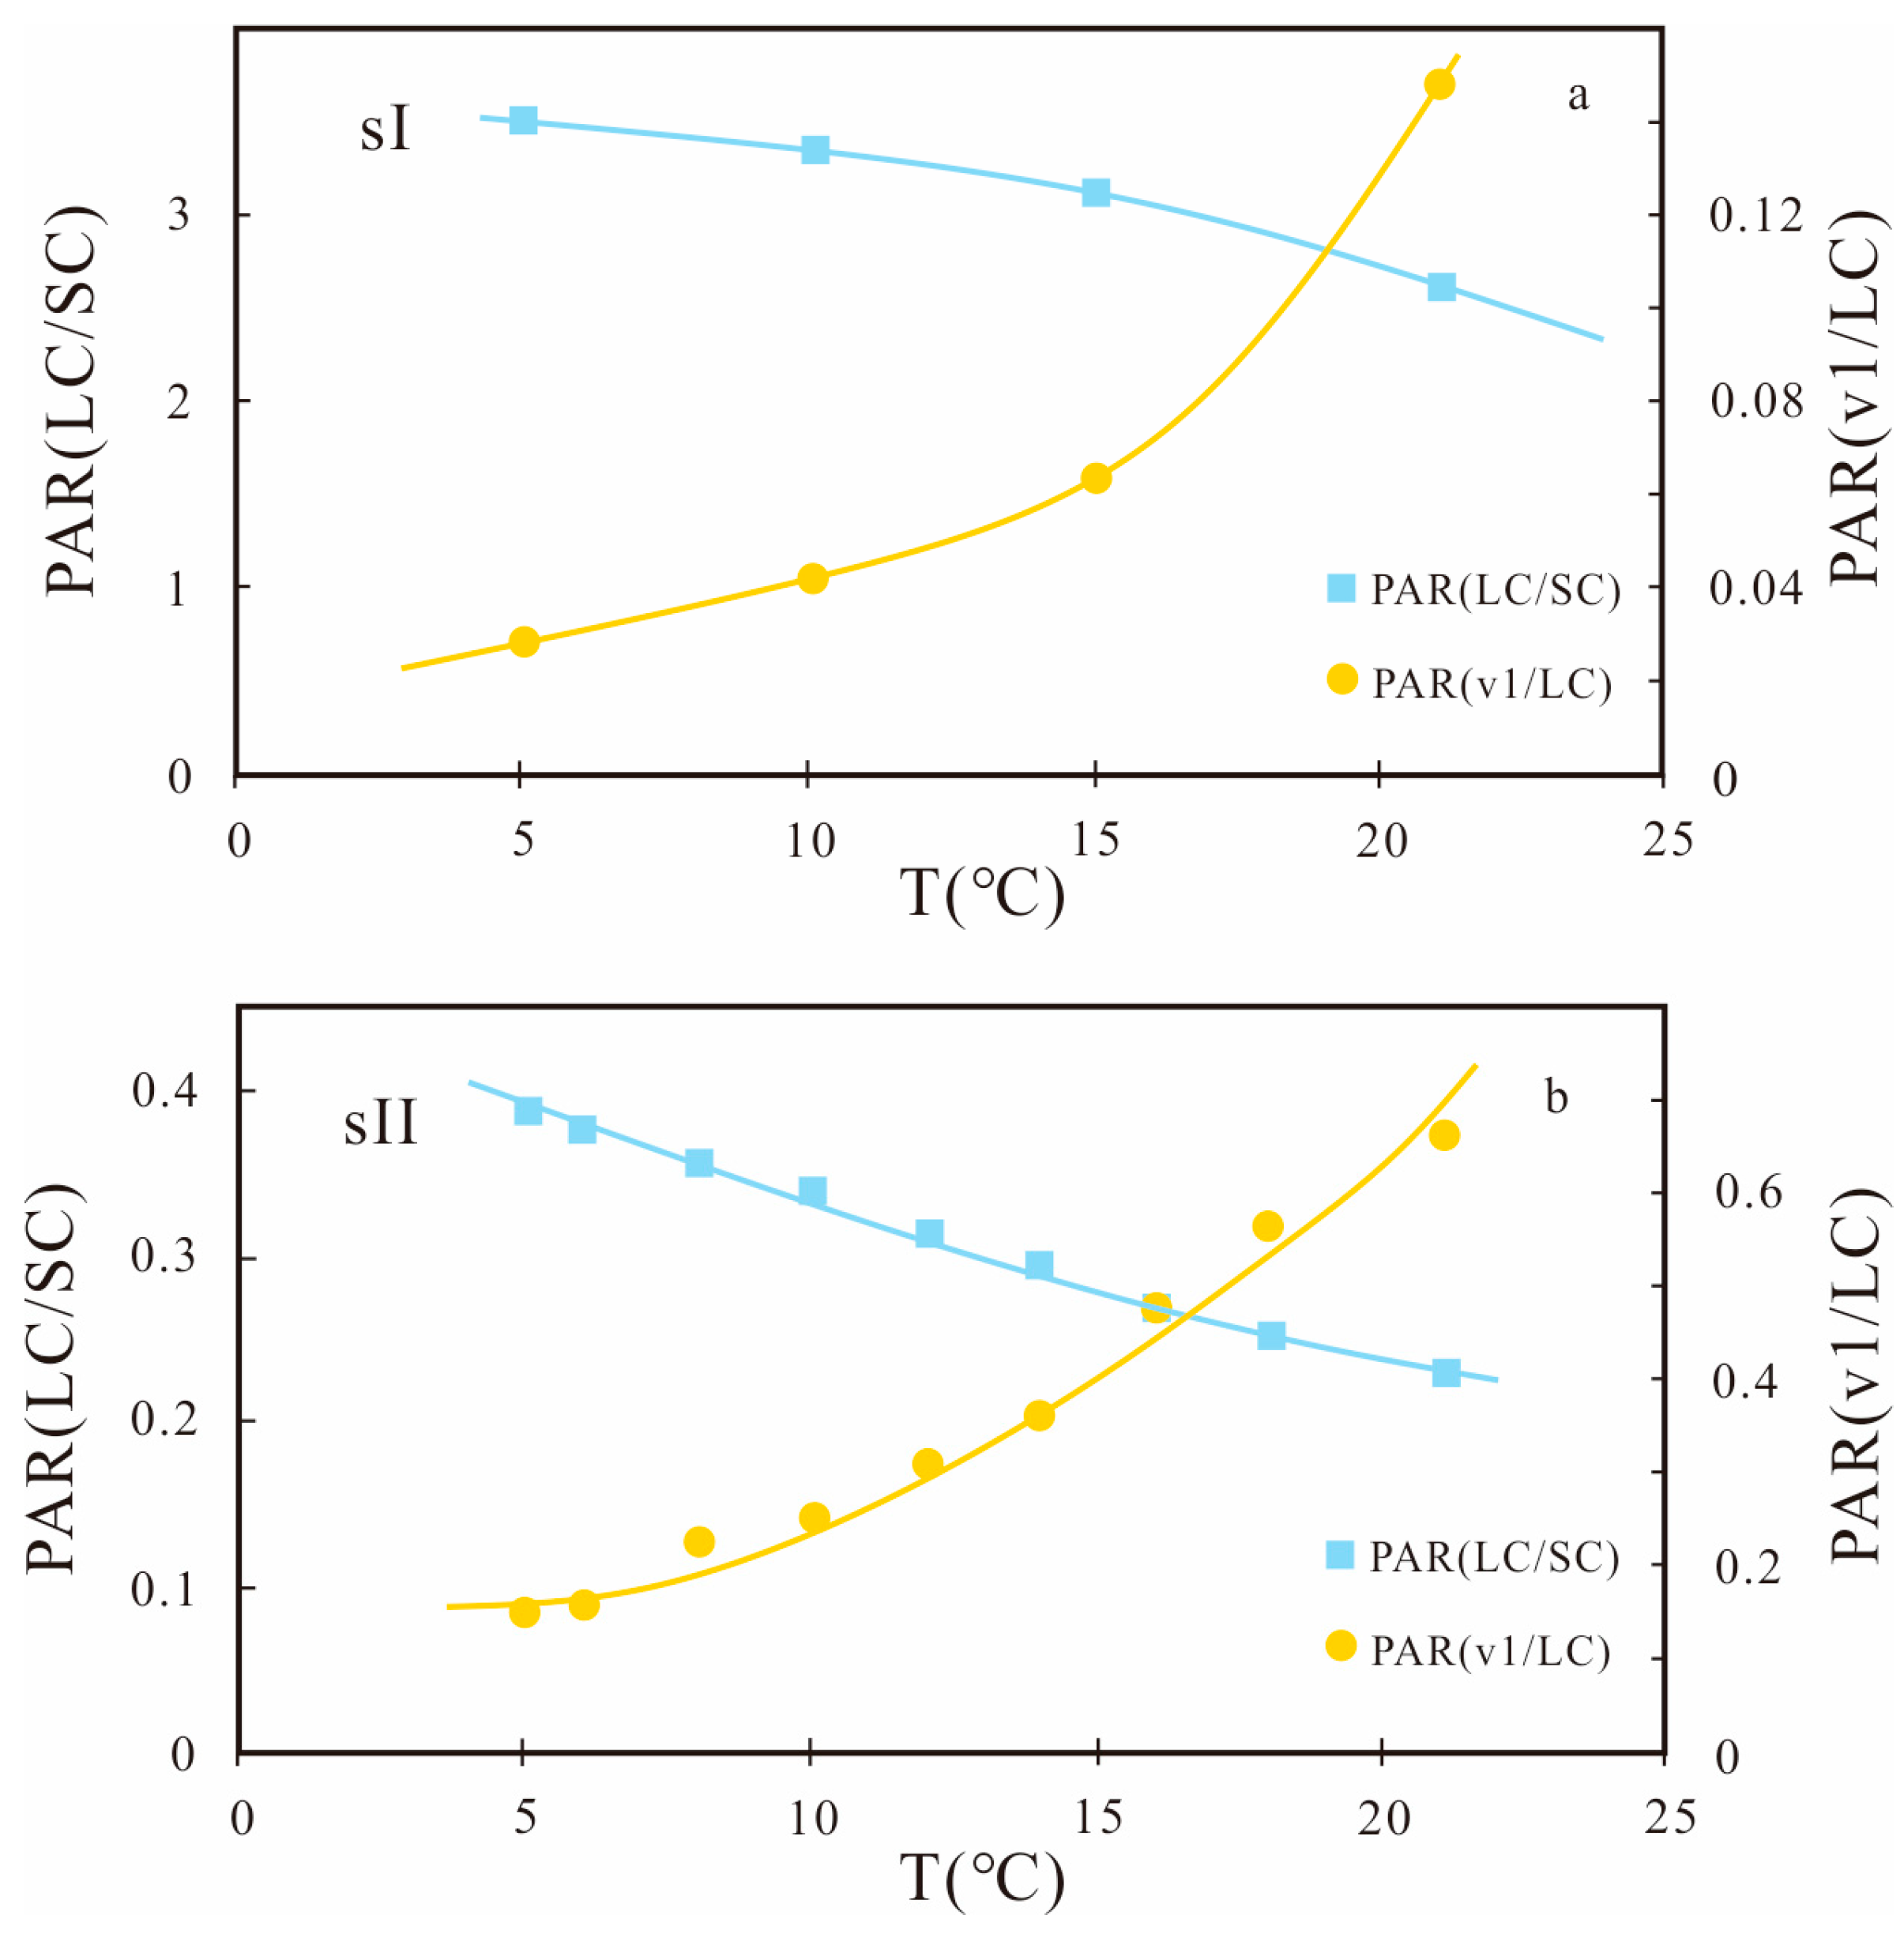
Peak fitting (Figure 8) enables quantitative separation of overlapping Raman contributions from CH4 and C2H6 and supports estimation of relative guest occupancy in large and small cages. In sII hydrates, ethane is expected to preferentially occupy large cages due to its larger molecular size, whereas methane can occupy both cage types. The peak-area ratio approach (Figure 9) indicates systematic temperature-dependent changes in guest partitioning: methane occupancy in large cages decreases with increasing temperature, while ethane-associated signals increase, consistent with progressive ethane enrichment in large cages during formation and/or re-equilibration. The C1/C2 ratio trends toward the gas-phase composition as temperature increases, indicating compositional differentiation and affinity effects during guest capture.
Figure 8.
Spectra after peak fitting processing. The purple line represents the experimental spectrum, the orange line is the overall fitted curve, and the colored lines (green/yellow/red/…) correspond to the deconvoluted peak components assigned to CH4−LC, CH4−SC, and C2H6 (v1, v2), respectively.
Figure 9.
Temperature-dependent variation of C1 and C2 composition in large and small cages, derived from the peak area ratio of gas to structural water in the spectra. (a) sI hydrate; (b) sII hydrate.
3.2. Thermodynamic Phase Equilibrium and Compositional Fractionation
Thermodynamic calculations based on the calibrated vdW-P framework were used to evaluate three-phase equilibrium boundaries and phase-component distributions for representative CH4-C2H6 mixtures (90% CH4 + 10% C2H6 and 99% CH4 + 1% C2H6) under pure-water conditions. The model reproduces the experimentally constrained equilibrium trend and provides a consistent description of compositional effects on stability.
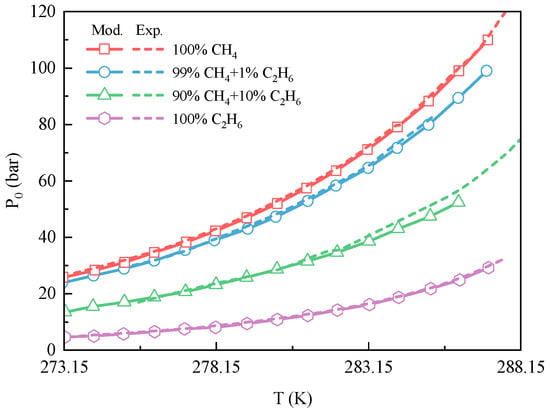
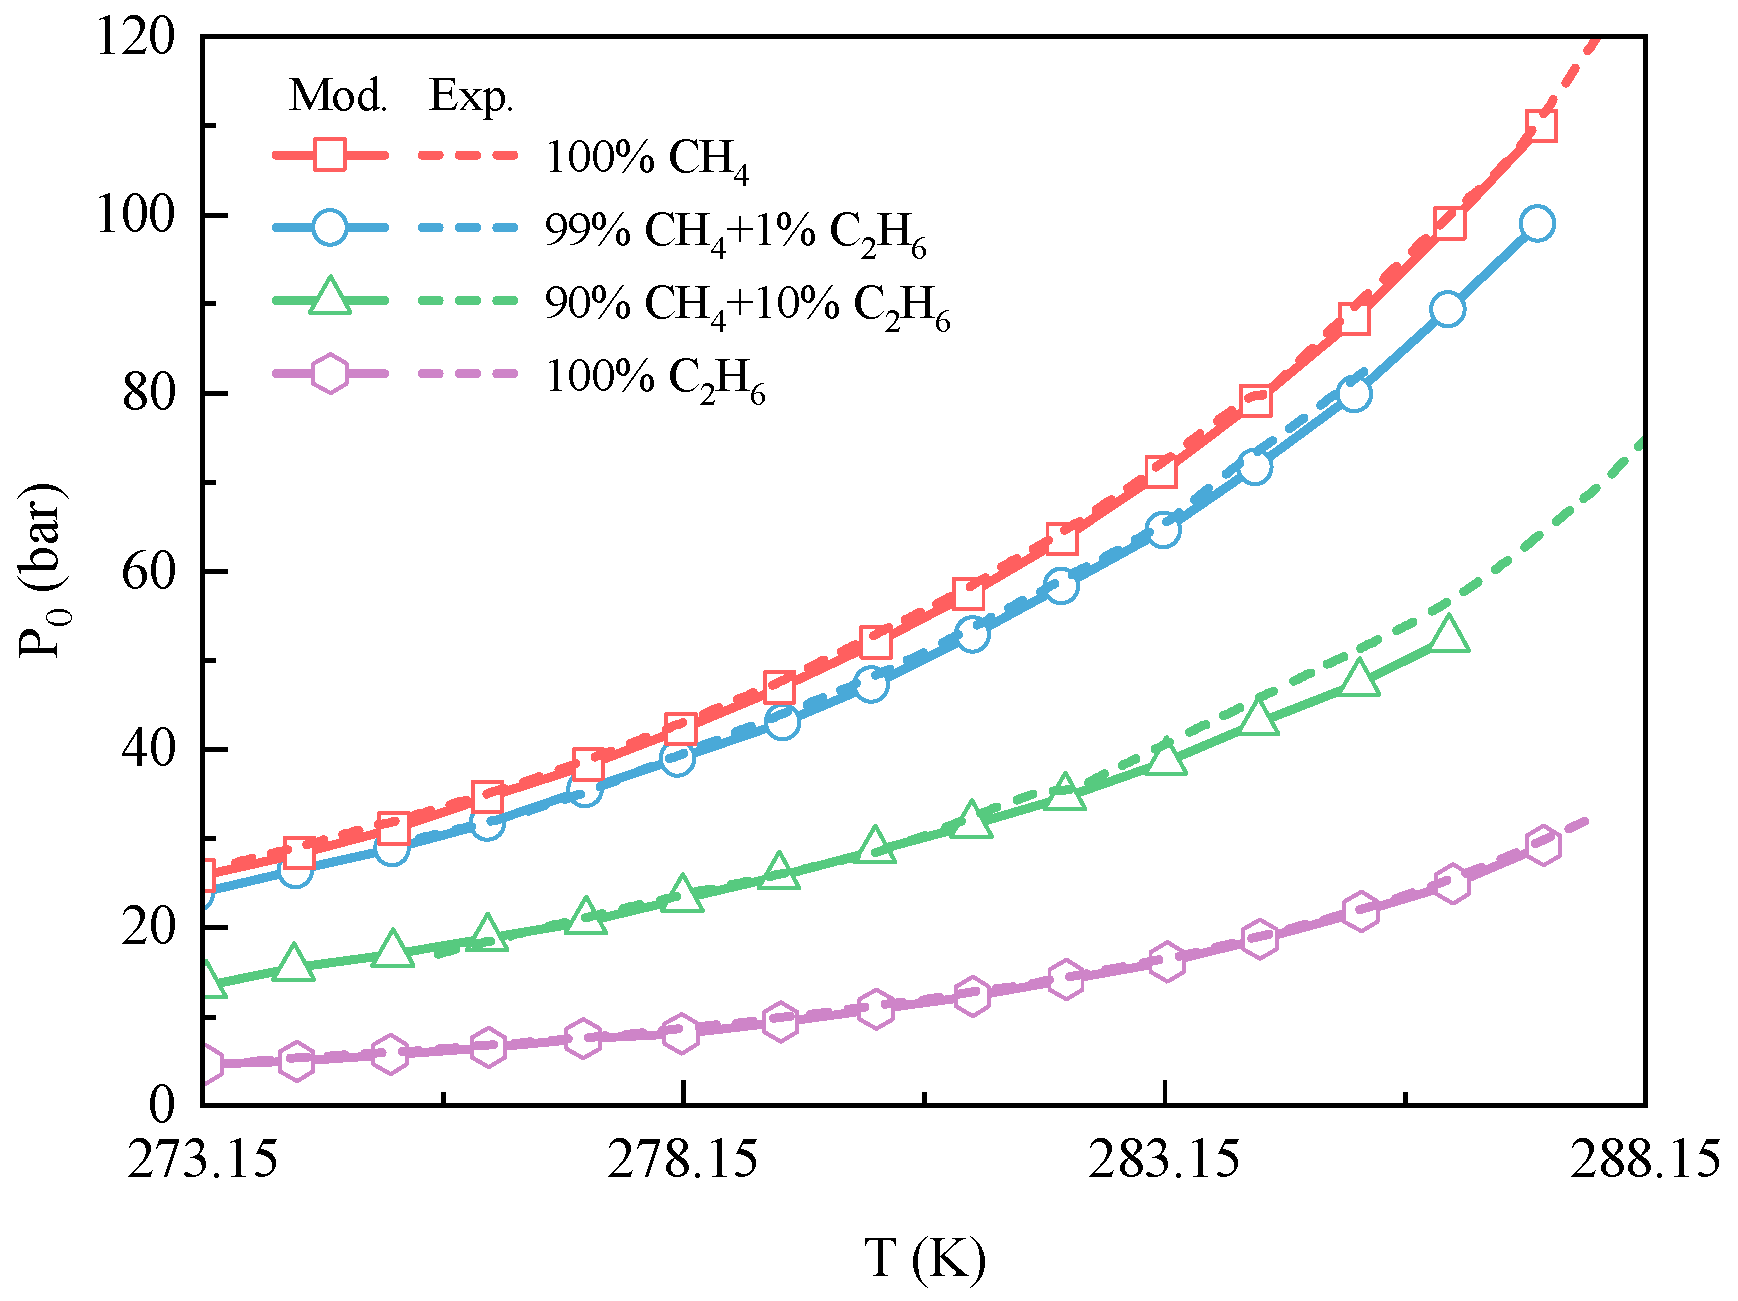
Figure 10 compares experimental equilibrium points with modeled three-phase boundaries. Relative to pure CH4 hydrates, ethane-bearing systems exhibit equilibrium curves shifted toward lower pressures at a given temperature, indicating enhanced stability. The magnitude of the shift depends on the ethane fraction, consistent with the preferential incorporation of ethane into hydrate cages and the associated stabilization of sII hydrates.
Figure 10.
Three-phase equilibrium curves of multicomponent gas hydrate, showing the comparison of experimental formation pressures (exp.) and model predictions (mod.) as a function of temperature for different gas compositions (CH4/C2H6). The experimental data (exp.) are represented by solid symbols, while the model predictions (mod.) are shown by open symbols.
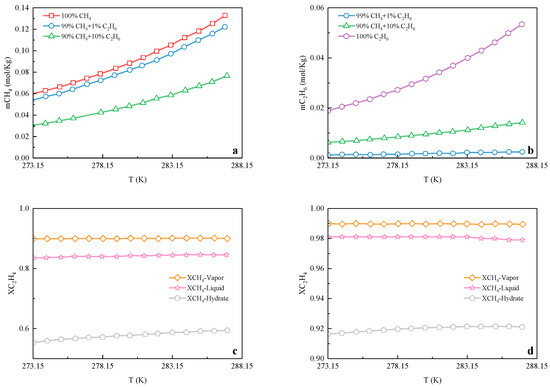
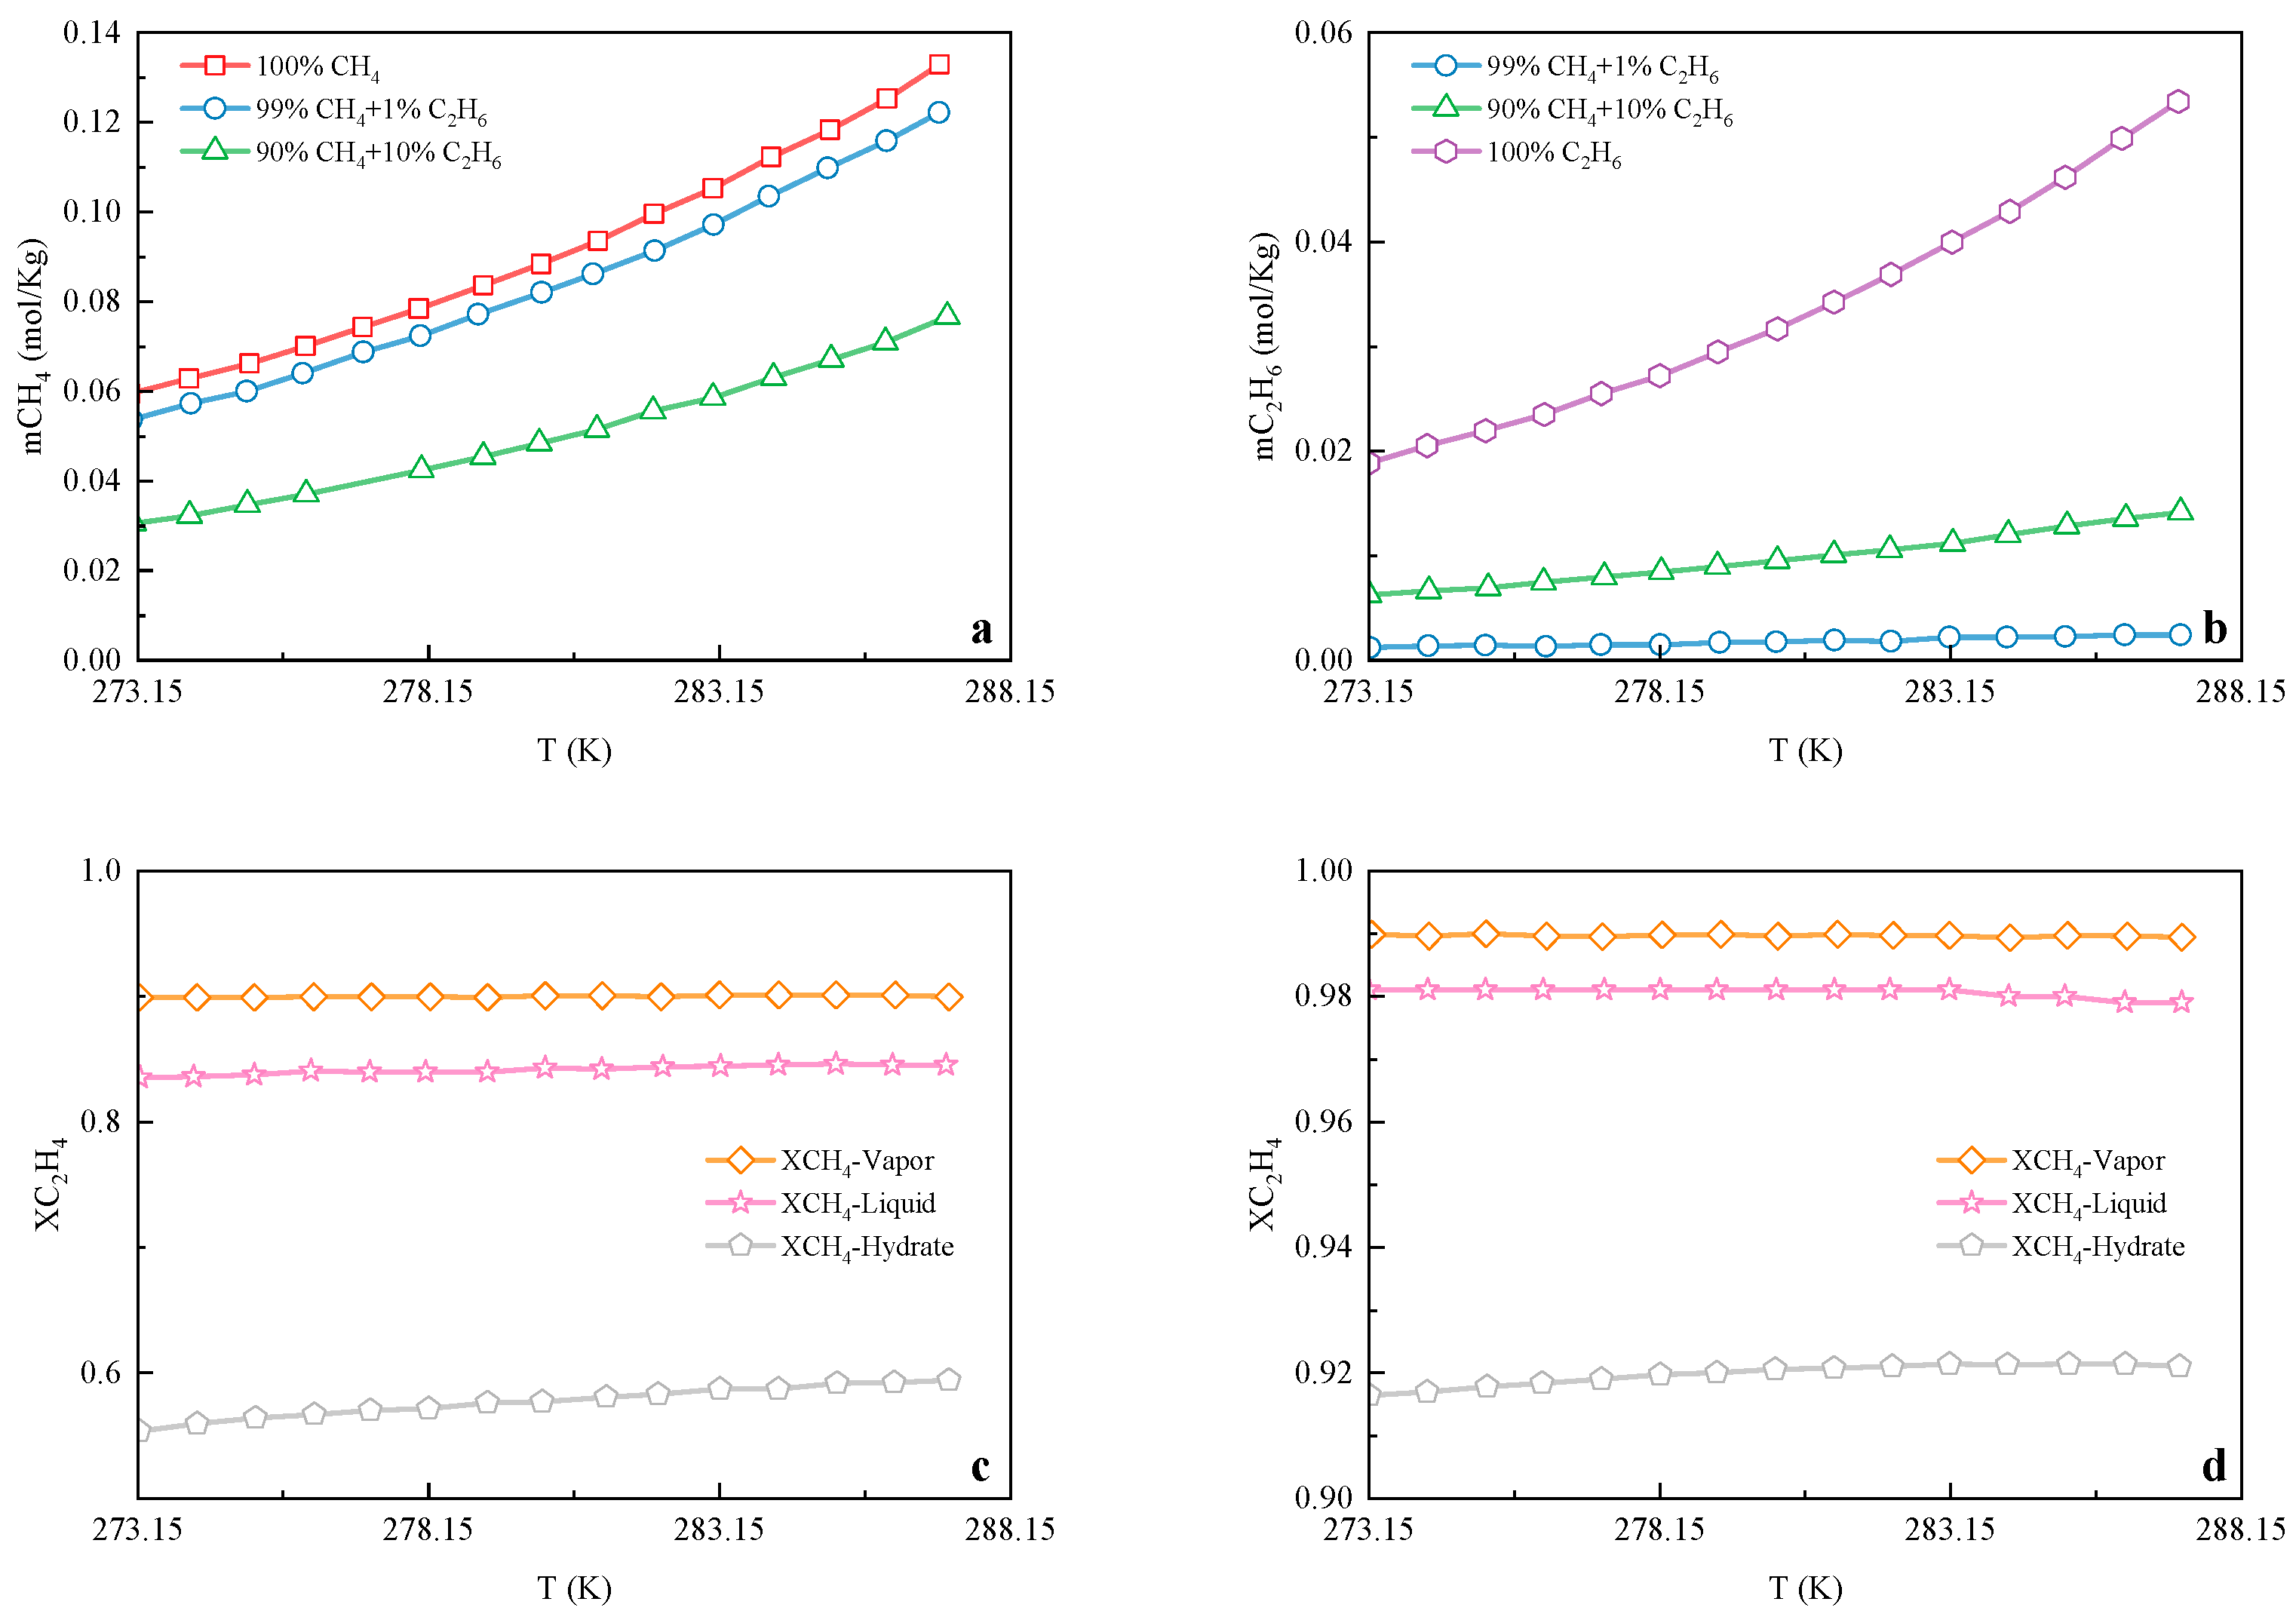
Phase-component distributions (Figure 11) further demonstrate compositional differentiation across coexisting phases. Under three-phase equilibrium, the hydrate phase is enriched in C2H6 relative to the coexisting free-gas phase, whereas the gas phase remains relatively CH4-rich. This differentiation is observed in both the 90/10 and 99/1 mixture scenarios. Notably, even when ethane is present at only 1 mol%, the hydrate-phase methane fraction remains measurably lower than the gas-phase methane fraction (Figure 11d), indicating that trace ethane can still influence cage occupancy and stability. These phase-partitioning patterns provide a thermodynamic basis for interpreting hydrate-free gas coexistence beneath the BSR in ethane-bearing natural systems.
Figure 11.
(a) CH4 content in the liquid phase under three-phase equilibrium conditions; (b) C2H6 content in the liquid phase under three-phase equilibrium conditions; (c) mole fraction of CH4 in the gas, liquid, and hydrate phases of a 90% CH4 + 10% C2H6 mixed gas system; (d) mole fraction of CH4 in the gas, liquid, and hydrate phases of a 99% CH4 + 1% C2H6 mixed gas system.
3.3. Site-Scale GHSZ Predictions: Uncertainty, Sensitivity, and Intermediate Validation
To evaluate the robustness of site-scale GHSZ predictions, uncertainties in boundary conditions (water depth, seafloor temperature, geothermal gradient, and ethane fraction) were propagated into confidence intervals for BGHSZ depth at SC-01, SC-02, W18, W19, and W17 (Table 3).
Before extending the framework to regional mapping, model-predicted I-BGHSZ depths were compared with logging-constrained BGHSZ observations at multiple Shenhu sites (Table 3). The close agreement provides an intermediate-scale validation linking laboratory-scale equilibrium constraints (Section 3.1 and Section 3.2) to field-scale stability predictions, supporting subsequent application to site and regional scenarios.
For the Shenhu sites listed in Table 3, predicted I-BGHSZ depths fall within 172–177 mbsf, while inclusion of trace ethane extends stability to II-BGHSZ depths of 192–199 mbsf. At W17, the boundary conditions yield a modeled GHSZ thickness of 300 mbsf.
Uncertainty analysis based on first-order error propagation under a linear geothermal profile indicates that BGHSZ uncertainty is dominated by geothermal-gradient uncertainty, with seafloor-temperature uncertainty contributing a smaller fraction. Sensitivity coefficients consistently rank geothermal gradient as the primary uncertainty driver, while ethane fraction chiefly controls the separation between I-BGHSZ and II-BGHSZ and therefore the magnitude of the predicted hydrate-free gas coexistence interval beneath the BSR.
3.4. Application to Site W17: Predicted Vertical Zoning Beneath the BSR
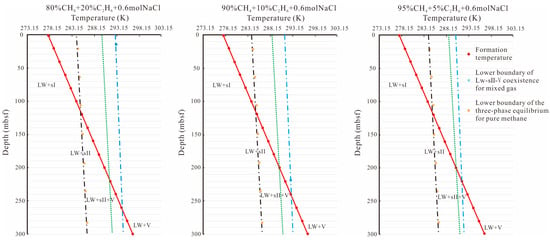
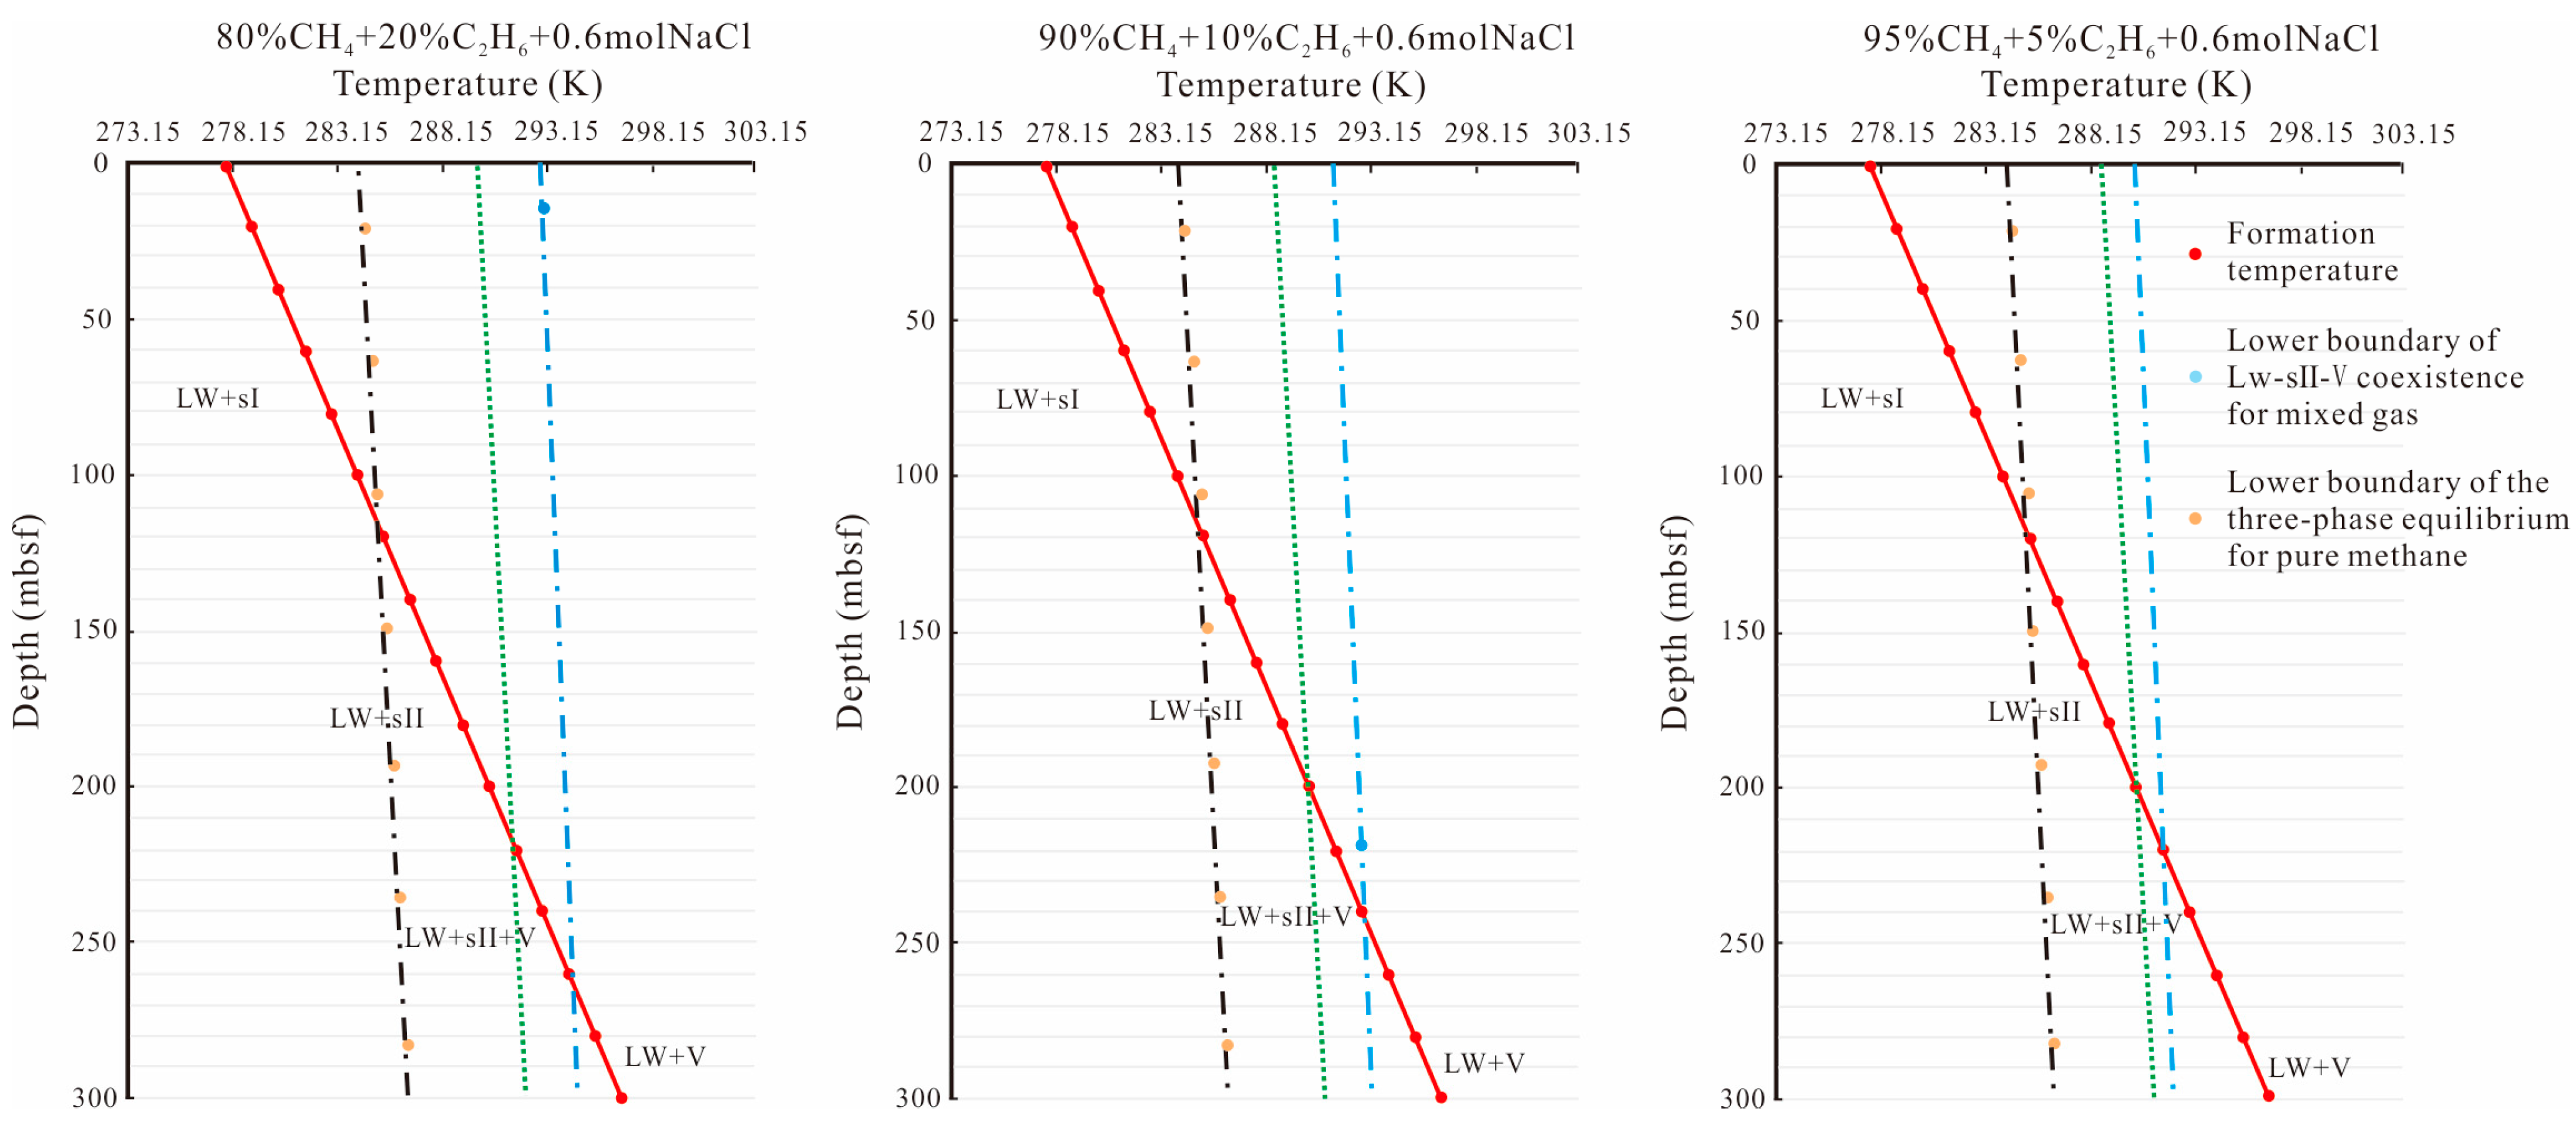
At Site W17, the modeled geothermal profile and the composition-dependent equilibrium boundaries were used to predict the vertical extent of hydrate stability and the relative positions of methane-only and ethane-bearing stability bases. Figure 12 summarizes the predicted vertical distribution of hydrate stability boundaries under different gas composition assumptions and hydrate structures.
Figure 12.
Predicted vertical distribution of multicomponent gas hydrates with varying compositions and hydrate types in site W17.
Under the pure CH4 assumption, the stability base corresponds to the conventional methane BGHSZ boundary commonly associated with BSR-based exploration targets. When ethane-bearing compositions are considered, the predicted stability base shifts downward, producing a deeper stability interval consistent with sII hydrate conditions. This composition-dependent deepening generates an expanded stability zone beneath the methane-only boundary, indicating an expanded stability interval below the methane-only boundary at W17.
3.5. Regional Prediction of GHSZ Thickness in the Northern South China Sea
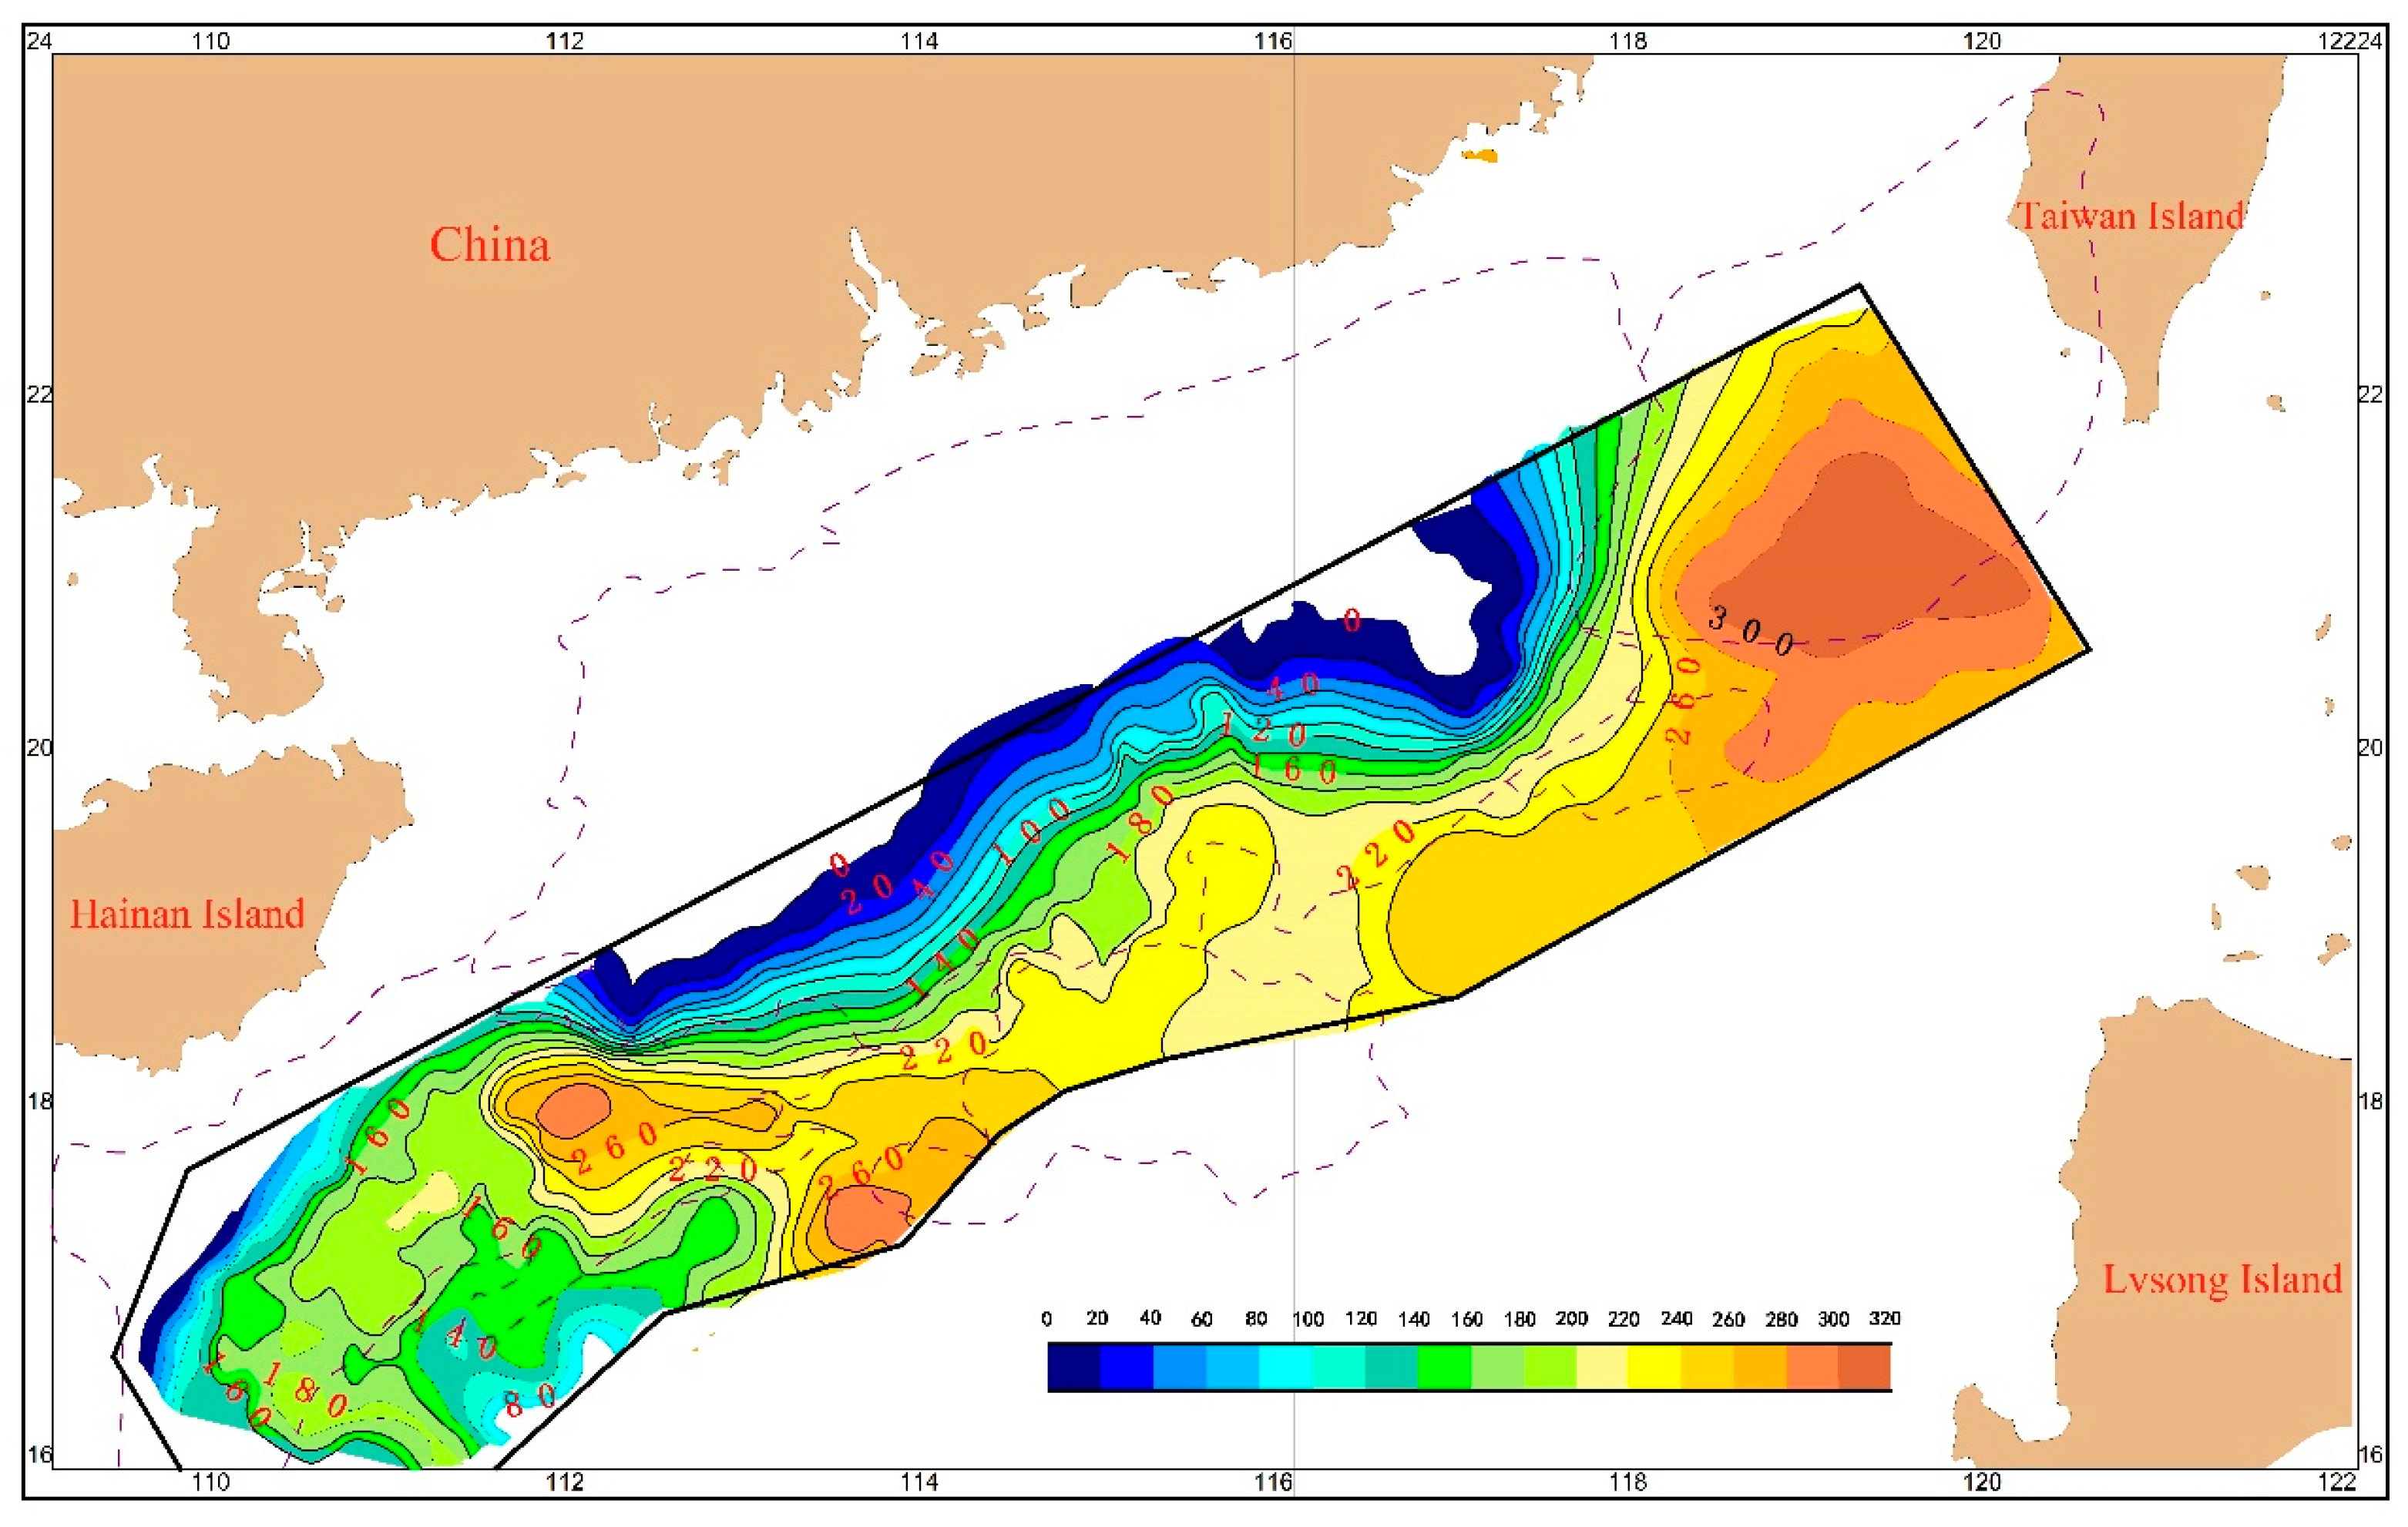
Using regional boundary conditions (water depth, seafloor temperature, geothermal gradient) together with representative gas composition scenarios, the validated model framework was applied to map spatial variations in GHSZ thickness across the northern South China Sea (Figure 13).
Figure 13.
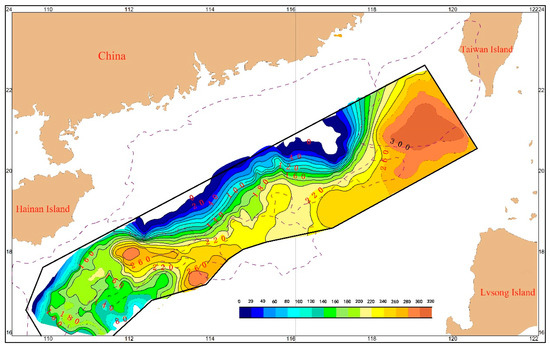
Isopach map of the GHSZ thickness in the northern South China Sea.
The isopach map shows pronounced spatial heterogeneity in predicted GHSZ thickness. Thicker stability zones (>280 m) are concentrated in deeper-water areas characterized by relatively low geothermal gradients, whereas thinner zones occur in regions with higher thermal gradients and/or shallower water depths. These regional results provide a first-order basis for evaluating spatial variability in hydrate stability extent and for assessing the potential bias introduced by methane-only assumptions in multicomponent hydrate provinces.
4. Discussion
4.1. Field Significance of sII Hydrate and Hydrate-Free Gas Coexistence Beneath the BSR
Field observations from the northern South China Sea indicate that hydrate occurrence and stability cannot always be explained by pure methane assumptions. Geochemical analyses from GMGS-1 show methane-dominated compositions with trace heavier hydrocarbons, and subsequent GMGS-3 and GMGS-4 drilling further report CH4-rich gases containing minor C2H6 and other components [34,35,36,37]. These observations motivate explicit evaluation of multicomponent effects on hydrate stability at both site and regional scales.
Seismic interpretations commonly treat BSR depth as a proxy for the base of methane hydrate stability; however, in several settings, the observed BSR depth is deeper than predictions from pure methane models. Published work [38] has shown that adopting a trace-ethane scenario (e.g., 99% CH4 + 1% C2H6) can improve consistency between predicted BGHSZ and BSR depth, supporting the possibility of sI-sII coexistence and compositional control on stability geometry. Logging and Raman evidence also support the presence of both hydrate structures in the Shenhu Area, including sII hydrate layers interbedded with free gas beneath the BSR at certain sites.
In this study, the laboratory-scale experimental constraints (Raman-derived cage occupancy trends and phase equilibrium behavior) and the calibrated vdW-P model provide a mechanism-based explanation for these field observations: ethane preferentially occupying large cages stabilizes sII hydrates and shifts equilibrium boundaries, creating conditions under which hydrate stability can extend beneath methane-only BGHSZ predictions. Importantly, the intermediate-scale agreement between model-predicted I-BGHSZ depths and logging-constrained observations across multiple Shenhu sites (Table 3) supports the credibility of extending composition-sensitive stability modeling to field interpretation and regional assessment.
Consistent with the Raman-inferred cage partitioning and the composition-dependent phase-equilibrium shifts, the DFT energetic comparisons (Table 4) indicate systematic differences in guest-cage stabilization between CH4 and C2H6 bearing configurations. In particular, the relative energetic tendencies support preferential stabilization associated with ethane-bearing large-cage environments, providing a molecular-level rationale for the enhanced stability of sII hydrates in ethane-bearing systems.
4.2. Controls on GHSZ Thickness and Composition-Dependent Stability
4.2.1. Gas Composition
Gas composition exerts a first-order control on hydrate structure selection and equilibrium boundaries in CH4-C2H6 systems. Ethane preferentially occupies large cages and stabilizes sII hydrates, shifting the equilibrium toward higher stability temperatures and lower dissociation pressures relative to pure methane. As a result, even minor ethane fractions can deepen predicted BGHSZ and enlarge the hydrate-free gas coexistence interval beneath the BSR. This effect is especially relevant for deep-water settings where stability conditions are close to the phase boundary and small compositional changes can translate into measurable depth shifts.
4.2.2. Geothermal Gradient
The geothermal gradient is a dominant control on both the absolute thickness of the GHSZ and the uncertainty bounds of BGHSZ predictions. Lower geothermal gradients favor thicker stability zones, whereas higher gradients reduce stability thickness. At the regional scale, spatial variability in geothermal gradient contributes strongly to the heterogeneity observed in GHSZ thickness distributions. This control is consistent with the sensitivity ranking obtained in Section 3.3, where geothermal gradient dominates BGHSZ confidence intervals across the Shenhu sites.
4.2.3. Geological Structure and Boundary Condition Heterogeneity
Geological structure influences hydrate stability indirectly by modulating regional thermal regimes (e.g., faults, tectonic segmentation, and volcanic/heat-flow anomalies). In the South China Sea, basin-scale zoning patterns and localized anomalies can produce spatial variations in geothermal gradient and, therefore, in stability thickness. These structural and thermal heterogeneities help explain the banded and zoned patterns seen in regional thickness predictions and provide a geological context for interpreting site-to-site differences in BGHSZ and hydrate occurrence.
4.3. Model Assumptions, Limitations, and Interpretation Scope
Several assumptions constrain the interpretation of composition-dependent stability predictions. The vdW-P model is applied under an equilibrium framework; in natural sediments, kinetic limitations, heterogeneous nucleation, and incomplete equilibration may influence hydrate distribution and phase partitioning. Regional calculations also simplify boundary conditions (e.g., linear geothermal gradient and spatially constant salinity), whereas local heat-flow anomalies, salinity variability, and sediment properties may shift equilibrium boundaries.
In addition, composition scenarios are represented by endmembers and representative mixtures. Natural systems may exhibit compositional gradients with depth and temporal variability in gas supply. Finally, porous-media effects (capillary pressure and grain-size dependence) are not explicitly treated, which may introduce deviations between bulk-phase equilibrium and in-sediment stability.
4.4. Implications for Resource Assessment, Exploration Targeting, and Uncertainty
Composition-dependent stability has direct implications for hydrate resource evaluation and exploration strategy. Methane-only assumptions can underestimate stability thickness and potentially overlook hydrate-bearing intervals beneath the conventional BSR target when sII hydrates are stabilized by trace ethane. This bias affects not only predicted GHSZ geometry but also the interpretation of hydrate-free gas coexistence zones and related geohazard considerations.
Uncertainty analysis indicates that improving geothermal constraints is the most effective way to reduce prediction confidence bounds, whereas better characterization of trace hydrocarbons primarily reduces systematic bias relative to pure methane stability predictions and refines estimates of the I-BGHSZ to II-BGHSZ separation. These insights provide practical guidance for prioritizing future data acquisition in hydrate provinces.
5. Conclusions
This study integrated experimental observations, Raman spectroscopic analyses, and thermodynamic simulations to investigate the phase equilibrium and stability zones of natural gas hydrates. The key conclusions can be summarized as follows:
- (1)
- The thermodynamic model proposed in this study combines the vdW-P model with experimental data and accurately predicts hydrate phase behavior and stability zone position in multicomponent gas systems. The model effectively accounts for the impact of gas composition on the hydrate stability zone. Comparison with experimental results demonstrates the model’s accuracy and reliability, with a prediction error of less than 5%.
- (2)
- Compared to the pure CH4 gas system, the hydrate formed in the CH4-C2H6 mixed gas system exhibits greater stability and remains stable at lower pressures and higher temperatures. Especially in low-temperature, high-pressure environments, the occupancy effect of C2H6 allows the hydrate stability zone to extend to deeper layers. This finding indicates that gas composition, particularly the addition of C2H6, significantly affects the depth and extent of the hydrate stability zone.
- (3)
- Using geothermal gradient, seafloor temperature, water depth, and gas composition scenarios (pure CH4 versus CH4-C2H6 mixtures), this study quantitatively predicted the distribution and thickness of the GHSZ in the northern South China Sea. The results demonstrate that, compared with predictions based on pure CH4 systems, the presence of trace amounts of C2H6 systematically deepens the basal GHSZ and expands the hydrate-free gas coexistence zone beneath the BSR. At the regional scale, these compositional effects, in combination with variations in geothermal gradient and geological structure, lead to significant spatial heterogeneity in GHSZ thickness and indicate that hydrate stability may be underestimated when gas composition is neglected in conventional assessments.
The results of this study provide important theoretical support for hydrate exploration and development in the South China Sea and other regions. The research emphasizes the critical role of gas composition, particularly the impact of C2H6, on the depth and thickness of the hydrate stability zone. It points out that multicomponent gas systems should be considered in hydrate resource assessments. This study provides a scientific basis for accurately predicting the distribution, thickness, and resource potential of hydrate stability zones. It is particularly valuable in the exploration and exploitation of multicomponent gas natural systems, aiding in the identification of potential hydrate accumulation areas and offering guidance for future hydrate extraction.
Author Contributions
Conceptualization, Q.H. and M.W.; methodology, Q.H.; software, Q.H.; validation, Q.H., M.W. and W.L.; formal analysis, Q.H.; investigation, M.W.; resources, W.L.; data curation, W.L.; writing—original draft preparation, Q.H.; writing—review and editing, Q.H.; supervision, Y.C.; project administration, Y.C.; funding acquisition, Y.C. All authors have read and agreed to the published version of the manuscript.
Funding
This research was funded by the National Natural Science Foundation of China State Key Laboratory of Deep Oil and Gas, China University of Petroleum (East China), grant number SKLDOG2024-ZYTS-13; the Major Scientific and Technological Projects of CNPC Grant number: ZD2019-184-001.
Data Availability Statement
The original contributions presented in this study are included in the article. Further inquiries can be directed to the corresponding author.
Conflicts of Interest
The authors declare no conflicts of interest.
References
- Liu, T.; Shi, W.; Xu, C.; Lu, H.; Fu, X.; Liu, B. Synthesis of mixed methane-ethylene hydrate with ice powder. Unconv. Resour. 2023, 3, 1–6. [Google Scholar] [CrossRef] [Scilit]
- Makogon, Y.F. Natural gas hydrates—A promising source of energy. J. Nat. Gas Sci. Eng. 2010, 2, 49–59. [Google Scholar] [CrossRef] [Scilit]
- Sloan, E.D. Fundamental principles and applications of natural gas hydrates. Nature 2003, 426, 353–359. [Google Scholar] [CrossRef] [Scilit] [PubMed]
- Max, M.D. Natural Gas Hydrate in Oceanic and Permafrost Environments; Springer Science & Business Media: Berlin/Heidelberg, Germany, 2003. [Google Scholar]
- Pang, X.Q.; Jia, C.Z.; Chen, Z.X.; Shi, H.S.; Chen, Z.H.; Hu, T.; Wang, T.; Xu, Z.; Liu, X.-H.; Zhang, X.-W.; et al. Reduction of global natural gas hydrate (NGH) resource estimation and implications for the NGH development in the South China Sea. Pet. Sci. 2022, 19, 3–12. [Google Scholar] [CrossRef] [Scilit]
- Sloan, E.D. Clathrate Hydrates of Natural Gases; CRC Press: Boca Raton, FL, USA, 2007; Available online: https://www.taylorfrancis.com/books/mono/10.1201/9781420008494/clathrate-hydrates-natural-gases-dendy-sloan-jr-carolyn-koh-carolyn-koh (accessed on 10 October 2024).
- Dong, H.; Zhang, L.; Wang, J. Formation, Exploration, and Development of Natural Gas Hydrates. Energies 2022, 15, 5951. [Google Scholar] [CrossRef] [Scilit]
- Fujii, T.; Suzuki, K.; Takayama, T.; Tamaki, M.; Komatsu, Y.; Konno, Y.; Yoneda, J.; Yamamoto, K.; Nagao, J. Geological setting and characterization of a methane hydrate reservoir distributed at the first offshore production test site on the Daini-Atsumi Knoll in the eastern Nankai Trough, Japan. Mar. Pet. Geol. 2015, 66, 310–322. [Google Scholar] [CrossRef] [Scilit]
- Guo, Y.; Li, S.; Song, Z.; Zhang, N.; Liu, L.; Liu, J.; Sun, H.; Wu, D. Effect of interlayer flow capability on the interference of natural gas hydrate and shallow gas reservoir co-production. J. Clean. Prod. 2025, 493, 144996. [Google Scholar] [CrossRef] [Scilit]
- Su, Z.; Huang, L.; Wu, N.; Yang, S. Effect of thermal stimulation on gas production from hydrate deposits in Shenhu area of the South China Sea. Sci. China Earth Sci. 2013, 56, 601–610. [Google Scholar] [CrossRef] [Scilit]
- Zhang, Z.; Li, Y.; Li, S.; He, J.; Xie, Z.; Li, X.; Lu, C.; Qin, X. Comparative Evaluation of Thermal Stimulation Techniques for Natural Gas Hydrate Production. Energy Fuels 2024, 38, 17674–17686. [Google Scholar] [CrossRef] [Scilit]
- Mohammadi, A.H.; Eslamimanesh, A.; Richon, D.; Gharagheizi, F.; Yazdizadeh, M.; Javanmardi, J.; Hashemi, H.; Zarifi, M.; Babaee, S. Gas Hydrate Phase Equilibrium in Porous Media: Mathematical Modeling and Correlation. Ind. Eng. Chem. Res. 2012, 51, 1062–1072. [Google Scholar] [CrossRef] [Scilit]
- Vysniauskas, A.; Bishnoi, P.R. A kinetic study of methane hydrate formation. Chem. Eng. Sci. 1983, 38, 1061–1072. [Google Scholar] [CrossRef] [Scilit]
- Mingjun, Y.; Yongchen, S.; Yu, L.; Yongjun, C.; Qingping, L.I. Influence of Pore Size, Salinity and Gas Composition upon the Hydrate Formation Conditions. Chin. J. Chem. Eng. 2010, 18, 292–296. [Google Scholar] [CrossRef] [Scilit]
- Ravipati, S.; Punnathanam, S.N. Calculation of three-phase methane–ethane binary clathrate hydrate phase equilibrium from Monte Carlo molecular simulations. Fluid Phase Equilibria 2014, 376, 193–201. [Google Scholar] [CrossRef] [Scilit]
- Subramanian, S.; Ballard, A.L.; Kini, R.A.; Dec, S.F.; Sloan, E.D. Structural transitions in methane + ethane gas hydrates—Part I: Upper transition point and applications. Chem. Eng. Sci. 2000, 55, 5763–5771. [Google Scholar] [CrossRef] [Scilit]
- Kunath, P.; Chi, W.C.; Berndt, C.; Chen, L.; Liu, C.S.; Kläschen, D.; Muff, S. A Shallow Seabed Dynamic Gas Hydrate System off SW Taiwan: Results From 3-D Seismic, Thermal, and Fluid Migration Analyses. J. Geophys. Res. Solid Earth 2020, 125, e2019JB019245-T. [Google Scholar] [CrossRef] [Scilit]
- Han, S.; Bangs, N.L.; Hornbach, M.J.; Pecher, I.A.; Tobin, H.J.; Silver, E.A. The many double BSRs across the northern Hikurangi margin and their implications for subduction processes. Earth Planet. Sci. Lett. 2021, 558, 116743. [Google Scholar] [CrossRef] [Scilit]
- Pecher, I.A.; Villinger, H.; Kaul, N.; Crutchley, G.J.; Mountjoy, J.J.; Huhn, K.; Kukowski, N.; Henrys, S.A.; Rose, P.S.; Coffin, R.B. A Fluid Pulse on the Hikurangi Subduction Margin: Evidence from a Heat Flux Transect Across the Upper Limit of Gas Hydrate Stability. Geophys. Res. Lett. 2017, 44, 12385–12395. [Google Scholar] [CrossRef] [Scilit]
- Paganoni, M.; Cartwright, J.A.; Foschi, M.; Shipp, R.C.; Van Rensbergen, P. Structure II gas hydrates found below the bottom-simulating reflector. Geophys. Res. Lett. 2016, 43, 5696–5706. [Google Scholar] [CrossRef] [Scilit]
- Qian, J.; Wang, X.; Collett, T.S.; Guo, Y.; Kang, D.; Jin, J. Downhole log evidence for the coexistence of structure II gas hydrate and free gas below the bottom simulating reflector in the South China Sea. Mar. Pet. Geol. 2018, 98, 662–674. [Google Scholar] [CrossRef] [Scilit]
- Zhang, W.; Liang, J.; Wei, J.; Lu, J.A.; Su, P.; Lin, L.; Huang, W.; Guo, Y.; Deng, W.; Yang, X.; et al. Geological and geophysical features of and controls on occurrence and accumulation of gas hydrates in the first offshore gas-hydrate production test region in the Shenhu area, Northern South China Sea. Mar. Pet. Geol. 2020, 114, 104191. [Google Scholar] [CrossRef] [Scilit]
- Wei, J.; Fang, Y.; Lu, H.; Lu, H.; Lu, J.; Liang, J.; Yang, S. Distribution and characteristics of natural gas hydrates in the Shenhu Sea Area, South China Sea. Mar. Pet. Geol. 2018, 98, 622–628. [Google Scholar] [CrossRef] [Scilit]
- Huang, Q.; Chen, Y.; Wang, M.; Lv, W. Geological characteristics and models of gas hydrate-free gas coexistence in Shenhu area, South China Sea. Unconv. Resour. 2025, 8, 100228. [Google Scholar] [CrossRef] [Scilit]
- Ballard, A.L.; Sloan, E.D., Jr. Hydrate phase diagrams for methane + ethane + propane mixtures. Chem. Eng. Sci. 2001, 56, 6883–6895. [Google Scholar] [CrossRef] [Scilit]
- Holder, G.D.; Grigoriou, G.C. Hydrate dissociation pressures of (methane + ethane + water) existence of a locus of minimum pressures. J. Chem. Thermodyn. 1980, 12, 1093–1104. [Google Scholar] [CrossRef] [Scilit]
- Ismail, I.; Gaganis, V.; Marinakis, D.; Mousavi, R.; Tohidi, B. Accuracy of different thermodynamic software packages in predicting hydrate dissociation conditions. Chem. Thermodyn. Therm. Anal. 2023, 9, 100103. [Google Scholar] [CrossRef] [Scilit]
- Jiang, J.; Jiang, J.; Mao, J.; Li, D.; Liu, T.; Pan, Z. A novel model to predict phase equilibrium state of hydrates from the relationship of gas solubility. Front. Energy Res. 2024, 12, 1378754. [Google Scholar] [CrossRef] [Scilit]
- Nixdorf, J.; Oellrich, L.R. Experimental determination of hydrate equilibrium conditions for pure gases, binary and ternary mixtures and natural gases. Fluid Phase Equilibria 1997, 139, 325–333. [Google Scholar] [CrossRef] [Scilit]
- Liang, J.; Zhang, Z.; Su, P.; Sha, Z.; Yang, S. Evaluation of gas hydrate-bearing sediments below the conventional bottom-simulating reflection on the northern slope of the South China Sea. Interpretation 2017, 5, SM61–SM74. [Google Scholar] [CrossRef] [Scilit]
- Zhang, W.; Liang, J.; Wan, Z.; Su, P.; Huang, W.; Wang, L.; Lin, L. Dynamic accumulation of gas hydrates associated with the channel-levee system in the Shenhu area, northern South China Sea. Mar. Pet. Geol. 2020, 117, 104354. [Google Scholar] [CrossRef] [Scilit]
- Song, Y.; Lei, Y.; Zhang, L.; Cheng, M.; Miao, L.; Li, C.; Liu, N. Spatial-temporal variations of the gas hydrate stability zone and hydrate accumulation models in the Dongsha region, China. Front. Mar. Sci. 2022, 9, 982814. [Google Scholar] [CrossRef] [Scilit]
- Wei, D.; Jinqiang, L.; Zenggui, K.; Tong, Z.; Yanian, Z.; Yulin, H. The variation of free gas distribution within the seeping seafloor hydrate stability zone and its link to hydrate formations in the Qiongdongnan Basin. Acta Geophys. 2022, 70, 1115–1136. [Google Scholar] [CrossRef] [Scilit]
- Su, M.; Wang, H.; Sha, Z.; Liang, J.; Wu, N.; Qiao, S.; Cong, X.; Yang, R. Gas hydrates distribution in the Shenhu Area, northern South China Sea: Comparisons between the eight drilling sites with gas-hydrate petroleum system. Geol. Acta 2016, 14, 79–100. [Google Scholar]
- Wu, N.; Yang, S.; Zhang, H.; Liang, J.; Wang, H.; Su, X.; Fu, S. Preliminary Discussion on Gas Hydrate Reservoir System of Shenhu Area, North Slope of South China Sea. 2008. Available online: https://open.library.ubc.ca/soa/cIRcle/collections/59278/items/1.0041054 (accessed on 7 September 2025).
- Wu, N.; Zhang, H.; Yang, S.; Zhang, G.; Liang, J.; Lu, J.A.; Su, X.; Schultheiss, P.; Holland, M.; Zhu, Y. Gas Hydrate System of Shenhu Area, Northern South China Sea: Geochemical Results. J. Geol. Res. 2011, 2011, 370298. [Google Scholar] [CrossRef] [Scilit]
- Youhai, Z.; Xia, H.; Shaoying, F.; Pibo, S. Gas Sources of Natural Gas Hydrates in the Shenhu Drilling Area, South China Sea: Geochemical Evidence and Geological Analysis. Acta Geol. Sin. Engl. Ed. 2013, 87, 767–776. [Google Scholar] [CrossRef] [Scilit]
- Zhang, W.; Liang, J.; Wei, J.; Su, P.; Lin, L.; Huang, W. Origin of natural gases and associated gas hydrates in the Shenhu area, northern South China Sea: Results from the China gas hydrate drilling expeditions. J. Asian Earth Sci. 2019, 183, 103953. [Google Scholar] [CrossRef] [Scilit]

Disclaimer/Publisher’s Note: The statements, opinions and data contained in all publications are solely those of the individual author(s) and contributor(s) and not of MDPI and/or the editor(s). MDPI and/or the editor(s) disclaim responsibility for any injury to people or property resulting from any ideas, methods, instructions or products referred to in the content. |
© 2026 by the authors. Licensee MDPI, Basel, Switzerland. This article is an open access article distributed under the terms and conditions of the Creative Commons Attribution (CC BY) license.