


Abstract
The overtopping phenomenon is the main cause of coastal flooding and the susceptibility of coastal defense structures. Recent investigations have demonstrated that local hydrodynamics are considerably altered by progressive erosion and fluctuations in the water level in front of structures, with the direct impact of higher and more energetic waves on the structure increasing the overtopping volume. These studies show that the quantity of water that is overtopped is influenced by a variety of factors, including wave height, wave period, and sea water level. However, the fluctuation in the bottom elevation in front of coastal structures (due to coastal erosion, for instance) is one of the potential causes of the growth of this phenomenon over time. This work evaluates the impact of water depth variations in front of sea structures on overtopping. This paper introduces a numerical methodology that uses a computational fluid dynamics (CFD) method to verify the experimental results obtained in a two-dimensional hydraulic channel, on beach profiles in front of structures armored with Antifer-type blocks. Unlike traditional homogeneous porous media models, the individual blocks (Antifer) were discretized geometrically in 3D by superimposing them in the numerical domain. Additionally, the morpho dynamic evolution of the sandy beach in front of the structure was simulated. The purpose of this paper is to evaluate the efficacy of an advanced CFD methodology as a prediction and design tool for coastal defense systems. By comparing numerical results with physical models and mathematical formulas, this study assesses the accuracy of numerical approaches in reproducing beach evolution and the internal flow of coastal defense structures. While the CFD model demonstrates strong predictive capabilities under standard scenarios, notable discrepancies are observed under specific experimental conditions. These limitations and their implications for design practice are compared and discussed.
1. Introduction
Wave overtopping is one of the main mechanisms responsible for coastal flooding and represents one of the most critical factors affecting the stability and functionality of coastal defense structures. This phenomenon occurs when incident waves exceed the crest elevation of a structure, causing water volumes to pass over it and reach the landward areas, posing risks to infrastructure, settlements, and human activities along the coastal fringe [1].
Several studies have shown that the local hydrodynamics in the vicinity of coastal defense structures are significantly altered both by long-term sea-level rise and by localized erosive processes that cause fluctuations in the seabed elevation in front of the structures. Although both phenomena increase wave overtopping, they drive different hydraulic mechanisms; while rising water levels directly increase the base water depth and allow larger waves to propagate shoreward, seabed erosion alters the local morphodynamics and wave-breaking patterns right before the structure. Consequently, these distinct boundary condition modifications allow higher and more energetic waves to directly impact the defense systems, thereby increasing overtopping volumes through separate but compounding effects [2]. It is well established that overtopping rates depend on a range of parameters, including wave height, wave period, and water level. However, bottom elevation fluctuations in front of coastal structures are often associated with coastal erosion, and their role as a potential driver of the long-term amplification of overtopping remains comparatively under-investigated.
Computational fluid dynamics (CFD) has increasingly established itself as a reliable tool for studying wave-structure interaction, owing to its ability to reproduce both wave motion and energy dissipation mechanisms within porous structures, with a high level of detail [3,4]. However, most numerical approaches in the literature represent armor layers, such as Antifer-type concrete blocks, using homogeneous porous-medium formulations, thereby neglecting the discrete geometry of individual units and the resulting heterogeneity in internal flow paths. Likewise, few studies have addressed, in an integrated manner, the coupled simulation of sandy beach morphodynamic evolution and its effect on overtopping, which limits the predictive capability of existing models under realistic, time-varying coastal conditions.
This study evaluates the impact of water depth variations in front of maritime structures on overtopping, using a numerical CFD methodology validated against experimental results obtained in a two-dimensional hydraulic flume, on beach profiles in front of structures armored with Antifer-type blocks. Unlike conventional homogeneous porous-medium models, the individual Antifer blocks are geometrically discretized in 3D and explicitly superimposed within the numerical domain, enabling a more realistic representation of the internal flow field, as described in [5]. The morphodynamic evolution of the sandy beach in front of the structure is simulated concurrently.
The primary contribution of this work relates to sensitivity to overtopping. The core value of the research lies in revealing how specific variables (such as wave parameters, structural geometry, or environmental conditions) directly impact wave overtopping rates. It provides actionable insights into how sensitive the overtopping process is to these changing factors. The supporting tool is CFD validation, which serves as a rigorous foundation. It proves that the numerical model is accurate and reliable enough to test these sensitivities, but the validation itself is a means to an end, not the main takeaway.
The objective of this work is to assess the reliability of this advanced CFD methodology as a predictive and design-support tool for coastal defense systems, by demonstrating its accuracy in reproducing both beach profile evolution and the internal flow within the structure. To this end, results from physical model tests, empirical formulas, and numerical simulations are compared and critically discussed. The remainder of this paper is organized as follows: Section 2 reviews the state of the art on the influence of water depth on wave overtopping. Section 3 describes the physical model; Section 4 describes numerical models; Section 5 presents the results; and Section 6 summarizes the main conclusions.
2. Impact of Water Depth on Wave Overtopping
Rubble mound structures are widely used for coastal protection, and their performance is commonly assessed in terms of mean overtopping discharge and individual overtopping volumes. Many of these structures are not exposed directly to deep-water waves, but are fronted by a sandy berm or beach, so that the water depth at the structure toe is limited and may vary significantly with tide, storm surge, and beach evolution. Understanding how this depth affects overtopping is, therefore, essential for reliable design and for the assessment of existing defenses. Various researchers have recognized the potential effects of water depth, as outlined in [6] and further summarized below.
According to [7], a large-scale wave flume experiment was conducted to examine the roughness characteristics of different placed block revetments; the authors determined that the findings demonstrated a considerable impact of water depth on wave run-up characteristics and suggested further investigation into this matter.
Overtopping of rubble mound structures is generally described through empirical formulae that relate the dimensionless discharge to the relative freeboard, with reduction factors accounting for armor roughness, permeability, berms and crest geometry [1]. The CLASH database allowed the calibration of roughness factors for different armor units and the development of neural-network-based predictions [8]. However, these formulae were primarily derived from conditions where waves arriving at the toe were not strongly depth limited.
In shallow water, depth-induced breaking reduces the incident wave height and shifts spectral energy towards lower frequencies, so that offshore wave parameters cannot be used directly [9]. For very shallow foreshores, standard overtopping formulae tend to be inaccurate unless modified, as shown for dikes and seawalls [2,10]. Most of this work focuses on dikes and vertical walls, whereas rubble mound structures have received comparatively less attention.
A sand berm in front of a rubble mound structure modifies the overtopping process in several ways. It limits the local water depth and promotes wave breaking before the structure; it reduces the effective freeboard by raising the toe level; and it alters wave set-up and the contribution of infragravity waves at the toe [11]. In addition, the beach may partially bury the lower armor layer, changing the effective roughness and permeability of the slope. While these mechanisms are individually recognized, their combined effect on overtopping at rubble mound structures has not been systematically quantified.
Physical model tests remain the main source of data for overtopping at rubble mound structures, while CFD (e.g., volume of fluid, VOF-based solvers) and particle methods, such as smoothed-particle hydrodynamics (SPH), are increasingly used to reproduce wave breaking and flow through porous media. Their validation with a mobile sandy bed in front of the structure is still limited.
Although the impact of shallow foreshores and overtopping at rubble mound structures has been investigated, the impact of water depth on structures that are fronted by a sandy berm, including the potential for erosion, is still inadequately documented. This study aims to address this deficiency by integrating computational and experimental overtopping data for rubble-mound breakwaters with a sand berm.
3. Experiments
3.1. Facilities
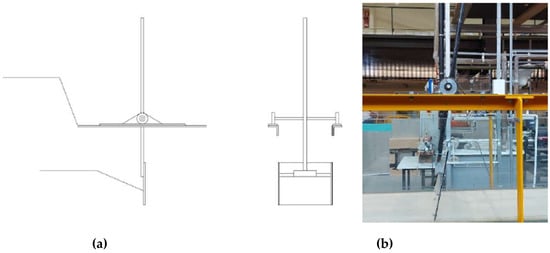
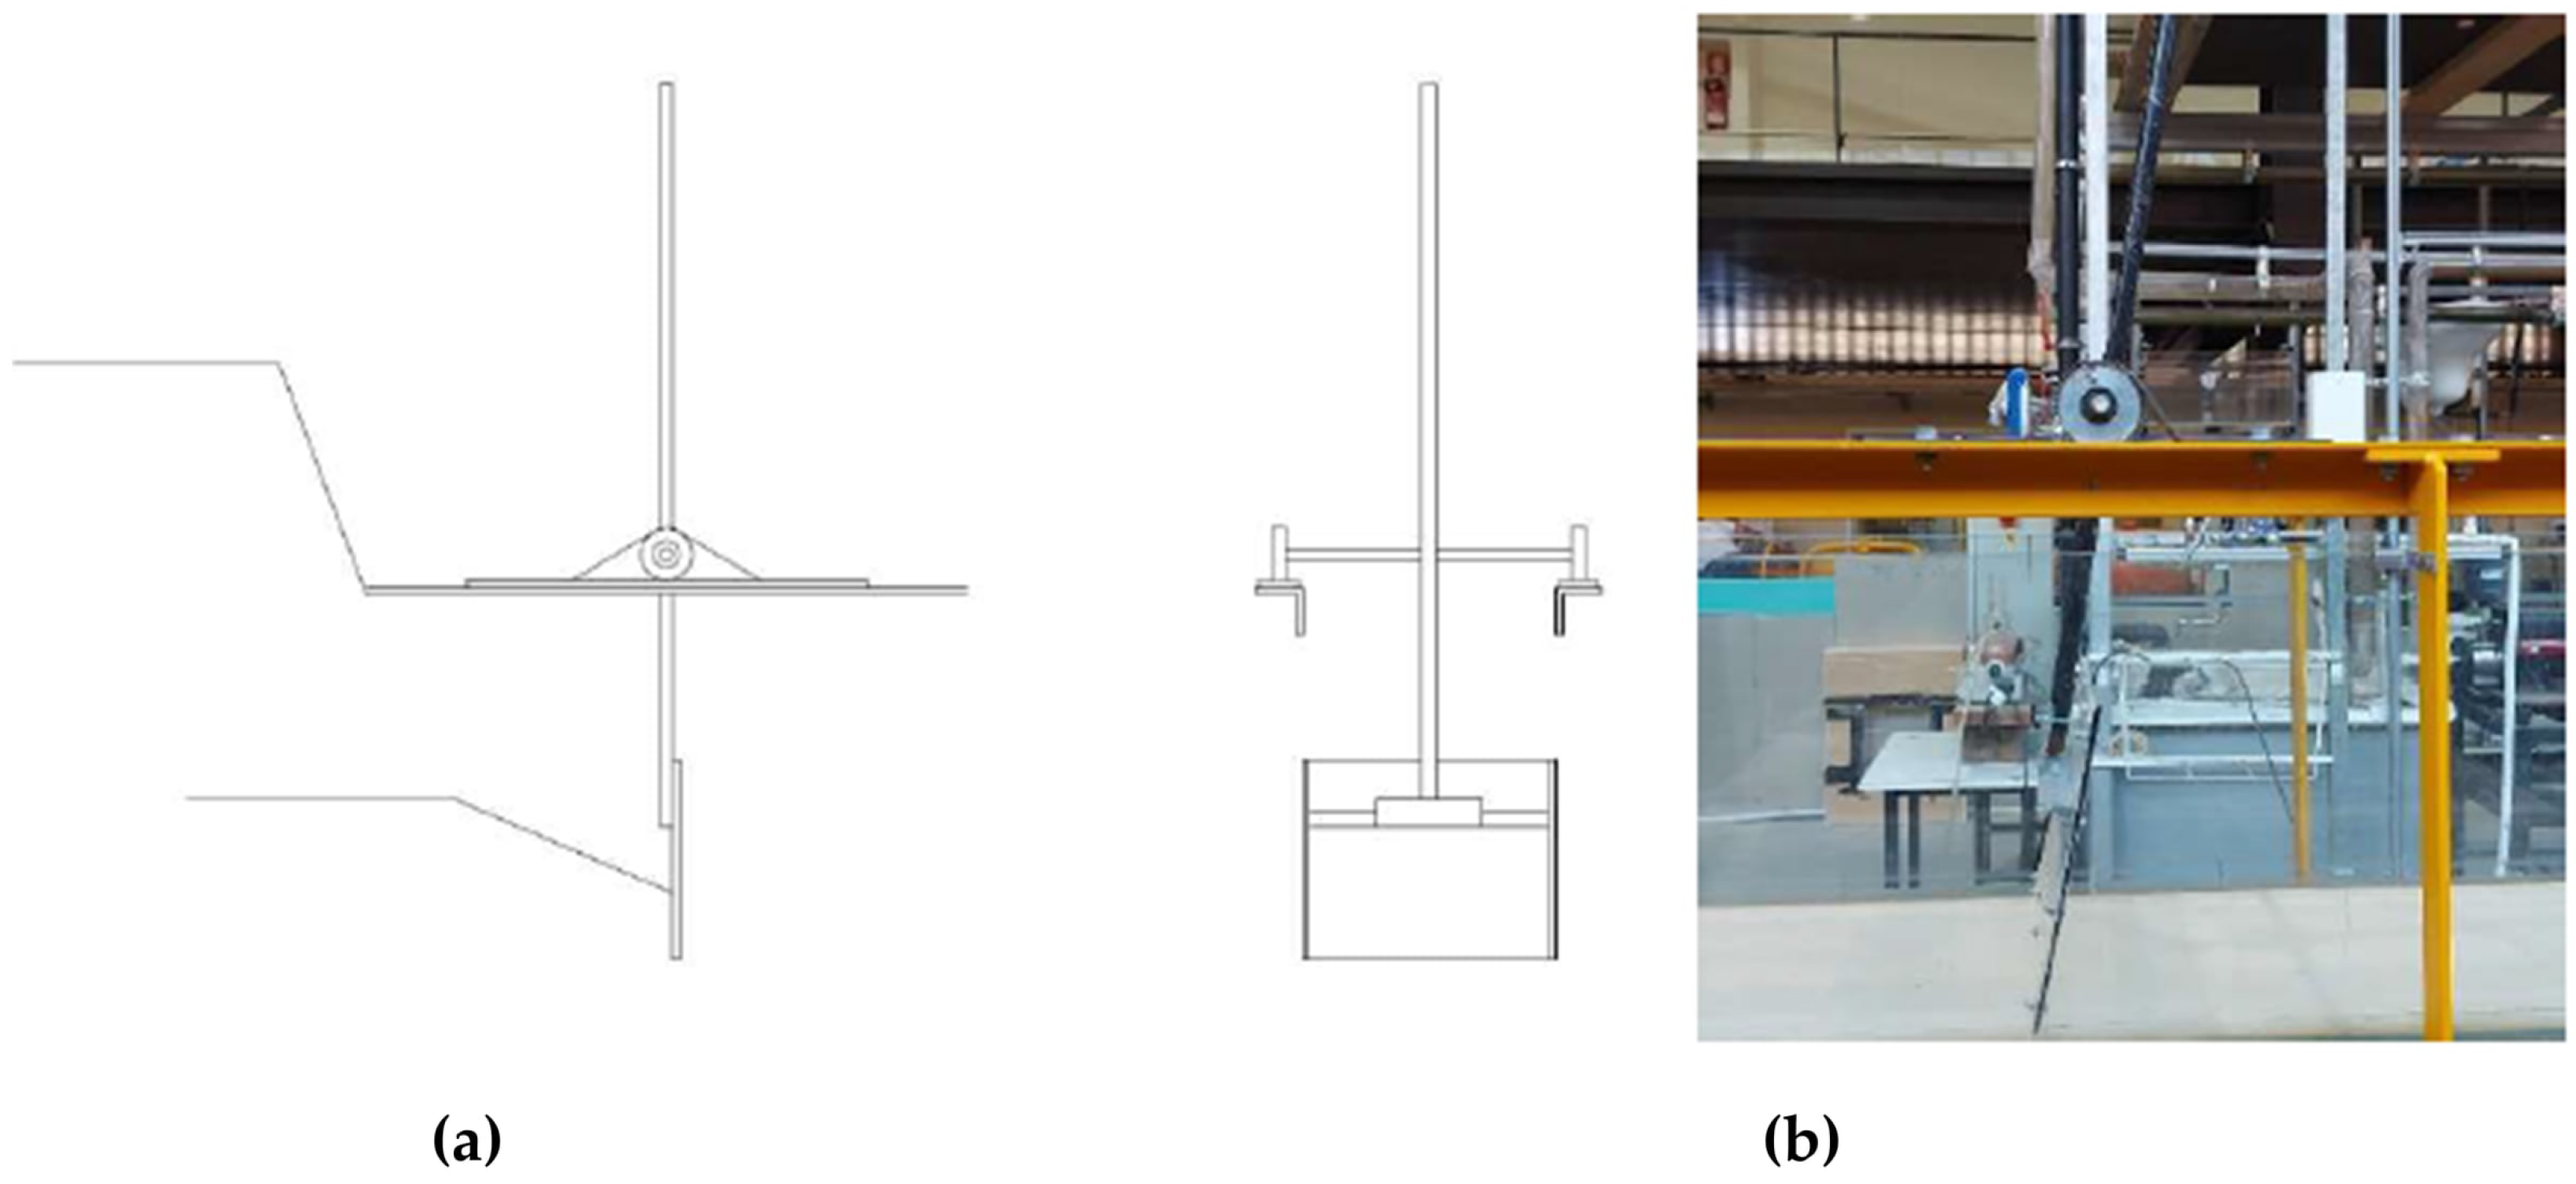
The tests were carried out in the hydraulic channel of the Civil Engineering Department of the University of Aveiro, Portugal [12]. The channel had a length of 10 m and a cross-section of 0.4 m × 0.5 m. Through a movable support at height, different inclinations were established. In the upstream area of the channel, a wave maker was installed, a manual mechanism that allows the generation of waves. This works with a pendulum motion and consists of acrylic plates, connected to a system of steel shafts. Figure 1 shows the wave generator used.
Figure 1.
Wave generation: (a) diagram (elevation on the left and front view on the right); (b) laboratory equipment.
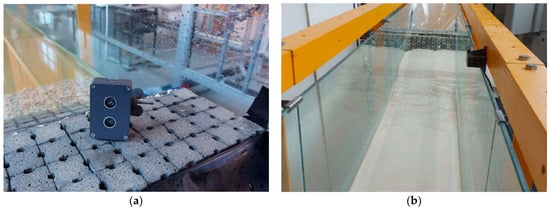
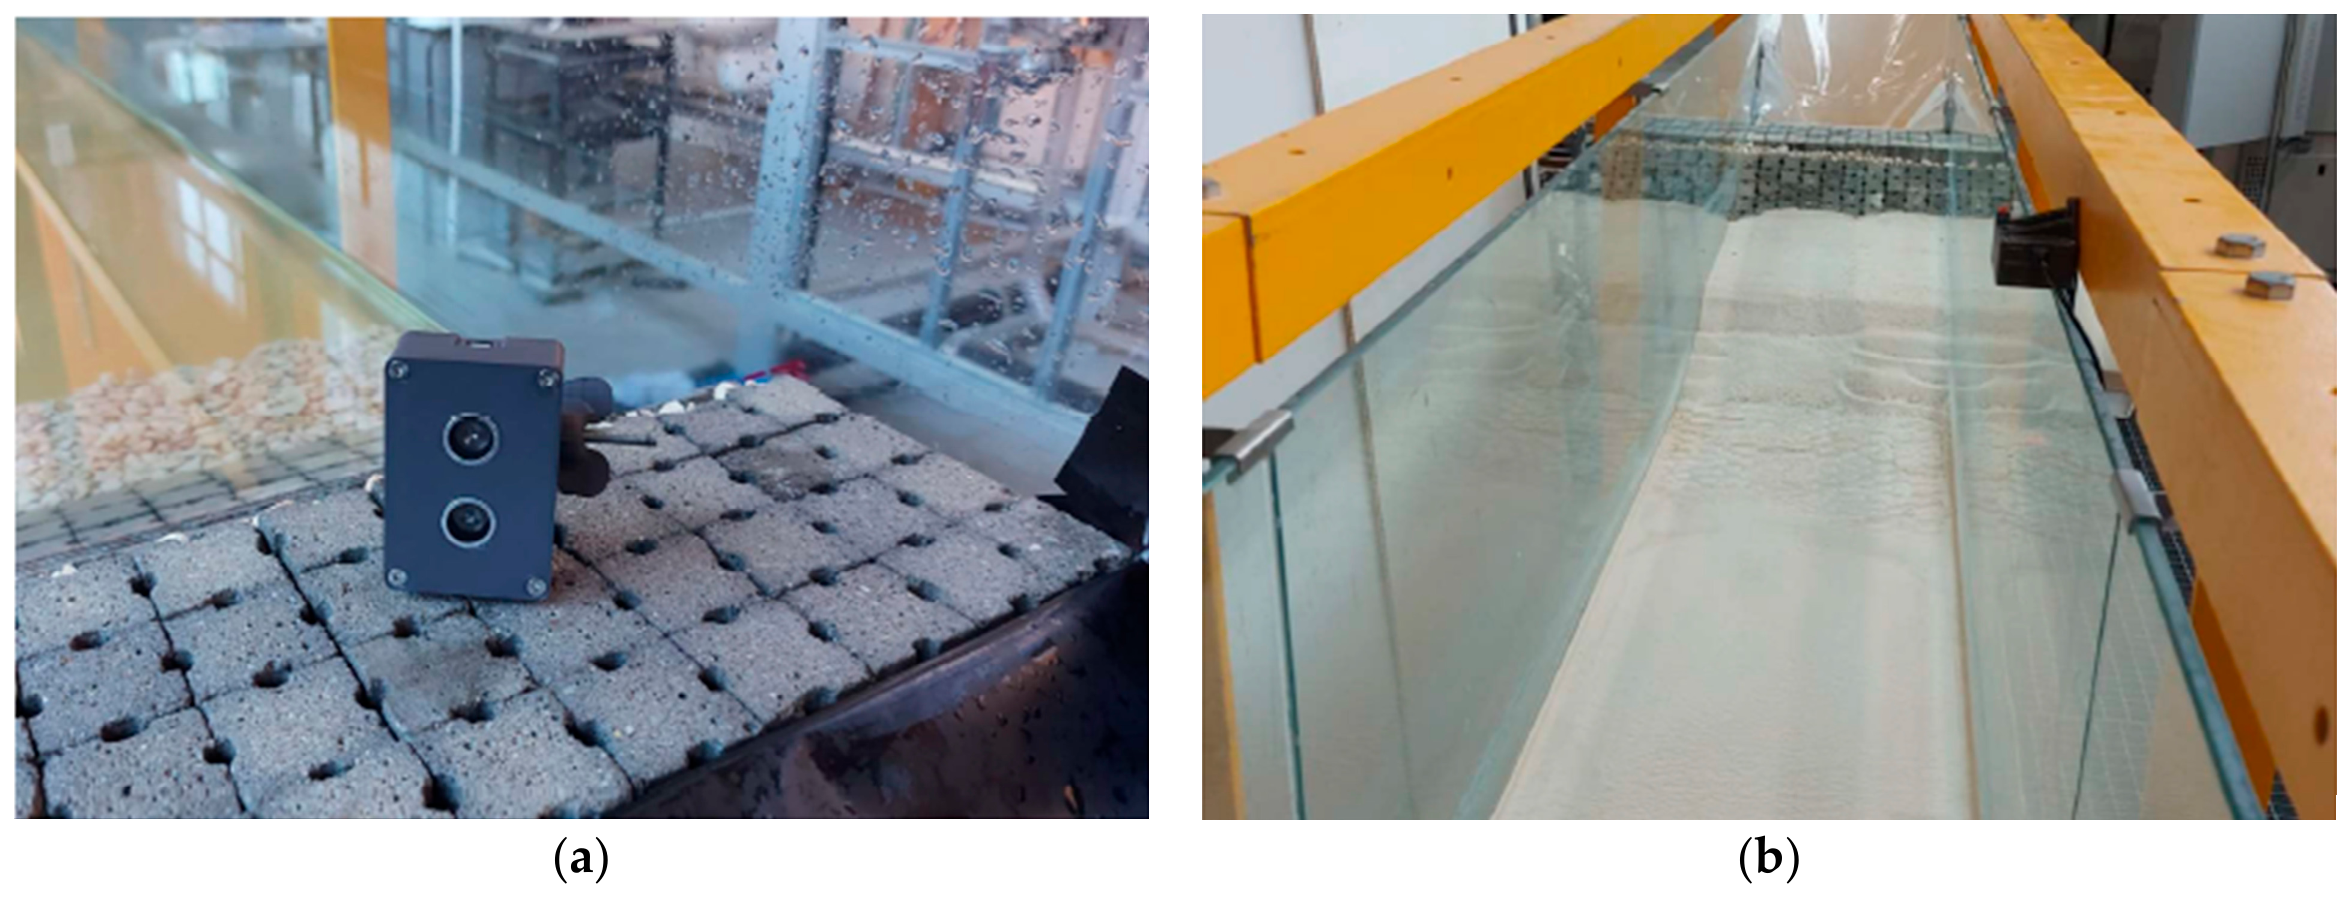
An ultrasonic sensor, as represented in Figure 2, was used to analyze and quantify the features of the waves created throughout the testing process. This sensor emitted ultrasound every 40 milliseconds, capturing the measured distance between the sensor and the water surface. The slide was installed at a distance of 4.30 m from the wave maker, in the approach area of the structure that was installed in the channel. Preliminary tests were performed to evaluate the repeatability of wave generation conditions and to check the performance of the mechanism.
Figure 2.
Ultrasonic sensor: (a) sensor; (b) position of the sensor in the channel.
To assess the amount of water that overflowed, a plastic structure was placed beneath the adherent structure, in order to channel the water to a container, so that the volume that passed over the structure could later be quantified.
3.2. Coastal Structure
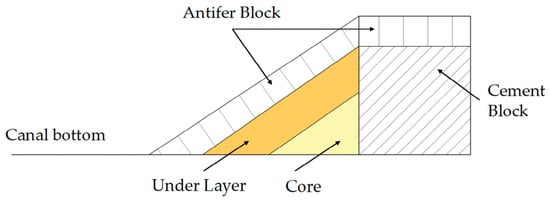
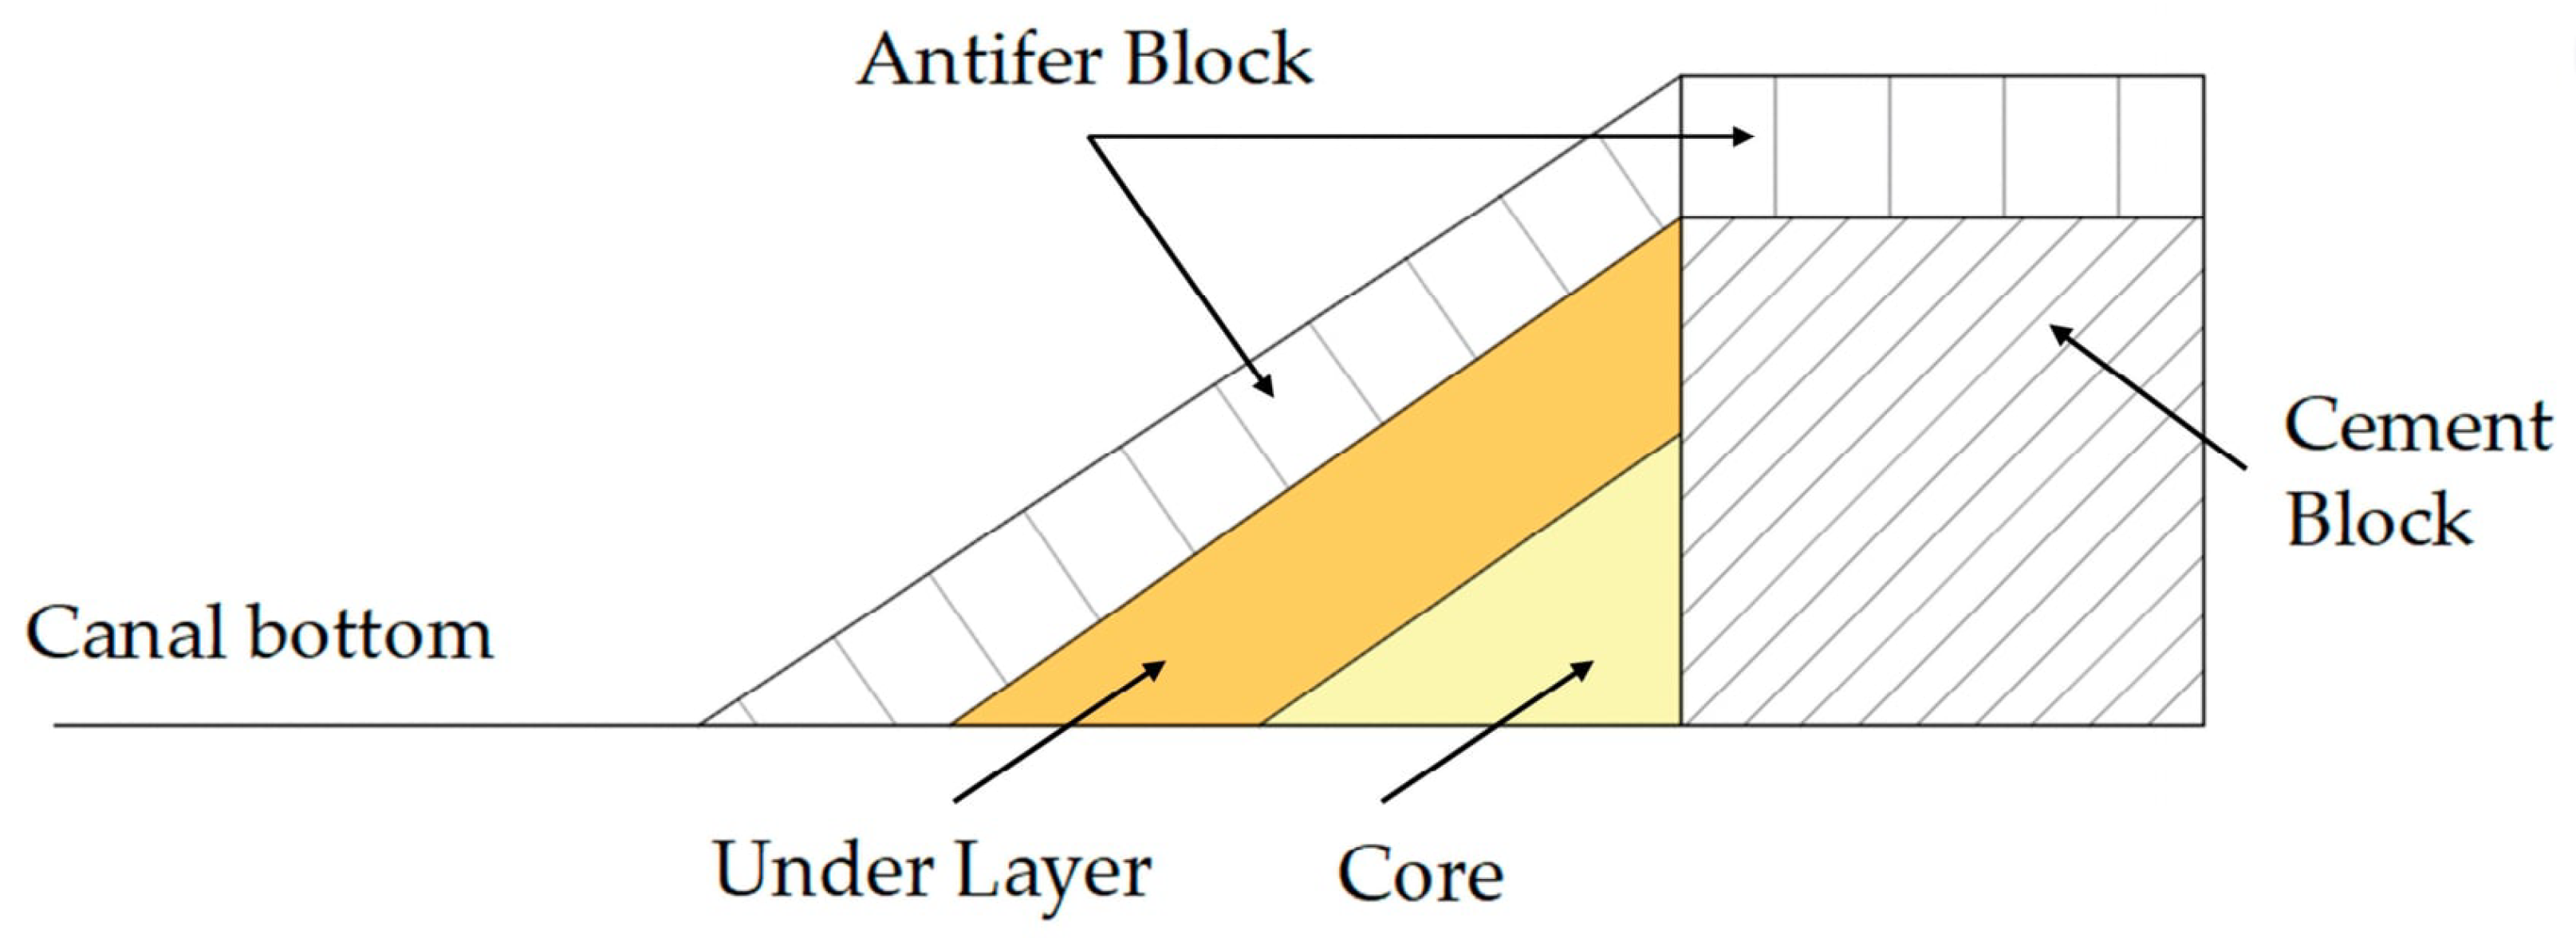
To carry out the tests in order to simulate a beach protected with a coastal structure, a scale model was built. The construction of the model followed several scale considerations, respecting Froude’s similarity. Similar to previous work carried out in the same channel [13], the geometric scale 1:40 was used for the construction of the model. Thus, a scheme of the structure with a 2:3 (V:H) slope was devised, which consisted of a core layer (coarse sand), an inner layer (8/12 crushed stone), and a resistant layer constructed with Antifer blocks. This model is illustrated in Figure 3.
Figure 3.
Scheme of the rubble mound structure built at the channel, according to model.
3.3. Beach Profile
To study the variation in seabed elevation in front of the coastal structure, influenced by wave reflectivity processes, a beach was constructed next to the rubble mound defense structure. With this, over time, it was possible to analyze the behavior of the profile variation in relation to waves and water levels, in each scenario. The sand used to construct the model was beach sand, with a D50 of 0.36 mm.
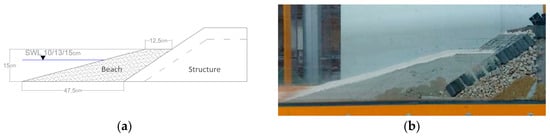
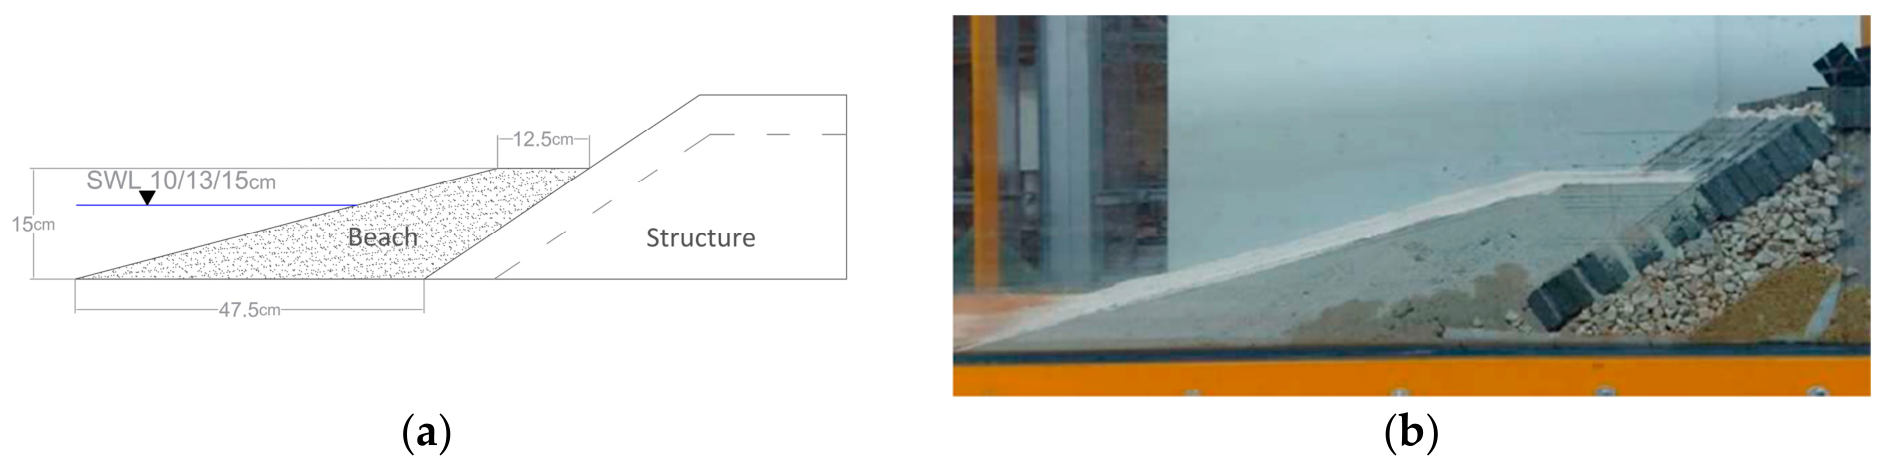
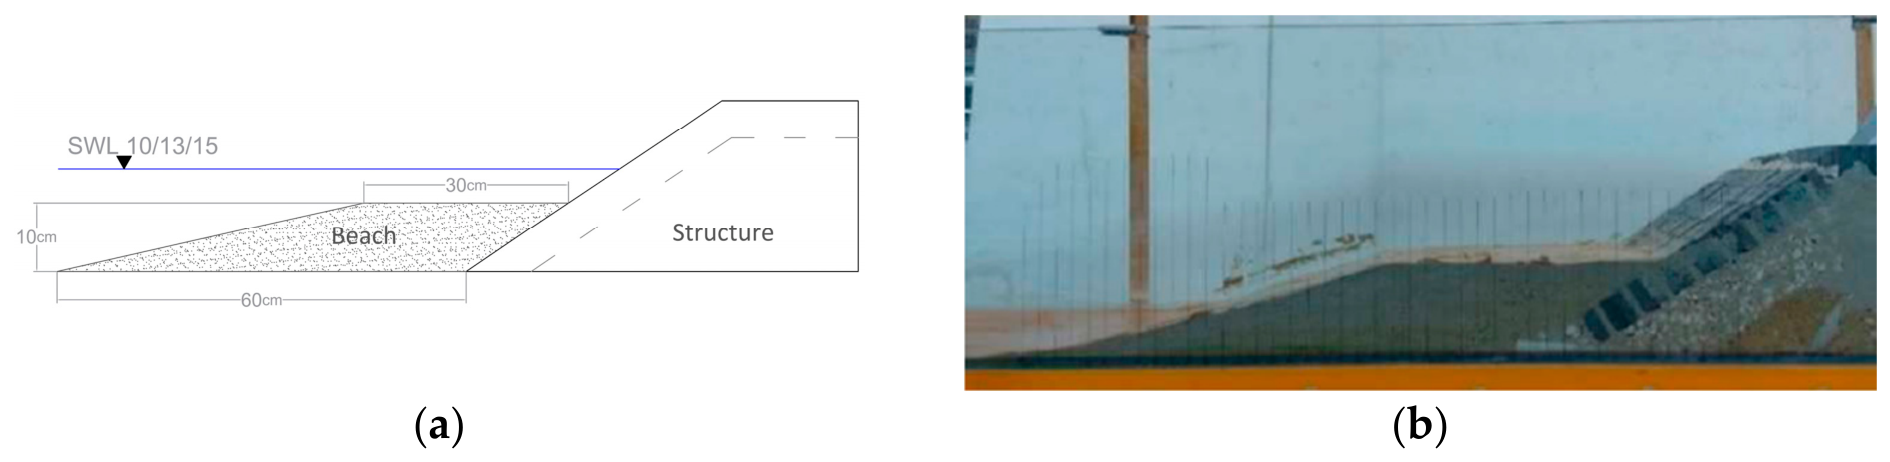
For study the morphological behavior of the beach, two similar profiles were designed, with different berm heights and widths, but considering the same amount of sand. Both were constructed with approximately 18,000 cm3 of sand, where the first profile, having a berm of 20 cm in length at the 15 cm elevation, simulates an emerged beach, and the second a submerged beach (berm width equal to 30 cm, at the 10 cm elevation). The water levels considered in the tests were 10 cm, 13 cm, and 15 cm. The diagram of the profiles and a photo of the constructed model can be seen in Figure 4 and Figure 5.
Figure 4.
Emerged beach profile S1 (MWL—mean water level of 10, 13 and 15 cm, depending on the test): (a) model section; (b) physical model.
Figure 5.
Submerged beach profile S2 (MWL—mean water level of 10, 13 and 15 cm, depending on the test): (a) model section; (b) physical model.
To record the evolution of the beach profile, a grid of vertical lines, spaced 2 cm apart, was defined where the height of the sand was measured with a millimeter scale precision, allowing the evolution of the profile shape to be recorded at each measurement instant, throughout the tests.
After preparing the laboratory setup (model, sensor, wave generator, overtopping water capture system), some preliminary tests were carried out to test the operation of all components, which allowed the definition of scenarios for various tests, presented in the following chapter.
Initially, just to evaluate the beach profile evolution and define the duration of the tests, a compromise between a quasi-stable profile and the time to perform the tests was established, not making them too long and allowing tests several different scenarios. It was verified that at the end of 6 min, the changes to the previous measurement were almost neglectable.
These preliminary test runs were carried out with a water height of 10 cm and 15 cm, with 10 cm waves high and a wave period of 3 s, with and without a beach profile in front of the coastal structure.
Through the preliminary tests, some parameters were stipulated. Therefore, wave periods of 1.5 s and 3 s were defined. Due to a large amount of water overflowing with wave periods of 3 s, this period was chosen as the maximum; and, due to the difficulty of generating waves consistently with lower wave periods, the minimum period of 1.5 s was chosen. Regarding the wave height, it was decided to use a height of 10 cm and, for the water surface levels, heights of 10 cm, 13 cm, and 15 cm were chosen. These measurements coincided with the crest elevations of the beach profiles, with 15 cm in the emerged part and 10 cm in the submerged part. The 13 cm level was chosen as an intermediate level for future comparisons. The test was extended until there were no significant changes in the beach profile, which was considered to occur after 6 min.
3.4. Tested Scenarios
After conducting the preliminary test, which served as a reference scenario, scenarios testing water surface levels and wave periods were carried out, to evaluate the behavior of the beach profile in front of the coastal protection structure. The tests were carried out over 6 min, stopping every minute to collect data on the variation of the beach profile elevations and the amount of water overtopping. Scenarios described in Table 1 were defined with surface water levels (s.w.l.s) varying between 10 cm, 13 cm, and 15 cm in height. These levels enabled testing with an emerged and a submerged sand profile, with limiting elevations coinciding with the berm of the profile. In the emerged profile, the elevation is 15 cm, while in the submerged profile, the elevation is 10 cm. These water levels also considered the generation of the desired wave height, with sufficient water height in the channel for adequate wave generation, but without an excess amount of water, which could have led to very frequent and difficult-to-quantify overtopping, due to its high volume.
Table 1.
Wave parameters model vs. prototype.
4. Numerical Model
4.1. Beach Modeling
Laboratory wave flume experiments in coastal engineering and physical oceanography are widely used to provide an improved understanding of morphodynamic processes [14]. Perfect model-prototype scaling of all hydrodynamic processes is rarely possible, though, and it is not clear how much skewed models can be used for direct morphological comparison.
Scale relationships for sediment transport and beach profile evolution are intrinsically complicated, making exact similitude between model and prototype, for both bedload and suspended load processes, very difficult. However, experimental and numerical studies have shown that distorted physical models can still provide reliable insights into morpho dynamic behavior if adequate dynamic parameters are kept [15].
The material used in the model was sand (same density as the prototype sediment, so λ_Δ = 1). The sediment scale coincides with the geometric scale:
With geometric scale λL = 40 and a moving-bottom model (undistorted moving-bottom, sand of the same material and same relative density in both the model and the prototype), the Froude/Shields densiometric similarity holds:
Therefore, the diameter in prototype is:
To further assess the morpho dynamic state and evaluate potential scale effects within the beach profile, the dimensionless Dean parameter was analyzed:
The physical model exhibited a standard settling velocity ws of 0.048 m/s. In the Froude-scaled numerical domain λL = 40, the resulting prototype gravel yielded a settling velocity of 0.65 m/s.
For the short-period wave condition (Tp,model = 1.5 s; Prototype Tp,prototype = 9.5 s), the Dean parameter shifted from a highly reflective regime in the prototype (Ωp = 0.65) to a transitional, more mobile state in the physical model (Ωm = 1.39). For the longer-period wave condition (Tp,model = 3 s; Prototype Tp,prototype = 19 s), the morphodynamic similarity improved significantly, with both scales operating within the reflective regime (Ωp = 0.32 and Ωm = 0.69, respectively).
This discrepancy stems from the non-linear scaling of the sediment fall velocity, which does not strictly conform to the Froude timescale. This represents a well-documented scale effect in coastal physical modeling when geometric sediment scaling is enforced. However, from an engineering perspective, this distortion induces conservative bias. The higher relative mobility of the sand matrix in the laboratory accelerates profile deformation and slightly overestimates sediment displacement ahead of the rubble-mound structure compared to the real-world gravel prototype. Consequently, the physical model establishes a conservative “worst-case scenario” benchmark, providing a robust and safety-oriented framework for validating the numerical model’s capability to predict toe scour and profile evolution.
The beach is modeled with sediment transport algorithm with the parameters indicated in Table 2.
Table 2.
Beach sediment characteristics.
The scaling strategy ensures a strictly non-cohesive matrix in both domains and guarantees that both the experimental sand and the upscaled gravel operate within a morpho dynamic regime dominated by bedload transport.
To accurately capture the profile evolution, the Nielsen bedload formulation was implemented. Unlike conventional steady-state equations, Nielsen’s formula accounts for flow unsteadiness, fluid acceleration, and phase lags in the swash and surf zones by linking transport rates directly to the transient bed shear stresses resolved by FLOW-3D. Furthermore, the critical Shields number is dynamically evaluated via the Soulsby–Whitehouse equation. For the gravel size, the particle boundary layer falls within the fully rough-turbulent regime, where the formulation automatically converges toward an asymptotic physical threshold. To prevent unphysical bed profiles, the Sediment Scour and Bed Load Transport module was activated. This algorithm continuously monitors the local bed slope against the critical dry and sub-merged angles of repose, triggering instantaneous gravitational mass-wasting when wave-induced toe scour at the rubble-mound structure exceeds these physical stability limits.
4.2. Governing Equation
The flow in general is described by the general Navier–Stokes equations, which are the fundamental equations for fluid dynamics, reflecting the conservation of mass and momentum. The general equation of mass conservation for incompressible fluid reads:
where ui is the cartesian component of the velocity.
The conservation of momentum establishes that the change in momentum in a control volume is equal to all the acting forces on the control volume:
where (g) is the gravity force, (p) pressure forces, and the viscous stress tensor is (τ). The momentum equations, often referred to as the Navier–Stokes equations, describe the fluid motion with full consideration of nonlinear effects.
The solution of the momentum conservation equation required constitutive equations that relate the stress tensor to the velocity field. For Newtonian fluids, shear stresses are directly proportional to velocity gradient; when the fluid is incompressible, the shear stresses read:
The basic tool required for the derivation of the RANS equations from the instantaneous Navier–Stokes equations is the Reynolds decomposition.
Imposing continuity within the flow, the following system is then solved:
where u is the time averaged velocity, ρ is the fluid density, p is the pressure, ν is the kinematic viscosity, νt is the eddy viscosity, and g is the acceleration due to gravity. Turbulence in the flow is accounted for with the RNG k-e model [18].
The eddy viscosity νt in the RANS equations is determined through the two-equation RNG k-e model, with the equations for the turbulent kinetic energy k and the specific turbulent dissipation e as follows:
Spatial derivatives are approximated in the model using advanced finite difference methods on a Cartesian grid in which the momentum fluxes are calculated explicitly, and a generalized minimum residual method (GMRES) is used for the pressures [19].
4.3. Numerical Model Setup
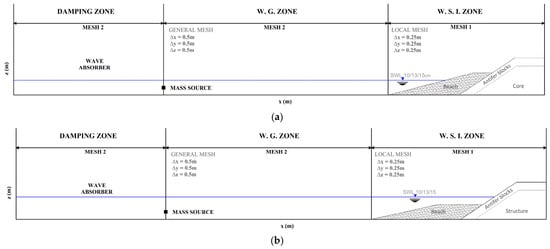
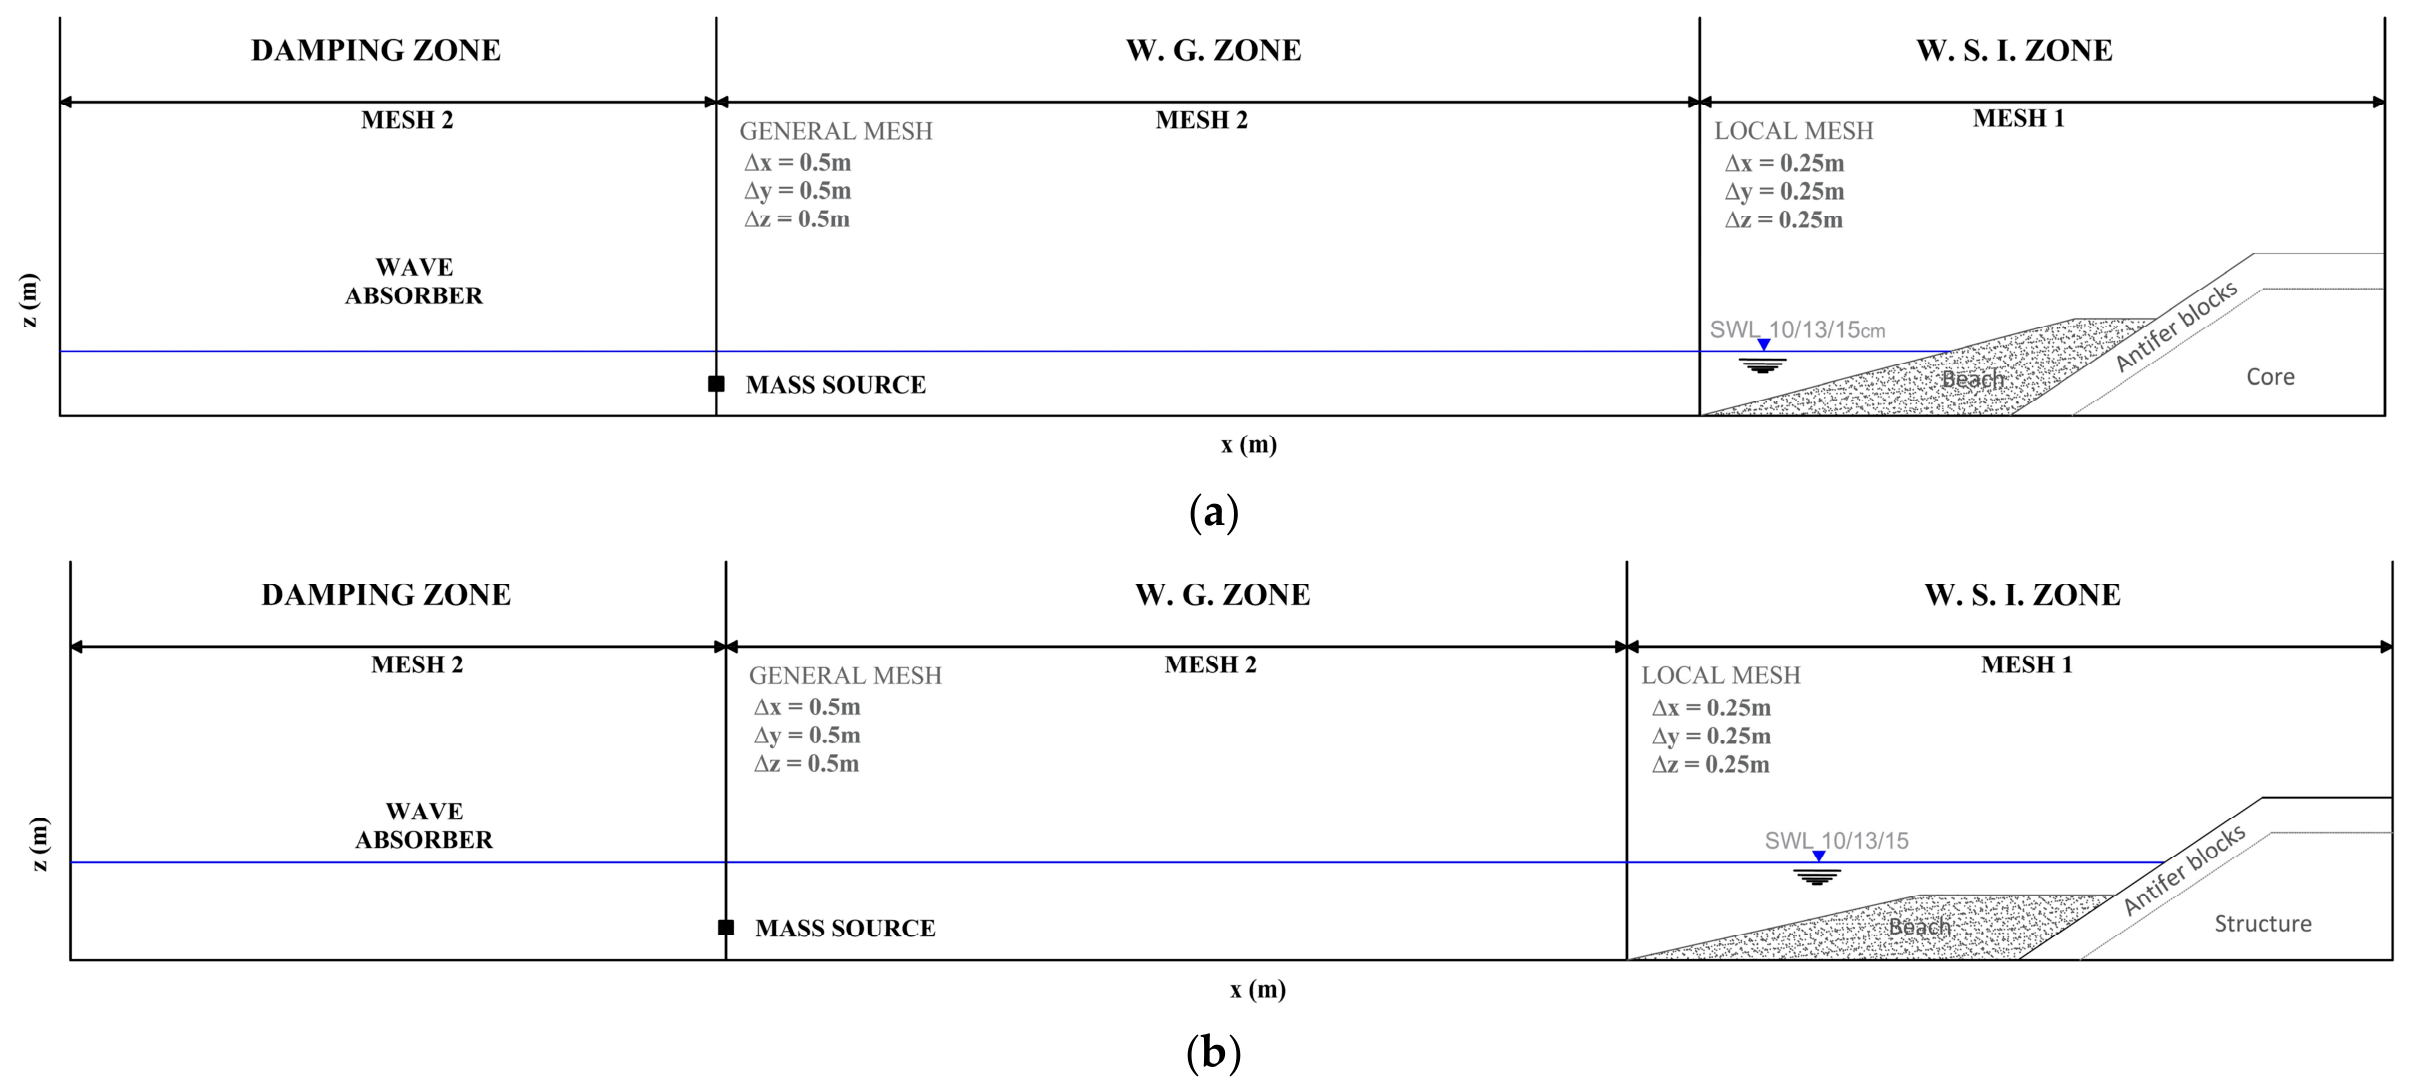
According to the experimental model scale that was developed in the laboratory, the length of the wave generation zone (W.G. zone), wave structure interaction zone (W.S.I), and wave damping zone (DAMPING zone) was 400 m in the X direction, 5 m in the Y direction, and 15 m in the Z direction, as previously discussed (Figure 6).
Figure 6.
Numerical computational domain: (a) emerged beach profile; (b) submerged beach profile.
The still water level (d) was variable; the wave structure interaction zone (W.S.I. zone) and the geometry of the structure were the same as described in the previous section, realized in prototype scale. A wave-absorber, a special geometry component properly dimensioned as a function of a wavelength, was incorporated into the numerical domain to define a damping zone. It applied damping to wave motion, despite being completely open to fluid flow. The damping coefficient in the sponge layer increased linearly from 0 to 1.0 s−1 in the direction of wave propagation. The 3D numerical domain was subjected to the boundary conditions. A condition of pressure “P” was applied to the right side, which enabled fluid to exit the flume with a specific distribution. This is essential for maintaining a consistent fluid level in the flume during long-term simulation. The waves were generated by the mass source, which converted spectral parameters into volume flow rate.
From a solid element situated beneath the still water level, random waves (Jonswap spectrum shape) were produced. In accordance with mass-source theory [20], a flow was incorporated.
where s(x,y,t) is nonzero mass-source function within the source region Ω.
The inverse Fourier transformation can reconstruct a wave train from a known energy spectrum of an irregular wave train by superposing a finite number of wave modes, from i = 1 to n:
where fi is the phase of the i-th wave mode and wi wave frequency.
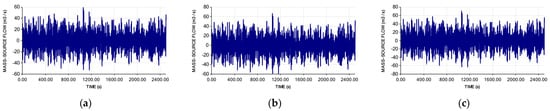
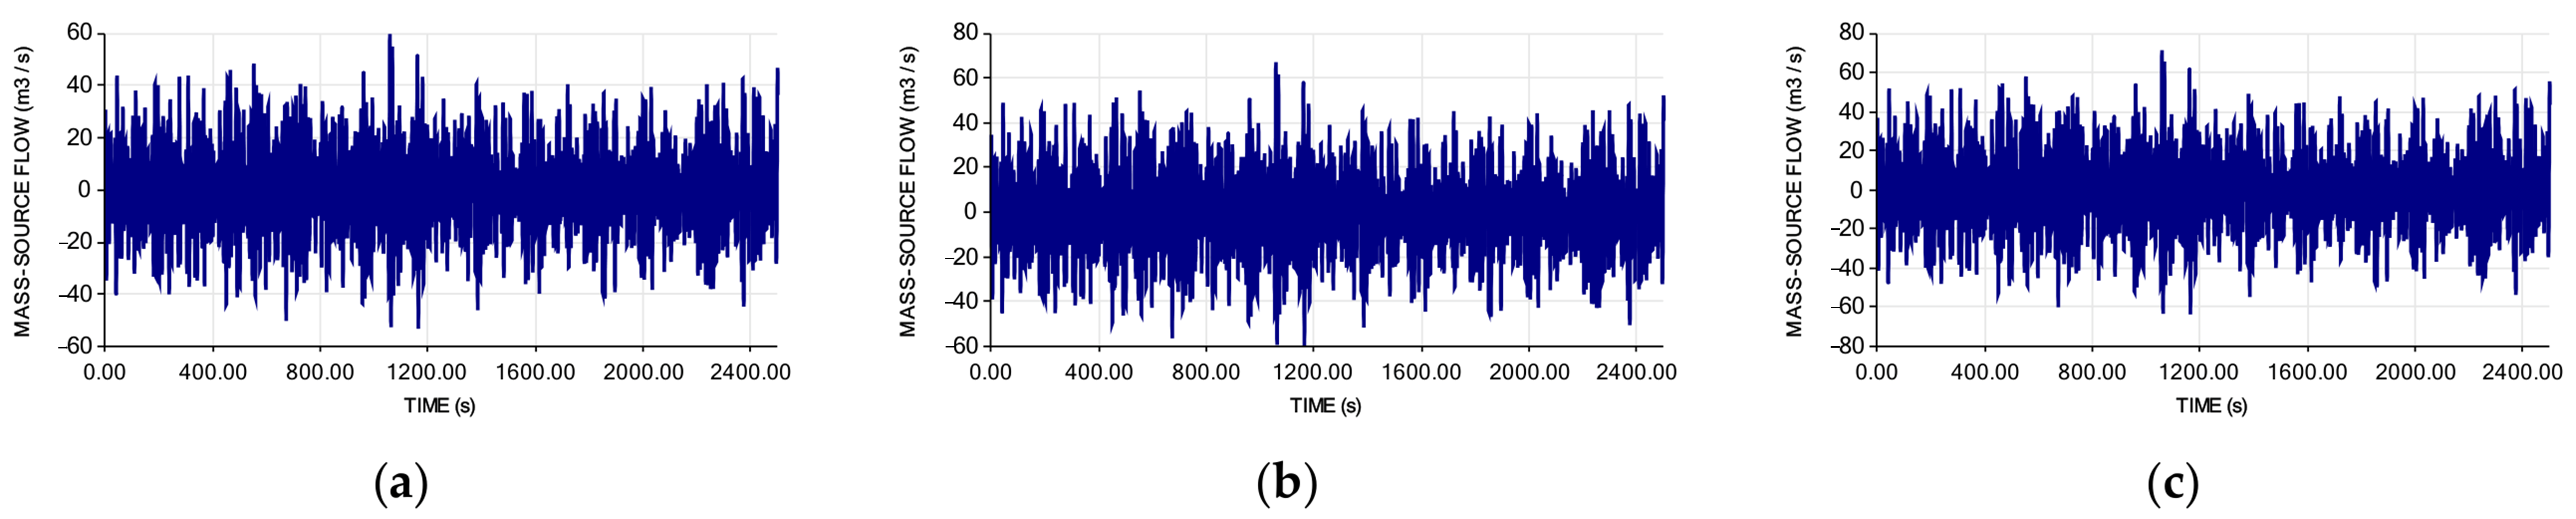
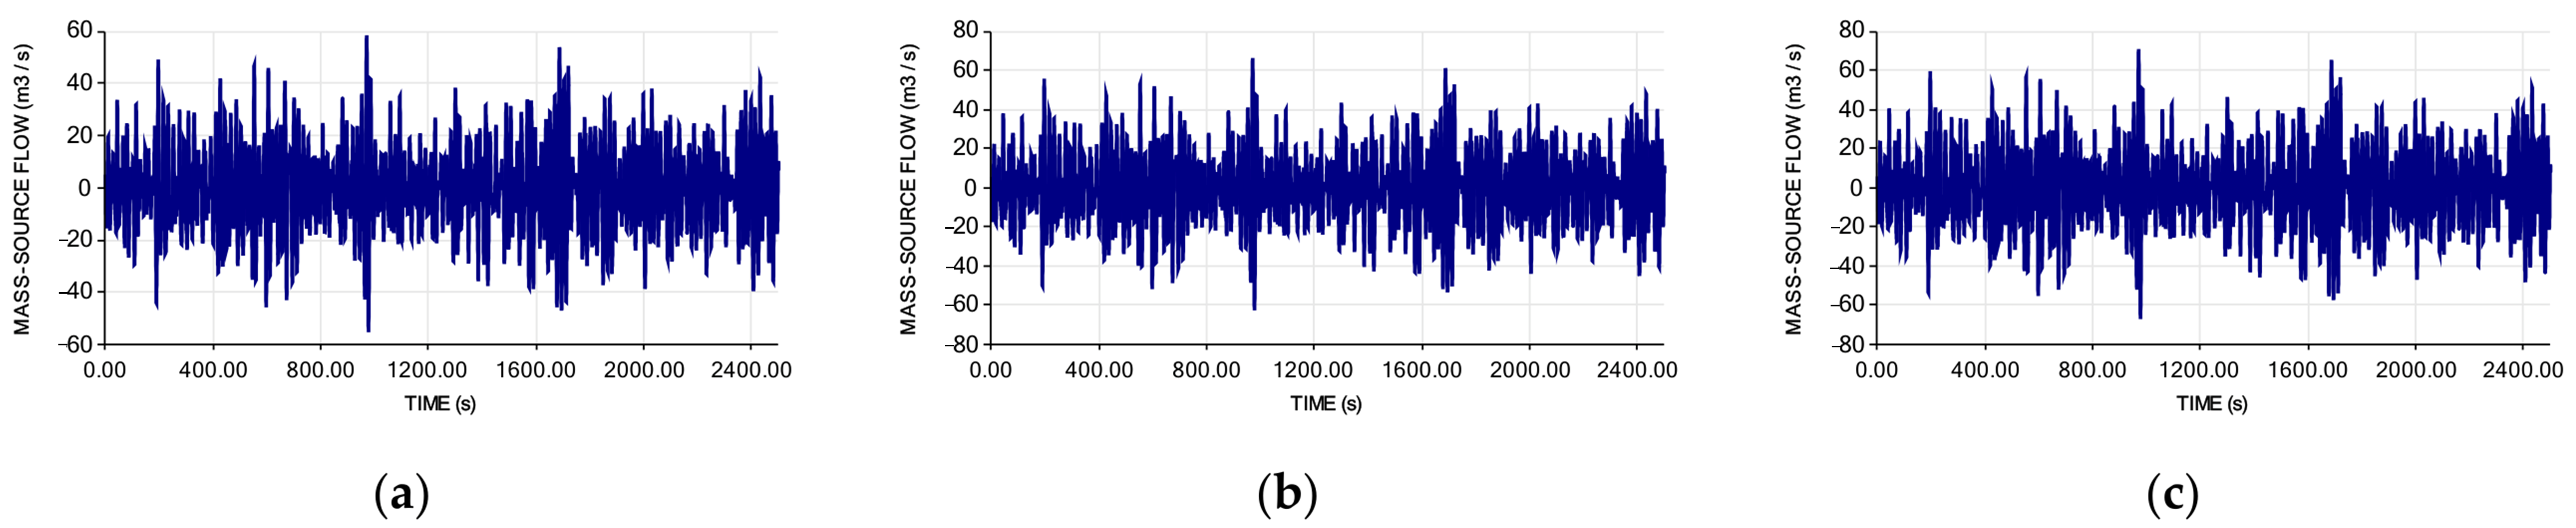
According to the wave condition described in Table 1, a mass-source volume flow rate was generated and is shown in Figure 7 and Figure 8.
Figure 7.
Numerical wave signal of mass-source for Tp = 9.50 s: (a) Test 1A; (b) Test 2A; (c) Test 3A.
Figure 8.
Numerical wave signal of mass-source for Tp = 18.97 s: (a) Test 1B; (b) Test 2B; (c) Test 3B.
At the bottom, a condition of Wall “W” was applied, and lateral and upper Symmetry “S” was selected.
Fluid properties were set by loading those of water at 20 °C through a Fluids Database. Turbulence was simulated using an RNG model and the main parameters are summarized in Table 3.
Table 3.
General Parameters settings in the numerical study.
The free surface was tracked using the volume of fluid (VOF) technique, while the RANS equations that govern the problem were resolved by Flow3D HYDRO 2024R1 [21] using a staggered grid finite difference scheme. A variable time step was implemented by the software to ensure the stability and accuracy of the solution. This technique conforms to the Courant–Friedrichs–Lewy (CFL) stability standard and ensured that surface waves were restricted to propagating no more than one cell each time step.
In accordance with the realistic prototype structure placement, the initial phase of the analysis is the definition of the rubble mound structural section, which includes concrete units and geometrical properties as outlined previously [3,5].
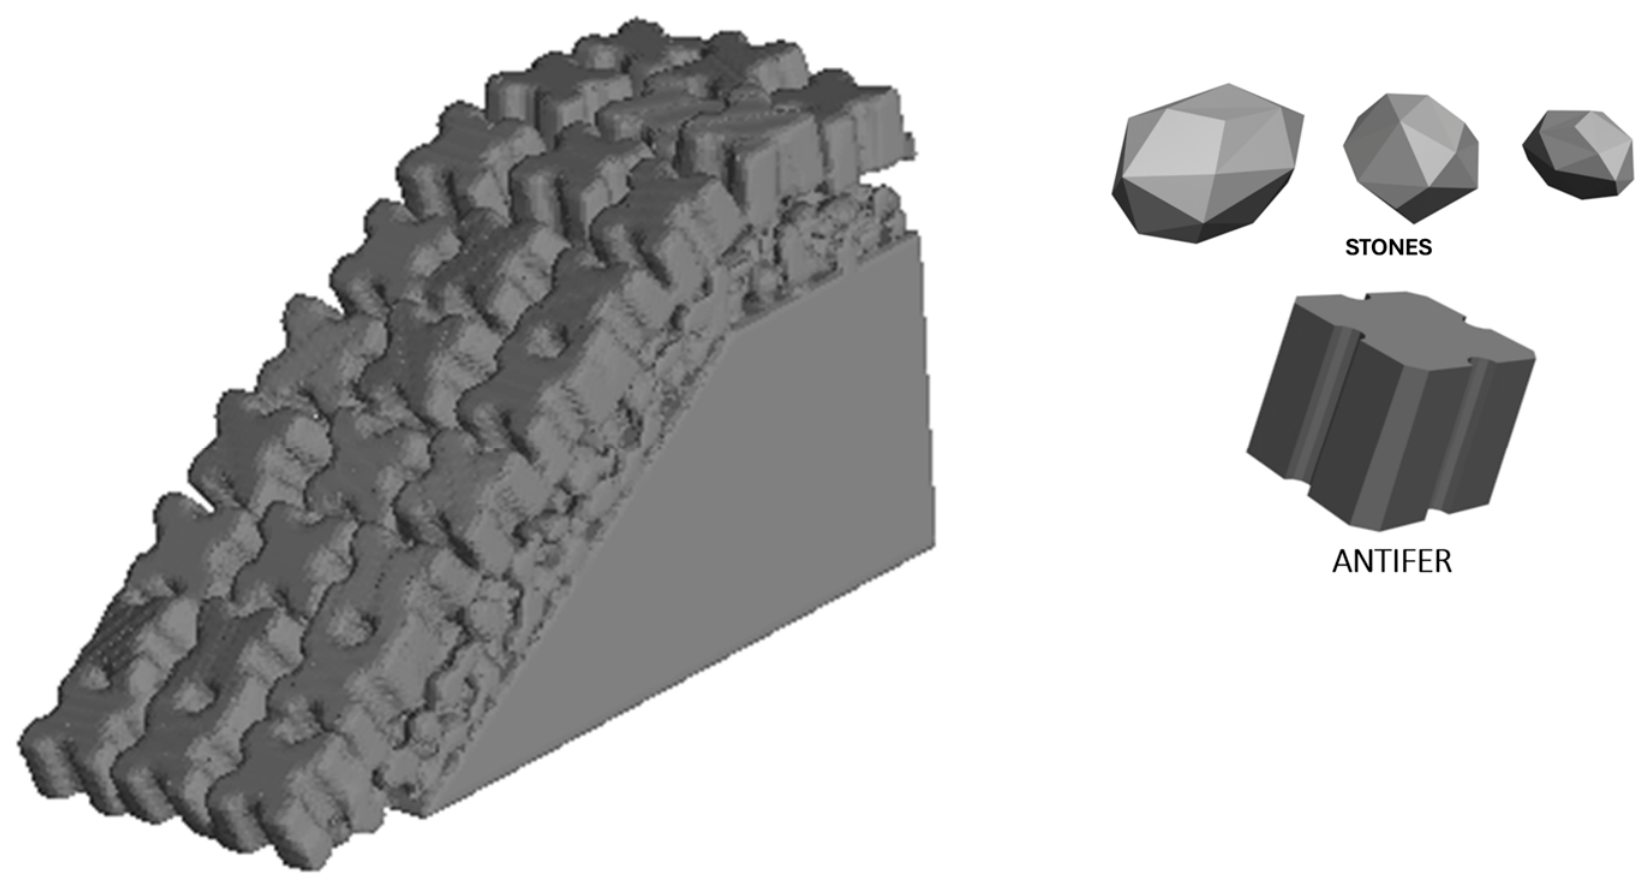
The impermeable section, which includes the core, was designed. Subsequently, a double filter layer (in virtual stones or blocks of 1000–3000 kg) was modelled on the slope facing the sea by digitally overlapping the individual elements one by one in accordance with real geometry (Figure 9).
Figure 9.
3Dimensional virtual structures.
The description of the coastal structure was then finished by inserting a single Antifer armor layer, using with the same digital technique.
The numerical flume was set up at full scale and reproduced both the structure and foreshore without distortion; the foreshore was modeled via the sediment transport model according to the characteristics previously discussed.
After the geometry was completely specified, it was transferred into the CFD software to assess the hydrodynamic interactions. This was achieved through the special features of Flow3D HYDRO 2024R1 [21], including the FAVOR™ (Fractional Area Volume Obstacle Representation) technique, which facilitates the delineation of intricate geometric areas within rectangular grids and multi-block meshing. The FAVORTM method is a highly effective approach for incorporating geometry effects into the governing equations. The methodology and use of computational fluid dynamics (CFD) for coastal engineering investigation are well documented in the literature [22].
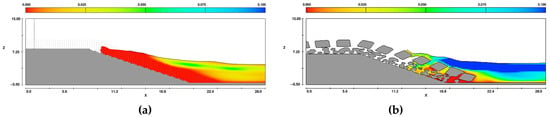
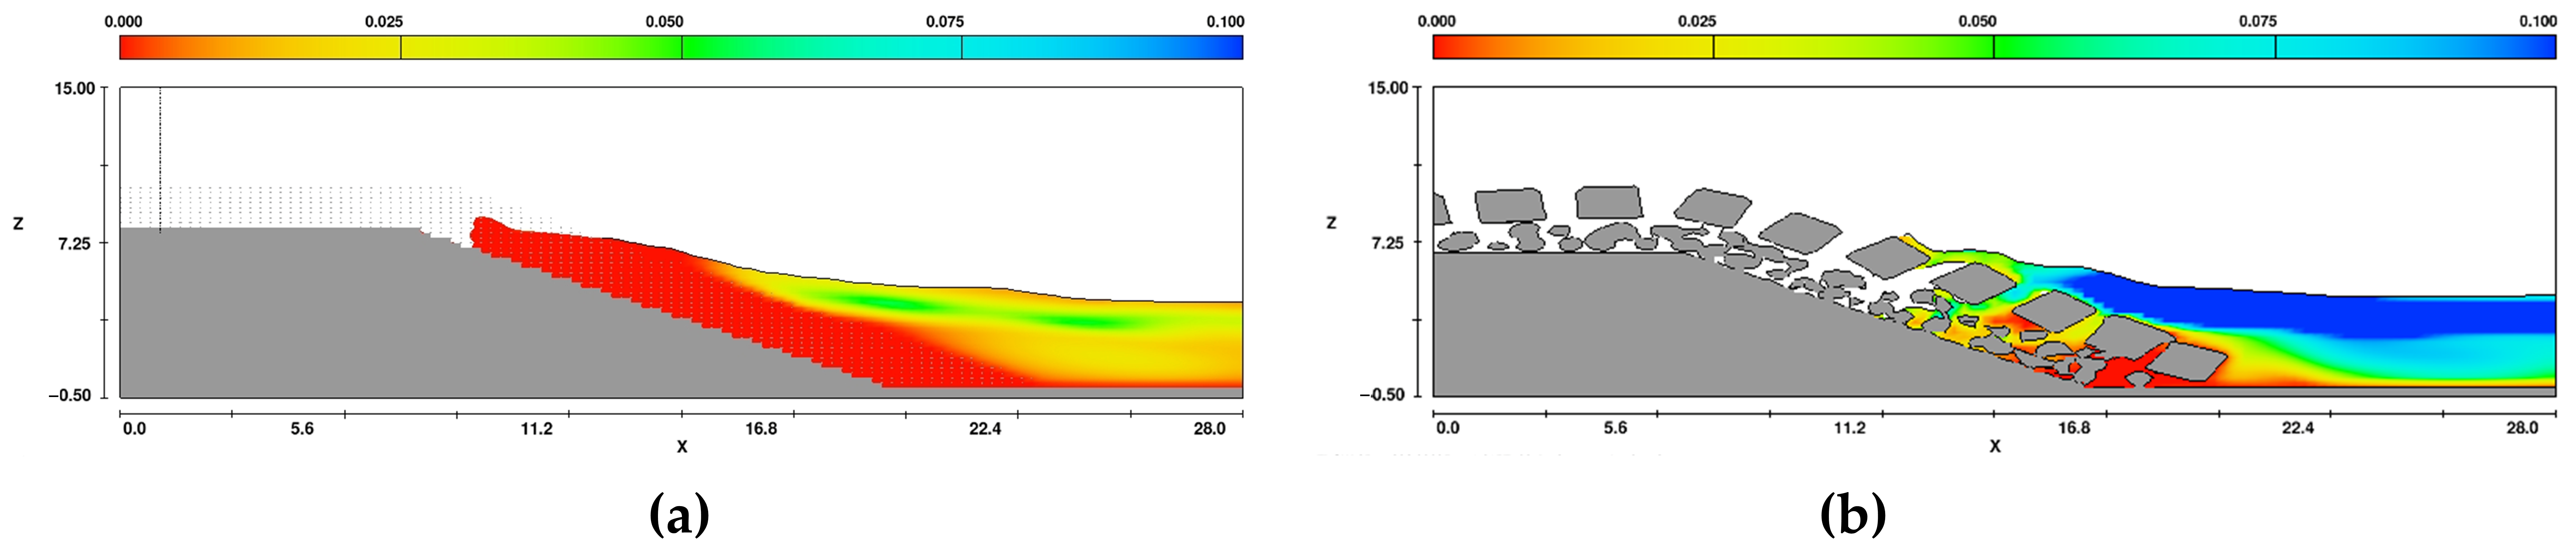
The reliability of these models depends heavily on a complex calibration process. In general, however, the porous medium model remains ill-suited for capturing the complex turbulent phenomena that occur within the armor layer. As illustrated in Figure 10, this innovative approach overcomes the limitations of the classic porous media numerical models.
Figure 10.
Turbulent energy comparison: porous media model (a) versus realistic 3D reconstruction (b).
As shown in Figure 10, the high Reynolds number motion inside the block interstitial paths generates turbulent kinetic energy that governs wave profile evolution at the breakwater. Consequently, the resulting wave shape deviates from the classic profile predicted by the ‘porous media’ model, which inherently fails to resolve turbulence within permeable layers.
The computational domain illustrated in Figure 6 is divided into two sub-domains with different grid sizes, selected after the grid sensitivity study performed on mesh 1.
Three uniform grids were implemented, ∆x = ∆y = ∆z = 0.35 m, ∆x = ∆y = ∆z = 0.25 m, ∆x = ∆y = ∆z = 0.15 m.
The grid sensitivity analysis was carried out in FLOW-3D by comparing the results obtained with a wider and a finer grid. The comparison was based on the wave overtopping signal and on the wave parameters Hs and Tp, computed from the free-surface elevation at the toe of the structure. Two indicators were evaluated.
- The relative error from the wider to the finer grid is articulated as follows:
- 2.
- The wave overtopping signals at the toe of the structure exhibit a square correlation:
Table 4, Table 5 and Table 6 provide a summary of the analysis’ findings, which confirm the significant coherence between the grids of 0.25 m × 0.25 m × 0.25 m and 0.15 m × 0.15 m × 0.15 m (R2 is approximately 99%).
Table 4.
Grid sensitivity study indicator Hs.
Table 5.
Grid sensitivity study indicator Tp.
Table 6.
Grid sensitivity study indicator Ovvol.
As a result, the local mesh size (mesh 1, on the beach and breakwater) was determined to be ∆x = ∆y = ∆z = 0.25 m. The general mesh size (mesh2) for all computations was selected to be 0.50 × 0.50 × 0.50 m3. This decision enabled the reduction of the total number of cells, thereby saving computational time, while maintaining an adequate vertical resolution in the wave generation zone and along the structure. The calibration of the numerical wave flume in FLOW-3D was carried out using a target-matching approach based on the laboratory free surface time-history data. The experimental water level variations hlab(t) were transformed into wave energy density spectra via fast Fourier transform (FFT) analysis. An internal mass source function was then iteratively calibrated in the numerical domain until the generated wave spectra at the toe of the structure achieved an optimal fit with the laboratory benchmarks. To ensure hydrodynamic equivalence, the stationary spectral wave statistics were verified.
5. Results
This section details the results concerning the interaction between beach morphology and wave overtopping dynamics, focusing on the comparison between numerical and experimental data. It first describes the morphological changes, validating the simulated cross-section deformations against experimental data. Then, it examines how water depth variations interact with evolved profiles and berm configurations, comparing the numerical overtopping rates directly with laboratory measurements.
5.1. Evolution of Beach Profiles
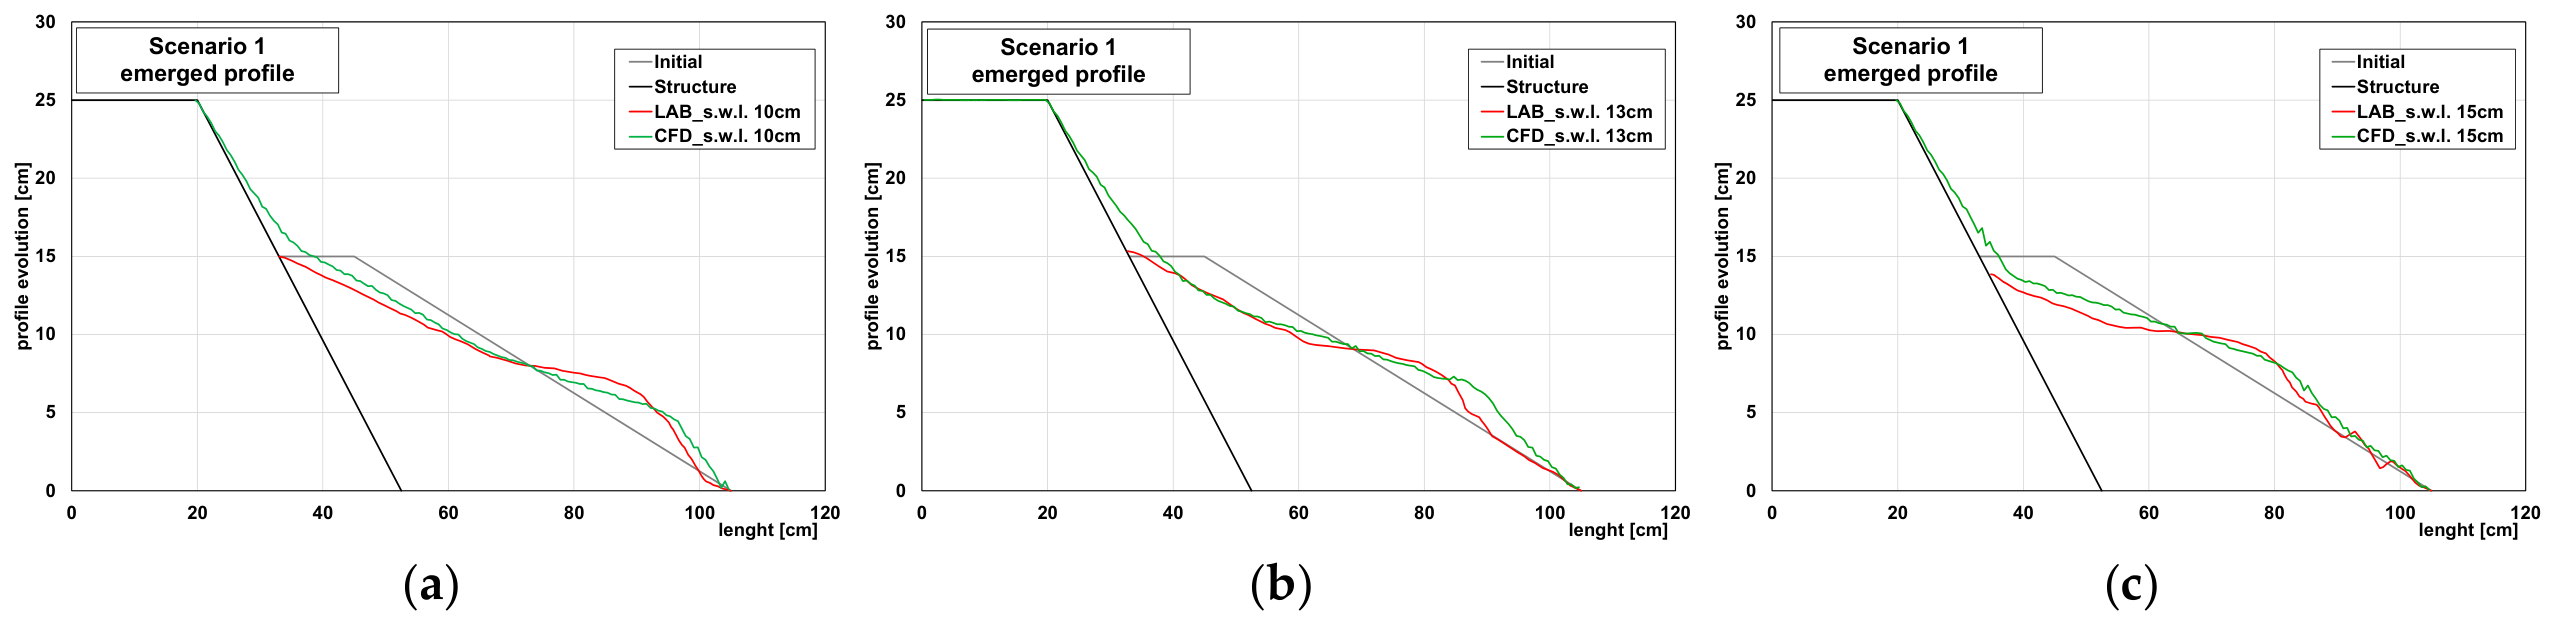
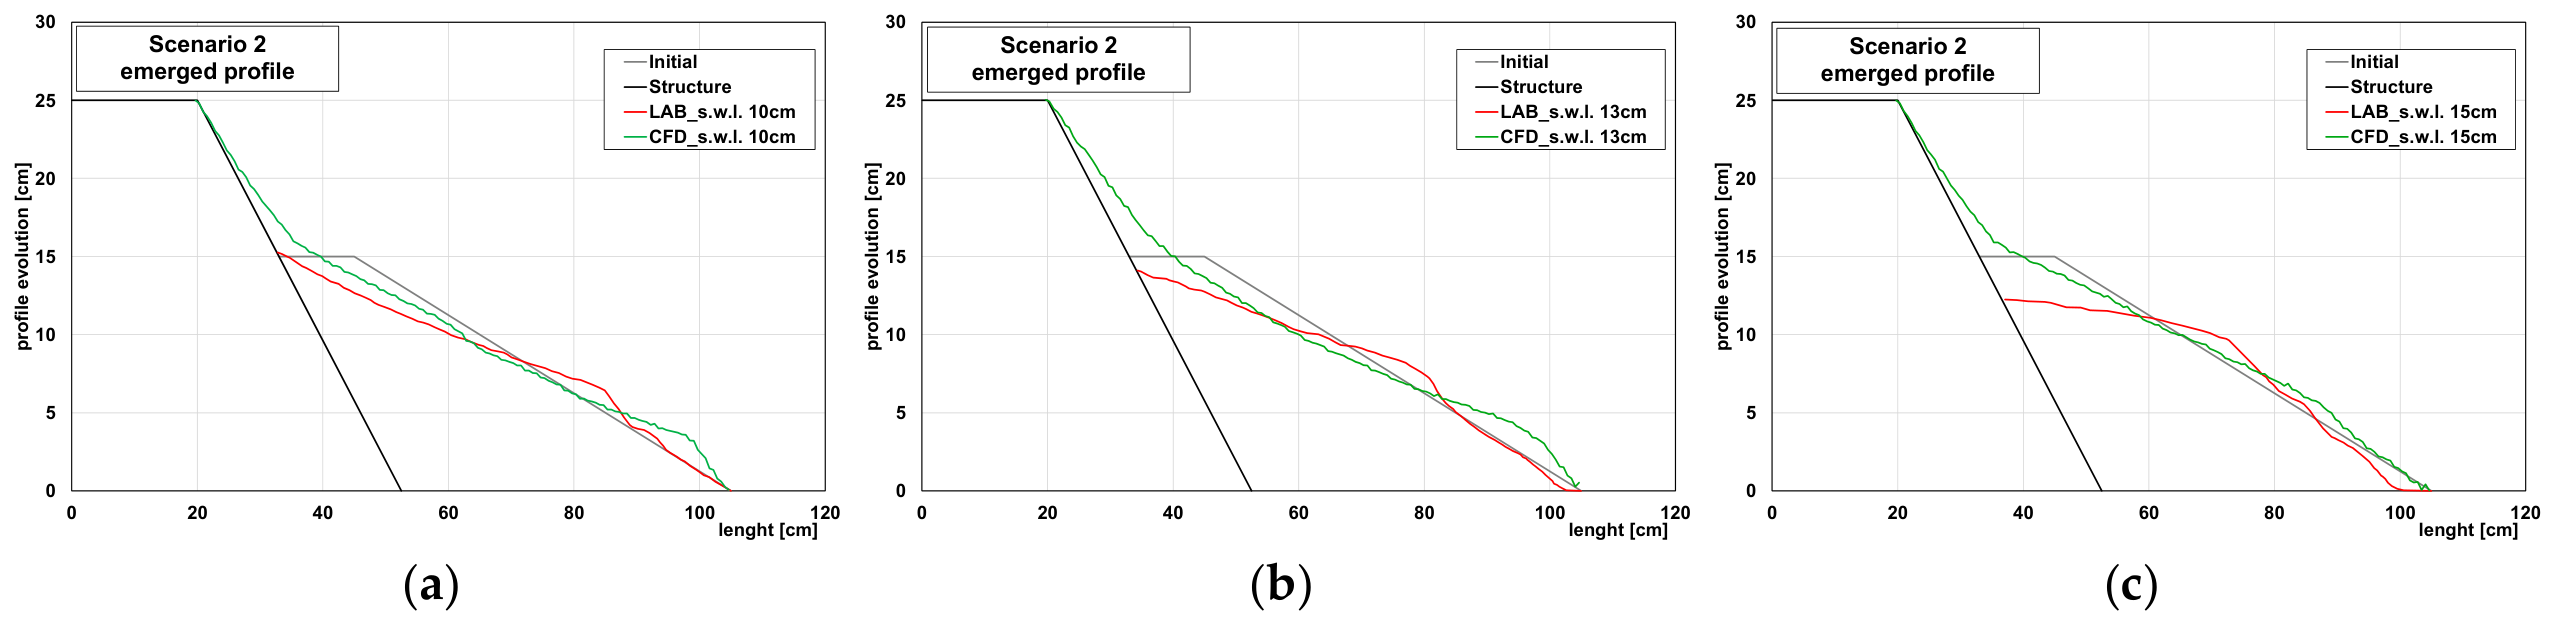
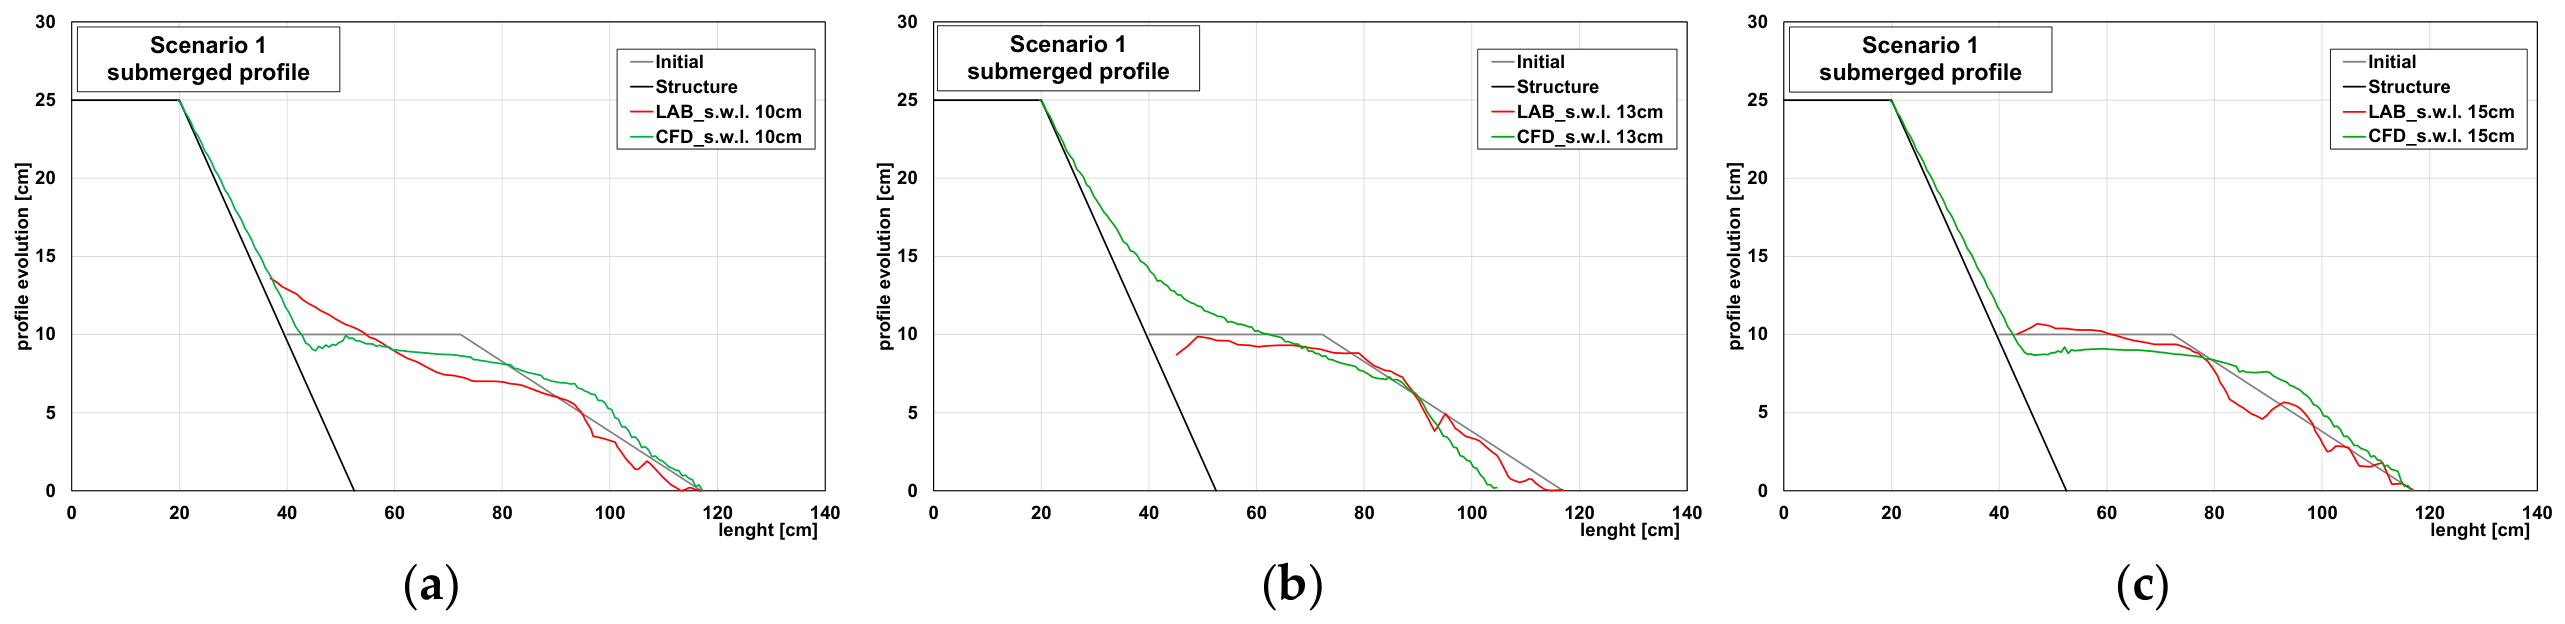
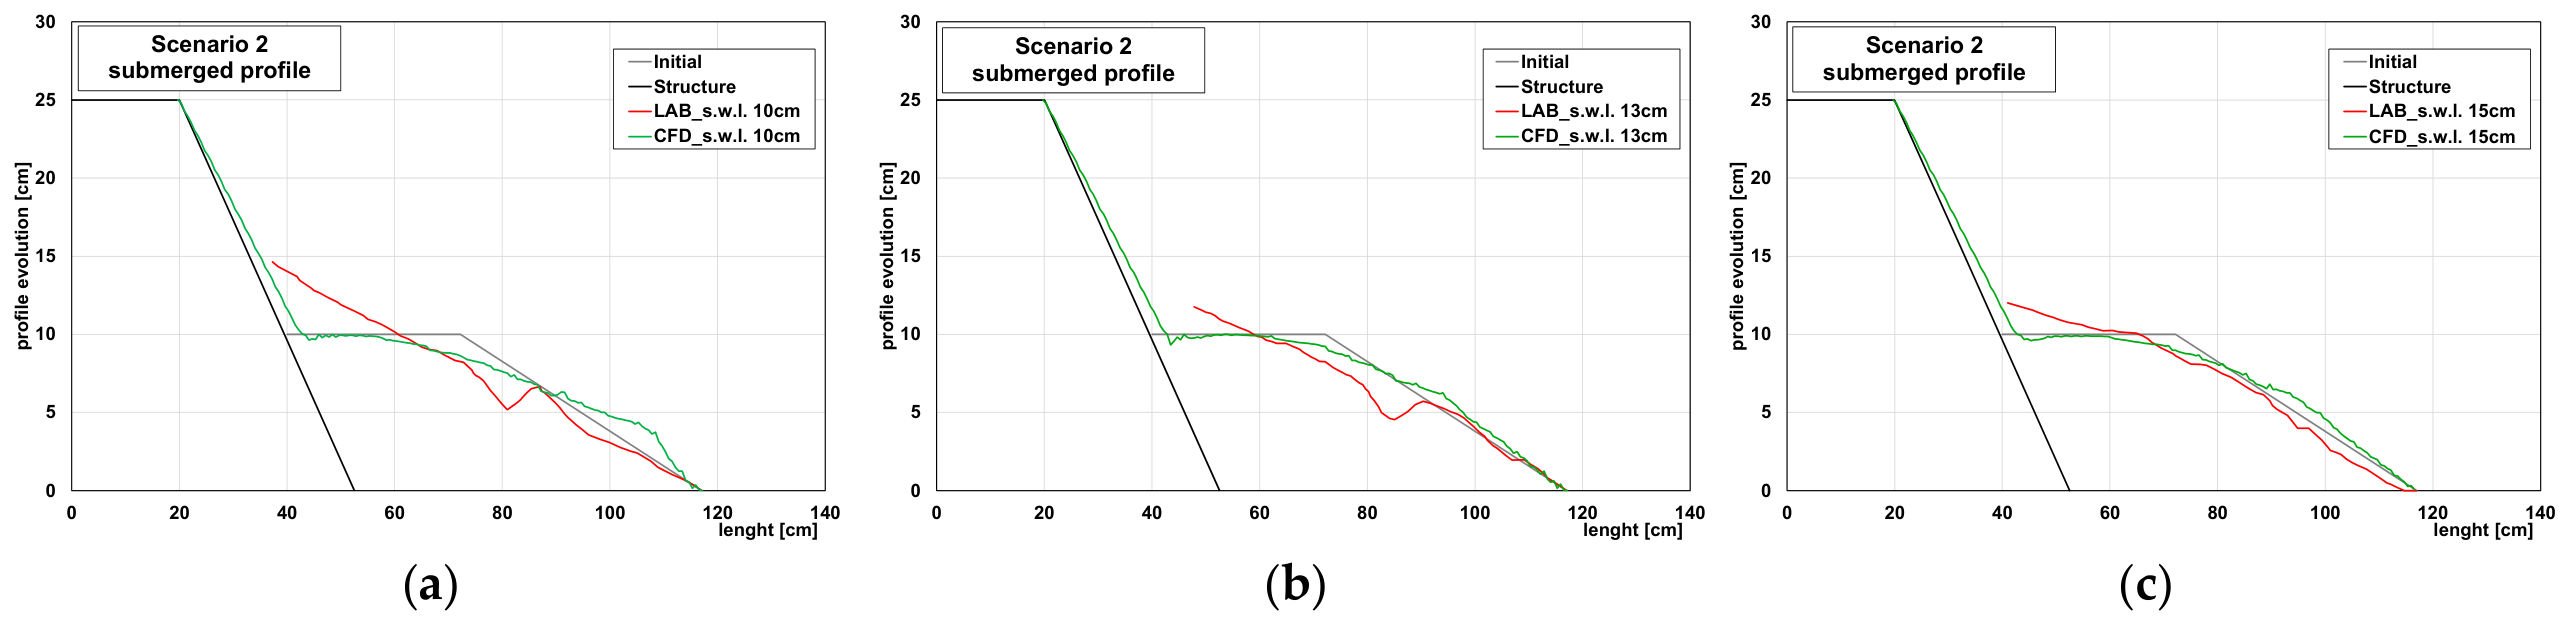
The beach profiles exhibited morphological modifications during the tests. As the waves impacted the coastal defense structure, the profile evolved, with lowering and/or rising elevations along its length. However, differences were recorded between the two profile situations (emerged and submerged). Differences also related to the water level, which allowed the characterization of some behaviors. The evolution of the profile shape over the time of the tests can be observed in Figure 11, Figure 12, Figure 13 and Figure 14.
Figure 11.
Final shape of the emerged beach profile, for different water surface levels and wave period 1.5 s: (a) Test 1A; (b) Test 2A; (c) Test 3A.
Figure 12.
Final shape of the emerged beach profile, for different water surface levels and wave period 3 s: (a) Test 1B; (b) Test 2B; (c) Test 3B.
Figure 13.
Final shape of the submerged beach profile, for different water surface levels and wave period 1.5 s: (a) Test 1A; (b) Test 2A; (c) Test 3A.
Figure 14.
Final shape of the submerged beach profile, for different water surface levels and wave period 3 s: (a) Test 1B; (b) Test 2B; (c) Test 3B.
The maximum change in elevation along the profile, in both the zones subject to erosion and those subject to accumulation, tended to stabilize over time. Regarding the subaerial profile, for both wave periods (1.5 s and 3 s), the test showing the greatest drop in elevation was the one with a water level of 15 cm. In tests with lower water levels (10 cm and 13 cm), the waves propagated along the beach profile slope, losing energy and mobilizing less sand during backwash processes. Increases in elevation relative to the initial level occurred where submerged bars formed. At these locations, sand from higher elevations was transported toward the middle sections of the slope, corresponding to the wave-breaking point (Figure 11 and Figure 12).
As with the subaerial profile, the maximum elevation changes in the submerged profile also tended to stabilize over time (Figure 13 and Figure 14). The test showing the greatest reduction in elevation was the one with a water level of 10 cm.
In this case, as with the subaerial profile, the elevation of the beach edge coincided with the water level, facilitating sand mobilization. For the tests with the other water levels (13 cm and 15 cm), since the profile was submerged, the waves did not impact the beach profile directly; upon striking the structure, they mobilized less sand transport through wave run-down and backwash. The greatest increases in elevation were observed near the structure, where sand transported by the wave run-down was deposited.
To provide a rigorous quantitative evaluation of the morphodynamic model, the root mean square error (RMSE) and the Brier skill score (BSS) were computed for the final bed profiles (Table 7).
Table 7.
Statistical indicators (RMSE and BSS) for the validation of the simulated final beach profiles.
The model demonstrated high predictive skill for the emerged beach configurations, particularly under Scenario 1 (Emerged), where BSS values ranged between 0.45 and 0.78, falling into the ‘good’ to ‘excellent’ performance categories.
On the other hand, the submerged beach profiles exhibited lower performance, with higher RMSE values and negative BSS values (e.g., Scenario 1 submerged). This discrepancy is primarily attributed to the high sensitivity of the BSS metric to minor phase or spatial shifts in the localized positioning of submerged bars and troughs, which are inherently complex to capture due to highly non-linear undertow currents and wave-breaking dynamics, even when the overall cross-shore volumetric trends are qualitatively reproduced.
These results demonstrate the physical limits of applying direct Froude scaling to beach sediments in CFD models. While the approach remains highly robust and computationally efficient under moderate or bedload dominated conditions (Scenario 1), it induces severe predictive saturation under long-period, suspension-dominated regimes (Scenario 2). Future works aiming to resolve this limitation should consider decoupling the hydrodynamic mesh from the sediment boundary by introducing an artificial calibration factor to lower the critical Shields parameter, or by activating a porous media module to account for the physical infiltration that naturally dampens the backwash acceleration over actual gravel beds.
5.2. Influence on Sea Water Level on Wave Overtopping
The sea water level (SWL) plays a pivotal role in governing wave overtopping dynamics, acting in combination with the morphodynamic features of coastal defenses [23,24]. This section provides a comprehensive analysis of overtopping behavior by simultaneously accounting for fluctuations in water depth and the configuration of the profile, specifically focusing on the presence of emerged and submerged berms. These components jointly affect both the relative freeboard and the processes of wave transformation into shallow water conditions.
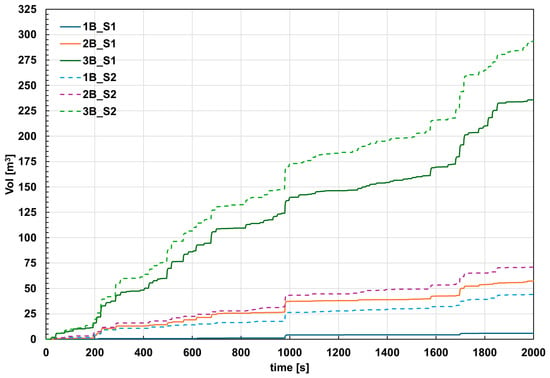
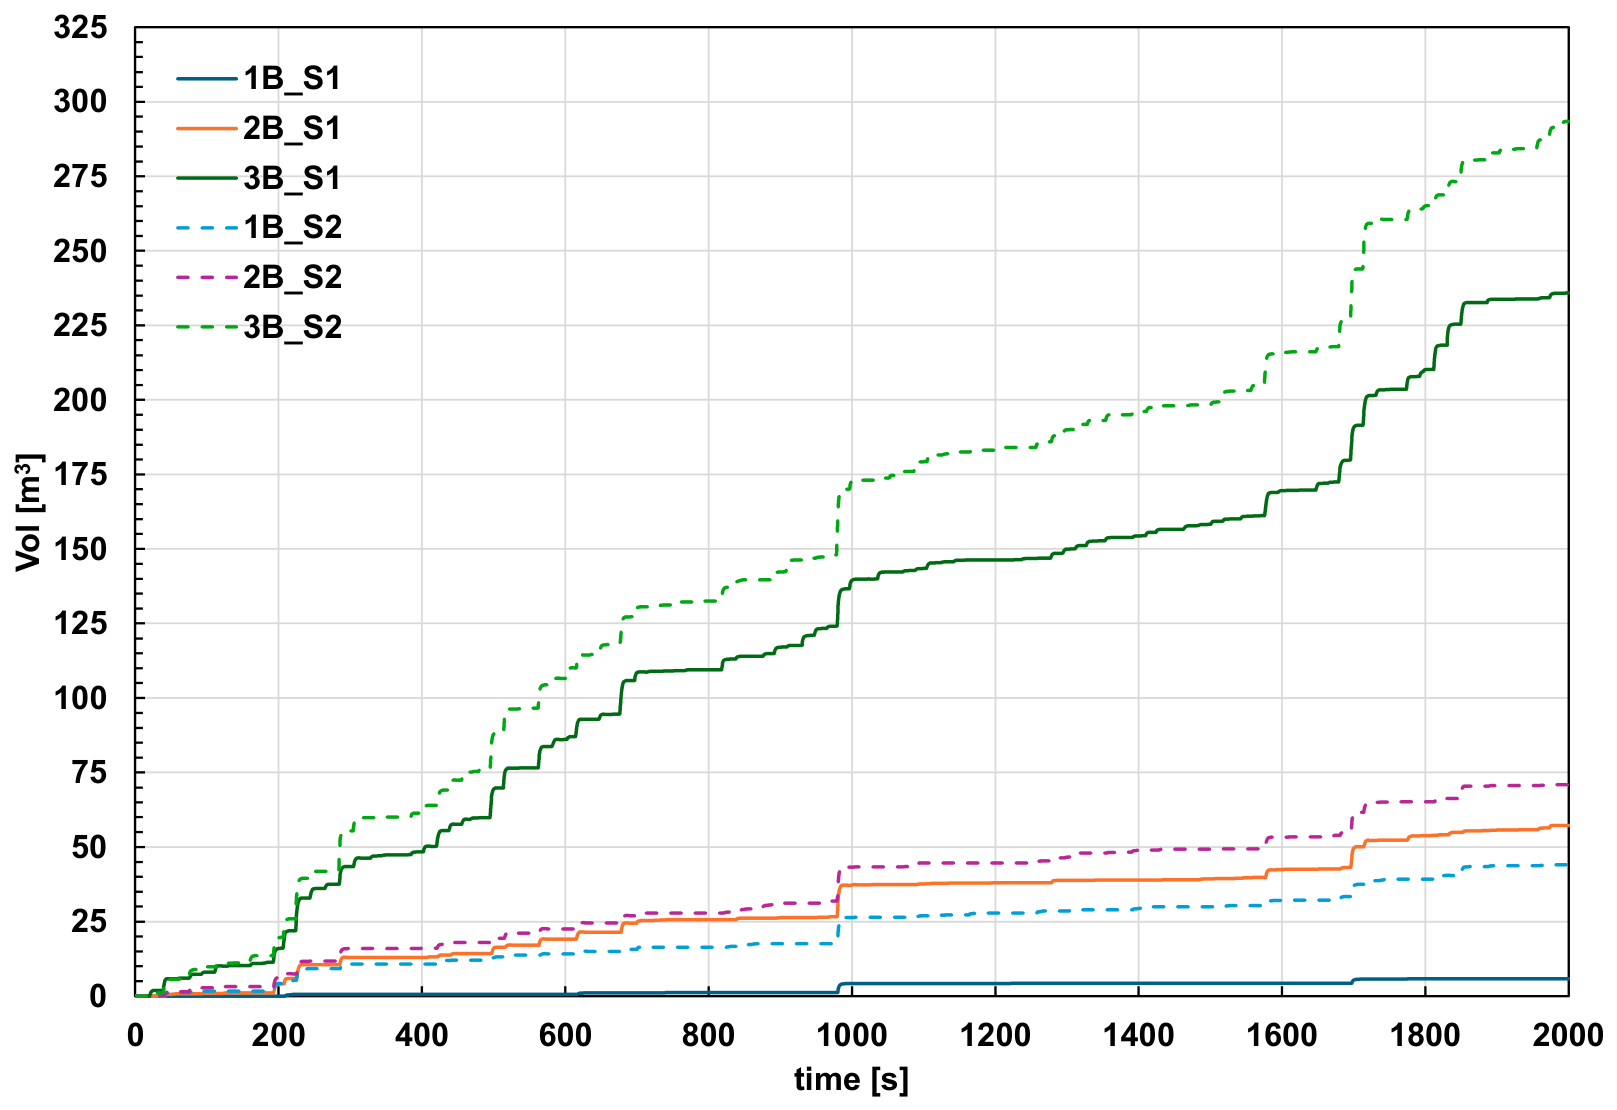
The volume flow rate measured on the crest of the structure was acquired; then, the curves of cumulative overtopping volume for different geometric and wave conditions were compared (Figure 15). The software computed the overtopping time series q(t) by extracting the volume flow rate (fluid fraction times area times velocity) at a face of the flux surface. Flux surfaces are a special subset of baffles that are used to measure quantities that flow through them.
Figure 15.
Numerical results of wave overtopping volume.
It should be noted that, since the SWL was varied with a fixed crest elevation, changes in Rc were accompanied by changes in local water depth h_toe. With the present dataset, the two effects cannot be separated quantitatively; the results should therefore be interpreted as the combined effect of both parameters. A systematic investigation of their individual contributions is left to future work.
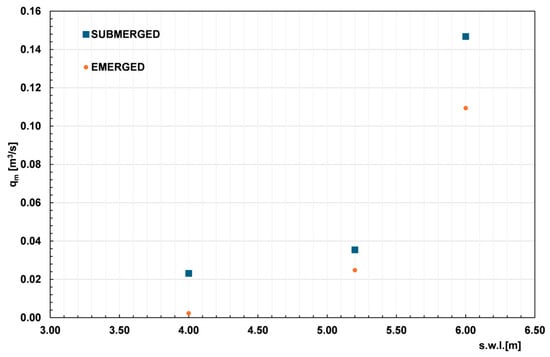
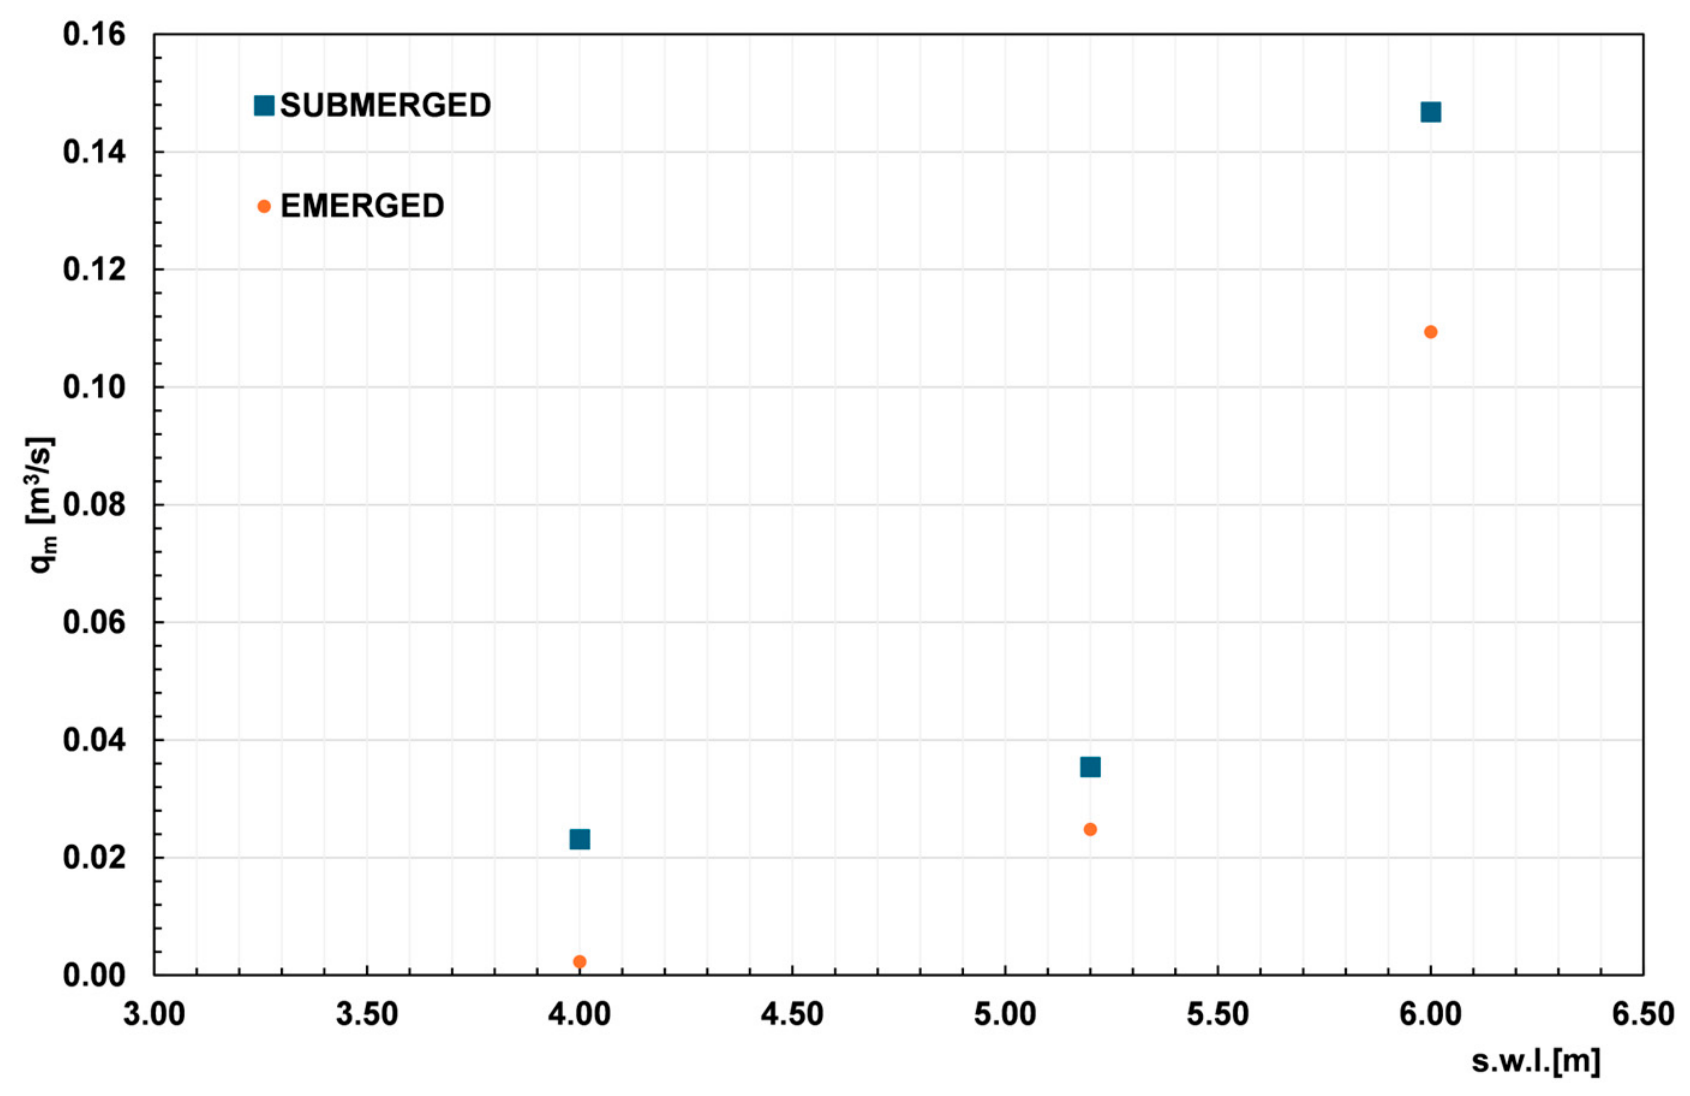
To illustrate the high sensitivity of the mean overtopping discharge to variations in the still water level (SWL), which directly dictates the crest freeboard Rc, the Figure 16 and Table 8 presents the computed values of qm across the different water levels simulated in the numerical domain.
Figure 16.
Numerical results of mean overtopping discharge.
Table 8.
Numerical results of wave overtopping.
The mean overtopping discharge increased with the still water level (s.w.l.), for both morphological configurations investigated (emerged and submerged profile), following an exponential trend consistent with the classical formulations adopted in the literature for overtopping discharge estimation [1].
At the lower water levels tested (s.w.l. = 4.00–5.20 m), the submerged profile showed systematically higher wave overtopping values than the emerged one, indicating a lower dissipative capacity of the submerged structure at equal water level.
The emerged profile, despite negligible discharge values at the lowest levels (consistent with the absence of significant overtopping while freeboard is sufficient), exhibited a markedly steeper exponential growth rate (b = 1.93 vs. b = 0.88 for the submerged case). This led to a rapid convergence of the two regimes as the water level increased, reaching comparable q_m values at s.w.l. = 6.00 m.
This behavior is physically consistent; once a critical freeboard is exceeded, the emerged profile rapidly loses its dissipative/attenuating function, resulting in a sharp increase in overtopping discharge.
5.3. Validation Against Laboratory Data (Lab–CFD Comparison)
The comparison between CFD simulations and laboratory measurements allows an assessment of the numerical model’s reliability in predicting mean overtopping discharge for both morphological configurations.
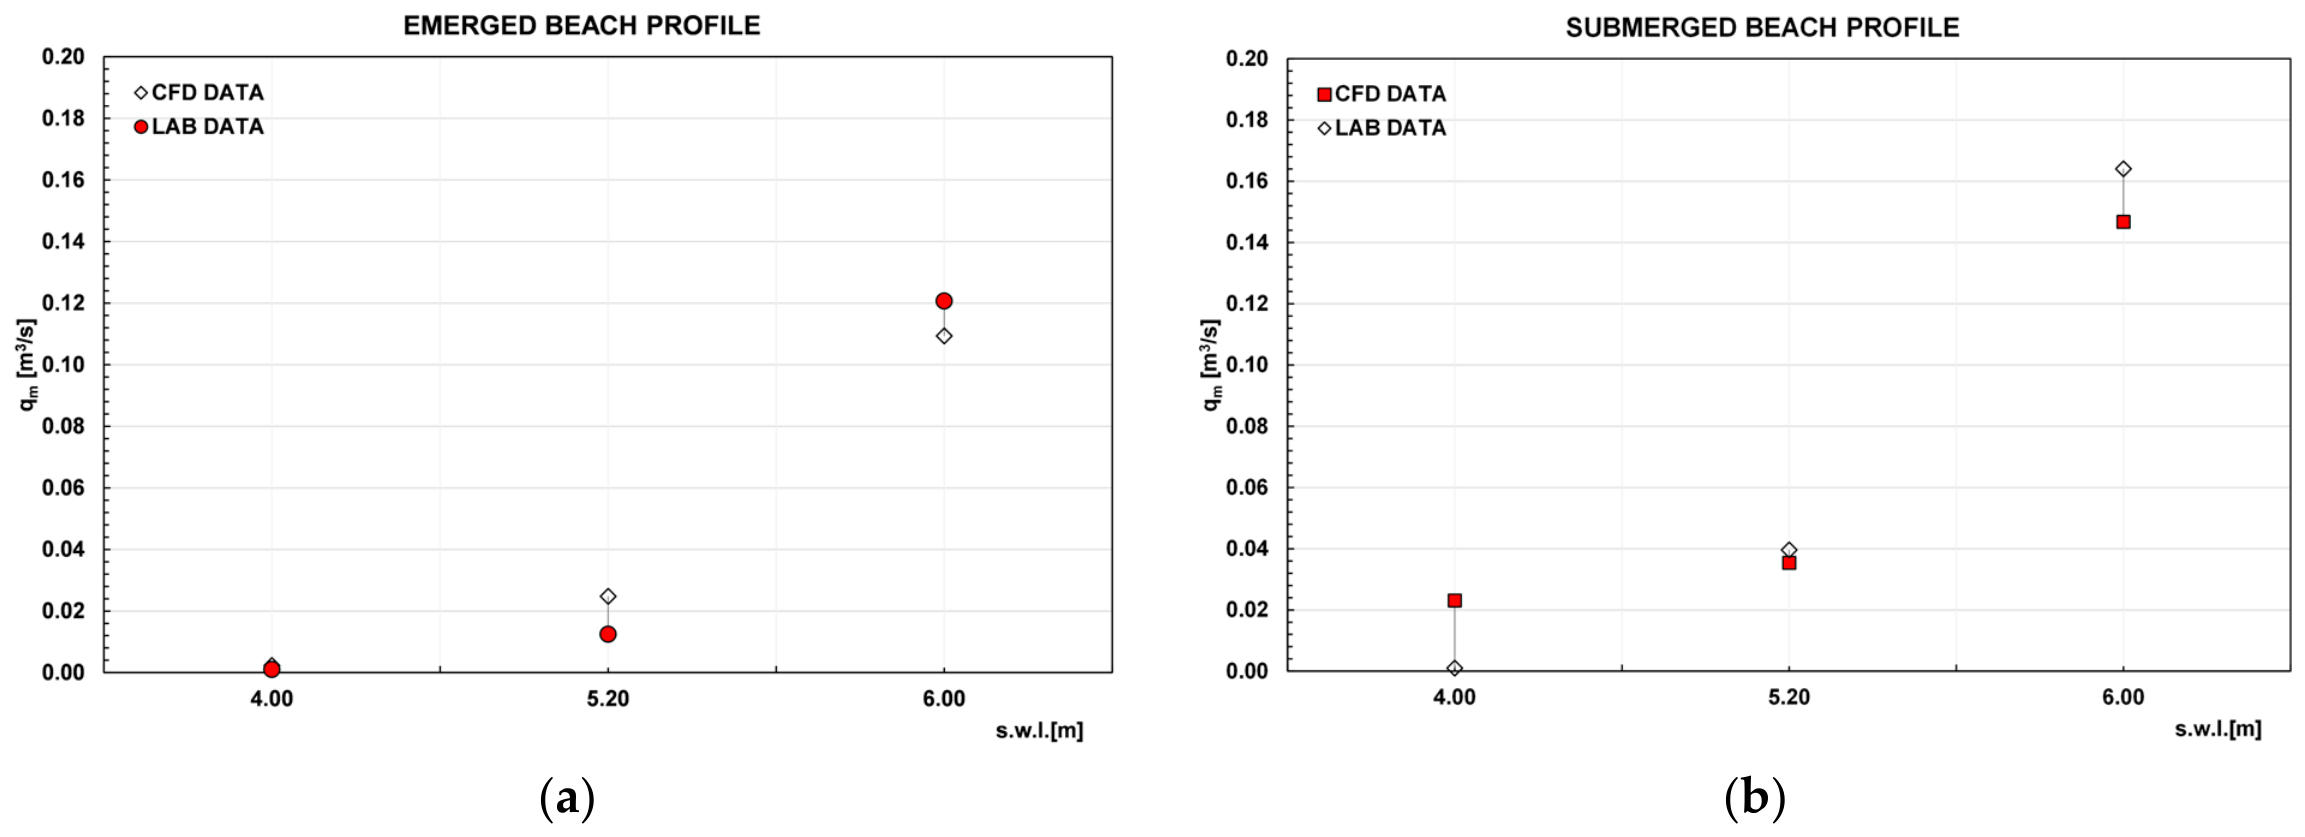
The comparison between the numerical model (CFD) and experimental data (LAB) shows a consistent non-linear increase in the overtopping rate as the still water level rises, confirming that the CFD model successfully captures the overall physical trend for both beach configurations. For the emerged beach profile (Figure 17a), a negligible overtopping rate was observed at s.w.l. = 4.00 m in both datasets. However, at the intermediate level, the CFD model significantly overestimated the experimental baseline, suggesting a potential underestimation of wave energy dissipation during initial overtopping stages. At the highest level (6.00 m), the model showed excellent convergence, slightly underestimating the laboratory data by 9.4%. Conversely, for the submerged beach profile (Figure 17b), the CFD model tended to underestimate the overtopping rate at higher water levels, with a remarkably stable and contained percentage error of 12.5% at 5.20 m and 10.4% at 6.00 m. The only notable discrepancy occurred at 4.00 m, where the numerical model predicted a minor residual overtopping rate while the laboratory registered a null value. Within higher water level regimes, the numerical model demonstrated reasonable reliability and robustness, maintaining errors near 10%. The most significant discrepancies, however, were restricted to lower water levels and transition phases. The most significant discrepancies were confined to lower water levels and transition phases, which are inherently challenging to simulate due to wetting-and-drying numerical thresholds and bottom friction dynamics.
These deviations are associated with the very low overtopping regime, in which the mean discharge depends on few extreme events and is sensitive to simulation duration and mesh resolution, and the laboratory measurements are affected by large relative uncertainty. Based on these preliminary findings, the model can be considered reliable for discharges above a tentative threshold of approximately 0.02 m3/s/m.
Figure 17.
Numerical and experimental results in prototype scale; panel (a) emerged profile, panel (b) submerged profile.
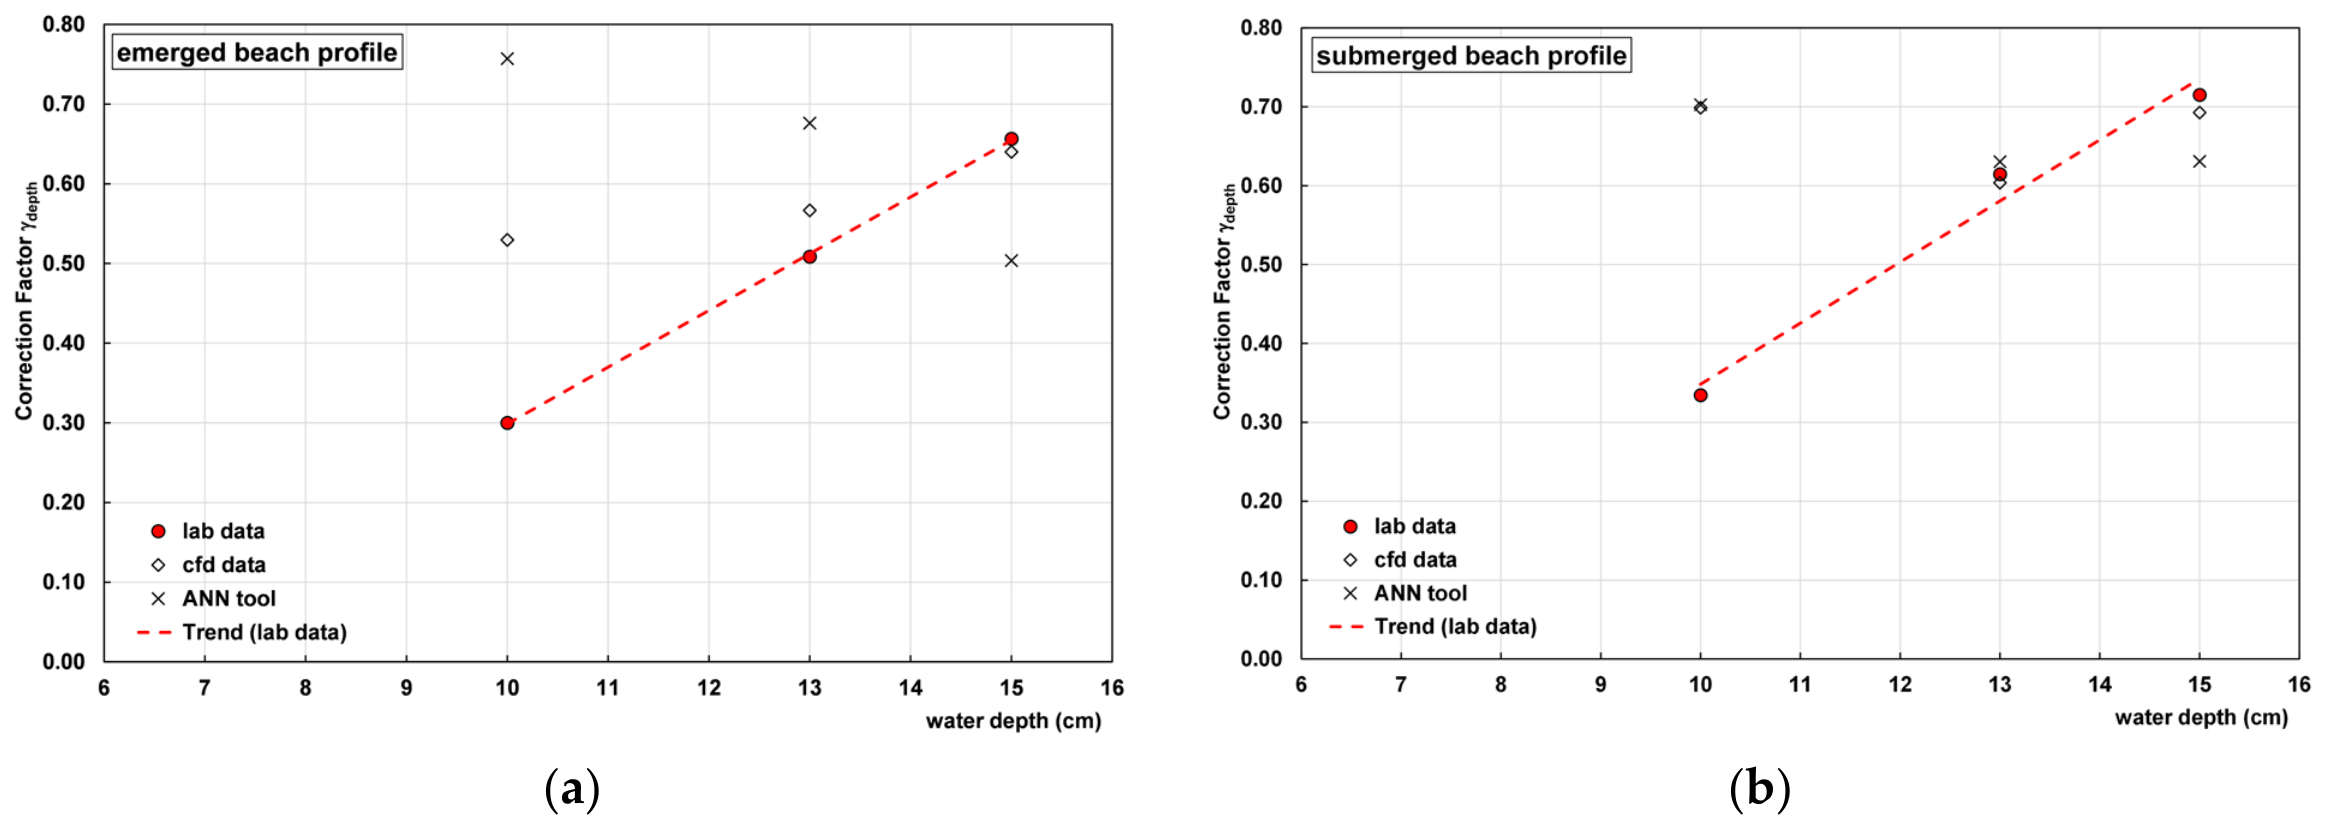
The influence of water depth and foreshore bathymetry is evaluated through a specific reduction coefficient, γdepth, adapting the conceptual framework discussed in EurOtop (2018) [1]. In this study, γdepth was implemented as an equivalent attenuation factor to capture the wave dissipation induced by seabed and water depth variations. To quantify this parameter, mean overtopping discharge data obtained from laboratory experiments, numerical simulations, and artificial neural network (ANN) [25] predictions were compared against the empirical formula. The γdepth values were then calibrated by minimizing the error between the datasets and the analytical formulations, mapping the specific role of shallow-water bathymetry on overtopping reduction.
The results in Figure 18 show that, for both configurations, the correction factor γdepth increased with water depth. Since lower values indicate a greater reduction in mean overtopping discharge, this means that the effectiveness of the berm decreased as the water depth increased.
Figure 18.
Fitting of experimental results of reduction factor: (a) emerged profile; (b) submerged profile.
The emerged beach profile was consistently more effective than the submerged one, with γdepth ranging from about 0.30 to 0.66, compared with 0.33 to 0.71 for the submerged beach profile; the difference was largest at 13 cm. The CFD model reproduced experimental values satisfactorily at 13 and 15 cm, whereas at 10 cm, both numerical tools significantly overestimated γdepth (i.e., underestimate the effect of the beach profile), particularly for the submerged configuration. The ANN also showed a non-monotonic trend for the emerged beach profile, indicating lower robustness than the CFD model. The discrepancies at low water depth may be attributed to the complexity of the wave breaking and energy dissipation processes on the berm, and to the limited representativeness of the ANN training database in this range.
6. Discussion and Conclusions
Following the examination of the results from the preceding chapter, it is evident that the profiles exhibit varying results in terms of the morphodynamic evolution of the profile and the quantity of water overtopping. In the emerged profile, the waves encounter greater difficulty in reaching the structure, because the profile represents a portion of the beach profile above the water surface level. Consequently, the overtopping that transpired was less severe than in the submerged profile.
Overall, the lab–CFD comparison provides satisfactory validation of the numerical model for both configurations, with slightly better agreement for the submerged profile. The pointwise discrepancy observed for the emerged profile at the intermediate water level does not affect the overall trend but should be discussed in terms of experimental/numerical uncertainty or representativeness of the single laboratory data point.
It is important to emphasize that while the main objective of this work is to correlate the mean overtopping discharges directly with beach profile characteristics and still water levels, this study recognizes the distinct, highly non-linear hydrodynamic mechanisms that take place within the nearshore zone.
The geometric configuration formed by the berm and the structure inherently creates a semi-enclosed region. The recent literature has demonstrated that such layout conditions can be susceptible to fluid resonance and transient oscillations triggered by non-linear focused wave groups [26,27]. Within an irregular JONSWAP wave field, transient wave groups can induce localized resonant responses inside the gap between the beach features and the structure [28,29], potentially leading to episodic, high-intensity overtopping events that contribute to the total accumulated volumes.
Although the scope of the present study is bound to time-averaged engineering metrics, acknowledging these group-induced transient resonance processes provides a more comprehensive physical framework for understanding the scattering of overtop-ping data under irregular wave conditions. Incorporating wave-by-wave and spectral resonance analysis represents a compelling direction for future research extensions.
Author Contributions
Conceptualization, A.D.L., A.S., C.C. and F.D.; methodology, A.S., A.D.L., C.C. and F.D.; software, A.S.; validation, A.D.L., A.S. and C.C.; formal analysis, A.S. and A.D.L.; investigation, A.S. and C.C.; resources, F.D. and C.C.; data curation A.S. and C.C.; writing—original draft preparation, A.S. and A.D.L.; writing—review and editing, C.C. and F.D.; visualization, A.S., A.D.L. and C.C.; supervision, F.D. and C.C. All authors have read and agreed to the published version of the manuscript.
Funding
The PhD scholarship of A.S. was funded by the European Union – NextGenerationEU, under the National Recovery and Resilience Plan (NRRP), Mission 4, Component 1, Investment 3.4 (D.M. 629/2024). CUP:D42B24002450006.
Data Availability Statement
To gain access to the experimental data, please contact the authors.
Acknowledgments
During the preparation of this manuscript, the authors used linguistic revision and grammar correction tools to improve the readability and language quality of the text. The authors have reviewed and edited the output and take full responsibility for the content of this publication.
Conflicts of Interest
The authors declare no conflicts of interest.
Abbreviations
The following abbreviations are used in this manuscript:
| CFD | Computational fluid dynamic |
| VOF | Volume of fluid |
| RANS | Reynolds-averaged Navier–Stokes |
| RNG | Renormalization group |
| GMRES | Generalized minimal residual |
| FAVOR | Fractional area volume obstacle representation |
| ANN | Artificial neural network |
References
- Van der Meer, J.W.; Allsop, N.W.H.; Bruce, T.; De Rouck, J.; Kortenhaus, A.; Pullen, T.; Schüttrumpf, H.; Troch, P.; Zanuttigh, B. Manual on Wave Overtopping of Sea Defences and Related Structures; EurOtop: București, Romania, 2018; Available online: https://www.overtopping-manual.com/ (accessed on 2 July 2026).
- Lashley, C.H.; Roelvink, D.; Bricker, J.D.; Altomare, C. The effect of foreshore evolution on wave overtopping: A numerical study. Coast. Eng. 2020, 156, 103621. [Google Scholar]
- Di Leo, A.; Reale, F.; Dentale, F.; Viccione, G.; Carratelli, E.P. Wave-structure interactions a 2d innovative numerical methodology. In Proceedings of the 23rd Conference of the Italian Association of Theoretical and Applied Mechanics, Salerno, Italy, 4–7 September 2017; Volume 2, pp. 1699–1708. [Google Scholar]
- Di Leo, A.; Sansanelli, A.; Pratola, L.; Berardi, V.P.; Dentale, F. Numerical and Experimental Investigation of New Concrete Armor Unit Maya. J. Mar. Sci. Eng. 2025, 13, 2098. [Google Scholar] [CrossRef] [Scilit]
- Najafi, J.A.; Niri, M.Z.; Naderi, N. Simulating three dimensional wave run-up over breakwaters covered by antifer units. Int. J. Nav. Archit. Ocean. Eng. 2014, 6, 297–306. [Google Scholar] [CrossRef] [Scilit]
- Deltares. Influence of Water Depth at Wave Run-up and Wave Overtopping; Deltares Report 1220038-010-VEB-00092015; Deltares: Singapore, 2015. [Google Scholar]
- Van Steeg, P.; Klein Breteler, M.; Provoost, Y. Large-scale physical model tests to determine influence factor of roughness for wave run-up of channel shaped block revetments. In Proceedings of the 6th International Conferences on the Application of Physical Modelling in Coastal and Port Engineering and Science, Ottawa, ON, Canada, 10–13 May 2016. [Google Scholar]
- Medina, J.R.; Molines, J.; Gómez-Martín, M.E. Influence of armour porosity on the hydraulic stability of cube armour layers. Ocean Eng. 2014, 88, 289–297. [Google Scholar] [CrossRef] [Scilit]
- Battjes, J.A.; Janssen, J.P.F.M. Energy loss and set-up due to breaking of random waves. In Proceedings of the 16th International Conferences Coastal Engineering; ASCE: Reston, VA, USA, 1978; pp. 569–587. [Google Scholar]
- Altomare, C.; Suzuki, T.; Chen, X.; Verwaest, T.; Kortenhaus, A. Wave overtopping of sea dikes with very shallow foreshores. Coast. Eng. 2016, 116, 236–257. [Google Scholar] [CrossRef] [Scilit]
- Etemad-Shahidi, A.; Jafari, A. A model for prediction of overtopping at berm breakwaters. In Proceedings of the 21st International Congress on Modelling and Simulation, Goldcoast, Australia, 29 November–4 December 2015. [Google Scholar]
- Sequeira, A.; Coelho, C.; Lima, M. Morphodynamic Interactions Between Sandbar, Beach Profile, and Dune Under Variable Hydrodynamic and Morphological Conditions. Water 2025, 17, 2112. [Google Scholar] [CrossRef] [Scilit]
- Vale, D.; Pires, R. Avaliação do Espraiamento e Galgamento em Estruturas Costeiras. 2022. Available online: https://incca.web.ua.pt/index.php/relatorios/ (accessed on 2 July 2026).
- Bayle, P.M.; Beuzen, T.; Blenkinsopp, C.E.; Baldock, T.E.; Turner, I.L. A new approach for scaling beach profile evolution and sediment transport rates in distorted laboratory models. Coast Eng. 2021, 163, 103794. [Google Scholar] [CrossRef] [Scilit]
- Li, Y.; Zhang, C.; He, Y.; Chen, W.; Liu, J.; Sui, T.; Chi, S.; Zheng, J. Experimental investigation on profile evolution of beach-dune system exposed to irregular waves. Coast. Eng. 2026, 207, 104974. [Google Scholar] [CrossRef] [Scilit]
- Soulsby, R.L.; Whitehouse, R.J.S. Threshold of sediment motion in coastal environments. In Proceedings of the Pacific Coasts and Ports ’97 Conference; University of Canterbury: Christchurch, New Zealand, 1997; Volume 1, p. 149154. [Google Scholar]
- Nielsen, P. Coastal Bottom Boundary Layers and Sediment Transport; World Scientific: Singapore, 1992; ISBN 978-981-02-0473-0. [Google Scholar]
- Bradford, S.F. Numerical simulation of surf-zone dynamics. J. Waterw. Port Coast. Ocean Eng. 2000, 126, 1–13. [Google Scholar] [CrossRef] [Scilit]
- Saad, Y. Iterative Methods for Sparse Linear Systems, 1st ed.; PWS Publishing Company: Boston, MA, USA, 1996; ISBN 978-0-534-94776-7. [Google Scholar]
- Lin, P.; Liu, P.L.F. Internal wave-maker for navier-stokes equation models. J. Waterw. Port Coast. Ocean Eng. 1999, 125, 4. [Google Scholar] [CrossRef] [Scilit]
- Flow Science, Inc. FLOW-3D User’s Manual, HYDRO ed.; Flow Science, Inc.: Santa Fe, NM, USA, 2022. [Google Scholar]
- Di Leo, A.; Buccino, M.; Dentale, F.; Pugliese Carratelli, E. CFD Analysis of Wind Effect on Wave Overtopping. In Proceedings of the 32nd International Ocean and Polar Engineering Conference, Shanghai, China, 5–10 June 2022. [Google Scholar]
- Cheon, S.H.; Suh, K.D. Effect of sea level rise on nearshore significant waves and coastal structures. Ocean. Eng. 2016, 114, 280–289. [Google Scholar] [CrossRef] [Scilit]
- Pillai, K.; Lemckert, C.; Etemad-Shahidi, A.; Cappieti, L.; Sigurdarson, S. Effect of sea level rise on wave overtopping rate at berm breakwater. J. Waterw. Port Coast. Ocean Eng. 2019, 145, 04019019. [Google Scholar] [CrossRef] [Scilit]
- Deltares. NN Overtopping: Wave Overtopping Neural Network Calculator. Available online: https://dserie.deltares.nl/NNOvertopping/overtopping.aspx (accessed on 2 July 2026).
- Gao, J.; Ma, X.; Zang, J.; Dong, G.; Zhou, X.; Zhou, L. Numerical investigation of harbor oscillations induced by focused transient wave groups. Coast Eng. 2019, 153, 103541. [Google Scholar]
- Gao, J.; Mi, C.; Song, Z.; Ma, X. Transient gap resonance between two closely-spaced boxes triggered by nonlinear focused wave groups. Ocean Eng. 2024, 299, 117236. [Google Scholar] [CrossRef] [Scilit]
- Gao, J.; Song, Z.; Mi, C.; Wang, G. Hydrodynamic wave forces on two side-by-side barges subjected to nonlinear focused wave groups. Ocean Eng. 2024, 308, 118350. [Google Scholar] [CrossRef] [Scilit]
- Gao, J.; Mi, C.; Song, Z.; Ma, X. Hydrodynamics of transient gap resonance between a heaving box and a vertical wall excited by focused wave groups. Ocean Eng. 2026, 312, 125617. [Google Scholar] [CrossRef] [Scilit]

Disclaimer/Publisher’s Note: The statements, opinions and data contained in all publications are solely those of the individual author(s) and contributor(s) and not of MDPI and/or the editor(s). MDPI and/or the editor(s) disclaim responsibility for any injury to people or property resulting from any ideas, methods, instructions or products referred to in the content. |
© 2026 by the authors. Licensee MDPI, Basel, Switzerland. This article is an open access article distributed under the terms and conditions of the Creative Commons Attribution (CC BY) license.