


Abstract
DNA metabarcoding has emerged as a powerful tool for biodiversity assessment in aquatic ecosystems; however, most studies focus solely on target taxa. This study leveraged surplus COI metabarcoding data originally generated from ichthyoplankton bulk samples to characterize mesozooplanktonic marine invertebrate communities across coastal and estuarine environments in southern Portugal. By reanalyzing the previously generated high-throughput sequencing (HTS) amplicon libraries of two COI primer sets, a total of 424 mesozooplankton taxa (403 species) belonging to 10 metazoan phyla were identified, revealing diverse non-target groups. Arthropoda, Mollusca, and Cnidaria were the most represented phyla, accounting for 84.12% of the total species-level diversity, while the estuarine records overlapped with 62.5% of the historically documented species represented in the COI reference database. Additionally, significant seasonal variability in mesozooplankton composition was detected during the estuarine sampling period, and higher species richness was observed at nearshore sites in the separately analyzed marine dataset. The low diversity observed during summer (n = 105) in estuarine samples, compared to the unexpectedly higher richness in winter (n = 126), appears to reflect the atypical climatic conditions recorded during the sampling year. These findings suggest that metabarcoding, even when applied to non-target taxa, can potentially detect shifts in community composition that, in this case, may be associated with particular hydrological and climatic conditions. Furthermore, 28 taxa classified as non-indigenous species (NIS) in the Bay of Biscay and Iberian Coast region were identified, highlighting the capacity of this molecular approach to support early NIS screening in regular assessments. Overall, this study demonstrates that ichthyoplankton metabarcoding datasets can be repurposed to provide insights into broader planktonic communities, maximizing the ecological value of routine monitoring efforts.
1. Introduction
Marine communities inhabiting estuarine and coastal zones comprise a rich diversity of species that interact in complex ways, shaping food webs, nutrient cycles, and habitat structures [1]. Monitoring these dynamics is essential for understanding ecosystem health, stability, and biodiversity [2]. Effective monitoring allows researchers to uncover complex patterns of species interactions and detect shifts driven by environmental and anthropogenic pressures—an especially critical task given that these ecosystems rank among the most threatened on Earth [3,4]. Furthermore, assessing community structure across multiple taxonomic groups provides an ample perspective on ecosystem functioning, which facilitates the identification of key biodiversity indicators and ecosystem health metrics [5]. This holistic approach delivers valuable insights into conservation initiatives and informed management strategies [6].
Zooplanktonic communities, encompassing a diverse range of taxa such as crustaceans, mollusks, and polychaetes, play a pivotal role in estuarine and coastal ecosystems, contributing to trophic interactions and serving as indicators of environmental quality [7,8,9]. Their community structure and productivity are influenced by phytoplankton dynamics and seasonal phenology, with consequences for food-web functioning and the transfer of primary production to benthic ecosystems [10,11,12,13,14].
Traditional methods for monitoring zooplankton often involve direct sampling followed by morphological identification, which, while informative, can be time-consuming and limited by taxonomic resolution [15]. In many cases, the identification of organisms to species level proves challenging, particularly when linking early life stages to their corresponding adult forms [5,16]. Advances in molecular techniques included the emergence of DNA barcoding as a complementary approach, enabling species identification by sequencing standardized genetic markers (originally mitochondrial cytochrome c oxidase subunit I (COI) in animals) and comparing the resulting sequences with reference libraries [17]. Building on this approach, DNA metabarcoding facilitates comprehensive and efficient assessments of bulk organism assemblages, supporting taxonomic identification across life stages, addressing some limitations of morphological identification, and improving the cost-effectiveness of frequent sampling [18,19,20]. It can also expand the spatial, temporal, and taxonomic coverage of traditional biomonitoring programs [21,22,23]. Additionally, it is a highly sensitive approach capable of detecting DNA from rare organisms and taxa classified as non-indigenous species (NIS), while also contributing to the discovery of cryptic diversity [24,25]. However, its performance and assignment reliability depend on sampling design, marker resolution, primer-specific amplification biases, reference-library completeness, and the taxonomic assignment and curation procedures applied [18,20,23,26].
The re-analysis of high-throughput sequencing (HTS) data from archived ichthyoplankton trawls not only detected fish eggs and larvae but also revealed a diverse assemblage of non-target organisms, including zooplankton and other invertebrates, without requiring additional sequencing effort. The mesh sizes used in our study (335 and 500 µm) are consistent with the mesozooplankton size fraction. Mesozooplankton comprise multicellular drifting organisms ranging from 200 µm to 20 mm, including crustacean plankton, meroplanktonic larvae, and small gelatinous taxa, and contribute to aquatic food webs and carbon and nutrient cycling through grazing and vertical particle flux [27,28,29]. However, these mesh sizes tend to favor the retention of larger organisms; therefore, the detected assemblage should be interpreted as a size-selective fraction of the community.
By employing DNA extraction methods that process the entire bulk sample, we can take advantage of the potential of DNA metabarcoding to investigate and identify these planktonic organisms. This approach is facilitated by the use of COI (cytochrome c oxidase subunit I) primer sets, which benefit from extensive database coverage across a broad range of taxonomic groups [26]. This contrasts with other genetic markers, such as 12S, which, although widely regarded as more suitable for fish-specific applications due to its higher amplification specificity and better-curated fish reference libraries, has a narrower taxonomic scope than COI [30]. Multiple taxonomic databases can be integrated to create a complete marine community database, effectively targeting mesozooplankton invertebrate species. Furthermore, generalist primer pairs, such as mlCOIintF/LoboR1 (Leray-Lobo: [31,32]), have demonstrated great capacity to detect a broad range of marine species, providing a detailed profile of the marine communities in the sampled ecosystems [25,33,34,35,36,37]. This strategy underscores the potential of DNA metabarcoding to maximize the amount of information extracted from each sample, enabling the simultaneous characterization of ichthyoplankton and associated non-target invertebrate diversity. It can also provide information on community composition and patterns of taxon co-occurrence within the same bulk samples. When supported by adequate marker resolution, comprehensive reference databases, and careful taxonomic curation, DNA metabarcoding can provide species-level identifications that are valuable for detecting subtle ecological changes and understanding the responses of mesozooplankton communities to environmental and anthropogenic pressures [38].
Based on this rationale, the main goal of this study is to characterize mesozooplanktonic marine invertebrate diversity by leveraging surplus COI metabarcoding data generated from previous ichthyoplankton surveys conducted along the Algarve coast [39] and in the Guadiana River Estuary during a monthly year-long campaign [40], both in southern Portugal. By analyzing COI reads assigned to marine invertebrate taxa, we further aim to: (i) assess species richness across different phyla, (ii) identify areas of higher diversity within marine environments, and (iii) detect seasonal trends in community-level diversity within estuarine samples.
2. Materials and Methods
2.1. Sampling Design
Since the aim of this study was to repurpose COI metabarcoding data originally generated from ichthyoplankton samples to identify co-occurring mesozooplanktonic species, the datasets used here correspond to material collected in previous investigations [39,40]. The datasets were grouped into marine and estuarine categories according to the design of each study. Although all locations are situated in southern Portugal, the marine and estuarine data were analyzed separately because of the lack of direct connectivity between environments and differences in sampling timelines, design, and effort. Accordingly, no direct statistical or quantitative comparisons were made between the two datasets, with coastal-distance patterns evaluated only within the marine dataset and temporal patterns only within the estuarine dataset. The marine dataset comprised eight biological samples collected during a single survey, with one sample obtained at each of the eight sampling points. Marine sampling was conducted at night, with each sample collected through a 10-min oblique tow at 2 knots using a Bongo net with a mesh size of 335 µm. These tows were restricted to the upper water column and did not characterize the full vertical distribution of mesozooplankton at any sampling station. In contrast, the estuarine dataset comprised 39 biological samples collected monthly over 13 consecutive months at three fixed sampling points, with one sample collected per point each month. Each estuarine sample was obtained through a 5-min horizontal subsurface tow using a conical plankton net with a mesh size of 500 µm.
More specifically, marine samples were collected in June 2022 along two perpendicular transects in coastal areas adjacent to the Arade River (A1–A4) and Ria Formosa (F1–F4) (Figure 1). Sampling points were distributed across increasing distances from the coast, representing distinct depth zones: inner shore (<30 m), middle shore (30–100 m), outer shore (100–200 m), and offshore (>500 m). As sampling was restricted to a single campaign in June 2022, the spatial analyses characterize differences among sites during that campaign and should be interpreted as a snapshot rather than as representing annual patterns in marine community composition or richness. Estuarine sampling was conducted in the lower section of the Guadiana River Estuary, where monthly surveys were carried out from April 2022 to April 2023 at three fixed sampling points (Figure 1). For the subsequent temporal and seasonal analyses, detections from the three points were combined to produce a single presence-absence assemblage for each month. Monthly richness therefore represents the total number of unique taxa detected across the three sampling points rather than an average among points. Similarly, seasonal richness represents the cumulative number of unique taxa detected across all months included within each season. More details on the specific sampling strategies can be found in Ferreira et al. [39,40]. After collection, all samples were immediately preserved in ethanol 96% and stored at −20 °C to ensure optimal sample preservation for subsequent molecular analyses.
Figure 1.
Sampling locations used for assessing mesozooplanktonic diversity in southern Portugal. Points A1 to A4 (Arade River) and F1 to F4 (Ria Formosa) correspond to marine sampling sites categorized by their distance from the coast. The inset map on the right shows the lower section of the Guadiana River Estuary, where estuarine samples were collected. Maps were created using the CalTopo application (https://caltopo.com (accessed on 27 January 2026); [41]).
2.2. DNA Extraction, PCR Amplification, and High-Throughput Sequencing (HTS)
The molecular processing of the samples used in this analysis is described in detail in Ferreira et al. [39]. Briefly, following ethanol filtration, DNA was extracted from each bulk sample using an adaptation of the protocol described by Steinke et al. [42], which was based on Ivanova et al. [43]. A volume of lysis buffer proportional to the sample weight (100 mM NaCl, 50 mM Tris-HCl pH 8.0, 10 mM EDTA pH 8.0, and 0.5% SDS) was added, and the samples were incubated overnight at 56 °C with agitation at 60 rpm. Two 1 mL aliquots from each resulting lysate were processed independently according to the same extraction protocol, which included three washing steps. DNA from each aliquot was eluted in 30 µL of sterile double-distilled water (ddH2O), and the two eluates were subsequently combined, resulting in approximately 60 µL of extracted DNA per sample. DNA concentration and purity were assessed using a Thermo Scientific™ NanoDrop™ One/OneC spectrophotometer (Thermo Fisher Scientific, Waltham, MA, USA), and the extracts were stored at −20 °C until amplification. Negative extraction controls were processed alongside the samples. Because these controls showed no detectable amplification, they were not included in the sequencing libraries. Consequently, sequencing-level artifacts cannot be completely excluded for detections supported by only one or a few reads.
For this study, we used the amplicon libraries generated from two primer sets targeting the COI region: mlCOIintF/LoboR1 [31,32], and a fish-specific primer cocktail, FishATL_Cocktail2 [44] (Table 1). Following the manufacturer’s instructions, two replicate PCR reactions were performed for each sample using the KAPA HIFI HotStart PCR Kit (Kapa Biosystems, Cape Town, South Africa). The PCR reaction mixture contained 0.3 µM of each primer (forward primer mlCOIintF and reverse primer LoboR1) and 5 μL of template DNA, in a total reaction volume of 25 µL. For the 9ishATL_Cocktail2, the PCR reaction included 3 µM of each primer, comprising a pool of forward primers (219F, 217F, and 214F) and a pool of reverse primers (FishR1, FishR2, and FishR7), with 1 μL of template DNA in a total reaction volume of 25 µL. Thermal cycling conditions for both primer sets are detailed in Table 1. The reaction conditions were independently optimized for each primer set rather than standardized for quantitative comparisons of amplification efficiency; therefore, comparisons between primer sets were limited to their qualitative taxonomic coverage based on presence–absence data.
Table 1.
Primer sets used to test the efficiency of COI metabarcoding for the identification of mesozooplanktonic species. Bold text indicates the primer-set names and the corresponding forward and reverse primer names. (F)—forward; (R)—reverse; bp—base pairs.
Following the combination of PCR replicates for each sample, a second PCR reaction was performed to add Nextera XT indexes and sequencing adapters to both ends of the amplified target regions in accordance with the manufacturer’s guidelines [47]. PCR products were purified, normalized, and pooled together before being subjected to paired-end sequencing on an Illumina MiSeq® sequencer using the MiSeq Reagent Kit v3 (600 cycles), following the manufacturer’s instructions (Illumina, San Diego, CA, USA). The sequencing was conducted at Genoinseq (Cantanhede, Portugal). The raw sequence data generated from the marine and estuarine samples have been deposited in the NCBI Sequence Read Archive (SRA) under BioProject accession numbers PRJNA1329156 and PRJNA1334324, respectively.
2.3. Bioinformatic Processing
Amplicon COI datasets generated through Illumina sequencing were processed using PMiFish version 2.4.1 (available at https://github.com/rogotoh/PMiFish (accessed on 8 July 2026); [48]). Based on USEARCH version 10.0.240 [49], the pipeline processed the HTS raw data through a series of steps, including paired-end read merging, primer removal, quality filtering, dereplication, denoising, and chimera removal (see Ferreira et al. [40] for a detailed description of each step). The remaining ASVs (Amplicon Sequence Variants) were taxonomically assigned to species using an identity threshold of >97% and subsequently grouped into molecular operational taxonomic units (MOTUs). Each MOTU was represented by a single representative sequence, corresponding to the ASV with the highest read count within its group of sequences.
The COI reference database was compiled using an R script adapted from the BAGS software [50]. Records corresponding to marine and brackish invertebrate phyla and the ‘COI-5P’ marker were extracted from the BOLD database [51] using the “bold” R package [52] in RStudio 4.0.4 [53]. Records lacking species names or Barcode Index Number (BIN) were removed, and the remaining data were carefully reviewed to address synonyms and unaccepted names. Taxonomic consistency was ensured by aligning with the accepted nomenclature in the World Register of Marine Species Records [54].
2.4. Data Curation
To maximize the detection of potentially rare taxa, including non-indigenous species, no minimum read threshold was applied to preserve identifications with small number of sequence reads, which are often associated with such taxa. This methodological choice required a rigorous data curation workflow to minimize the risk of false-positive detections while avoiding an overly conservative approach. All taxonomic assignments obtained using the compiled reference database were subsequently re-checked against WoRMS to standardize the nomenclature and resolve taxonomic inconsistencies. Each COI sequence was linked to a BIN, a molecular operational taxonomic unit based on sequence similarity [55], and BIN assignments were cross-validated against the BOLD reference database. Representative sequences associated with each taxonomic assignment generated by the PMiFish pipeline were then independently verified using BLASTn searches against GenBank [56], with sequence identity, query coverage, and E-values evaluated to assess assignment confidence.
Additionally, when a species-level assignment remained ambiguous for one COI primer set but was strongly supported by the complementary primer through consistent BIN assignment, BLASTn results, and taxonomic agreement, the species record was retained based on cross-primer validation. As a final step, if assignments still could not be confidently resolved to species level or multiple closely related species could not be reliably distinguished, records were conservatively reassigned to the genus or family level. This multi-step curation procedure was implemented to maximize the detection of ecologically relevant taxa, including potential NIS, while minimizing taxonomic misassignments and spurious detections.
2.5. Diversity Analysis
All data analyses were conducted within the RStudio environment version 4.0.4 [53] using the vegan R package (v2.6-4) [57]. Due to potential amplification-associated biases, only presence/absence data were considered. Treemap plots illustrating the composition of mesozooplankton recovered through COI metabarcoding of ichthyoplankton from marine and estuarine samples were generated using the “treemap” function from the treemap R package [58]. The R package ggplot2 [59] was employed to enhance graphical data representation. Additionally, this package was used to generate the fluctuation plot showing seasonal variations in the number of detected taxa for each phylum and the heatmap representing the presence and absence of non-indigenous species identified within the samples. NIS identification was based on the 2024 Marine Non-Indigenous Species report from the Marine Strategy Framework Directive (MSFD) for the Bay of Biscay and the Iberian Coast region [60]. These visualizations were further supported by the use of the “tidyr” [61] and “dplyr” [62] R packages, which facilitated data manipulation and the creation of appropriate data frames for visualization. The Jaccard dissimilarity index was calculated for each sampling location using the “vegdist” function from the vegan R package. To visualize data-specific patterns, separate non-metric multidimensional scaling (NMDS) analyses were performed using R scripts with the vegan R package. For the marine dataset, NMDS was used to visualize variation in taxonomic composition among coastal-distance categories. For the estuarine dataset, NMDS was used to assess variation among sampling seasons. No NMDS or PERMANOVA analysis directly compared the marine and estuarine samples. Differences within each dataset were evaluated using Permutational Multivariate Analysis of Variance (PERMANOVA) conducted with the “adonis2” function from the vegan package in R, employing 999 permutations. When applicable, additional “pairwise” comparisons were performed to assess differences between variable categories, providing a more detailed understanding of the observed patterns. For the estuarine seasonal analyses, as described in the Sampling Design section, NMDS and PERMANOVA were performed using a single monthly presence–absence profile generated by combining detections from the three sampling points, with the 13 monthly profiles grouped according to their respective seasons. The homogeneity of multivariate dispersion among seasons was evaluated using the “betadisper” function from the vegan package, and differences in dispersion were tested using analysis of variance.
3. Results
3.1. HTS Data Processing and Global Mesozooplanktonic Composition
Among the 94 COI amplicon libraries expected from 47 biological samples (8 marine and 39 estuarine), 92 were successfully generated and analyzed, yielding a total of 8,921,839 reads. Of these, 4,962,691 were generated using the mlCOIintF/LoboR1 primer pair and 3,959,148 using the FishATL_Cocktail2 primer cocktail (Table S1). Following bioinformatic processing, 90.44% of the reads from the mlCOIintF/LoboR1 primer pair were retained for taxonomic assignment compared to 69.07% for the FishATL_Cocktail2 primer cocktail. Approximately 37% of the total COI reads were successfully assigned to aquatic metazoan species (45% in the case of the generalist mlCOIintF/LoboR1 primer versus 28% for the fish-specific cocktail). The mlCOIintF/LoboR1 primer identified 471 taxa, of which 453 were assigned to species level, comprising 375 invertebrate (Table S2) and 78 fish species. Following taxonomic curation, 15 records were conservatively reassigned to genus level and 3 to family level. In contrast, FishATL_Cocktail2 primer recovered 272 taxa, including 265 species-level assignments, but showed greater efficiency in detecting the target fish fauna, identifying 93 fish species alongside 172 invertebrate species (Table S3). After taxonomic curation, 6 records were reassigned to genus level and 1 to family level. Fish taxa data were excluded from the subsequent analyses, as they have already been thoroughly explored in previous studies [39,40]. The following section provides a descriptive summary of the combined taxonomic diversity obtained from the marine and estuarine datasets. This combined inventory is presented solely to characterize the total non-target diversity detected, while all spatial and temporal analyses were conducted separately for each dataset.
Across the combined taxonomic dataset, a total of 424 mesozooplanktonic invertebrate taxa were identified across all analyzed samples, comprising 403 species-level, 17 genus-level, and 4 family-level assignments (Table S4). These taxa spanned 10 metazoan phyla: Annelida, Arthropoda, Bryozoa, Chaetognatha, Chordata, Cnidaria, Echinodermata, Mollusca, Nemertea, and Porifera. They were classified into 22 classes, 63 orders, and 207 families, reflecting the extensive taxonomic diversity captured through DNA metabarcoding analysis. The three most represented phyla accounted for 84.12% of the total species-level diversity: Arthropoda with 196 species, Mollusca with 98 species, and Cnidaria with 45 species. This overall pattern remained consistent across both case studies and sample types (Figure 2). In marine samples (Figure 2a), Arthropoda was the dominant phylum with 157 species (53.77%), followed by Mollusca with 76 species (26.03%), Cnidaria with 26 species (8.90%), and Annelida with 22 species (7.53%). The remaining phyla collectively represented 3.77% of the total diversity, including seven species of Echinodermata, two species of Bryozoa, and one species each of Chaetognatha, Nemertea, and Porifera. In the estuarine monthly samples (Figure 2b), a similar pattern was observed, with Arthropoda dominating (135 species, 46.55%), followed by Mollusca (67 species, 23.10%) and Cnidaria (34 species, 11.72%). Annelida was also well represented with 31 species (10.69%). The remaining phyla accounted for 7.93% of the total diversity, including Bryozoa (seven species), Echinodermata (five species), Chaetognatha (four species), Porifera (three species), and Chordata and Nemertea (two species each). Globally, at the class level, five classes stood out, collectively accounting for 79.95% of the total diversity across all samples: Malacostraca (112 species) and Copepoda (57 species) within Arthropoda, Gastropoda (79 species) within Mollusca, Hydrozoa (41 species) within Cnidaria, and Polychaeta (33 species) within Annelida.
Figure 2.
Taxonomic composition of mesozooplankton invertebrates recovered through COI metabarcoding: (a) marine samples collected along coastal transects and (b) estuarine samples from the Guadiana River Estuary. The tree maps are color-coded by phylum, illustrating the taxonomic diversity retrieved. Taxonomic composition was characterized independently for each dataset and was not used for direct comparisons between the marine and estuarine communities.
3.2. Influence of Coastal Distance (Marine Samples) on Mesozooplanktonic Species Richness and Composition
The number of mesozooplankton taxa recorded across the different coastal categories for each marine transects (F1–F4 and A1–A4) varied among sampling points, with generally higher richness observed at sites closer to the coast and lower richness at sites farther offshore. Sampling points closer to the coast (F1-A1 and F2-A2, representing inner shore and middle shore categories) exhibited the highest species richness compared to the more distant sites (F3-A3 and F4-A4, representing outer shore and offshore categories). The highest richness was observed at site F1, with 168 taxa identified, while the middle shore sites showed contrasting patterns, with A2 recording the highest diversity (124 taxa) and F2 displaying the lowest richness of all locations, with only 48 (Figure 3). Across all marine sites, Arthropoda, Mollusca, and Cnidaria emerged as the dominant phyla, with Arthropoda consistently representing the largest proportion of species across all sampling locations. The remaining phyla, including Bryozoa, Chaetognatha, Nemertea, and Porifera, contributed minimally to the overall taxonomic composition.
Figure 3.
Number of taxa detected using COI metabarcoding across the marine sampling locations. Bar heights represent the total number of mesozooplankton diversity identified, with colors indicating their distribution among phyla. Sampling locations are grouped into four categories according to the maximum depth at each point: Inner (Inner shore: <30 m), Mid (Middle shore: 30–100 m), Outer (Outer shore: 100–200 m), and Off (Offshore: >500 m). Numbers above each bar indicate the total taxa richness detected at each sampling location.
3.3. Influence of Seasonal Variation (Estuarine Samples) on Mesozooplanktonic Species Richness and Composition
In the estuarine environment, species richness displayed pronounced seasonal fluctuations, with the highest number of records (n = 155) recorded in April and the lowest (n = 49) in August (Figure 4). A clear pattern emerged, with spring months showing the highest species richness, while summer months, except for September, exhibited lower diversity. The estuarine samples also displayed a taxonomic distribution pattern similar to the marine environment, with Arthropoda, Mollusca, and Cnidaria as the most abundant phyla. However, Annelida exhibited a more noticeable presence in the estuarine samples compared to marine sites. When assessing seasonal variation, spring (April to June) stood out as the most diverse period, with 208 taxa detected, followed by winter (January to March) with 126 and autumn (October to December) with 112. In contrast, the summer period (July to September) recorded the lowest diversity, with only 105 mesozooplankton species identified.
Figure 4.
Number of taxa detected using COI metabarcoding across the estuarine monthly samples. Bar heights represent the total number of mesozooplankton diversity identified, with colors indicating their distribution among phyla. Monthly samples span from April 2022 (APR) to April 2023 (APR*) and are grouped by the corresponding season. Numbers above each bar indicate the total species richness detected in each monthly sample. SPR.—Spring.
Seasonal fluctuations in mesozooplankton diversity revealed distinct trends across the ten identified phyla in the lower section of the Guadiana River Estuary (Figure 5). Arthropoda, the dominant phylum, exhibited marked seasonal variation, with the highest species richness recorded in spring (n = 92), followed by a pronounced decline in summer (n = 59) and a gradual increase through autumn (n = 71) and winter (n = 76). Mollusca also peaked in spring (n = 60) but experienced an intense decline in summer (n = 9) and autumn (n = 4); a similar pattern was observed for Annelida, although at a smaller scale (decrease from 23 species to 7). Cnidaria, another prominent phylum, maintained relatively stable species richness throughout the year, with a slight increase in winter (24 species), one more than in spring. The remaining phyla contributed less to the overall seasonal mesozooplankton composition but still displayed distinct seasonal patterns. The decline in species richness observed during the summer months aligns with the overall reduction in diversity patterns seen in Figure 4, emphasizing the seasonal influence on mesozooplankton community composition.
Figure 5.
Seasonal fluctuations in species richness for the ten identified phyla in the lower Guadiana River Estuary. Monthly detections were grouped by season, illustrating the contrasting temporal patterns of the dominant and less abundant phyla.
3.4. Marine and Estuarine Mesozooplankton Community Structure
The NMDS analysis based on the Jaccard dissimilarity index was used to visualize potential variation in mesozooplankton community composition across spatial and seasonal gradients (Figure 6 and Figure 7). Figure 6 illustrates the spatial distribution of samples categorized by their distance from the shore and provides a low-dimensional representation with a stress value of 0.034. Although the ordination visually suggested a potential gradient in community composition with increasing distance from the coast, this pattern was based on only eight marine observations and should therefore be interpreted cautiously. Specifically, inner shore sites appeared relatively close in the ordination, while the middle shore site F2 was positioned separately from the other sampling points. In contrast, the outer shore and offshore sites (F3, F4, A3, and A4) appeared to form a separate grouping, with samples positioned close to one another. However, this apparent spatial gradient was not statistically supported, as PERMANOVA indicated no significant differences among coastal-distance categories (R2 = 0.473, pseudo-F = 1.195, df = 3, p = 0.194; Table S5). Further pairwise PERMANOVA comparisons between different coastal distance categories revealed no significant differences, even between the most visually contrasting groups, inner shore and offshore (pseudo-F = 1.928, df = 1, p = 0.333; Table S6).
Figure 6.
Non-metric Multidimensional Scaling (NMDS) plot based on the Jaccard dissimilarity index illustrating variation in species composition across sampling locations grouped by distance from shore (Stress = 0.034). Points are labeled by their corresponding sampling locations and colored according to four distance categories: Inner Shore (light blue), Middle Shore (medium blue), Outer Shore (blue), and Offshore (dark blue).
Figure 7.
Non-metric Multidimensional Scaling (NMDS) plot based on the Jaccard dissimilarity index illustrating seasonal variation in species composition (Stress = 0.107). Points are labeled by their corresponding sampling months and colored according to season: Spring (green), Summer (yellow), Autumn (orange), and Winter (blue). Convex hulls delineate the distribution of samples within each season, illustrating seasonal patterns in community composition. APR*—April 2023.
Figure 7 highlights the seasonal variation in mesozooplankton composition, with samples grouped by season. The NMDS ordination suggested visually distinguishable seasonal groupings, with a slight overlap between January (winter) and the autumn cluster. Spring samples (April, May, and June) appeared to form a distinct and more isolated cluster, indicating a relatively unique community structure during this period. Autumn samples (October, November, and December) appeared a more dispersed pattern, suggesting higher variability in species composition within this season. In contrast, summer months (July, August, and September) formed a more cohesive cluster, indicating greater similarity in their composition. PERMANOVA analysis revealed significant differences in mesozooplankton community composition among seasons and showed that season accounted for 34.61% of the observed variation (R2 = 0.346, pseudo-F = 1.588, df = 3, p = 0.002; Table S7). Nevertheless, the analysis of multivariate dispersion revealed no significant differences among seasons (F = 0.764, df = 3, p = 0.542). Pairwise comparisons using PERMANOVA further highlighted the distinct contribution of spring months to the observed differences, with significant differences found when comparing spring to summer (p = 0.023) and autumn (p = 0.026) and a near-significant difference with winter (p = 0.066) (Table S8). No significant differences were observed among the remaining seasonal comparisons. These findings indicate an overall temporal pattern in mesozooplankton community composition during the sampled annual cycle, with the observed variation appearing to be mainly associated with the distinct spring assemblage rather than clear separation among all individual seasons.
3.5. Non-Indigenous Species (NIS) Detection
The DNA metabarcoding analysis of ichthyoplankton samples enabled the detection of twenty-eight non-indigenous mesozooplanktonic species (NIS), according to the 2024 Marine Non-Indigenous Species report from the Marine Strategy Framework Directive (MSFD) for the Bay of Biscay and the Iberian Coast region [60]. These NIS represented 6.95% of the total identified diversity and were distributed across five phyla: Arthropoda (13 species), Bryozoa (5 species), Chordata (2 species), Cnidaria (5 species), and Mollusca (3 species) (Figure 8).
Figure 8.
Detection of twenty-eight non-indigenous species (NIS) classified for the Bay of Biscay and the Iberian Coast region, as reported in the 2024 MSFD report [60]. The figure illustrates the presence of these species across varying distances from the coast in marine environments (F1–F4, A1–A4) and their temporal occurrence in a temperate estuary in southern Portugal, based on monthly sampling. APR*—April 2023.
In the marine environment, thirteen NIS were detected, with their presence varying across sampling points. Balanus trigonus Darwin, 1854 was consistently detected at all sites, while Paracalanus quasimodo Bowman, 1971 was present at all locations except F4. Additionally, nine species were recorded within the Ria Formosa transect (F1–F4), predominantly distributed from the inner shore to the outer shore. These included: Acartia (Acanthacartia) tonsa Dana, 1849–1852; Austrominius modestus (Darwin, 1854); Caprella scaura Templeton, 1836; Crepidula fornicata (Linnaeus, 1758); Membranipora membranacea (Linnaeus, 1767); Neomysis integer (Leach, 1814); Ostrea stentina Payraudeau, 1826; Pseudodiaptomus marinus Sato, 1913; and Ruditapes philippinarum (A. Adams & Reeve, 1850). Furthermore, two additional NIS, Ectopleura crocea (Agassiz, 1862) and Palaemon macrodactylus Rathbun, 1902, were recorded exclusively in samples from the Arade River transect (A1–A4). The Arade River dataset also included Membranipora membranacea and Austrominius modestus, which were detected in the Ria Formosa transect as well.
In the estuarine environment, twenty-four NIS were identified, each displaying distinct temporal distribution patterns. Paracalanus quasimodo was consistently detected throughout all months, suggesting persistent occurrence in the Guadiana River Estuary. A similar pattern was observed for Austrominius modestus and Balanus trigonus, with the former absent only in November and February and the latter missing solely in November. Several species demonstrated prolonged presence across multiple months; Bugula neritina (Linnaeus, 1758), Clytia linearis (Thornely, 1900), and Palaemon macrodactylus were recorded in six or more months. Bugula neritina exhibited seasonal permanence from spring to autumn, while C. linearis and P. macrodactylus were primarily detected in spring and summer. Certain species, such as Membranipora membranacea, Microcosmus squamiger Michaelsen, 1927, and Neomysis integer, were predominantly associated with warmer months. In contrast, Acartia (Acanthacartia) tonsa; Amphibalanus amphitrite (Darwin, 1854); Blackfordia virginica Mayer, 1910; Jassa slatteryi Conlan, 1990; Ostrea stentina; and Pseudodiaptomus marinus were more frequently detected during colder months. Additionally, some species, such as Callinectes sapidus Rathbun, 1896; Eucheilota menoni Kramp, 1959; and Grandidierella japonica Stephensen, 1938, exhibited a patchy distribution across the sampled months, suggesting intermittent occurrences. Conversely, the following species were each detected in only one month: Amphibalanus eburneus (Gould, 1841) in April 2023; Botrylloides diegensis Ritter & Forsyth, 1917 in September; Bugulina stolonifera (Ryland, 1960) in November; Celleporaria brunnea (Hincks, 1884) in October; Gonionemus vertens A. Agassiz, 1862 in September; and Watersipora subtorquata (d’Orbigny, 1852) in July.
4. Discussion
This study aimed to leverage additional data generated from previous COI-based DNA metabarcoding studies primarily targeting ichthyoplankton to identify co-occurring mesozooplankton diversity and explore distribution patterns across estuarine and coastal environments. A total of 403 mesozooplankton species from 10 metazoan phyla were identified alongside the target fish species, demonstrating that ichthyoplankton metabarcoding amplicon libraries can also provide valuable insights into non-target communities and highlighting the potential of DNA metabarcoding to simultaneously recover biodiversity information across multiple taxonomic groups from a single dataset.
The results of the separate analyses revealed higher diversity at nearshore sites in the marine datasets, while the estuarine dataset exhibited marked seasonal variation in mesozooplankton composition, with richness peaking in spring. Notably, atypical hydrological and climatic conditions during the sampling year may have contributed to observed lower diversity in summer (n = 105) compared to unexpectedly higher richness in winter (n = 126). Furthermore, the detection of 28 non-indigenous species (NIS) highlights the value of DNA metabarcoding in screening for potentially introduced taxa, even within non-targeted monitoring programme.
4.1. COI Multi-Primer Metabarcoding Uncovered Extensive Mesozooplankton Invertebrate Diversity
The primary objective of using surplus data from COI ichthyoplankton metabarcoding was successfully achieved, as evidenced by the identification of over 400 additional mesozooplanktonic taxa across marine and estuarine samples. Nevertheless, as in any metabarcoding survey, the observed assemblage reflects the taxonomic diversity captured under the methodological conditions applied and may not fully represent all taxa present, given differences in primer-template affinity, amplification efficiency, DNA abundance among taxa, sequencing depth, and reference-database completeness. The mesh sizes used in the marine and estuarine surveys (335 and 500 µm, respectively) may also have under-represented small copepods, nauplii, and other early developmental stages while favoring the retention of larger organisms. Consequently, the reported proportions at the phylum and class levels characterize the size fraction retained by the sampling gear rather than the entire community, as metabarcoding cannot recover taxa that were not efficiently collected. Nevertheless, the consistent sampling approach within each dataset supports comparisons of the sampled taxonomic fraction. As anticipated, the generalist primer mlCOIintF/LoboR1 was pivotal in broadening the taxonomic diversity detected in this study, with 375 mesozooplanktonic species identified. Of these, 61.60% were detected exclusively by this primer, corresponding to 231 species. These results align with prior studies that have employed this primer pair in marine habitats, consistently highlighting its good performance in retrieving metazoan species across various environments [27,34,35,36,37]. Despite its design specifically tailored for fish detection, the FishATL_Cocktail2 primer set detected 172 mesozooplanktonic invertebrate species globally. Importantly, this primer cocktail detected 28 species not captured by the generalist primer, including 4 annelids, 16 arthropods, 2 cnidarians, 4 echinoderms, and 2 mollusks. As the initial rationale was to make use of the full COI datasets generated, it was surprising to observe the complementary value provided by the fish-specific cocktail primer, contributing to a 6.95% increase in the total mesozooplankton diversity recovered in the study, while demonstrating an unexpected ability to detect taxa beyond its primary target group.
These detailed taxonomic identifications were supported by the availability of comparatively extensive COI reference databases for the study region [63,64,65,66,67]. The curation process, which involved BIN inspections [68], auditing of COI reference records [50], and nomenclature verification, was used to increase confidence in species-level assignments and minimize potential taxonomic misassignments. The application of this molecular approach marks a significant advancement in planktonic community research for the Guadiana Estuary region, which has previously relied primarily on traditional morphological inspection methods [69,70,71,72,73,74].
76 historical species represented in the database resulted in an overlap of 62.5% (15 of 24 species) between the historical and molecular data. These percentages represent comparisons between datasets rather than estimates of metabarcoding detection efficiency, since the historical and molecular surveys may have differed in aspects such as sampling gear, effort, season, and taxonomic methodology. Despite the availability of a robust COI barcode library for the study region, many species remain underrepresented or lack suitable COI reference sequences, emphasizing the need for ongoing efforts to complete these reference libraries [75]. Consequently, historically documented species not recovered in the metabarcoding dataset cannot be considered biologically absent, as their non-detection may reflect incomplete reference-library coverage, insufficient marker resolution, primer bias, low abundance, or other methodological factors. In particular, the 500 µm mesh used for estuarine sampling may have reduced the retention of smaller taxa and early developmental stages, further contributing to differences between the historical records and the taxa detected in this study. The molecular dataset should therefore be regarded as a complementary biodiversity assessment rather than an exhaustive inventory, and molecular non-detection should not be interpreted as evidence of local absence without additional supporting data. In addition, previous morphological studies have identified the genera Idotea, Pleopis, and Podon without achieving species-level resolution. Our HTS data provided species-level identifications within these genera, likely corresponding to these historical records that remained taxonomically unresolved. This demonstrates the potential of DNA metabarcoding to generate valuable taxonomic information, aiding in more precise morphological identifications and addressing some of the inherent limitations of traditional morphological methods [39]. The first-time application of DNA-based approaches in this region establishes a valuable baseline for future monitoring assessments.
4.2. Coastal Proximity and Seasonality Effects on Mesozooplankton Invertebrate Diversity and Community Structure
The results from the marine samples indicated a trend of higher mesozooplanktonic invertebrate diversity at nearshore sites (inner and middle shore) compared to outer shore and offshore locations. This apparent pattern reflects only the upper water-column fraction sampled at night during this campaign, a limitation that may be particularly relevant at the outer shore and offshore sites because of their greater depths. It should therefore not be interpreted as evidence of lower richness throughout the entire water column. The marked difference in richness between F1 (168 taxa) and F2 (48 taxa) indicates substantial site-specific variability and suggests that distance from shore alone is insufficient to explain the observed pattern. Local environmental conditions, habitat characteristics, and hydrodynamic processes may also have contributed to this variation, although these factors were not directly evaluated. Despite this apparent trend, the differences in species composition were not significant, aligning with a pattern previously reported by Ben-Hamadou et al. [76] for the Portuguese southern coastal zone. Because marine sampling was limited to a single campaign in June 2022, the observed spatial patterns may reflect conditions specific to that sampling period and should not be generalized to the annual marine community. Future studies in these areas should enhance sampling efforts to generate robust data on community variability that can validate potential spatial patterns.
Regarding the estuarine samples, mesozooplanktonic invertebrate composition showed significant seasonal variation, with differences in species richness across seasons. Spring emerged as the most diverse season, characterized by a distinct community structure compared to other seasons, particularly summer and autumn. This peak in diversity follows expected patterns and may be associated with favorable environmental conditions such as increased water temperature, higher nutrient availability, and enhanced primary productivity, which could promote zooplankton proliferation. The dominance of Arthropoda, Mollusca, and Cnidaria across all seasons was consistently observed, with Annelida showing a marked increase during spring months. Copepods were among the most frequent taxa in our samples, something consistent with previous morphology-based studies that identified them as a dominant group [70,72,73]. In addition, the increased presence of copepods in the lower section of the Guadiana River Estuary across the year [69] was corroborated by our data. Interestingly, in terms of species richness, Malacostraca crustaceans exhibited the highest diversity, with 72 recorded species. The greater richness of Malacostraca relative to Copepoda may partly reflect the 500 µm mesh used in the estuarine survey, which favored the retention of larger organisms while potentially under-sampling smaller copepods and early developmental stages, meaning that this pattern may not represent the relative richness of these classes across the entire estuarine community. This outcome may also have been influenced by a bias in our reference library, as this taxonomic group can be more represented compared to others. Species from the genera Acartia, Centropages, Paracalanus, Paracartia, and Temora were detected nearly every month of the study period, highlighting their persistent role in the estuarine mesozooplankton community. Additionally, the pattern observed by Chícharo et al. [71] of a decline in Insecta and Mysida records due to reduced freshwater habitats in the lower Guadiana Estuary is consistent with our findings. Insecta were absent from our samples, while only five Mysida species were detected, with sporadic occurrences found throughout the study period. For instance, Mesopodopsis slabberi, previously documented as a common presence in the estuary, was only recorded in December, indicating a potential reduction in suitable habitat conditions for this group. Once again, this underrepresentation may be attributed to a bias in our reference databases, as species from this taxonomic group may lack available reference sequences needed for accurate taxonomic assignments.
Interestingly, while we expected higher zooplankton diversity during the warmer months, in line with historical trends in the Guadiana Estuary [69,70], our results revealed lower richness in summer (n = 105) than in winter (n = 126). Summer months are generally expected to support greater zooplankton diversity, with meroplankton reaching its highest densities, due to stable environmental conditions and warmer temperatures [69,70]. However, summer exhibited lower richness compared to other seasons. The climatic and hydrological conditions observed during the sampling period offer a possible explanation for this pattern, although some environmental variables were not directly evaluated. In particular, the hydrological conditions associated with an exceptionally dry year may have had a stronger influence than seasonal temperature, given the reduced rainfall and potential decrease in freshwater discharge from the Alqueva Dam into the estuary, similar to the pattern observed by Chícharo et al. [70]. In fact, the summer of 2022 was classified as extremely hot and very dry, ranking as the fourth hottest since 1931, with less than half of the usual summer rainfall being recorded [77]. This scenario of reduced freshwater inflow during the sampling period could have induced changes in both biotic components—including reduced planktonic productivity and altered phytoplankton composition and prey availability—and abiotic conditions—including increased salinity, reduced nutrient inputs, and modified turbidity—potentially affecting the entire food web and the typical mesozooplankton community structure of the estuarine ecosystem [70,78]. Conversely, winter, traditionally characterized by lower zooplankton richness, emerged as the second most diverse season. This result coincided with positive precipitation anomalies recorded at the end of summer and throughout autumn 2022 [77]. If these increased precipitation translated into greater freshwater inflow from the Alqueva dam to the lower estuary, the consequent freshwater pulses may have renewed nutrient inputs, promoting phytoplankton diversity and consequently increasing prey availability for zooplankton, as previously reported by Chícharo et al. [70], which could help explain the comparatively rich mesozooplankton assemblage recorded during the colder months. As a complementary observation, the fish community did not exhibit the same seasonal pattern. Although spring presented the highest species richness (n = 78), as expected, summer (n = 59) remained slightly richer than winter (n = 52), while winter exceeded autumn (n = 46) [40]. The temporal patterns observed here represent a single annual cycle from April 2022 to April 2023 and should not be interpreted as recurrent seasonal dynamics. Although the unusual climatic conditions recorded during this period may have contributed to the observed variation, their influence cannot be separated from other environmental and biological drivers. Multi-year monitoring is therefore required to distinguish consistent seasonal patterns from year-specific variability.
The seasonal fluctuations observed in this work reinforce the dynamic nature of mesozooplankton communities in estuarine systems and demonstrate the capability of molecular tools to detect these patterns even when analyzing non-target communities recovered through DNA metabarcoding. This level of sensitivity enabled the detection of variations in community structure caused by unusual hydrological and climatic conditions, which is particularly relevant in environments such as the Guadiana River Estuary, where seasonal variability can strongly influence ecosystem functioning.
4.3. DNA Metabarcoding Revealed to Be Highly Efficient for Detecting Non-Indigenous Species (NIS)
Twenty-eight non-indigenous species were identified across the mesozooplanktonic marine and estuarine samples, as referenced in the 2024 MSFD report [60], accounting for 6.95% of the total mesozooplankton diversity recovered. From this recent list, eighteen species have already been documented as NIS in Portuguese coastal areas, coastal lagoons, estuaries, and islands by Chainho et al. [79], with established references to their initial records.
Specifically, within the Guadiana Estuary, the species Blackfordia virginica and Palaemon macrodactylus were first documented by Chícharo et al. [80], highlighting potential impacts on the estuary’s nursery function and competition for food with native species. Subsequent records of B. virginica were also reported in the following years by Bode et al. [69] and Muha et al. [72]. Additionally, two species listed in the 2024 MSFD report, Acartia (Acanthacartia) tonsa and Pseudodiaptomus marinus, were recently documented in the estuary by Reyes-Martínez et al. [73]. Several species detected in this study, including Botrylloides diegensis, Clytia linearis, Eucheilota menoni, Jassa slatteryi, and Neomysis integer, may represent the first records of these taxa in the sampled region. Conversely, four NIS listed for the Bay of Biscay and the Iberian Coast had previously been recorded in Portuguese waters, and their detection in this study provides additional confirmation of their presence. Ostrea stentina was described in the Ria Formosa Lagoon by López-Sanmartín et al. [81], and its identification in the marine samples of this study aligns with previous findings. Pseudodiaptomus marinus was recently identified in 2023 along the western coast of Portugal; its known adaptability to adverse environments and multiple introduction vectors likely explain its dispersal [82]. Additionally, Grandidierella japonica was previously reported in aquaculture facilities associated with the Ria Formosa Lagoon, where it was one of the most abundant amphipod species identified [83]. Paracalanus quasimodo, a copepod recorded in the Berlengas Archipelago through COI metabarcoding [84], was among the most frequently detected species in terms of read abundance in that study. In our samples, P. quasimodo was identified in nearly all, except for one offshore marine site, which suggests its persistent occurrence within the region. This species may have been previously overlooked due to misidentifications, either morphologically—owing to its similar traits to congeners Paracalanus parvus parvus and Paracalanus indicus Wolfenden, 1906—or molecularly, due to their relatively low genetic differentiation [5,85].
The molecular detection of these species raises important questions regarding their plausibility and potential ecological impact on the south coast of Portugal, emphasizing the utility of DNA metabarcoding for early detection and biosecurity monitoring [5,86]. Nevertheless, NIS assignments supported by only one or a few reads should be regarded as provisional molecular detections, as sequencing-level artifacts cannot be completely excluded. Further surveys are crucial to validate these findings and assess whether the detected taxa represent established populations in the area, particularly through continued sampling and complementary morphology-based assessments. Additionally, conducting targeted sampling efforts specifically designed for detecting NIS would enhance their identification accuracy and contribute to a better understanding of their distribution and potential establishment within the estuarine ecosystem.
5. Conclusions
This study demonstrated the effectiveness of DNA metabarcoding in providing valuable insights into mesozooplankton invertebrate diversity across estuarine and coastal environments, extending beyond the targeted characterization of ichthyoplankton. By employing a multi-primer approach, an extensive assessment of the mesozooplankton community was achieved without requiring a separate sequencing effort, capturing a wide range of taxa beyond the targeted fish species. The separate analyses revealed differences in species richness within the marine dataset and significant temporal variation within the estuarine dataset. The detection of DNA assigned to taxa classified as NIS highlights the potential of DNA metabarcoding to complement early-detection initiatives and biodiversity monitoring programmes.
Despite these promising results, molecular methodologies still require further refinement, particularly through improved sampling strategies, more comprehensive reference databases, and robust validation procedures to reduce false-positive and false-negative detections, thereby enhancing the accuracy and reliability of species identification. Additionally, these findings reinforce the need for future efforts to integrate DNA-based methods with traditional morphological assessments to maximize detection precision and deepen our understanding of ecosystem dynamics. Finally, this study contributes to a more comprehensive understanding of mesozooplankton diversity in the Guadiana Estuary and adjacent coastal areas, showing that the integration of DNA metabarcoding into routine monitoring surveys will improve the assessment of the impacts of environmental and anthropogenic pressures on marine communities, contributing to the management and conservation of these ecologically important ecosystems.
Supplementary Materials
The following supporting information can be downloaded at https://www.mdpi.com/article/10.3390/jmse14212112/s1, The supplementary material provides sequencing summaries, taxonomic assignments and classifications, statistical analyses, and historical zooplankton records supporting the results presented in the main text. Table S1: Total number of Raw reads generated through Illumina MiSeq high-throughput sequencing for DNA metabarcoding, Usable reads retained after bioinformatics processing steps (including primer removal, demultiplexing, quality filtering, and denoising), reads taxonomically assigned to the species level (Assigned reads), and reads specifically assigned to mesozooplankton invertebrate taxa (Fish reads) for each COI primer set; Table S2: Number of reads assigned to each mesozooplankton invertebrate identified using the COI primer pair mICOIintF/LoboR1, together with the percentage identity obtained from PMiFish, the corresponding Barcode Index Number (BIN) in BOLD, and the percent identity, E-value, and query coverage (%) of the best GenBank BLAST match; Table S3: Number of reads assigned to each mesozooplankton invertebrate identified using the COI primer set FishATL_Cocktail2, together with the percentage identity obtained from PMiFish, the corresponding Barcode Index Number (BIN) in BOLD, and the percent identity, E-value, and query coverage (%) of the best GenBank BLAST match; Table S4: Taxonomic classification of the mesozooplankton species identified in this study, listed at the species level together with their respective authorities, according to the World Register of Marine Species (WoRMS; accessed 8 July 2026). Species are arranged alphabetically by phylum (↓); Table S5: Summary of PERMANOVA results (based on 999 permutations) assessing differences in species composition across coastal categories of marine samples. The table includes Df (degrees of freedom), SumOfSqs (sums of squares), R2 (explained variation), F (F-test value), and p (p-value of the F score); Table S6: Pairwise PERMANOVA results (based on 999 permutations) assessing differences in species composition across coastal categories of marine samples. The table includes Df (degrees of freedom), SumOfSqs (sums of squares), R2 (proportion of explained variation), F (F-test statistic), and p-value (significance level). Comparisons were made between different coastal zones: Inner Shore, Middle Shore, Outer Shore, and Offshore; Table S7: Summary of PERMANOVA results (based on 999 permutations) assessing differences in mesozooplanktonic species composition across seasons for estuarine samples from the Guadiana River Estuary. The table includes Df (degrees of freedom), SumOfSqs (sums of squares), R2 (proportion of explained variation), F (F-test statistic), and p-value (significance level). Significant values are indicated with "".**; Table S8: Pairwise-PERMANOVA results (based on 999 permutations) assessing differences in mesozooplanktonic species composition across seasons in estuarine samples from the Guadiana River Estuary. The table includes Df (degrees of freedom), SumOfSqs (sums of squares), R2 (proportion of explained variation), F (F-test statistic), and p-value (significance level); Table S9: Historical records of zooplanktonic species identified morphologically in the Guadiana River Estuary, based on findings from previous studies. Species are organized alphabetically by phylum name (↓).
Author Contributions
Conceptualization, A.O.F., S.D., A.M.P.-S. and F.O.C.; methodology, A.O.F., O.M.A., C.B., S.D. and C.E.; investigation, A.O.F.; data curation, A.O.F.; formal analysis, A.O.F.; validation, A.O.F.; supervision, A.M.P.-S. and F.O.C.; funding acquisition, F.O.C.; writing—original draft preparation, A.O.F.; writing—review and editing, A.O.F., O.M.A., C.B., S.D., C.E., A.M.P.-S. and F.O.C. All authors have read and agreed to the published version of the manuscript.
Funding
This research was funded by the project “A-Fish-DNA-Scan: Cutting-edge DNA-based approaches for improved monitoring and management of fisheries resources along Magellan-Elcano’s Atlantic route” (CIRCNABRB/0156/2019; https://doi.org/10.54499/CIRCNA/BRB/0156/2019) financed by the Foundation for Science and Technology (FCT, I.P.), by the CBMA “Contrato-Programa” (UIDB/04050/2020; https://doi.org/10.54499/UIDB/04050/2020) and by the ARNET “Contrato-Programa” (LA/P/0069/2020; https://doi.org/10.54499/LA/P/0069/2020) funded by national funds through FCT, I.P. A.O.F. (2020.06653.BD; https://doi.org/10.54499/2020.06653.BD) and S.D. (https://doi.org/10.54499/CEECIND/00667/2017/CP1458/CT0001) were financially supported by FCT I.P. This work was also supported by the European Regional Development Fund (ERDF) through the Operational Programme for Competitiveness and Internationalisation—COMPETE 2020 and Portuguese national funds from FCT, I.P. under the strategic project UIDB/04539/2020, UIDP/04539/2020 and LA/P/0058/2020 and contributed to the Strategic Research Plan of CCMAR under the contracts UIDB/04326/2020, UIDP/04326/2020 and LA/P/0101/2020 funded by FCT. I.P.
Institutional Review Board Statement
All fieldwork was conducted in accordance with the ethical standards established by the former General Directorate of Veterinary (DGV), under the former Portuguese Ministry of Agriculture, Rural Development and Fisheries, for ichthyoplankton collection and ecological research, and complied with the ARRIVE guidelines.
Data Availability Statement
The raw sequence data generated from the marine and estuarine bulk samples have been deposited in the NCBI Sequence Read Archive (SRA) under BioProject accession numbers PRJNA1329156 and PRJNA1334324, respectively.
Acknowledgments
We sincerely thank the crew of the R/V Mário Ruivo for their invaluable assistance during the field campaign, as well as everyone who supported our researchers throughout the 13 months of sampling in the Guadiana Estuary.
Conflicts of Interest
The authors declare no competing interests.
References
- Barbier, E.B. Marine Ecosystem Services. Curr. Biol. 2017, 27, R507–R510. [Google Scholar] [CrossRef] [Scilit] [PubMed]
- Tett, P.; Gowen, R.J.; Painting, S.J.; Elliott, M.; Forster, R.; Mills, D.K.; Bresnan, E.; Capuzzo, E.; Fernandes, T.F.; Foden, J. Framework for Understanding Marine Ecosystem Health. Mar. Ecol. Prog. Ser. 2013, 494, 1–27. [Google Scholar] [CrossRef] [Scilit]
- Crain, C.M.; Halpern, B.S.; Beck, M.W.; Kappel, C.V. Understanding and Managing Human Threats to the Coastal Marine Environment. Ann. N. Y. Acad. Sci. 2009, 1162, 39–62. [Google Scholar] [CrossRef] [Scilit] [PubMed]
- Kennish, M.J. Environmental Threats and Environmental Future of Estuaries. Environ. Conserv. 2002, 29, 78–107. [Google Scholar] [CrossRef] [Scilit]
- Stefanni, S.; Stanko, D.; Borme, D.; De Olazabal, A.; Juretić, T.; Pallavicini, A.; Tirelli, V. Multi-Marker Metabarcoding Approach to Study Mesozooplankton at Basin Scale. Sci. Rep. 2018, 8, 12085. [Google Scholar] [CrossRef] [Scilit] [PubMed]
- Kennish, M.J. Management Strategies to Mitigate Anthropogenic Impacts in Estuarine and Coastal Marine Environments: A Review. Open J. Ecol. 2022, 12, 667–688. [Google Scholar] [CrossRef]
- Chiba, S.; Batten, S.; Martin, C.S.; Ivory, S.; Miloslavich, P.; Weatherdon, L.V. Zooplankton Monitoring to Contribute towards Addressing Global Biodiversity Conservation Challenges. J. Plankton Res. 2018, 40, 509–518. [Google Scholar] [CrossRef] [Scilit] [PubMed]
- Gannon, J.E.; Stemberger, R.S. Zooplankton (Especially Crustaceans and Rotifers) as Indicators of Water Quality. Trans. Am. Microsc. Soc. 1978, 97, 16–35. [Google Scholar] [CrossRef] [Scilit]
- Kour, S.; Slathia, D.; Sharma, N.; Kour, S.; Verma, R. Zooplankton as Bioindicators of Trophic Status of a Lentic Water Source, Jammu (J&K) with Remarks on First Reports. Proc. Natl. Acad. Sci. India Sect. B—Biol. Sci. 2022, 92, 393–404. [Google Scholar] [CrossRef] [Scilit]
- Bindoff, N.L.; Cheung, W.W.L.; Kairo, J.G.; Arístegui, J.; Guinder, V.A.; Hallberg, R.; Hilmi, N.; Jiao, N.; Karim, S.; Levin, L. Changing Ocean, Marine Ecosystems, and Dependent Communities. In IPCC Special Report on the Ocean and Cryosphere in a Changing Climate; Pörtner, H.-O., Roberts, D.C., Masson-Delmotte, V., Zhai, P., Tignor, M., Poloczanska, E., Mintenbeck, K., Alegría, A., Nicolai, M., Okem, A., et al., Eds.; Cambridge University Press: Cambridge, UK; New York, NY, USA, 2019; pp. 447–588. [Google Scholar]
- Calbet, A.; Landry, M.R. Phytoplankton Growth, Microzooplankton Grazing, and Carbon Cycling in Marine Systems. Limnol. Oceanogr. 2004, 49, 51–57. [Google Scholar] [CrossRef] [Scilit]
- Novotny, A.; Zamora-Terol, S.; Winder, M. DNA Metabarcoding Reveals Trophic Niche Diversity of Micro and Mesozooplankton Species. Proc. R. Soc. B 2021, 288, 20210908. [Google Scholar] [CrossRef] [Scilit] [PubMed]
- Kiørboe, T. Formation and Fate of Marine Snow: Small-Scale Processes with Large-Scale Implications. Sci. Mar. 2001, 65, 57–71. [Google Scholar] [CrossRef] [Scilit]
- Steinberg, D.K.; Landry, M.R. Zooplankton and the Ocean Carbon Cycle. Ann. Rev. Mar. Sci. 2017, 9, 413–444. [Google Scholar] [CrossRef] [Scilit] [PubMed]
- Yu, D.W.; Ji, Y.; Emerson, B.C.; Wang, X.; Ye, C.; Yang, C.; Ding, Z. Biodiversity Soup: Metabarcoding of Arthropods for Rapid Biodiversity Assessment and Biomonitoring. Methods Ecol. Evol. 2012, 3, 613–623. [Google Scholar] [CrossRef] [Scilit]
- Darling, J.A.; Blum, M.J. DNA-Based Methods for Monitoring Invasive Species: A Review and Prospectus. Biol. Invasions 2007, 9, 751–765. [Google Scholar] [CrossRef] [Scilit]
- Hebert, P.D.N.; Cywinska, A.; Ball, S.L.; DeWaard, J.R. Biological Identifications through DNA Barcodes. Proc. R. Soc. B Biol. Sci. 2003, 270, 313–321. [Google Scholar] [CrossRef] [Scilit] [PubMed]
- Bucklin, A.; Lindeque, P.K.; Rodriguez-Ezpeleta, N.; Albaina, A.; Lehtiniemi, M. Metabarcoding of Marine Zooplankton: Prospects, Progress and Pitfalls. J. Plankton Res. 2016, 38, 393–400. [Google Scholar] [CrossRef] [Scilit]
- Taberlet, P.; Coissac, E.; Hajibabaei, M.; Rieseberg, L.H. Environmental DNA. Mol. Ecol. 2012, 21, 1789–1793. [Google Scholar] [CrossRef] [Scilit] [PubMed]
- Porter, T.M.; Hajibabaei, M. Scaling up: A Guide to High-Throughput Genomic Approaches for Biodiversity Analysis. Mol. Ecol. 2018, 27, 313–338. [Google Scholar] [CrossRef] [Scilit] [PubMed]
- Borja, A.; Elliott, M.; Andersen, J.H.; Berg, T.; Carstensen, J.; Halpern, B.S.; Heiskanen, A.S.; Korpinen, S.; Stewart Lowndes, J.S.; Martin, G.; et al. Overview of Integrative Assessment of Marine Systems: The Ecosystem Approach in Practice. Front. Mar. Sci. 2016, 3, 20. [Google Scholar] [CrossRef] [Scilit]
- Chain, F.J.J.; Brown, E.A.; Macisaac, H.J.; Cristescu, M.E. Metabarcoding Reveals Strong Spatial Structure and Temporal Turnover of Zooplankton Communities among Marine and Freshwater Ports. Divers. Distrib. 2016, 22, 493–504. [Google Scholar] [CrossRef] [Scilit]
- Yeo, D.; Srivathsan, A.; Meier, R. Longer Is Not Always Better: Optimizing Barcode Length for Large-Scale Species Discovery and Identification. Syst. Biol. 2020, 69, 999–1015. [Google Scholar] [CrossRef] [Scilit] [PubMed]
- Duarte, S.; Vieira, P.E.; Lavrador, A.S.; Costa, F.O. Status and Prospects of Marine NIS Detection and Monitoring through (e)DNA Metabarcoding. Sci. Total Environ. 2021, 751, 141729. [Google Scholar] [CrossRef] [Scilit] [PubMed]
- Lavrador, A.S.; Amaral, F.G.; Moutinho, J.; Vieira, P.E.; Costa, F.O.; Duarte, S. Comprehensive DNA Metabarcoding-Based Detection of Non-Indigenous Invertebrates in Recreational Marinas through a Multi-Substrate Approach. Mar. Environ. Res. 2024, 200, 106660. [Google Scholar] [CrossRef] [Scilit] [PubMed]
- Weigand, H.; Beermann, A.J.; Čiampor, F.; Costa, F.O.; Csabai, Z.; Duarte, S.; Geiger, M.F.; Grabowski, M.; Rimet, F.; Rulik, B.; et al. DNA Barcode Reference Libraries for the Monitoring of Aquatic Biota in Europe: Gap-Analysis and Recommendations for Future Work. Sci. Total Environ. 2019, 678, 499–524. [Google Scholar] [CrossRef] [Scilit] [PubMed]
- Sieburth, J.M.; Smetacek, V.; Lenz, J. Pelagic Ecosystem Structure: Heterotrophic Compartments of the Plankton and Their Relationship to Plankton Size Fractions. Limnol. Oceanogr. 1978, 23, 1256–1263. [Google Scholar] [CrossRef] [Scilit]
- Moriarty, R.; O’Brien, T.D. Distribution of Mesozooplankton Biomass in the Global Ocean. Earth Syst. Sci. Data 2013, 5, 45–55. [Google Scholar] [CrossRef] [Scilit]
- Buitenhuis, E.; Le Quéré, C.; Aumont, O.; Beaugrand, G.; Bunker, A.; Hirst, A.; Ikeda, T.; O’Brien, T.; Piontkovski, S.; Straile, D. Biogeochemical Fluxes through Mesozooplankton. Glob. Biogeochem. Cycles 2006, 20, GB2003. [Google Scholar] [CrossRef] [Scilit]
- Miya, M.; Sato, Y.; Fukunaga, T.; Sado, T.; Poulsen, J.Y.; Sato, K.; Minamoto, T.; Yamamoto, S.; Yamanaka, H.; Araki, H.; et al. MiFish, a Set of Universal PCR Primers for Metabarcoding Environmental DNA from Fishes: Detection of More than 230 Subtropical Marine Species. R. Soc. Open Sci. 2015, 2, 150088. [Google Scholar] [CrossRef] [Scilit] [PubMed]
- Leray, M.; Yang, J.Y.; Meyer, C.P.; Mills, S.C.; Agudelo, N.; Ranwez, V.; Boehm, J.T.; Machida, R.J. A New Versatile Primer Set Targeting a Short Fragment of the Mitochondrial COI Region for Metabarcoding Metazoan Diversity: Application for Characterizing Coral Reef Fish Gut Contents. Front. Zool. 2013, 10, 34. [Google Scholar] [CrossRef] [Scilit] [PubMed]
- Lobo, J.; Costa, P.M.; Teixeira, M.A.L.; Ferreira, M.S.G.; Costa, M.H.; Costa, F.O. Enhanced Primers for Amplification of DNA Barcodes from a Broad Range of Marine Metazoans. BMC Ecol. 2013, 13, 34. [Google Scholar] [CrossRef] [Scilit] [PubMed]
- Chang, J.J.M.; Ip, Y.C.A.; Neo, W.L.; Mowe, M.A.D.; Jaafar, Z.; Huang, D. Primed and Ready: Nanopore Metabarcoding Can Now Recover Highly Accurate Consensus Barcodes That Are Generally Indel-Free. BMC Genom. 2024, 25, 842. [Google Scholar] [CrossRef] [Scilit] [PubMed]
- Jungbluth, M.J.; Burns, J.; Grimaldo, L.; Slaughter, A.; Katla, A.; Kimmerer, W. Feeding Habits and Novel Prey of Larval Fishes in the Northern San Francisco Estuary. Environ. DNA 2021, 3, 1059–1080. [Google Scholar] [CrossRef] [Scilit]
- Leite, B.R.; Duarte, S.; Troncoso, J.S.; Costa, F.O. Artificial Seaweed Substrates Complement ARMS in DNA Metabarcoding-Based Monitoring of Temperate Coastal Macrozoobenthos. Diversity 2023, 15, 657. [Google Scholar] [CrossRef] [Scilit]
- Moutinho, J.; Carreira-Flores, D.; Gomes, P.T.; Costa, F.O.; Duarte, S. Assessing the Seasonal and Spatial Dynamics of Zooplankton through DNA Metabarcoding in a Temperate Estuary. Animals 2023, 13, 3876. [Google Scholar] [CrossRef] [Scilit] [PubMed]
- van der Reis, A.L.; Beckley, L.E.; Olivar, M.P.; Jeffs, A.G. Nanopore Short-Read Sequencing: A Quick, Cost-Effective and Accurate Method for DNA Metabarcoding. Environ. DNA 2023, 5, 282–296. [Google Scholar] [CrossRef] [Scilit]
- Bourlat, S.J.; Borja, A.; Gilbert, J.; Taylor, M.I.; Davies, N.; Weisberg, S.B.; Griffith, J.F.; Lettieri, T.; Field, D.; Benzie, J.; et al. Genomics in Marine Monitoring: New Opportunities for Assessing Marine Health Status. Mar. Pollut. Bull. 2013, 74, 19–31. [Google Scholar] [CrossRef] [Scilit] [PubMed]
- Ferreira, A.O.; Azevedo, O.M.; Barroso, C.; Duarte, S.; Egas, C.; Fontes, J.T.; Ré, P.; Santos, A.M.P.; Costa, F.O. Multi-Marker DNA Metabarcoding for Precise Species Identification in Ichthyoplankton Samples. Sci. Rep. 2024, 14, 19772. [Google Scholar] [CrossRef] [Scilit] [PubMed]
- Ferreira, A.O.; Machado, C.; Azevedo, O.M.; Barroso, C.; Duarte, S.; Egas, C.; Piecho-Santos, A.M.; Costa, F.O. From Egg to Adult: Combining Morphology, Bulk Metabarcoding and EDNA for Comprehensive Monthly Monitoring of Ichthyoplankton in a Temperate Estuary. Estuar. Coast. Shelf Sci. 2026, 340, 110074. [Google Scholar] [CrossRef] [Scilit]
- CalTopo LLC. CalTopo [Web Mapping Application]. 2021. Available online: https://caltopo.com/ (accessed on 27 January 2026).
- Steinke, D.; DeWaard, S.L.; Sones, J.E.; Ivanova, N.V.; Prosser, S.W.J.; Perez, K.; Braukmann, T.W.A.; Milton, M.; Zakharov, E.V.; Dewaard, J.R.; et al. Message in a Bottle—Metabarcoding Enables Biodiversity Comparisons across Ecoregions. Gigascience 2022, 11, giac040. [Google Scholar] [CrossRef] [Scilit] [PubMed]
- Ivanova, N.V.; Dewaard, J.R.; Hebert, P.D.N. An Inexpensive, Automation-Friendly Protocol for Recovering High-Quality DNA. Mol. Ecol. Notes 2006, 6, 998–1002. [Google Scholar] [CrossRef] [Scilit]
- Costa, G.O.; Nobile, A.B.; Morales, B.F.; Rossini, B.C.; Souza, D.F.; Freitas, É.A.S.; Oliveira, C. Identification of Fish Eggs and Larvae Using a Novel DNA Metabarcoding Approach. Neotrop. Ichthyol. 2025, 23, e250005. [Google Scholar] [CrossRef] [Scilit]
- Ward, R.D.; Zemlak, T.S.; Innes, B.H.; Last, P.R.; Hebert, P.D.N. DNA Barcoding Australia’s Fish Species. Philos. Trans. R. Soc. B Biol. Sci. 2005, 360, 1847–1857. [Google Scholar] [CrossRef] [Scilit] [PubMed]
- Jennings, W.B.; Ruschi, P.A.; Ferraro, G.; Quijada, C.C.; Silva-Malanski, A.C.G.; Prosdocimi, F.; Buckup, P.A. Barcoding the Neotropical Freshwater Fish Fauna Using a New Pair of Universal COI Primers with a Discussion of Primer Dimers and M13 Primer Tails. Genome 2019, 62, 77–83. [Google Scholar] [CrossRef] [Scilit] [PubMed]
- Illumina, Inc. 16S Metagenomic Sequencing Library Preparation: Preparing 16S Ribosomal RNA Gene Amplicons for the Illumina MiSeq System; Part No. 15044223 Rev. B; Illumina, Inc.: San Diego, CA, USA, 2013; Available online: https://www.illumina.com/content/dam/illumina-support/documents/documentation/chemistry_documentation/16s/16s-metagenomic-library-prep-guide-15044223-b.pdf (accessed on 20 February 2026).
- Miya, M.; Gotoh, R.O.; Sado, T. MiFish Metabarcoding: A High-Throughput Approach for Simultaneous Detection of Multiple Fish Species from Environmental DNA and Other Samples. Fish. Sci. 2020, 86, 939–970. [Google Scholar] [CrossRef] [Scilit]
- Edgar, R.C. Search and Clustering Orders of Magnitude Faster than BLAST. Bioinformatics 2010, 26, 2460–2461. [Google Scholar] [CrossRef] [Scilit] [PubMed]
- Fontes, J.T.; Vieira, P.E.; Ekrem, T.; Soares, P.; Costa, F.O. BAGS: An Automated Barcode, Audit & Grade System for DNA Barcode Reference Libraries. Mol. Ecol. Resour. 2021, 21, 573–583. [Google Scholar] [CrossRef] [Scilit] [PubMed]
- Ratnasingham, S.; Hebert, P.D.N. BOLD: The Barcode of Life Data System. Mol. Ecol. Notes 2007, 7, 355–364. [Google Scholar] [CrossRef] [Scilit] [PubMed]
- Dubois, S.; Chamberlain, S. bold: Interface to BOLD Systems API, version 1.3.0; R package. 2024. Available online: https://github.com/ropensci/bold/releases/tag/v1.3.0 (accessed on 15 October 2025).
- R Core Team. R: A Language and Environment for Statistical Computing, version 4.0.4; R Foundation for Statistical Computing: Vienna, Austria, 2021; Available online: https://www.R-project.org/ (accessed on 8 July 2026).
- WoRMS Editorial Board. World Register of Marine Species. Available online: https://www.marinespecies.org (accessed on 8 July 2026).
- Ratnasingham, S.; Hebert, P.D.N. A DNA-Based Registry for All Animal Species: The Barcode Index Number (BIN) System. PLoS ONE 2013, 8, e66213. [Google Scholar] [CrossRef] [Scilit] [PubMed]
- Camacho, C.; Coulouris, G.; Avagyan, V.; Ma, N.; Papadopoulos, J.; Bealer, K.; Madden, T.L. BLAST+: Architecture and Applications. BMC Bioinform. 2009, 10, 421. [Google Scholar] [CrossRef] [Scilit] [PubMed]
- Oksanen, J.; Simpson, G.L.; Blanchet, F.G.; Kindt, R.; Legendre, P.; Minchin, P.R.; O’Hara, R.B.; Solymos, P.; Stevens, M.H.H.; Szoecs, E.; et al. vegan: Community Ecology Package, version 2.6-4; R package. 2022. Available online: https://cran.r-project.org/src/contrib/Archive/vegan/vegan_2.6-4.tar.gz (accessed on 8 July 2026).
- Tennekes, M. treemap: Treemap Visualization, version 2.4-4; R package. 2023. Available online: https://CRAN.R-project.org/package=treemap (accessed on 8 July 2026).
- Wickham, H. Ggplot2: Elegant Graphics for Data Analysis; Springer-Verlag: New York, NY, USA, 2016. [Google Scholar]
- European Environment Agency. Marine Non-Indigenous Species in Europe’s Seas for MSFD D2—Tabular Data, September 2024. 2024. Available online: https://www.eea.europa.eu/en/datahub/datahubitem-view/8775b34c-bc10-4a6c-b446-f01b521bba85 (accessed on 8 July 2026).
- Wickham, H.; Vaughan, D.; Girlich, M. tidyr: Tidy Messy Data, version 1.3.1; R package. 2024. Available online: https://cran.r-project.org/src/contrib/Archive/tidyr/tidyr_1.3.1.tar.gz (accessed on 8 July 2026).
- Wickham, H.; François, R.; Henry, L.; Müller, K.; Vaughan, D. dplyr: A Grammar of Data Manipulation, version 1.1.4; R package. 2023. Available online: https://cran.r-project.org/src/contrib/Archive/dplyr/dplyr_1.1.4.tar.gz (accessed on 8 July 2026).
- Borges, L.M.S.; Hollatz, C.; Lobo, J.; Cunha, A.M.; Vilela, A.P.; Calado, G.; Coelho, R.; Costa, A.C.; Ferreira, M.S.G.; Costa, M.H.; et al. With a Little Help from DNA Barcoding: Investigating the Diversity of Gastropoda from the Portuguese Coast. Sci. Rep. 2016, 6, 20226. [Google Scholar] [CrossRef] [Scilit] [PubMed]
- Costa, F.O.; Landi, M.; Martins, R.; Costa, M.H.; Costa, M.E.; Carneiro, M.; Alves, M.J.; Steinke, D.; Carvalho, G.R. A Ranking System for Reference Libraries of DNA Barcodes: Application to Marine Fish Species from Portugal. PLoS ONE 2012, 7, e35858. [Google Scholar] [CrossRef] [Scilit] [PubMed]
- Leite, B.R.; Vieira, P.E.; Teixeira, M.A.L.; Lobo-Arteaga, J.; Hollatz, C.; Borges, L.M.S.; Duarte, S.; Troncoso, J.S.; Costa, F.O. Gap-Analysis and Annotated Reference Library for Supporting Macroinvertebrate Metabarcoding in Atlantic Iberia. Reg. Stud. Mar. Sci. 2020, 36, 101307. [Google Scholar] [CrossRef] [Scilit]
- Lobo, J.; Teixeira, M.A.L.; Borges, L.M.S.; Ferreira, M.S.G.; Hollatz, C.; Gomes, P.T.; Sousa, R.; Ravara, A.; Costa, M.H.; Costa, F.O. Starting a DNA Barcode Reference Library for Shallow Water Polychaetes from the Southern European Atlantic Coast. Mol. Ecol. Resour. 2016, 16, 298–313. [Google Scholar] [CrossRef] [Scilit] [PubMed]
- Lobo, J.; Shokralla, S.; Costa, M.H.; Hajibabaei, M.; Costa, F.O. DNA Metabarcoding for High-Throughput Monitoring of Estuarine Macrobenthic Communities. Sci. Rep. 2017, 7, 15618. [Google Scholar] [CrossRef] [Scilit] [PubMed]
- Lavrador, A.S.; Fontes, J.T.; Vieira, P.E.; Costa, F.O.; Duarte, S. Compilation, Revision, and Annotation of DNA Barcodes of Marine Invertebrate Non-Indigenous Species (NIS) Occurring in European Coastal Regions. Diversity 2023, 15, 174. [Google Scholar] [CrossRef] [Scilit]
- Bode, A.; Bueno, J.; López-Urrutia, Á.; Villate, F.; Uriarte, I.; Iriarte, A.; Alvarez-Ossorio, M.T.; Miranda, A.; Casas, G.; Santos, A.M.P.; et al. Zooplankton of the Bay of Biscay and Western Iberian Shelf. In ICES Zooplankton Status Report 2010/2011; O’Brien, T.D., Wiebe, P.H., Falkenhaug, T., Eds.; International Council for the Exploration of the Sea: Copenhagen, Denmark, 2013; ICES Cooperative Research Report No. 318; pp. 132–161. [Google Scholar]
- Chícharo, L.; Chícharo, M.A.; Ben-Hamadou, R. Use of a Hydrotechnical Infrastructure (Alqueva Dam) to Regulate Planktonic Assemblages in the Guadiana Estuary: Basis for Sustainable Water and Ecosystem Services Management. Estuar. Coast. Shelf Sci. 2006, 70, 3–18. [Google Scholar] [CrossRef] [Scilit]
- Chícharo, M.A.; Chícharo, L.M.; Galvão, H.; Barbosa, A.; Marques, M.H.; Andrade, J.P.; Esteves, E.; Miguel, C.; Gouveia, I. Status of the Guadiana Estuary (South Portugal) during 1996-1998: An Ecohydrological Approach. Aquat. Ecosyst. Heal. Manag. 2001, 4, 73–89. [Google Scholar] [CrossRef] [Scilit]
- Muha, T.P.; Chícharo, L.; Morais, P.; Pereira, R.; Ben-Hamadou, R.; Cruz, J.; Chícharo, M.A.T. The Effect of Distinct Hydrologic Conditions on the Zooplankton Community in an Estuary under Mediterranean Climate Influence. Ecohydrol. Hydrobiol. 2012, 12, 327–335. [Google Scholar] [CrossRef] [Scilit]
- Reyes-Martínez, M.J.; Miró, J.M.; Vicente, L.; Megina, C.; Donázar-Aramendía, I.; García-Gómez, J.C.; González-Gordillo, J.I. Mesozooplankton Assemblage in the Gulf of Cádiz Estuaries: Taxonomic and Trait-Based Approaches. Mar. Environ. Res. 2024, 198, 106554. [Google Scholar] [CrossRef] [Scilit] [PubMed]
- Sousa, N. Dynamics of Zooplankton Communities in the Alqueva Reservoir. Master’s Thesis, Faculdade de Ciências da Universidade do Porto, Porto, Portugal, 2018. [Google Scholar]
- Radulovici, A.E.; Vieira, P.E.; Duarte, S.; Teixeira, M.A.L.; Borges, L.M.S.; Deagle, B.E.; Majaneva, S.; Redmond, N.; Schultz, J.A.; Costa, F.O. Revision and Annotation of DNA Barcode Records for Marine Invertebrates: Report of the 8th IBOL Conference Hackathon. Metabarcoding Metagenomics 2021, 5, e67862. [Google Scholar] [CrossRef] [Scilit]
- Ben-Hamadou, R.; Chícharo, M.A.; Cruz, J.; Madeira, C.; Morais, P.; Chícharo, L. Spatial Distribution of Zooplankton Communities in the Algarve Coastal Zone (Northeast Atlantic Ocean). In Proceedings of the “Joint ICES/CIESM Workshop to Compare Zooplankton Ecology and Methodologies Between the Mediterranean and the North Atlantic (WKZEM)”; Gislason, A., Gorsky, G., Eds.; International Council for the Exploration of the Sea: Copenhagen, Denmark, 2010; ICES Cooperative Research Report No. 300; pp. 2–7. [Google Scholar]
- Instituto Português do Mar e da Atmosfera, I.P. Boletim Anual 2022; Version 1.0; Instituto Português do Mar e da Atmosfera, I.P.: Lisbon, Portugal, 2023. Available online: https://www.ipma.pt/pt/media/noticias/documentos/2022/Resumo_Climatologico_Ano2022_2.pdf (accessed on 20 February 2026).
- Sklar, F.H.; Browder, J.A. Coastal Environmental Impacts Brought about by Alterations to Freshwater Flow in the Gulf of Mexico. Environ. Manag. 1998, 22, 547–562. [Google Scholar] [CrossRef] [Scilit] [PubMed]
- Chainho, P.; Fernandes, A.; Amorim, A.; Ávila, S.P.; Canning-Clode, J.; Castro, J.J.; Costa, A.C.; Costa, J.L.; Cruz, T.; Gollasch, S.; et al. Non-Indigenous Species in Portuguese Coastal Areas, Coastal Lagoons, Estuaries and Islands. Estuar. Coast. Shelf Sci. 2015, 167, 199–211. [Google Scholar] [CrossRef] [Scilit]
- Chícharo, M.A.; Leitão, T.; Range, P.; Gutierrez, C.; Morales, J.; Morais, P.; Chícharo, L. Alien Species in the Guadiana Estuary (SE-Portugal/SW-Spain): Blackfordia Virginica (Cnidaria, Hydrozoa) and Palaemon Macrodactylus (Crustacea, Decapoda): Potential Impacts and Mitigation Measures. Aquat. Invasions 2009, 4, 501–506. [Google Scholar] [CrossRef] [Scilit]
- López-Sanmartín, M.; Batista, F.M.; del Carmen Marín, M.; Garrido, I.; Quintero, D.; Grade, A.; Ruano, F.; de la Herrán, R.; Navas, J.I. Detection of Marteilia Refringens Infecting the European Flat Oyster Ostrea Edulis and the Dwarf Oyster Ostrea Stentina in Southern Portugal and Spain. J. Invertebr. Pathol. 2015, 130, 52–55. [Google Scholar] [CrossRef] [Scilit] [PubMed]
- Uttieri, M.; Anadoli, O.; Banchi, E.; Battuello, M.; Beşiktepe, Ş.; Carotenuto, Y.; Marques, S.C.; de Olazabal, A.; Di Capua, I.; Engell-Sørensen, K.; et al. The Distribution of Pseudodiaptomus Marinus in European and Neighbouring Waters—A Rolling Review. J. Mar. Sci. Eng. 2023, 11, 1238. [Google Scholar] [CrossRef] [Scilit]
- Vieira, R.; Mateus, M.Â.; Afonso, C.M.L.; Soares, F.; Pousão-Ferreira, P.; Gamito, S. Macroinvertebrates Associated with Macroalgae within Integrated Multi-Trophic Aquaculture (IMTA) in Earthen Ponds: Potential for Accessory Production. J. Mar. Sci. Eng. 2024, 12, 1369. [Google Scholar] [CrossRef] [Scilit]
- Simões, M.; Cotrim Marques, S.; Costa, C.; da Luz Calado, M.; Lobo-Arteaga, J.; Bartilotti, C.; Jorge Campos, M.; Leandro, S.M.; Antunes, A. The Advantages of Combining Morphological and Molecular Methods to Characterise Zooplankton Communities: A Case Study of the UNESCO Biosphere Reserve of the Berlengas Archipelago, Portugal. Oceans 2024, 5, 805–824. [Google Scholar] [CrossRef] [Scilit]
- Cornils, A.; Held, C. Evidence of Cryptic and Pseudocryptic Speciation in the Paracalanus Parvus Species Complex (Crustacea, Copepoda, Calanoida). Front. Zool. 2014, 11, 19. [Google Scholar] [CrossRef] [Scilit] [PubMed]
- Von Ammon, U.; Wood, S.A.; Laroche, O.; Zaiko, A.; Tait, L.; Lavery, S.; Inglis, G.J.; Pochon, X. Combining Morpho-Taxonomy and Metabarcoding Enhances the Detection of Non-Indigenous Marine Pests in Biofouling Communities. Sci. Rep. 2018, 8, 16290. [Google Scholar] [CrossRef] [Scilit] [PubMed]
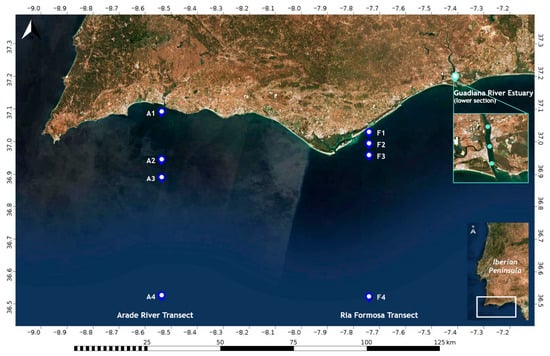
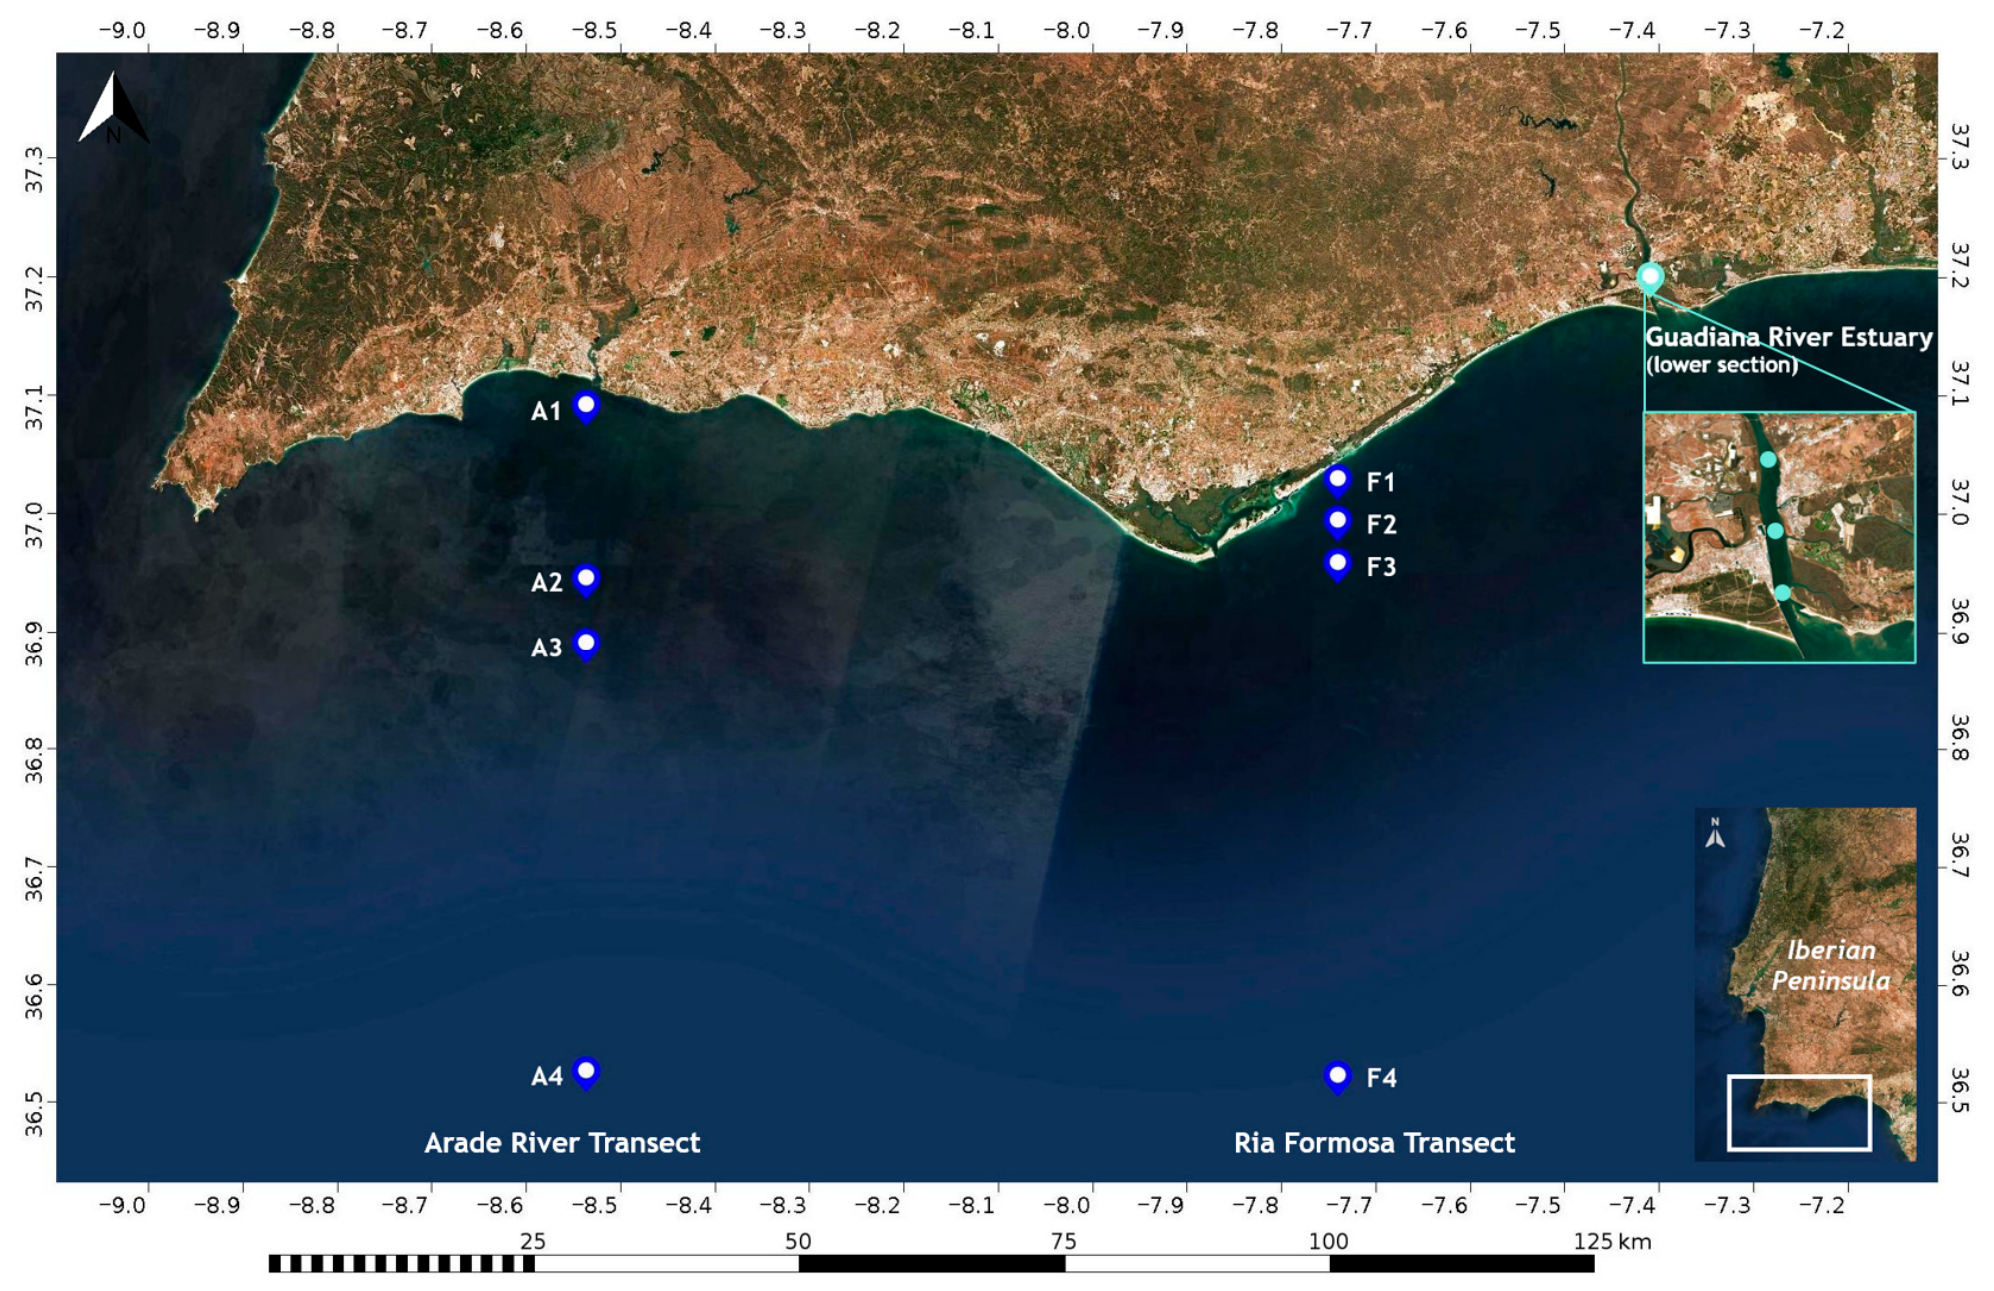
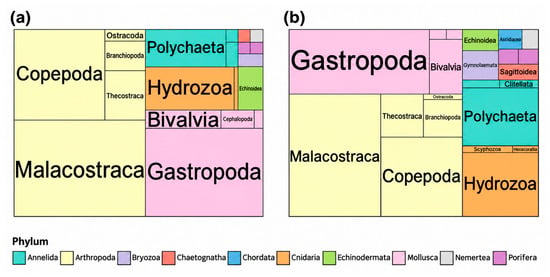
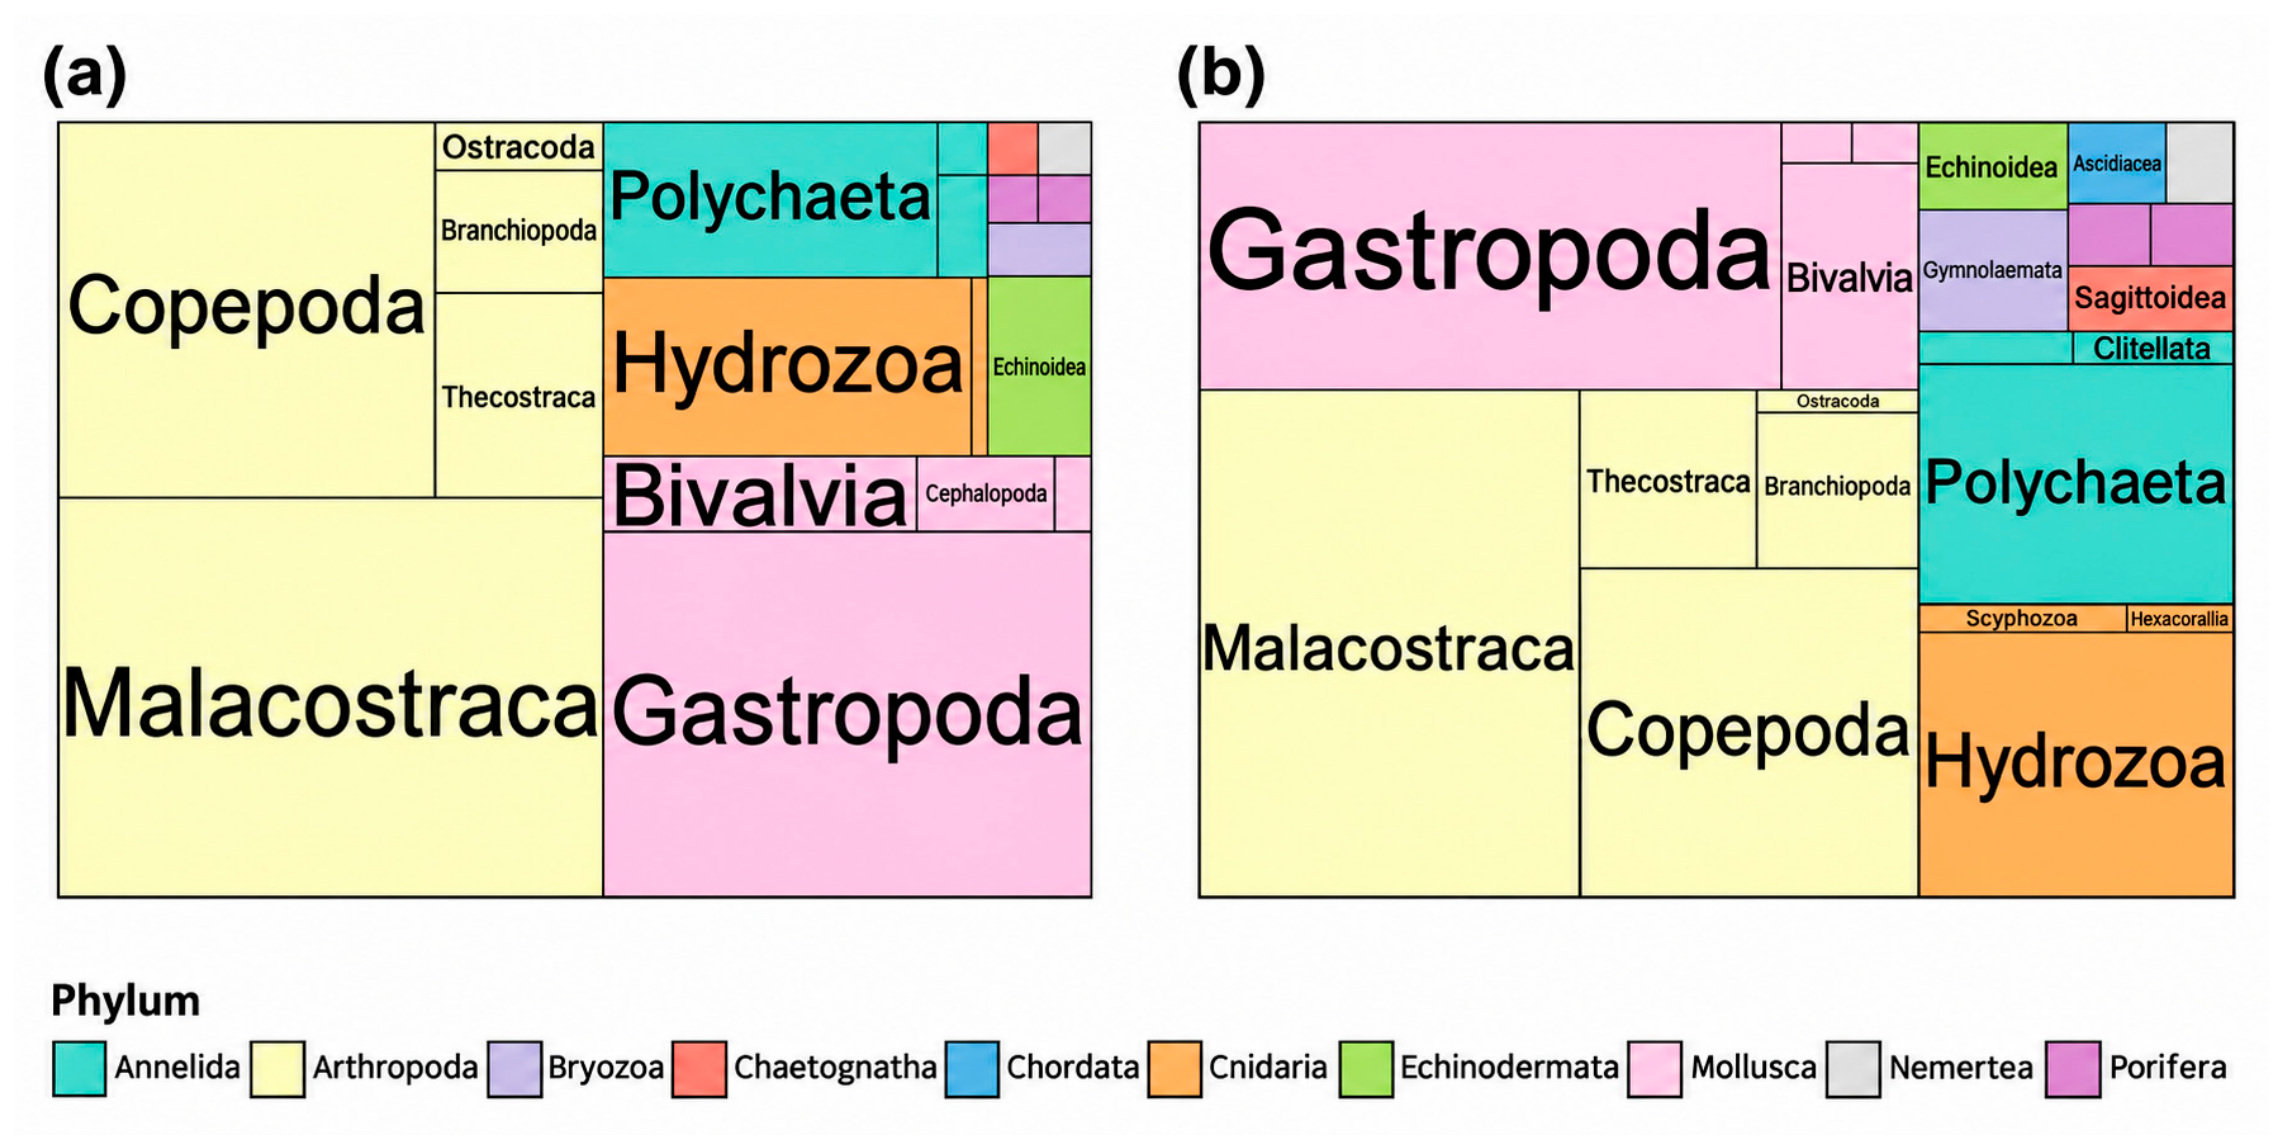
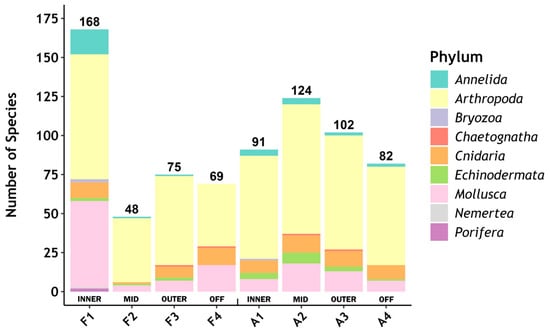
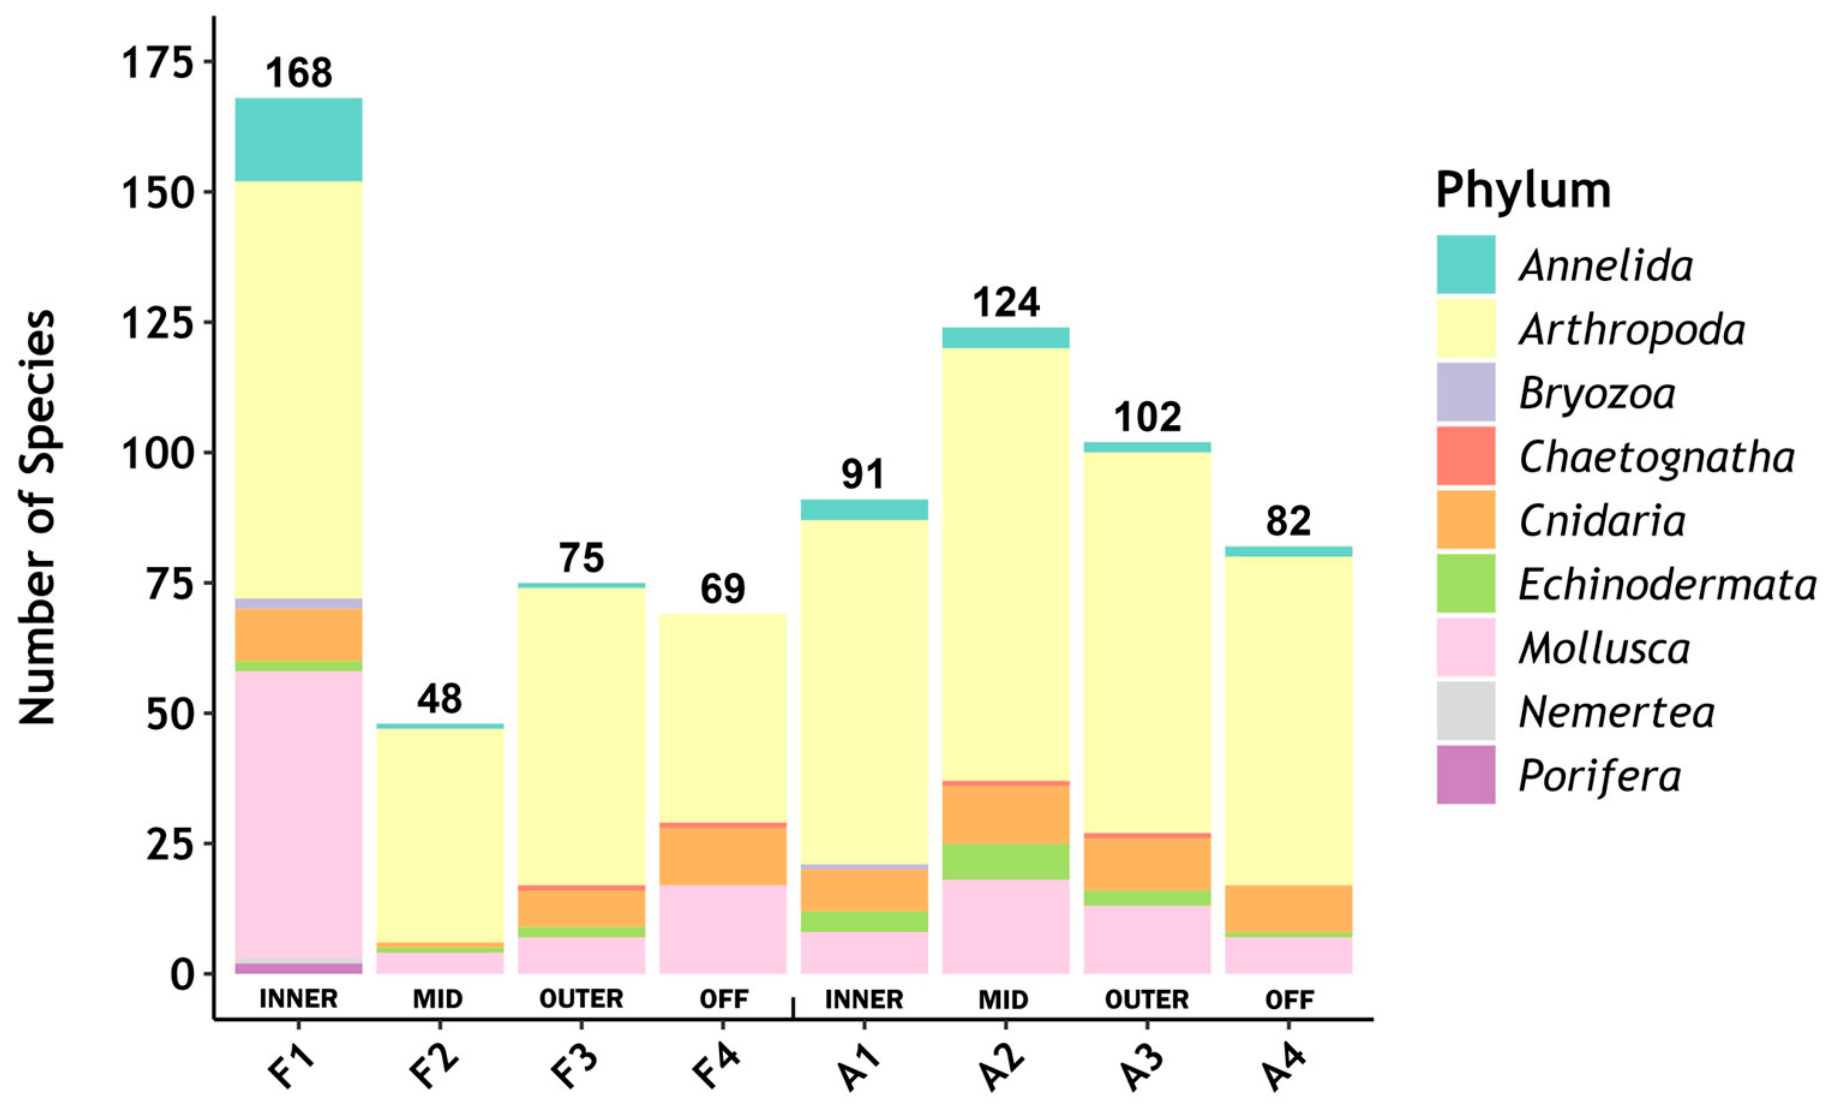
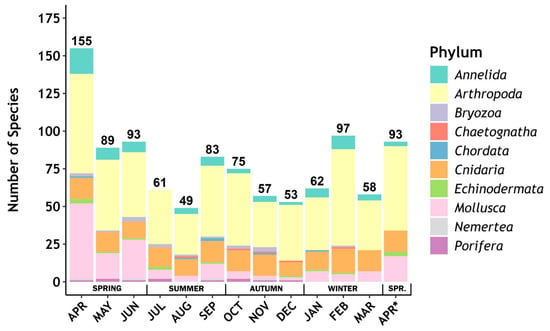
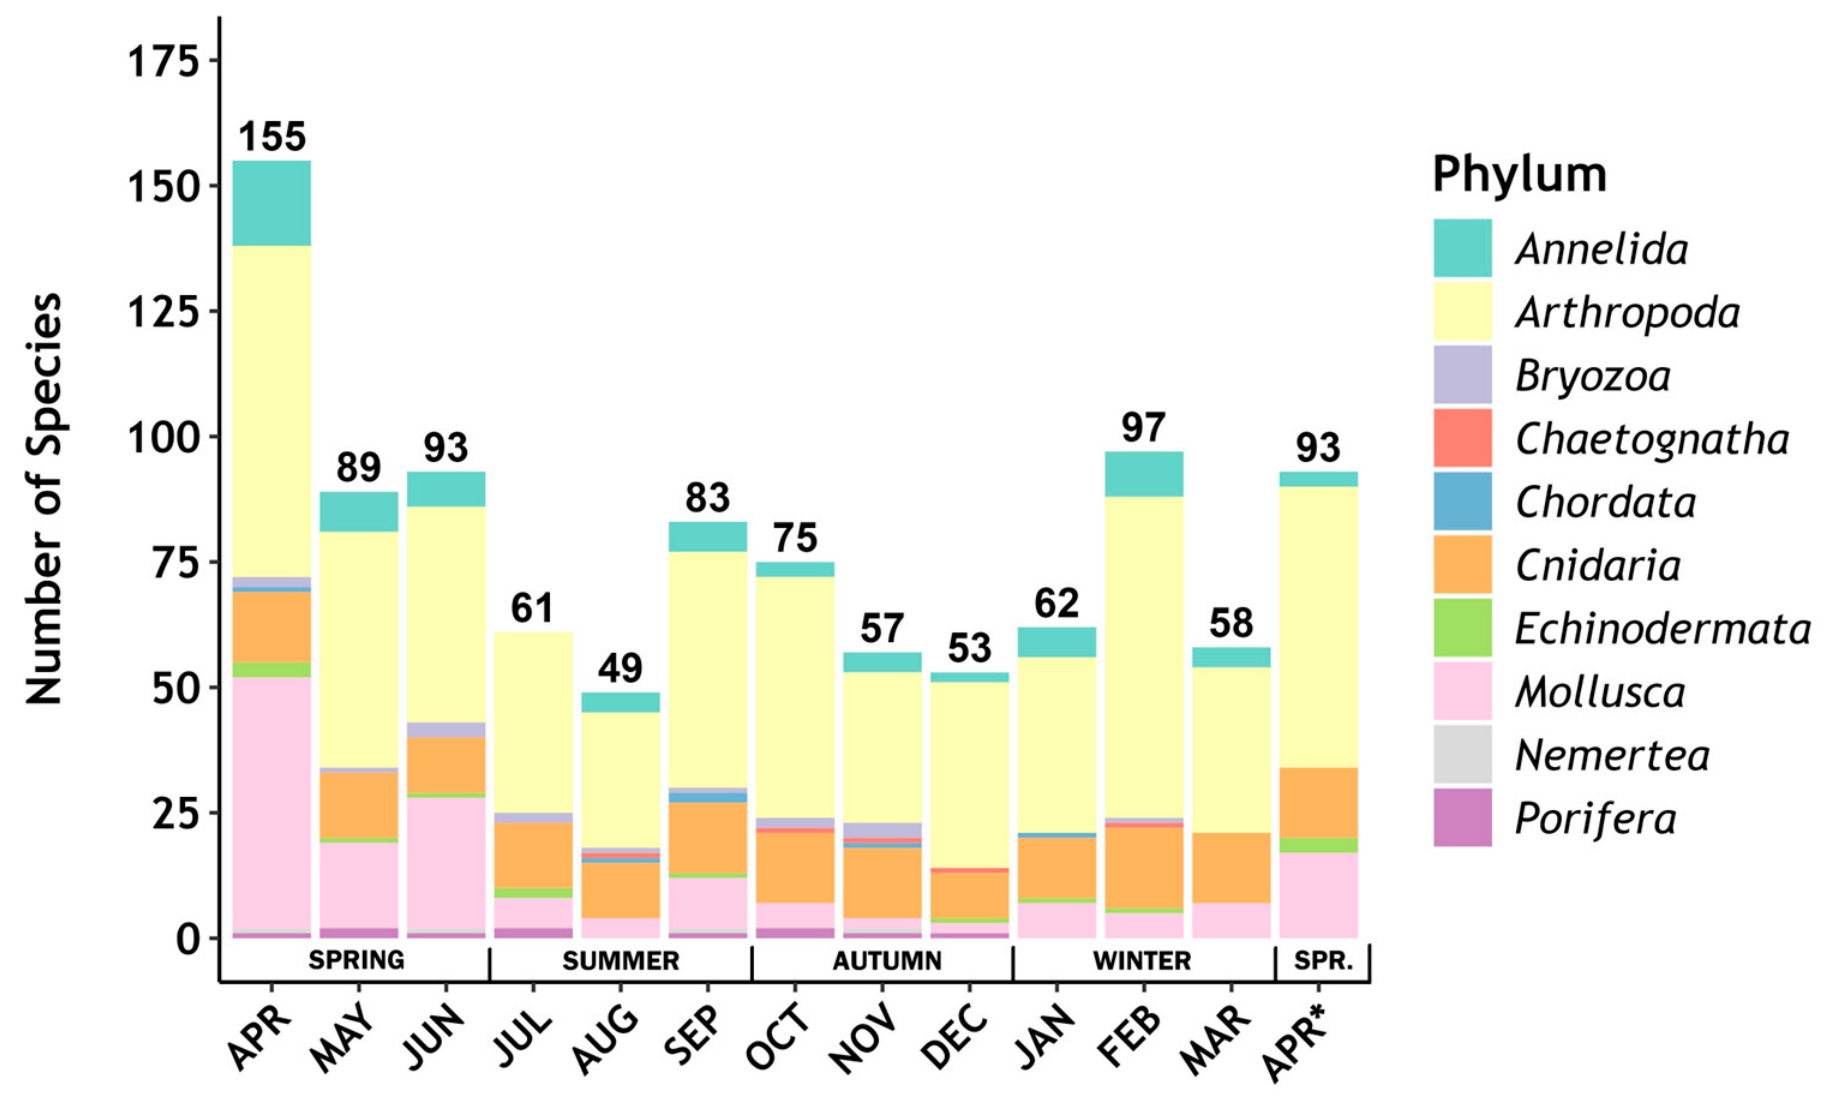
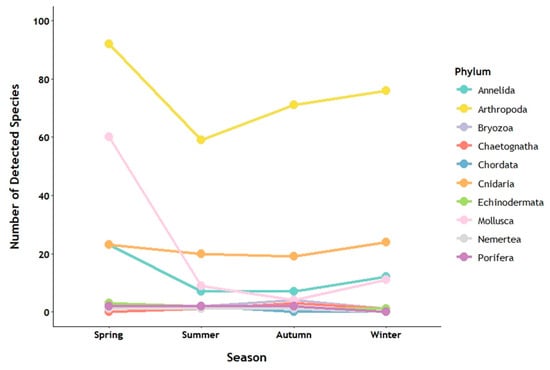
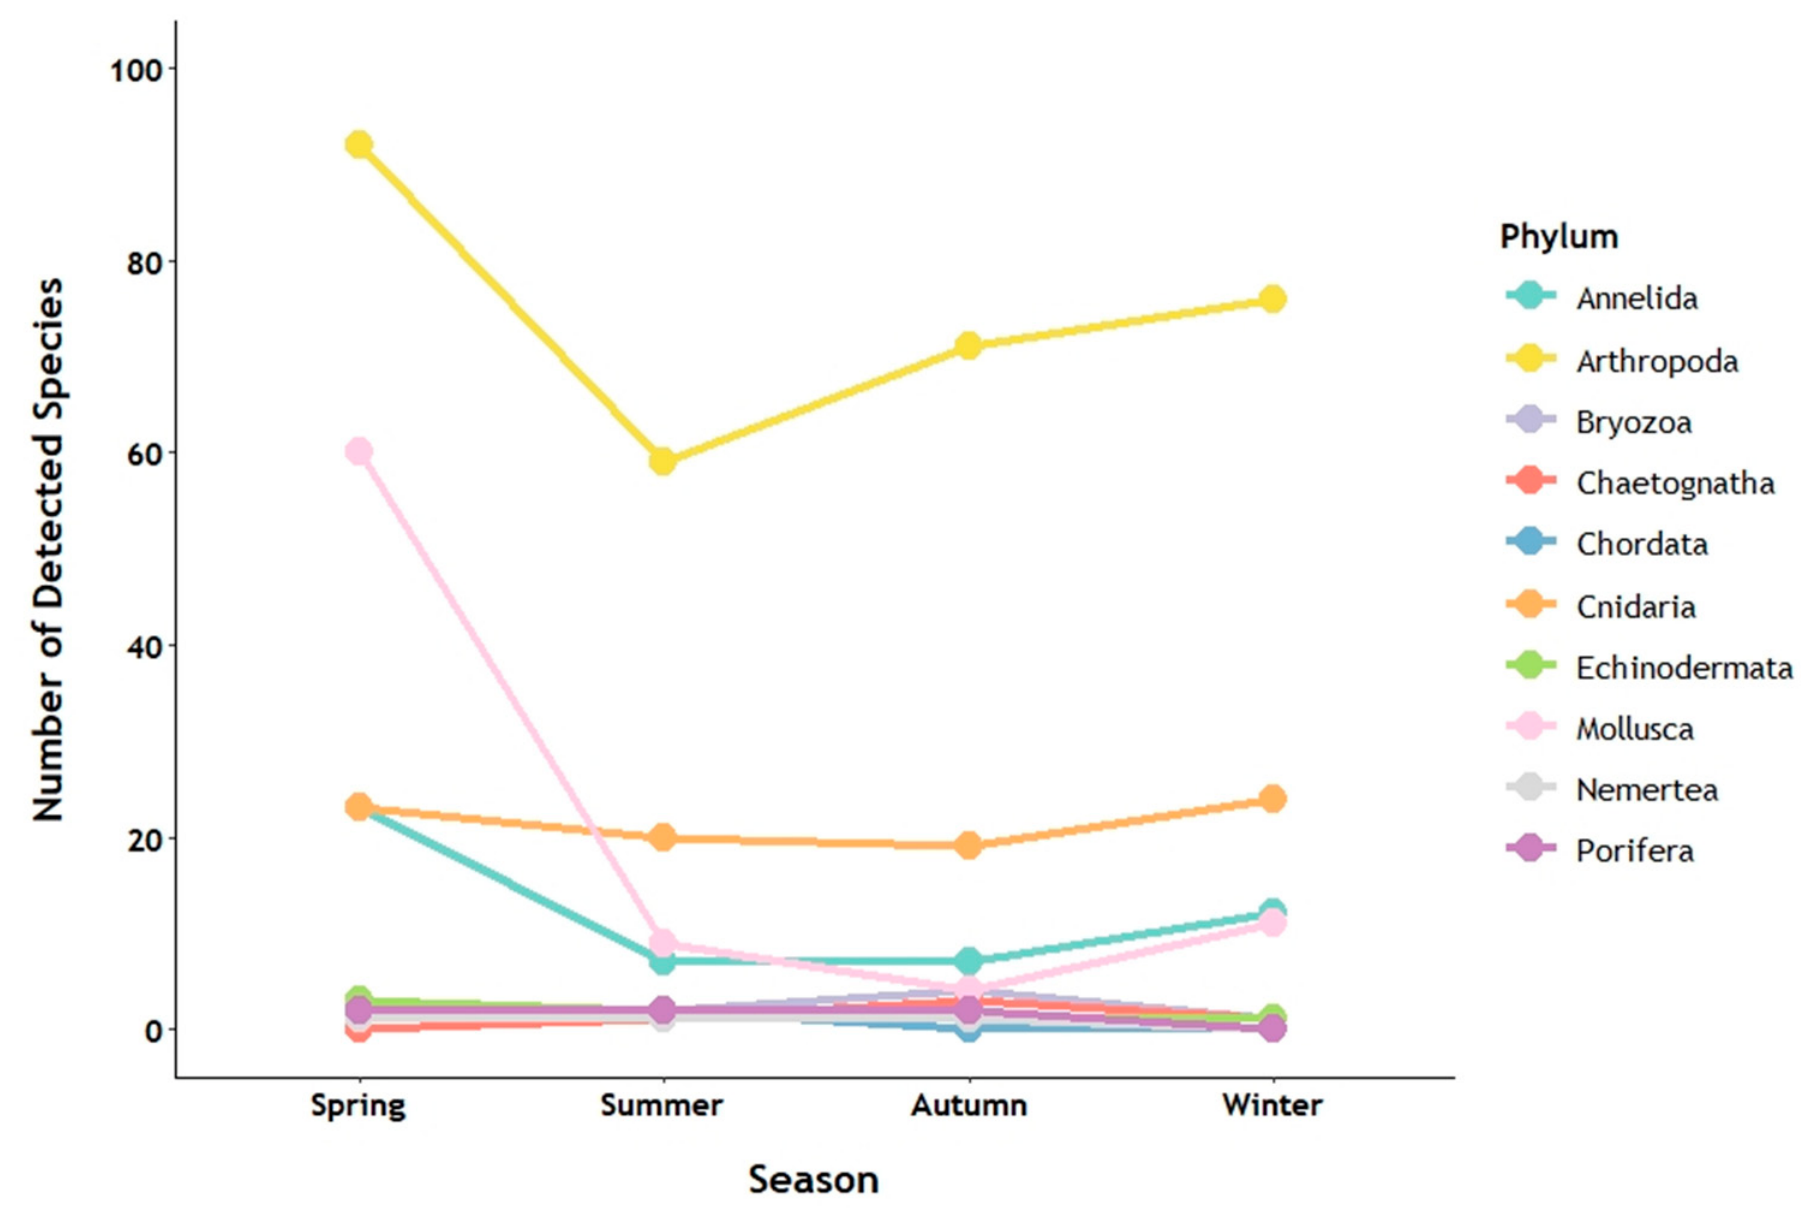
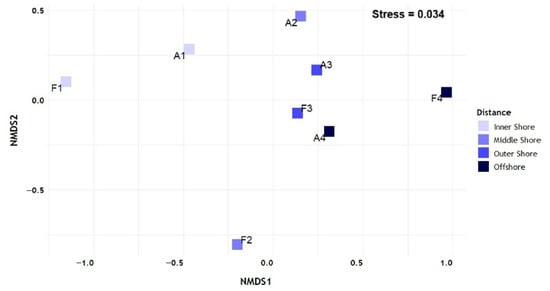
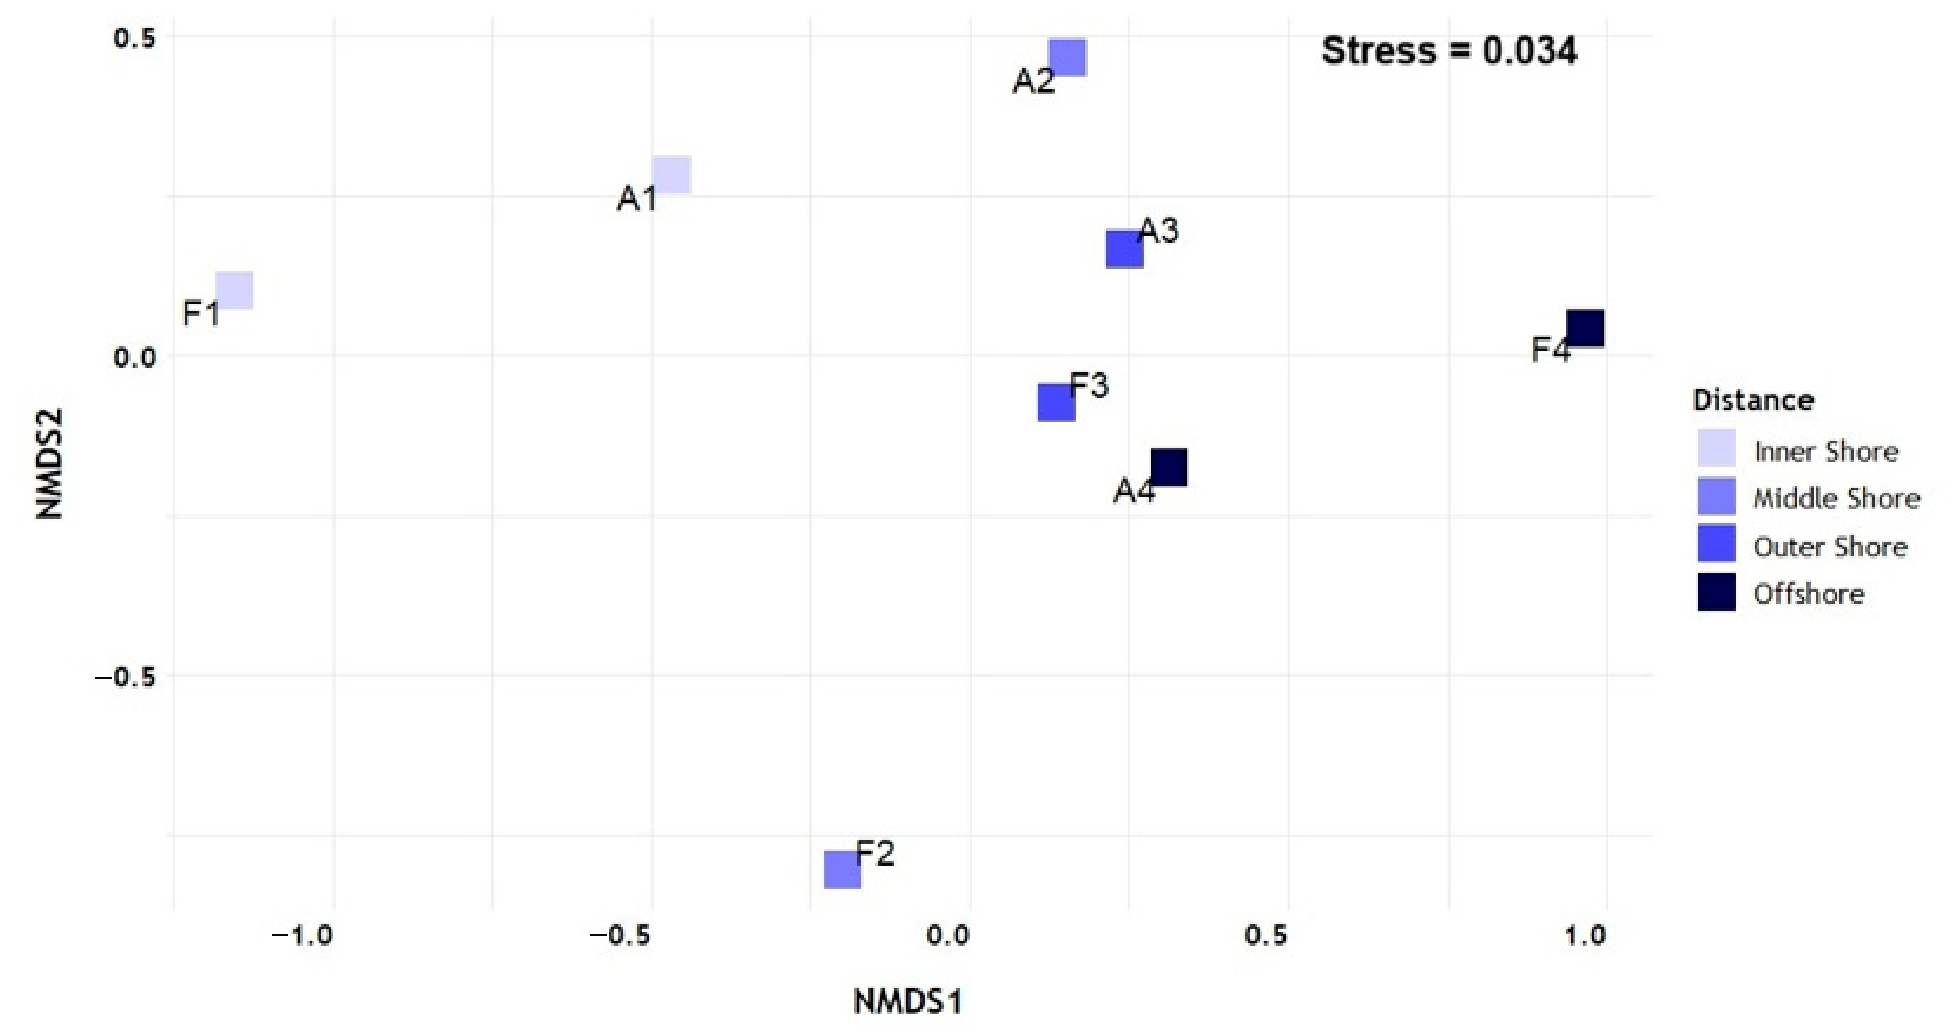
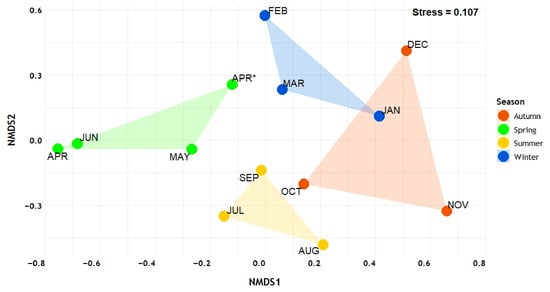
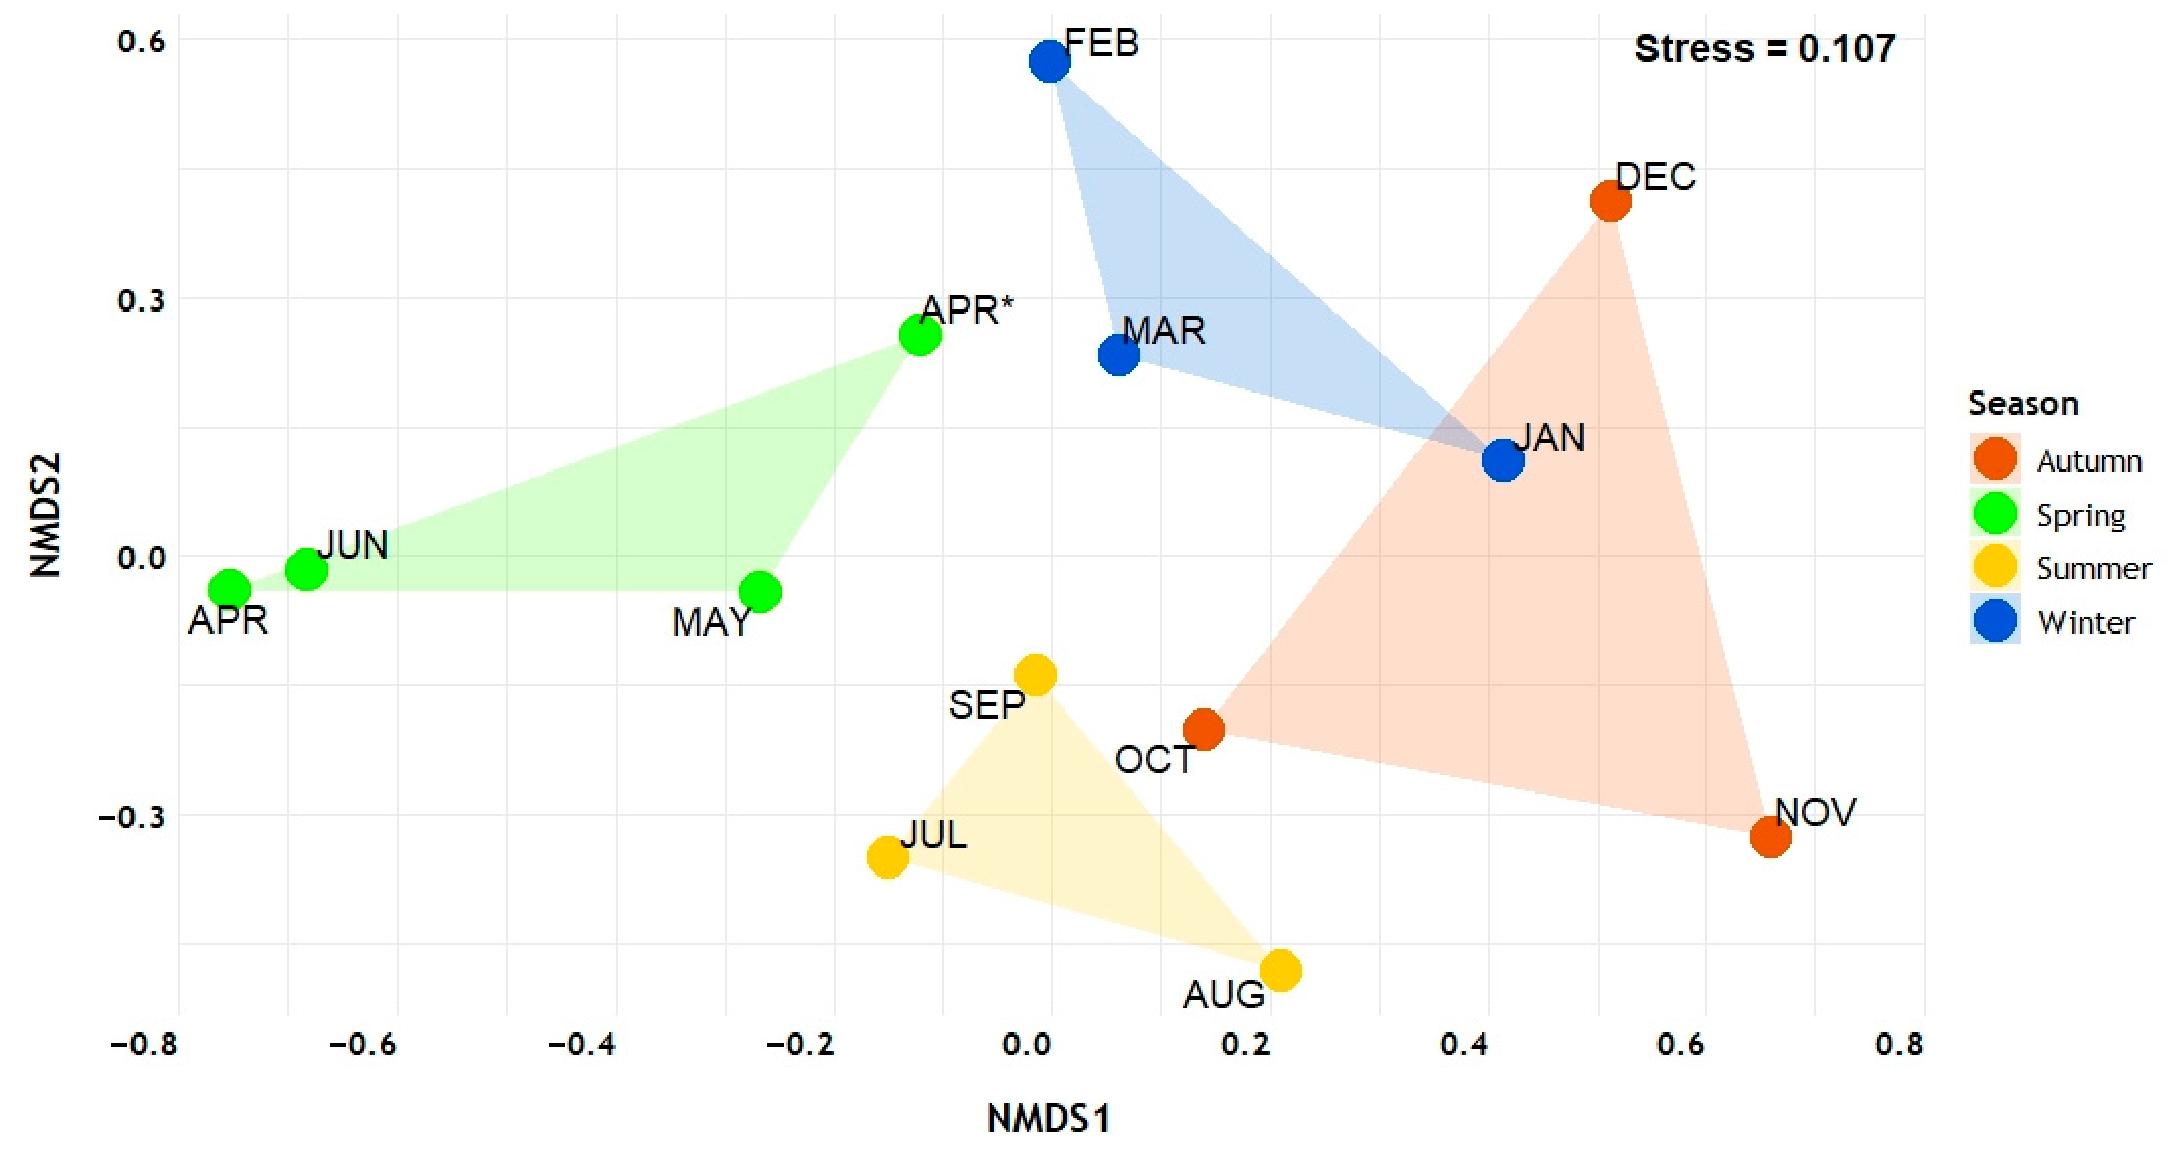
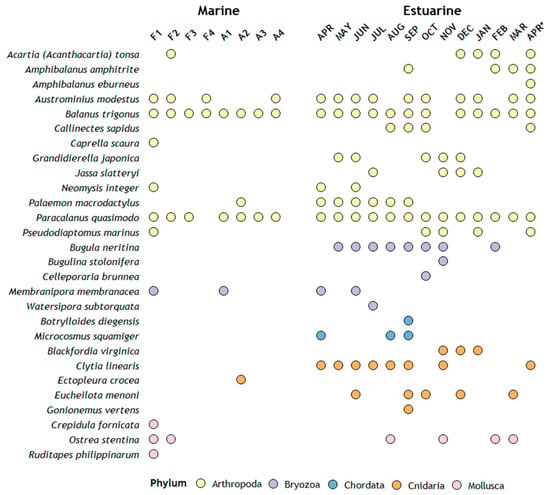
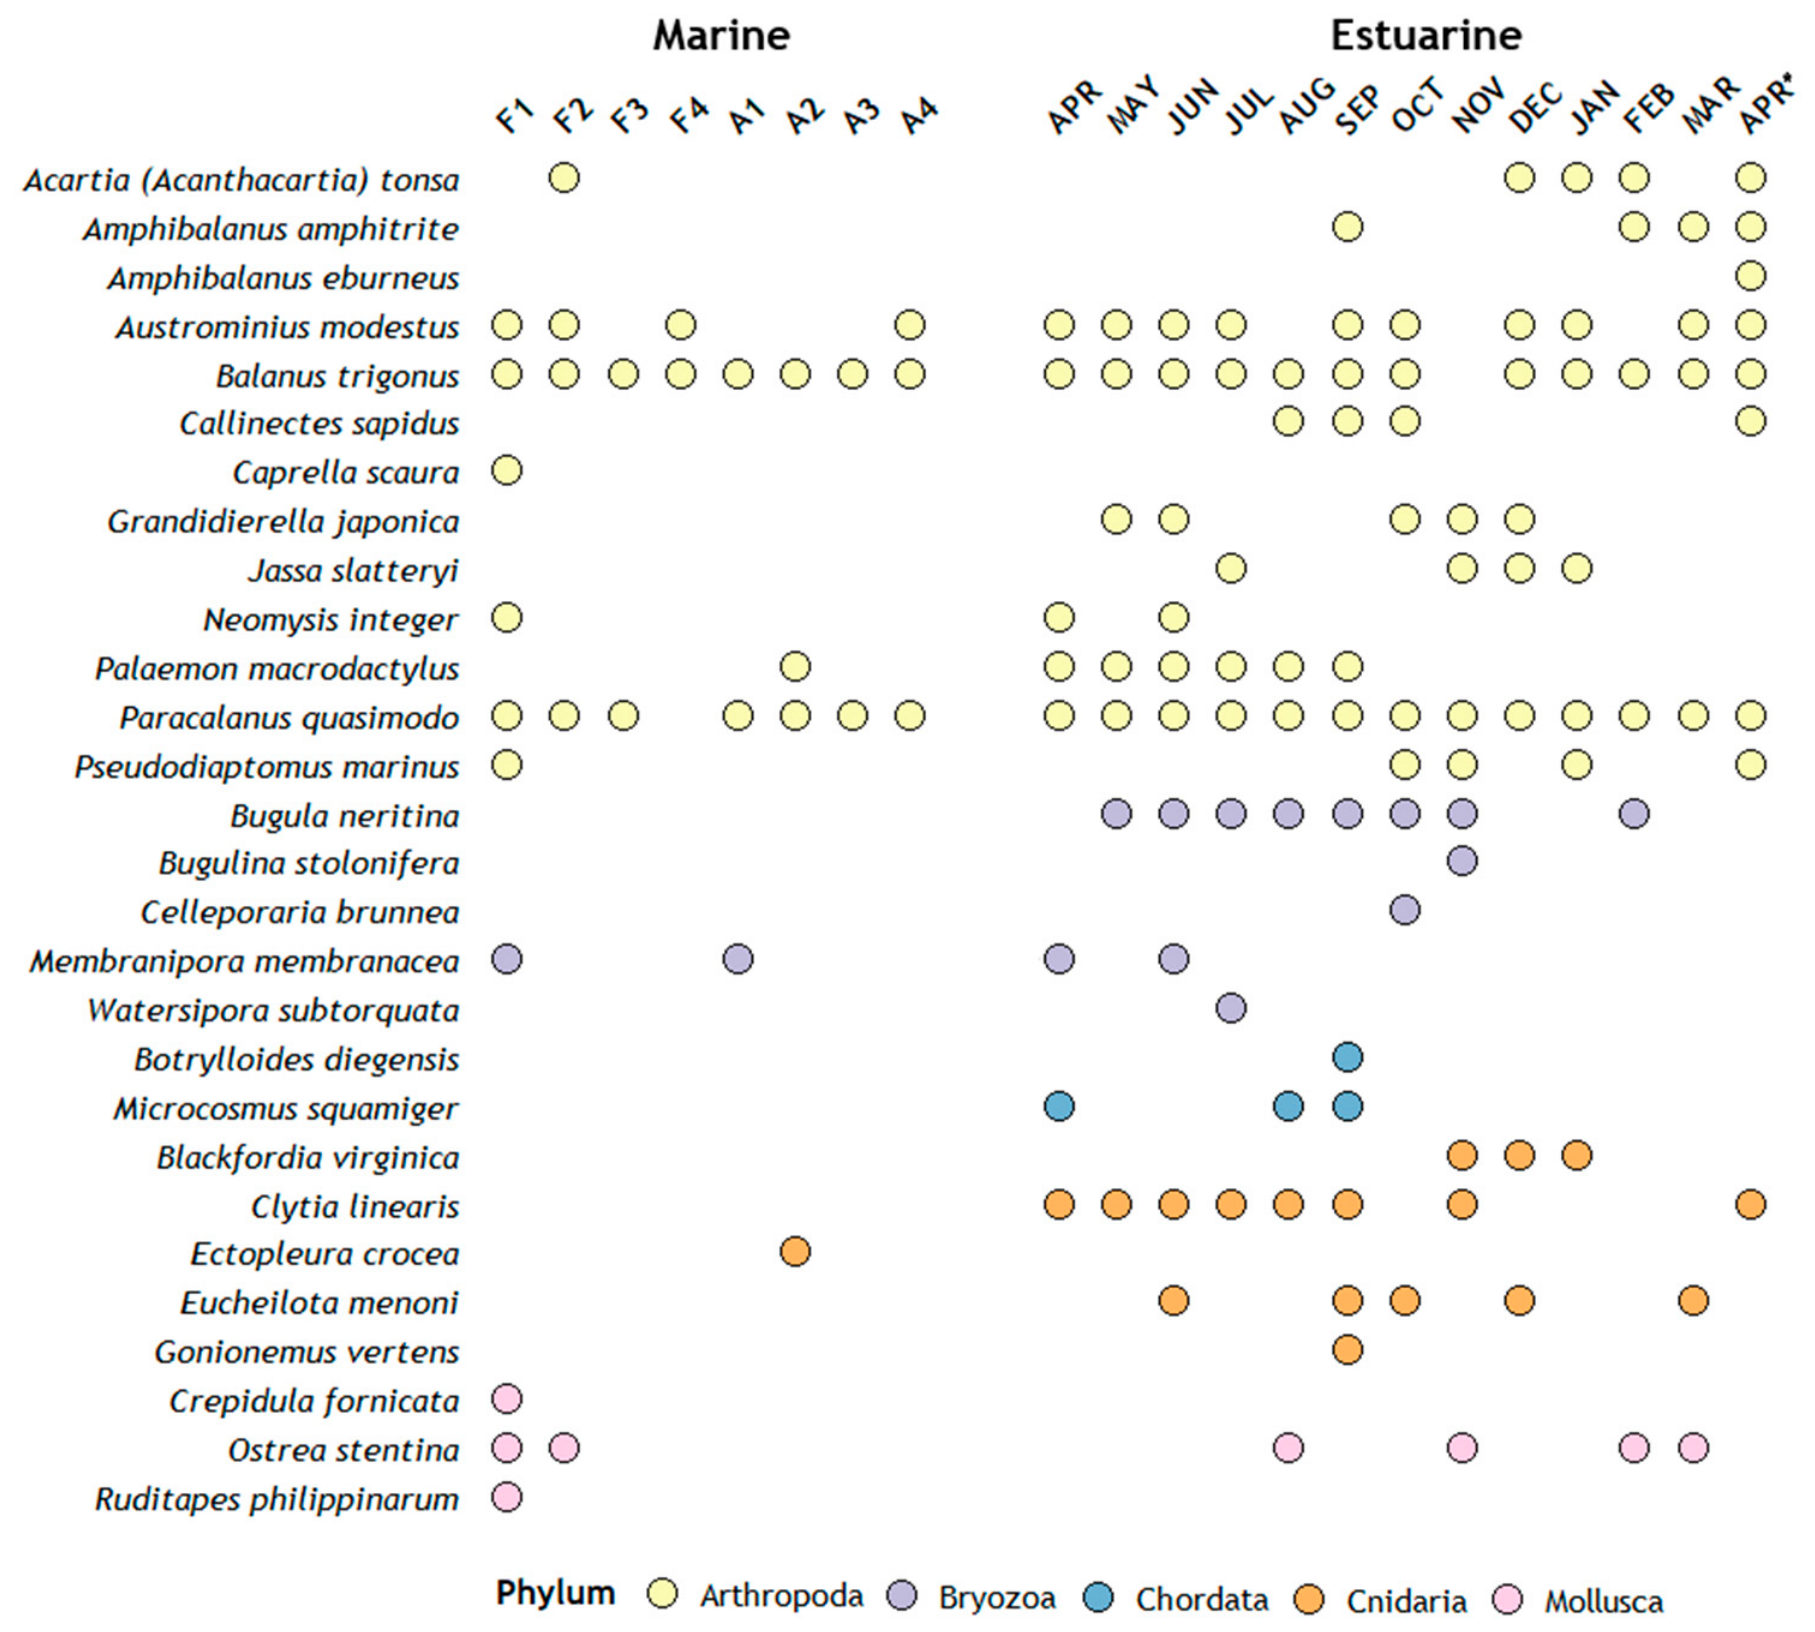

Disclaimer/Publisher’s Note: The statements, opinions and data contained in all publications are solely those of the individual author(s) and contributor(s) and not of MDPI and/or the editor(s). MDPI and/or the editor(s) disclaim responsibility for any injury to people or property resulting from any ideas, methods, instructions or products referred to in the content. |
© 2026 by the authors. Licensee MDPI, Basel, Switzerland. This article is an open access article distributed under the terms and conditions of the Creative Commons Attribution (CC BY) license.