


Abstract
Vessel traffic services (VTSs) in ports require interpretable information on vessel approaches and travel times where shared fairways branch toward multiple destinations. This study presents a gate-based Bayesian method for VTS decision support in Busan North Port. Automatic Identification System (AIS) and Port Management Information System (PORT-MIS) records from September 2024 to August 2025 were linked. Density-based clustering of turning locations and examination of traffic functions informed the placement of 22 virtual gates. A Bayesian network with 20 binary gate-passage variables was constructed from 7194 inbound trajectories. The probability of shared-fairway passage given a passenger-terminal approach was approximately 99.9%, whereas the reverse conditional probability was 20.55%. These results distinguish shared passage locations associated with a known approach from approaches associated with an observed passage. Three illustrative routes had annual mean travel times of 6.22, 6.52, and 13.38 min. Speed-conditioned travel-time probabilities were estimated from the data. On the main-fairway route, arrival in less than 6 min had a probability of 91.01% at departure speeds of 10–<12 kts. The method provides location-specific passage probabilities and route-specific travel-time information for interpreting observed traffic. Validation of predictive performance and benefits for controller decision-making remains necessary.
1. Introduction
1.1. Background
Decision-making in vessel traffic services (VTSs) involves identifying current traffic conditions and anticipating situations that may develop. Controllers must monitor the positions and motion states of multiple vessels while considering merging and branching flows along shared fairways, deceleration and turning during berth approaches, and entry into anchorages. The International Maritime Organization’s VTS guidelines identify the provision of information on vessel identity, position, intentions, and movements, traffic monitoring and management, and responses to developing unsafe situations as key functions [1]. Accordingly, decision-support information should go beyond displaying where a vessel is currently located and indicate which areas the vessel may traverse and within what time frame.
This need can be understood from the perspective of situation awareness. Endsley [2] explained the relationships among situation awareness, information acquisition and interpretation, mental models, attention, and working memory in dynamic decision-making. In port traffic, receiving position, speed, and course information is different from understanding the behavior of multiple vessels in context. For example, two vessels following similar courses along the same fairway may behave differently: one may continue into the inner harbor, whereas the other may decelerate to approach a nearby berth. To anticipate such differences, controllers need information that connects observed movements with past traffic experience. This study focuses on constructing quantitative information to support such anticipatory assessments.
Route exchange, through which planned routes are directly shared, is one approach to understanding vessel intentions. Aylward et al. [3] used simulator experiments to examine the effects of ship-to-ship route exchange and meeting-point information on navigators’ decision-making, trust, and safety. Participants used the additional information in their decisions, but the provision of information did not consistently guarantee improvements in safety. These findings suggest that information on anticipated movements can be useful, but its conditions and uncertainty should be clearly presented. Port traffic control likewise needs to consider previously communicated route plans alongside observed vessel movements.
Recurrent traffic patterns extracted from historical AIS data can be used to interpret observed vessel movements and estimate future routes [4]. Within ports, vessels following a shared fairway may select different approach routes depending on their destination berths; therefore, destination information and vessel motion states should be considered together. For decision support, these observations need to be organized in terms of the relationships between passage through key locations and destination approaches and interpreted alongside the time required for movement.
1.2. Research Objectives
This study aims to express vessel passage through key locations as traffic-flow probabilities that controllers can query. Specifically, it addresses three questions: which approach flows are associated with trajectories passing a given location; which shared locations are used by trajectories approaching a particular destination; and how long a vessel may take to reach the next reference gate when following a specified route. These probabilities are intended to provide evidence that changes with observations rather than instructions that determine a vessel’s course.
To this end, port-call information was linked to observed vessel trajectories, and key traffic locations were represented as gates to estimate associated approach flows and route travel times from passage evidence. First, clusters of AIS turning events were used to locate recurrent branching and approach positions, which were defined as fixed crossing sections. Gate-passage indicators for each trajectory were then used as variables in a Bayesian network (BN), allowing probabilities without additional evidence to be compared with those obtained after passage evidence was entered. For time analysis, routes with different traffic functions were selected, and travel-time distributions and arrival probabilities conditional on departure speed were presented.
The spatial scope covers Fairway No. 1 in Busan North Port and the connecting approaches to berths, anchorages, and the Yeongdo Bridge area. In Busan North Port, Fairway No. 1 connects traffic bound for container terminals, inner-harbor berths, passenger terminals, quays along Yeongdo, anchorages, and the Yeongdo Bridge area. Consequently, vessels with different destinations may initially follow the same fairway before diverging toward their respective berths or anchorages. This shared-and-branching traffic structure makes it difficult to distinguish intended approach routes solely from a vessel’s current position or course, particularly before it reaches a major branching location. The point reached along the shared fairway therefore provides a useful basis for interpreting associated approach flows. AIS and PORT-MIS data from September 2024 to August 2025 were used for this purpose.
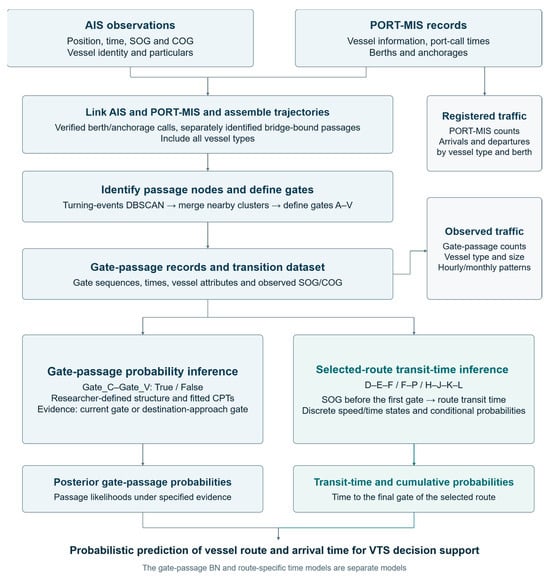
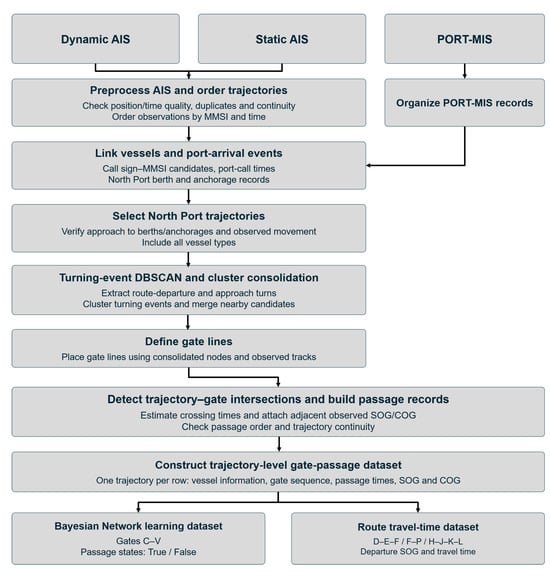
The overall study framework is shown in Figure 1. Section 2 reviews studies on AIS-based traffic and route analysis, in-port trajectory prediction, Bayesian inference, and arrival-time estimation, and identifies the research gap. Section 3 describes data analysis, clustering of key locations, gate configuration, and the construction of the probabilistic models. Section 4 presents North Port traffic conditions, gate-specific passage characteristics, approach-flow probabilities under different evidence conditions, and travel-time distributions for selected routes. Section 5 discusses the results from the perspective of VTS decision support, including their applicability and limitations. Section 6 summarizes the main findings and directions for future research.
Figure 1.
Overall workflow of the study.
2. Literature Review
2.1. AIS-Based Traffic Analysis and Route Extraction
AIS-based maritime traffic research has expanded from describing spatial traffic concentrations to extracting recurrent routes and estimating future movements. Kim et al. [5] used traffic-density information from AIS and vessel monitoring system data for marine spatial planning. Such aggregation is useful for identifying heavily used waters, but both vessel residence time and observation frequency contribute to positional density. An additional procedure is therefore required to convert density distributions into movement events when analyzing passage counts at particular locations or approaches to destinations within a port.
Recurrent route extraction often summarizes trajectories around major turning locations. Pallotta et al. [4] proposed TREAD, which extracts movement patterns from large AIS datasets and links them to route prediction and anomaly detection. Rong et al. [6] used trajectory turning points and DBSCAN to represent routes as segments and turning areas, whereas Onyango et al. [7] used maneuvering points and HDBSCAN to construct waypoints and route networks. Dobrkovic et al. [8] addressed the reconstruction of movement patterns and routes from incomplete and noisy AIS data. These studies provide a basis for organizing large numbers of position observations into spatially meaningful route structures. The present study uses this basis to define measurement sections for berth-specific approach flows.
2.2. Prediction of In-Port Trajectories and Operating States
Studies of future vessel movements have emphasized the importance of destinations and predictive uncertainty. Rong et al. [9] estimated destination probabilities and route-conditioned future trajectories based on movement patterns. Capobianco et al. [10] combined recurrent encoder–decoder trajectory prediction with uncertainty estimation.
Shin and Yang [11] incorporated destination-berth information into trajectory prediction within Busan Port and identified the segment from fairway departure to berth arrival as an important prediction interval from a traffic-control perspective. Lee et al. [12] separated port-entry and berthing phases in Busan New Port, analyzed spatial variations in speed and course, and developed operational information using quantile regression. Because movement along a shared fairway and final maneuvering have different characteristics, the presentation of prediction results should reflect the operational phase as well as spatial location.
Recent studies have further investigated vessel intentions and uncertainty in maritime traffic prediction. Yamaki et al. [13] employed a hidden Markov model to estimate destination likelihoods from partial AIS trajectories in Tokyo Bay. Mahipala et al. [14] developed an intention-aware probabilistic framework incorporating planned-route information and navigational constraints into vessel trajectory prediction. Yang et al. [15] proposed a flow-based generative model to represent multiple plausible future vessel trajectories under uncertainty. While these studies focus on predicting destinations or future vessel movements, the present study addresses a different inferential task by estimating conditional associations among observed passages at predefined traffic gates. This distinction enables the results to be interpreted as location-specific reference information for VTS rather than direct predictions of future trajectories.
2.3. Bayesian Inference and Arrival-Time Estimation
Bayesian networks combine dependencies among variables with observed evidence. Mascaro et al. [16] applied static and dynamic BNs to anomaly detection in vessel tracks. A BN can describe not only individual variable probabilities but also how the probabilities of related variables change when new information becomes available. This property is relevant to traffic-control tasks in which controllers query associated approach flows after observing passage through a location. However, a static BN based on gate-passage indicators and a dynamic model predicting the next state at each time step address different inference targets; their results must therefore be interpreted according to the variable definitions.
Travel time is another necessary component of information about anticipated traffic. Alessandrini et al. [17] presented arrival-time estimation using historical vessel tracking data. Within a port, even vessels with similar destination-approach probabilities may have different arrival times because their routes involve different combinations of fairway transit, deceleration, and turning. Linking spatial and temporal information therefore requires the departure and arrival gates to be defined, together with evidence, such as speed, that can be observed at departure.
2.4. Research Gap and Positioning of the Present Study
The reviewed studies address traffic density [5], route networks [4,6,7,8], future trajectories and operating states [9,10,11,12,13,14,15], anomalies [16], and arrival times [17]. The gap addressed here concerns connecting these findings to location-based traffic-flow estimation for port traffic control. Even after representative routes have been extracted, further consideration is needed to determine which port facilities their key locations relate to, which probabilities should be updated when a crossing is observed, and how the travel time along the associated segment should be presented. AIS destination fields alone may be insufficient to distinguish individual berths and anchorages. Studies reporting reliability problems in AIS data and inconsistencies in destination-port entries [18,19] support the need to examine actual position changes together with administrative port-call information.
The contribution of this study is to establish gate lines at major branching and berth-approach locations identified from AIS trajectories and to represent passage through those gates as BN nodes. This directly relates spatial traffic flows in the study waters to probabilistic inference results. Consequently, posterior probabilities can be interpreted as passage and destination-approach likelihoods at identifiable locations rather than as abstract statistical values.
PORT-MIS is used to identify the destination facilities associated with the analyzed trajectories, AIS is used to measure actual passages and their times, and DBSCAN provides candidate gate locations. The BN updates the probabilities of related approach flows using these observations. This procedure provides a way to use historical traffic experience as quantitative decision-support information without requiring a new system for collecting planned routes. Travel-time distributions for selected routes are also presented to account for differences in arrival timing that spatial passage probabilities alone cannot explain.
3. Methodology
3.1. Data Collection
The study was conducted in Busan Port, South Korea, with a particular focus on the approach to Fairway No. 1. Busan Port is a major maritime logistics hub in Northeast Asia [20], and previous studies have highlighted navigational safety in the North Port approaches [21] and AIS-based prediction of vessel movements within the port [11]. The area was therefore selected to examine VTS decision support through vessel traffic estimation.
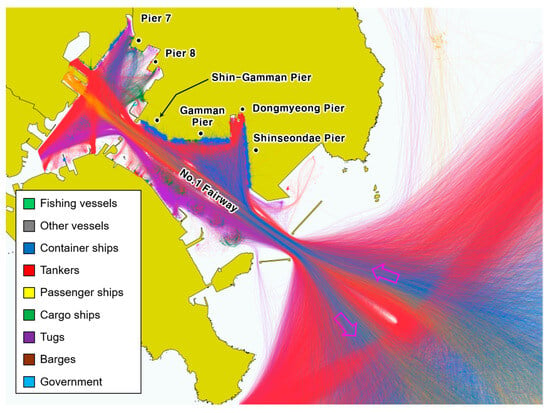
AIS trajectory data and PORT-MIS arrival and departure records for vessels calling at Busan Port were used. The AIS collection period was set to one year, from 1 September 2024 to 1 September 2025. The AIS fields used for vessel identification and trajectory reconstruction were Maritime Mobile Service Identity (MMSI), reception timestamp, latitude, longitude, speed over ground (SOG), and course over ground (COG). PORT-MIS fields included vessel name, vessel type, arrival and departure times, and berth and anchorage information, which were used to confirm port calls and actual destinations. The datasets were linked using vessel identifiers and time information to verify whether the AIS trajectories corresponded to Busan Port calls and to identify their destinations. The data sources and fields used are summarized in Table 1, and the study area and vessel trajectories by type are shown in Figure 2.
Table 1.
Data sources and information used in the analysis.
Figure 2.
Study area in Busan North Port and AIS trajectories by vessel type.
3.2. AIS Processing with PORT-MIS Data
AIS observations were ordered by MMSI and timestamp, and duplicate or invalid records were identified before trajectory reconstruction. All spatial calculations were performed in WGS 84/UTM zone 52N (EPSG:32652). Trajectory continuity was evaluated between consecutive AIS observations of the same vessel. Two observations were connected only when the time interval was greater than 0 and no more than 300 s and the displacement speed calculated from their projected positions did not exceed 60 kts. When either criterion was violated, the observations were not connected, and a new continuous trajectory segment was initiated rather than deleting the vessel’s entire trajectory. Continuity boundaries were retained during subsequent processing so that observations separated by an invalid or discontinuous segment were not artificially reconnected.
AIS and PORT-MIS records were linked primarily through vessel identification and port-call timing. Normalized call signs in PORT-MIS were matched with AIS static records to identify corresponding MMSI values, and only unambiguous vessel correspondences were retained. Vessel type and vessel size were subsequently used as descriptive and consistency information rather than as primary vessel-identification keys. For registered berth-arrival candidates, AIS observations around the reported port-call time were examined together with the registered berth or anchorage information. An initial time window of ±6 h around the registered arrival event was used to examine corresponding vessel activity, while a broader observation window was used when reconstructing the continuous approach trajectory. For extended trajectory reconstruction, AIS observations from up to 24 h before the registered arrival to 24 h after the corresponding departure were examined, with the window shortened using adjacent port-call times when successive calls overlapped.
Cases were considered registered-arrival candidates when a North Port berth or anchorage facility code was identified and the corresponding AIS trajectory showed an approach followed by arrival or stationary behavior at the relevant facility. Repeated calls by the same vessel were therefore treated as separate port-call events rather than as a single annual vessel trajectory. The registered destination in PORT-MIS was used as a reference for identifying the relevant arrival event, whereas actual passage locations and gate crossings were determined solely from the AIS trajectory. Consequently, vessels registered at the same berth were not assumed to have followed identical routes or passed the same gates.
Vessels without a specified destination berth in PORT-MIS were nevertheless included when their movement within Busan Port could be identified directly from AIS trajectories. In particular, trajectories proceeding toward Yeongdo Bridge were identified separately from AIS observations and treated as a distinct movement group from the PORT-MIS-based destination groups.
3.3. Identification of Key Points and Gate Configuration Using DBSCAN
Locations relevant to traffic-control support do not necessarily coincide with locations containing the largest numbers of observations. Applying density-based clustering to all raw AIS positions may cause observations associated with anchoring and low-speed activities to dominate or may connect a continuous fairway into a single large cluster. This study therefore used the positions of fairway-departure and turning events as DBSCAN inputs to identify branching and approach locations.
DBSCAN (Density-Based Spatial Clustering of Applications with Noise) is an unsupervised clustering method that evaluates observation density using a spatial neighborhood radius, ε, and a minimum number of neighboring observations, MinPts, and forms clusters from density-connected points [22]. It does not require the number of clusters to be specified in advance and can identify observations outside sufficiently dense clusters as noise, making it suitable for detecting irregularly shaped spatial clusters. Here, turning events extracted during fairway departure and approach maneuvers, rather than all AIS positions, were used to identify major branching and approach locations that recur across multiple trajectories.
Turning events were extracted from AIS trajectories by distinguishing the initial departure from the main fairway from subsequent turning maneuvers. For the exploratory turning-event extraction, observations with SOG ≥ 3 kts were used to focus on vessel movements associated with active navigation. To identify an initial fairway departure, the movement direction at each candidate position was evaluated using a forward trajectory point located approximately 300 m along the observed track. A departure candidate was identified when the resulting direction differed from the fairway axis by at least 12° and the directional deviation persisted over at least 200 m of subsequent trajectory. The observations used to assess the directional change were required to belong to the same continuous trajectory block.
For subsequent turning events after leaving the main fairway, movement directions before and after each candidate position were calculated using observed trajectory points located approximately 150 m along the track on either side of the candidate. The signed directional change between the incoming and outgoing movement vectors was calculated using Equation (1):
where and denote the incoming and outgoing displacement vectors, respectively, calculated from AIS positions before and after candidate point i, and Δθi represents the signed directional change in degrees.
Candidates with an absolute directional change between 15° and 120° were retained, provided that the observations belonged to the same 60-s continuous observation block and that the elapsed time required to obtain the reference point on either side did not exceed 300 s. Instantaneous COG fluctuations and localized movements associated with anchoring or berthing were therefore not treated as turning events. Only sustained directional changes representing route branching or approach maneuvers were retained as inputs to the subsequent DBSCAN analysis. This approach follows previous AIS route-extraction studies that first identify points representing vessel maneuvers and then apply density-based clustering, rather than clustering all raw AIS positions [6,7].
DBSCAN was applied to identify spatial concentrations of the extracted turning events using a neighborhood radius (ε) of 75 m and MinPts of 5. To reduce the influence of isolated or vessel-specific maneuvers, candidate clusters were retained only when they were supported by at least five distinct port-call trajectories. Spatially dispersed clusters with an observed-point bounding-box diagonal exceeding 500 m were treated separately rather than directly adopted as localized turning points. Candidate clusters representing the same traffic movement were subsequently consolidated using a 200 m complete-linkage distance criterion and were further examined together with the corresponding AIS trajectories and berth and anchorage approach flows. Adjacent candidates representing the same traffic function were consolidated into a single key traffic location before the gate lines were defined. Gate lines were then placed across the traffic flow at these locations to provide a consistent basis for determining actual vessel passages.
Polygons outlining the convex hulls of observed points belonging to the consolidated clusters were used to examine their locations. For the final measurements, 22 finite gate lines were placed across the major traffic flows. Cluster polygons represented the spatial extent of the key locations, whereas gate lines provided common crossing sections for comparing trajectories. Although DBSCAN informed the placement of the 22 gate lines, they were not treated as equivalent to 22 automatically generated DBSCAN clusters. The consolidation of adjacent candidates, the lengths and orientations of gate lines, and the addition of a gate for traffic toward Yeongdo Bridge also reflected the traffic functions of the study area.
The final 22 gate geometries were manually digitized in QGIS after examining the spatial clusters, observed vessel trajectories, and traffic functions of the corresponding branching and approach locations. For gates consisting of multiple line segments, the constituent segments were considered individually during intersection detection. To ensure reproducibility, the projected vertices (EPSG:32652), lengths, and orientations of the final gate geometries are provided in Appendix A.
3.4. Gate-Crossing Event Extraction and Data Construction
Actual passage through each gate was identified from the observed AIS trajectory. A passage candidate was first detected when the line segment connecting two consecutive AIS positions intersected the finite gate line; intersections occurring only with an extension of the gate line were not accepted. To reduce false detections caused by positional noise or movement close to a gate, supporting AIS observations were then searched for on both sides of the candidate crossing. A crossing was retained only when observations within 300 s before and after the candidate were located on opposite sides of the gate and each provided at least 20 m of spatial separation from the gate line. Missing trajectory intervals were not interpolated to generate additional crossing events.
For each valid crossing, the passage time was estimated by linear interpolation between the two consecutive AIS observations whose connecting segment intersected the gate. Let xi and xi+1 denote the two consecutive AIS positions and xg the intersection point with the gate. The fractional position of the intersection along the AIS segment was defined by Equation (2):
The corresponding gate-crossing time was then calculated using Equation (3):
where ti and ti+1 are the timestamps of the two AIS observations and tg is the estimated gate-crossing time.
tg = ti + λ(ti+1 − ti)
The resulting events were assigned a gate ID and arranged chronologically for each trajectory. When multiple candidate detections for the same vessel, trajectory, and gate were generated from the same supporting observation pair, they were consolidated into a single passage event rather than counted repeatedly.
The resulting passage records were used to calculate gate-specific passage counts and route travel times and to construct the binary gate-passage variables for the Bayesian network. Confirmed passage was coded as True (1), whereas False (0) indicated that passage through the corresponding gate was not confirmed within the continuously observed trajectory interval. Each trajectory constituted one learning case.
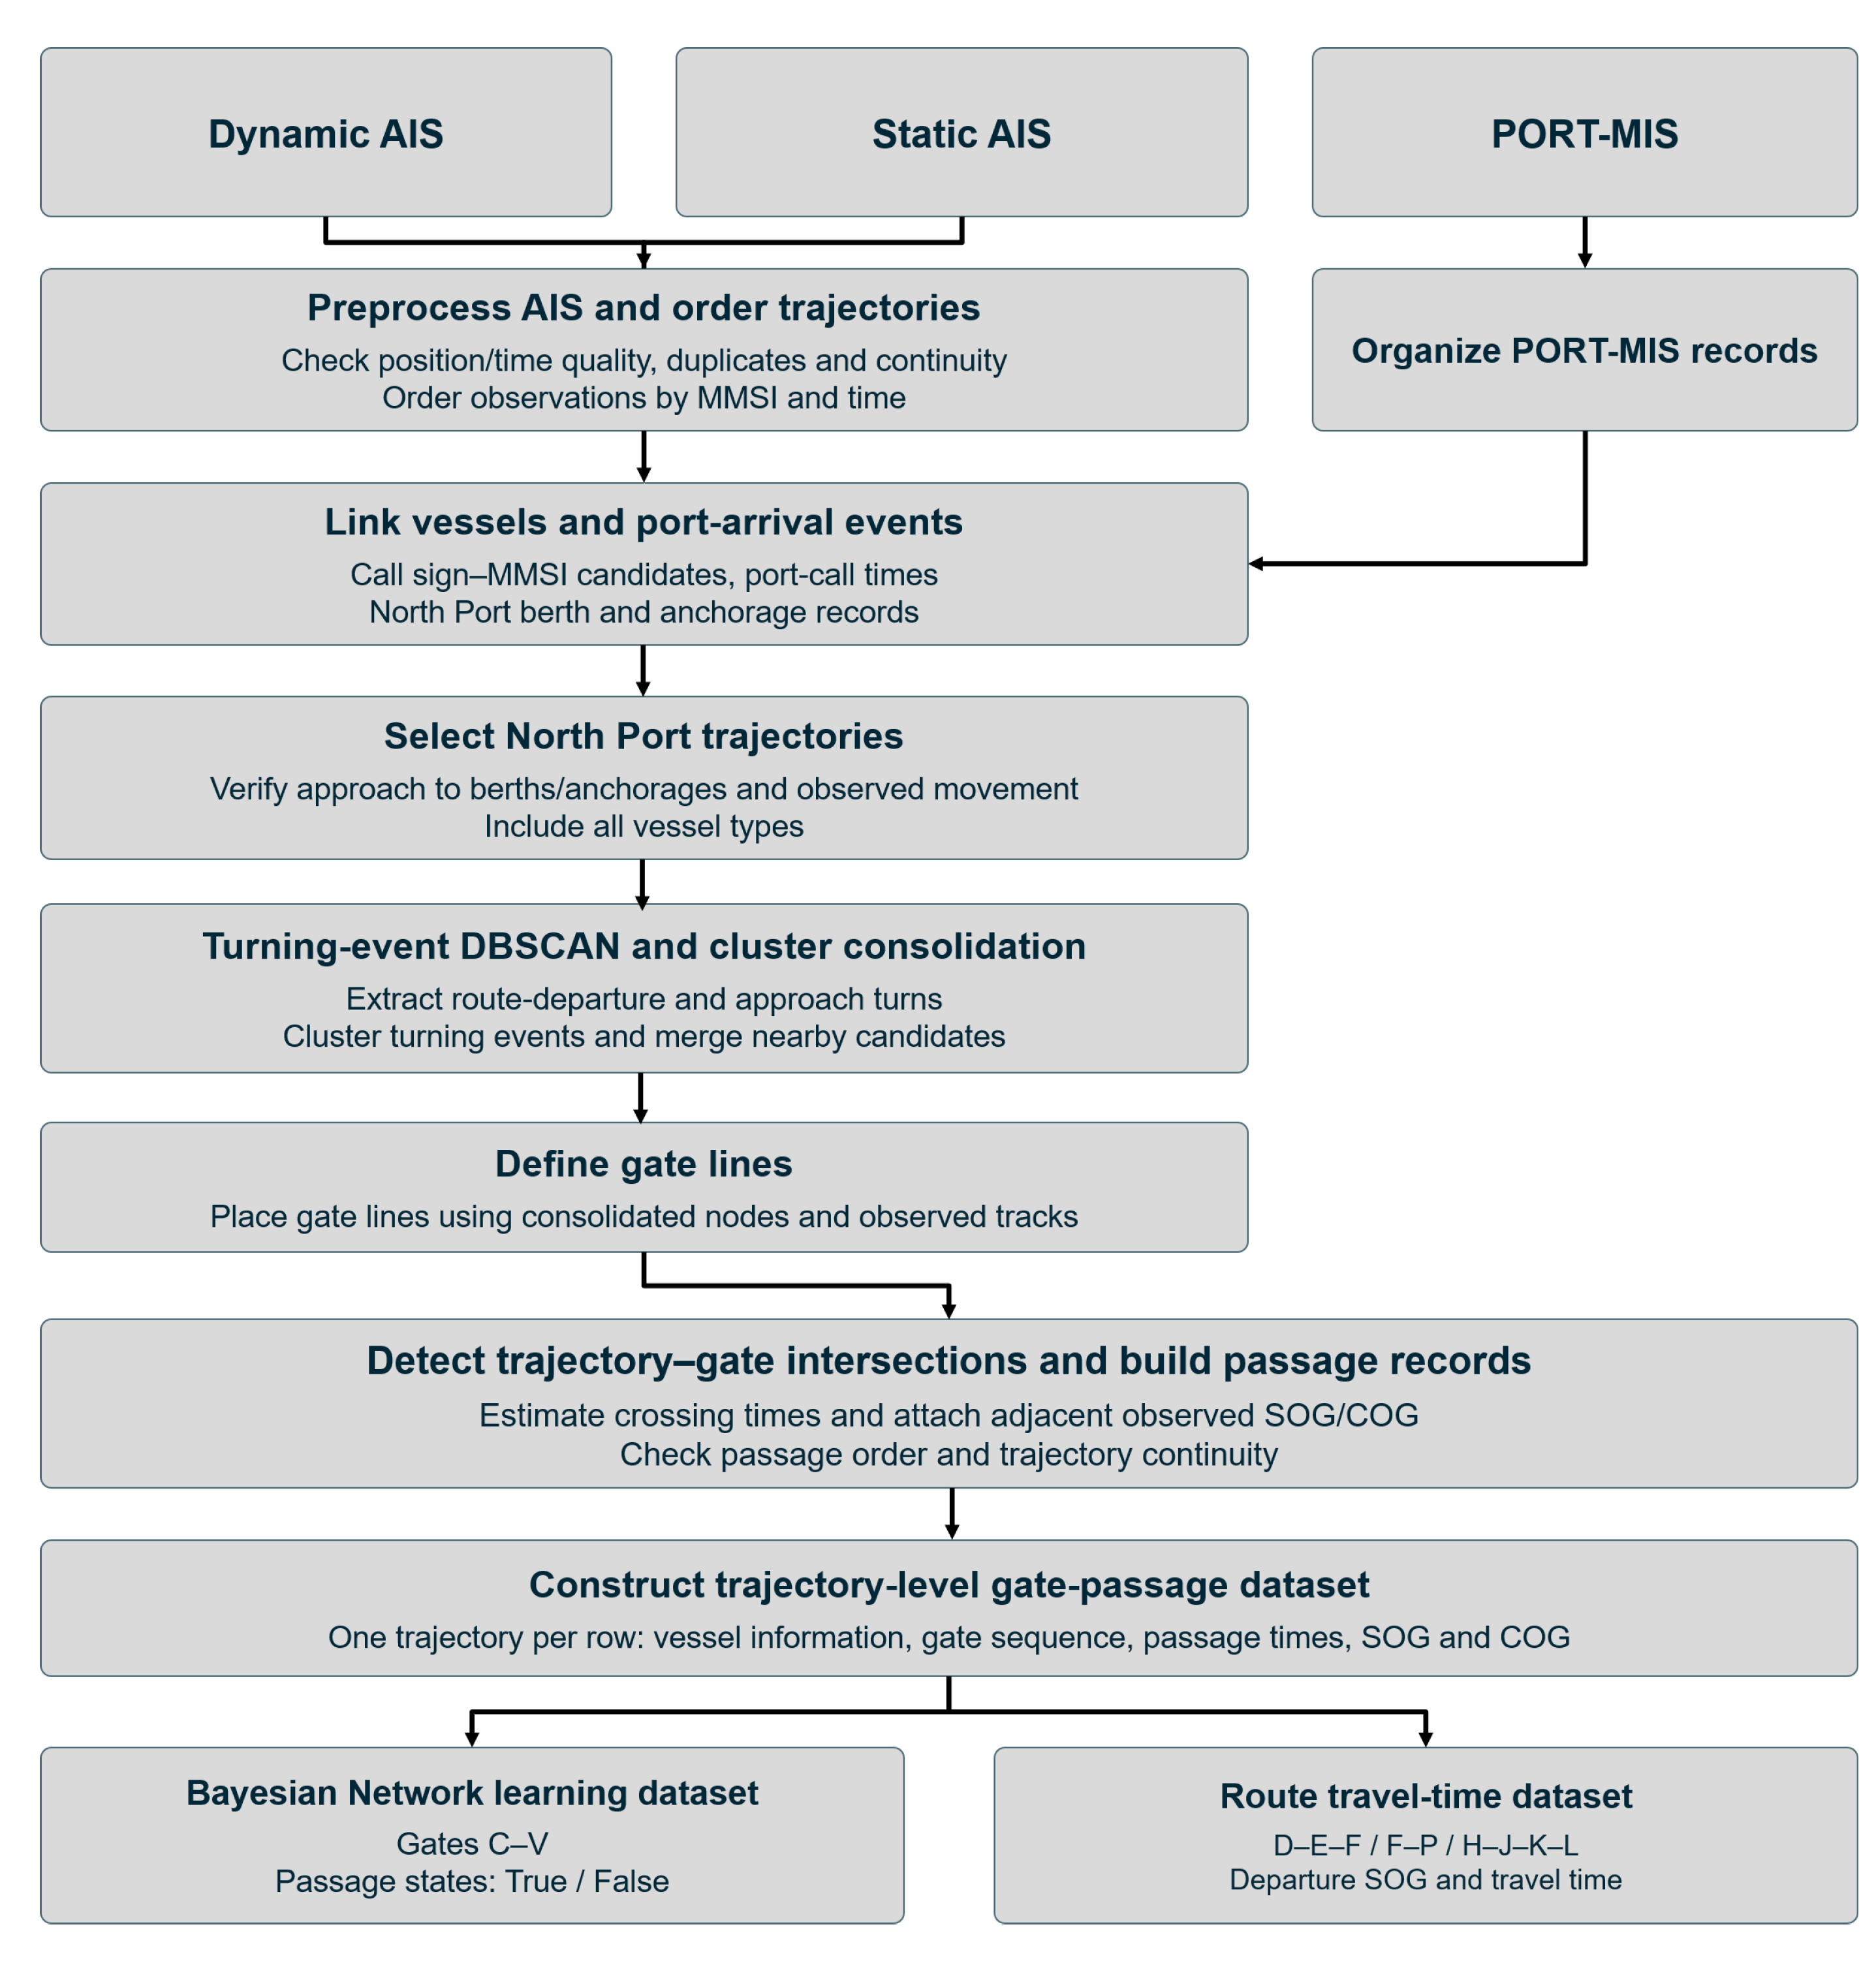
Figure 3 presents the complete processing workflow, from linking AIS and PORT-MIS records to constructing the final analysis datasets. After trajectories were linked to destination-facility information, DBSCAN clusters of turning events were used to establish key traffic locations and gate lines. Passage indicators and passage times were then extracted for each trajectory and used to construct the BN learning dataset and the travel-time analysis datasets for the selected routes.
Figure 3.
Workflow from AIS preprocessing to gate-passage records and probability-learning datasets.
The final analytical trajectories were selected separately from PORT-MIS-registered berth arrivals, registered anchorage arrivals, and AIS-identified passages toward Yeongdo Bridge. After verifying vessel identification, destination-related AIS activity, and continuous approaches through the study area, 6982 berth-arrival trajectories, 358 anchorage-arrival trajectories, and 9000 bridgeward passage candidates were identified.
To construct the BN learning dataset, only trajectories with a complete observed passage from the inward crossing of Gate A to the corresponding arrival endpoint or Gate V were retained. This resulted in 6456 berth-arrival trajectories, 335 anchorage-arrival trajectories, and 403 bridgeward trajectories, yielding a total of 7194 learning cases corresponding to 728 unique MMSIs. Table 2 summarizes the number of candidates retained or excluded at each selection stage and the corresponding screening procedures. Excluded candidates were not necessarily erroneous AIS records; many did not satisfy the spatial coverage or observation-completeness requirements of the analysis.
Table 2.
Inclusion and exclusion of trajectory candidates by source group and selection stage.
3.5. Gate-Passage Bayesian Network and Evidence-Based Inference
The BN was trained using trajectories for which movement from the starting location to an internal endpoint was continuously observed. The gates passed by each trajectory were represented as binary variables. Confirmed passage was coded as True (1), and the absence of confirmed passage within the trajectory’s observation interval was coded as False (0). Trajectories with incomplete observation intervals that prevented passage status from being determined were excluded from the learning data.
A BN represents random variables and their conditional dependencies as a directed acyclic graph [23]. In this study, each node represents whether a vessel passed a gate, rather than the geographical point itself. Each node has two states, True and False. An arc indicates a relationship in which the probability of one gate’s state depends on the state of another gate. This structure is suitable for using observed passage locations as evidence for probability updating.
The network structure was specified based on the spatial configuration of Fairway No. 1, the locations of major branching points, and the gate-passage patterns observed in AIS trajectories. The 23 arcs were organized to represent conditional dependencies associated with shared fairway sections, branching movements, and berth or anchorage approaches. For example, the connections C–D–E–F represent the relationships among successive common fairway sections, whereas F–P, H–M, and K–L represent associations between shared passage locations and destination approaches. Gates with multiple parent nodes were used to represent dependencies involving more than one passage location.
The final conditional probability tables (CPTs) of the GeNIe model were used after the trajectory-level binary data had been matched to the model variables and states. The CPTs were derived from the 7194 complete trajectory-level binary records. For each node, the conditional probabilities were defined according to the observed gate-passage states and the corresponding parent-state combinations. A numerical comparison between the stored CPTs and the observed conditional frequencies showed that 40 of the 49 parent-state rows matched the empirical proportions, while the remaining nine boundary rows were consistent with a 0.5 correction applied to both binary states. Results under different evidence conditions were calculated while keeping the specified structure and stored probabilities fixed [24]. The BN was constructed for inbound trajectories entering Busan North Port from the outer harbor. This avoided mixing inbound and outbound trajectories passing the same gates in opposite directions and enabled gate-passage patterns to be compared among destination approaches during entry. The joint probability of the 20 binary variables is factorized into conditional probabilities given the states of their parents, as shown in Equation (4).
Here, Xg is the binary random variable indicating passage through gate g. Xg = 1 denotes confirmed passage, whereas Xg = 0 denotes the absence of confirmed passage. Pa(Xg) denotes the set of parent nodes of Xg in the BN. Nodes without parents were assigned marginal probabilities, and nodes with parents were assigned conditional probabilities for each parent-state combination in their CPTs. For each combination, the probabilities of True and False sum to 1. Arcs represent the dependencies required for this factorization; they do not imply that a vessel must move in the direction of an arc, nor do they imply causal effects.
When observed evidence e was available, the probabilities of other gates were updated using Equation (5).
Here, e represents observed gate-passage states, and P(Xg = 1 ∣ e) is the passage probability for gate g given that evidence. Posterior probabilities were calculated using the probabilities of joint states consistent with the evidence. In this study, a prior probability denotes a model probability before additional gate-passage evidence is entered, whereas a posterior probability denotes the probability updated after entering observed evidence into the same BN. Entering evidence is therefore distinct from relearning the CPTs.
Evidence-based queries were performed in two directions. First, passage through destination-approach gate d was entered as evidence to calculate P(Xg = 1 ∣ Xd = 1). Here, d denotes a destination-related approach gate and g denotes the queried gate. This query identifies common passage locations used by trajectories approaching a particular destination. Second, confirmed passage through gate c was entered as evidence to calculate P(Xd = 1 ∣ Xc = 1). Here, c denotes the observed passage gate. This query compares berth and anchorage approach candidates associated with trajectories passing that location.
Unlike separately calculated empirical conditional probabilities for individual gate pairs, the BN represents dependencies among multiple gate-passage variables within a single joint probability distribution. This enables probability updating under different combinations of observed evidence.
The destination-related gates in this study are not mutually exclusive destination categories from which a vessel must select exactly one; each variable indicates whether a trajectory passed the corresponding gate. A trajectory can pass multiple approach gates, so the probabilities of different gates were not adjusted to sum to 100%. Each variable summarizes the passage over the entire trajectory. Thus, probabilities obtained by entering a current passage location as evidence describe associated approach flows rather than the transition probability for the next gate encountered. Future gates whose passage status was not yet known were left unobserved rather than entered as False evidence.
The numerical consistency of the model calculations was also examined. The sum of the joint probabilities was checked against 1, and results under identical evidence conditions were compared with those obtained using a separate probability-calculation method. Representative CPTs and posterior probabilities are presented in the main text, and the complete CPTs are provided in Appendix A. These checks concern the correctness of probability calculations in the constructed BN and are distinct from validation of predictive accuracy on new trajectories.
A supplementary temporal assessment was conducted using the fixed 23-arc BN structure. The CPTs were re-estimated using 5389 trajectories from September 2024 to May 2025, and the resulting conditional probabilities were evaluated using 1805 trajectories from June to August 2025. This assessment examined node-level probabilities given the observed parent states. Because the network structure had been developed with reference to the full study period, the assessment was treated as a diagnostic evaluation of local conditional relationships rather than an independent validation of the complete network.
3.6. Estimation of Route Travel Times Conditional on Departure Speed
This section describes the analysis of travel times between major gates, separately from the spatial passage probabilities discussed above. Rather than analyzing every gate combination in Busan North Port, three illustrative routes with different traffic characteristics were selected. D–E–F represents continuous movement along Fairway No. 1; F–P represents the final approach to Shin-Gamman Pier; and H–J–K–L represents the approach to Lighter Wharf 5 through the inner harbor. These routes allow departure-speed-related travel times to be compared across fairway transit, berth approach, and inner-harbor movement. Only cases in which the specified gate sequence was observed consecutively within the same trajectory and temporal continuity was established were included in each route analysis.
Travel time Tr for route r was defined as the difference between the passage times at departure gate a and final gate b, as shown in Equation (6). Passage times are expressed in seconds and travel time in minutes. For routes containing multiple gates, the start and end times of the same trajectory were used rather than summing mean segment times from different trajectories. The nearest valid SOG observation before passage through the departure gate was used as speed evidence.
Departure speed and travel time were discretized to analyze route-specific temporal characteristics. The departure-speed state was denoted by Va, and the travel-time state for route r by Kr. The conditional probability P(Kr ∣ Va) was calculated for travel-time states within each departure-speed state. Speed intervals were selected according to the operating characteristics and observed distributions of each route, and travel time was divided into five intervals. The state boundaries are presented in Table 3.
Table 3.
Discrete departure-speed and travel-time intervals by route.
After departure speeds and travel times had been divided into intervals, conditional probabilities for the travel-time intervals were calculated using trajectories in the same departure-speed interval. The number of observations belonging to speed state v and time state k was denoted by nvk. To avoid assigning a probability of exactly zero to unobserved time intervals, 0.5 was added to the frequency of each interval, as shown in Equation (7).
Here, r denotes the analyzed route, Va the departure-speed state, and Kr the travel-time state for that route. nvk is the number of observations in travel-time state k for departure-speed state v. Arrival probabilities at a given time threshold were calculated by summing the probabilities of the shorter travel-time intervals. For example, the probability of arrival in less than 6 min is the sum of the probabilities for “less than 4 min” and “at least 4 min and less than 6 min.” The resulting probabilities form conditional distributions for trajectories that followed each specified route; they do not include the time required to complete berthing or the probability of selecting a different route.
To evaluate the temporal generalizability of the route travel-time distributions, the valid trajectory cases were chronologically divided into a nine-month training period (September 2024–May 2025) and a three-month holdout period (June–August 2025), based on the starting time of each trajectory. The conditional travel-time probabilities were estimated using only the training cases, whereas the holdout cases were used to evaluate the resulting probability distributions using the multiclass Brier score. Descriptive travel-time statistics were calculated using the full annual dataset, including both training and holdout cases. This temporal evaluation was conducted for the selected routes under the fixed gate configuration.
4. Results
4.1. Registered Arrivals and Departures in Busan North Port
During the study period, PORT-MIS contained 40,704 registered events associated with identified North Port berths or anchorages, comprising 20,354 arrivals and 20,350 departures. Tankers accounted for 19,550 events (48.0%), and container ships accounted for 11,769 (28.9%). Together, these two categories represented 76.9% of registered events. They were followed by passenger ships with 3881 events, tugs with 2008, bulk and general cargo ships with 1868, and barges with 1372. Table 4 presents the event composition, including repeated calls by the same vessels.
Table 4.
Annual PORT-MIS arrival and departure events in North Port by vessel type.
As shown in Table 5, Lighter Wharf 5 recorded 15,996 events, followed by Shinseondae Pier with 4999, Gamman Pier with 4268, the Busan Port International Passenger Terminal with 3665, Cheonghak Quay with 2538, and Shin-Gamman Pier with 2061. Lighter Wharf 5 alone accounted for 39.3% of all registered events. This composition indicates that limiting North Port arrival flows to large cargo vessels approaching container terminals would overlook frequent wharf calls and passenger and support-vessel traffic. Accordingly, trajectories were selected based on the availability of identified destination facilities rather than vessel type alone.
Table 5.
Annual PORT-MIS arrival and departure events in North Port by facility.
Registered anchorage events totaled 1564, comprising 898 arrivals and 666 departures. Although anchorage calls serve a different purpose from berth calls, they also form flows that leave a shared fairway and branch into separate waters. They were therefore included in the analysis using gates distinct from those for berth approaches. The annual arrival and departure totals represent events recorded within the same period; the available data were not used to identify why the two totals differed for individual facilities.
4.2. Key Traffic Locations and Gate Configuration
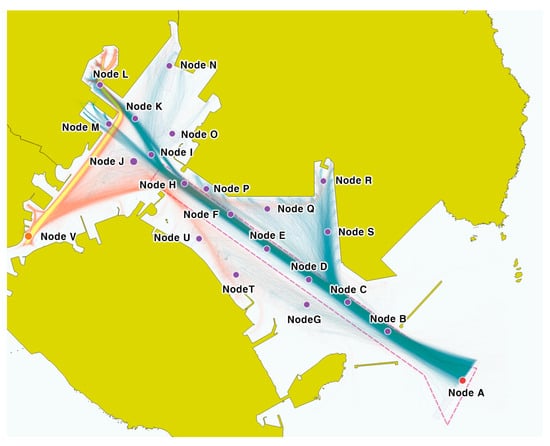
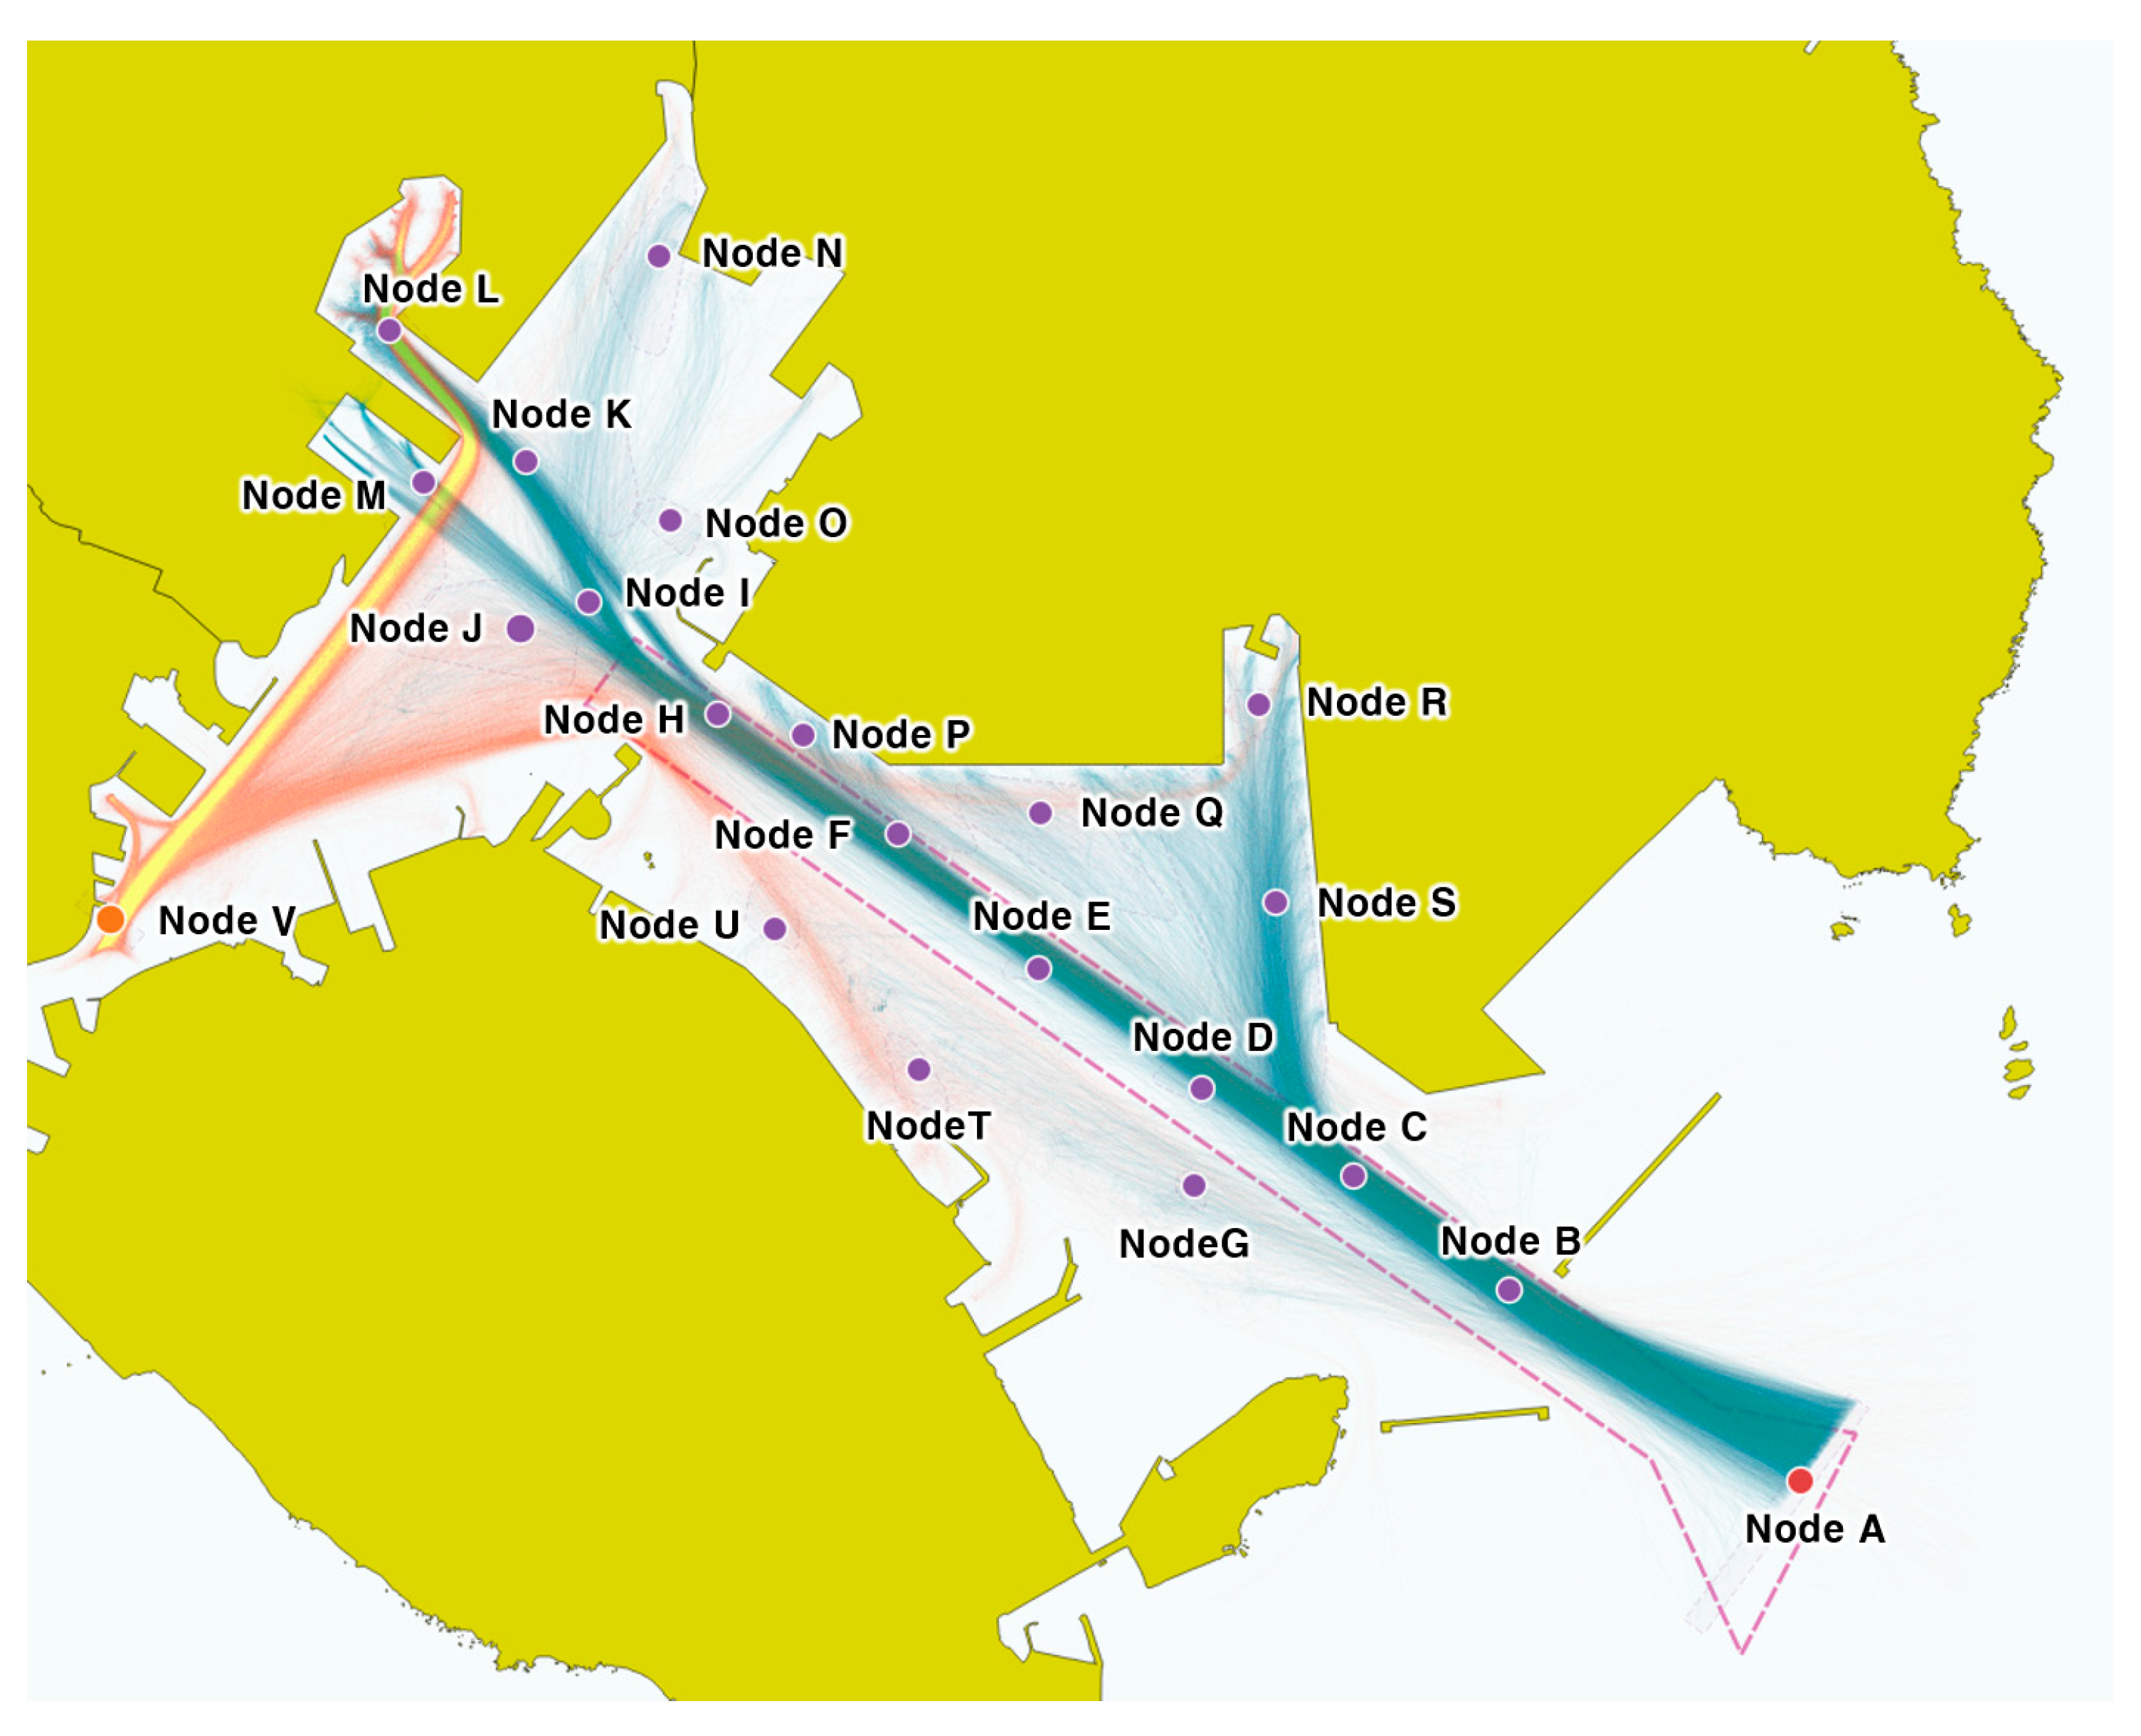
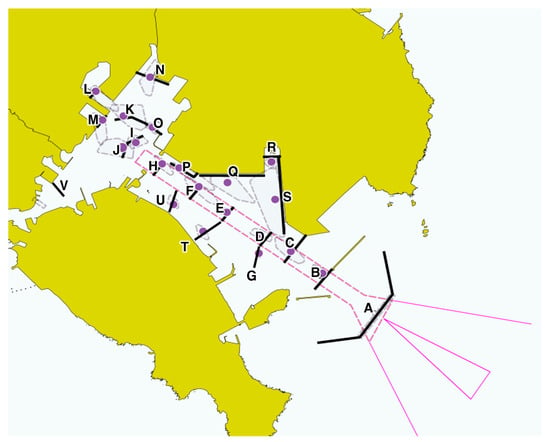
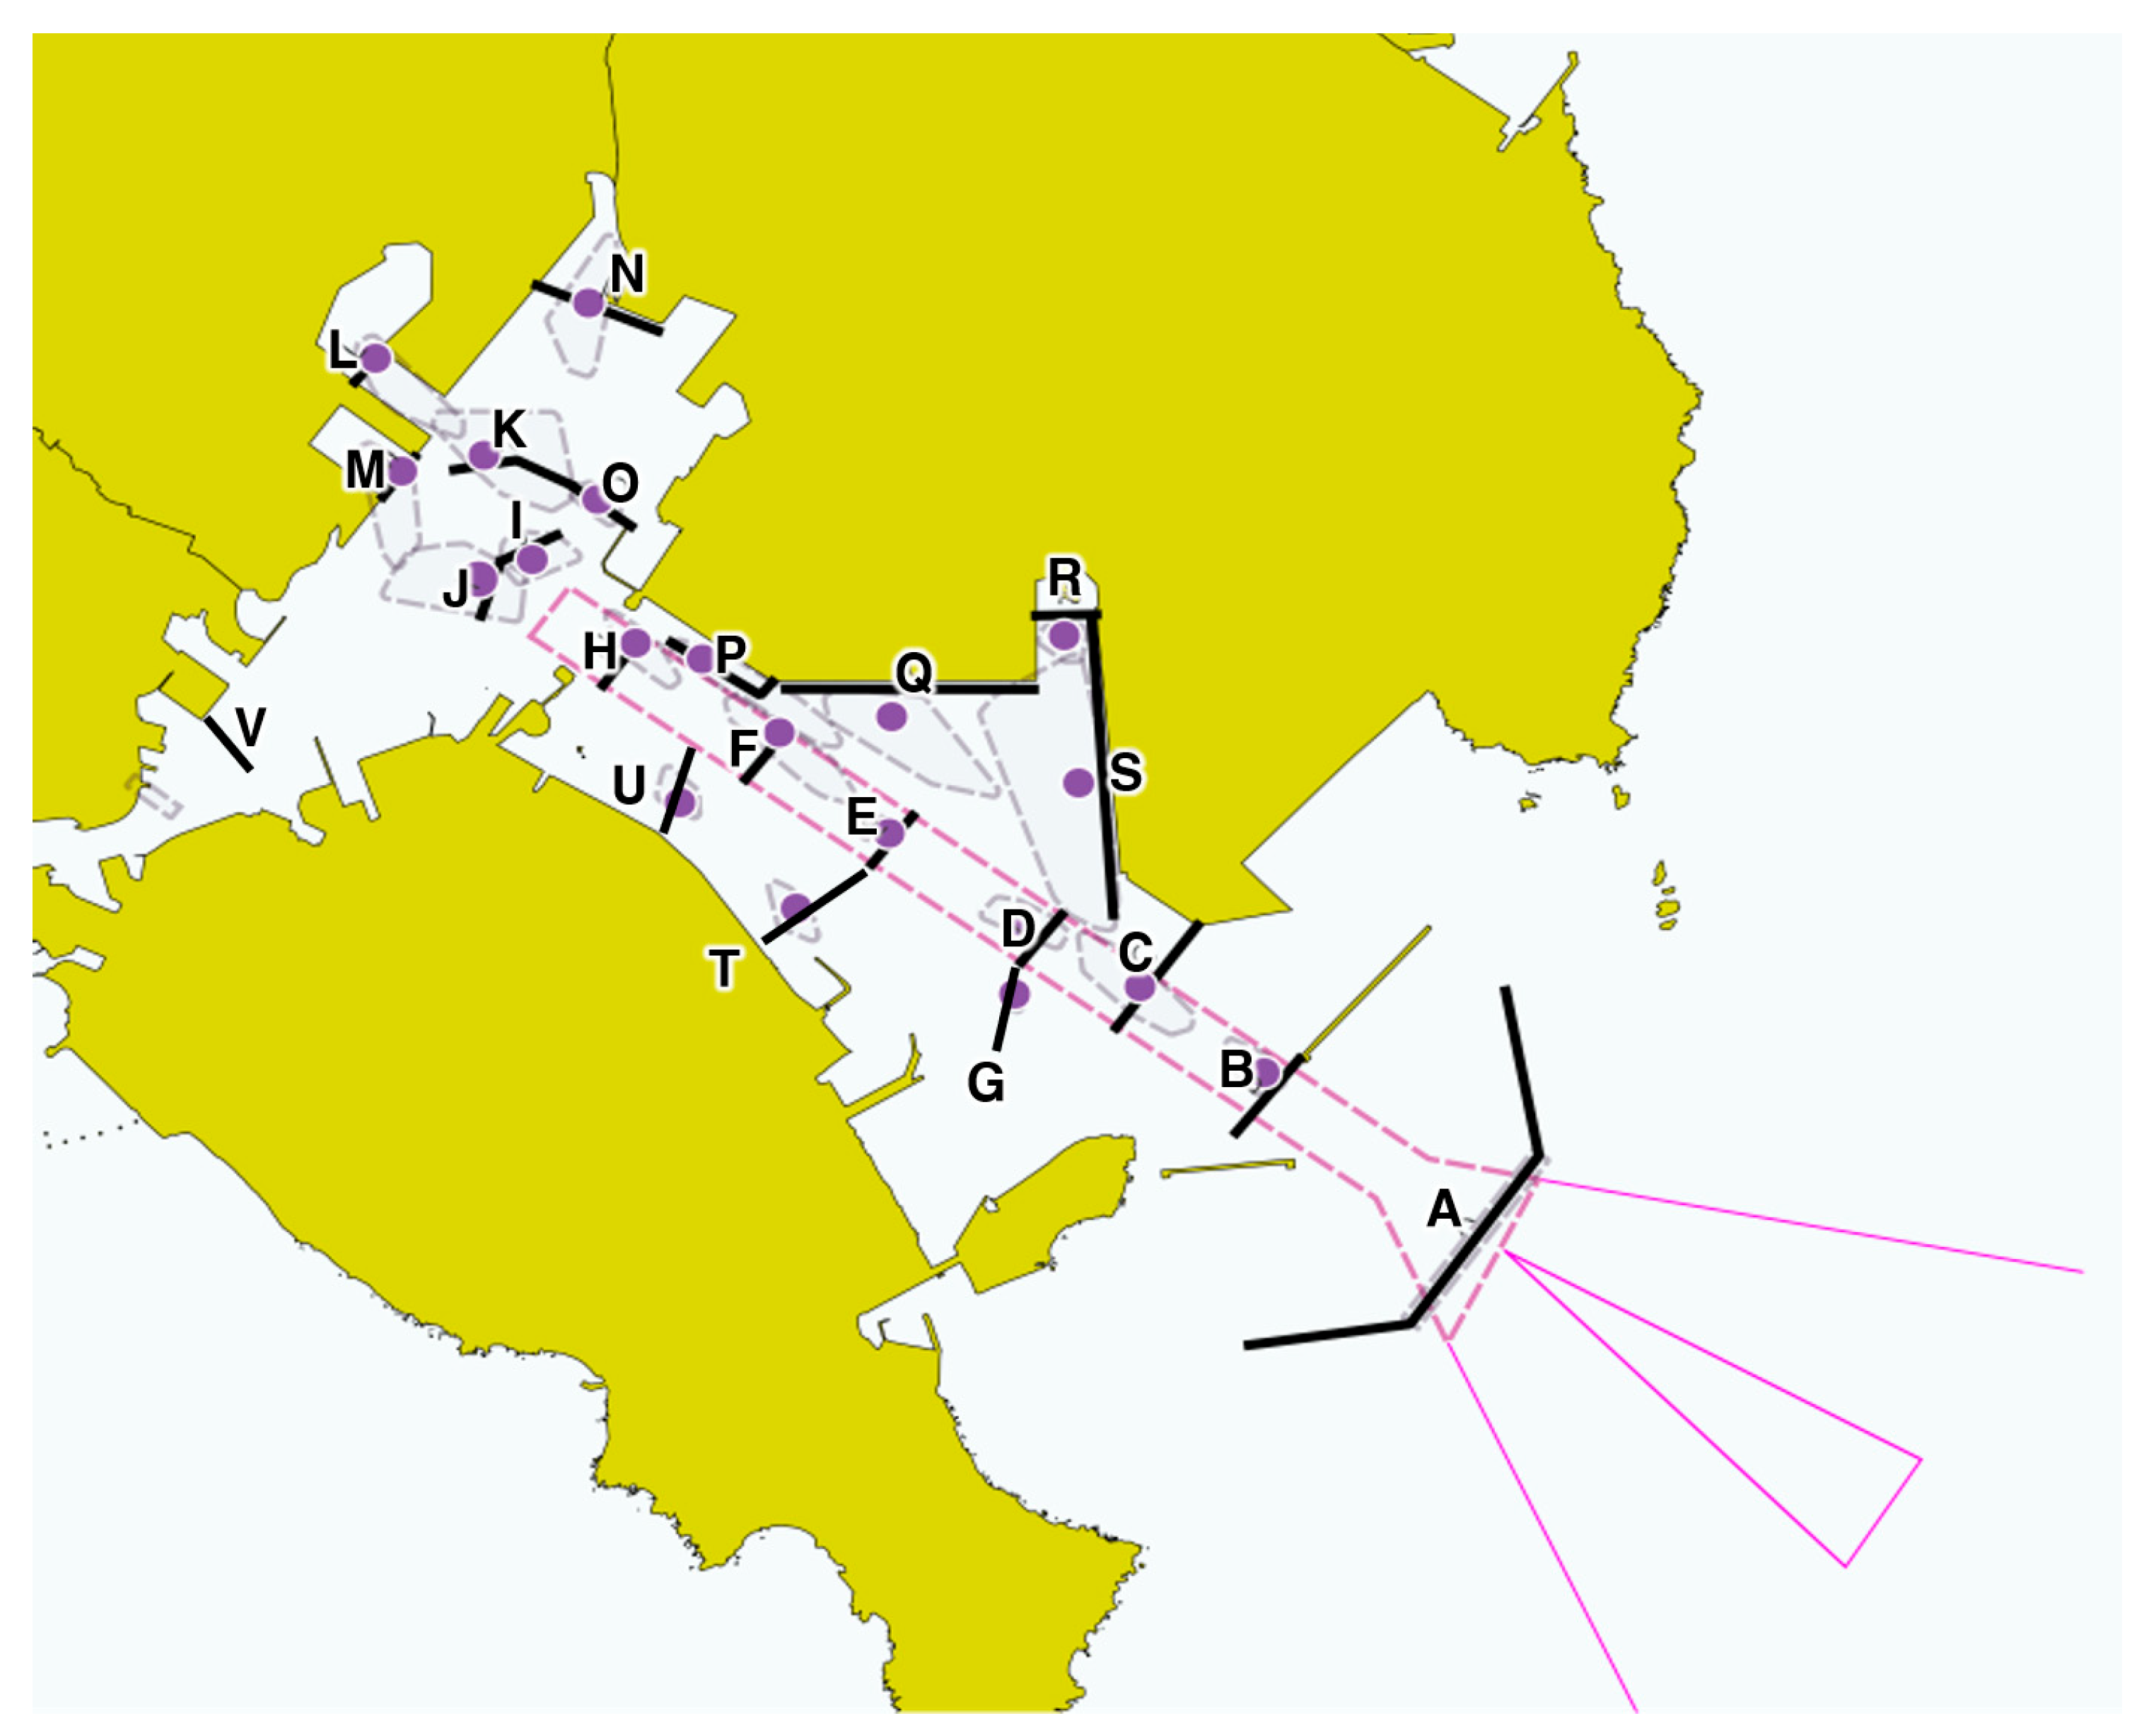
The clusters of turning events and actual trajectories were examined to identify key locations that distinguish flows sharing Fairway No. 1 from flows branching toward berths and anchorages. Figure 4 shows the consolidated location candidates, and Figure 5 shows the gate lines established with reference to those locations and traffic directions.
Figure 4.
Key traffic locations identified by examining trajectories and spatial cluster candidates.
Figure 5.
Gate lines A–V established at key traffic locations.
For readers unfamiliar with Busan North Port, the gate configuration can be understood as a shared inbound traffic corridor followed by several branching approaches. Vessels entering from the outer harbor initially pass through common fairway sections, after which their routes diverge toward container terminals, passenger terminals, inner-harbor berths, or anchorages. The gates were positioned to represent these shared passages and subsequent branching movements, rather than simply dividing the study area into geographical segments.
Gate A represents the common entrance from the outer harbor, while Gates B and C correspond to the common traffic flow toward Fairway No. 1. Gates D–F and H represent branching and passage sections within Fairway No. 1. Gate I represents the common approach to the E1 and E2 anchorages, Gate J represents the common entrance to the inner harbor, and Gate K represents an intermediate branching point within the inner harbor. Gates L–S represent approaches to the major berth groups. Gates G, T, and U correspond to approaches to M8 Anchorage, Cheonghak Quay, and Miwon Quay, respectively, while Gate V represents traffic toward Yeongdo Bridge. The identifiers and representative traffic functions of the gates are summarized in Table 6.
Table 6.
Final gate identifiers and representative traffic functions.
The E1 and E2 anchorage approaches were represented by the common Gate I, whereas Gate J was distinguished as the continuation of traffic into the inner harbor. Gate K was subsequently defined as an intermediate branching point for traffic proceeding toward different inner-harbor destinations.
4.3. Characteristics of Vessel Traffic in Busan North Port
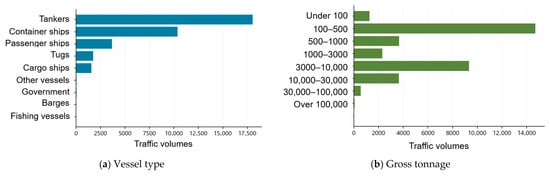
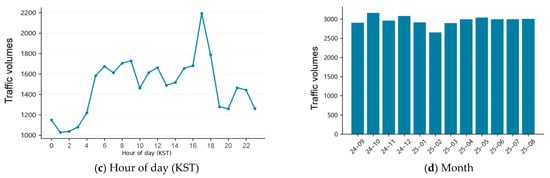
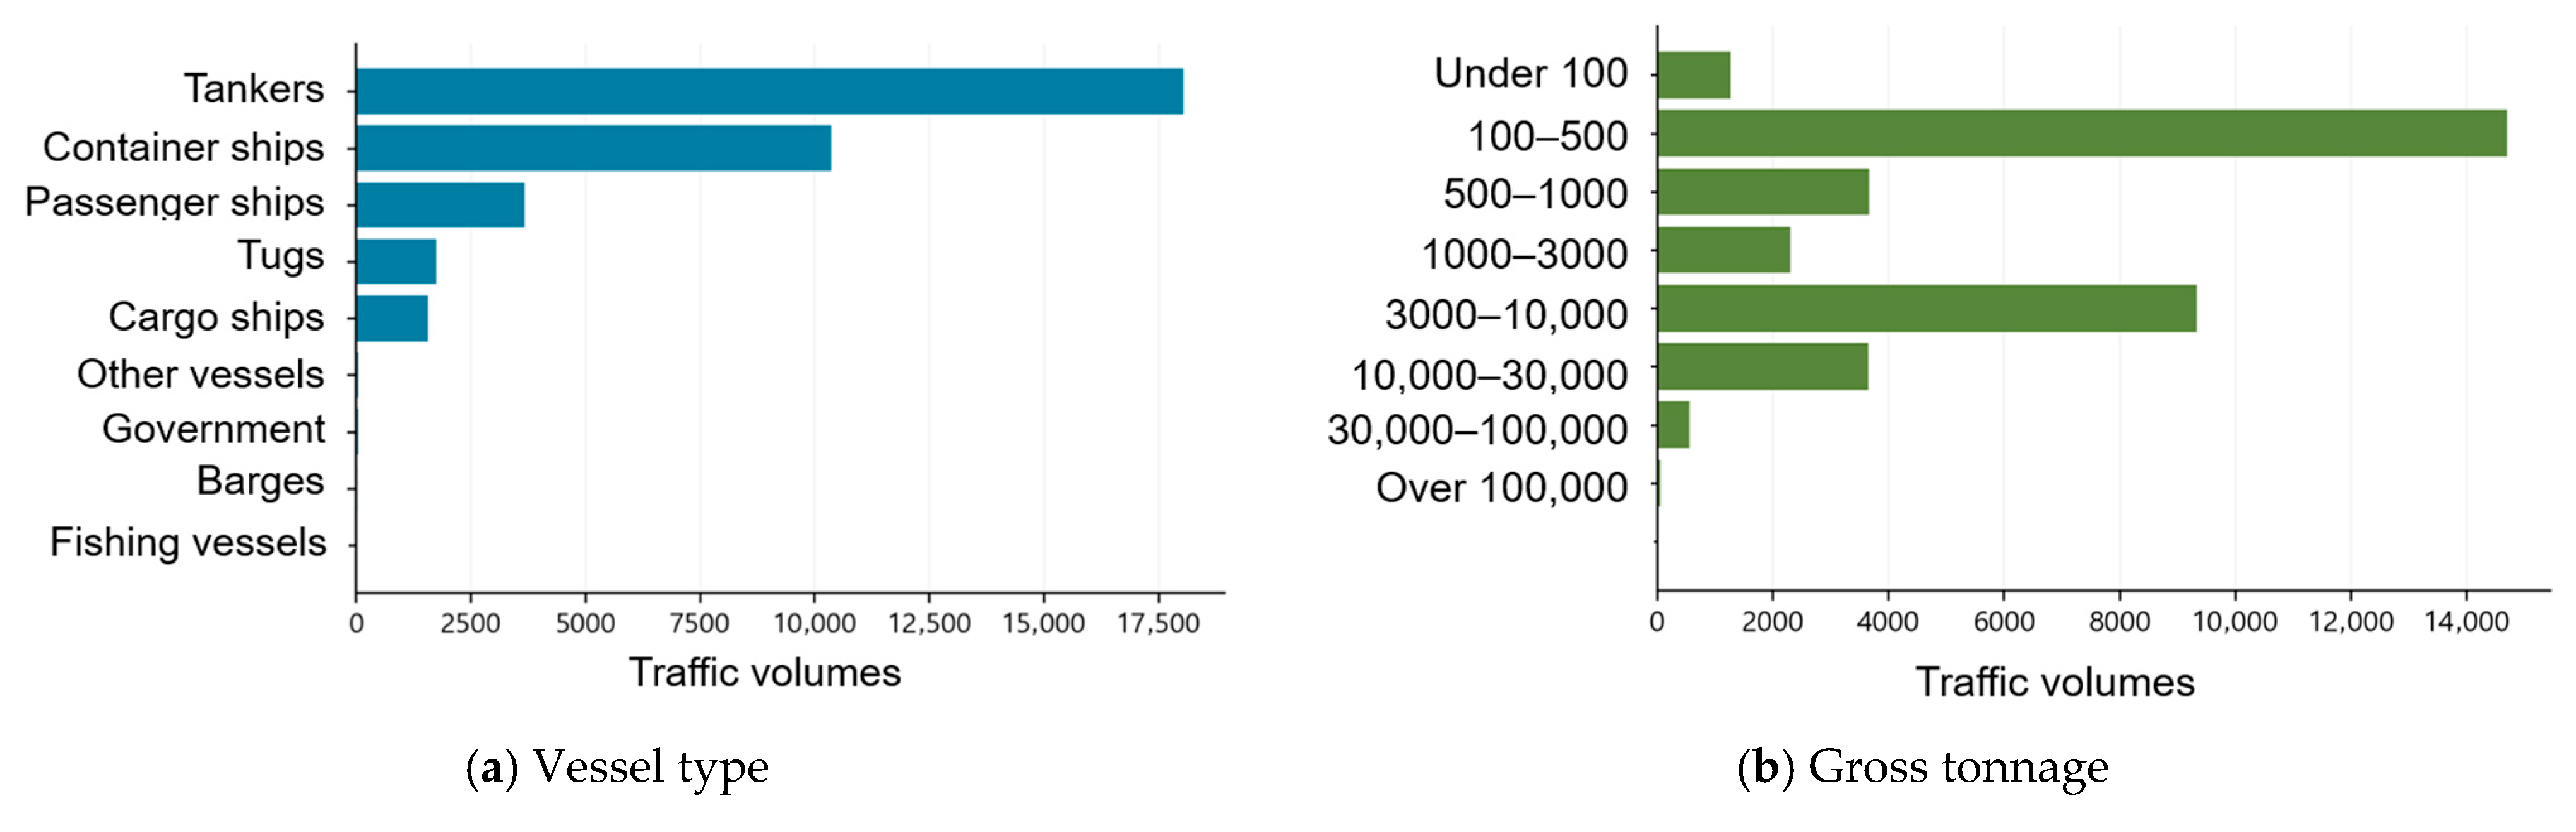
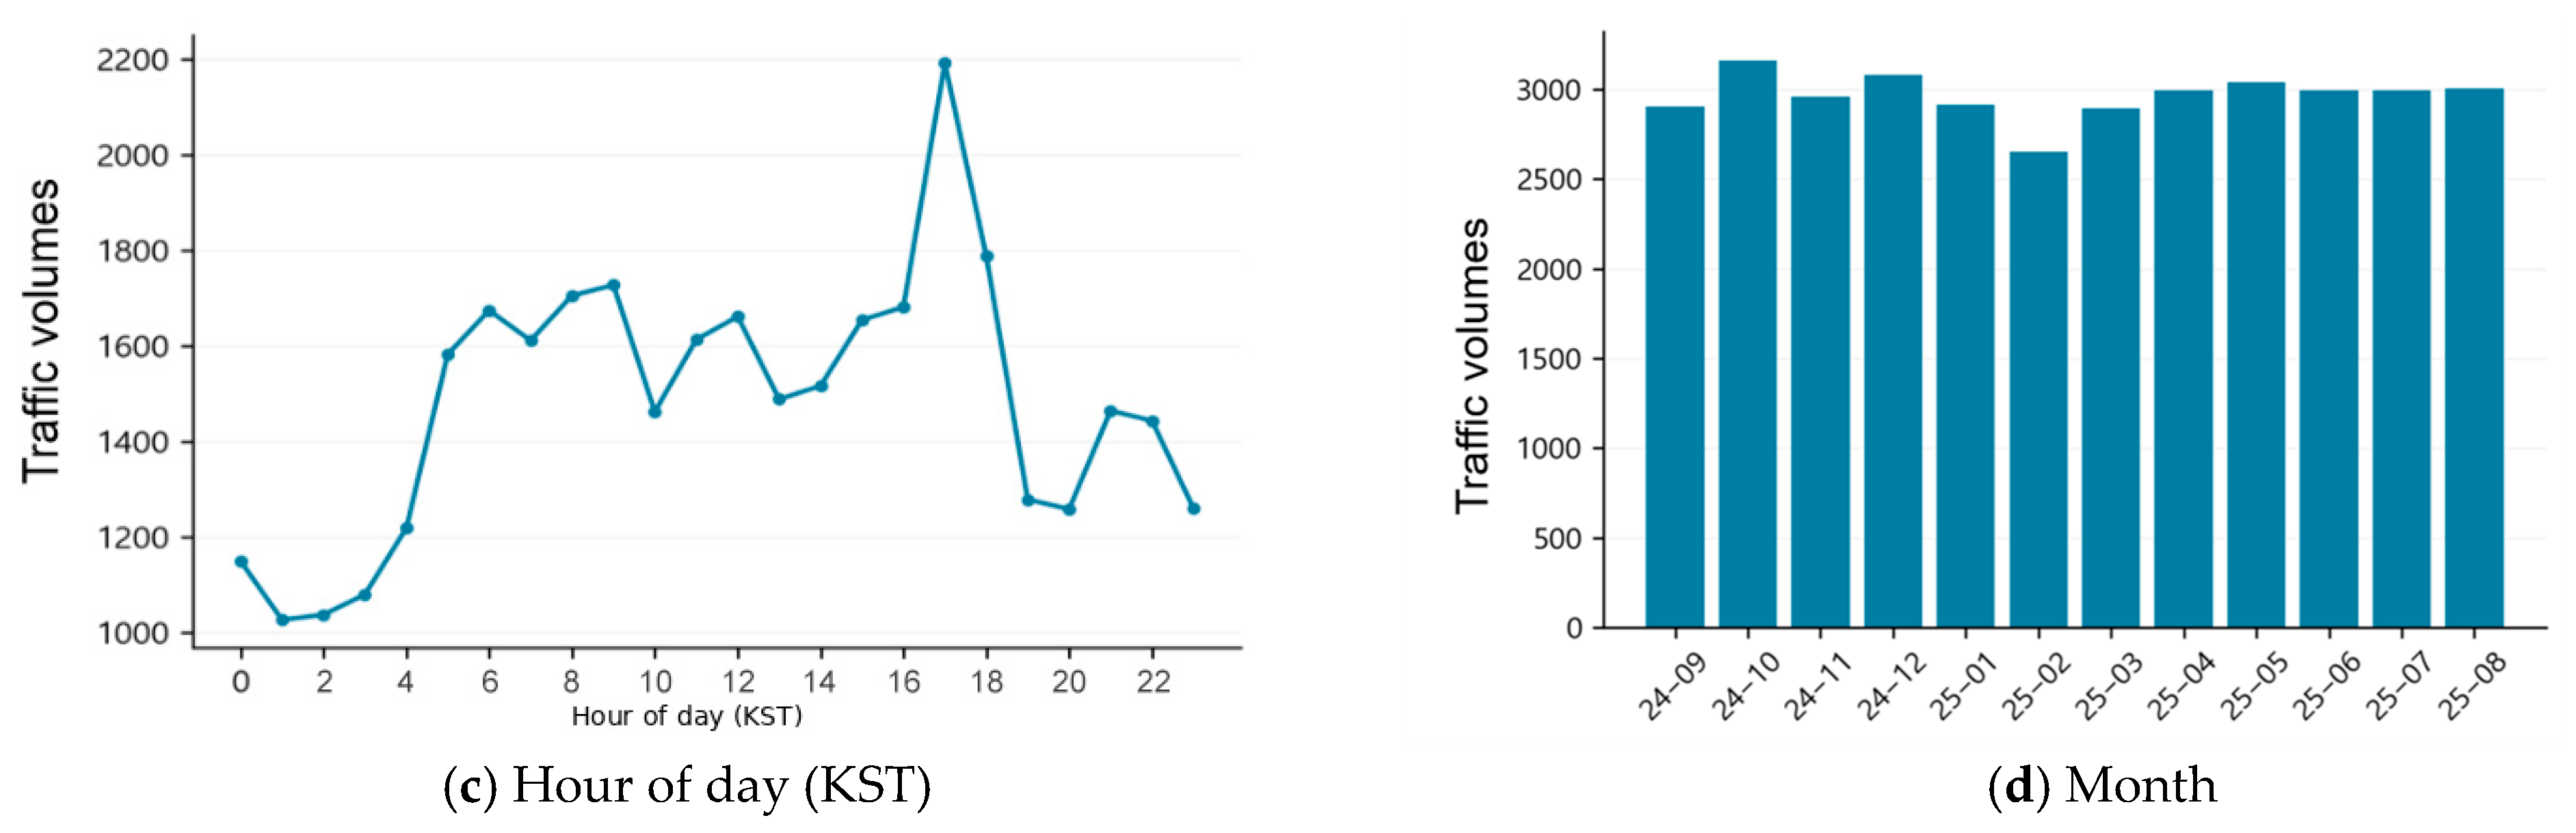
Figure 6 presents the overall characteristics of inbound and outbound vessel traffic in Busan North Port during the AIS data collection period, classified by vessel type, gross tonnage, hour of day, and month. Gate A, located at the common outer entrance to the study area, was used as the reference cross-section for aggregating inbound and outbound traffic. A total of 35,590 vessel passages were recorded during the study period, including 17,791 inbound and 17,799 outbound passages, corresponding to an average of 97.5 passages per day. By vessel type, tankers accounted for 18,046 passages (50.7%), container ships for 10,372 (29.1%), and passenger ships for 3688 (10.4%). These results indicate that tanker and container traffic constituted the dominant components of vessel traffic entering and leaving Busan North Port.
Figure 6.
Annual traffic characteristics at Gate A: (a) vessel type; (b) gross tonnage; (c) hour of day (KST); and (d) month.
The cumulative passage count by hour of day was highest during the 17:00 hour, with 2193 passages, and lowest during the 01:00 hour, with 1027 passages. These values aggregate passages during the corresponding hour of the day across all dates. The maximum count observed within a single hour was 14 passages. Monthly totals were highest in October 2024, with 3162 passages, and lowest in February 2025, with 2652. As monthly totals also reflect differences in the number of days and observation conditions, they were interpreted as descriptive characteristics of the observation periods.
Vessel-type composition varied among gates. Of the 18,745 passages through Gate L on the approach to Lighter Wharf 5, 18,599 were made by tankers. At passenger-terminal approach Gate M, passenger ships accounted for 3540 of 3796 passages. Container ships accounted for 3794 passages at Gate Q near Gamman Pier and 3551 at Gate S near Shinseondae Pier. Of the 5888 passages through Gate V toward Yeongdo Bridge, 4529 were made by tankers and 1300 by tugs. These differences indicate that vessel flows vary according to the destination facilities associated with each gate.
The 40,704 PORT-MIS events and 35,590 AIS passages cover the same study period but represent different types of events and units of measurement. PORT-MIS records facility-related registration events, whereas the AIS count represents observed passages through a specific gate. The two totals were therefore not treated as directly equivalent measures of traffic volume. Moreover, because the same trajectory can pass multiple gates, the sum of passage counts across all gates was not interpreted as the total number of arrivals and departures for Busan Port. Traffic characteristics were accordingly interpreted as passage frequencies in the study waters, whereas the BN analysis in the following section was interpreted in terms of passage associations across trajectories.
4.4. Bayesian Network Structure with Prior and Conditional Probabilities
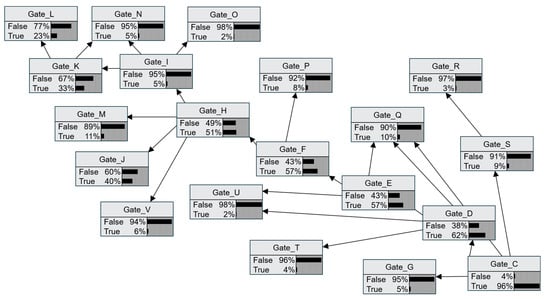
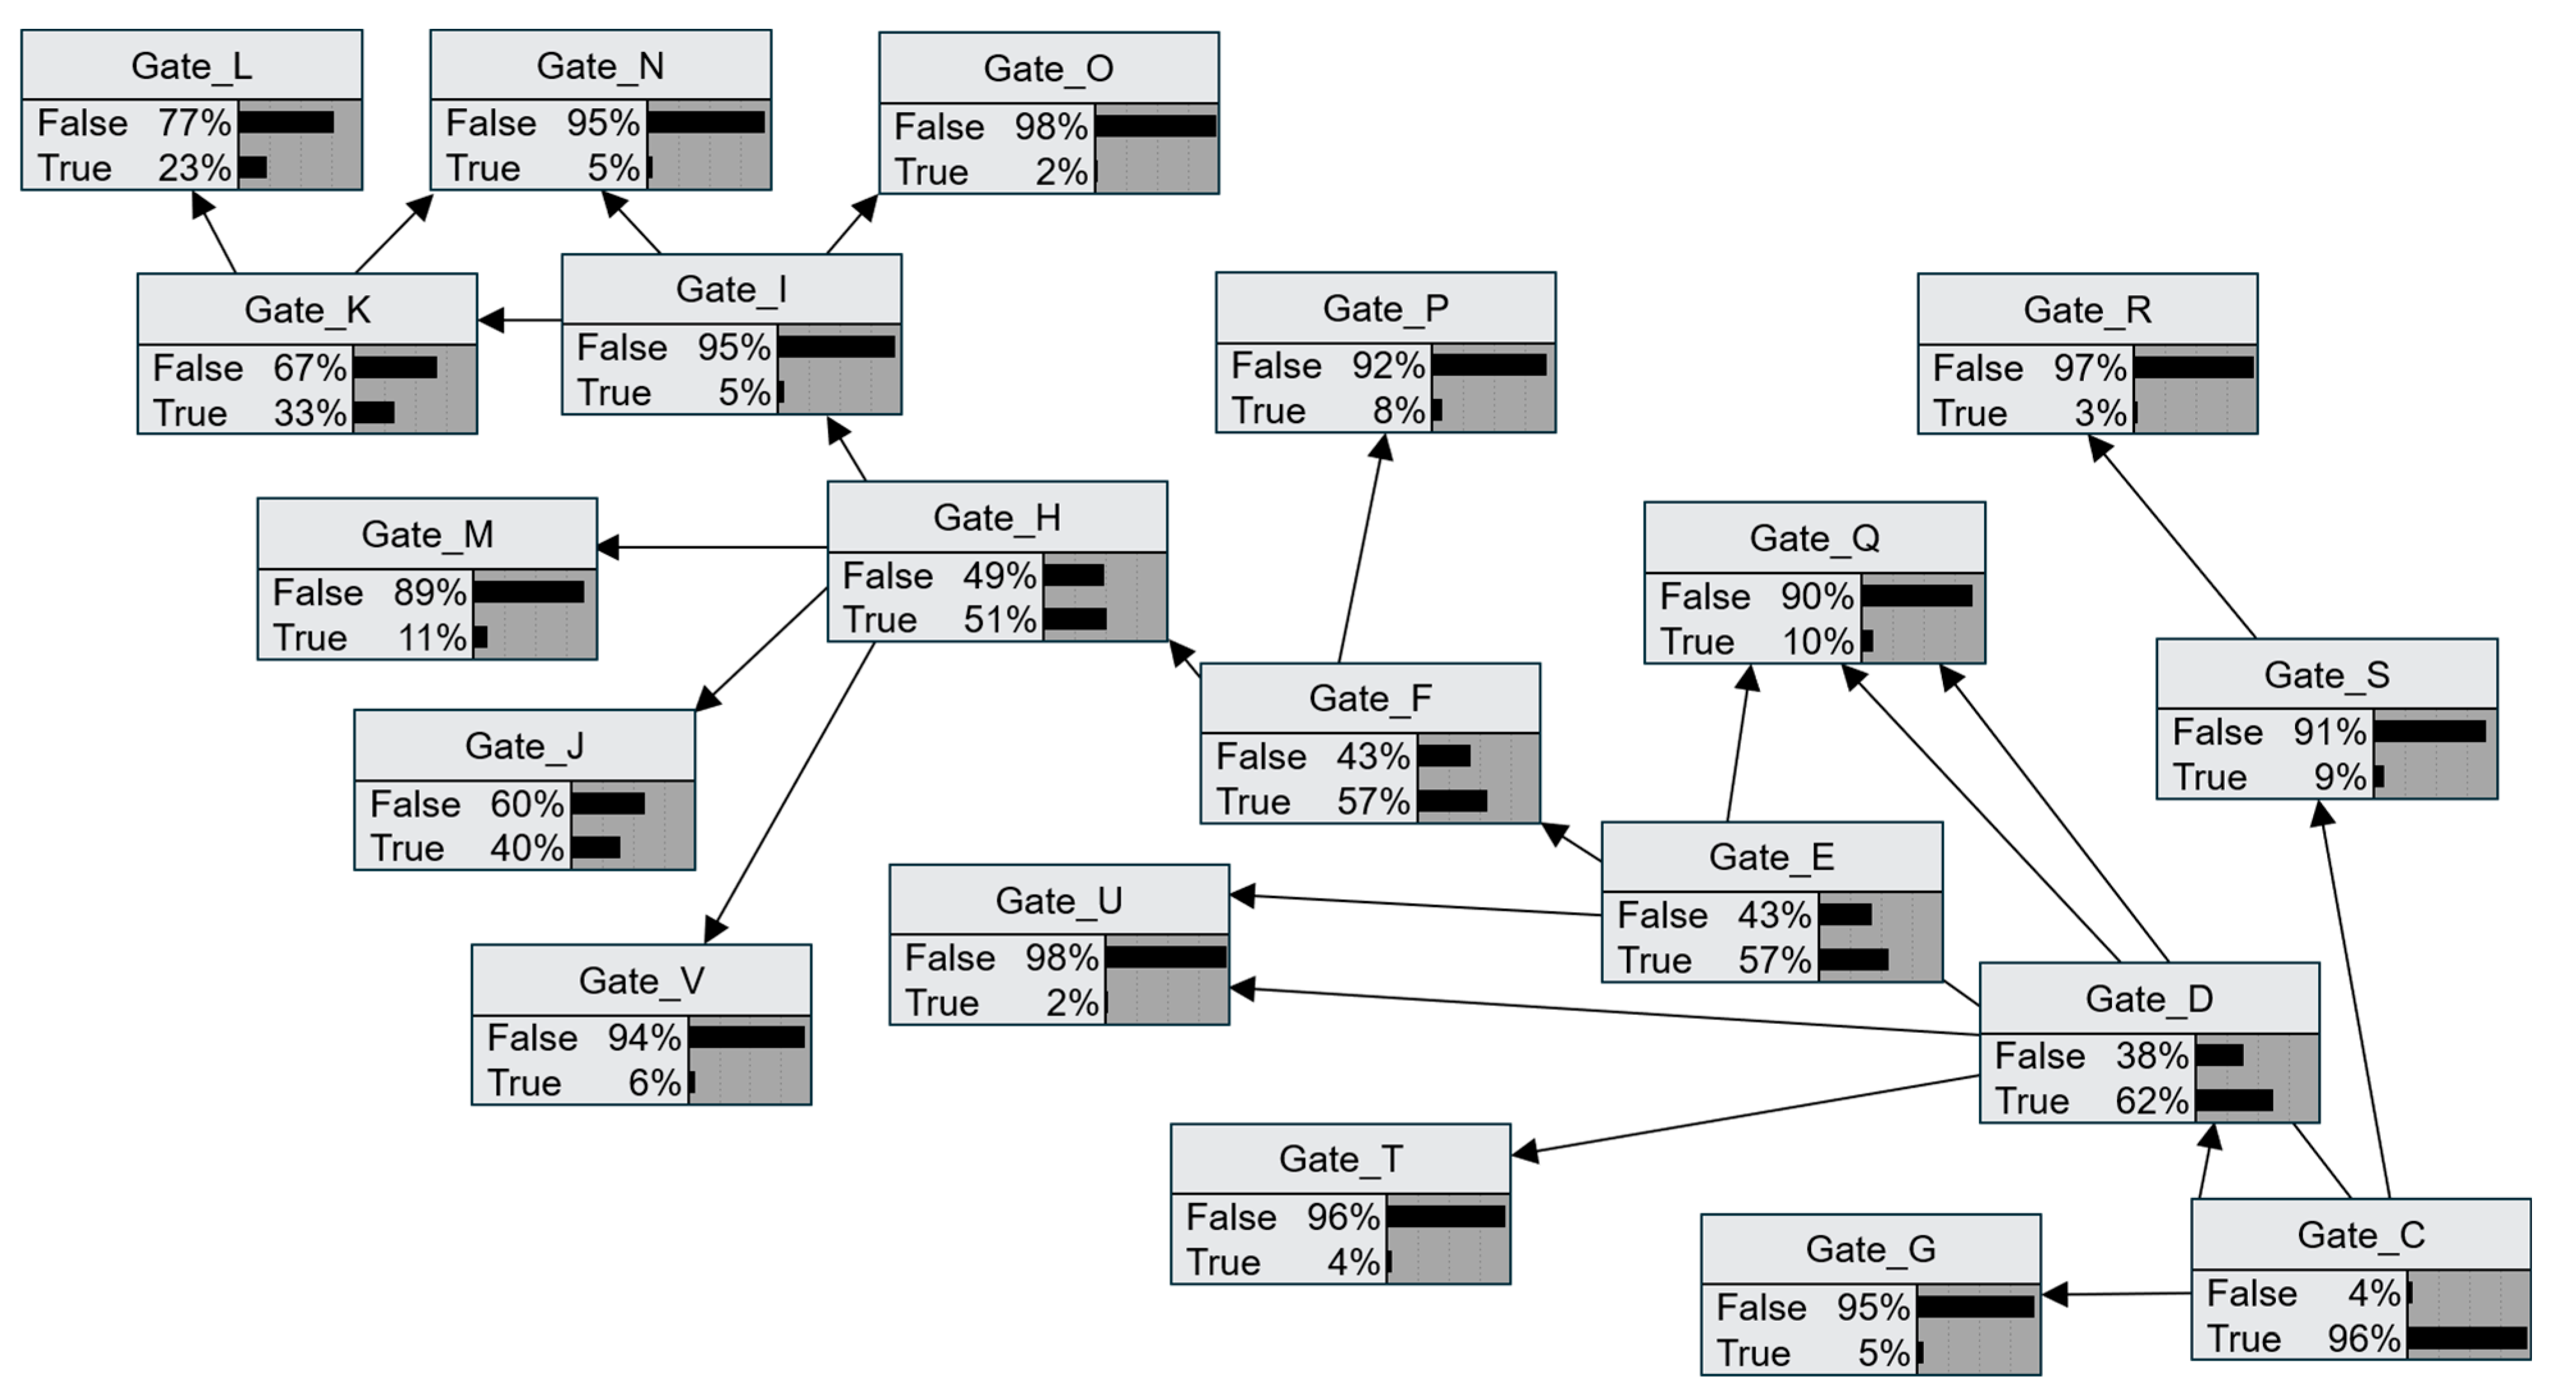
The final BN analysis used 7194 trajectories with continuously observed movement from an outer-harbor starting location to an internal endpoint in Busan North Port. The final network contained 20 binary variables and 23 arcs. Gates A and B, whose passage indicators were True for all learning trajectories and therefore showed no variation, were excluded from the model. Figure 7 shows the specified structure and marginal probabilities without additional evidence, and Table 7 presents representative prior probabilities and CPT entries. Gate C, which represents a shared outer-harbor flow, had a passage probability of 96.32% without additional evidence, indicating that it was widely used within the selected trajectory population.
Figure 7.
Gate-passage Bayesian network comprising 20 binary variables.
Table 7.
Selected prior and conditional probabilities of the gate-passage BN.
In the supplementary temporal assessment, the mean node-level Brier score was 0.0697 for the BN, compared with 0.1146 for a reference model using marginal gate-passage probabilities estimated from the same training data. This result indicates that the modeled local conditional relationships provided additional information relative to the marginal baseline.
In the CPTs for the shared fairway, the probability of D=True given C=True was 63.78%; that of E=True given D=True was 91.59%; that of F=True given E=True was 97.89%; and that of H=True given F=True was 87.08%. Although consecutive gates along the fairway showed strong passage associations, not all trajectories used the same combination of crossing sections. Passage combinations varied with branching locations and actual approach paths, and these differences were reflected in gate-specific conditional probabilities.
Given K=True at the inner-harbor branch, the probability of L=True on the approach to Lighter Wharf 5 was 70.03%. Given H=True, the probability of M=True on the passenger-terminal approach was 20.55%. The probability of passage through Gate G on the approach to M8 Anchorage was 86.79% given C=False but only 1.60% given C=True. This indicates that anchorage approaches tended to occur in gate combinations different from those of the main fairway flow entering Busan Port. Unlike destination-berth information alone in PORT-MIS, observed passage through the shared fairway can therefore help distinguish approach flows.
Table 7 contains selected CPT entries for the corresponding parent states, whereas the posterior probabilities in the following section were calculated by entering evidence into the complete network. The full CPTs are provided in Table A3. The sum of the joint probabilities and the posterior probabilities obtained after entering evidence were checked to assess the numerical consistency of the final BN, and agreement among the calculation results was confirmed.
4.5. Probability Updating Based on Passage Evidence
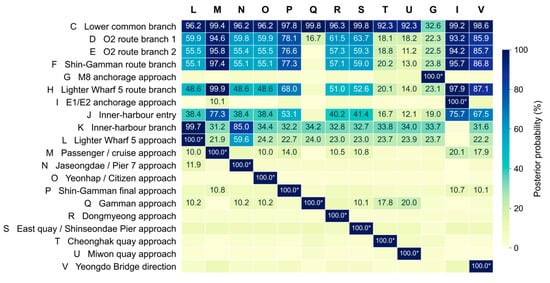
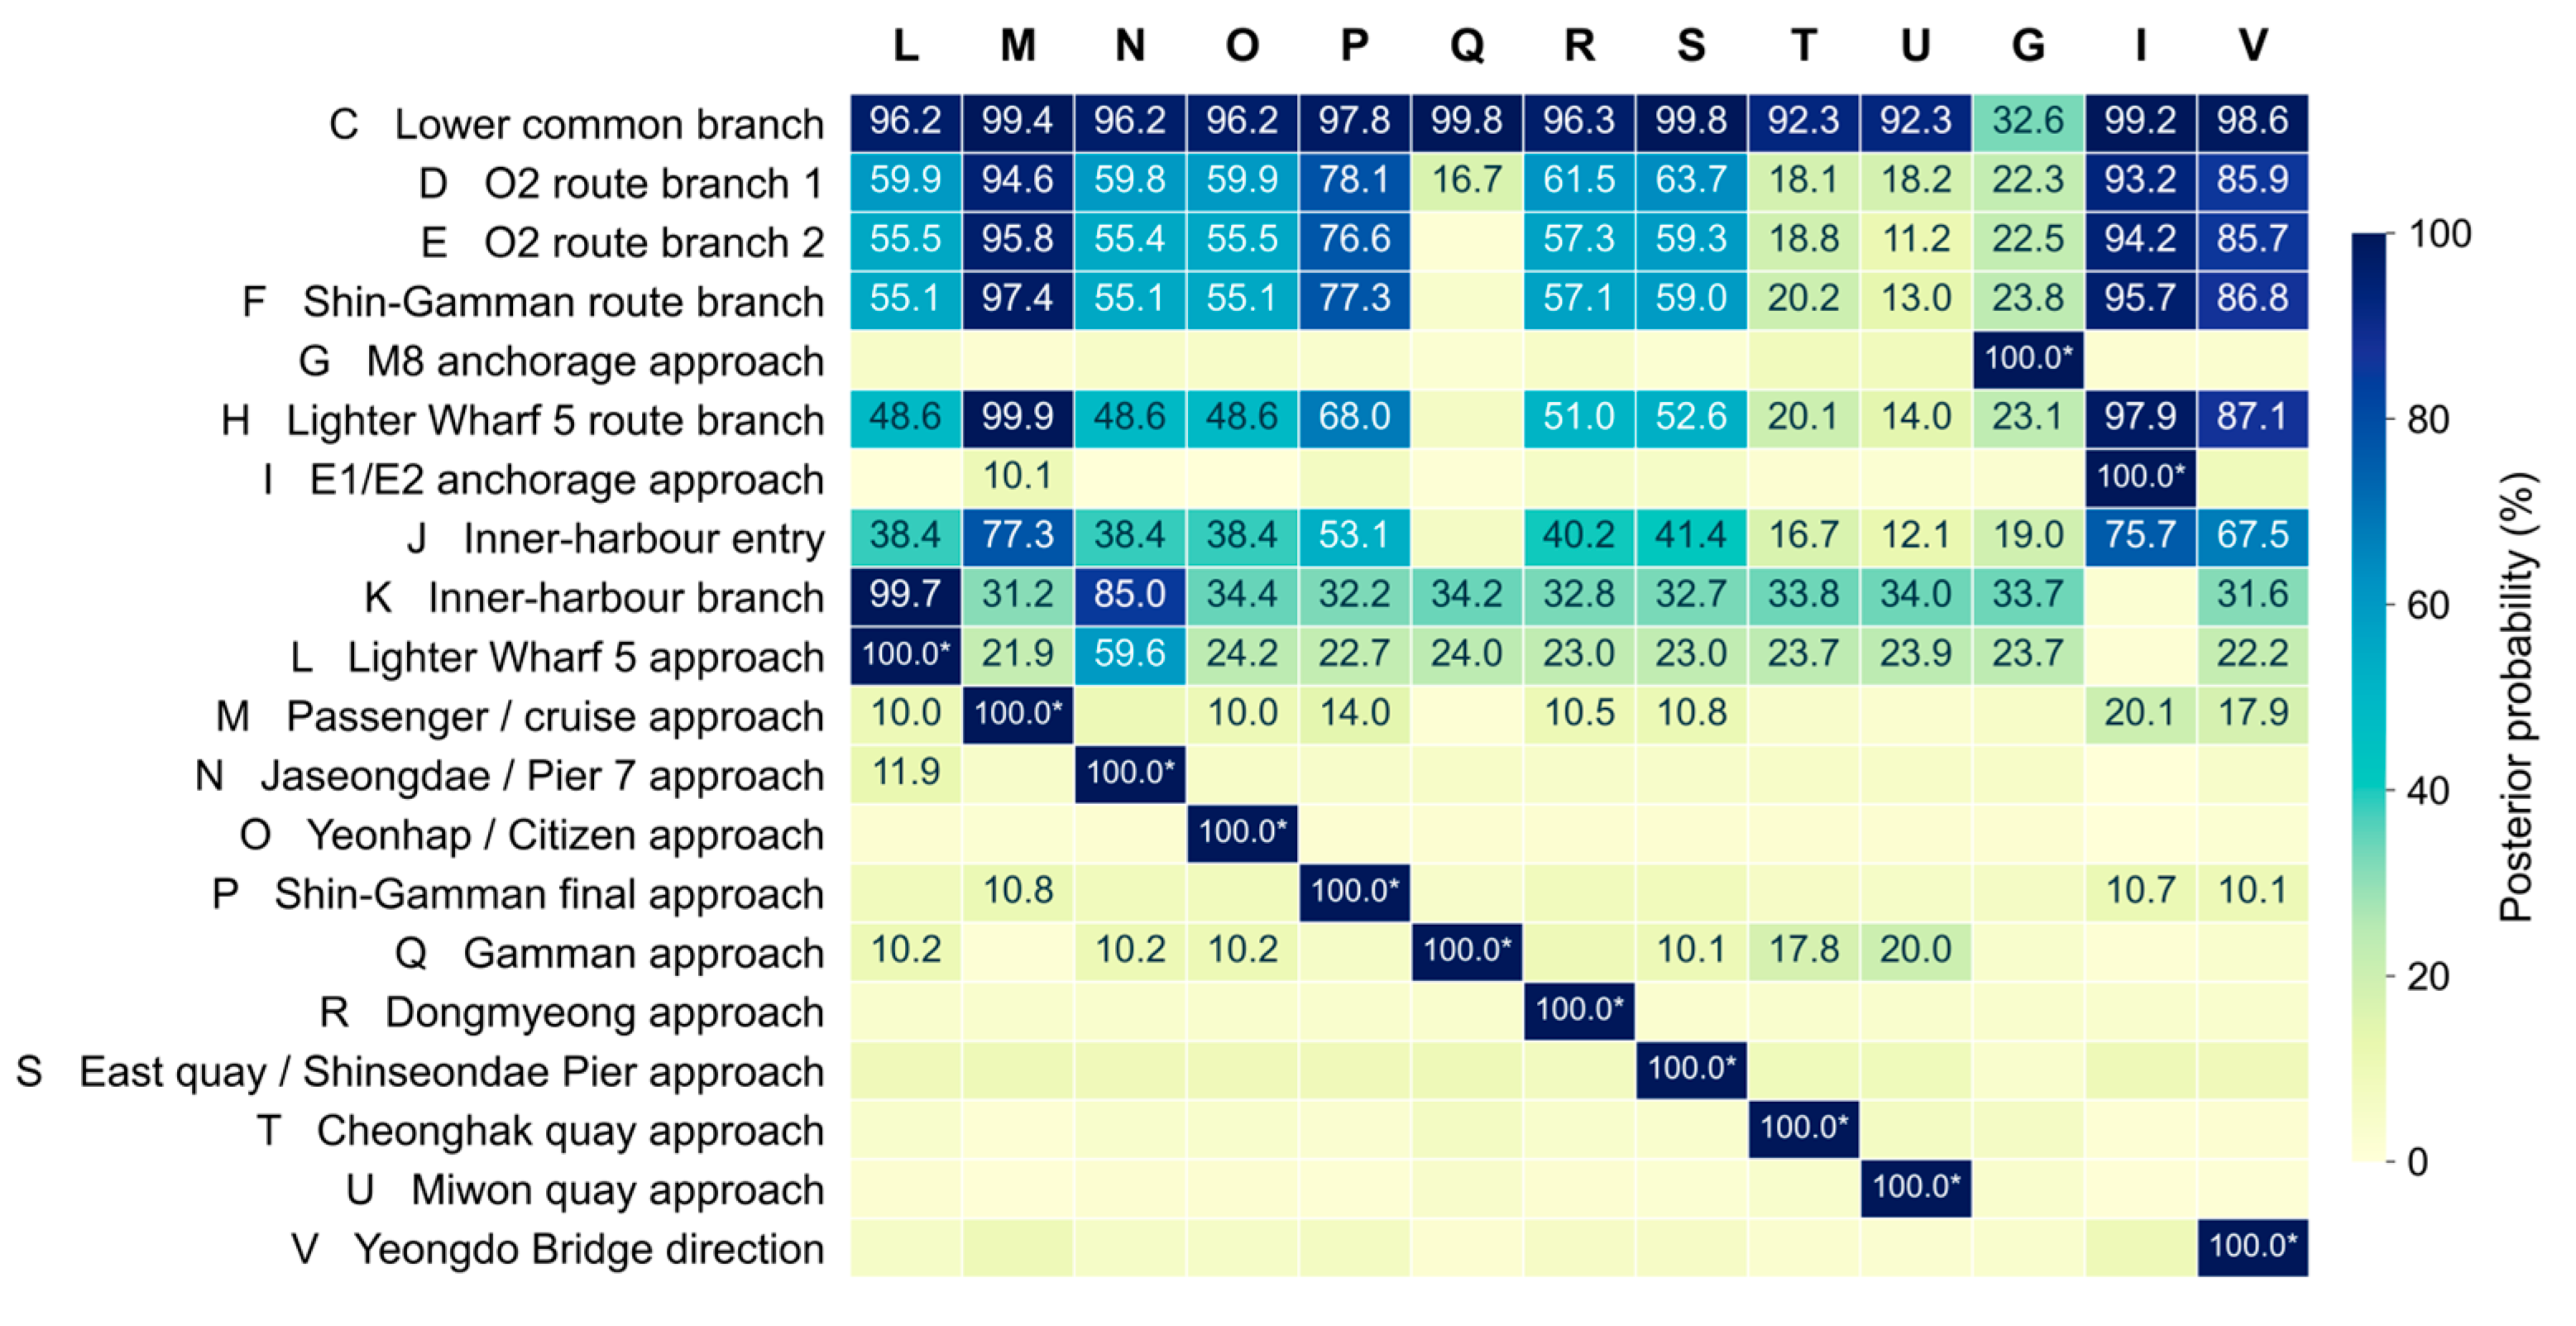
Figure 8 presents the passage probabilities for the other gates when a destination-approach gate is set to True. Columns represent evidence gates, and rows represent queried gates. Given passenger-terminal approach M, the passage probabilities of C, D, E, F, and H were approximately 99.4%, 94.6%, 95.8%, 97.4%, and 99.9%, respectively. Trajectories approaching M were thus strongly associated with these shared fairway gates. This provides information on the related waters when a destination approach is known.
Figure 8.
Posterior gate-passage probabilities given destination-approach gate evidence. Each column represents a separate scenario in which the indicated evidence gate is set to True and all other gates remain unobserved. Probabilities ≥ 10% are labeled as percentages to one decimal place; unlabeled cells have probabilities below 10%. Asterisks indicate probabilities fixed at 100.0% by the evidence. Gate-passage events are non-exclusive, and their probabilities need not sum to 100%.
Given passage through Gate P on the Shin-Gamman Pier approach, the passage probabilities of D, E, F, and H were approximately 78.1%, 76.6%, 77.3%, and 68.0%, respectively. In contrast, given passage through Gate Q on the Gamman Pier approach, the passage probability of C was approximately 99.8%, whereas those of D, E, and F were lower, at 16.7%, 1.4%, and 3.6%. These results indicate that even geographically adjacent berths can be associated with different gates and traffic routes during approach.
The leading approach candidates, given an observed passage gate, are shown in Table 8. Given C=True, the highest probabilities were L at 23.00%, M at 10.83%, and Q at 10.11%. Given F=True, they were L at 22.22%, M at 17.90%, and P at 11.02%. The probability of M given H=True was 20.55%, and that of L given K=True was 70.03%. Several approach candidates were associated with the common entry gate C, whereas passage through the inner-harbor branch K was more strongly associated with the approach to Lighter Wharf 5. The relative importance of approach candidates queried by a controller can therefore differ depending on the observed passage location.
Table 8.
Highest posterior gate-passage probabilities for non-exclusive approach gates given observed passage evidence.
The two directions of inference support different assessments. The probability of H given approach M, approximately 99.9%, indicates that H was almost universally associated with trajectories approaching M. Conversely, the probability of M given H, 20.55%, indicates that trajectories passing H also included many approach flows other than M.
4.6. Travel-Time Estimation by Route
Travel times observed in actual trajectories were analyzed for the three routes selected in Section 3.6: D–E–F, F–P, and H–J–K–L. The annual datasets meeting the temporal quality criteria contained 3919, 447, and 1518 trajectories, respectively, involving 403, 90, and 71 unique vessels. Table 9 presents the sample sizes and travel-time characteristics in terms of the mean, standard deviation, median, and percentiles.
Table 9.
Annual valid samples and observed travel-time statistics for the selected routes.
For D–E–F, the mean travel time was 6.22 min, the median was 5.88 min, and P10–P90 was 4.57–8.95 min. The corresponding values were 6.52 min, 6.10 min, and 3.94–9.29 min for F–P, and 13.38 min, 12.45 min, and 9.38–18.83 min for H–J–K–L. P10 and P90 denote the 10th and 90th percentiles, respectively: the values at or below which approximately 10% and 90% of the observations fall. The P10–P90 interval therefore represents the central 80% of the observed travel-time distribution. The mean exceeded the median on all three routes, suggesting that relatively long travel-time observations influenced the mean. The mean and median describe typical travel times, whereas P10–P90 describes the spread of observed travel times and is distinct from a confidence interval.
The annual valid trajectory samples were divided into training and temporal holdout subsets. The D–E–F route contained 2956 training and 963 holdout trajectories; the F–P route contained 326 and 121; and the H–J–K–L route contained 1144 and 374, respectively. Accordingly, the sample sizes used to estimate the speed-conditioned probability distributions differ from the annual totals reported in Table 9.
In the temporal holdout evaluation, the speed-conditioned model reduced the multiclass Brier score from 0.7023 to 0.3588 for D–E–F compared with the unconditional travel-time distribution. The corresponding changes were smaller for F–P (0.7810 to 0.7796) and H–J–K–L (0.7568 to 0.7523). These results indicate that departure speed provides substantially more predictive information for the selected main-fairway transit than for the final berth-approach and inner-harbor routes.
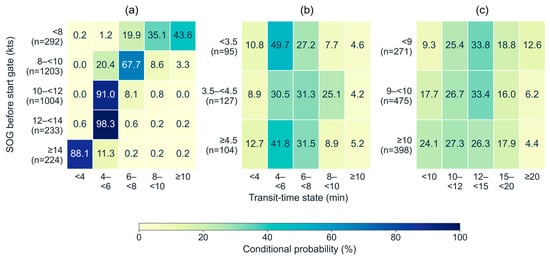
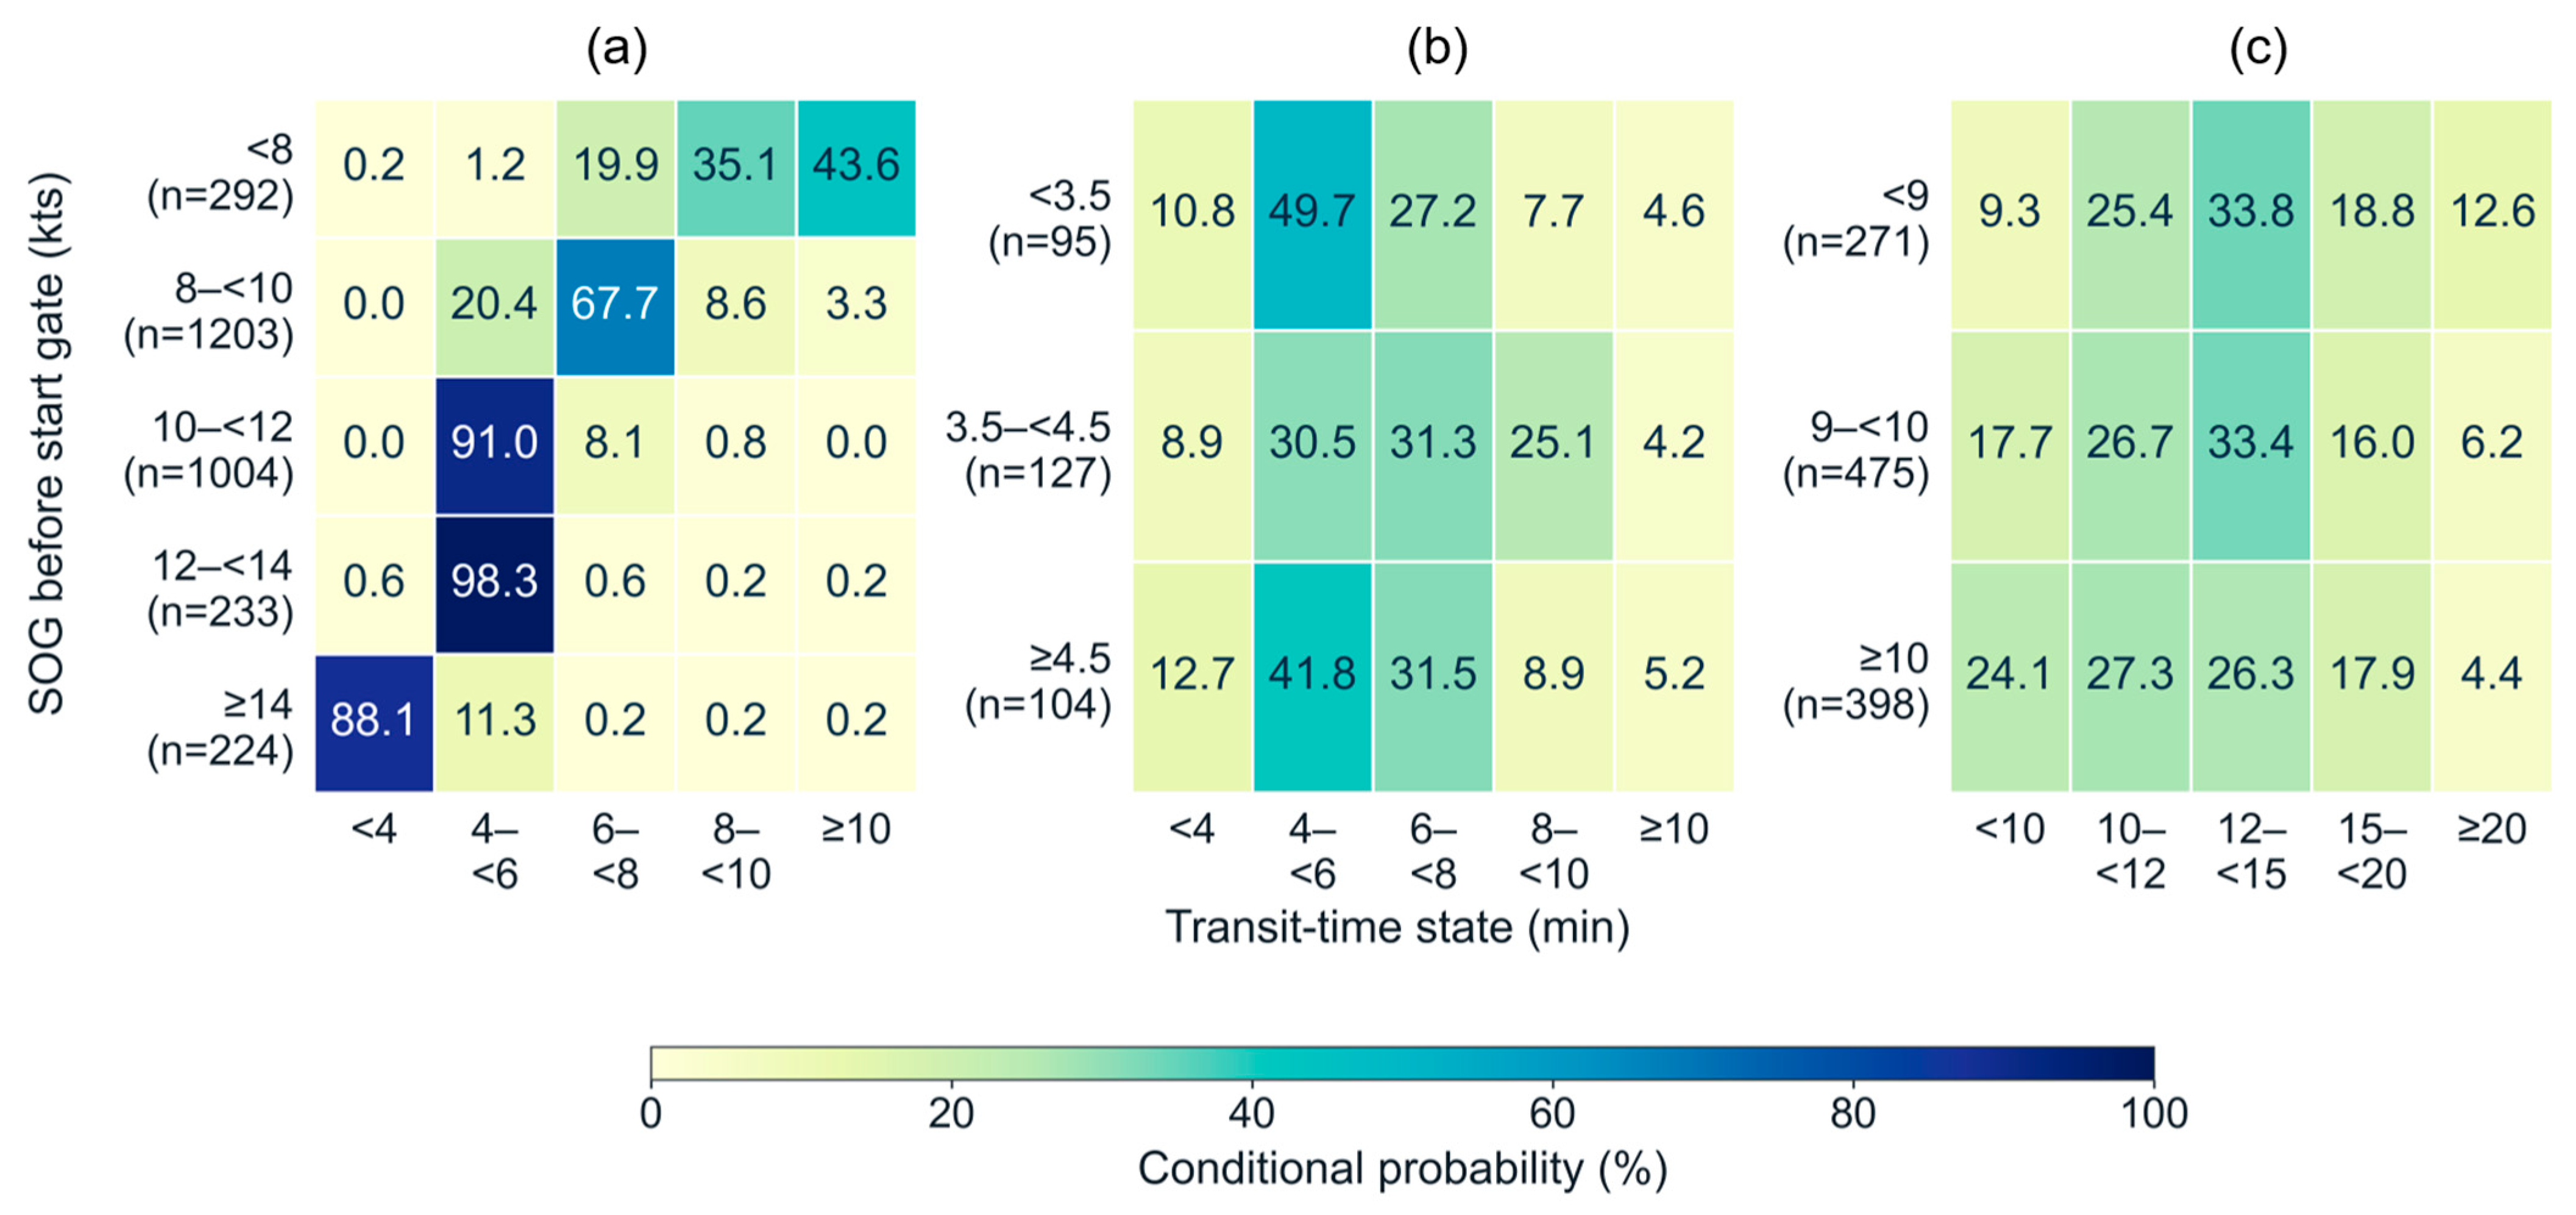
Figure 9 shows the probabilities of travel-time states conditional on departure speed. For D–E–F, at departure speeds of at least 8 kts and below 10 kts, the probability of a travel time of at least 6 min but less than 8 min was 67.73%. At speeds of at least 10 kts and below 12 kts, 90.96% of the probability was concentrated in the interval from 4 min to less than 6 min. At speeds of at least 14 kts, the probability of arrival in less than 4 min was 88.08%. On this shared-fairway route, the center of the travel-time distribution varied clearly with departure speed, revealing differences among operating conditions that were not apparent from the annual mean of 6.22 min alone.
Figure 9.
Travel-time interval probabilities conditional on departure speed for the selected routes, estimated using the nine-month training dataset: (a) D–E–F, main fairway (n = 2956); (b) F–P, Shin-Gamman Pier approach (n = 326); and (c) H–J–K–L, inner harbor (n = 1144). Panels are arranged from left to right.
For F–P, the probability of a travel time of at least 4 min but less than 6 min was 49.74% at departure speeds below 3.5 kts but 41.78% at speeds of at least 4.5 kts. The cumulative probabilities of arrival in less than 6 min were 60.51% and 54.46%, respectively. Thus, a higher departure speed did not correspond to earlier arrival at every time threshold. This pattern suggests that final-approach travel time may also depend on subsequent deceleration and turning, actual travel distance, and surrounding traffic. For H–J–K–L, the probability of arrival in less than 10 min was 9.32% at departure speeds below 9 kts and 24.09% at speeds of at least 10 kts. Higher departure speeds were associated with a greater probability of short travel times, but the distributions extended across several time states.
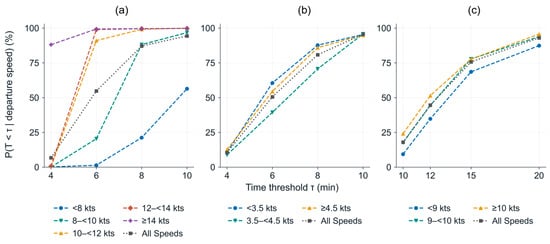
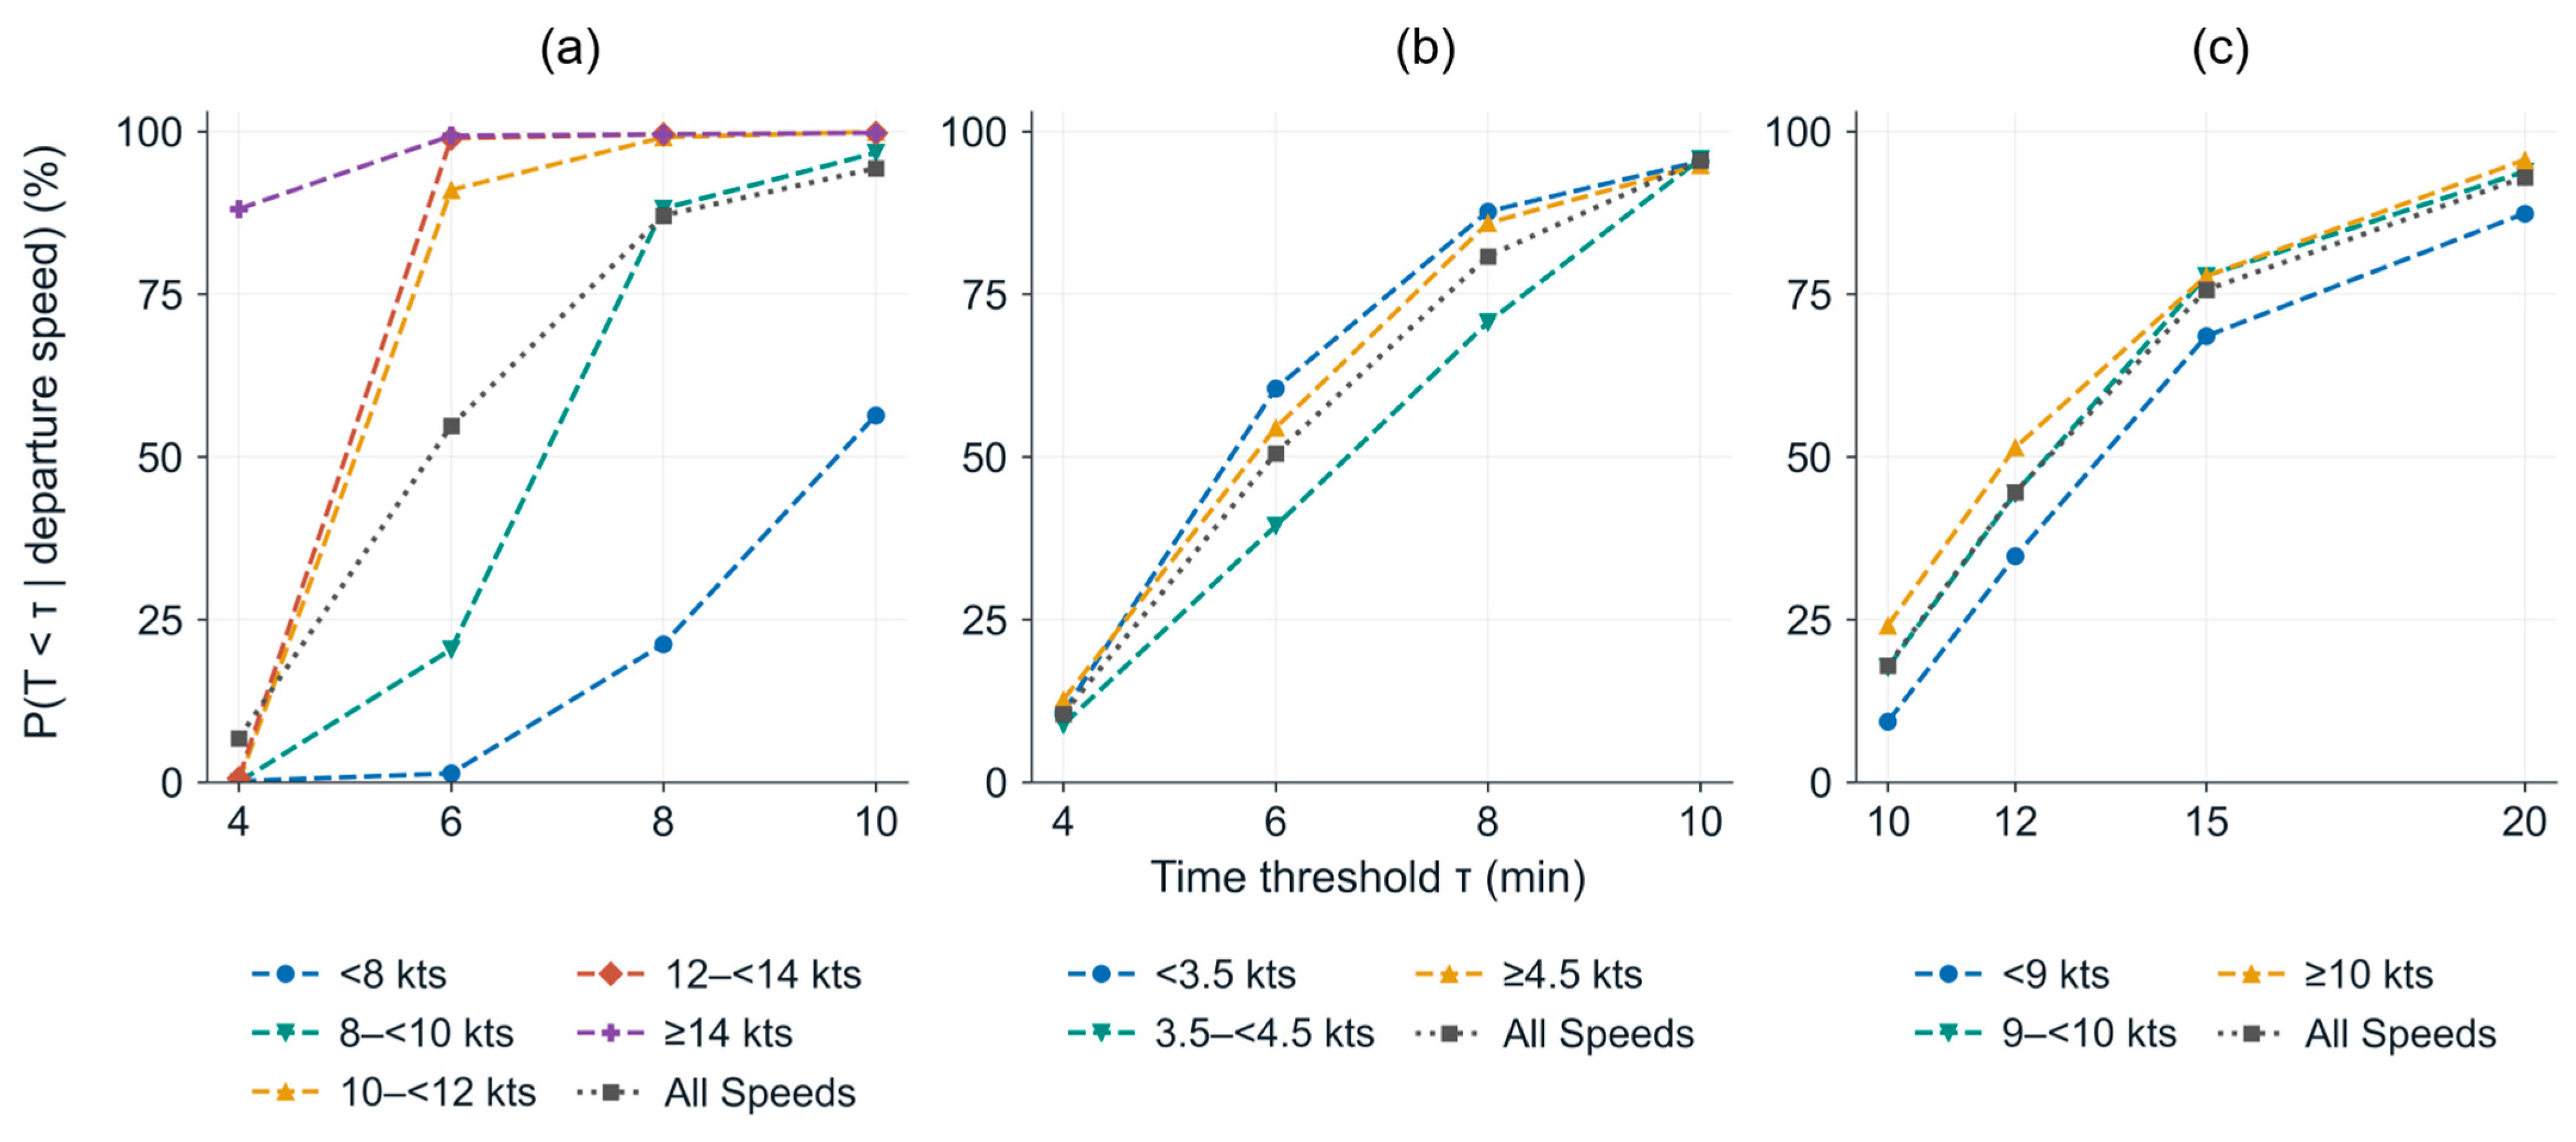
Figure 10 presents cumulative arrival probabilities evaluated at the upper boundaries of the travel-time intervals. For D–E–F, a departure speed of at least 8 kts and below 10 kts corresponded to an 88.14% probability of reaching F in less than 8 min. At a departure speed of at least 10 kts and below 12 kts, the probability of reaching F in less than 6 min was 91.01%. These results allow the probability of reaching the final gate before a specified time to be examined for a given departure-speed interval. “All speeds” represents the arrival probabilities calculated without separating trajectories by departure speed and provides a reference for comparison with the speed-specific results.
Figure 10.
Cumulative probabilities of reaching the final gate before specified time thresholds on the selected routes, estimated using the nine-month training dataset: (a) D–E–F, main fairway; (b) F–P, Shin-Gamman Pier approach; and (c) H–J–K–L, inner harbor.
The travel-time analysis concerns movement from the starting gate to the final gate along a specified route. These travel times therefore do not represent the time required to complete berthing or anchoring. Arrival probabilities in Figure 10 were calculated at the defined time thresholds, and the lines connecting the probability values are intended to illustrate their variation visually.
5. Discussion
5.1. Significance of Gate-Passage Probabilities for VTS Decision Support
From a VTS perspective, gate-passage probabilities are most useful when interpreted according to the traffic function of the observed location. Passage through a shared-fairway gate may be associated with several berth or anchorage approaches, whereas evidence at a downstream branching gate can provide more specific information about associated approach flows. This distinction can help VTS operators identify which approach areas remain relevant for monitoring as additional passage evidence becomes available, without assuming that a particular destination has been confirmed.
The two directions of BN inference also serve different operational purposes. When a vessel’s intended approach is known, the corresponding approach-gate evidence can be used to examine historically associated shared-fairway passages. Conversely, when a vessel is observed crossing a gate but its intended approach remains uncertain, the model can provide probabilities associated with several approach gates. These probabilistic references can be compared with subsequent AIS movements and vessel-reported intentions to support further verification, rather than being treated as automatic navigational instructions or definitive evidence of unsafe behavior.
As an illustrative VTS scenario, consider an inbound vessel observed passing Gate D before its intended berth has been confirmed. The BN associates this passage with approach Gates L, M, and P at probabilities of 22.42%, 16.15%, and 10.34%, respectively. Rather than identifying a single destination, these non-exclusive probabilities provide reference information about approach areas that may warrant continued monitoring. If the vessel’s subsequent movement is consistent with the D–E–F route and its departure SOG at Gate D is between 10 and less than 12 kts, the historical travel-time model indicates a 91.01% probability of reaching Gate F in less than 6 min among trajectories following that route. A VTS operator could use these spatial and temporal references to support traffic monitoring and verify the vessel’s reported intentions, while considering its actual movement and surrounding traffic conditions. These probabilities and travel-time estimates should therefore be interpreted as supplementary decision-support information rather than definitive predictions of a vessel’s future route, destination, or arrival time.
5.2. Methodological Significance of Gate-Based Analysis Using AIS and PORT-MIS Data
Previous AIS-based studies have used recurrent turning locations and maneuvering points to identify movement patterns and construct route networks [4,6,7,8]. In contrast, the present study converted selected traffic locations into finite gate lines, allowing vessel movements to be represented as comparable passage events rather than positional concentrations alone. From a VTS perspective, this representation makes the resulting probabilities directly interpretable at identifiable locations within the waterway. However, their interpretation remains dependent on the selected gate configuration and the spatial judgment involved in defining the measurement sections.
Combining PORT-MIS facility information with AIS-derived passage events also helps distinguish administratively recorded destinations from the waterways actually traversed by vessels, which is relevant given the reported limitations of AIS destination information [18,19]. Unlike studies focusing on destination-conditioned or continuous trajectory prediction [9,10,11], the present approach addresses a narrower inferential task: estimating conditional associations among gate passages over complete trajectories. It therefore complements rather than replaces future-trajectory prediction methods. Furthermore, the differences between port-entry and berthing operations examined in previous research [12] support interpreting the temporal characteristics of vessel movements according to their operational phases.
5.3. Joint Interpretation of Gate-Passage Probabilities and Route Travel Times
Gate-passage probabilities and route travel-time distributions provide complementary but distinct types of operational information. The BN describes approach-gate passages associated with observed evidence, whereas the travel-time model describes the distribution of transit times between specified gates among trajectories following a selected route. These two types of information can be considered together when the relevant route conditions are identified, but they should not be combined or interpreted as definitive predictions of a vessel’s destination or arrival time.
The observed relationships between departure speed and travel time varied with the operational phase. Along the main fairway, departure speed provided more information about the time required to reach the final gate, whereas final berth approaches were less directly explained by departure speed alone. For VTS operations, these differences suggest that historical travel-time distributions can provide temporal references for monitoring vessels along identified routes, while continued observation remains necessary during deceleration, turning, and other maneuvering activities. Furthermore, the estimated times represent gate-to-gate movements rather than completed berthing or anchoring operations. Neither the gate-passage probabilities nor the travel-time estimates directly quantify collision risk without additional information on relative vessel movements and traffic interactions.
5.4. Study Limitations and Future Research
The results are based on the defined study area and selected trajectories. The principal analysis population comprised inbound North Port trajectories linked to PORT-MIS, while movements toward Yeongdo Bridge without identified PORT-MIS destinations were classified as a separate destination group using AIS. The resulting probabilities should therefore be interpreted as passage associations under the specified trajectory-selection criteria and gate configuration, rather than unconditional traffic probabilities for all vessels in Busan North Port.
Gate location and geometry also involved some degree of discretionary adjustment. Although DBSCAN identified recurrent turning locations, its clusters were not used directly as gates. Actual trajectories and traffic functions were considered when consolidating adjacent clusters and determining gate positions and orientations. Changes in DBSCAN parameters or gate locations could therefore alter the passage classification of some trajectories. Future work should examine the sensitivity of the results to clustering parameters and gate configurations to assess the stability of the spatial measurement criteria.
The current BN represents whether each gate was passed within an entire trajectory using True and False states. It does not directly predict the exact passage order or the next gate encountered. Vessel type, vessel size, and motion states are also not included as direct explanatory variables in the BN. Future studies should incorporate the order of gates passed so far, vessel characteristics, speed, and course to analyze approach flows as they evolve over time.
The travel-time analysis is likewise limited to the three selected routes and departure speed. Repeated voyages by the same vessel were included, so the results are best interpreted as empirical conditional distributions of traffic observed during the study period. Future work should expand the route coverage and incorporate operational variables such as vessel type and size, turning, and deceleration. Although the supplementary temporal assessment examined the stability of local BN conditional relationships using data from a later period, further validation of network-wide evidence-based inference using separately designed temporal or vessel-independent datasets is required. Usability assessments involving VTS controllers are also necessary to determine whether the proposed information improves practical traffic interpretation and decision-making.
6. Conclusions
This study proposed a VTS decision-support analysis method that defines key vessel traffic locations in Busan North Port as gates and uses gate-passage information to present approach-flow probabilities and travel times for selected routes. AIS and PORT-MIS data from September 2024 to August 2025 were linked, and 22 gate lines were established by examining DBSCAN clusters of AIS turning events together with actual traffic functions. Gate-passage indicators were then converted into binary variables to construct a BN with 20 variables.
The BN results showed that the probabilities of related approach flows varied with the observed evidence. Given passage through inner-harbor branching gate K, the probability of passage through Gate L on the approach to Lighter Wharf 5 was 70.03%. Given passenger-terminal approach M, the passage probability of H was approximately 99.9%; conversely, the probability of M given H was 20.55%. These results demonstrate the distinction between identifying shared passage locations for trajectories approaching a particular destination and identifying associated approach flows from a currently observed passage location.
The annual mean travel times for D–E–F, F–P, and H–J–K–L were 6.22, 6.52, and 13.38 min, respectively. On D–E–F, the probabilities of relatively short travel-time intervals tended to increase with departure speed. At departure speeds of at least 10 kts and below 12 kts, the probability of reaching F in less than 6 min was 91.01%. In contrast, departure speed and arrival time did not exhibit a simple relationship with F–P, indicating that temporal characteristics may differ between fairway transit and final berth approach.
Nevertheless, the BN summarizes gate passage over entire trajectories and does not fully represent passage order or detailed vessel operating states. The travel-time analysis is also limited to three illustrative routes and departure speed. Future studies should incorporate sequential gate-passage information and variables such as vessel type, size, speed, and course, and expand the routes and study areas considered. Validation using independent periods or vessel datasets, together with experiments involving VTS controllers, is needed to assess the effects of the proposed information on practical situation assessment and decision support.
Author Contributions
Conceptualization, S.P.; methodology, H.P. and S.P.; software, H.P.; validation, D.K.; investigation, H.P.; resources, S.P., Y.P. and D.K.; data curation, H.P.; writing—original draft preparation, H.P.; writing—review and editing, S.P. and D.K.; visualization, H.P.; supervision, Y.P. and D.K.; project administration, Y.P., S.O. and D.K.; funding acquisition, S.O. All authors have read and agreed to the published version of the manuscript.
Funding
This work was supported by the Korea Institute of Marine Science & Technology Promotion (KIMST) funded by the Korea Coast Guard (RS-2025-14322995).
Data Availability Statement
The authors are not authorized to redistribute the third-party datasets used in this study. Access to these datasets is subject to the permissions and conditions established by the respective data providers.
Acknowledgments
During the preparation of this manuscript, the authors used ChatGPT(GPT-6.1 Sol) and Codex(GPT-6.1 Sol), both provided by OpenAI, for English translation and language editing. The authors reviewed and edited all AI-assisted outputs and take full responsibility for the content of this publication.
Conflicts of Interest
The authors declare that they have no known competing financial interests or personal relationships that could have appeared to influence the work reported in this paper.
Appendix A. Detailed Gate-Level Statistics and Probability Tables
Table A1.
Annual Number of Gate Passages by Vessel Type.
Table A2.
Annual Number of Gate Passages by Vessel Length.
Table A3.
Complete Prior Probabilities and Conditional Probability Tables (CPTs) of the Final Gate-Passage Bayesian Network.
Table A4.
Coordinates and geometry of the 22 gates.
References
- International Maritime Organization. Guidelines for Vessel Traffic Services; Resolution A.1158(32), adopted 15 December 2021; International Maritime Organization: London, UK, 2021. [Google Scholar]
- Endsley, M.R. Toward a theory of situation awareness in dynamic systems. Hum. Factors 1995, 37, 32–64. [Google Scholar] [CrossRef] [Scilit]
- Aylward, K.; Weber, R.; Man, Y.; Lundh, M.; MacKinnon, S.N. “Are you planning to follow your route?” The effect of route exchange on decision making, trust, and safety. J. Mar. Sci. Eng. 2020, 8, 280. [Google Scholar] [CrossRef] [Scilit]
- Pallotta, G.; Vespe, M.; Bryan, K. Vessel pattern knowledge discovery from AIS data: A framework for anomaly detection and route prediction. Entropy 2013, 15, 2218–2245. [Google Scholar] [CrossRef] [Scilit]
- Kim, Y.H.; Howlett, E.; Hwang, J.H.; Park, Y.G. Use of ship traffic density from Automatic Identification System (AIS) and Vessel Monitoring Systems (VMS) in marine spatial planning: A case study in New England coast, USA. KMI Int. J. Marit. Aff. Fish. 2014, 6, 39–52. [Google Scholar] [CrossRef] [Scilit]
- Rong, H.; Teixeira, A.P.; Guedes Soares, C. Data mining approach to shipping route characterization and anomaly detection based on AIS data. Ocean Eng. 2020, 198, 106936. [Google Scholar] [CrossRef] [Scilit]
- Onyango, S.O.; Owiredu, S.A.; Kim, K.-I.; Yoo, S.-L. A quasi-intelligent maritime route extraction from AIS data. Sensors 2022, 22, 8639. [Google Scholar] [CrossRef] [Scilit]
- Dobrkovic, A.; Iacob, M.-E.; van Hillegersberg, J. Maritime pattern extraction and route reconstruction from incomplete AIS data. Int. J. Data Sci. Anal. 2018, 5, 111–136. [Google Scholar] [CrossRef] [Scilit]
- Rong, H.; Teixeira, A.P.; Guedes Soares, C. Maritime traffic probabilistic prediction based on ship motion pattern extraction. Reliab. Eng. Syst. Saf. 2022, 217, 108061. [Google Scholar] [CrossRef] [Scilit]
- Capobianco, S.; Forti, N.; Millefiori, L.M.; Braca, P.; Willett, P. Recurrent encoder–decoder networks for vessel trajectory prediction with uncertainty estimation. IEEE Trans. Aerosp. Electron. Syst. 2023, 59, 2554–2565. [Google Scholar] [CrossRef] [Scilit]
- Shin, G.-H.; Yang, H. Vessel trajectory prediction at inner harbor based on deep learning using AIS data. J. Mar. Sci. Eng. 2024, 12, 1739. [Google Scholar] [CrossRef] [Scilit]
- Lee, H.-T.; Yang, H.; Cho, I.-S. Data-driven analysis for safe ship operation in ports using quantile regression based on generalized additive models and deep neural network. Sensors 2021, 21, 8254. [Google Scholar] [CrossRef] [Scilit]
- Yamaki, A.; Itoh, H.; Kawamura, Y.; Kawashima, S. Ship destination prediction from AIS trajectories using hidden Markov models. J. Jpn. Inst. Navig. 2025, 153, 103–113. [Google Scholar] [CrossRef] [Scilit]
- Mahipala, D.; Tengesdal, T.; Rokseth, B.; Johansen, T.A. Design and validation of an intention-aware probabilistic framework for trajectory prediction: Integrating COLREGS, grounding hazards, and planned routes. Ocean Eng. 2025, 335, 121564. [Google Scholar] [CrossRef] [Scilit]
- Yang, K.; Lu, Y.; Yang, D. Seeking safety from uncertainty: Probabilistic vessel trajectory prediction with a flow-based generative model. IEEE Trans. Ind. Inform. 2026, 22, 7705–7715. [Google Scholar] [CrossRef] [Scilit]
- Mascaro, S.; Nicholson, A.E.; Korb, K.B. Anomaly detection in vessel tracks using Bayesian networks. Int. J. Approx. Reason. 2014, 55, 84–98. [Google Scholar] [CrossRef] [Scilit]
- Alessandrini, A.; Mazzarella, F.; Vespe, M. Estimated time of arrival using historical vessel tracking data. IEEE Trans. Intell. Transp. Syst. 2019, 20, 7–15. [Google Scholar] [CrossRef] [Scilit]
- Harati-Mokhtari, A.; Wall, A.; Brooks, P.; Wang, J. Automatic Identification System (AIS): Data reliability and human error implications. J. Navig. 2007, 60, 373–389. [Google Scholar] [CrossRef] [Scilit]
- Yang, D.; Wu, L.; Wang, S. Can we trust the AIS destination port information for bulk ships?—Implications for shipping policy and practice. Transp. Res. Part E Logist. Transp. Rev. 2021, 149, 102308. [Google Scholar] [CrossRef] [Scilit]
- Busan Port Authority. Busan Port: Overview. Available online: https://busanpa.com/index.bpa?menuCd=DOM_000000202001000000 (accessed on 24 September 2026).
- Lee, Y.-S.; Jung, M.; Song, C.-U.; Park, J.-S.; Park, Y.-S.; Cho, I.-S. A study on the traffic improvement at an approach area of Busan Harbor. J. Navig. Port. Res. 2007, 31, 345–351. (In Korean) [Google Scholar] [CrossRef] [Scilit]
- Ester, M.; Kriegel, H.-P.; Sander, J.; Xu, X. A density-based algorithm for discovering clusters in large spatial databases with noise. In Proceedings of the Second International Conference on Knowledge Discovery and Data Mining (KDD-96), Portland, OR, USA, 2–4 August 1996; pp. 226–231. [Google Scholar]
- Jensen, F.V.; Nielsen, T.D. Bayesian Networks and Decision Graphs, 2nd ed.; Springer: New York, NY, USA, 2007. [Google Scholar] [CrossRef] [Scilit]
- BayesFusion. GeNIe Modeler User’s Manual: Learning Parameters. Available online: https://support.bayesfusion.com/docs/GeNIe/learning_parameters.html (accessed on 24 September 2026).

Disclaimer/Publisher’s Note: The statements, opinions and data contained in all publications are solely those of the individual author(s) and contributor(s) and not of MDPI and/or the editor(s). MDPI and/or the editor(s) disclaim responsibility for any injury to people or property resulting from any ideas, methods, instructions or products referred to in the content. |
© 2026 by the authors. Licensee MDPI, Basel, Switzerland. This article is an open access article distributed under the terms and conditions of the Creative Commons Attribution (CC BY) license.