


Abstract
Mooring systems are critical to deepwater floating platforms, ensuring their safe operation under harsh marine environmental conditions. Mooring-line failure can disrupt load redistribution, alter platform dynamic response, and compromise operational safety. Conventional monitoring methods based on maximum mooring tension and tension responses often fail to distinguish environmental load variations from structural abnormalities. This study proposed a health-monitoring approach using Volterra kernel energies extracted from mooring tension responses. A second-order truncated Volterra model with a self-excitation modeling strategy was employed to derive first- and second-order Volterra kernel energies, which were used to construct health monitoring indicators. The performance of these indicators was assessed using a semi-submersible floating platform equipped with a carbon fiber-reinforced polymer (CFRP) mooring system. Furthermore, the effects of sensor location, segment duration, and random seed on monitoring performance were investigated. The results indicated that the first-order Volterra kernel energy was highly sensitive to environmental load variations, whereas the second-order kernel energy effectively captured nonlinear dynamic characteristics associated with mooring-line failure. By integrating these complementary features, the proposed approach can effectively distinguish environmental load variations from structural abnormalities under complex marine environmental conditions. These findings provide a methodological basis for the health-state assessment and integrity management of deepwater mooring systems.
1. Introduction
The exploration and production of offshore oil and natural gas resources are progressively expanding into deep and ultra-deep waters, driving the widespread deployment of deepwater semi-submersible platforms [1,2,3]. As critical station-keeping components, mooring systems play an essential role in limiting platform offsets and maintaining structural integrity under harsh marine environmental conditions [4,5,6]. However, ensuring the operational reliability of these systems under extreme dynamic loading remains a significant engineering challenge [7,8].
Conventional mooring systems primarily employ steel chains and synthetic fiber ropes, including polyester and high-modulus polyethylene (HMPE) fibers [9,10]. However, during long-term service in deepwater environments, synthetic fiber mooring lines are susceptible to complex degradation mechanisms, including friction-induced abrasion, axial compressive failure, and creep rupture [11]. Documented field failures, including the premature rupture of HMPE and aramid mooring lines used in offshore platforms, further highlight the persistent reliability challenges associated with conventional materials [12]. In response, carbon fiber-reinforced polymer (CFRP) has emerged as a promising alternative due to its low density, high specific stiffness, and excellent fatigue and corrosion resistance [13]. Although the lightweight nature of CFRP mooring lines can substantially enhance the dynamic performance and payload capacity of deepwater platforms, their high axial stiffness fundamentally modifies the global stiffness characteristics of the coupled platform-mooring system [14,15,16]. This altered stiffness configuration can intensify nonlinear dynamic responses under complex wave and current loading and increase the sensitivity of the coupled system to localized damage. Consequently, advanced structural health monitoring and condition assessment techniques are urgently needed to ensure the long-term operational reliability of CFRP mooring systems.
Existing monitoring approaches for mooring systems primarily rely on measurements of mooring-line tension, fairlead inclination angles, and platform motion responses [17]. Among these, conventional tension-based diagnostic methods typically employ static thresholds or time-domain statistical features established under prescribed environmental conditions [18,19]. However, under realistic states, dynamic mooring tension is jointly influenced by environmental load changes and structural abnormalities. A reduction in wave height may partially compensate for the tension redistribution induced by a line failure, resulting in a potentially hazardous masking effect in which the statistical characteristics of a damaged system closely resemble those of an intact system. Such coupled interference can substantially degrade diagnostic performance, leading to either costly false alarms or missed detections of actual structural abnormalities. This challenge is particularly pronounced in CFRP mooring systems, where high axial stiffness and the resulting nonlinear dynamic behavior may further obscure damage-sensitive signatures. Therefore, robust health-monitoring approaches to distinguish environmental variability from genuine structural degradation are urgently needed.
Most existing damage identification methods remain grounded in linearized analytical frameworks, such as linear discriminant analysis (LDA) [20] and statistical linearization in the frequency domain [21]. However, these linear methods are inherently limited in their ability to characterize the transient and non-stationary nonlinear dynamics associated with mooring-line failure. In recent years, the Volterra series model, a classical nonlinear system identification technique, has demonstrated considerable potential in structural dynamics [22] and mechanical fault diagnosis [23]. Unlike conventional linear models, the Volterra series represents weakly nonlinear systems through kernel-based expansions of input–output relationships without requiring explicit physical governing equations [24,25]. More importantly, it provides a systematic mathematical framework for decomposing system dynamics into linear and nonlinear components: the first-order Volterra kernel characterizes the linear dynamic response, whereas higher-order kernels describe nonlinear interactions and coupling effects within the system [26]. This inherent decomposition capability makes the Volterra model a promising candidate for distinguishing damage-induced nonlinearities from environment-driven linear responses.
To address these challenges, this study introduced the Volterra model into the structural health monitoring of CFRP mooring systems and proposed a condition assessment approach based on Volterra kernel energy. A self-excited Volterra modeling framework was employed. In this framework, the mooring tension signal served simultaneously as the input and output, enabling the decomposition of the measured response into linear and nonlinear dynamic characteristics. By extracting the first- and second-order Volterra kernel energies from tension time-series data, health-monitoring indicators were established. The effectiveness of these indicators was evaluated under various operational scenarios, including pure environmental load variations, isolated mooring-line failure, and their coupled effects. The proposed method provides an adaptable framework for mitigating the masking effects of environmental load variations, offering theoretical insights and practical support for the integrity management of deepwater mooring systems.
The remainder of this paper is organized as follows. Section 2 introduces the fundamental theory of the Volterra model and proposes the health-monitoring approach for deepwater mooring systems based on Volterra kernel energy. Section 3 investigates the time-domain dynamic responses of a deepwater semi-submersible platform equipped with a chain-CFRP- chain mooring configuration. Section 4 evaluates the robustness of the proposed method under complex coupled conditions and examines the effects of sensor placement and segmentation duration on monitoring performance. Finally, Section 5 summarizes the main conclusions of this study.
2. Volterra Series-Based Monitoring Approaches
2.1. Volterra Series Model
The Volterra series provides a powerful mathematical framework for identifying nonlinear dynamic systems with memory effects. It represents the system output as a superposition of responses associated with Volterra kernels of different orders. The first-order kernel describes the linear dynamic behavior of the system, whereas the second- and higher-order kernels characterize nonlinear interactions and coupling effects. Compared with conventional frequency-domain analysis techniques, the Volterra series can capture the frequency-dependent characteristics of system responses and their nonlinear dynamics and memory effects, making it particularly suitable for the analysis of nonlinear structural systems.
The Volterra series establishes a functional relationship between the input and output signals using a series of Volterra kernels. These kernels provide a systematic means of characterizing the inherent dynamic properties of nonlinear systems. By estimating the Volterra kernels from measured input–output data, the dynamic behavior of the system can be effectively identified.
Let x(n) denote a discrete-time input signal. For a causal nonlinear system with finite memory, its response can be represented using a discrete-time Volterra series as follows:
where y(n) denotes the system output, h0 is a constant term, and hj(k1, …, kj) represents the j-th-order Volterra kernel associated with the time lags ki(i = 1, 2, …, j).
Notably, the number of model parameters increases with the order of the Volterra kernel, which limits the practical applicability of higher-order Volterra models. Therefore, truncated models are generally adopted in engineering applications to reduce computational complexity. The p-th-order truncated discrete-time Volterra series can be expressed as:
where M denotes the memory length of the model.
For a more compact representation, the truncated Volterra model can be expressed as a summation of Volterra operators yi(n)(i = 1, 2, …, p), given by:
where y0(n) = h0 is a constant term, and yi(n)(i = 1, 2, …, p) denotes the i-th-order Volterra operator, defined as:
y(n) = y0(n) + y1(n) + y2(n) + … + yi(n) + … + yp(n)
The first-order operator y1(n) represents the linear component of the system response, whereas the higher-order operators yi(n)(i ≥ 2) characterize its nonlinear components. Consequently, the Volterra model provides an effective framework for decomposing the system response into linear and nonlinear contributions.
2.2. Health-Monitoring Method Based on the Volterra Model
Generally, the dynamic response of deepwater mooring systems is governed by the coupled effects of environmental load variations and structural abnormalities. Environmental load variations primarily influence the linear dynamic characteristics of the system response, whereas structural abnormalities tend to induce pronounced nonlinear dynamic responses. Therefore, effectively extracting the linear and nonlinear dynamic features embedded in responses can facilitate the discrimination of environmental variations from structural abnormalities, thereby providing a reliable basis for assessing the health condition of mooring systems.
The Volterra model provides a rigorous theoretical framework for characterizing the dynamic behavior of nonlinear systems. In this study, a self-excited Volterra model is employed as an output-only temporal feature-extraction framework. Only the measured dynamic response is used, and its delayed samples are introduced to construct a nonlinear temporal representation of the dynamic-response time history. It should be emphasized that these delayed response samples do not represent the physical input excitation of the system, and the proposed formulation is therefore different from conventional physical input–output system identification. In addition, the delayed samples used in the regression and the current response correspond to different time instants rather than the same sample being simultaneously treated as both input and output. The core purpose of the formulation is to identify the first- and second-order Volterra kernels and to extract their corresponding features from the measured dynamic response for health monitoring. Specifically, the first-order Volterra kernel characterizes the first-order temporal dependence of the dynamic response, whereas the second-order Volterra kernel characterizes its second-order nonlinear temporal dependence. The sensitivities of these kernel-based features to different operating-condition changes are subsequently evaluated through comparative numerical analyses.
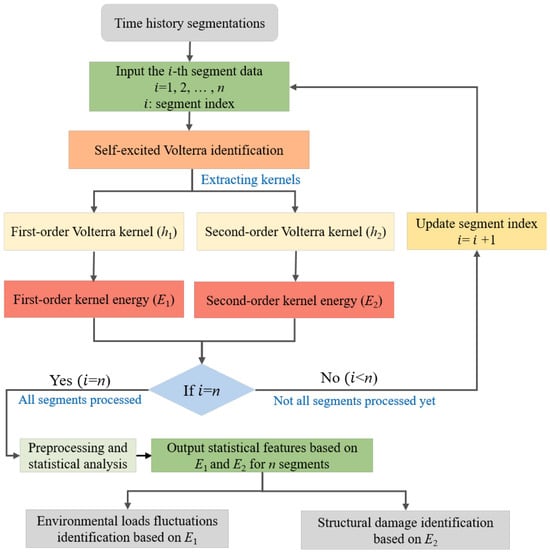
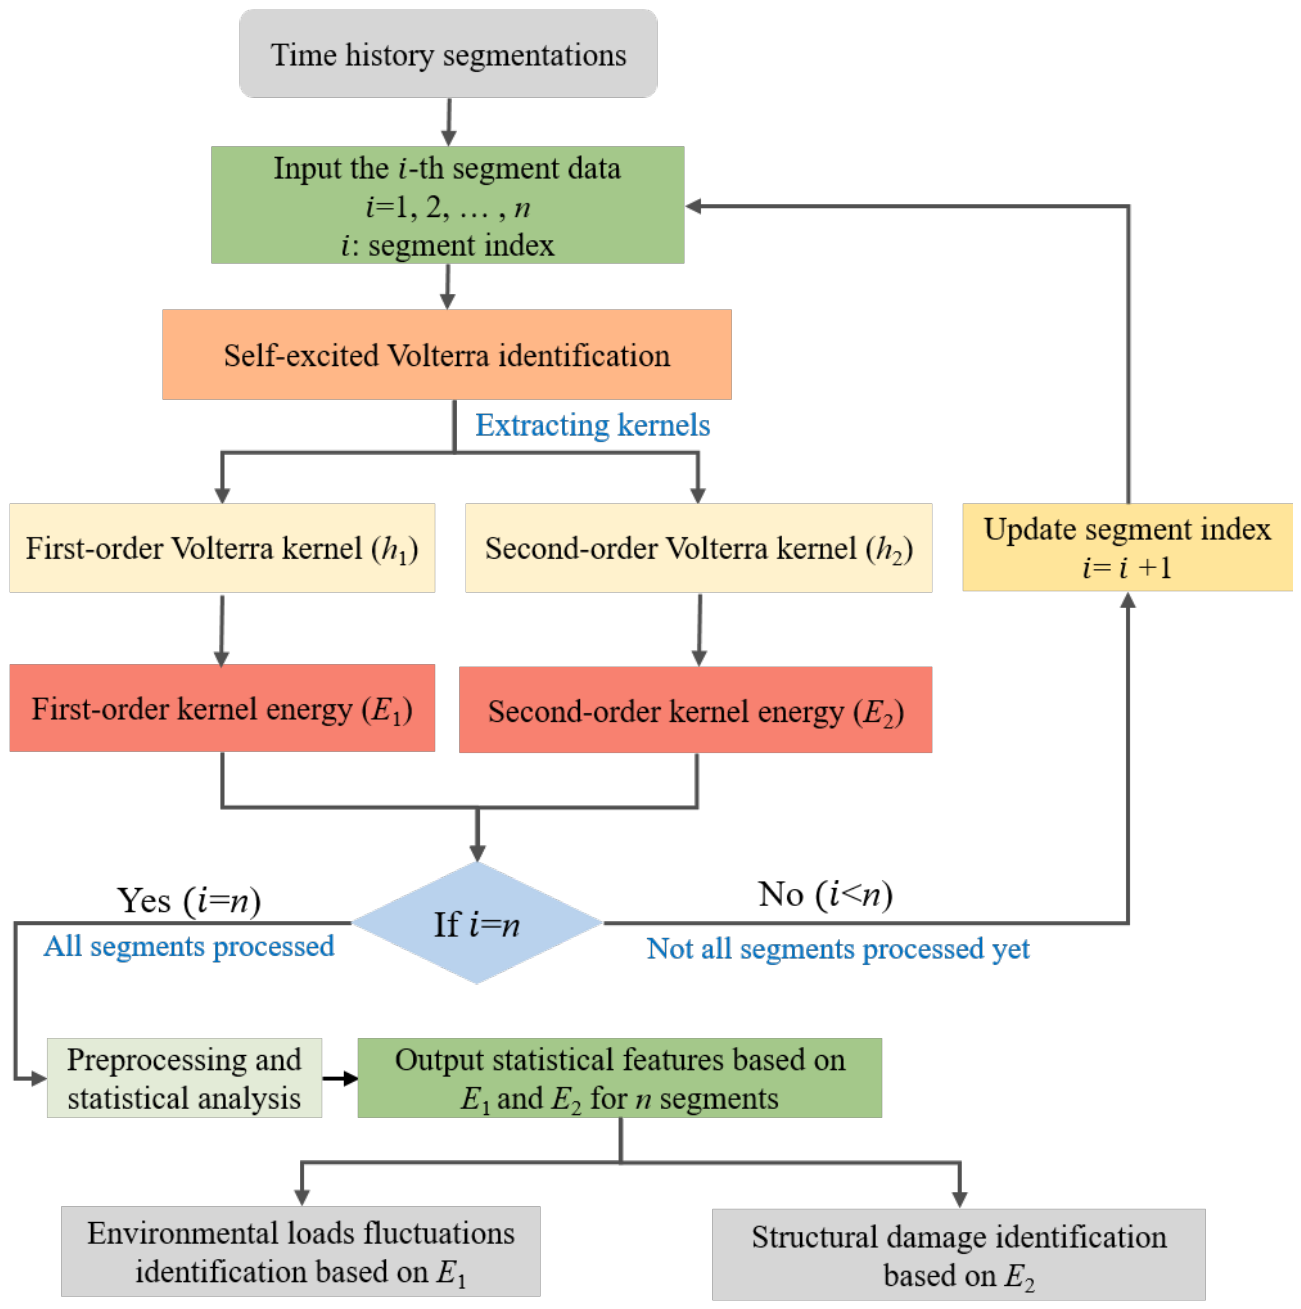
As illustrated in Figure 1, a segmented identification strategy is adopted to improve the characterization of non-stationary dynamic responses. First, the entire dynamic response time history is divided into multiple temporal segments. A Volterra regression model is then established for each segment to characterize the dynamic properties of the system. The total duration of the time-domain hydrodynamic simulation is set to T = 10,800 s. The simulated dynamic responses were recorded at an output time interval of 0.1 s, corresponding to a sampling frequency of 10 Hz. The dynamic response time history of the mooring line is equally divided into n segments, each with a duration of t, given by:
Figure 1.
Flowchart of the proposed operating-condition identification method based on the Volterra model.
A self-excited Volterra modeling approach is then adopted. For each response segment, the measured tension response is used both as the source sequence for constructing the Volterra basis functions and as the response sequence to be represented. By exploiting the temporal dependence and nonlinear interactions contained within the response sequence itself, segment-level temporal features can be extracted. Specifically, for the i-th (i = 1, 2,…, n) response segment, the Volterra model is defined as:
x(n) = y(n)
For the discrete nonlinear system, the second-order Volterra series model is expressed as:
where the first-order Volterra operator represents the linear component of the system response, given by:
y(n) = y0(n) + y1(n) + y2(n)
The second-order Volterra operator characterizes the nonlinear component of the system response, expressed as:
Accordingly, the complete second-order Volterra model can be expressed as:
where the first term denotes the constant component, the second term represents the linear response, and the third term characterizes the second-order nonlinear response.
Based on the input signal, the Volterra regression matrix H is constructed as:
where the first M columns correspond to the first-order delayed input terms, whereas the remaining columns represent the second-order interaction terms. It should be noted that the zero-delay term is included in the regression matrix. The corresponding parameter vector is defined as:
Accordingly, the Volterra system model can be expressed in matrix form as:
where y denotes the dynamic response vector, expressed as:
y = Hθ
N is the total number of discrete samples within the current response segment.
The Volterra kernel parameters are estimated using the least-squares method, yielding:
The Volterra kernel parameters were estimated directly from the original mooring-line tension time-series data using the least-squares method. No normalization was applied to the original data, and no regularization was introduced during parameter estimation. Based on the parameter vector, the first- and second-order Volterra kernels can be obtained. The first-order Volterra kernel is given by:
The second-order Volterra kernel is expressed as:
From the estimated Volterra kernels, the corresponding kernel energy features are extracted. The first-order kernel energy is defined as:
The second-order kernel energy is calculated as:
where E1 characterizes the intensity of the linear dynamic response, whereas E2 reflects the degree of nonlinear coupling and the intensity of the nonlinear dynamic response.
Finally, the kernel energy features (E1 and E2) extracted from all response segments are subjected to batch preprocessing and statistical analysis. Specifically, E1 is used to characterize environmental load fluctuations [27], whereas E2 is employed to detect structural abnormalities in the mooring system [28]. Based on these features, health-monitoring indicators are developed to assess the structural condition of mooring lines and to provide useful information for identifying abnormal system states under harsh marine environmental conditions.
3. Dynamic Response Analysis of the CFRP Mooring System
A coupled hydrodynamic model of the floating platform-mooring system was developed to investigate the dynamic response characteristics of a semi-submersible platform equipped with a CFRP mooring system. The time-domain dynamic responses, with particular emphasis on mooring line tension, were analyzed to establish a theoretical basis for the health-monitoring method in the subsequent section.
3.1. Establishment and Validation of the Semi-Submersible Platform Model
A deepwater semi-submersible platform operating in the South China Sea [29] was selected as the case study. The platform mainly consisted of four pontoons, four square columns, and an upper deck. The overall configuration was symmetric about both the transverse and longitudinal center planes. The platform had an overall breadth of 91.5 m, a design draft of 37 m, and an operating water depth of 1422.1 m. The remaining principal dimensions and properties are summarized in Table 1.
Table 1.
Principal parameters of the semi-submersible platform.
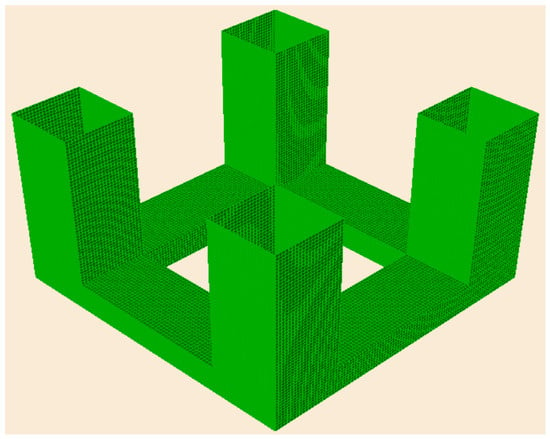
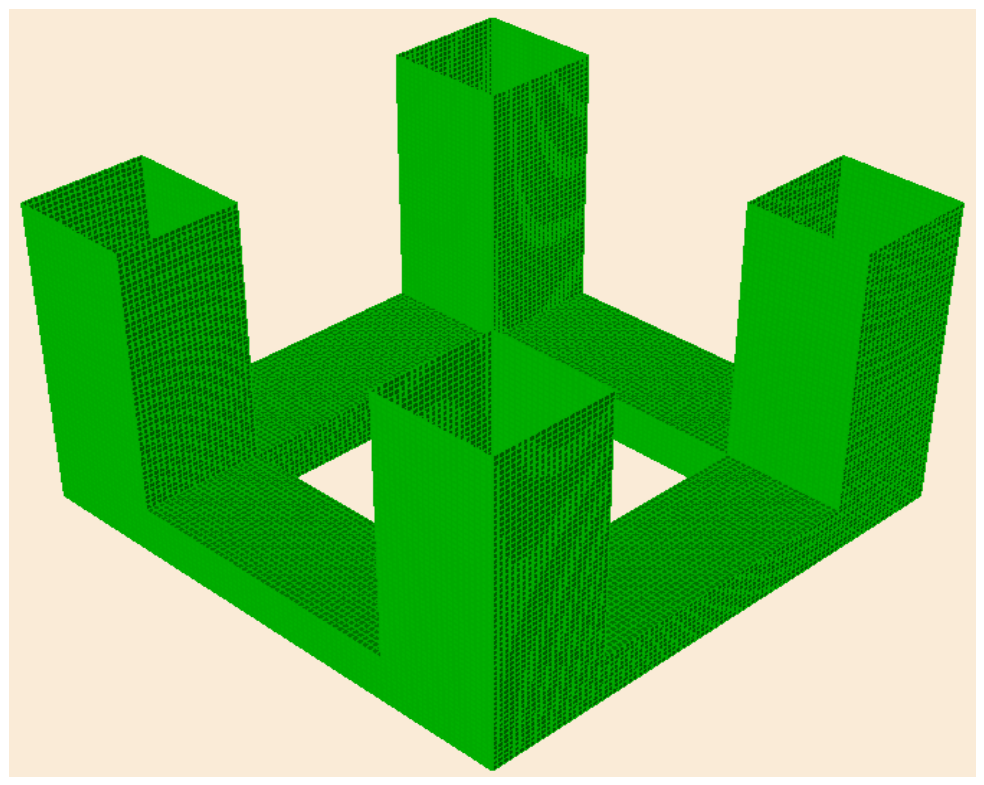
A hydrodynamic model of the semi-submersible platform was established using SESAM-GeniE V7.0 (DNV, Høvik, Norway) (Figure 2). Frequency-domain hydrodynamic analyses were performed using SESAM-HydroD V4.9 (DNV, Høvik, Norway) and the resulting hydrodynamic coefficients were validated against representative results reported in the literature [30].
Figure 2.
Hydrodynamic model of the semi-submersible platform.
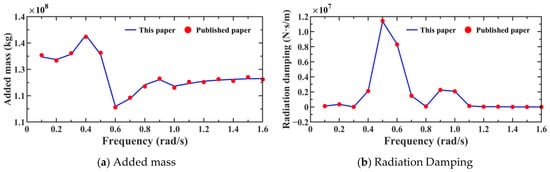
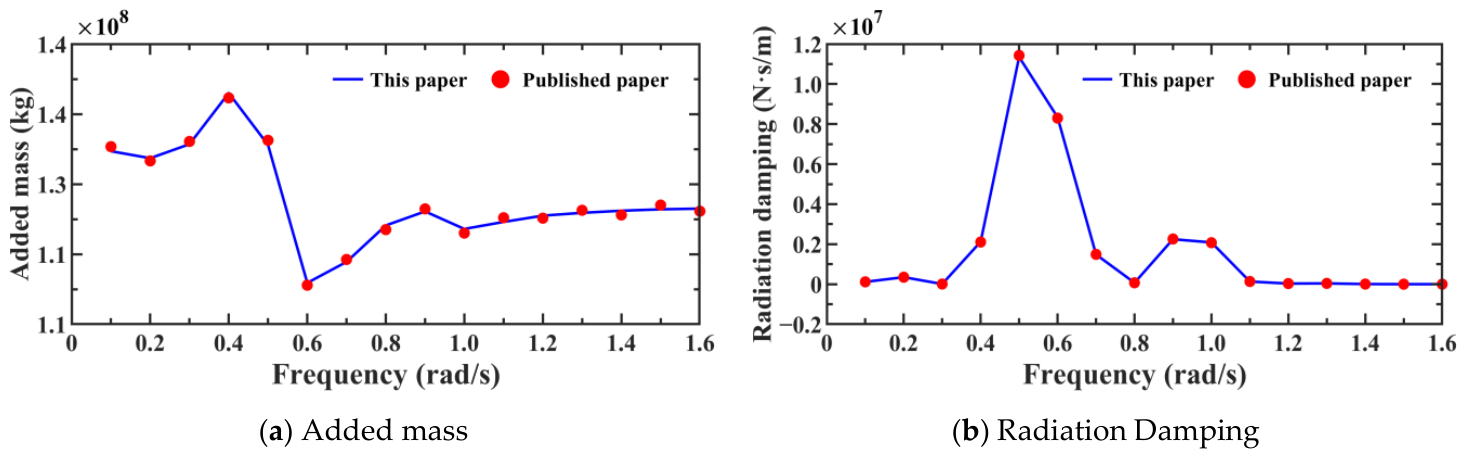
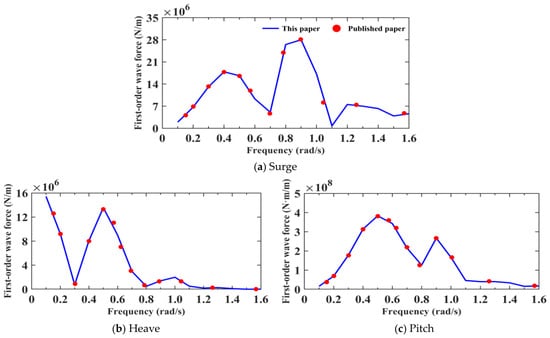
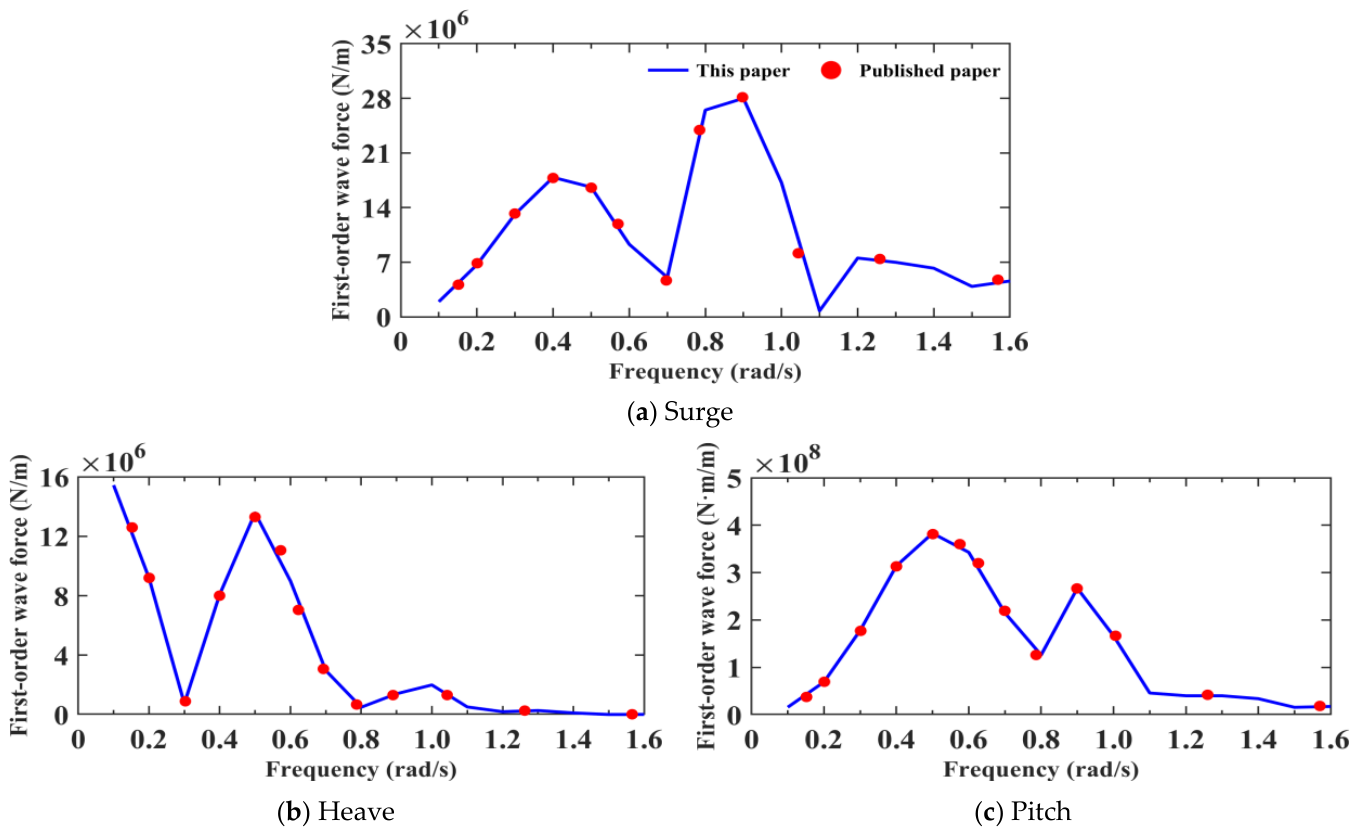
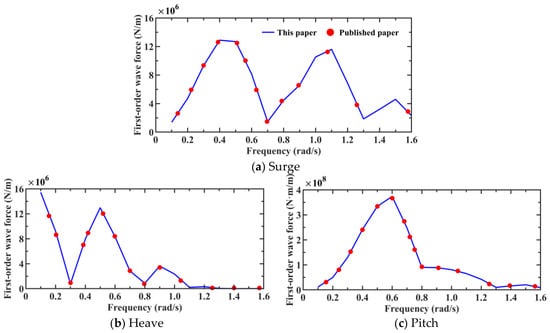
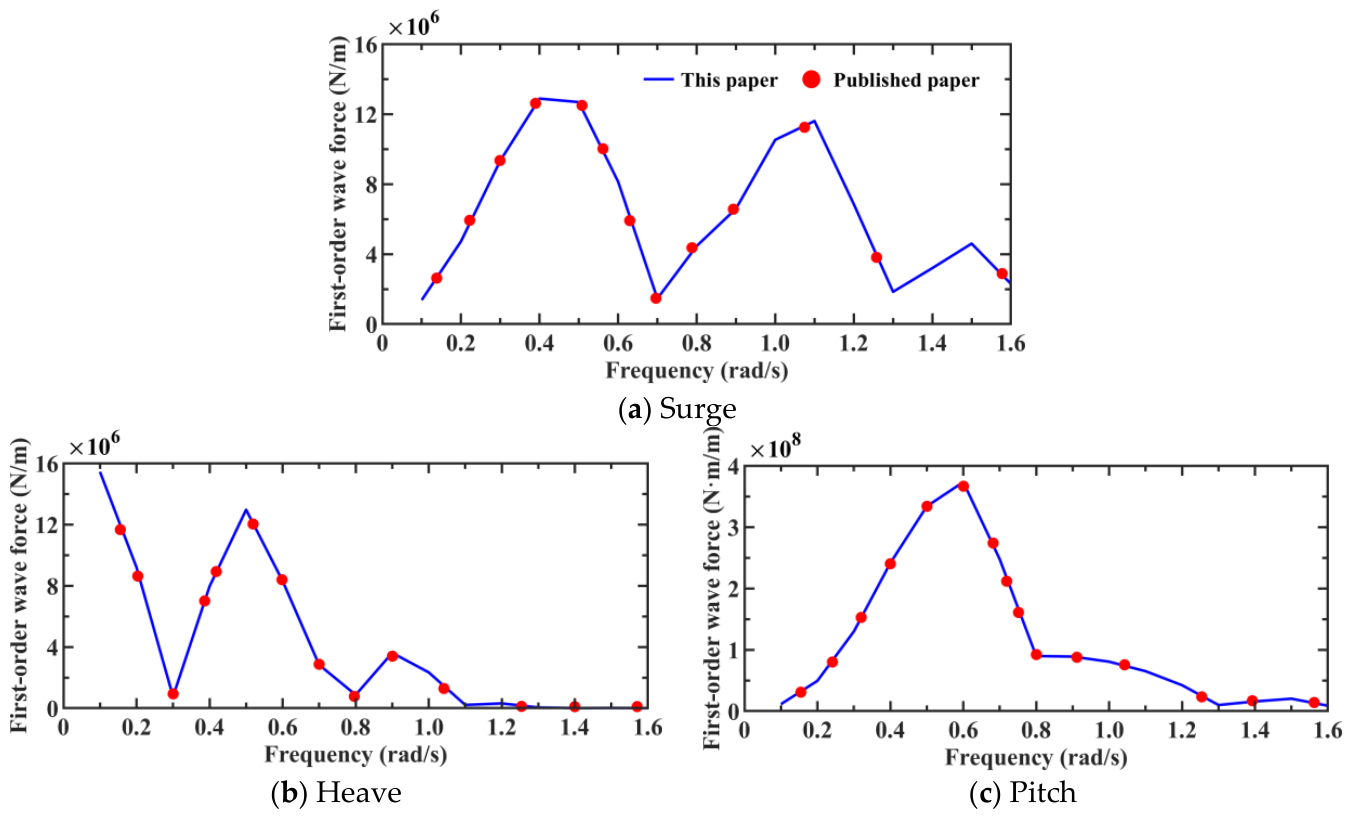
Considering the double symmetry of the semi-submersible platform, wave headings ranging from 0° to 45° (0°, 15°, 30°, and 45°) were selected for the hydrodynamic analysis. Figure 3 compares the added mass and radiation damping in the heave direction. Figure 4 and Figure 5 compare the first-order wave forces in the surge, heave, and pitch directions under wave headings of 0° and 45°, respectively. The results show good agreement with the published results, thereby demonstrating the accuracy and reliability of the developed model. Similar agreement was also obtained for the hydrodynamic coefficients, including added mass and radiation damping, in other degrees of freedom, as well as for the first-order wave forces under wave headings of 15° and 30°; therefore, these results are omitted for brevity.
Figure 3.
Comparison of added mass and radiation damping in the heave direction.
Figure 4.
Comparison of first-order wave forces under a wave heading of 0°.
Figure 5.
Comparison of first-order wave forces under a wave heading of 45°.
3.2. Mooring System Parameters
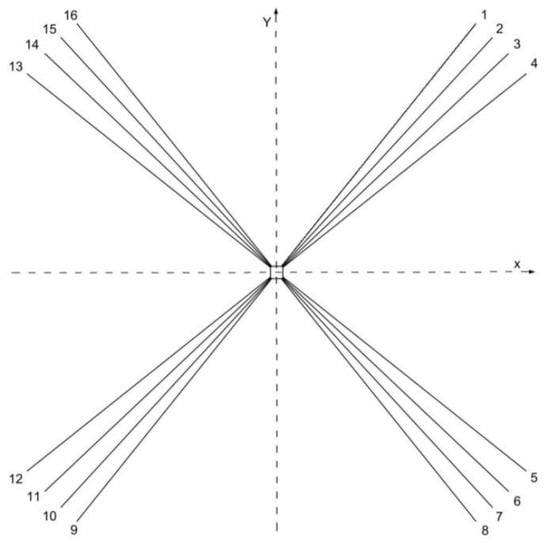
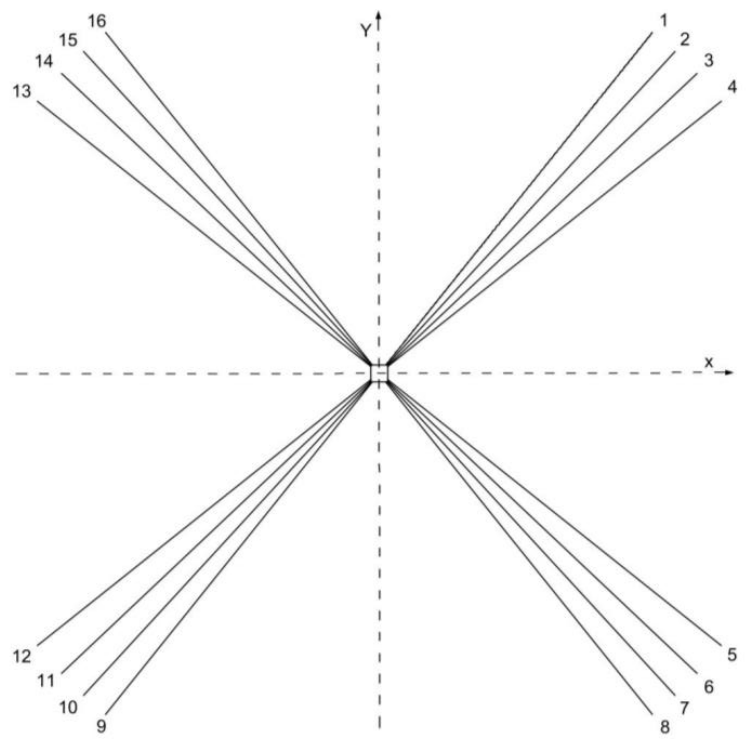
The platform was equipped with a 16-point mooring system. The system comprised four equally spaced groups, each containing four mooring lines (Figure 6). Each mooring line consisted of three segments: an upper chain, a middle CFRP line, and a lower chain.
Figure 6.
Schematic layout of the mooring system for the deepwater semi-submersible platform. The labels 1–16 in this figure denote the identification numbers of the mooring lines.
The material properties of these segments are summarized in Table 2.
Table 2.
Properties and parameters of the mooring lines.
3.3. Dynamic Response Analysis and Safety Assessment
This section considers the 100-year return-period sea state at the operating site of the semi-submersible platform. The sea state was characterized by the JONSWAP spectrum, with a significant wave height of HS = 14.6 m, a spectral peak period of Tp = 12.6 s, and a peak enhancement factor of γ = 2.4. Dynamic response analyses of the mooring system were then conducted under these conditions.
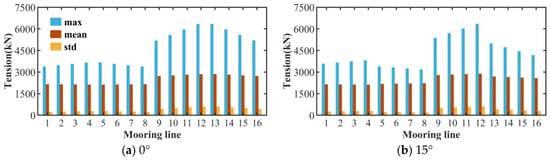
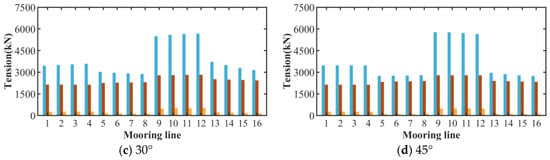
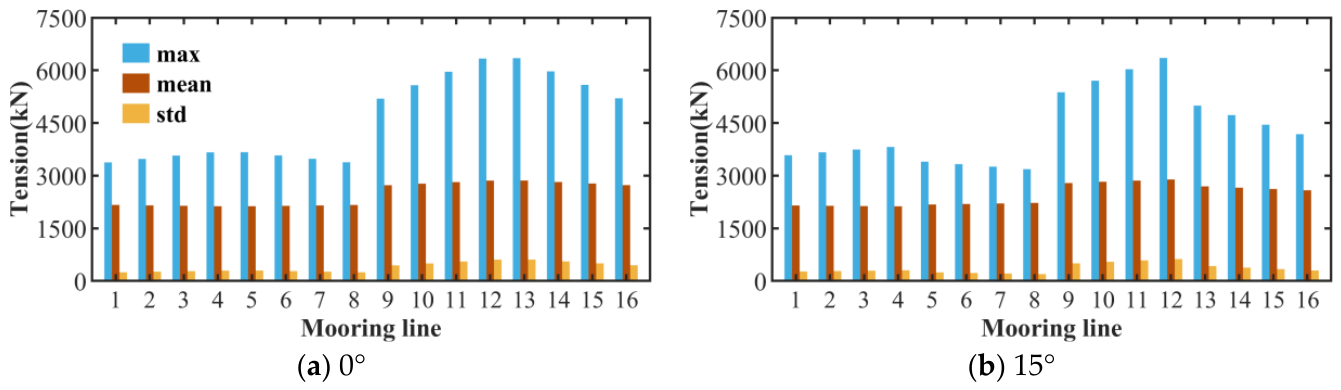
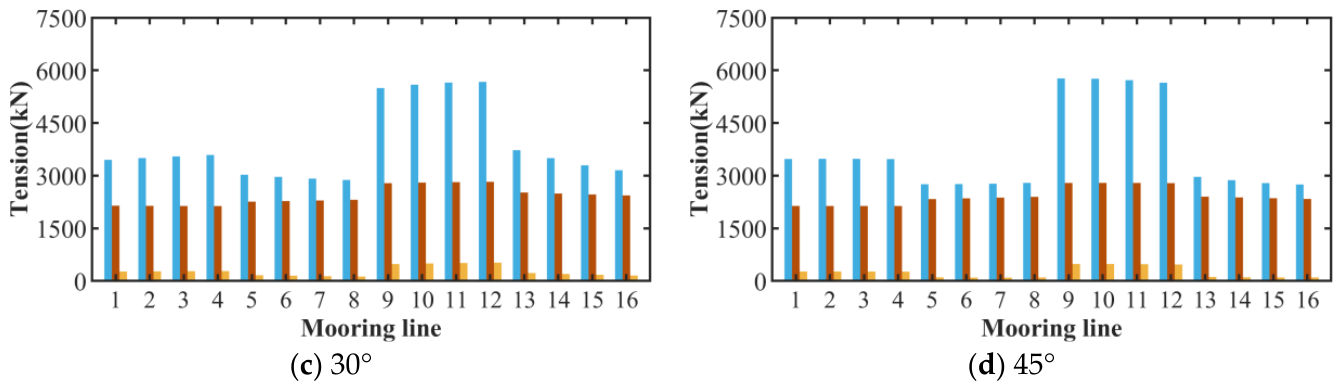
Figure 7 illustrates the maximum, mean, and standard deviation of CFRP mooring line tensions under different wave headings. The waveward mooring lines consistently experience higher tension levels than the sheltered mooring lines. This can be attributed to the high axial stiffness of CFRP lines, which increases the overall stiffness of the coupled platform-mooring system. Consequently, the system exhibits a stronger response to wave loading, leading to increased tension in the waveward mooring lines.
Figure 7.
Statistical parameters of CFRP line tension under different wave headings.
Table 3 summarizes the mooring line experiencing the maximum tension under each wave heading, together with its corresponding factor of safety (FS).
Table 3.
Maximum mooring-line tensions and corresponding FS under different wave headings.
The minimum FS across all examined conditions is 3.58, which is substantially higher than the allowable safety factor of 1.67 recommended by the design guideline [31]. This result indicates that the chain-CFRP line-chain mooring system provides an adequate safety margin for the safe operation of the semi-submersible platform. Furthermore, CFRP materials exhibit excellent fatigue resistance [32], which can effectively mitigate fatigue damage in CFRP mooring lines. These characteristics highlight the potential of CFRP materials for long-term service and their promising engineering applicability in deepwater mooring systems.
3.4. Selection of Time-Domain Response Characteristics
The proposed health-monitoring method was based on the time-domain dynamic responses of the mooring system. Numerical simulations were conducted to obtain the time-domain responses and corresponding characteristic parameters of the mooring system. The objective was to identify response features that were robust to variations in marine environmental conditions while maintaining high sensitivity to mooring-line fracture.
Based on the maximum mooring tension analysis detailed in Section 3.3, the failure of Line 12 was selected as the representative mooring-line failure in this study. Six extreme operational conditions were considered. Their detailed parameters are summarized in Table 4. In the Line 12 failure condition, the entire Line 12 was removed from the mooring system to simulate an instantaneous complete failure. An independent post-failure model was established, and the steady-state dynamic response after failure was investigated rather than the transient rupture process. After the failure, Line 12 no longer carries mooring load, and its original load is redistributed mainly to the remaining lines within the same mooring group.
Table 4.
Extreme operating conditions.
3.4.1. Comparative Analysis of Maximum Mooring Tension
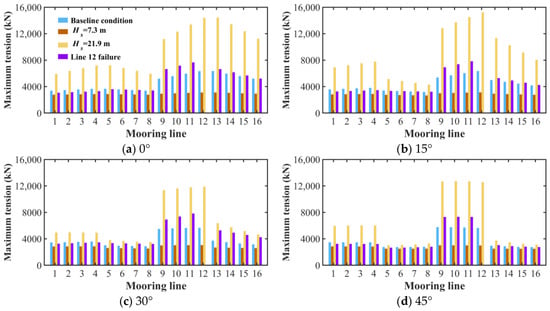
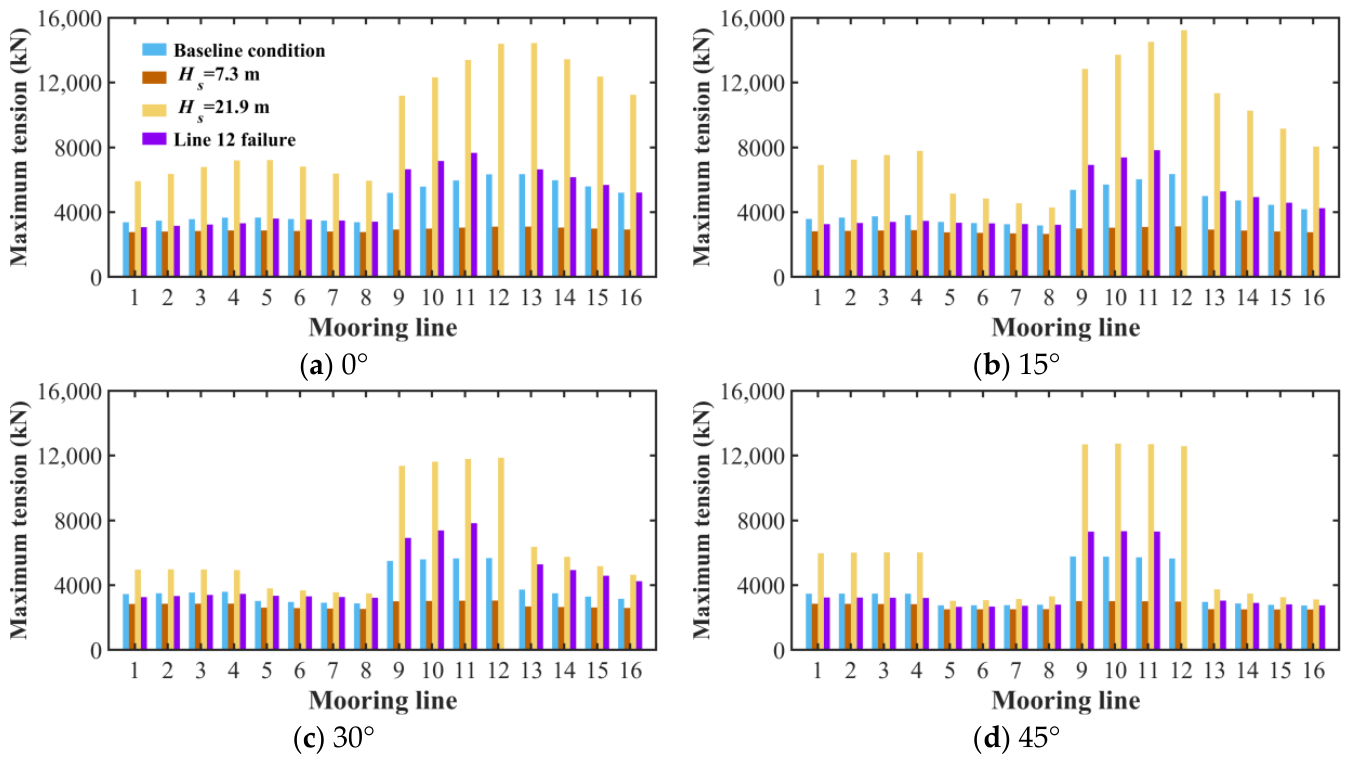
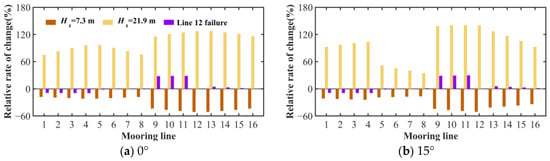
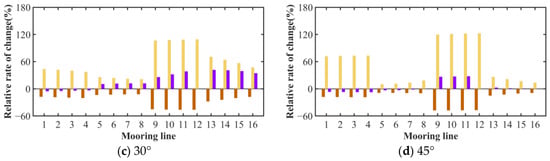
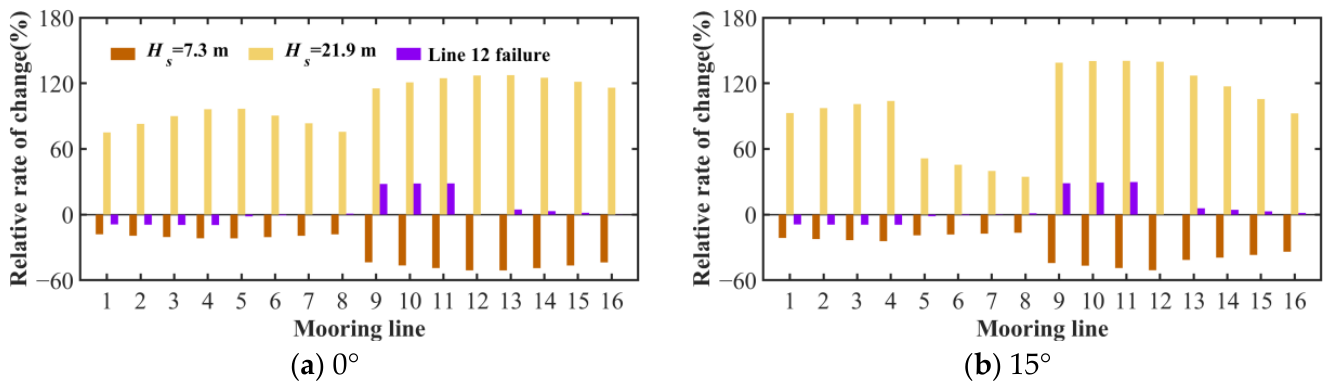
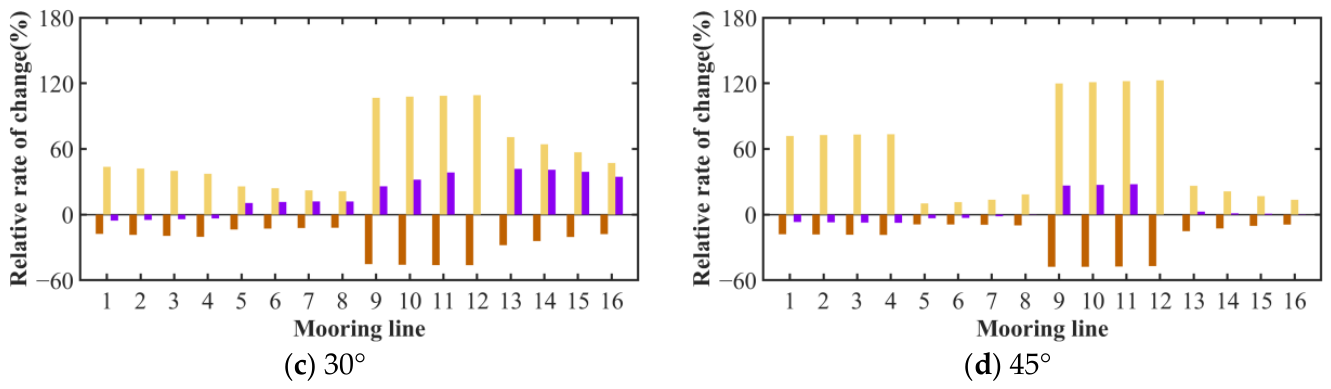
The maximum tensions of the CFRP lines and their corresponding relative variations under various wave headings are illustrated in Figure 8 and Figure 9. Both the maximum tensions and their relative variations exhibit consistent spatial distributions across mooring lines under different wave headings, with the peak values concentrated in the waveward lines. Under the Hs = 7.3 m condition, the maximum tensions generally decrease, whereas an overall increase is observed under the Hs = 21.9 m condition. Following the failure of Line 12, the loads are redistributed among the remaining mooring lines. Consequently, Lines 9–11, which belong to the same mooring group as the failed line, experience the most pronounced increases in maximum tension.
Figure 8.
Maximum tensions of the CFRP lines under different operating conditions.
Figure 9.
Relative variations in the maximum tensions of the CFRP lines under different operating conditions.
Both an increase in Hs and a single mooring-line failure can increase the tensions of the remaining mooring lines within the same group. Consequently, when only the tensions of the adjacent mooring lines are monitored, it is difficult to determine whether the observed increase is caused by environmental load variations or structural abnormalities. Furthermore, when a decrease in Hs occurs simultaneously with a single mooring-line failure, the corresponding effects on maximum mooring tension may partially offset each other. As a result, the tension response under the coupled condition becomes comparable to that under the baseline condition, making it difficult to distinguish the damaged state from the intact state based solely on tension monitoring. This masking effect substantially increases the risk of missed damage detection during mooring system condition assessment.
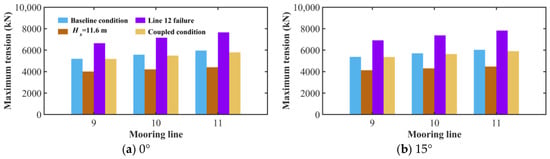
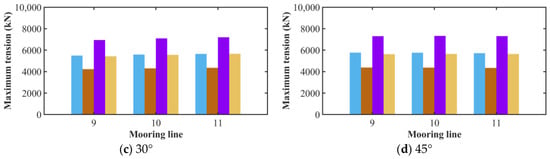
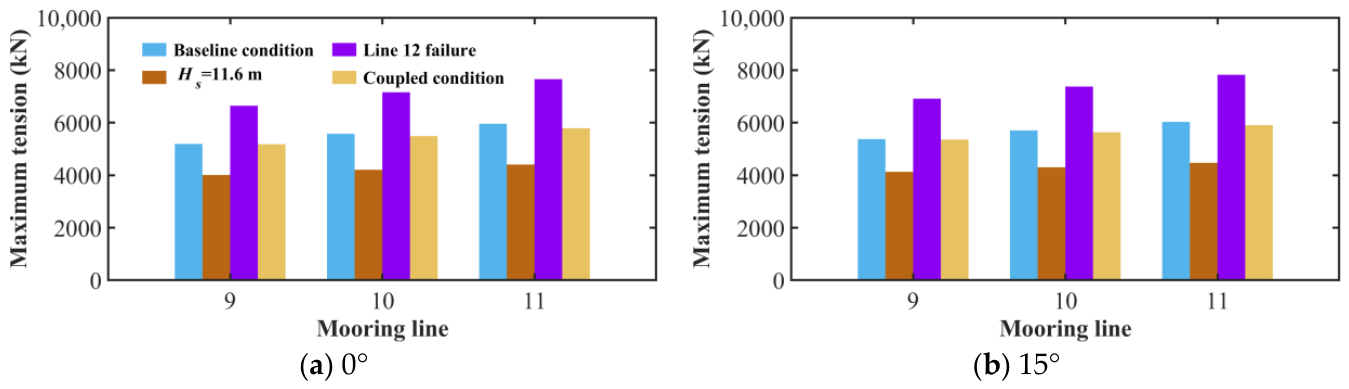
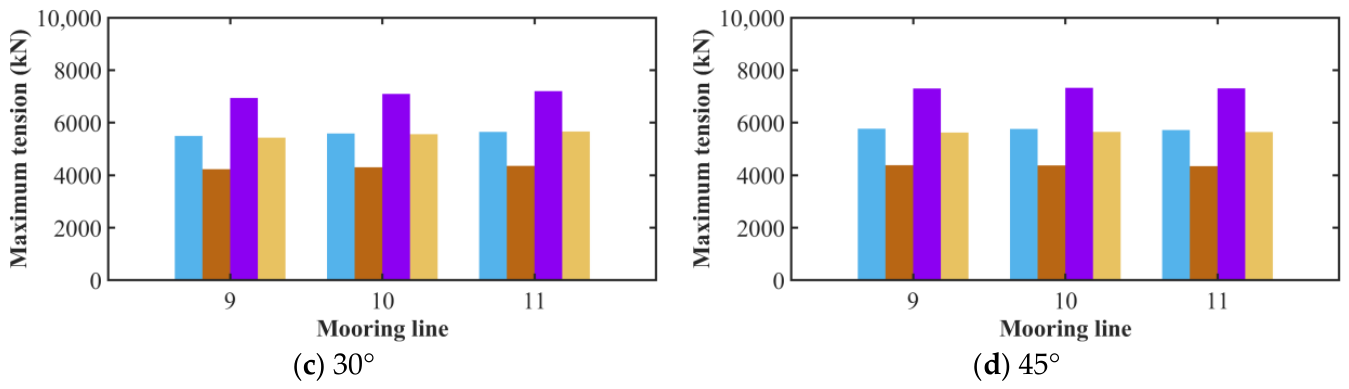
Since the failure of Line 12 has a pronounced influence on the maximum tensions of Lines 9–11, while its effects on the remaining mooring lines are relatively limited, the baseline condition, Hs = 11.6 m, Line 12 failure, and coupled condition were selected for comparative analysis of the maximum tensions of Lines 9–11.
The maximum tensions of Lines 9–11 under different wave headings are depicted in Figure 10.
Figure 10.
Maximum tensions of Lines 9–11 under different operating conditions.
Compared with the baseline condition, the maximum tensions of Lines 9–11 decrease significantly under the Hs = 11.6 m condition but increase following the failure of Line 12. In contrast, under the coupled condition, the maximum tensions remain comparable to those under the baseline condition, making reliable discrimination between the damaged and intact states challenging. This result indicates that the reduction in Hs partially offsets the increase in mooring tension induced by the line failure, thereby masking the associated structural abnormalities. Accordingly, maximum mooring tension, although widely used as a conventional damage-sensitive indicator, may be ineffective for detecting mooring-line failure under coupled environmental and structural variations. These findings highlight the need for robust health-monitoring methods.
3.4.2. Comparative Analysis of Mooring Tension Time Histories
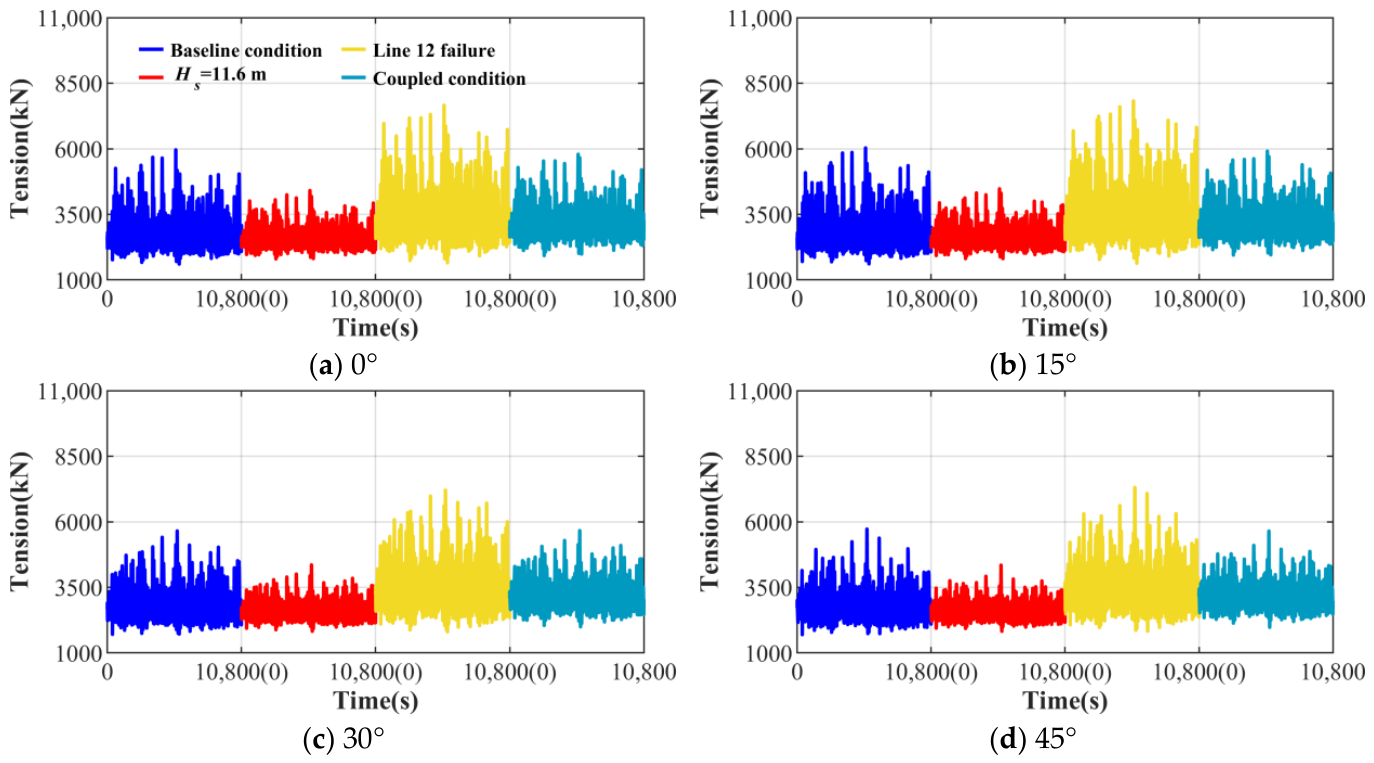
Figure 11 illustrates the tension time histories of Line 11 under different wave headings. Across all wave headings, the Line 12 failure condition consistently exhibits larger fluctuation amplitudes, more frequent peak responses, and higher overall tension levels than the other operating conditions. In addition, the increased occurrence of local extrema suggests a more pronounced dynamic response following mooring-line failure. Nevertheless, under a given wave heading, the overall temporal evolution of the tension time histories remains broadly similar across the different operating conditions. Under Hs = 11.6 m condition, the tension time histories exhibit reduced amplitudes under all wave headings, characterized by lower mean tension levels, narrower fluctuation ranges, and fewer peak responses. By contrast, under the coupled condition, the fluctuation amplitudes, peak tensions, and overall tension levels remain comparable to those observed under the baseline condition across all wave headings. This indicates that environmental load variations partially compensate for the effects of mooring-line failure on the tension response, thereby producing time-history characteristics that closely resemble those of the baseline condition. Consequently, conventional approaches based solely on the global characteristics of tension time histories may be insufficient to distinguish mooring-line failure from environmental load variations. These findings highlight the need for a robust health monitoring method capable of identifying mooring-line failure under varying environmental conditions.
Figure 11.
Tension time histories of Line 11 under different operating conditions. The four tension time histories are displayed sequentially, with “(0)” indicating the start of each subsequent operating condition.
Structural abnormalities, such as mooring-line failure, may produce tension-response characteristics that closely resemble those of the intact condition when they occur simultaneously with variations in Hs. Consequently, conventional damage-detection indicators may fail to distinguish structural abnormalities from environmental variations, thereby increasing the risk of false-negative damage identification, in which an abnormal structural state is incorrectly classified as healthy. These findings underscore the need for robust health-monitoring techniques capable of reliably identifying structural abnormalities in deepwater mooring systems under varying environmental conditions.
4. Numerical Validation and Performance Assessment of the Proposed Approach
The effectiveness and engineering applicability of the proposed health-monitoring method were evaluated through numerical simulations. Furthermore, the effects of sensor location and time-segment duration on monitoring performance were investigated to assess the applicability and robustness of the proposed method under different monitoring conditions.
4.1. Determination of the Memory Length for the Volterra Model
The memory length determines the extent of historical information incorporated into the Volterra model, thereby influencing both prediction accuracy and computational complexity. In this study, the memory length was determined using the RMSE and the number of model parameters. The RMSE is defined as:
where Ne denotes the number of samples, yi represents the measured mooring tension of the i-th sample, and is the corresponding tension predicted by the Volterra model.
The number of parameters to be identified increases rapidly with the memory length. For the second-order Volterra model, the number of parameters is given by
where P denotes the number of parameters to be identified. The first term corresponds to the zeroth-order constant term, the second term represents the number of first-order Volterra kernel parameters, and the third term denotes the number of independent second-order Volterra kernel parameters.
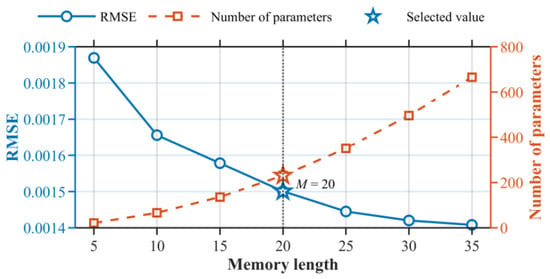
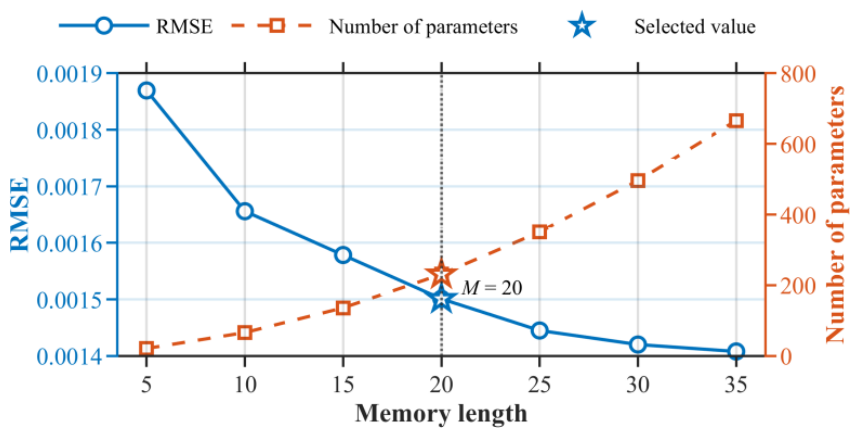
To balance prediction accuracy against computational complexity, the RMSE and the number of model parameters were evaluated for different memory lengths (Figure 12).
Figure 12.
Memory length selection for the Volterra model.
The RMSE gradually decreases with the memory length, indicating that incorporating a longer history of the tension response improves prediction accuracy. However, when the memory length exceeds 20, the RMSE has already reached a relatively low level, and further reductions provide only limited improvement in prediction accuracy, whereas the number of model parameters continues to increase rapidly. As a result, computational complexity increases substantially. Therefore, considering the trade-off between prediction accuracy and computational complexity, M = 20 was selected as the optimal memory length for the subsequent Volterra kernel identification and kernel-energy feature extraction.
4.2. Construction of Health Monitoring Indicators Based on the Volterra Model
Considering the practical engineering requirements and sensor-installation constraints associated with tension monitoring of CFRP mooring lines, the mooring tension measured at the connection between the CFRP line and the upper chain was selected for subsequent analysis.
The Volterra model was employed to characterize the linear and nonlinear dynamic features embedded in the tension time histories recorded by the sensor. The corresponding kernel energy features were subsequently extracted from h1 and h2. By jointly analyzing E1 and E2 under different operating conditions, their ability to distinguish environmental load variations from structural abnormalities was evaluated. In the present monitoring framework, the baseline condition was defined as the healthy state of the mooring system and was used as the reference condition. The remaining four operating conditions were defined as test conditions: Test 1 corresponds to Hs = 11.6 m, Test 2 to Hs = 7.3 m, Test 3 to the Line 12 failure condition, and Test 4 to the coupled condition.
E1 and E2 were calculated for each time segment using the Volterra model. For ease of presentation and comparative analysis, all time segments from the different operating conditions were assigned consecutive indices. Specifically, indices 1 to n correspond to the healthy state, n + 1 to 2n correspond to Test 1, 2n + 1 to 3n correspond to Test 2, 3n + 1 to 4n correspond to Test 3, and 4n + 1 to 5n correspond to Test 4. The n values of E1 obtained from the healthy state served as the reference dataset. The mean value (μ1) and standard deviation (σ1) of the reference dataset were first calculated. The segmented E1 values obtained under all operating conditions were then standardized using these reference statistics, thereby expressing the feature values relative to the statistical distribution of the healthy state. The standardized deviation of E1, denoted by ∆1, was introduced to quantitatively characterize the deviation of each test condition from the healthy state. The standardized deviation is defined as:
Similarly, the n values of E2 obtained from the healthy state were used as the reference dataset. Based on their calculated mean value (μ2) and standard deviation (σ2), the same normalization procedure was applied to the segmented E2 values under all operating conditions. Accordingly, the standardized deviation of E2, denoted by ∆2, was defined to quantify the deviation of each test condition from the healthy state as
The same healthy statistics are used for standardization across all test conditions to ensure cross-condition comparability. Where E1 represents the linear component of the tension response, and its variation is closely associated with changes in Hs. To assess the linear response characteristics of the four test conditions relative to the healthy state, the mean value of ∆1 over all segmented tension time histories was calculated for each test condition and denoted by Mk(k = 1, 2, 3, 4, 5):
where M1 through M5 correspond to the healthy state, Test 1, Test 2, Test 3 and Test 4, respectively.
E2 reflects the nonlinear characteristics of the tension response and is more sensitive to structural variations. To assess the nonlinear response characteristics of the four test conditions relative to the healthy state, the mean value of ∆2 over all segmented tension time histories, denoted by mk (k = 1, 2, 3, 4, 5), was calculated for each test condition:
Since the segmented kernel-energy features under all operating conditions are standardized using the mean and standard deviation obtained from the healthy state, the corresponding mean values under the healthy state, M1 and m1, are theoretically zero. However, considering the statistical fluctuations of the monitoring indicators, a decision threshold of is introduced around the zero baseline, where n represents the number of segments used to calculate the mean value of each monitoring indicator. Therefore, the relationships between the monitoring indicators of different test conditions, Mk and mk (k = 2, 3, 4, 5), and the positive and negative thresholds are used to determine whether the corresponding response characteristics indicate environmental-load variations or potential structural abnormalities.
Specifically, Mk is employed as the first-order monitoring indicator. Since the first-order kernel-energy indicator is mainly influenced by environmental-load variations, Mk > τ is adopted as the identification criterion for environmental-load variations. Accordingly, the first-order monitoring indicator is used to identify changes in the response characteristics associated with different environmental conditions.
Similarly, mk is employed as the second-order monitoring indicator. Since the second-order kernel-energy indicator is more sensitive to structural variations, mk < −τ is adopted as the identification criterion for potential structural abnormalities, such as mooring-line failure. Accordingly, the second-order monitoring indicator is used to identify structural abnormalities associated with changes in the nonlinear response characteristics.
Accordingly, Mk and mk are jointly employed as baseline-referenced health-monitoring indicators. By adopting Mk > τ as the criterion for identifying environmental-load variations and mk < −τ as the criterion for identifying potential mooring-line failure, each test condition is independently evaluated relative to the healthy state. No prescribed ordering relationship is assumed among different test conditions, and the identification is performed based on the comparison between each test condition and the healthy baseline.
4.3. Validation of the Proposed Health-Monitoring Method
The tension history of Line 11 was selected to validate the feasibility and effectiveness of the proposed method. The complete tension time history was equally divided into 60 segments, each with a duration of 180 s, corresponding to n = 60 and t = 180 s. The number of data points in each segment is 1800.
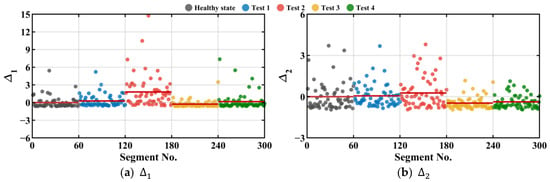
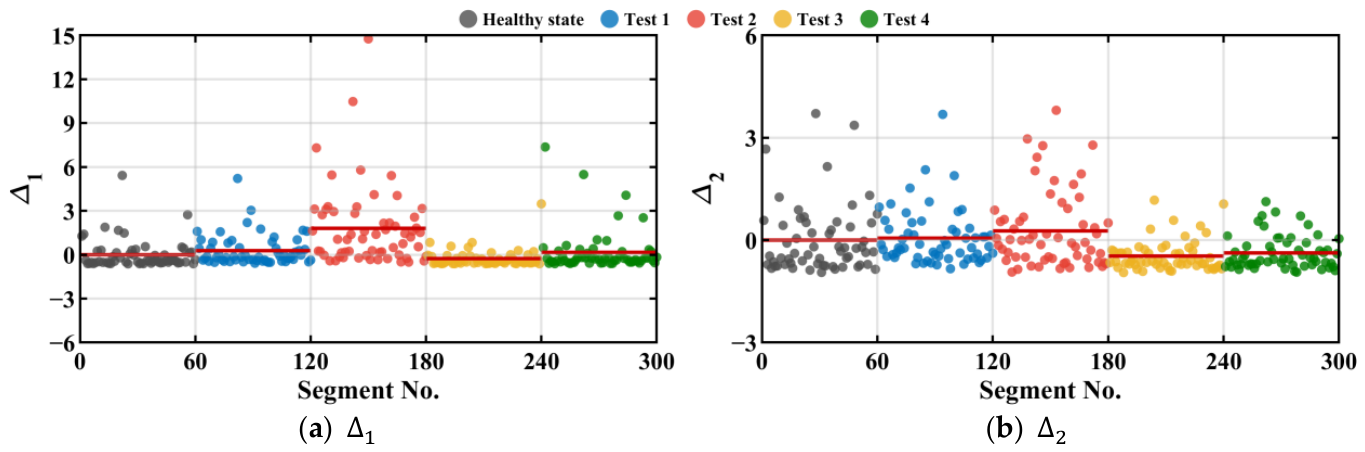
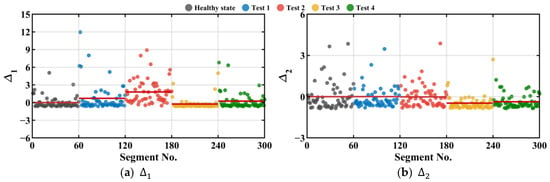
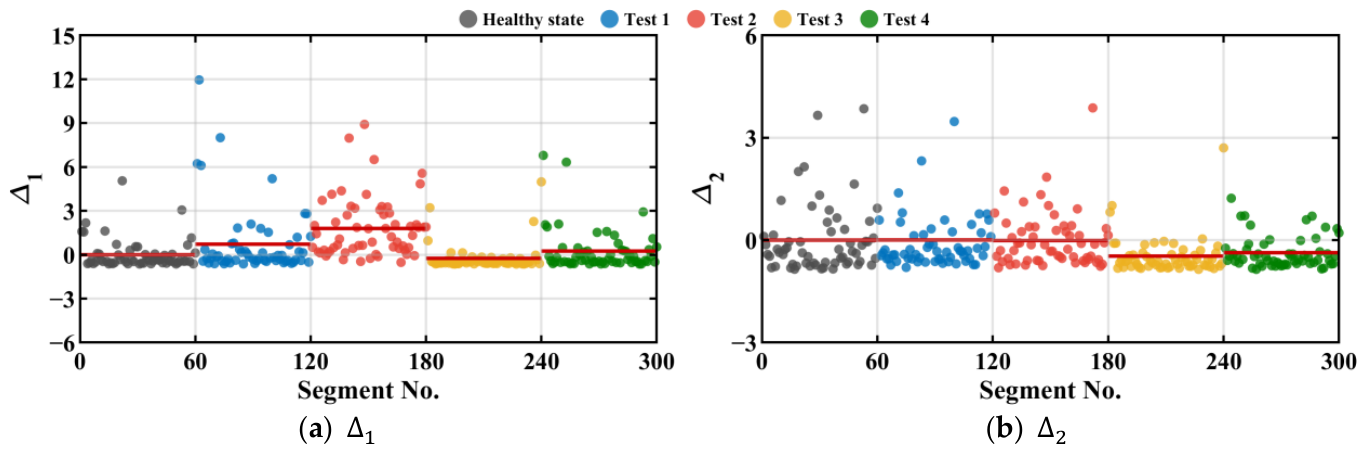
Figure 13 and Figure 14 illustrate the distributions of ∆1 and ∆2 under wave headings of 0° and 15°, respectively. As shown in these figures, under both wave headings, the first-order monitoring indicators M2 and M3 are both greater than the established threshold τ, indicating that the first-order monitoring indicators can effectively identify environmental-load variations. These results demonstrate that the first-order kernel-energy indicator exhibits good sensitivity to environmental-load variations and can effectively characterize the corresponding changes in the system response. However, its capability to identify nonlinear response changes associated with structural abnormalities, such as mooring-line failure, remains relatively limited.
Figure 13.
Distribution of ∆1 and ∆2 under a wave heading of 0°. In subplot (a), the red horizontal lines represent M1–M5, whereas in subplot (b), they represent m1–m5.
Figure 14.
Distribution of ∆1 and ∆2 under a wave heading of 15°. In subplot (a), the red horizontal lines represent M1–M5, whereas in subplot (b), they represent m1–m5.
In contrast, m4 and m5 are both greater than zero, whereas m4 and m5 are both less than the negative threshold −τ under both wave headings, indicating that the second-order monitoring indicator can effectively identify mooring-line failure, including the coupled condition involving environmental-load variations and mooring-line failure. These results demonstrate that the second-order kernel-energy indicator exhibits good sensitivity to structural abnormalities and can effectively capture the nonlinear response characteristics associated with mooring-line failure. Therefore, compared with the first-order monitoring indicator, the second-order monitoring indicator provides complementary information for identifying structural abnormalities that cannot be adequately captured by the first-order kernel energy.
Furthermore, the sensitivities of the health-monitoring indicators to different operating conditions under wave headings of 30° and 45° are generally consistent with those observed under wave headings of 0° and 15° and are therefore not discussed further. Based on the established threshold-based identification criteria and the combined characteristics of the two monitoring indicators, Test 1 and Test 2 can be effectively identified as conditions primarily involving environmental-load variations, whereas Test 3 and Test 4 can be identified as the mooring-line failure condition and the coupled condition involving both environmental-load variations and mooring-line failure, respectively. Overall, by integrating the first- and second-order Volterra kernel energies into health-monitoring indicators, the proposed approach can effectively distinguish environmental-load variations from structural abnormalities, such as mooring-line failure. These results provide preliminary validation of its applicability and robustness in assessing the health condition of mooring systems under complex marine environmental conditions.
The first-order Volterra kernel energy demonstrated strong sensitivity to environmental load variations, whereas the second-order Volterra kernel energy was more responsive to nonlinear dynamic characteristics associated with structural abnormalities. By integrating these two complementary features, the proposed health-monitoring indicators effectively distinguished environmental load variations from damage-induced response characteristics, thereby enabling health-state monitoring of the mooring system. Collectively, the results verified the effectiveness and engineering applicability of the proposed method.
4.4. Influence of Monitoring Location on the Performance of the Health-Monitoring Method
The identification results of the proposed monitoring indicators for Lines 9–11 under different wave headings, obtained using the established threshold-based identification criteria, are summarized in Table 5. The first-order monitoring indicator demonstrates good performance in identifying environmental-load variations under different wave headings, indicating its high sensitivity to changes in environmental conditions. Similarly, the second-order monitoring indicator effectively identifies mooring-line failure, demonstrating its sensitivity to structural abnormalities. However, the identification performance is relatively weaker under the coupled conditions, where environmental-load variations and mooring-line failure occur simultaneously. This may be attributed to the interaction between environmental-load variations and structural abnormalities, which can partially weaken the distinctive nonlinear response characteristics associated with mooring-line failure. Overall, the proposed monitoring indicators exhibit good identification performance for environmental-load variations and mooring-line failure, although their identification capability is slightly reduced under coupled conditions.
Table 5.
Identification results of the monitoring indicators for Lines 9–11 under different wave headings.
Furthermore, the monitoring indicators obtained from the other mooring lines exhibited considerably inferior identification performance compared with those from Lines 9–11, particularly in terms of detecting mooring-line failure.
Overall, the monitoring indicators obtained from Lines 10 and 11 exhibited comparable and superior identification performance, demonstrating high sensitivity to environmental variations and the nonlinear characteristics associated with mooring-line failure. In comparison, the indicators obtained from Line 9 exhibited slightly lower sensitivity to both environmental load variations and mooring-line failure. Therefore, Lines 10 and 11 demonstrated the best overall condition-discrimination capability among the monitoring locations investigated, while Line 9 showed slightly weaker performance. Accordingly, the measurement locations corresponding to Lines 10 and 11 were identified as the preferred monitoring locations for the proposed health-monitoring method.
4.5. Influence of Segment Duration on the Performance of the Health-Monitoring Method
The segment duration is an important factor affecting the performance of the proposed health-monitoring method. Based on the optimal monitoring location, Lines 9–11 were selected as the primary monitoring locations, while the remaining mooring lines were also briefly analyzed for comparison. Segment durations of 120, 180, 240, and 300 s were considered for the tension time-history data, corresponding to 1200, 1800, 2400, and 3000 data points per segment. The proposed monitoring indicators were evaluated under different segmentation schemes to investigate the influence of segment duration on health-monitoring performance and determine an appropriate segment duration.
The identification results of the proposed monitoring indicators for Line 11 under different segment durations are summarized in Table 6.
Table 6.
Identification results of the monitoring indicators for Lines 9–11 under different segment durations.
As shown in Table 6, when t = 120 s, the identification rates for Lines 9, 10, and 11 are 13/16, 12/16, and 12/16, respectively, indicating relatively limited overall identification performance. When t = 180 s, the identification rates for Lines 10 and 11 increase to 15/16, while that for Line 9 remains at 13/16, demonstrating the best overall identification performance among the investigated segment durations. However, when t = 240 s, the identification rates for Lines 9, 10, and 11 are 13/16, 12/16, and 9/16, respectively, indicating a decline in overall identification performance, particularly for Line 11. When t = 300 s, the identification rates further decrease to 9/16, 10/16, and 9/16, respectively, representing the lowest overall identification performance among the investigated segment durations.
Overall, shorter segment durations can improve monitoring timeliness and may adequately capture first-order response characteristics; however, they may provide insufficient information to characterize the nonlinear dynamic features of the tension response, thereby weakening the discrimination capability of the second-order indicator. Conversely, excessively long segment durations may reduce monitoring timeliness without improving identification performance and may even lead to a deterioration in overall identification accuracy. Therefore, among the segment durations considered in this study, a segment duration of 180 s is identified as the optimal choice, achieving a favorable balance among identification accuracy, monitoring performance across different locations, and monitoring timeliness.
4.6. Influence of Random Seed on Monitoring Performance
To further evaluate the robustness of the proposed health-monitoring method under different stochastic variations in irregular wave loading, three different random seeds (2761, 3987, and 5219) were considered. Based on the findings presented in Section 4.5, the segment duration was fixed at 180 s, corresponding to 1800 data points per segment.
The identification results of the proposed monitoring indicators for Line 11 under different seeds are summarized in Table 7. As shown in Table 7, the identification rates corresponding to random seeds 2761, 3987, and 5219 are 14/16, 13/16, and 13/16, respectively. Although slight differences in identification rates are observed among the three random seeds, the overall identification performance remains relatively stable, with a maximum difference of only one correctly identified case out of sixteen. The identification results of the monitoring indicators obtained from Lines 9 and 10 exhibit generally consistent trends and are therefore not discussed in detail. Overall, the results indicate that different random seeds have only a limited influence on the identification performance of the proposed monitoring indicators, demonstrating the stability of the proposed method under different random realizations. These findings further enhance the credibility of the numerical simulation results and provide additional support for the reliability of the proposed health-monitoring method.
Table 7.
Identification results of the monitoring indicators for Line 11 under different seeds.
To further evaluate the false-alarm performance of the proposed health-monitoring method, additional healthy-state tension responses were simulated using three different random seeds (2761, 3987, and 5219), while maintaining the same environmental conditions and intact mooring configuration as the initial healthy state. For each random seed, the monitoring indicators under four wave headings (0°, 15°, 30°, and 45°) were evaluated against the corresponding initial healthy reference using the established threshold-based identification criterion. For Line 11, a total of 12 independent healthy-state comparisons were conducted, of which 10 were correctly classified as healthy, while 2 were incorrectly identified as mooring-line failure, corresponding to a false-alarm rate of 16.7% (2/12). These results indicate that the proposed monitoring indicator can distinguish healthy-state variations induced by different random wave realizations from mooring-line failure in most of the investigated cases. Nevertheless, the observed false alarms suggest that the indicator remains somewhat sensitive to stochastic variations in environmental excitation.
Based on the above analysis and the established threshold-based identification criteria, it can be reasonably concluded that Test 1 and Test 2 involve only environmental-load variations, whereas Test 3 and Test 4 involve structural abnormalities, such as mooring-line failure. Specifically, under most operating conditions, the first-order monitoring indicators M2 and M3 exceed the established threshold τ, indicating that the first-order monitoring indicator can effectively identify environmental-load variations. These results demonstrate that the monitoring indicators constructed from the first-order Volterra kernel energy exhibit good sensitivity to environmental-load variations and can effectively characterize the corresponding changes in the system response.
In contrast, most values of the second-order monitoring indicator m4 fall below the negative threshold −τ, indicating good identification performance for mooring-line failure. However, the second-order monitoring indicator exhibits relatively lower sensitivity under the coupled conditions involving environmental-load variations and mooring-line failure. These results demonstrate that the second-order kernel-energy indicator can effectively capture the nonlinear response characteristics associated with mooring-line failure, although its identification capability is weakened under the coupled conditions. Therefore, compared with the first-order monitoring indicator, the second-order monitoring indicator provides complementary information for identifying structural abnormalities that cannot be adequately captured by the first-order kernel energy.
By jointly analyzing the variation characteristics of the first- and second-order monitoring indicators and considering the settings of the test conditions, the specific operating conditions corresponding to the four tests can be further determined: Test 1 corresponds to Hs = 11.6 m, Test 2 to Hs = 7.3 m, Test 3 to the Line 12 failure condition, and Test 4 to the coupled condition involving Hs = 11.6 m and Line 12 failure. Accordingly, this study adopts the newly established thresholds as the identification criteria for environmental-load variations and mooring-line failure. Specifically, first-order monitoring indicators exceeding the positive threshold τ are used to identify environmental-load variations, whereas second-order monitoring indicators falling below the negative threshold −τ are used to identify structural abnormalities associated with mooring-line failure. By jointly considering the threshold-exceedance characteristics of the first- and second-order monitoring indicators, the proposed health-monitoring method can effectively distinguish environmental-load variations from structural abnormalities under most investigated conditions. However, the reduced sensitivity of the second-order monitoring indicator under the coupled condition may limit the reliability of mooring-line failure identification in certain cases. Therefore, the combined monitoring indicators provide a basis for assessing the health condition of mooring systems while accounting for the influence of environmental-load variations on structural abnormality identification.
4.7. Comparison with a Linear AR-Based Indicator
To further clarify the additional information provided by the second-order Volterra kernel, a linear autoregressive (AR) model was introduced as a simple reference indicator. To ensure a consistent comparison, the AR model employed the same memory length (M = 20), segment duration, monitoring locations, and tension time-history data as those used in the Volterra analysis. The AR model is expressed as
where is the predicted tension response at the n-th sampling point, a0 is the intercept term, and ak is the AR coefficient corresponding to the k-th lag. The corresponding residual is defined as
The root-mean-square value of the AR residual was then used as the reference indicator:
where N is the number of sampling points in each tension time-history segment.
As shown in Table 8, when the threshold-based identification criterion established in this study is applied to the monitoring indicators constructed using the AR residual, the indicator values under all four wave headings fall below the established negative threshold −τ, indicating mooring-line failure. The AR-residual-based indicator shows limited reliability in distinguishing structural abnormalities under varying operating conditions. In contrast, the proposed second-order Volterra indicator can effectively characterize the nonlinear response changes associated with structural abnormalities such as mooring-line failure and exhibits a clearer correspondence with the actual structural condition. Consequently, the second-order Volterra indicator demonstrates better performance in identifying mooring-line failure compared with the AR-based method.
Table 8.
Comparison of the AR residual and second-order Volterra indicators for Line 11 under different wave headings.
5. Conclusions
Despite the promising results, several limitations of the present study should be acknowledged. First, the proposed method was validated primarily using numerical simulation data, and the influence of measurement noise on the monitoring indicators and identification performance has not been systematically investigated. Second, the numerical validation was conducted using a single semi-submersible platform model and focused on one mooring-line failure scenario, which may limit the generalizability of the findings to other platform configurations and failure scenarios. Furthermore, ocean-current velocity can influence the dynamic responses of floating platforms and mooring systems. However, the effects of current velocity were not considered in the present study, as they were beyond the primary research scope. Future work will focus on evaluating the robustness of the proposed method under measurement noise, different platform configurations, diverse failure scenarios, and a wider range of environmental conditions, including variations in current velocity, to further assess its engineering applicability.
To address the limitations of conventional tension-based monitoring methods, a Volterra kernel energy-based health monitoring method was proposed for CFRP mooring systems of deepwater semi-submersible platforms. The proposed method effectively distinguished environmental load variations from structural abnormalities associated with mooring-line failure, thereby supporting the health-state assessment of deepwater mooring systems. The primary findings and engineering implications are summarized as follows:
- (1)
- Volterra kernels were extracted from mooring-tension time histories to construct health monitoring indicators based on the first- and second-order Volterra kernel energies. The first-order kernel energy exhibited high sensitivity to environmental load variations, whereas the second-order kernel energy captured nonlinear dynamic characteristics associated with mooring-line failure. By integrating these complementary features, the proposed indicators effectively distinguished environmental load variations from damage-induced response characteristics.
- (2)
- The performance of the proposed health-monitoring method was significantly affected by sensor location. Mooring lines within the same group as the failed line generally exhibited higher sensitivity to environmental load variations and mooring-line failure. Specifically, Lines 10 and 11 exhibited comparable performance and achieved the best overall monitoring results, whereas Line 9 showed slightly lower sensitivity in identifying environmental load variations and mooring-line failure. Therefore, monitoring locations with higher response sensitivity are recommended to improve monitoring accuracy and reliability. For the four-line mooring configuration considered in this study, Lines 10 and 11 were identified as the preferred monitoring locations, while Line 9 could serve as an alternative monitoring location with slightly reduced performance. These results suggest that priority should be given to neighboring mooring lines within the same mooring group when selecting sensor locations, rather than relying solely on the distance from the potentially failed line. Appropriate sensor placement can facilitate effective health-state assessment of the entire mooring group. The proposed method is particularly applicable to sparse-sensing configurations, where failure of an uninstrumented mooring line can be inferred from the tension responses of adjacent monitored lines.
- (3)
- Segment duration significantly influenced the accuracy and stability of condition identification. A segment duration of 180 s yielded the best overall performance by balancing statistical reliability and monitoring timeliness. This duration provides sufficient response information for reliable Volterra kernel-energy feature extraction while maintaining an appropriate monitoring interval, thereby supporting timely health-state assessment and integrity management of deepwater mooring systems.
Author Contributions
Conceptualization, J.D. and Y.J.; methodology, H.C.; formal analysis, Y.L.; investigation, Y.L.; data curation, Y.L.; visualization, Y.L.; writing—original draft preparation, Y.L.; writing—review and editing, J.D., H.C. and Y.J.; supervision, J.D. and Y.J.; project administration, J.D. and Y.J.; funding acquisition, J.D., H.C. and Y.J. All authors have read and agreed to the published version of the manuscript.
Funding
This work is supported by the National Key Research and Development Program of China (No. 2023YFB3711500); the Key R&D Program of Shandong Province (No. 2025CXPT202); the National Natural Science Foundation of China (No. 52271298/52301349); the Fundamental Research Funds for the Central Universities (No. 202561068).
Data Availability Statement
The data presented in this study are available on request from the corresponding author.
Conflicts of Interest
The authors declare no conflicts of interest.
References
- Xue, X.; Chen, N.-Z.; Wu, Y.; Xiong, Y.; Guo, Y. Mooring System Fatigue Analysis for a Semi-Submersible. Ocean Eng. 2018, 156, 550–563. [Google Scholar] [CrossRef] [Scilit]
- He, L.; Chai, W.; Gu, J.; Chen, W.; Shi, W.; Liu, Z.; Zhang, W. Extreme Value Prediction for the Dynamic Responses of a Semi-Submersible Platform in Harsh Environments with Consideration of Mooring Line Failure Accidents. Ocean Eng. 2025, 333, 121428. [Google Scholar] [CrossRef] [Scilit]
- Liu, H.; Zhou, S.; Gu, W.; Li, Z.; Guo, X.; Zhao, B. A Comprehensive Assessment of the Low-Carbon Energy Extraction Transition in the Global Offshore Oil and Gas Industry. Energy 2026, 351, 140782. [Google Scholar] [CrossRef] [Scilit]
- Rendón-Conde, C.; Heredia-Zavoni, E. Reliability Assessment of Mooring Lines for Floating Structures Considering Statistical Parameter Uncertainties. Appl. Ocean Res. 2015, 52, 295–308. [Google Scholar] [CrossRef] [Scilit]
- Vazquez-Hernandez, A.O.; Ellwanger, G.B.; Sagrilo, L.V.S. Reliability-Based Comparative Study for Mooring Lines Design Criteria. Appl. Ocean Res. 2006, 28, 398–406. [Google Scholar] [CrossRef] [Scilit]
- Mohapatra, S.C.; Amouzadrad, P.; Bispo, I.B.d.S.; Guedes Soares, C. Hydrodynamic Response to Current and Wind on a Large Floating Interconnected Structure. J. Mar. Sci. Eng. 2025, 13, 63. [Google Scholar] [CrossRef] [Scilit]
- Qiu, N.; Liu, X.; Li, Y.; Hu, P.; Chang, Y.; Chen, G.; Meng, H. Dynamic Catastrophe Analysis of Deepwater Mooring Platform/Riser/Wellhead Coupled System under ISW. Reliab. Eng. Syst. Saf. 2024, 246, 110084. [Google Scholar] [CrossRef] [Scilit]
- Zhang, D.; Du, J.; Wang, J.; Chang, A. Probability Distribution of the Hull Motion and Mooring Line Tension of Two Floating Systems. J. Ocean Univ. China 2020, 19, 281–297. [Google Scholar] [CrossRef] [Scilit]
- Cai, H.; Zhang, D.-Q.; Du, J.; Yuan, Z.-M.; Jiang, Z. Safety Analysis of Floating Multi-Module Systems under Connector Failure. Eng. Struct. 2026, 349, 121916. [Google Scholar] [CrossRef] [Scilit]
- Feuvrie, M.; Cartraud, P.; Davies, P. Dynamic Stiffness Characterization and Modelling of Nylon Mooring Rope for Floating Wind Turbines under Realistic and Regular Loading Conditions. Ocean Eng. 2026, 360, 126042. [Google Scholar] [CrossRef] [Scilit]
- Huang, W. Research Directions in Synthetic Fiber Ropes Applied as Mooring Lines for Floating Offshore Wind Turbines. Renew. Sustain. Energy Rev. 2026, 225, 116183. [Google Scholar] [CrossRef] [Scilit]
- Corbetta, I.; Sloan, F. HMPE Mooring Line Trial for Scarabeo III. In Proceedings of the Offshore Technology Conference, Houston, TX, USA, 3 May 2001. [Google Scholar] [CrossRef] [Scilit]
- Liang, Y.; Liu, Z.; Wang, L.; Han, Q.; Liang, W. Study on the Fatigue Performance of an Integrated Wedge Anchorage System for CFRP Rods in Cable Roof Structures. Case Stud. Constr. Mater. 2026, 24, e06180. [Google Scholar] [CrossRef] [Scilit]
- Hari, S.; Krishna, S.; Rao, M.H.V.R.; Vij, R.K. Fatigue Analysis and Reliability Assessment of Tether System of an Offshore Oil and Gas Platform Operating in Extreme Sea-State Conditions. Mar. Syst. Ocean Technol. 2022, 17, 113–121. [Google Scholar] [CrossRef] [Scilit]
- Rui, S.; Zhou, Z.; Gao, Z.; Jostad, H.P.; Wang, L.; Xu, H.; Guo, Z. A Review on Mooring Lines and Anchors of Floating Marine Structures. Renew. Sustain. Energy Rev. 2024, 199, 114547. [Google Scholar] [CrossRef] [Scilit]
- Mohapatra, S.C.; Soares, C.G. Effect of Mooring Lines on the Hydroelastic Response of a Floating Flexible Plate Using the BIEM Approach. J. Mar. Sci. Eng. 2021, 9, 941. [Google Scholar] [CrossRef] [Scilit]
- Xu, P.; Lin, Z.; Zahid, U.; Zheng, J.; Song, Q.; Han, B. Mooring Lines Structural Health Monitoring Based on Floating Wind Turbine Response Using an Integrated ESAX-ResNet-50 Model. Ocean Eng. 2026, 353, 124696. [Google Scholar] [CrossRef] [Scilit]
- Jin, C.; Hong, S.H. Underwater Line Monitoring Using Optimally Placed Inclinometers. J. Mar. Sci. Eng. 2024, 12, 1939. [Google Scholar] [CrossRef] [Scilit]
- Wu, W.; Feng, J.; Xie, B.; Tang, D.; Yue, Q.; Xie, R. Development and Sensing Properties Study of Underwater Assembled Water Depth-Inclination Sensors for a Multi-Component Mooring System, Using a Self-Contained Technique. Sensors 2016, 16, 1925. [Google Scholar] [CrossRef] [Scilit] [PubMed]
- Jiang, Y.; Liu, Y.; Wang, S. Structural Damage Classification in Offshore Structures under Environmental Variations and Measured Noises Using Linear Discrimination Analysis. Struct. Control Health Monit. 2024, 2024, 6650582. [Google Scholar] [CrossRef] [Scilit]
- Chang, A.; Wang, S.; Du, J.; Li, H. Second-Order Frequency-Domain Coupled Analysis for Moored Offshore Structure Dynamics. Ocean Eng. 2019, 174, 201–215. [Google Scholar] [CrossRef] [Scilit]
- Jiang, J.; Cao, D.; Chen, H.; Zhao, K. The Vibration Transmissibility of a Single Degree of Freedom Oscillator with Nonlinear Fractional Order Damping. Int. J. Syst. Sci. 2017, 48, 2379–2393. [Google Scholar] [CrossRef] [Scilit]
- Tang, H.; Liao, Y.H.; Cao, J.Y.; Xie, H. Fault Diagnosis Approach Based on Volterra Models. Mech. Syst. Signal Process. 2010, 24, 1099–1113. [Google Scholar] [CrossRef] [Scilit]
- Kong, F.; Yu, J.; Xu, Y.; Fang, J. A Volterra-Series-Based Semi-Analytical Method for Fractionally Damped Nonlinear Systems under Stochastic Excitation. Mech. Syst. Signal Process. 2025, 241, 113579. [Google Scholar] [CrossRef] [Scilit]
- Volterra, V. Theory of Functionals and of Integral and Integro-Differential Equations.: [Unabridged Republication of the First English Translation]; Dover Publications: New York, NY, USA, 1959. [Google Scholar]
- Li, Y.; Zhang, M.; Bai, Z.; Xu, R. Structural Damage Detection Based on Coherence-Statistical Analysis of Volterra Kernels. Measurement 2025, 255, 118000. [Google Scholar] [CrossRef] [Scilit]
- Villani, L.G.G.; da Silva, S.; Cunha, A.; Todd, M.D. Damage Detection in an Uncertain Nonlinear Beam Based on Stochastic Volterra Series: An Experimental Application. Mech. Syst. Signal Process. 2019, 128, 463–478. [Google Scholar] [CrossRef] [Scilit]
- Villani, L.G.G.; da Silva, S.; Cunha, A. Damage Detection in an Uncertain Nonlinear Beam Based on Stochastic Volterra Series. Mech. Syst. Signal Process. 2019, 125, 288–310. [Google Scholar] [CrossRef] [Scilit]
- Zhu, H.; Zhang, L.; Yang, J.; Zhang, J.; Gao, B.; Yan, X. A New Prediction Method for Mooring Tension of Semi-Submersible Platforms Based on SMVMD and Deep Learning. Ocean Eng. 2026, 357, 125508. [Google Scholar] [CrossRef] [Scilit]
- Gao, L.Q. Analysis of Taut Mooring Systems for Semi-Submersible Platforms and Deepwater Umbilical Laying. Master’s Thesis, Tianjin University, Tianjin, China, 2022. [Google Scholar]
- Liang, K.; Zhang, D. Study on the Effect of Column Form on the Dynamic Response of Semi-Submersible Truss-Type Fish Culture Platforms. J. Mar. Sci. Eng. 2025, 13, 2370. [Google Scholar] [CrossRef] [Scilit]
- Guo, R.; Li, C.; Niu, Y.; Xian, G. The Fatigue Performances of Carbon Fiber Reinforced Polymer Composites—A Review. J. Mater. Res. Technol. 2022, 21, 4773–4789. [Google Scholar] [CrossRef] [Scilit]

Disclaimer/Publisher’s Note: The statements, opinions and data contained in all publications are solely those of the individual author(s) and contributor(s) and not of MDPI and/or the editor(s). MDPI and/or the editor(s) disclaim responsibility for any injury to people or property resulting from any ideas, methods, instructions or products referred to in the content. |
© 2026 by the authors. Licensee MDPI, Basel, Switzerland. This article is an open access article distributed under the terms and conditions of the Creative Commons Attribution (CC BY) license.