


Abstract
Autonomous navigation in constrained nearshore waters is challenged by boundary constraints, static obstacles, and incomplete perception. Using Proximal Policy Optimization (PPO) as a common baseline, this study integrates distance-staged curriculum learning and a LiDAR-based Safety Shield into a point-to-point USV obstacle-avoidance framework and evaluates their incremental effects on training-task organization and runtime action filtering. Validation includes fixed-stratified paired tests, unseen obstacle layouts, three independent training runs, threshold-sensitivity analysis, and new cross-seed Shield evaluation on independently trained policies. Curriculum learning does not provide a consistent final success-rate advantage across the three training runs; its paired decision-efficiency effect is statistically detectable in the original run but practically modest. By contrast, the Safety Shield increases success and reduces collisions across all four independently trained seed-101/202 policies tested with Shield OFF/ON, while introducing a small number of timeouts and a small efficiency cost in triggered cases. Controlled runtime diagnostics further show that the Shield’s slow-forward command is a reduced-propulsion action rather than explicit braking. Overall, distance staging mainly changes training-task organization and produces modest decision-efficiency effects, whereas runtime shielding exhibits a reproducible trade-off between collision-risk mitigation and intervention cost within the present simplified Unity environment.
1. Introduction
1.1. Application Background and Contributions
Unmanned surface vehicles (USVs) have been applied to marine surveying, environmental monitoring, search and rescue, and nearshore support operations [1,2]. In constrained waters such as nearshore and harbor environments, shorelines, quay structures, and local obstacles reduce the navigable space, while vessel inertia and incomplete local perception further increase the difficulty of collision avoidance. Conventional planning methods provide good interpretability and engineering controllability, but they generally rely on relatively complete environmental information and motion models and may require additional parameter transfer and adaptation when the operating scenario changes substantially [3].
Deep reinforcement learning (DRL) provides an alternative approach by learning mappings from local perception to control actions through interaction with the environment. Proximal Policy Optimization (PPO) improves training stability by constraining the magnitude of policy updates and is well suited to sequential decision-making tasks. However, in USV obstacle avoidance, sparse terminal rewards, imbalanced task difficulty during training, and locally risky actions during execution can still affect training efficiency and operational safety.
This study uses a unified task-adapted PPO controller as the comparison basis and examines two complementary mechanisms: distance-staged curriculum learning during training and a LiDAR-based Safety Shield during execution. The former changes only the organization of training tasks, whereas the latter directly replaces candidate actions when local risk is detected. Matched-case pairing, unseen obstacle layouts, independent training repetitions, and threshold-sensitivity tests are used to assess their effects on task performance, training stability, and runtime intervention cost. The LiDAR Shield used here is a lightweight rule-based filter and does not provide a formal safety guarantee.
The main contributions of this study are as follows:
- (1)
- On a unified task-adapted PPO baseline, distance staging is restricted to a training-side modification and the LiDAR Safety Shield to an execution-side action correction. Their incremental effects are compared under the same state, action, reward, network architecture, and training budget.
- (2)
- Fixed-stratified pairing, unseen obstacle layouts, and independent training repetitions are used to distinguish case-level differences, environmental-layout variation, and training randomness. Curriculum learning does not show a stable improvement in overall success rate, but decision-step counts decrease on cases solved by both policies in all three training runs.
- (3)
- The Safety Shield is evaluated in terms of success rate, collision rate, paired outcome transitions, timeouts, trigger frequency, and action-override intensity, together with a sensitivity analysis of the forward trigger threshold. In addition, Shield OFF/ON evaluation is extended to four independently trained Baseline/Curriculum policies from seeds 101 and 202. Across those four policies, collision suppression and success-rate improvement are directionally consistent, while larger trigger thresholds increase intervention frequency and override intensity, revealing a trade-off between safety benefit and intervention cost.
1.2. Related Work
USV obstacle-avoidance methods can broadly be divided into model- and rule-based path planning and learning-based autonomous decision-making [3]. Conventional planners typically use methods such as A*, the dynamic window approach, artificial potential fields, or heuristic search to generate global or local paths. For USV applications, Liang et al. combined an improved A* algorithm with a minimum-course-alteration strategy for autonomous collision avoidance [4], whereas Bai et al. and Zhu et al. improved trajectory generation and obstacle avoidance using bio-inspired heuristic search and path planning in unknown complex environments, respectively [5,6]. These methods benefit from explicit rules and interpretable behavior, but their performance can depend strongly on environmental-model accuracy, rule coverage, and parameter settings, requiring additional model and parameter adaptation under incomplete perception or substantial scenario changes.
Unlike explicit planning, DRL directly learns a mapping from perception to action from interaction data and has increasingly been applied to USV navigation and collision avoidance. Existing studies include DRL methods for general autonomous navigation [7] and collision-avoidance policies that incorporate navigation rules such as COLREGs [8,9]. Reward shaping has been used to inject prior knowledge and improve training feedback [10]. Another USV-specific DRL study has examined collision avoidance using navigation characteristics [11]. Learning-based methods have also been extended to specific applications such as autonomous buoy inspection [12]. Recent reviews and related studies have further discussed algorithmic improvements, perception representations, generalization, and deployment issues in DRL-based USV navigation [13,14]. At the algorithmic level, DQN, DDPG, and PPO represent typical routes for discrete action selection, continuous control, and stable policy optimization, respectively [15,16,17]. PPO is selected here as the base algorithm because of its comparatively stable training behavior.
Beyond policy architecture, training-task organization and execution-stage risk constraints are also important in reinforcement-learning navigation. Reward shaping can improve learning signals [18], while curriculum learning promotes progressive training by arranging samples from easy to difficult [19,20,21]. Safe reinforcement learning includes both explicit constraints during optimization [22,23] and runtime shielding [24,25]. Dynamic Safety Shields have also been investigated for navigation [26], together with safety and generalization issues in real-world deployment [27]. In USV applications, Wang et al. combined adaptive curricula and domain randomization for mapless navigation and sim-to-real transfer [28]; Luo et al. developed LSTM-PPO and compared it with A2C, PPO, and SAC [29]; and Yun et al. used a control-barrier-function-based Safety Shield for dynamic encounters and COLREGs constraints [30]. Unlike formal CBF-QP filtering, this study uses a lightweight local-range threshold rule and emphasizes an interpretable, reproducible incremental evaluation rather than a formal safety guarantee.
Accordingly, this study addresses three research questions. RQ1: How does distance-staged curriculum learning affect task success rate and the decision process on cases solved by both policies? RQ2: What negative outcome transitions, timeouts, and action-intervention costs are introduced by the LiDAR Safety Shield while reducing collision risk? RQ3: Are these observations consistent across changes in obstacle layout and independent PPO training runs?
From an application perspective, nearshore autonomous navigation is relevant to harbor inspection, monitoring of confined waterways, and autonomous operations in constrained waters. The local-perception obstacle-avoidance and runtime risk-mitigation mechanisms studied here provide a simulation-based evaluation basis for safety-oriented decision-making in such applications.
2. Materials and Methods
2.1. Simulation Task Scenario
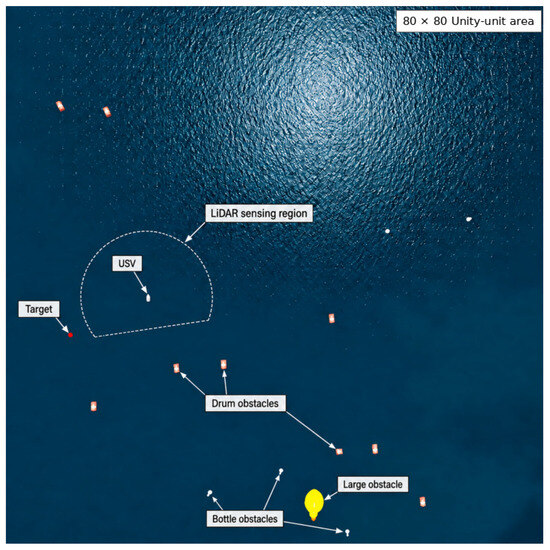
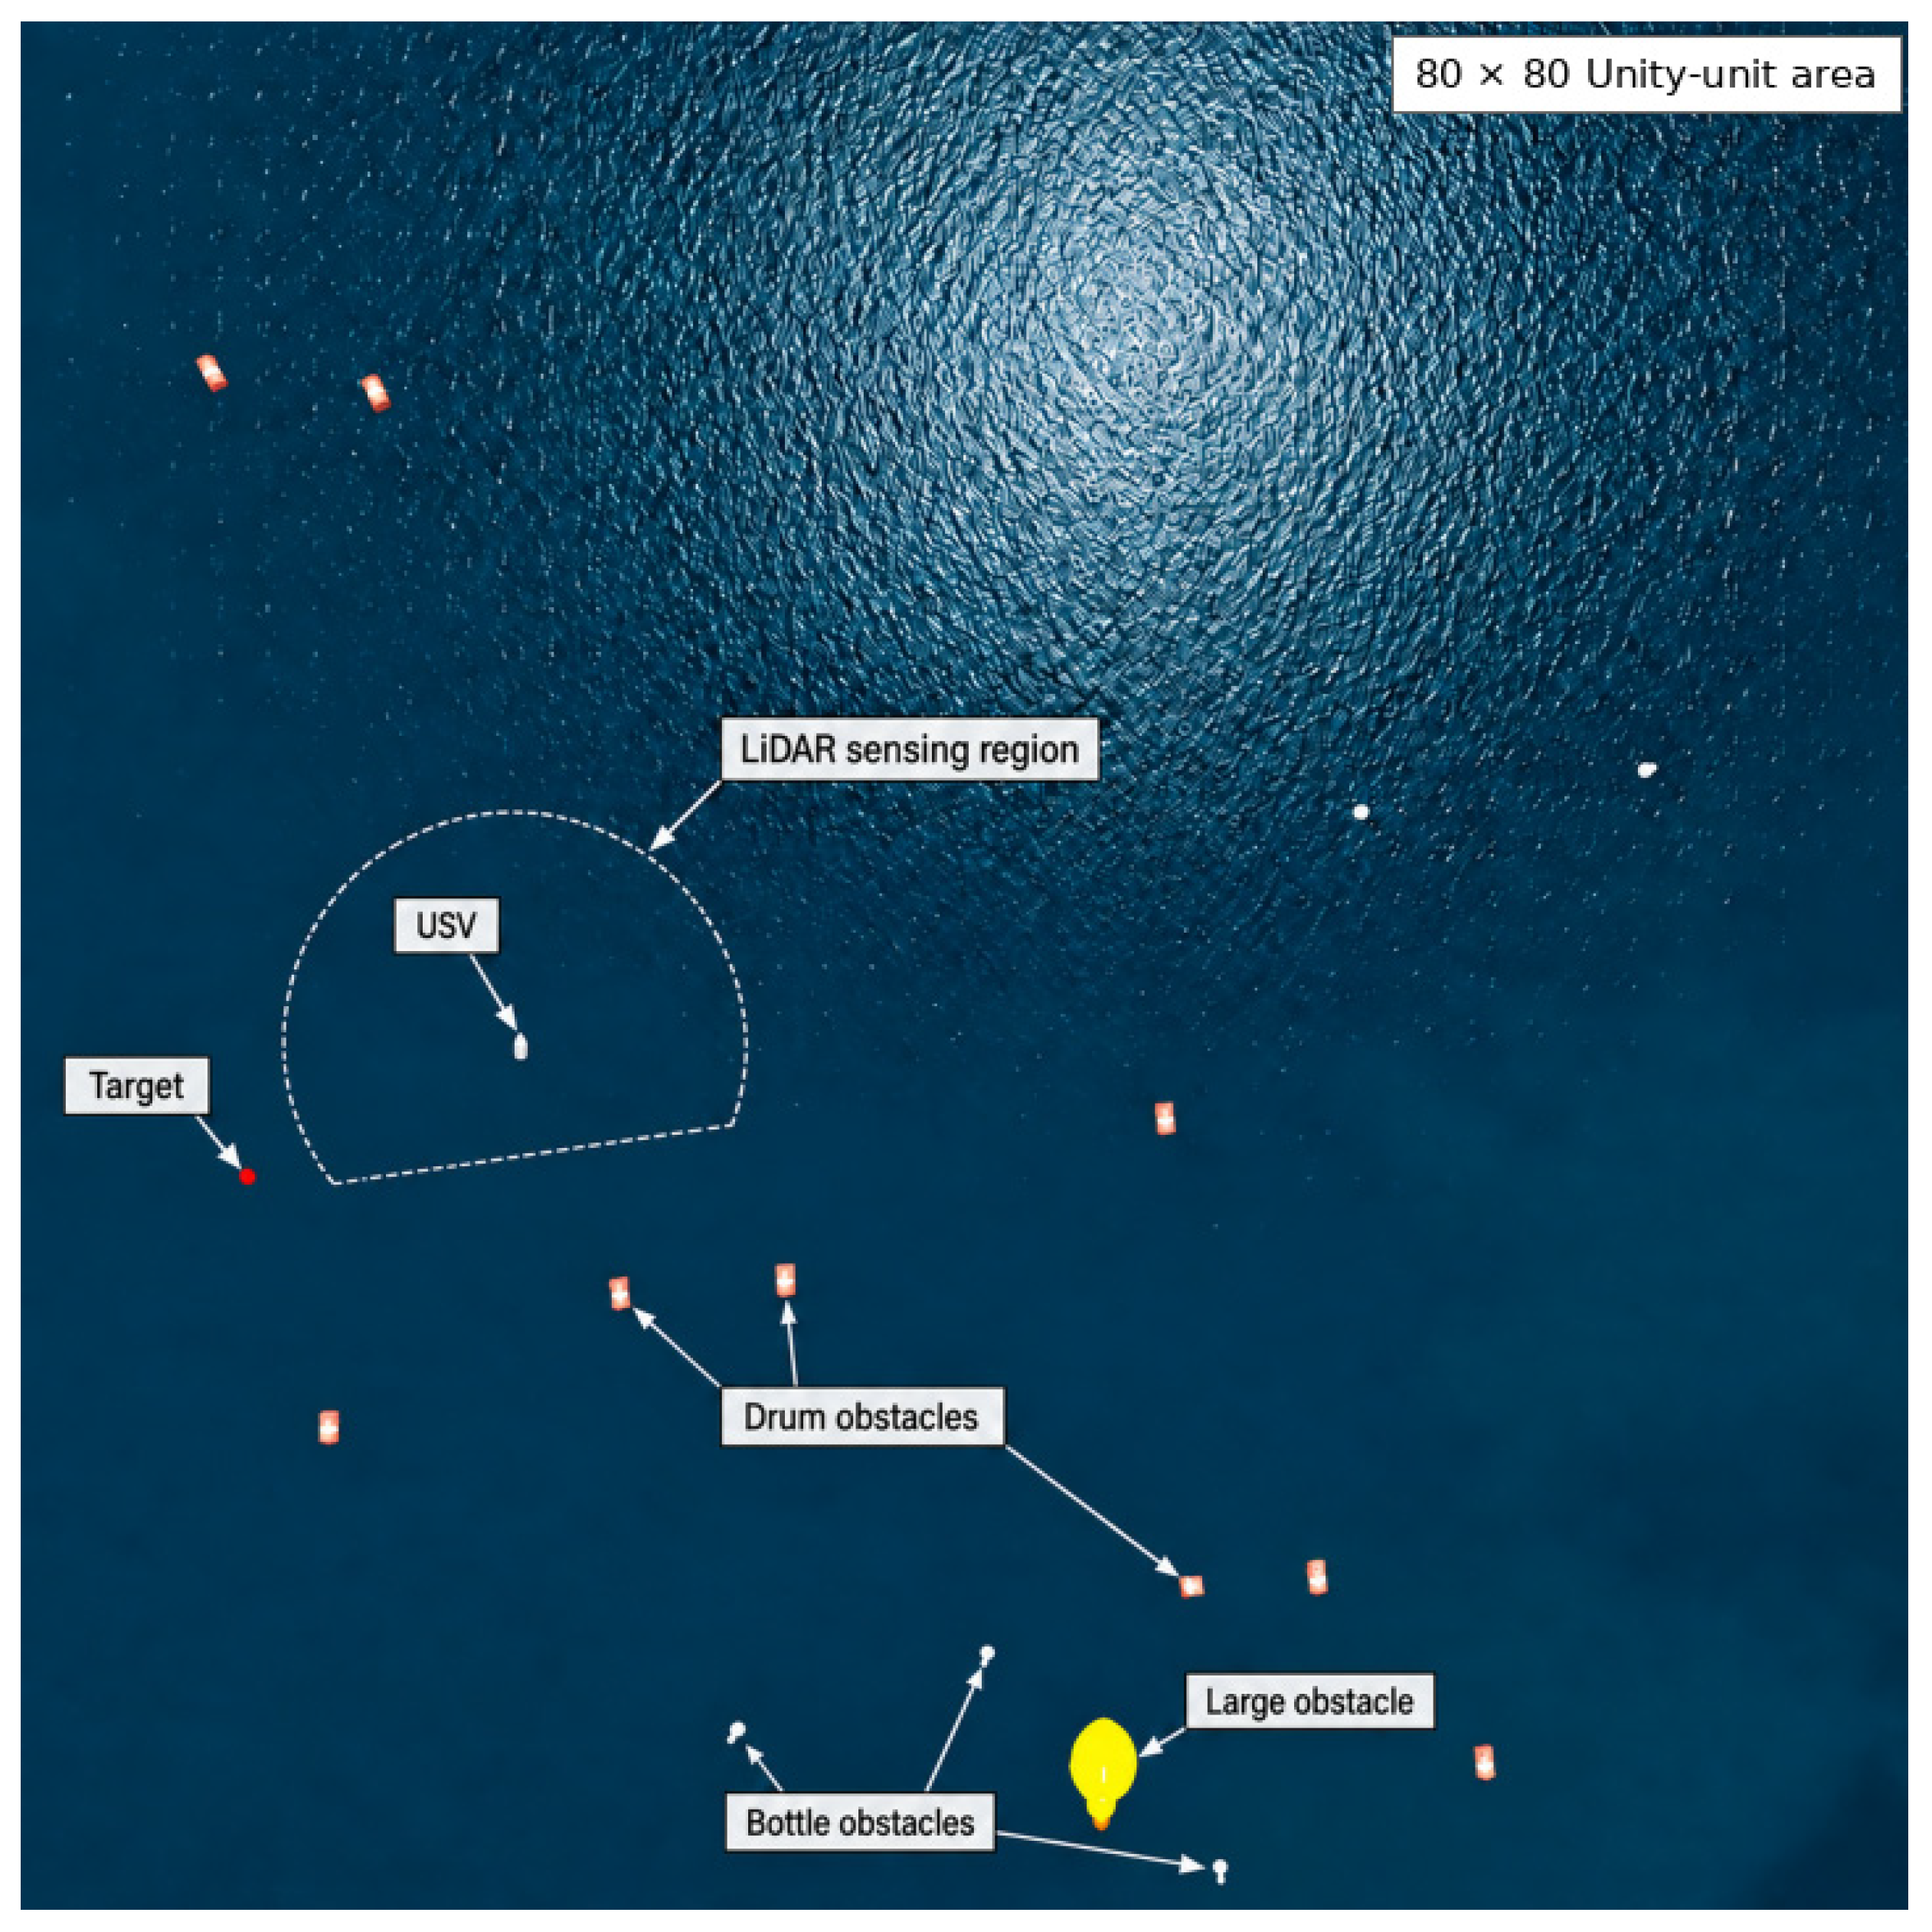
This study considers point-to-point navigation in an 80 × 80 Unity-unit constrained-water environment. In each episode, the USV and target are initialized within the valid water area, and the USV must reach the target without colliding with the water boundary or static obstacles. An episode is considered successful when the distance between the USV and target is below 1 Unity unit; a collision is considered a failure; and failure to reach the target within the maximum 4000 environment action-execution steps is recorded as a timeout. The scene uses Unity world coordinates as its internal spatial scale. Because no independent physical reference was available to establish an SI-metre calibration, distances and velocities in the revised manuscript are reported in Unity units and Unity units/s.
The simulation environment is built with Unity ML-Agents and contains an 80 × 80 Unity-unit main operating area, water boundaries, a target, the USV, a LiDAR sensor, and static geometric obstacles. At scene initialization, 15 static obstacles are randomly generated from two prefabs representing drum-like and column-like objects. Their positions are sampled within the valid region near the center of the water area while excluding a reserved central region with a radius of 12 Unity units. After generation, the obstacles remain stationary throughout the scene session, whereas the USV and target are reinitialized within valid regions according to the training or testing protocol.
The simulated task environment is shown in Figure 1. Task difficulty is represented by the initial horizontal distance between the start position and the target, which is subsequently used to organize the curriculum stages.
Figure 1.
Simulation environment for USV navigation in constrained waters. Spatial annotations are expressed in Unity world units.
2.2. Planar Motion Constraints and Simulation Assumptions
The planar motion of a nearshore USV can generally be described by three degrees of freedom: surge, sway, and yaw. Let the pose in the inertial frame be η = [x, z, ψ]T and the body-frame velocity be ν = [u, v, r]T. The planar kinematic relation is then = J(ψ)ν, where J(ψ) is the coordinate-transformation matrix determined by the heading angle ψ [31]. This relation is used to characterize the position, heading, and body-velocity constraints relevant to navigation decisions.
The Unity implementation uses a simplified rigid-body motion model. Propulsion actions apply velocity increments only along the vessel heading, with no lateral-thrust branch. Steering changes the heading, with opposite directions for right and left turns and a nominal rotation command scaled by 30°/s. The propulsion values 0.3 and 1.0 are relative multipliers of the velocity increment rather than direct speed commands. The value 1.0 used in the motion routine is an intermediate velocity-clamping threshold applied around a ForceMode.VelocityChange update and should not be interpreted as the realized maximum horizontal speed. A controlled runtime diagnostic measured a steady horizontal X–Z speed of approximately 1.381 Unity units/s under the normal-forward command, with displacement-derived peak values of approximately 1.384 Unity units/s. The control input is therefore underactuated, with propulsion and yaw channels but no direct sway control. The implementation does not explicitly solve vessel dynamics with added mass, hydrodynamic damping, or wind, wave, and current loads; consequently, the experimental conclusions concern navigation decisions in this simplified simulator rather than physically calibrated USV dynamics.
2.3. Markov Decision Process Formulation
The continuous interaction between the USV and the simulation environment is modeled as a Markov decision process (MDP), defined by the following five-tuple:
where S is the state space, A is the action space, P denotes state transitions, R is the reward function, and γ is the discount factor. A model-free reinforcement-learning approach is used; the transition-probability model is not explicitly constructed, and Unity updates the state according to the current state, control action, and environmental constraints.
M = (S, A, P, R, γ)
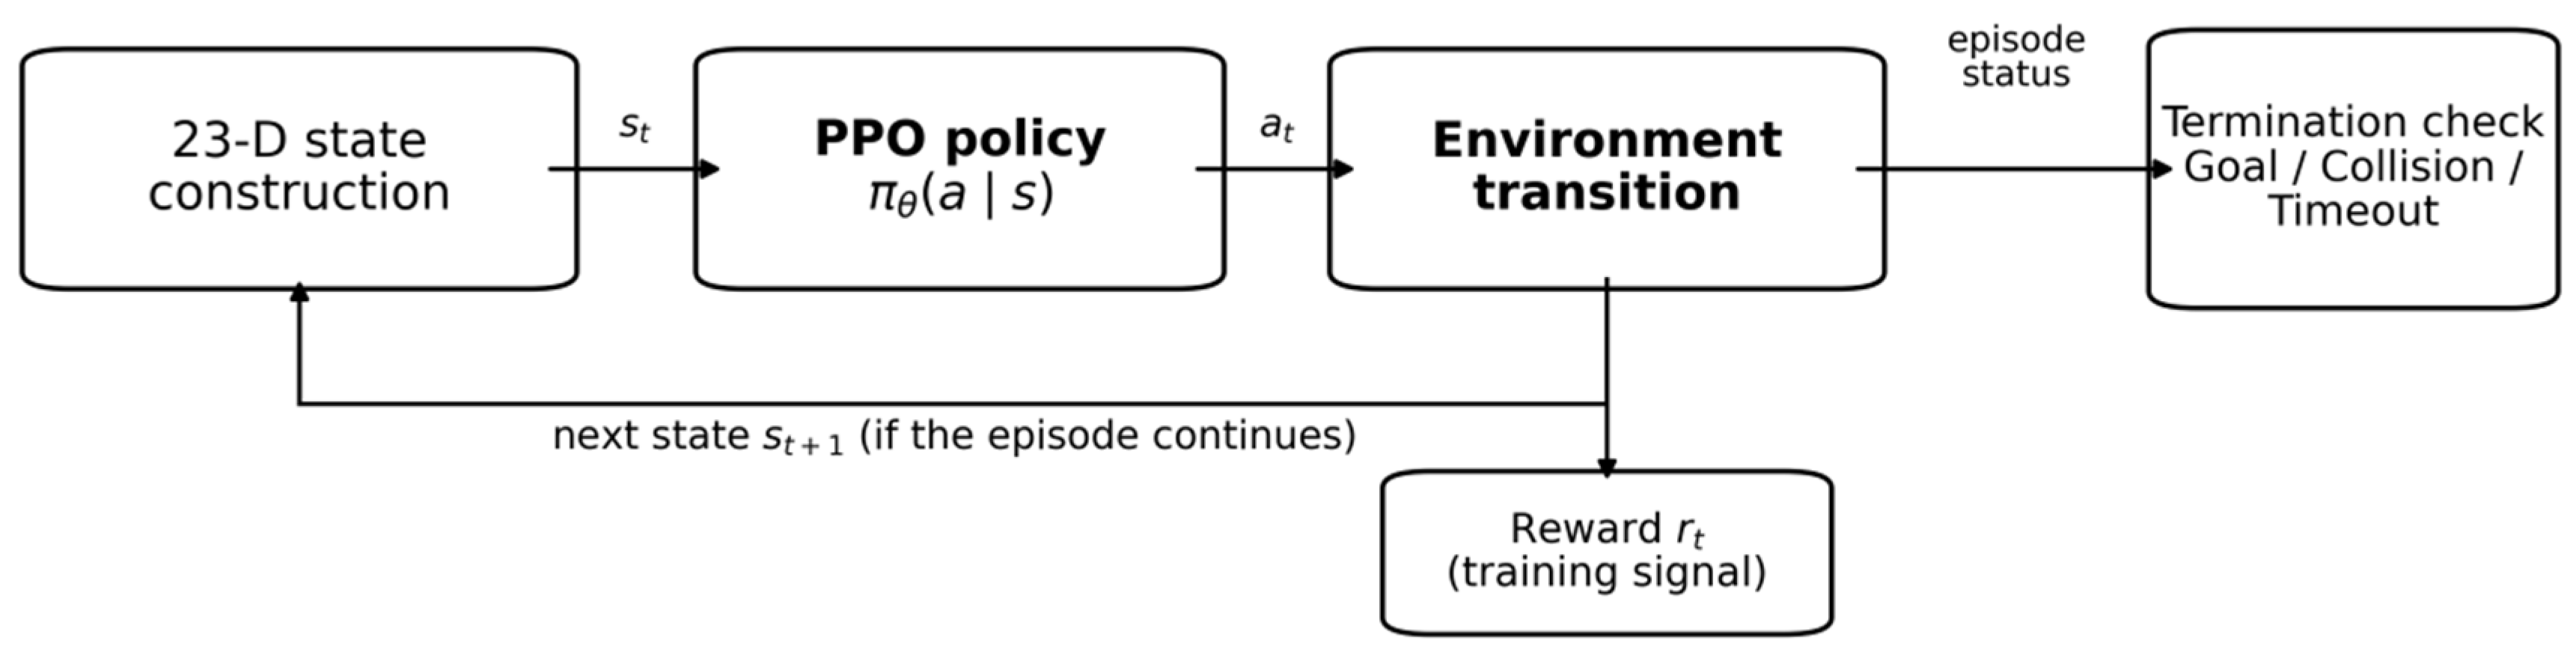
At each decision time, the Unity simulator has an internal physical/environment state, whereas the PPO policy receives only a reduced observation. For consistency with the PPO notation in Equations (1) and (2), this policy input is denoted st. It is constructed from vessel-motion information, target-relative information, and LiDAR perception and should not be interpreted as the complete Unity rigid-body/environment state. The PPO policy generates action at from st; after the environment executes the action, the simulator advances and produces the next policy observation st+1 and immediate reward rt.
where πθ(at|st) is the probability that policy π with parameters θ selects action at in state st; P denotes the state-transition kernel; and R denotes the reward function. Thus, the environment produces st+1 and rt after action at, while only st+1 is used to construct the next policy input when the episode continues.
at∼πθ(⋅∣st), st+1∼P(⋅∣st,at), rt = R(st,at,st+1)
During each episode, the USV repeatedly performs the sequence state perception-action selection-environment execution-reward feedback until the target is reached, a collision occurs, or the maximum episode length is reached. The environment is then reinitialized for the next episode.
The policy observation vector contains 23 scalar values and is a reduced representation of the simulator state. Specifically, it contains the USV speed magnitude (1; not the full velocity vector), target distance (1), lateral and forward components of the target direction in the body frame (2), normalized target-bearing angle (1), and 18 grouped LiDAR-distance features (18). The previously executed action is not included in this observation vector.
The speed term describes the current motion state, while target-relative information provides distance, body-frame direction, and bearing information. The LiDAR sensor is configured in Unity at 20 Hz with a minimum range of 0.1 Unity units, a maximum range of 15 Unity units, and Gaussian Noise Sigma = 0.05. The Single_line rotating scan contains one horizontal layer with 360 azimuth samples. The scan generator maps sample index i ∈ {0, …, 359} to an azimuth of 360° i/360; with the configured clockwise (CW) rotation, index 0 is aligned with the sensor local forward (+z) direction and subsequent indices advance clockwise in approximately 1° increments, covering a complete horizontal revolution. The VelodyneSensor implementation creates RaycastCommand queries without an explicit semantic object mask or custom layer mask, so LiDAR returns are collider-based under Unity’s default raycast query configuration rather than filtered by object class. The static obstacles and water-boundary/coastline wall colliders are therefore sensed through the same raycast mechanism when they participate in the raycast query. For each ray, Gaussian noise is added to the hit distance; a return is retained only when the resulting distance lies within 0.1–15 Unity units. Missing, invalid, too-near, or out-of-range returns are encoded as the configured maximum range (15 Unity units), with zero intensity for invalid returns. During policy-observation construction, the minimum distance within each consecutive group of 20 raw LiDAR samples is used to form 18 local distance features. Each feature is divided by the fixed factor 50 and clipped to [0, 1] before being passed to the policy network. Thus, 50 is an input-scaling constant used consistently in training and evaluation and is not the LiDAR physical maximum range; with the configured sensor range, the scaled LiDAR values lie primarily between approximately 0.002 and 0.30.
The task is formulated as an MDP at the environment level. However, the implemented action-smoothness reward also depends on the previously executed action, while that previous action is not separately included in the 23-dimensional policy observation. Therefore, the policy observation is not strictly Markov with respect to the reward calculation; this implementation detail is retained for reproducibility and is treated as a limitation.
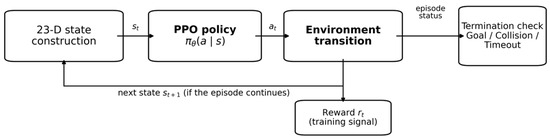
The policy-observation construction, policy decision, environment transition, and reward feedback form the interaction loop shown in Figure 2. After action at is executed, the environment returns the next policy observation st+1 and reward rt. The reward is a training signal, whereas if the episode continues, only st+1 is used to construct the next policy input.
Figure 2.
Interaction structure of the Markov decision process. The 23-D state-construction block in the schematic denotes the policy observation used by PPO, not the complete internal simulator state.
2.4. Action-Space Design
A two-branch discrete combined action space is used, separating USV control into propulsion and steering branches. At each decision time, one propulsion action and one steering action are selected and combined into the final control command:
The propulsion branch contains slow-forward and normal-forward actions, while the steering branch contains straight, right-turn, and left-turn actions:
The complete action space is the Cartesian product of the two branches:
A = Av × Aδ, Av = {0,1}, Aδ = {0, 1, 2}
The two branches form six possible propulsion–steering combinations, but they remain two discrete action branches in the Unity ML-Agents/Gym interface rather than being collapsed into a single six-class categorical action. PPO therefore produces branch-wise categorical action probabilities for the two-valued propulsion branch and the three-valued steering branch, and the executed control command is the Cartesian-product combination of the selected branch values. The minimum propulsion action is slow forward rather than a complete stop, reducing the possibility that the policy avoids collision penalties simply by remaining stationary.
3. PPO-Based USV Obstacle-Avoidance Framework
3.1. PPO Training Framework
PPO is based on an actor-critic architecture and improves training stability by clipping the probability ratio between the updated and previous policies, thereby constraining policy-update magnitude [15]. The policy network takes the 23-dimensional observation as input, uses two hidden layers with 64 units each, and outputs branch-wise action probabilities for the two-valued propulsion branch and the three-valued steering branch. The value network uses the same 64-64 hidden-layer structure and outputs the state value.
The PPO controller after observation, action, and reward adaptation is defined as the Baseline. Baseline and Curriculum use the same policy observation, action space, reward, network architecture, and PPO hyperparameters; they differ only in the organization of training tasks. The Safety Shield is an independent runtime module that can be enabled when needed. Thus, the subsequent comparisons isolate two incremental factors: whether distance-staged curriculum learning is used and whether execution-stage filtering is enabled.
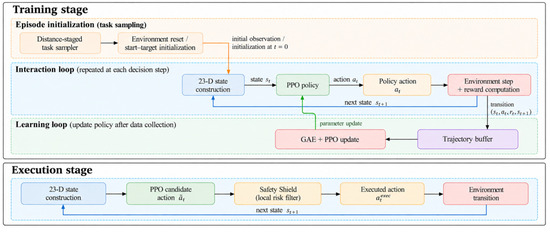
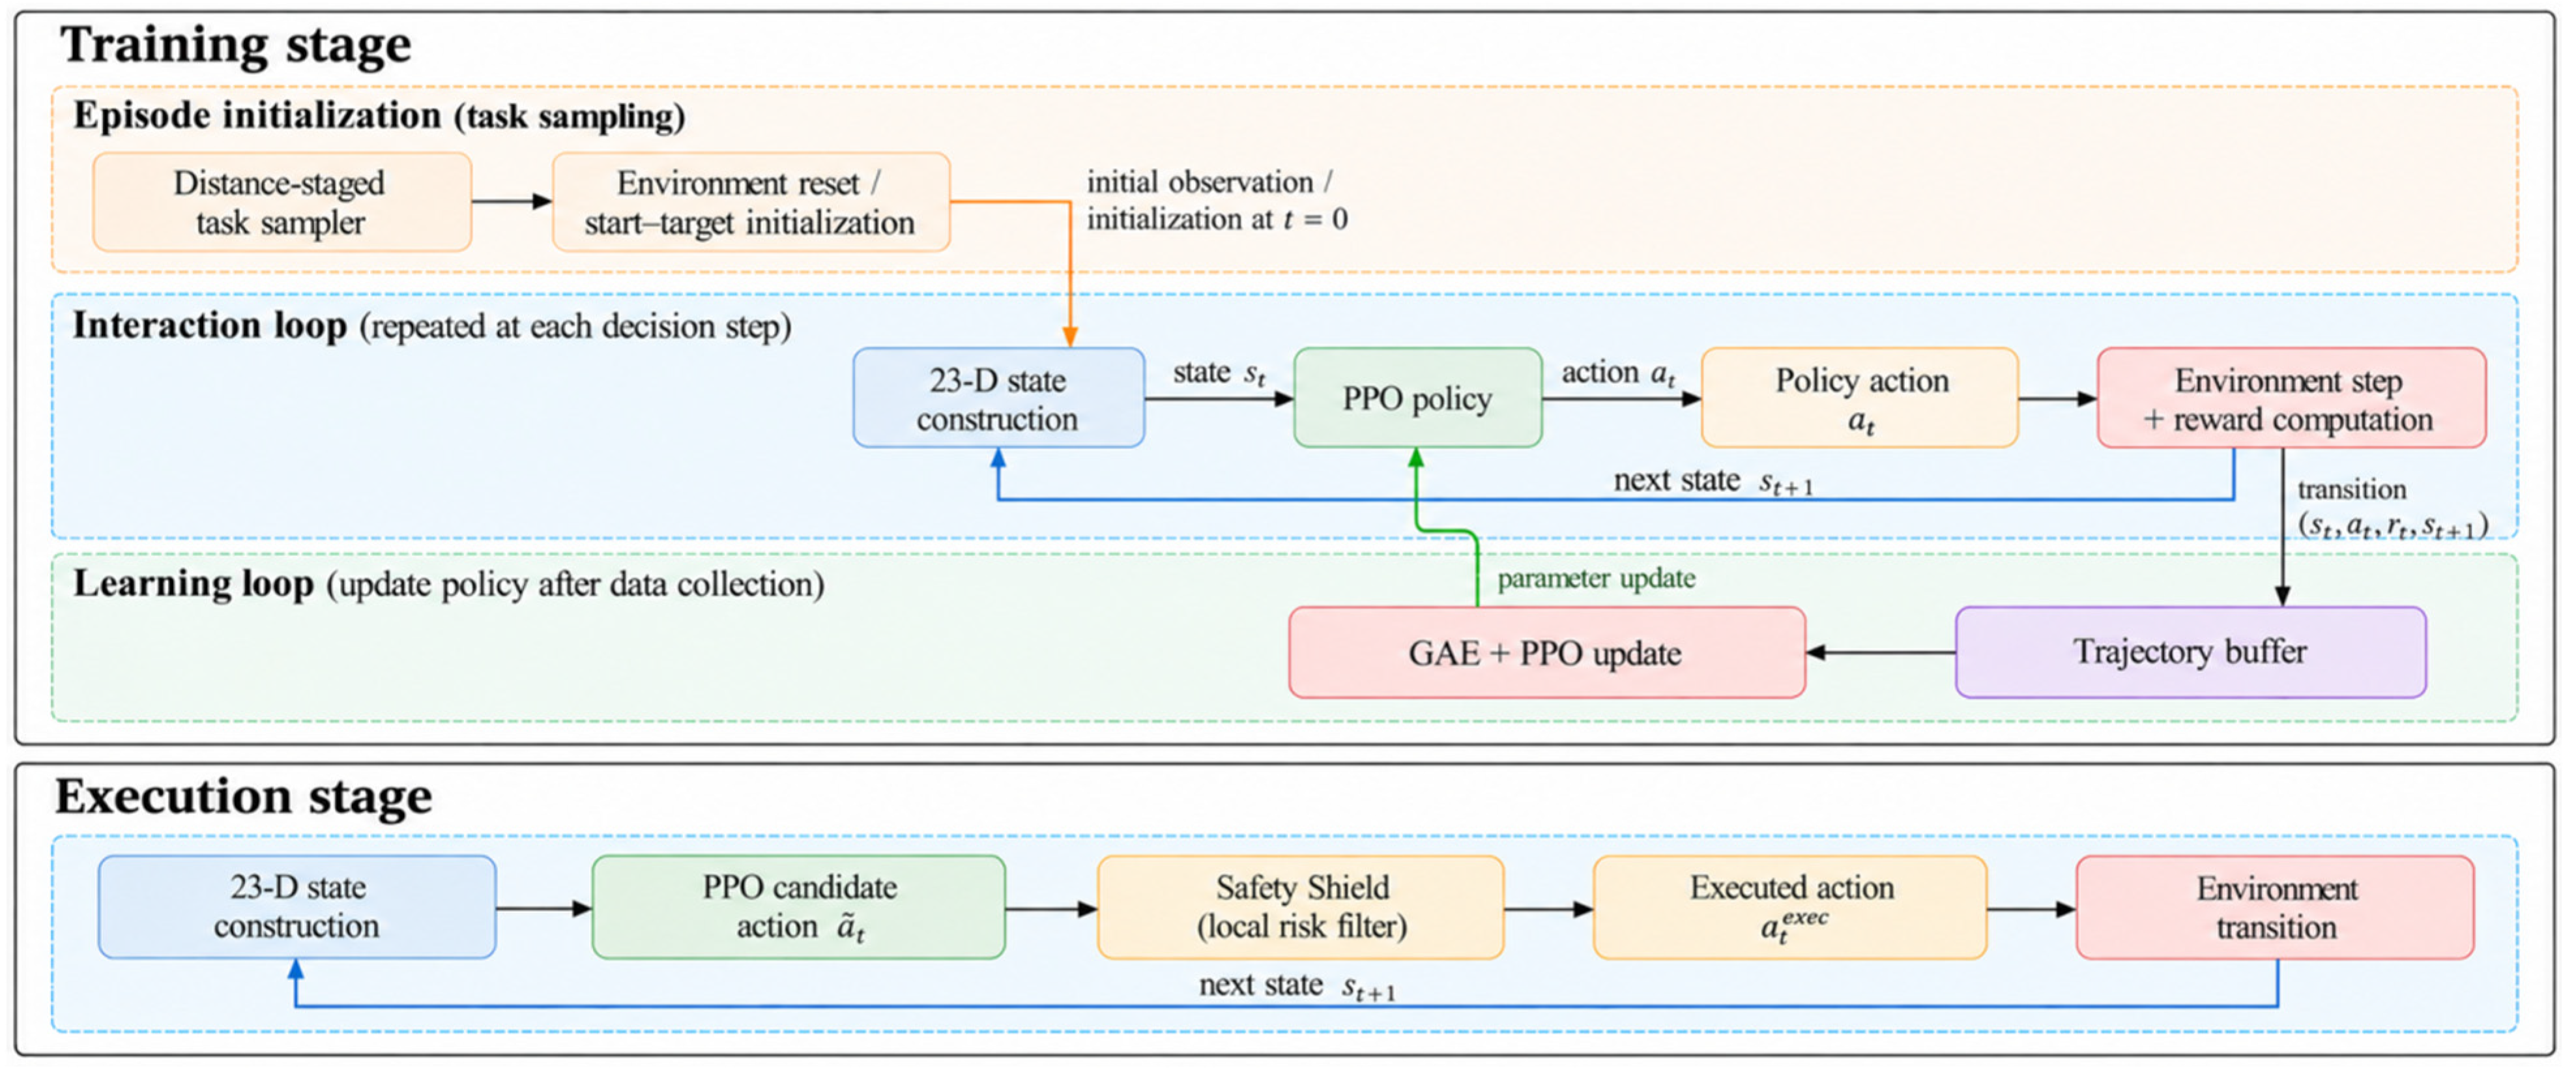
Figure 3 summarizes the overall workflow. During training, tasks are organized according to the initial target distance, and PPO updates the policy through environment interaction. During execution, the Safety Shield can be inserted between the policy output and the environment to modify locally high-risk actions.
Figure 3.
Overall PPO-based USV navigation framework with distance-staged curriculum learning and a Safety Shield. The Safety Shield is used only during execution and is excluded from PPO training.
3.2. Task-Oriented Reward Design
USV obstacle avoidance simultaneously involves target approach, safety constraints, and motion stability. Terminal rewards alone provide insufficient training feedback. Therefore, a task-oriented dense reward is used by combining terminal rewards with step-wise signals for distance change, heading alignment, time, low speed, and action smoothness, as expressed in Equation (6).
The first two terms are the goal reward and collision penalty. The distance-difference and target-angle cosine terms provide approach and directional guidance, whereas the time, low-speed, and action-change terms discourage unnecessary delay, low-speed stagnation, and frequent action switching. The implementation uses a +50 goal reward, a −50 collision penalty, a distance-change weight of 0.5, and a heading-alignment weight of 0.02. Each Unity action-execution step incurs a −0.01 time penalty; selecting slow forward before reaching the target incurs an additional −0.01 low-speed penalty; and the action-change smoothing weight is 0.01. For propulsion index m ∈ {0, 1} and steering index s ∈ {0, 1, 2}, the implemented smoothing term is rsmooth = −0.01[|mt − m(t−1)| + |st − s(t−1)|/2]/2. Because the steering categories are represented by numeric indices, the penalty is index-dependent: with propulsion unchanged, straight ↔ right gives −0.0025, straight ↔ left gives −0.0050, and right ↔ left gives −0.0025. This original implementation is retained for reproducibility and its encoding dependence is acknowledged as a limitation. The propulsion multipliers for slow and normal forward motion are 0.3 and 1.0, respectively.
The reward design is identical for Baseline and Curriculum and serves as the shared task-adaptation basis for both training strategies. Because the reward formulation itself is not subjected to a separate ablation, the subsequent experiments evaluate only the incremental effects of curriculum-based task organization and runtime shielding.
3.3. Distance-Staged Curriculum Learning
When training directly on the full random task distribution, the agent can encounter difficult samples early in training, leading to frequent collisions and insufficient useful feedback. To examine how easy-to-hard task organization affects the learned policy, a distance-staged curriculum is used, with the initial start-to-target distance as the task-difficulty measure and progressively expanded distance ranges across training stages [19].
The task difficulty and sampling distribution in curriculum stage k are defined as:
where d0 is the Euclidean distance between the USV and target at task initialization; Ωk is the task set at stage k; Lk and Uk are the lower and upper distance bounds of that stage; and ρk denotes the uniform sampling distribution over Ωk.
θk = PPO(θk−1; ρk), k = 1,2,⋯,5
Policy parameters are transferred progressively across stages according to:
The policy parameters obtained in one stage initialize the next stage, enabling continuous transfer from short-distance to long-distance tasks. The five distance ranges are 5–30, 20–50, 50–80, 70–120, and 5–120 Unity units. Here, 120 Unity units is a nominal sampling upper bound rather than a guaranteed realizable start-to-target distance. Because the start and target are constrained to the finite 80 × 80 Unity-unit operating region, the feasible horizontal distance is naturally limited by the scene geometry; accordingly, the 80–120 interval represents the longest-distance portion of the feasible task distribution. The final stage restores the complete distance range so that tasks of different difficulty levels are jointly represented. Adjacent stages overlap in distance to reduce abrupt distribution changes while progressively introducing longer-range samples. This setup follows the general easy-to-hard principle of curriculum learning [19,20,21]. The specific stage boundaries form a reproducible engineering curriculum and were not selected through a global parameter search; no claim is made that they are optimal. Baseline and Curriculum both use the same total training budget of 1.2 × 10⁶ steps.
3.4. LiDAR-Based Safety Shield Action Modification
The Safety Shield is positioned between the policy output and environment execution and does not participate in policy-network training. Unlike the collision penalty in the reward, which acts as a training-side soft constraint through the optimization objective, the Shield directly overrides a candidate action after detecting local forward risk and therefore constitutes an action-level hard modification during execution. It uses LiDAR ranges to estimate the locally available space in the forward, front-left, and front-right sectors. When the nearest forward obstacle is below a threshold, the propulsion action is changed to the slow-forward/reduced-propulsion branch and the vessel is turned toward the side with more available space. The placement of an action-correction filter between policy output and execution is consistent with runtime-shielding architectures [24,25,26], although our LiDAR-threshold rule is heuristic rather than a formally verified shield. Here, hard modification means only that the action is forcibly replaced; it does not imply a formal safety guarantee based on safe-set invariance or a physical braking actuator.
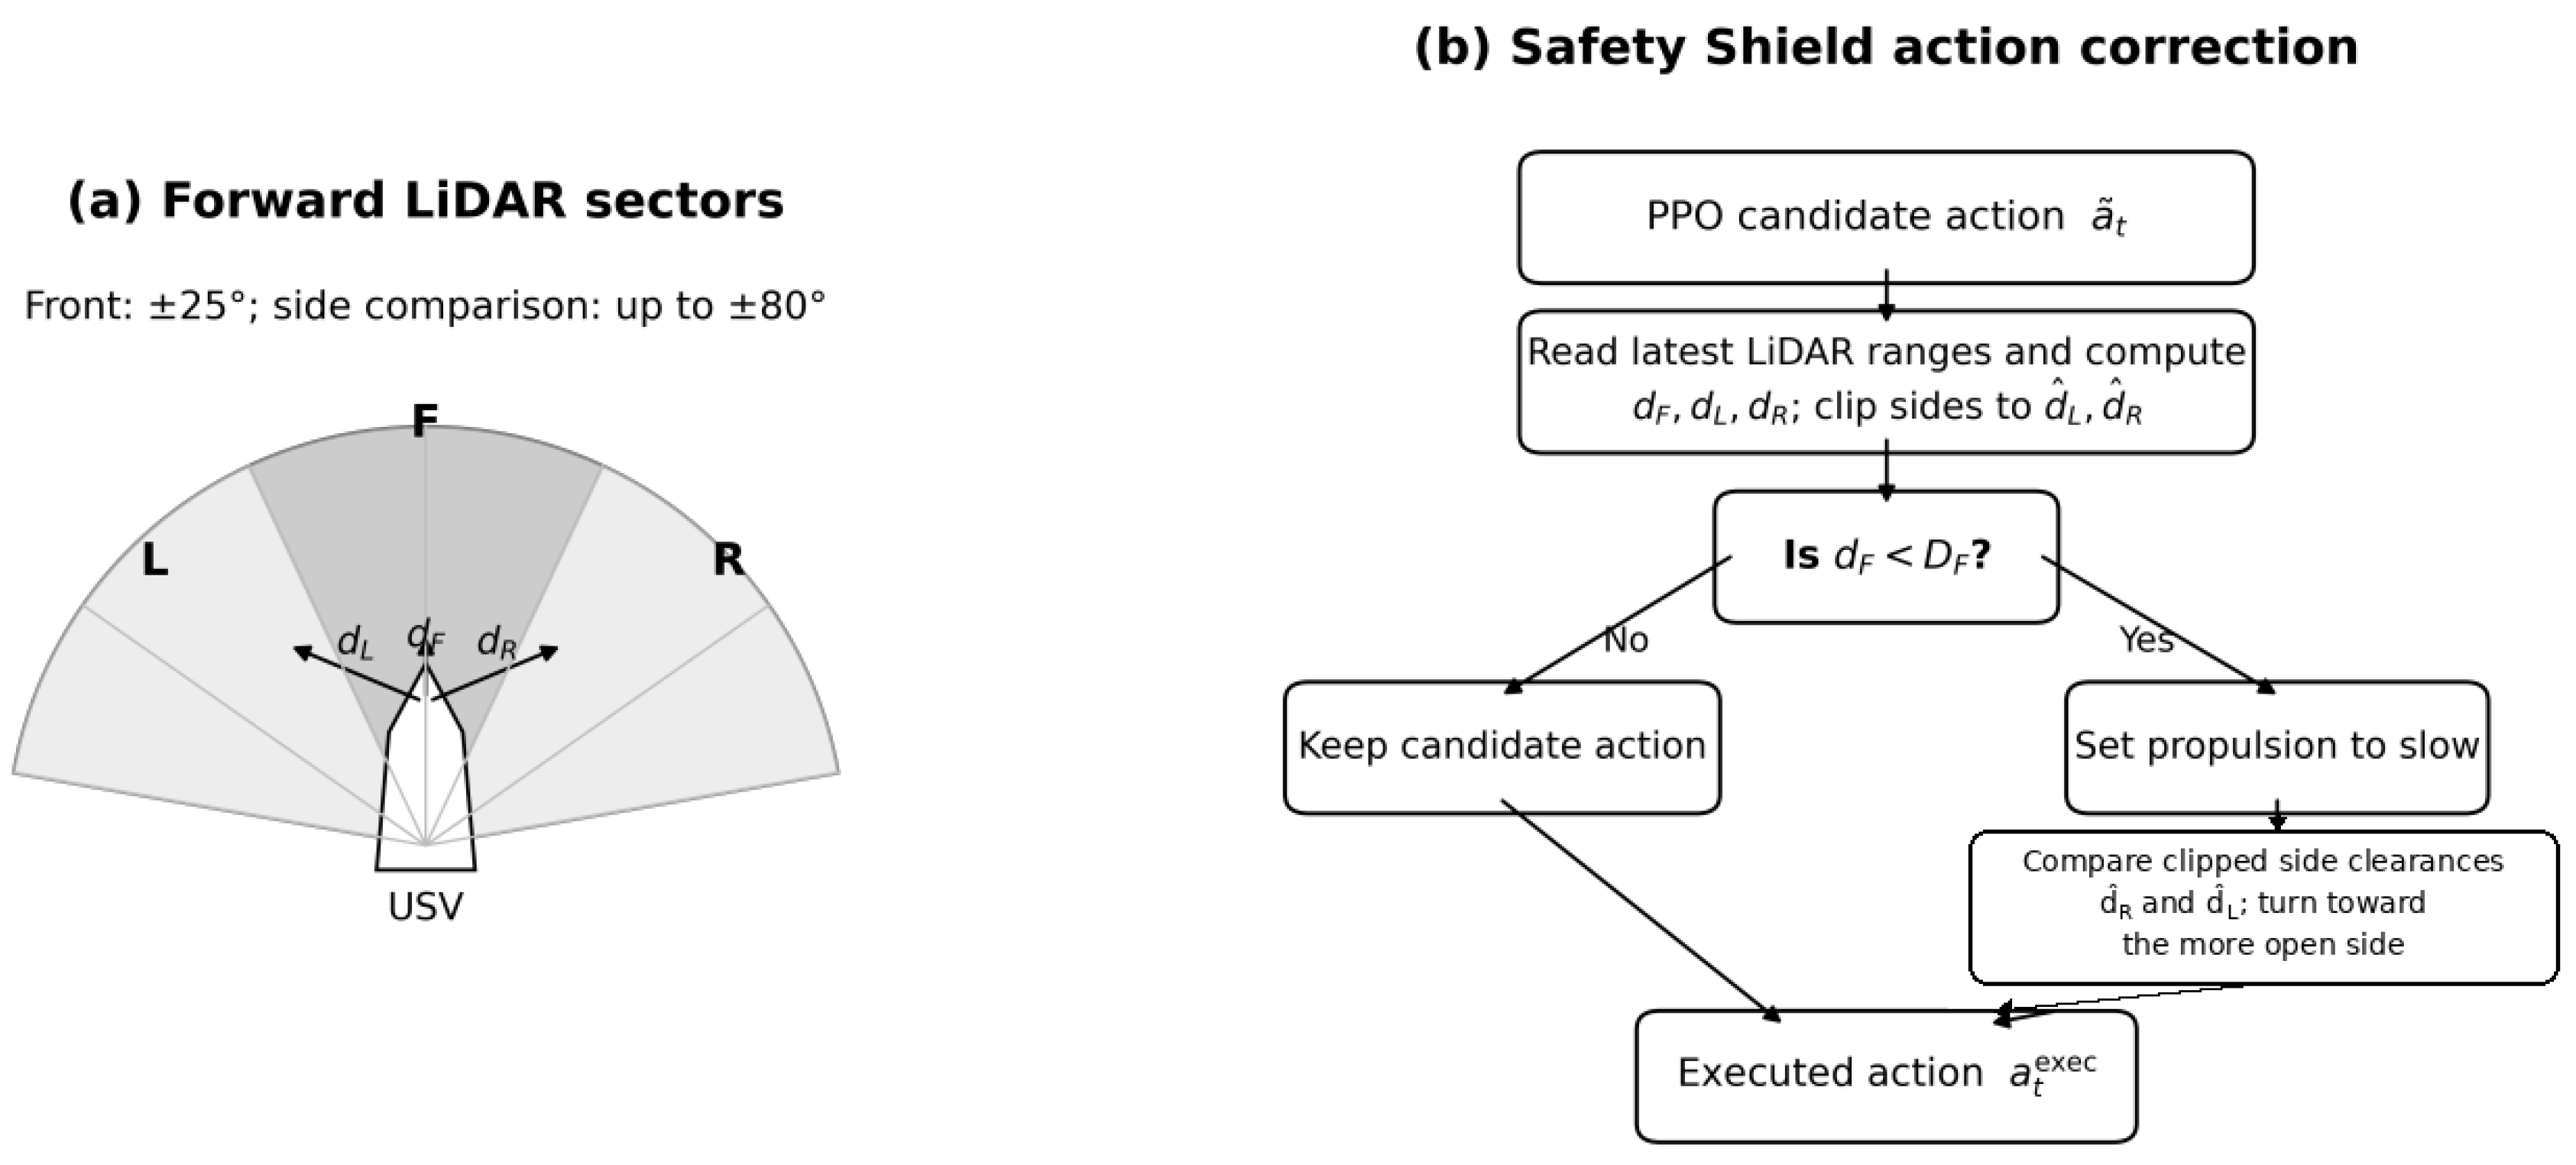
Here, F, L, and R denote the LiDAR-ray index sets for the forward, front-left, and front-right sectors, respectively, and the corresponding sector distances are the minimum valid LiDAR returns. In the implementation, each side-clearance value is initialized at the side threshold Ds and updated only when a smaller valid return is observed; this is equivalent to the clipped side clearances defined in Equations (9) and (10). PPO first produces a candidate action. If the forward clearance is not below the trigger threshold DF, the candidate action is retained. Otherwise, slow-forward motion is enforced, and steering is selected by comparing the clipped right- and left-side clearances, exactly matching the runtime implementation.
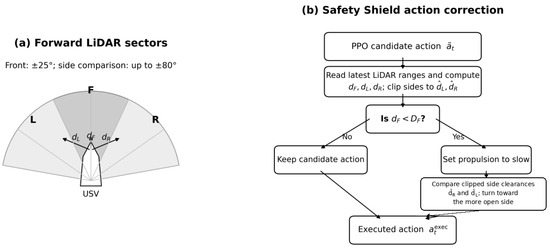
To illustrate the local-risk distance calculation and candidate-action modification, the forward LiDAR sensing region is divided into front-left, forward, and front-right sectors, as shown in Figure 4.
Figure 4.
LiDAR sector definition and Safety Shield action-modification rule.
As shown in Figure 4, the Safety Shield defines ±25° around the bow as the forward-risk sector and uses the regions out to ±80° as side-comparison sectors. When the minimum forward distance falls below 3.0 Unity units, the propulsion action is changed to slow-forward motion, and the vessel turns toward the side with the larger clipped clearance within the 6.0-Unity-unit comparison range. The values 3.0 and 6.0 Unity units are fixed engineering parameters rather than globally optimal settings. A controlled obstacle-free runtime diagnostic showed that the slow-forward branch reduced steady horizontal speed from 1.381 to 1.100 Unity units/s, corresponding to a 20.3% reduction; therefore, this action is described as reduced propulsion rather than braking. To examine the effect of the forward trigger distance, Section 4.2.7 varies DF from 2.0 to 4.0 Unity units while keeping DS = 6.0 Unity units and the sector angles unchanged. The rule modifies only the executed action, does not participate in network updates, and includes no steering hold or hysteresis; it therefore provides local risk suppression rather than a formal safety guarantee.
4. Results and Discussion
4.1. Experimental Setup
The environment was developed in Unity 2022.3.62f3c1 with Unity ML-Agents 2.0.2, with Unity handling simplified rigid-body motion, obstacle collision detection, and LiDAR sensing [32]. Reinforcement-learning training and evaluation were conducted with Python 3.8.20 using Stable-Baselines3 2.1.0, PyTorch 2.0.1 + cu118, mlagents 0.26.0, mlagents-envs 0.26.0, NumPy 1.21.2, and Gym 0.26.2; PPO training and inference were implemented with Stable-Baselines3 [33]. The training workstation used an NVIDIA GeForce RTX 5060 Laptop GPU (8 GB graphics memory) (NVIDIA Corporation, Santa Clara, CA, USA). Baseline and Curriculum were trained on the same fixed obstacle seed, 20260903, with 15 static obstacles. Fixing the training layout controlled environmental geometry as a potential confounder so that the difference between the two training strategies was primarily due to task organization; adaptation to geometry changes was evaluated separately on eight obstacle layouts not used during training. The formal fixed-stratified test reused the training layout and restored obstacle poses and rigid-body states before each episode. Baseline, Curriculum, Baseline + Shield, and Curriculum + Shield used the same fixed starts, targets, and obstacle layout, and policy inference used deterministic = True. Baseline and Curriculum had identical state spaces, action spaces, network architectures, and PPO parameters and differed only in training-task organization. The Safety Shield did not participate in network training and was enabled only during test-time execution when required. The fixed-layout test is therefore used as a controlled paired comparison of incremental method effects, whereas the unseen-layout tests assess sensitivity to obstacle-geometry changes and the independent training repetitions assess sensitivity to training randomness.
According to the final saved models and training scripts, both the policy and value networks use two 64-unit hidden layers, the policy-observation dimension is 23, and the discrete action branches have sizes 2 and 3, yielding six possible propulsion–steering combinations. The main training parameters are listed in Table 1.
Table 1.
Main PPO training parameters.
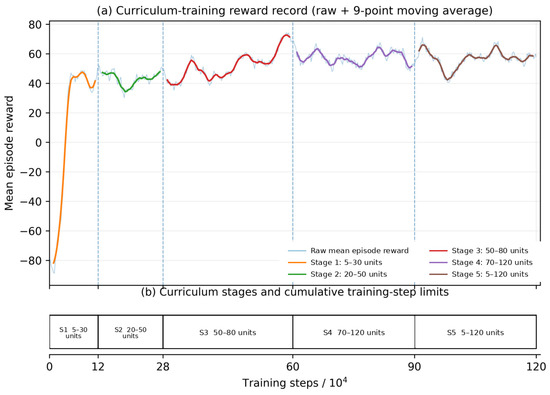
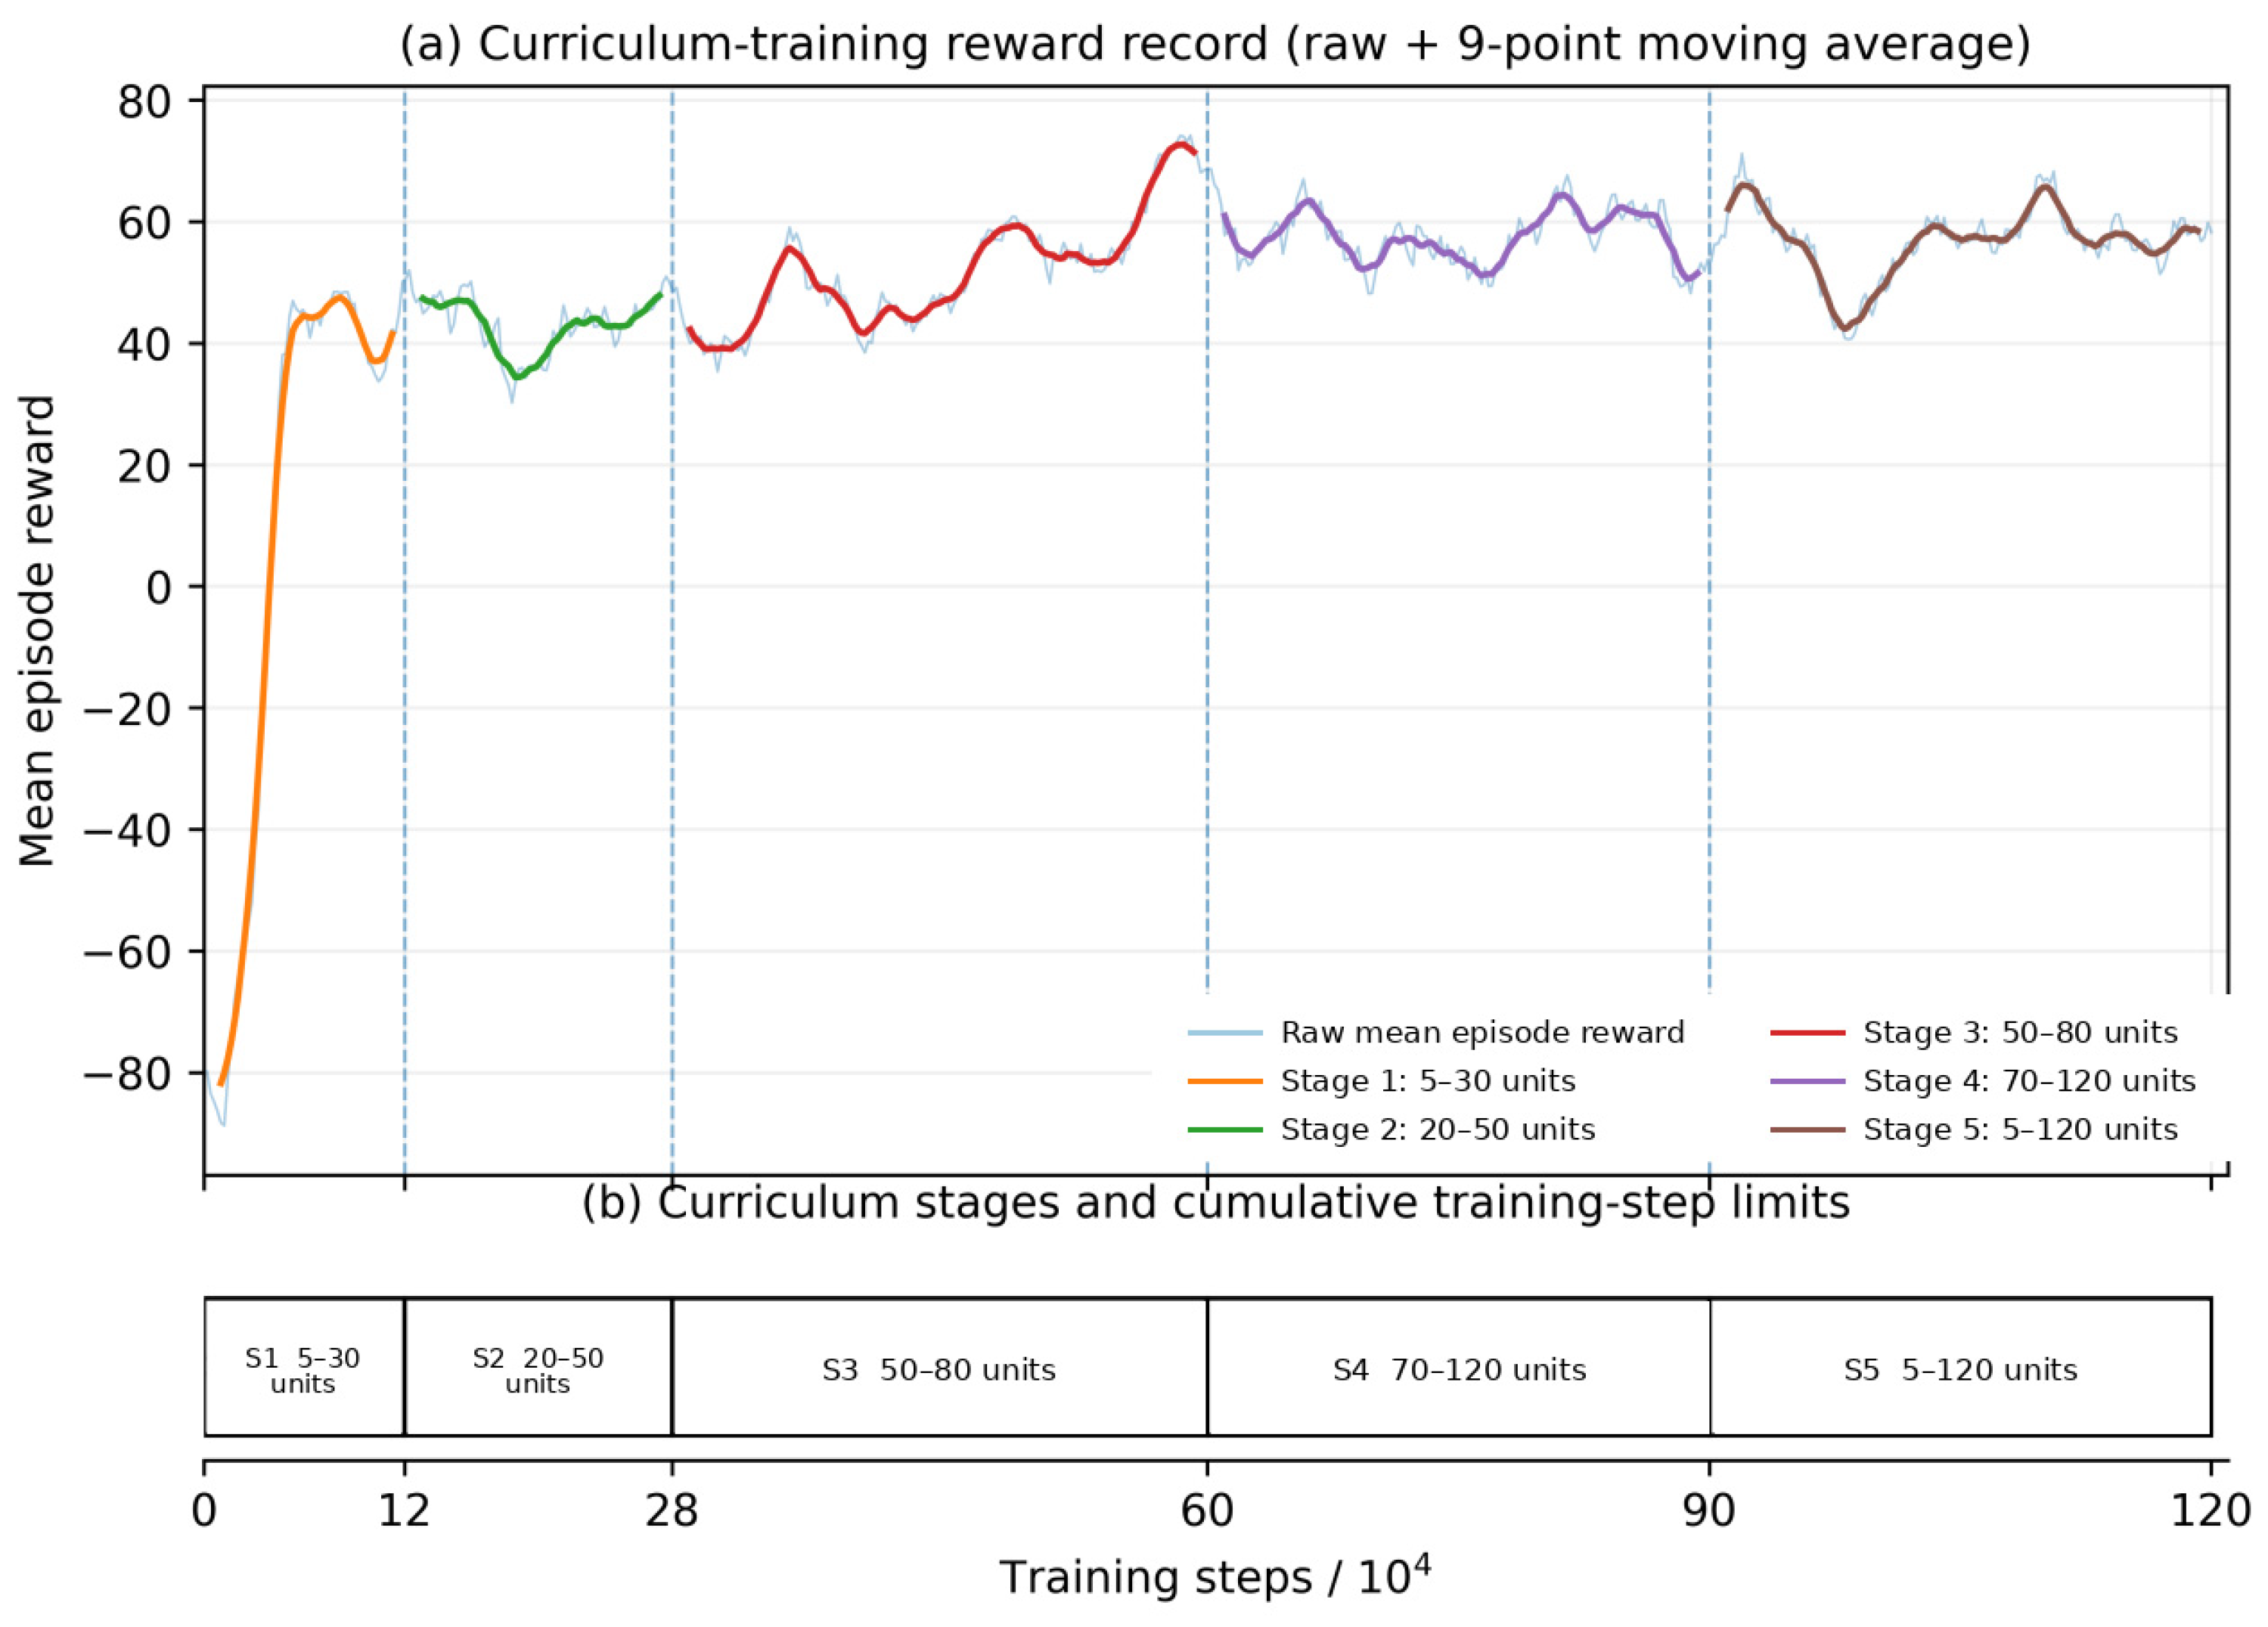
Curriculum training is organized into five stages based on the initial start-to-target distance. The cumulative training-step limits are approximately 0.12, 0.28, 0.60, 0.90, and 1.20 million steps, corresponding to distance ranges of 5–30, 20–50, 50–80, 70–120, and 5–120 Unity units. Policy parameters are carried forward from one stage to the next. The complete training record is shown in Figure 5. The thin gray line denotes the raw mean episode reward, colored curves show a stage-wise nine-point moving average, and dashed vertical lines mark stage transitions. Because the task-distance distribution differs across stages, Figure 5 is intended to document the curriculum-training process rather than to compare absolute reward values between stages.
Figure 5.
Training rewards and curriculum-stage schedule for distance-staged curriculum learning: (a) training reward curve (raw record and 9-point moving average); (b) curriculum stages and cumulative training-step limits. Distance labels denote Unity world units.
Evaluation comprises fixed-stratified, natural-random, and unseen-obstacle-layout tests. The original formal fixed-stratified test contains 250 episodes in each of four initial-distance bins (5–20, 20–50, 50–80, and 80–120 Unity units), giving 1000 paired tasks. The original four configurations use the same case IDs, start positions, targets, and obstacle layout, including deterministic repair of a small number of initial geometric-contact cases. Natural-random evaluation uses 1000 episodes; eight unseen layouts use 64 cases each (512 map–task combinations per policy). To examine training variability, additional Baseline and Curriculum policies were trained with seeds 101 and 202 under the same training budget. The seed-101/202 policies were also re-evaluated on 18 October 2026 in four 1000-case Shield-OFF/ON pairs, producing 8000 episode-level records. The evaluation launcher (eval_multiseed_shield_pair_repro1018.py) specifies the following model and Shield order: Baseline seed 101 (runs 1/2, OFF/ON), Curriculum seed 101 (3/4), Baseline seed 202 (5/6), and Curriculum seed 202 (7/8); the submitted-original LiDAR validity rule was used in this evaluation. For each model index m = 0, 1, 2, or 3 and case_id, the launcher assigns the nominal noise seed as 1 + ((617,281 + 100,003 × m + 37 × case_id) modulo 15,000,000). Every one of the 8000 episode records matches this seed formula, the OFF/ON run assignment, and original-filter mode. Seed agreement establishes reproducible case-wise seed assignment, but not equality of the LiDAR samples actually observed during different trajectories. All conditions within each OFF/ON pair share the recorded case ID, start/target coordinates, distance bin, and noise seed. However, the replay is not strictly identical across different trained policies: one case (ID 466) has a different start position for the first policy pair. Accordingly, within-policy OFF/ON comparisons remain matched, whereas cross-policy case identity should not be interpreted as perfect for that case.
Each test episode terminates when the target is reached, a collision occurs, or the maximum 4000 action-execution steps are reached. A target distance below 1 Unity unit is counted as success; contact with an obstacle or the water boundary is counted as a collision failure; and reaching the maximum step count without success is counted as a timeout. Let the total number of episodes be N, with Ns, Nc, and Nt denoting the numbers of successful, collision, and timeout episodes, respectively. The corresponding rates are calculated using Equation (12).
Unity uses a Fixed Timestep of 0.02 s, corresponding to a 50 Hz physics and action-execution rate. The Decision Requester uses Decision Period = 5 with Take Actions Between Decisions enabled. Therefore, the PPO policy generates a new action every five physics steps, giving a decision interval of 0.10 s or 10 Hz, while the most recent policy action is reused between new decisions. The Safety Shield is located in the ML-Agents action-execution callback and rechecks the candidate action at every Unity action-execution step using the currently available LiDAR ranges. When the trigger condition is met, the action is overridden. Thus, Shield checks and override counts are defined on the 50 Hz execution timescale rather than the 10 Hz new-policy-decision timescale. The LiDAR sensor itself updates at 20 Hz. The Unity/C# side uses at most 4000 environment action-execution steps per episode, corresponding to 80 s of simulated time and at most 800 new policy decisions. Throughout this paper, decision steps refer only to new actions actually produced by the Python policy. Trigger rate denotes the proportion of episodes with at least one Shield override, whereas override count records the number of actual action replacements on the 50 Hz execution timescale; neither quantity is mixed with the policy decision-step count.
Retained evaluation logs provide an additional feasibility check: successful episodes with initial start-to-goal separations of 100.658 and 100.982 Unity units were completed within approximately 3769–3801 execution steps. These episode-level records are consistent with the measured runtime horizontal speed and the 80-s episode horizon. Full per-frame trajectories were not retained for every original run, so the feasibility check combines the retained episode logs with the controlled displacement-based runtime diagnostic.
Decision-step counts are analyzed only on matched cases solved by both compared policies. Success and collision rates are reported with Wilson 95% confidence intervals. In the original formal evaluation, paired success differences are assessed by two-sided exact McNemar tests and 95% confidence intervals from 10,000 paired bootstrap replicates. For the four later Shield-OFF/ON seed-101/202 re-evaluations, we reconstruct outcomes from the episode-level categorical reason field and compute exact McNemar tests on success versus non-success. The paired success-rate and collision-rate differences (ON minus OFF) are accompanied by 95% percentile intervals from 12,000 bootstrap replicates, with resampling performed within each of the four fixed distance strata (250 matched cases per stratum). Thus, the confidence intervals describe evaluation-case sampling uncertainty conditional on the trained policy, not the uncertainty across arbitrary training seeds. Jointly successful decision-step counts in the original experimental protocol are compared using two-sided Wilcoxon signed-rank tests, rank-biserial effect sizes, and bootstrap confidence intervals; α = 0.05. Unseen-layout outcomes are summarized as pooled outcomes and map-level mean ± SD. Only three training runs are available for curriculum-related training variability; no training-level significance test is made. Threshold sensitivity is descriptive, and distance-bin inferences are exploratory without multiplicity-adjusted claims.
4.2. Results
4.2.1. Overall Performance in the Fixed-Stratified Test
Table 2 summarizes the overall results for the 1000 fixed-stratified test episodes.
Table 2.
Overall results for the fixed-stratified test.
The difference attributable to distance-staged curriculum learning is small in terms of overall success rate. In the fixed-stratified test, Baseline and Curriculum achieve success rates of 73.60% and 74.30%, respectively, giving a paired difference of +0.70 percentage points with a 95% bootstrap CI of [−1.70, 3.10] percentage points and McNemar p = 0.621. With the Safety Shield enabled, Baseline + Shield and Curriculum + Shield achieve 76.70% and 76.60% success, respectively, corresponding to a paired difference of −0.10 percentage points, a 95% CI of [−2.40, 2.20] percentage points, and p = 1.000. Thus, the overall success-rate difference due to curriculum learning is not significant under either condition. By contrast, enabling the Shield reduces collision rates for both training strategies.
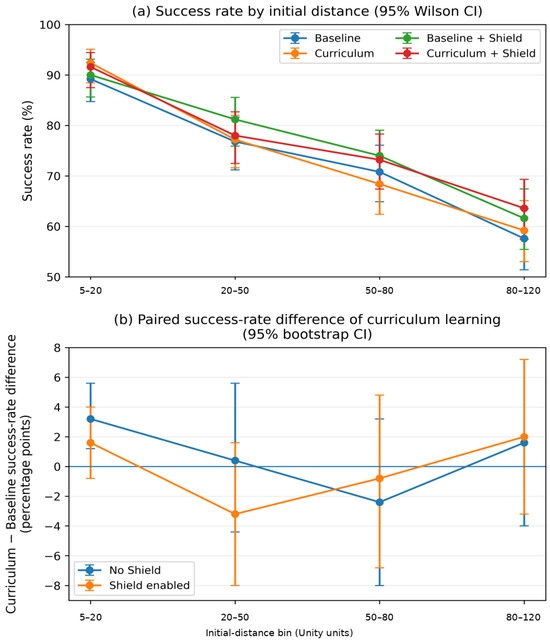
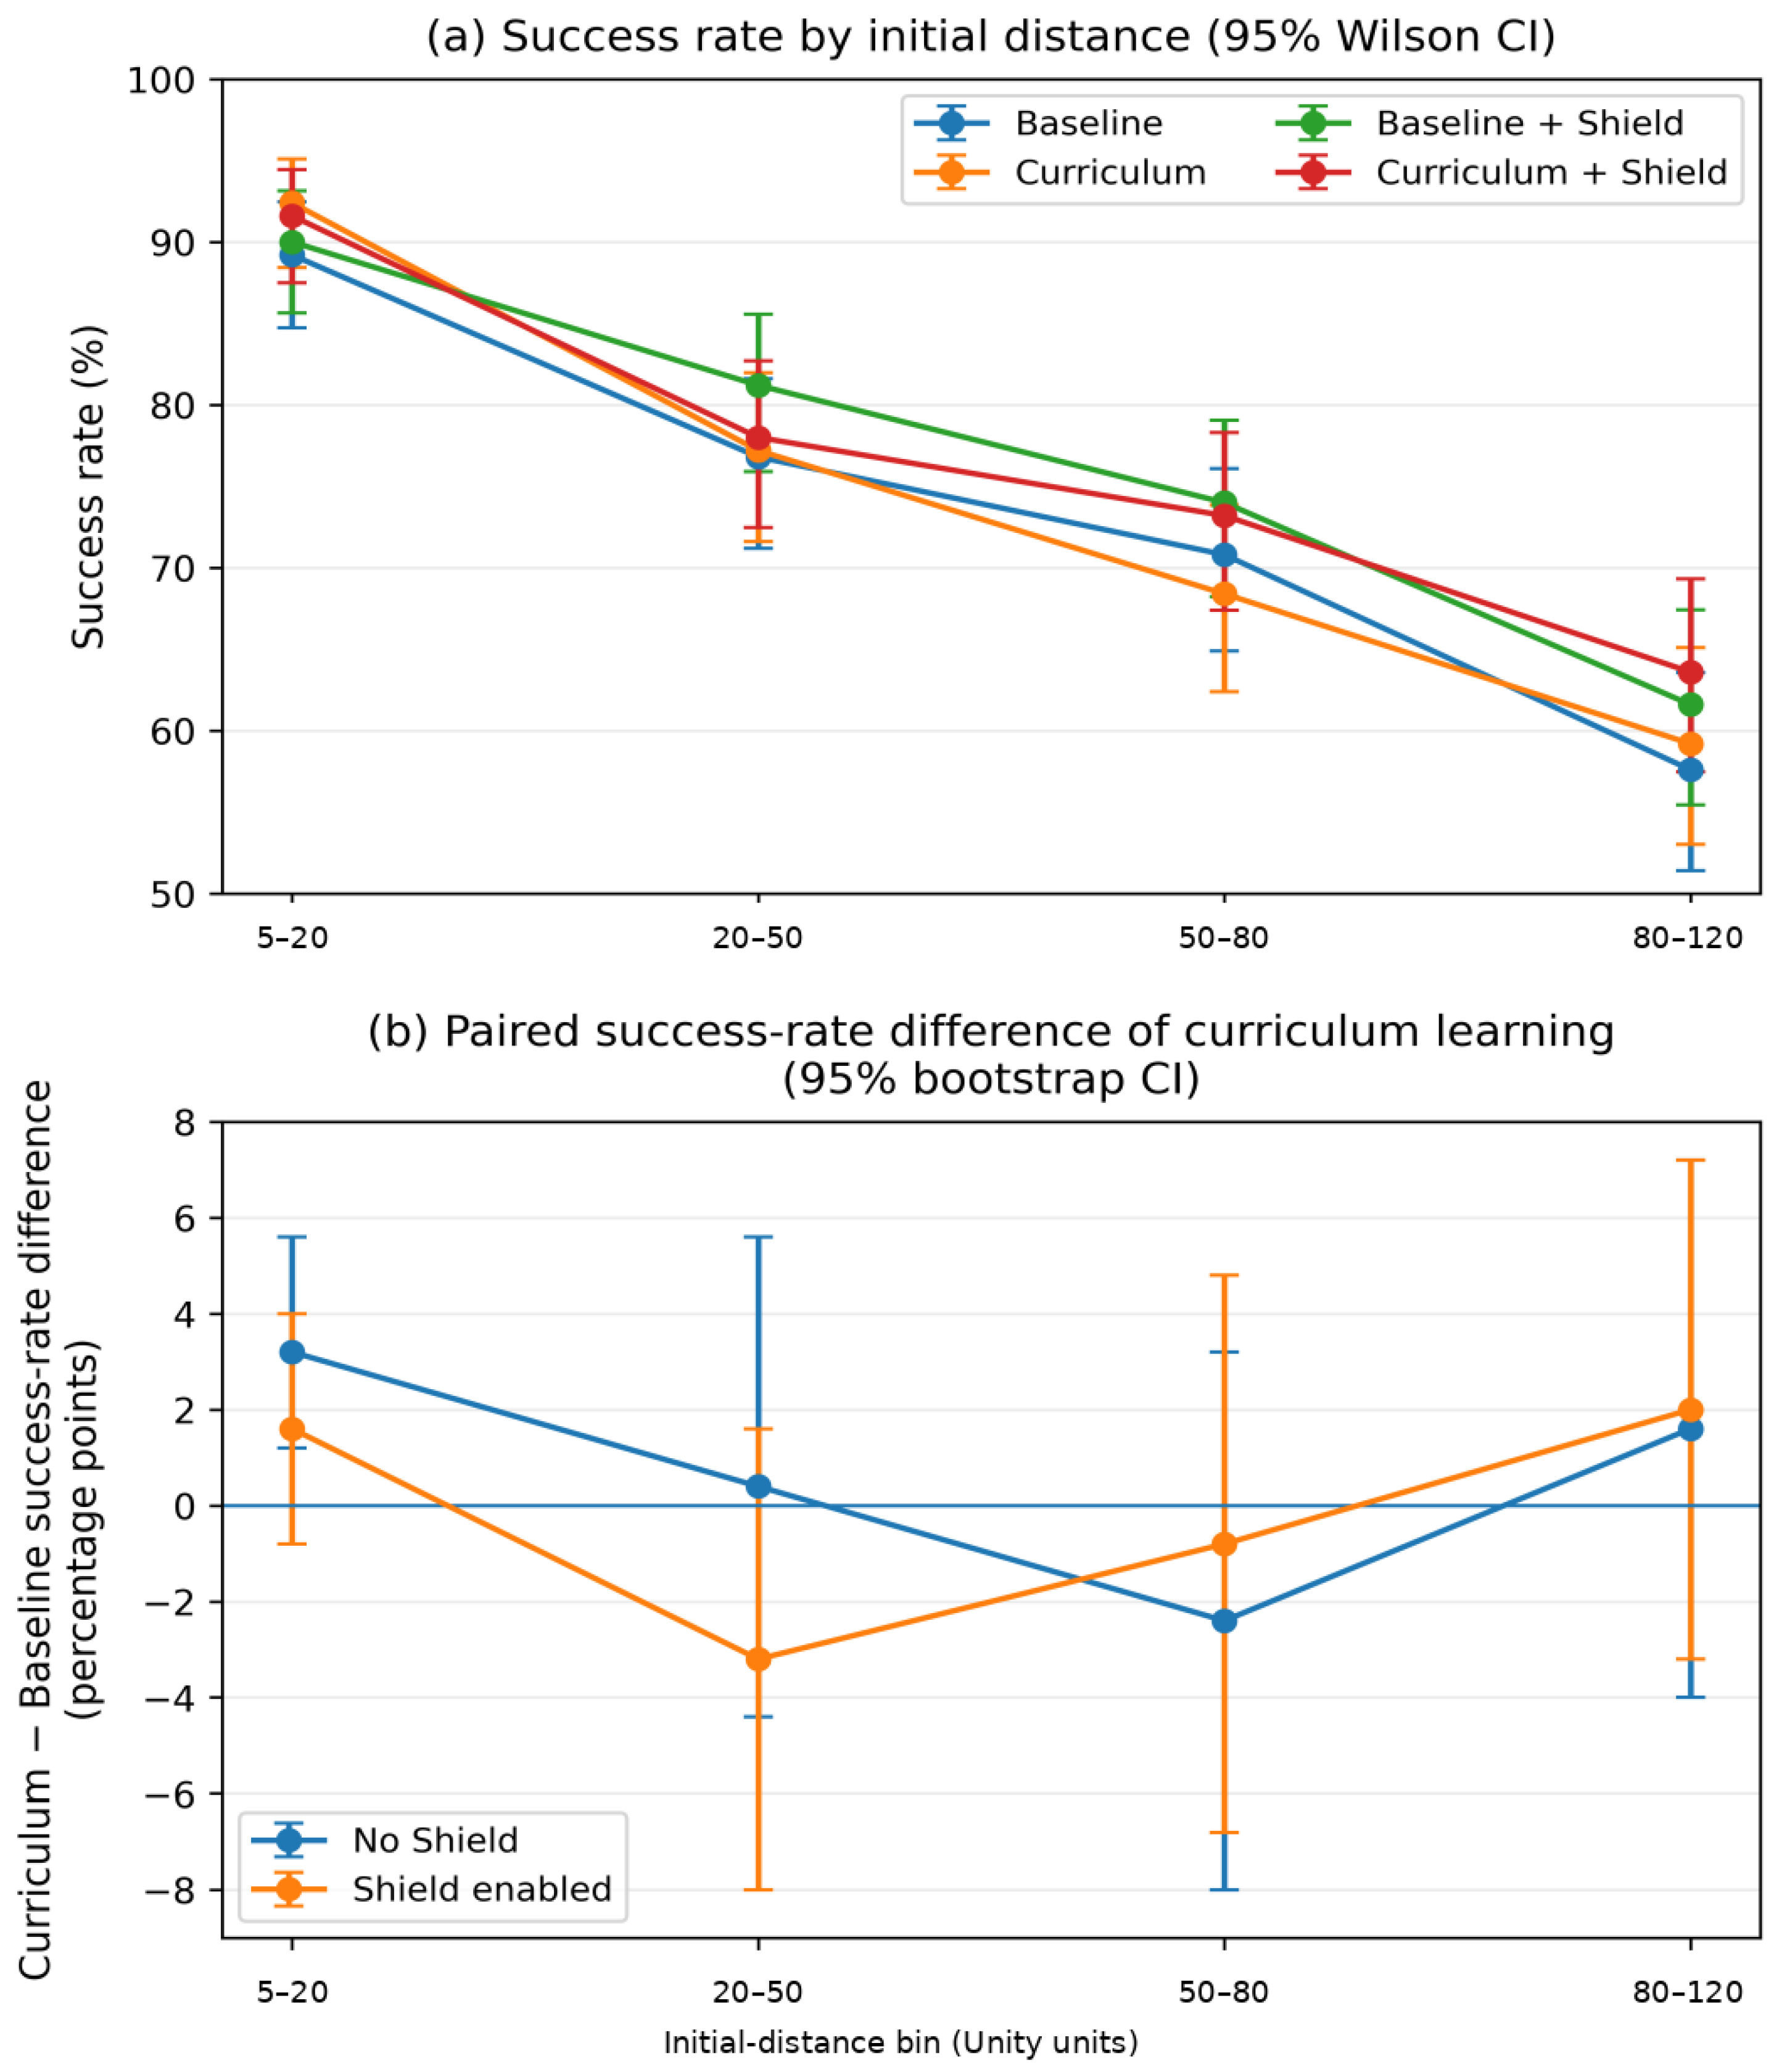
Figure 6 shows success rates and curriculum gains across the initial-distance bins. Success rate decreases with task distance for all four configurations. Without the Shield, the paired Curriculum−Baseline success-rate differences in the 5–20, 20–50, 50–80, and 80–120 Unity-unit bins are +3.20, +0.40, −2.40, and +1.60 percentage points, respectively. With the Shield, the corresponding differences are +1.60, −3.20, −0.80, and +2.00 percentage points. Except for the 5–20-unit bin without the Shield, the 95% bootstrap CIs of the stratified differences all include zero, and the sign of the difference varies across bins. The present results therefore do not support a claim that curriculum learning improves success rate in every distance range; its contribution is better interpreted together with the decision-efficiency results below.
Figure 6.
Fixed-stratified curriculum comparison by initial-distance bin: (a) success rates of the four configurations with 95% Wilson confidence intervals; (b) paired Curriculum−Baseline success-rate differences with 95% bootstrap confidence intervals. All distance-bin labels denote Unity world units.
4.2.2. Conditional Decision Efficiency of Distance-Staged Curriculum Learning
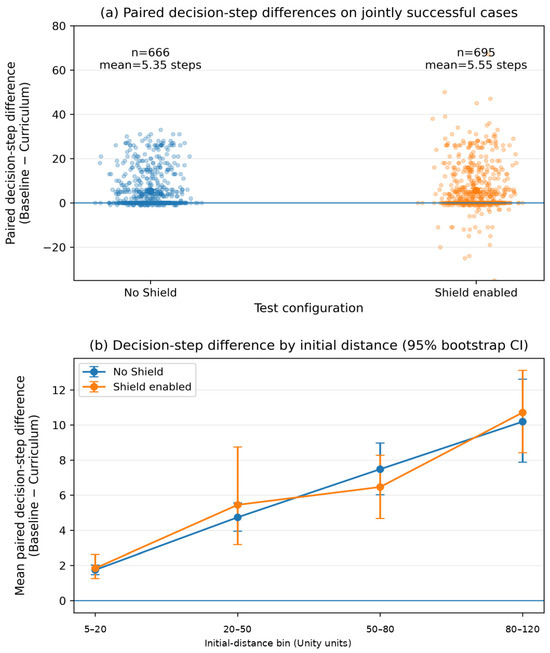
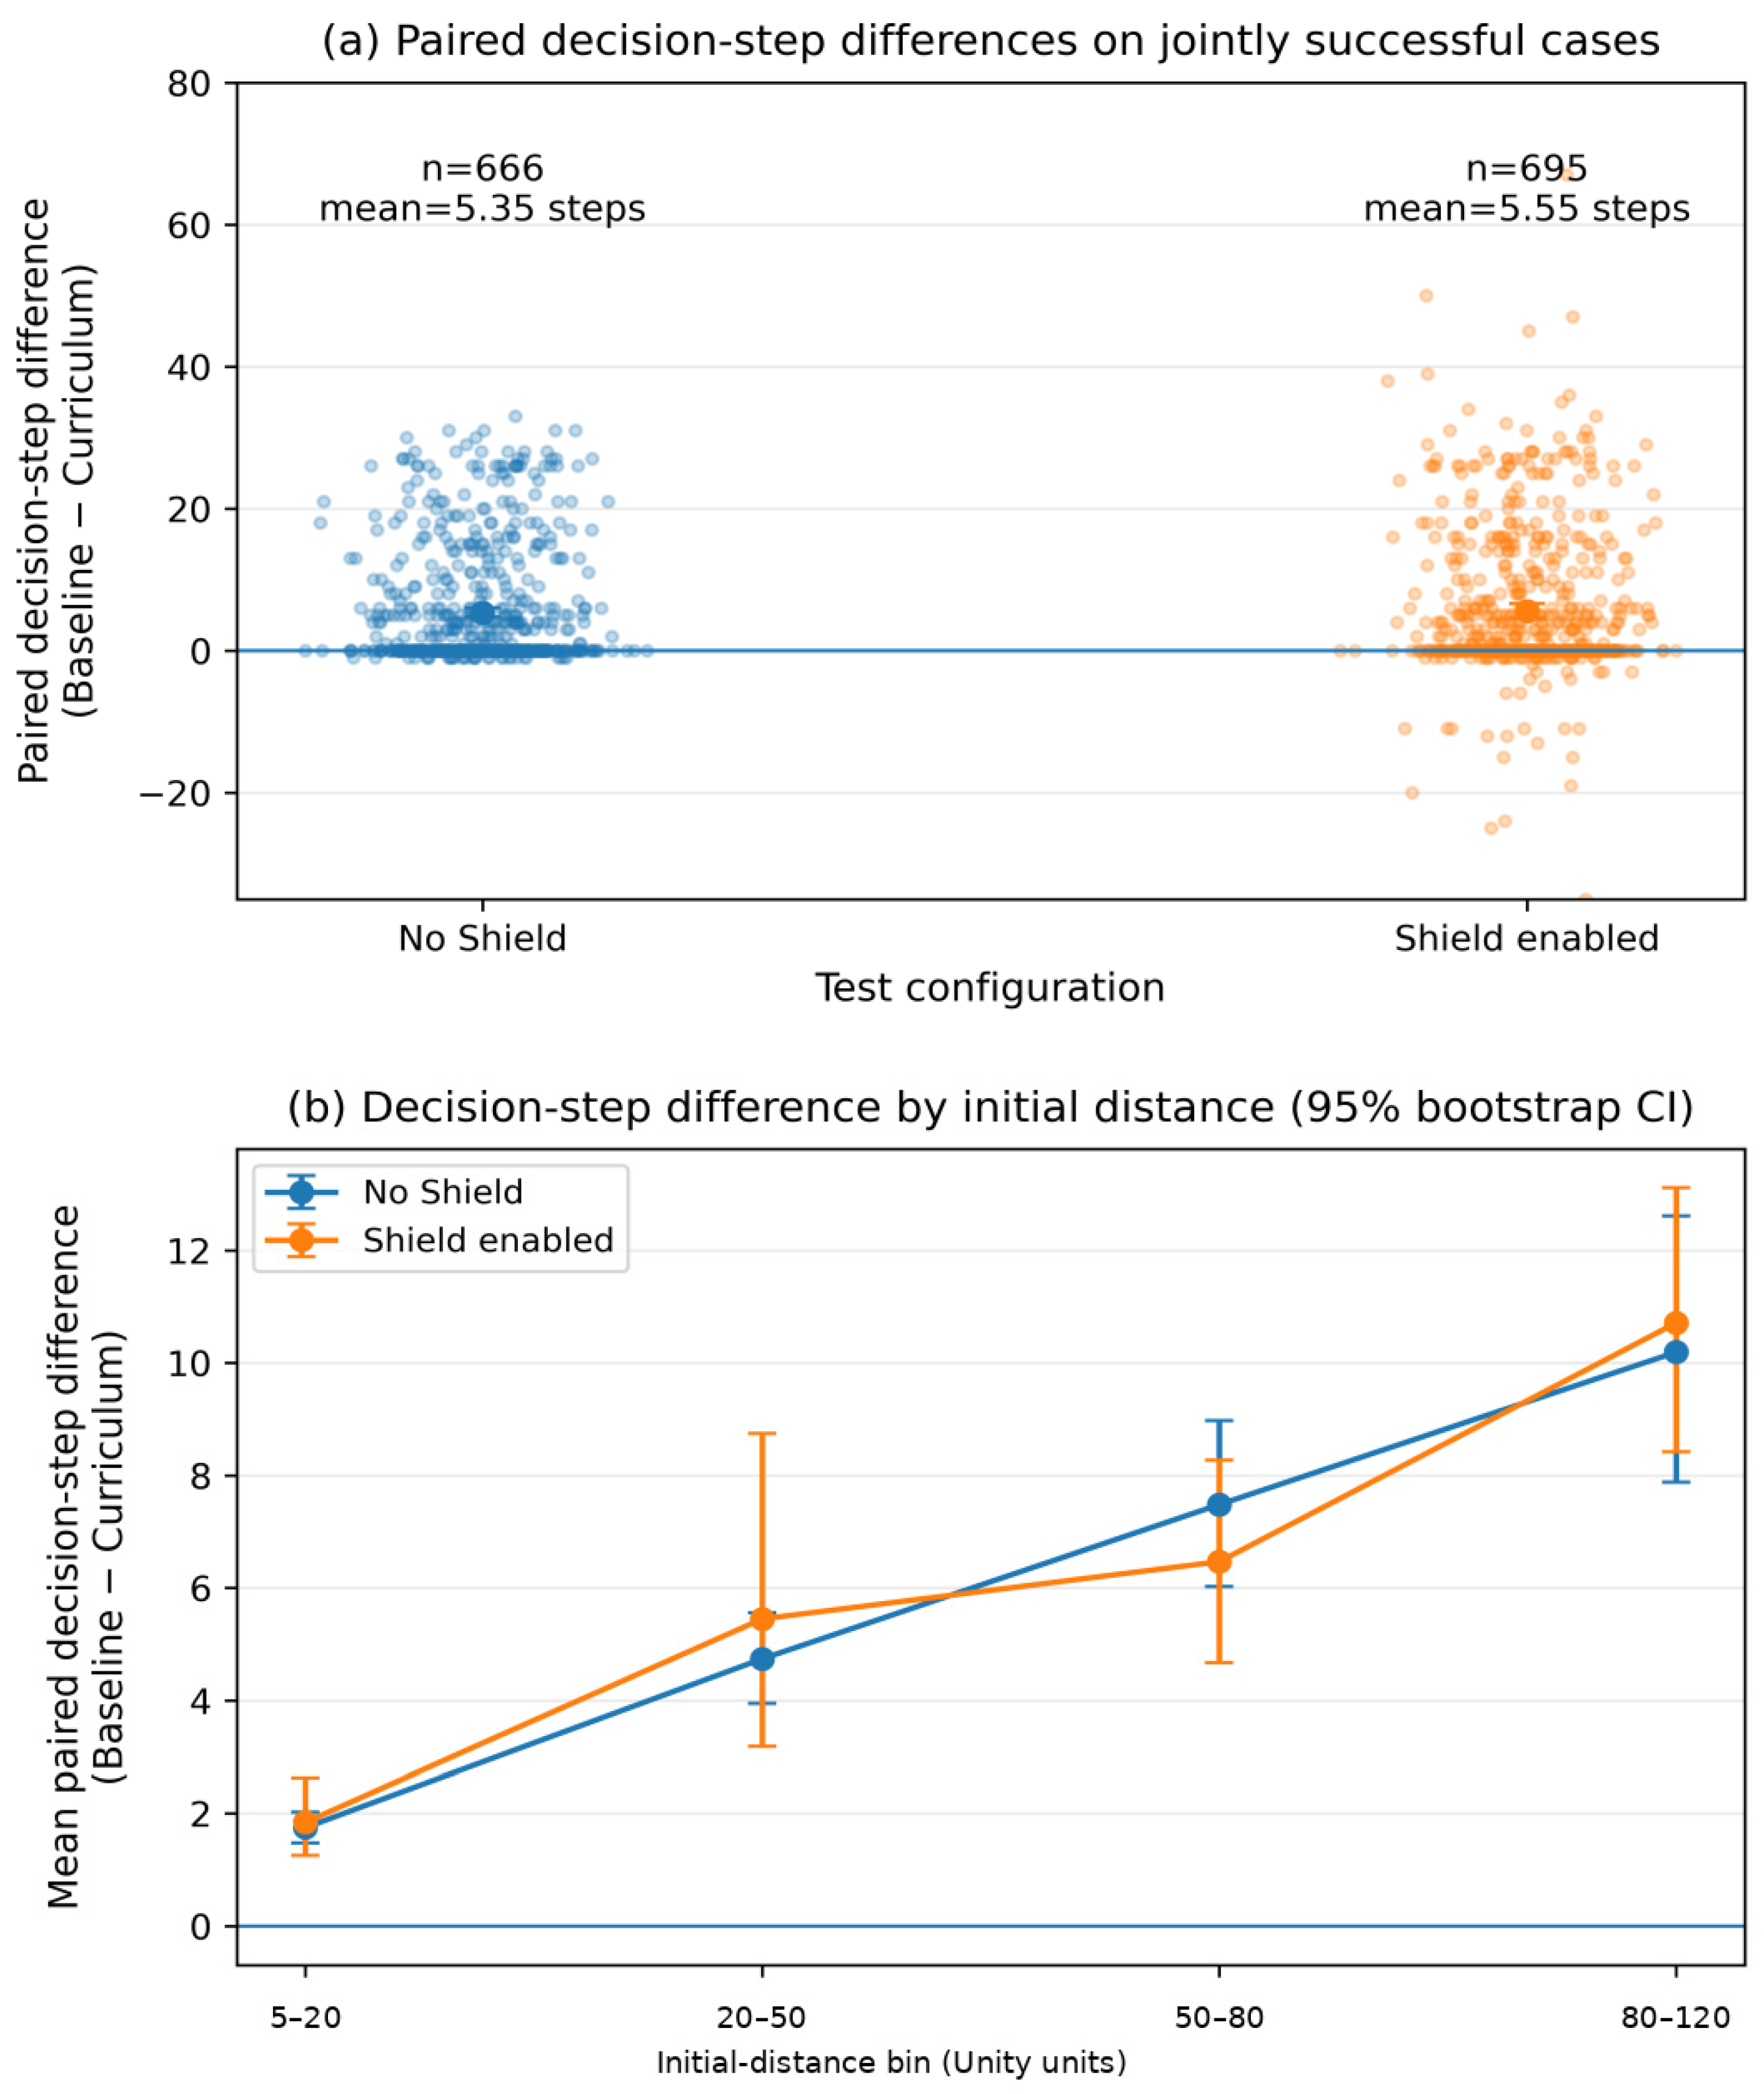
To further examine the conditional decision efficiency associated with curriculum learning, only matched episodes solved successfully by both compared policies are analyzed. Without the Shield, 666 cases are jointly successful. Baseline and Curriculum require mean decision-step counts of 329.01 and 323.66, respectively, so Curriculum uses 5.35 fewer decision steps on average, corresponding to a reduction of approximately 1.6%. The median paired difference is zero, indicating that the effect is concentrated in a subset of cases. With the 0.10-s policy decision interval, the mean difference of 5.35 decision steps corresponds to approximately 0.535 s of simulated navigation time. The Wilcoxon result therefore indicates a statistically detectable paired difference in the original run, but its practical magnitude is modest and should not be interpreted as a large operational time saving.
Stratification by initial distance makes this pattern clearer. Without the Shield, the mean paired step differences in the four distance bins are 1.75, 4.74, 7.48, and 10.19 steps; with the Shield, they are 1.84, 5.45, 6.46, and 10.71 steps. The bootstrap 95% CI in every bin lies above zero. Although the differences do not increase strictly monotonically, their overall magnitude tends to grow from short- to long-distance tasks. In this representative original training run, distance-staged curriculum learning provides little improvement in success rate; the more evident observation is fewer decision steps on jointly successful cases, with larger differences on longer-distance tasks. The paired decision-step differences and their distance-bin summaries are shown in Figure 7.
Figure 7.
Paired decision-efficiency comparison for curriculum learning: (a) paired Baseline−Curriculum decision-step differences for jointly successful cases, with sample size and mean indicated; (b) mean paired difference and 95% bootstrap confidence interval across initial-distance bins. A positive value indicates fewer policy decisions for Curriculum.
4.2.3. Safety Effects of the Safety Shield
Table 3 separately identifies the two original formal-model Shield comparisons and the four later seed-101/202 policy comparisons. For the latter four comparisons, we replace previously summarized rates and transition counts by recomputing outcomes from the 18 October 2026 episode-level CSV. The pairs correspond to run IDs 1/2, 3/4, 5/6, and 7/8 (OFF/ON), respectively; this model order is explicitly defined by the evaluation launcher and corroborated by all 8000 logged case-specific noise seeds: Baseline seed 101, Curriculum seed 101, Baseline seed 202, and Curriculum seed 202.
Table 3.
Shield-OFF/ON results: original formal evaluation (first two rows) and 18 October episode-level re-evaluation of four seed-101/202 policies (last four rows). The two evaluation campaigns are distinct.
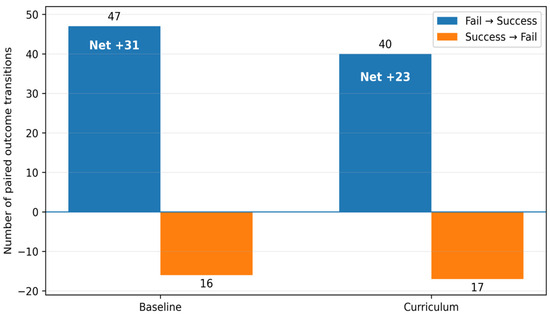
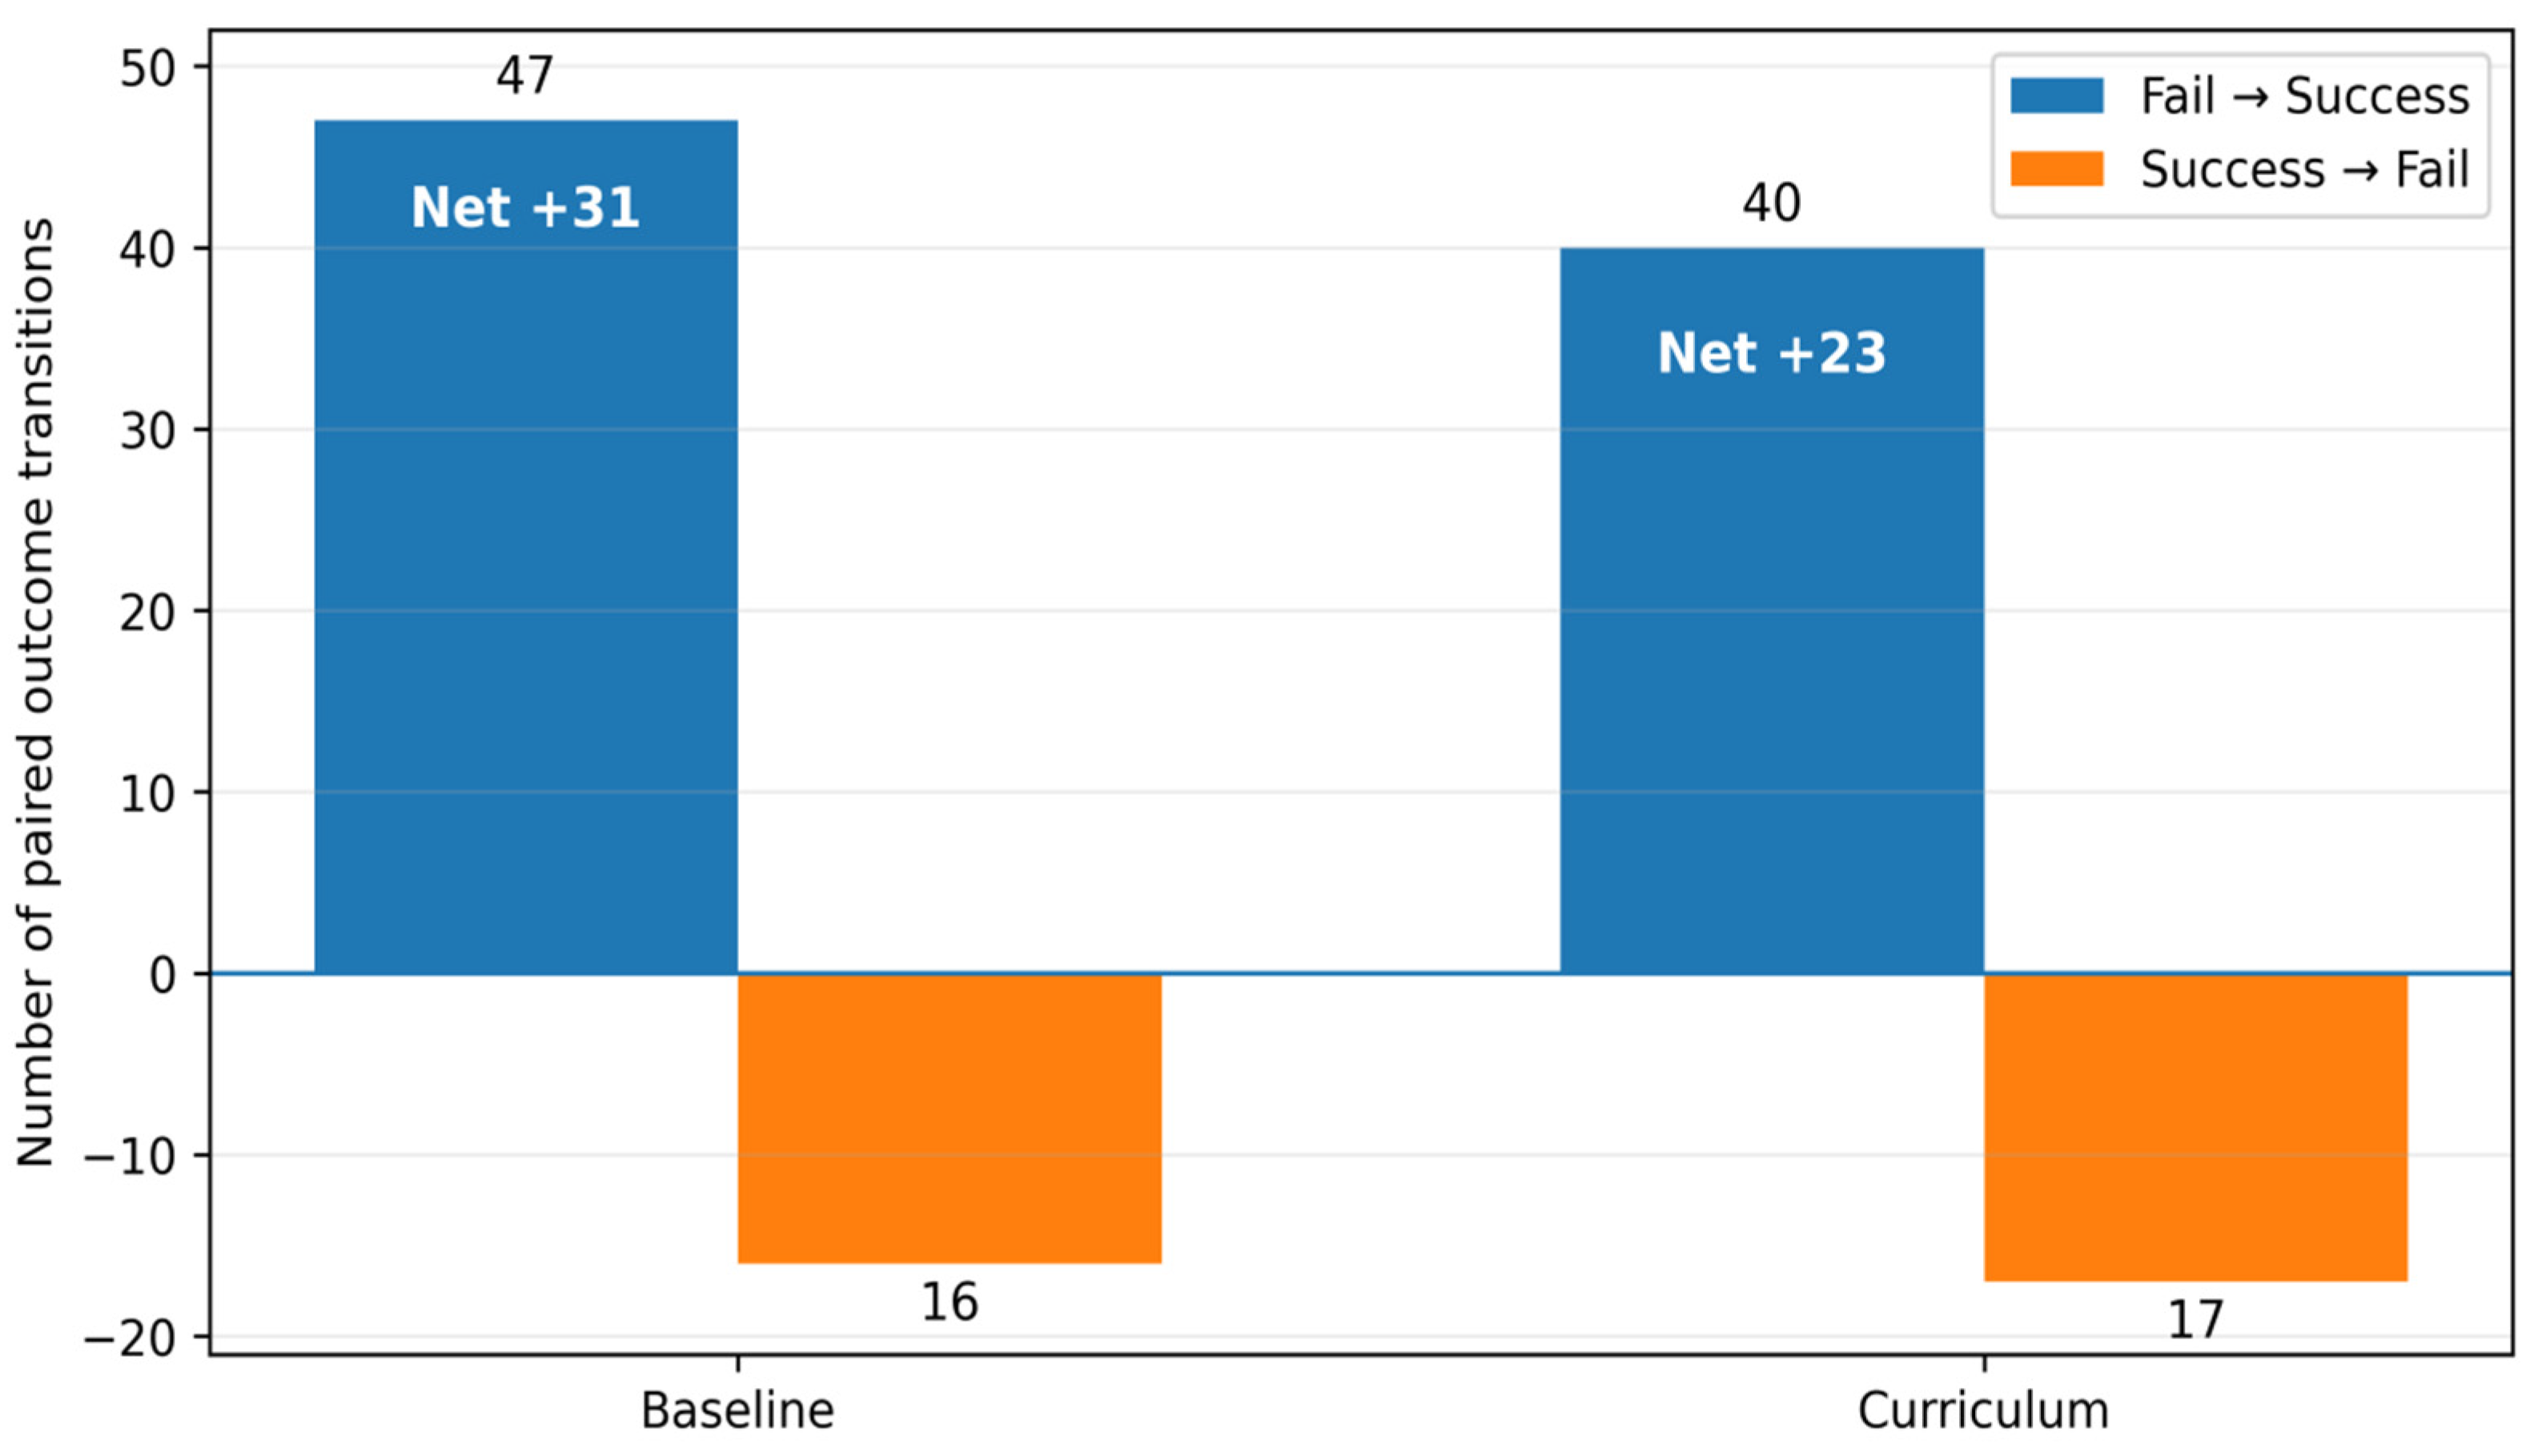
The two original formal-model comparisons in Table 3 are retained as reported in the previous revision: Baseline shows 47 Fail-to-Success and 16 Success-to-Fail transitions, and Curriculum shows 40 and 17. In the later four-policy evaluation, the corresponding transitions are 55/17 (Baseline seed 101), 49/13 (Curriculum seed 101), 49/21 (Baseline seed 202), and 48/20 (Curriculum seed 202). Success rises from 2988/4000 (74.70%) with Shield OFF to 3118/4000 (77.95%) with Shield ON, a +3.25-percentage-point change. Collisions fall from 1012/4000 (25.30%) to 857/4000 (21.425%), a −3.875-percentage-point change, while timeouts increase from zero to 25 (0.625%). Per-policy success-rate gains are +3.8, +3.6, +2.8, and +2.8 percentage points. These are case-matched observational differences for the original Shield implementation, not results of a revised filter. The earlier seed-101/202 aggregate transition counts given in the previous revision are superseded by the counts recomputed from the retained 18 October episode-level export; the previously quoted values cannot be reconciled with this row-level reconstruction. The paired outcome transitions for these two original formal comparisons are summarized in Figure 8.
Figure 8.
Paired fail-to-success and success-to-fail counts for the original formal Baseline and Curriculum comparisons only (not the later four seed-101/202 model pairs).
Shield-ON records show 643/4000 episodes (16.075%) with at least one actual action change (shieldActualActionChanges > 0). In this triggered group, the OFF → ON transitions are: 355 Success → Success, 34 Success → Collision, 13 Success → Timeout, 185 Collision → Success, 44 Collision → Collision, and 12 Collision → Timeout. The remaining 3357 paired cases have no recorded action override: 2562 Success → Success, 24 Success → Collision, 16 Collision → Success, and 755 Collision → Collision. Thus, the 201 total Collision → Success changes include 16 cases without intervention, while the 71 Success → non-Success changes include 24 without intervention. We do not attribute these non-triggered discordances to a Shield action replacement. Of the 25 Shield-ON timeouts, 1 occurs in the shortest (5–20-unit) stratum, 14 in the 20–50-unit stratum, and 10 in the 50–80-unit stratum; their median final goal distance is 2.53 Unity units. On the 355 cases successful with and without the Shield where an action was actually changed, Shield ON incurs a mean of 71.43 additional execution steps (approximately 1.43 s at 50 Hz), with a median increase of 51 execution steps. The CSV records matched noise seeds, but different observed LiDAR scan counts in many OFF/ON pairs, so it cannot verify that the realized noisy sensor streams were synchronized. Outcome transitions are therefore not individually attributed solely to Shield intervention.
For the four later model pairs, the respective paired 95% bootstrap intervals (percentage points; ON minus OFF) are: Baseline, seed 101: success +3.8 [+2.2, +5.5], collision −4.4 [−6.1, −2.8]; Curriculum, seed 101: success +3.6 [+2.1, +5.1], collision −4.1 [−5.7, −2.6]; Baseline, seed 202: success +2.8 [+1.2, +4.5], collision −3.5 [−5.2, −1.9]; Curriculum, seed 202: success +2.8 [+1.2, +4.4], collision −3.5 [−5.1, −1.9]. All intervals are conditional on the evaluated policy and fixed-case strata.
4.2.4. Natural-Random Test
Table 4 summarizes the overall results for 1000 natural-random test episodes.
Table 4.
Overall results for the natural-random test.
The natural-random test complements the fixed-stratified evaluation. Curriculum improves success rate by 2.10 percentage points relative to Baseline, and Curriculum + Shield improves it by 2.60 percentage points relative to Baseline + Shield; Curriculum + Shield reaches a success rate of 79.40%. However, 82.2% of the natural-random samples fall in the 20–80 Unity-unit range, whereas only 27 episodes fall in the 80–120 Unity-unit range. The aggregate metric therefore primarily reflects medium-distance tasks. Because the fixed-stratified test weights the four distance bins equally and supports strict matched-case comparison, it is used as the primary basis for method comparison, whereas the natural-random test is used as a supplementary view of performance under the original sampling distribution.
4.2.5. Generalization to Unseen Obstacle Layouts
To examine whether the main observations extend to geometric configurations not encountered during training, supplementary tests are conducted on eight static obstacle layouts generated from obstacle seeds not used in training. Each layout contains 15 static obstacles and changes only the obstacle arrangement. Each map contains 64 fixed-stratified tasks, with 16 tasks in each distance bin, and Baseline, Curriculum, Baseline+Shield, and Curriculum + Shield strictly reuse the same starts, targets, and repaired final cases. Thus, each method is evaluated on 512 map-task combinations. Only three map-task instances require deterministic repair during validity checking, accounting for 0.59% of the 512 combinations, and the same repaired results are reused across all four configurations. Here, unseen-layout generalization specifically refers to adaptation to changes in the spatial arrangement of obstacles and does not imply broader generalization across dynamic parameters, sensor configurations, or sim-to-real transfer. Because each layout contains the same number of identically stratified tasks, map-level means and SDs describe variation across environmental geometries, while the aggregate results over the 512 combinations describe overall task performance.
Table 5 reports the results of the original formal training run on the eight unseen layouts. Without the Safety Shield, the map-level mean success rates of Baseline and Curriculum are 71.88% ± 3.64% and 77.73% ± 3.98%, respectively. Curriculum has a higher success rate on seven of the eight maps and the same rate on the remaining map, yielding a mean difference of +5.86 ± 3.90 percentage points. With the Safety Shield enabled, the mean success rates of Baseline + Shield and Curriculum + Shield are 76.95% ± 2.47% and 80.86% ± 5.27%, respectively; Curriculum+Shield is higher on six maps and lower on two, with a mean difference of +3.91 ± 5.01 percentage points. Aggregated over all 512 map-task combinations, the success/collision/timeout counts for the four configurations are 368/144/0, 398/114/0, 394/118/0, and 414/97/1, respectively.
Table 5.
Success rates (%) on unseen obstacle layouts for the original training run.
In this original training run, the Curriculum−Baseline success-rate differences in the 5–20, 20–50, 50–80, and 80–120 Unity units bins are +0.78, −0.78, +0.78, and +22.66 percentage points without the Safety Shield, and +1.56, −3.12, +3.12, and +14.06 percentage points with the Shield. Among cases solved by both policies, Curriculum uses 5.64 and 5.81 fewer decision steps on average without and with the Safety Shield, respectively; for 80–120 Unity units tasks, the mean step differences are 10.28 and 12.00. These values describe the observation from the original training run; training-level stability is examined with independent repetitions in Section 4.2.6.
For the Safety Shield, enabling the Shield improves Baseline success rate on all eight unseen maps, with a map-level mean gain of +5.08 ± 2.00 percentage points and a decrease in mean collision rate from 28.13% to 23.05%. For Curriculum, the mean success-rate gain is +3.13 ± 4.57 percentage points, and the mean collision rate decreases from 22.27% to 18.95%, with one timeout observed. The magnitude of the gain varies across layouts.
4.2.6. Joint Analysis of Three Independent Training Runs
To study curriculum-learning sensitivity to PPO training variability, Table 6 retains the original independently collected evaluation summary for the original model pair and two further independent training runs with seeds 101 and 202. The original run had no explicit training seed; all training runs use the same network and nominal training budget. The table provides older fixed-layout and unseen-layout Baseline/Curriculum comparisons and conditional decision-step differences; those decision-step estimates belong to that historical evaluation. The seed-101/202 Shield-OFF/ON evaluation in Table 3 is a subsequent 18 October episode-level replay, not the identical execution behind the fixed-layout entries of Table 6. The full earlier per-episode Table 6 export is not included in the retained 18 October CSV, so the small numerical differences between the two independently recorded evaluations cannot be explained uniquely by sensor noise or case mapping. They are accordingly presented as separate evaluation passes rather than as an exact numerical replication. Figure 9 provides a visual comparison of the fixed-layout Curriculum−Baseline success-rate differences across the three independent runs.
Table 6.
Historical independent-training evaluation on fixed and unseen layouts (distinct from the later 18 October Shield-OFF/ON replay reported for seed-101/202 policies in Table 3).
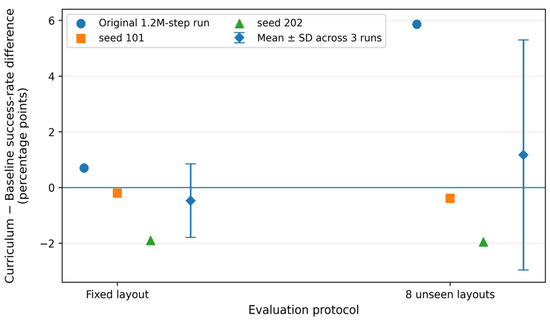
Figure 9.
Curriculum−Baseline success-rate differences across three independent training runs, with between-run mean ± SD. The horizontal line indicates zero difference.
In the historical independent-training evaluation summarized in Table 6, fixed-layout Curriculum−Baseline success-rate differences across the three runs are +0.70, −0.20, and −1.90 percentage points, with a between-run mean of −0.47 ± 1.32 points. These particular historical fixed-layout rates are not the later 18 October Shield-OFF data. Their signs illustrate that the curriculum advantage is not stable at the training-run level; the independent-training and unseen-layout data together do not support a universal final success-rate improvement from curriculum staging.
For jointly successful fixed-layout cases, the mean Baseline−Curriculum decision-step differences in the three runs are 5.35, 0.18, and 2.26 steps; on unseen layouts, the corresponding differences are 5.64, 0.21, and 2.35 steps. Although the direction is positive in all three runs, the magnitude varies strongly. Given the 0.10-s policy decision interval, even the largest fixed-layout mean difference (5.35 steps) corresponds to approximately 0.535 s of simulated time. Curriculum learning is therefore interpreted as producing a small, run-dependent decision-efficiency effect rather than a consistently large operational benefit.
4.2.7. Sensitivity to the Safety Shield Front Trigger Distance
A single-factor sensitivity test is conducted on the same 500 fixed-stratified tasks to evaluate the effect of the fixed front trigger distance. The subset contains 125 tasks from each of the four distance bins, and both policies use the same matched cases. The tested values are DF = 2.0, 3.0, and 4.0 Unity units, with DS = 6.0 Unity units and all sector angles unchanged. The sensitivity-test results are summarized in Table 7.
Table 7.
Sensitivity to the Safety Shield front trigger distance on the same 500 fixed-stratified cases.
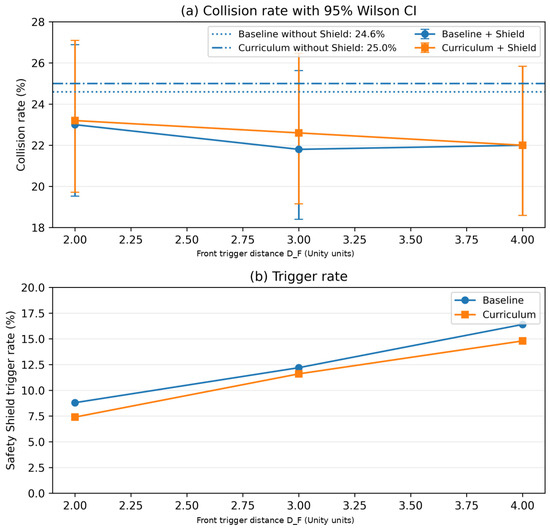
Across DF = 2.0–4.0 Unity units, the collision rate of both training strategies remains below the corresponding no-Shield reference. Relative to no Shield, the Baseline collision rate decreases by 1.60, 2.80, and 2.60 percentage points, while the Curriculum collision rate decreases by 1.80, 2.40, and 3.00 percentage points. Success rates are also higher than the no-Shield references, although differences among the tested thresholds are small. The intervention load changes more clearly with DF: the Baseline trigger rate increases from 8.80% to 16.40%, and the Curriculum trigger rate from 7.40% to 14.80%, while the mean override count among triggered episodes also generally increases. At DF = 4.0 Unity units, timeout rates rise to 0.80% and 0.60% for Baseline and Curriculum, respectively.
Matched-case outcome transitions show more Fail-to-Success than Success-to-Fail transitions at all three thresholds. For Baseline, the counts at DF = 2.0, 3.0, and 4.0 Unity units are 14/7, 22/9, and 22/12, respectively; for Curriculum, they are 20/12, 18/8, and 23/11. These transitions again represent paired observations under different execution conditions and are not interpreted as deterministic causal effects for individual episodes. Overall, safety outcomes are comparatively stable within the tested 2–4 Unity units range, whereas trigger frequency and override intensity are more sensitive to the threshold. The 3.0 Unity units setting lies near the middle of the tested range and can serve as the current engineering setting, but it is not claimed to be globally optimal. The collision-rate and trigger-rate trends across the tested thresholds are shown in Figure 10.
Figure 10.
Safety Shield front-trigger sensitivity on the matched 500-case subset: (a) collision rate with 95% Wilson confidence intervals, with horizontal lines indicating the no-Shield references; (b) Shield trigger rate. Trigger-distance values are expressed in Unity world units.
4.3. Discussion and Scope of Applicability
The three independent training runs show that case-level significance and training-level stability should be interpreted separately. Curriculum learning does not provide a stable final success-rate advantage: the fixed-layout Curriculum−Baseline differences are +0.70, −0.20, and −1.90 percentage points across the three runs, while unseen-layout effects are also variable. The paired decision-efficiency difference remains positive across the three runs but is small in magnitude; in the original run, 5.35 fewer decisions correspond to only about 0.535 s of simulated time. We therefore interpret curriculum learning as a training-task organization mechanism with modest, run-dependent efficiency effects rather than as a universally superior final policy.
The original runtime Safety Shield exhibits directionally consistent improvements across the four later independent-policy OFF/ON comparisons, with success gains of +2.8 to +3.8 percentage points and collision-rate reductions of 3.5 to 4.4 points. The new paired 95% confidence intervals for success improvements and collision reductions exclude zero in each of the four evaluated policy pairs, conditional on their training checkpoints and fixed-case sampling design. The aggregate gain of 130 successes coincides with 155 fewer collisions and 25 additional timeouts. Interventions also increase execution-step counts among some jointly successful triggered episodes. Nevertheless, the OFF/ON evaluation logs do not guarantee identical realized LiDAR noise traces merely because nominal noise seeds agree, and non-triggered cases can show different outcomes. These comparisons support observed changes for the evaluated models, not deterministic causal attribution for each case or a formal collision-avoidance guarantee.
The simulation uses a simplified planar rigid-body model and static obstacles and does not explicitly include added mass, hydrodynamic damping, or wind, wave, and current disturbances. The Unity scene is internally consistent in world coordinates but was not independently calibrated to SI metres; therefore, the revised manuscript reports distances and velocities in Unity units and Unity units/s. Real disturbances and physically calibrated vessel dynamics could alter closing rates, turning response, LiDAR geometry, and Shield intervention timing. The present findings should therefore be interpreted as simulator-level evidence under the stated assumptions, not as field-level robustness.
This study evaluates incremental mechanisms under a shared PPO framework rather than a ranking against all existing navigation algorithms. Prior work has studied adaptive curricula and transfer [28], recurrent PPO and comparisons with other algorithms [29], and control-barrier-function-based shields for dynamic encounters [30]. In contrast, our lightweight local-range Shield does not guarantee invariant safe sets. Two implementation limitations require explicit disclosure: the original action-smoothness reward depends on coded action indices and the previously executed action, which is not separately included in the 23-dimensional policy observation; and the original Shield ignores measured ranges ≤0.5 Unity units, even though the LiDAR accepts 0.1–15 Unity units and encodes invalid/no-return rays at its configured maximum. The 18 October evaluation contains 46,581 counted 0.1–0.5-unit returns, including 4818 logged true-hit returns and 41,763 logged no-hit returns. These are accumulated sensing events, not numbers of distinct episodes or proven filter-induced collisions. A previously performed implementation-level check of the revised range-validity predicate passed 16/16 boundary cases. Such unit-level checks do not establish a reduction in navigation collision rate. No updated close-range filter was evaluated in the four-policy performance comparison; its efficacy will require separately controlled navigation tests. An earlier, separate A/A diagnostic of 100 nominally matched repeated evaluation pairs showed two different terminal outcomes, 14 differences in action-execution step counts, and 93 differences in observed LiDAR scan counts. This diagnostic indicates sensitivity to evaluation replay and is not a synchronized-noise replay of the 18 October data. Finally, OFF/ON runs share stored noise seeds but do not necessarily share realized noise streams, and case 466 has a cross-policy start-position mismatch despite correct within-policy matching. The simplified scene omits realistic vessel hydrodynamics and environmental forcing. These constraints delimit the simulator-level scope of the present results.
5. Conclusions
This study incrementally examines distance-staged curriculum learning and a LiDAR-based runtime Safety Shield on a common task-adapted PPO controller. The original three-run curriculum evaluation does not establish a consistent final success-rate gain; conditional decision-step reductions are practically modest. In a subsequent 18 October evaluation of four independently trained seed-101/202 policies on 4000 paired Shield-OFF/ON cases, success improves from 74.70% to 77.95% (+3.25 percentage points), collisions decrease from 25.30% to 21.425% (−3.875 points), and timeouts rise from zero to 25 (0.625%). Individual policy success gains range from +2.8 to +3.8 points, and the corresponding paired confidence intervals exclude zero for the four evaluated policies. These benefits concern the original Shield implementation and do not imply formally guaranteed safety or fully synchronized stochastic LiDAR inputs.
The timing and sensing audit conducted during revision also clarifies the simulator interpretation. The 4000-step episode horizon corresponds to 80 s, the realized normal-forward horizontal speed is approximately 1.381 Unity units/s, and the slow-forward Shield command reduces steady speed to approximately 1.100 Unity units/s without constituting explicit braking. The LiDAR physical range is 0.1–15 Unity units, while division by 50 is a fixed policy-input scaling constant. Because no independent physical calibration was available, these quantities are reported in Unity world units rather than assumed SI metres.
The results remain limited by simplified vessel dynamics, static obstacles, only three independent curriculum-training runs, an index-dependent action-smoothness reward, and the original Shield exclusion of valid short-range LiDAR hits ≤ 0.5 Unity units. The episode-level OFF/ON records document identical case specifications and noise seeds within each policy pair but not identical realized LiDAR noise trajectories; one case also differs in starting position across trained-policy pairs. The available data support within-policy paired performance improvements rather than unqualified individual-episode causal claims. Future work should include a counter-based common-noise evaluation design, independent navigation tests for a corrected close-range filter, more training repetitions, physically calibrated hydrodynamics and external disturbances, comparisons with alternative safety filters, and field validation.
Author Contributions
Conceptualization, S.P. and P.W.; methodology, S.P. and P.W.; software, S.P.; validation, S.P. and Y.Y.; formal analysis, S.P.; investigation, S.P.; data curation, S.P.; writing—original draft preparation, S.P.; writing—review and editing, Y.Y. and J.W.; visualization, S.P.; supervision, J.W. All authors have read and agreed to the published version of the manuscript.
Funding
This research received no external funding.
Data Availability Statement
Selected processed evaluation data and supporting analysis materials underlying the reported tables and statistical analyses are available from the corresponding author upon reasonable request. The complete raw Unity simulation outputs, trained-model binaries, and intermediate development artifacts are not publicly available because they comprise large, heterogeneous project-specific files that are not maintained as a curated archival dataset. Retained evaluation outputs supporting the reported results can be provided for verification where available.
Acknowledgments
During manuscript preparation and revision, the authors used ChatGPT (GPT-5.5 during initial manuscript preparation and GPT-6 during revision) to assist with language refinement, organizing responses to reviewers, and checking descriptive calculations against retained evaluation outputs. The authors reviewed and verified the AI-assisted outputs and take full responsibility for all analyses, interpretations, and manuscript content.
Conflicts of Interest
The authors declare no conflict of interest.
References
- Barrera, C.; Padron, I.; Luis, F.S.; Llinas, O.; Marichal, G.N. Trends and challenges in unmanned surface vehicles (USV): From survey to shipping. TransNav Int. J. Mar. Navig. Saf. Sea Transp. 2021, 15, 135–142. [Google Scholar] [CrossRef] [Scilit]
- Yan, R.; Pang, S.; Sun, H.; Pang, Y. Development and missions of unmanned surface vehicle. J. Mar. Sci. Appl. 2010, 9, 451–457. [Google Scholar] [CrossRef] [Scilit]
- Polvara, R.; Sharma, S.; Wan, J.; Manning, A.; Sutton, R. Obstacle avoidance approaches for autonomous navigation of unmanned surface vehicles. J. Navig. 2018, 71, 241–256. [Google Scholar] [CrossRef] [Scilit]
- Liang, C.; Zhang, X.; Watanabe, Y.; Deng, Y. Autonomous collision avoidance of unmanned surface vehicles based on improved A star and minimum course alteration algorithms. Appl. Ocean Res. 2021, 113, 102755. [Google Scholar] [CrossRef] [Scilit]
- Bai, X.; Li, B.; Xu, X.; Xiao, Y. USV path planning algorithm based on plant growth. Ocean Eng. 2023, 273, 113965. [Google Scholar] [CrossRef] [Scilit]
- Zhu, X.; Yan, B.; Yue, Y. Path Planning and Collision Avoidance in Unknown Environments for USVs Based on an Improved D* Lite. Appl. Sci. 2021, 11, 7863. [Google Scholar] [CrossRef] [Scilit]
- Wu, X.; Chen, H.; Chen, C.; Zhong, M.; Xie, S.; Guo, Y.; Fujita, H. The autonomous navigation and obstacle avoidance for USVs with ANOA deep reinforcement learning method. Knowl.-Based Syst. 2020, 196, 105201. [Google Scholar] [CrossRef] [Scilit]
- Xu, X.; Lu, Y.; Liu, X.; Zhang, W. Intelligent collision avoidance algorithms for USVs via deep reinforcement learning under COLREGs. Ocean Eng. 2020, 217, 107704. [Google Scholar] [CrossRef] [Scilit]
- Meyer, E.; Heiberg, A.; Rasheed, A.; San, O. COLREG-compliant collision avoidance for unmanned surface vehicle using deep reinforcement learning. IEEE Access 2020, 8, 165344–165364. [Google Scholar] [CrossRef] [Scilit]
- Wang, W.; Luo, X.; Li, Y.; Xie, S. Unmanned surface vessel obstacle avoidance with prior knowledge-based reward shaping. Concurr. Comput. Pract. Exp. 2021, 33, e6110. [Google Scholar] [CrossRef] [Scilit]
- Sun, Z.; Fan, Y.; Wang, G. An Intelligent Algorithm for USVs Collision Avoidance Based on Deep Reinforcement Learning Approach with Navigation Characteristics. J. Mar. Sci. Eng. 2023, 11, 812. [Google Scholar] [CrossRef] [Scilit]
- Wang, J.; Lu, Z.; Hong, X.; Wu, Z.; Li, W. Navigation and obstacle avoidance for USV in autonomous buoy inspection: A deep reinforcement learning approach. J. Mar. Sci. Eng. 2025, 13, 843. [Google Scholar] [CrossRef] [Scilit]
- Li, Y.; Wu, D.; You, Z.; Chen, G.; Wu, D. Deep reinforcement learning for collision avoidance in unmanned surface vehicles: State-of-the-art. Appl. Ocean Res. 2025, 164, 104778. [Google Scholar] [CrossRef] [Scilit]
- Kong, C.; Wang, W.; Huang, S.; Zhang, Y.; Meng, D. Autonomous obstacle-avoidance method for unmanned surface vehicles based on improved proximal policy optimization. Comput. Sci. 2025, 52, 40–48. (In Chinese) [Google Scholar]
- Schulman, J.; Wolski, F.; Dhariwal, P.; Radford, A.; Klimov, O. Proximal Policy Optimization Algorithms. arXiv 2017, arXiv:1707.06347. [Google Scholar]
- Mnih, V.; Kavukcuoglu, K.; Silver, D.; Rusu, A.A.; Veness, J.; Bellemare, M.G.; Graves, A.; Riedmiller, M.; Fidjeland, A.K.; Ostrovski, G.; et al. Human-level control through deep reinforcement learning. Nature 2015, 518, 529–533. [Google Scholar] [CrossRef] [Scilit] [PubMed]
- Lillicrap, T.P.; Hunt, J.J.; Pritzel, A.; Heess, N.; Erez, T.; Tassa, Y.; Silver, D.; Wierstra, D. Continuous Control with Deep Reinforcement Learning. arXiv 2015, arXiv:1509.02971. [Google Scholar]
- Ng, A.Y.; Harada, D.; Russell, S. Policy invariance under reward transformations: Theory and application to reward shaping. In Proceedings of the 16th International Conference on Machine Learning, Bled, Slovenia, 27–30 June 1999; pp. 278–287. [Google Scholar]
- Bengio, Y.; Louradour, J.; Collobert, R.; Weston, J. Curriculum learning. In Proceedings of the 26th Annual International Conference on Machine Learning, Montreal, QC, Canada, 14–18 June 2009; pp. 41–48. [Google Scholar]
- Narvekar, S.; Peng, B.; Leonetti, M.; Sinapov, J.; Taylor, M.E.; Stone, P. Curriculum learning for reinforcement learning domains: A framework and survey. J. Mach. Learn. Res. 2020, 21, 1–50. [Google Scholar] [CrossRef] [Scilit]
- Portelas, R.; Colas, C.; Weng, L.; Hofmann, K.; Oudeyer, P.-Y. Automatic Curriculum Learning for Deep RL: A Short Survey. In Proceedings of the Twenty-Ninth International Joint Conference on Artificial Intelligence (IJCAI-20), Virtual, 7–15 January 2021; pp. 4819–4825. [Google Scholar] [CrossRef] [Scilit] [PubMed]
- García, J.; Fernández, F. A comprehensive survey on safe reinforcement learning. J. Mach. Learn. Res. 2015, 16, 1437–1480. [Google Scholar]
- Achiam, J.; Held, D.; Tamar, A.; Abbeel, P. Constrained policy optimization. In Proceedings of the 34th International Conference on Machine Learning, Sydney, Australia, 6–11 August 2017; PMLR: Cambridge, MA, USA, 2017; Volume 70, pp. 22–31. [Google Scholar]
- Alshiekh, M.; Bloem, R.; Ehlers, R.; Könighofer, B.; Niekum, S.; Topcu, U. Safe reinforcement learning via shielding. In Proceedings of the AAAI Conference on Artificial Intelligence, New Orleans, LA, USA, 2–7 February 2018; Volume 32, pp. 2669–2678. [Google Scholar]
- Carr, S.; Jansen, N.; Junges, S.; Topcu, U. Safe reinforcement learning via shielding under partial observability. In Proceedings of the AAAI Conference on Artificial Intelligence, Washington, DC, USA, 7–14 February 2023; Volume 37, pp. 14748–14756. [Google Scholar]
- Dawood, M.; Shokry, A.; Bennewitz, M. A Dynamic Safety Shield for Safe and Efficient Reinforcement Learning of Navigation Tasks. In Proceedings of the 7th Annual Learning for Dynamics and Control Conference, Proceedings of Machine Learning Research, Ann Arbor, MI, USA, 4–6 June 2025; Volume 283, pp. 686–697. Available online: https://proceedings.mlr.press/v283/dawood25a.html (accessed on 11 October 2026).
- Dulac-Arnold, G.; Levine, N.; Mankowitz, D.J.; Li, J.; Paduraru, C.; Gowal, S.; Hester, T. Challenges of real-world reinforcement learning: Definitions, benchmarks and analysis. Mach. Learn. 2021, 110, 2419–2468. [Google Scholar] [CrossRef] [Scilit]
- Wang, N.; Wang, Y.; Zhao, Y.; Wang, Y.; Li, Z. Sim-to-Real: Mapless navigation for USVs using deep reinforcement learning. J. Mar. Sci. Eng. 2022, 10, 895. [Google Scholar] [CrossRef] [Scilit]
- Luo, W.; Wang, X.; Han, F.; Zhou, Z.; Cai, J.; Zeng, L.; Chen, H.; Chen, J.; Zhou, X. Research on LSTM-PPO obstacle avoidance algorithm and training environment for unmanned surface vehicles. J. Mar. Sci. Eng. 2025, 13, 479. [Google Scholar] [CrossRef] [Scilit]
- Yun, S.-J.; Kim, H.; Kwon, J.-W.; Choi, Y.-H.; Kim, D.-H.; Lee, W.-K.; Kim, J.-W.; Choi, J.-H. Safety-enhanced COLREGs-compliant path planning for USVs with a CBF-based Safety Shield. J. Mar. Sci. Eng. 2026, 14, 1541. [Google Scholar] [CrossRef] [Scilit]
- Fossen, T.I. Handbook of Marine Craft Hydrodynamics and Motion Control, 2nd ed.; John Wiley & Sons: Hoboken, NJ, USA, 2021. [Google Scholar]
- Juliani, A.; Berges, V.-P.; Teng, E.; Cohen, A.; Harper, J.; Elion, C.; Goy, C.; Gao, Y.; Henry, H.; Mattar, M.; et al. Unity: A General Platform for Intelligent Agents. arXiv 2018, arXiv:1809.02627. [Google Scholar]
- Raffin, A.; Hill, A.; Gleave, A.; Kanervisto, A.; Ernestus, M.; Dormann, N. Stable-Baselines3: Reliable reinforcement learning implementations. J. Mach. Learn. Res. 2021, 22, 1–8. [Google Scholar]

Disclaimer/Publisher’s Note: The statements, opinions and data contained in all publications are solely those of the individual author(s) and contributor(s) and not of MDPI and/or the editor(s). MDPI and/or the editor(s) disclaim responsibility for any injury to people or property resulting from any ideas, methods, instructions or products referred to in the content. |
© 2026 by the authors. Licensee MDPI, Basel, Switzerland. This article is an open access article distributed under the terms and conditions of the Creative Commons Attribution (CC BY) license.