


Abstract
Submarine cold seeps are dynamic fluid-release systems; yet, in situ pore-pressure responses to penetration disturbance under different seep conditions remain poorly documented. To address this gap, we conducted in situ excess pore-pressure measurements using the Jiaolong manned submersible at six sites in the Qiongdongnan cold-seep area, northern South China Sea, supplemented by vane-shear tests on nearby sediments. Non-vent sites mainly exhibited positive excess pore-pressure dissipation, whereas transitions from positive to sustained negative excess pore pressure were observed only at the two active vent sites. These transitions occurred earlier at shallower depths, with zero-crossing times of 0.3~3.2 and 5.6~8.7 min at the two vents. Minimum excess pore pressures ranged from −22.1 to −19.8 kPa and from −27.3 to −22.0 kPa, respectively, and vertical pressure differences decreased over time. Short-term fluctuations included depth-localized variations and nearly synchronous multi-depth responses; the principal event showed a common positive excursion followed by a rapid negative drop and recovery, accompanied by concurrent spectral energy enhancement across all four depths. At the nearby A2 vane-test site, the sediment at 85 cm showed a higher peak shear strength and lower sensitivity than at 55 and 70 cm; longer pressure-decay times were independently observed at deeper pore-pressure sensors. These findings document contrasting post-penetration pressure pathways associated spatially with visible venting. A conceptual model integrates penetration disturbance, depth-dependent recovery, and subsequent negative-pressure evolution.
1. Introduction
Submarine cold seeps occur where gas-bearing fluids migrate through sedimentary strata and discharge at the seafloor. Seep activity is closely associated with gas accumulation, gas hydrate formation, material exchange, and the evolution of the seabed environment. Studies of cold seeps in the South China Sea have documented diverse seep-related landforms, geochemical processes, and gas-release characteristics [1]. High-resolution seismic surveys, drilling, and sediment geochemical evidence from the Qiongdongnan Basin have further revealed the links between seabed seep activity and gas chimneys, faults, and shallow gas-bearing systems [2,3,4,5,6,7]. Changes in pore-water pressure alter the effective stress state of sediments and affect their deformation and stability [8,9,10]. Seismic, geochemical, and water-column plume observations provide important evidence of fluid pathways and discharge at the seafloor, but they cannot directly resolve how pore pressure in shallow sediments near individual vents changes following a local disturbance. In situ pore-pressure measurements, interpreted together with observed vent activity, are therefore needed in order to characterize the local hydro-mechanical response.
Penetration-based pore-pressure testing provides a direct means of investigating the hydro-mechanical behavior of disturbed sediments. Probe penetration changes the stress and deformation states of the surrounding sediment and generates a spatially nonuniform excess pore-pressure field. Once penetration stops, this pressure field redistributes and gradually dissipates. Classical studies have linked penetration responses to soil properties through strain-path approaches, consolidation theory, and the interpretation of dissipation curves [11,12,13,14]. The effects of probe geometry, pressure-measurement position, and initial pressure distribution on measured responses and parameter interpretation have also been examined [15,16]. Subsequent studies of heterogeneous and sensitive soils have shown that stress history, shear deformation, and structural degradation can produce non-monotonic dissipation curves and complex pore-pressure responses [17,18,19,20,21]. These findings demonstrate that post-penetration pore pressure depends on both sediment properties and testing conditions. At active cold seeps, local fluid activity may also modify the pressure conditions at the measurement location. Field observations are thus needed in order to examine the relationship between penetration disturbance and subsequent pore-pressure evolution in its environmental context.
In situ investigations of active submarine fluid systems provide complementary evidence for interpreting complex pressure variations. While in situ pore-pressure monitoring in dynamic estuarine environments has documented how external wave forcing drives sediment erosion and pressure responses, combined pore-pressure and temperature observations at cold seeps have linked pressure responses in gas-bearing sediments to tidal variations and gas activity [22,23]. Joint analyses of pore-pressure and geotechnical data indicate that gas-migration characteristics and sediment stiffness may vary spatially [24]. Integrated environmental measurements and long-term acoustic monitoring have further revealed temporal variations in gas release and their relationships with tides and near-bottom water conditions [25,26]. In situ records from mud volcanoes and deep-water fault-related fluid systems have also documented pressure variations over different timescales [27,28]. Meanwhile, penetration-based pressure measurements in submarine landslide areas and deep-sea sediments have highlighted the need to distinguish natural pressure conditions, penetration-induced transients, and instrument reference conditions when interpreting pressure records [29,30,31]. Collectively, these studies show that a single pressure record can contain contributions from different processes. They also raise a field question: where vent activity can be identified directly, how do post-penetration pore-pressure responses differ between vents and nearby seabed locations, and how are these responses related to sediment mechanical properties?
Advances in deep-sea in situ pore-pressure measurement have made it possible to address this question. Early instruments for marine sediment pressure measurements, the differential-pressure probe PUPPI, and related methodological studies established the basis for acquiring and interpreting in situ seabed pressure data [32,33,34]. Devices designed for soft-sediment measurements, borehole penetration probes, and applications in complex geological settings subsequently broadened the range of deployment conditions [35,36,37,38,39]. Fiber-optic pressure sensing and combined penetration and tidal-response measurements have improved observational capabilities while underscoring the importance of reference-pressure transmission, measurement stability, and deployment procedures under high hydrostatic pressure [40,41,42]. Compared with approaches that rely primarily on deployment at predetermined positions, a manned submersible enables the direct visual identification of bubble release, vent locations, and seabed surface features, followed by targeted probe deployment using a manipulator. Previous manned submersible-supported in situ vane-shear testing in cold seep areas has demonstrated the feasibility of precisely located mechanical measurements in complex seabed environments [43]. Combining visual surveys with targeted testing therefore provides a means of directly linking the observed vent activity at each measurement location to its in situ pore-pressure record.
Against this background, this study uses the Jiaolong manned submersible to conduct in situ pore-pressure measurements at multiple sites and depths in shallow sediments of the Qiongdongnan cold seep area, supplemented by in situ vane shear data from nearby testing locations. Vent activity is identified visually, and pore-pressure records from different locations are compared to examine the temporal and vertical characteristics of post-penetration pressure evolution. Peak shear strength, remolded strength, and sensitivity are then used to explore the relationship between sediment mechanical responses to disturbance and pore-pressure behavior. Finally, a conceptual model of post-penetration pore-pressure evolution is developed to discuss the potential roles of sediment properties and local cold seep hydraulic conditions. The study provides field evidence for interpreting in situ pore-pressure records in shallow sediments at active cold seeps.
2. Geological Setting and In Situ Observations
2.1. Study Area and Observation Plan
This study conducted in situ excess pore-water pressure observations in shallow sediments of the Qiongdongnan Basin, northern South China Sea. The Qiongdongnan Basin is a Cenozoic rift basin on the northern continental margin of the South China Sea. Previous seismic investigations have identified mud diapirs, gas chimneys, and associated faults that may provide pathways for fluid migration from deeper strata toward the seafloor [44]. Regional studies have also documented spatial variations in cold-seep activity, seafloor morphology, and seep-related biological and carbonate accumulations [1,5]. These geological features provide regional context for the present observations, while the subsurface fluid pathways beneath the individual measurement sites remain unresolved. Figure 1 shows the study area, local bathymetry, and spatial distribution of the observation stations.
Figure 1.
Location, bathymetry, and seafloor characteristics of the investigated cold-seep sites in the Qiongdongnan Basin, northern South China Sea. (a) Regional location of the study area. (b) Basin-scale bathymetry and distribution of the pore-pressure observation sites and vane-shear test locations. (c) Local bathymetry of S01 and a representative seafloor photograph showing seep-related biological accumulations. (d) Local bathymetry of S02 and S03 and a representative seafloor photograph showing seep-related surface features. (e) Local bathymetry of the closely spaced S04 and S05 sites and a photograph of the surrounding seabed. (f) Local bathymetry of S06 and the adjacent vane-shear test locations A1 and A2, together with a representative seafloor photograph. Black triangles indicate pore-pressure measurement locations, red circles indicate cold-seep locations, and red stars indicate vane-shear test locations. A1 is located within the cold-seep area but away from a visible active vent, whereas A2 is located in the active-vent area adjacent to S06. Bathymetric color scales differ among the local panels.
Based on seafloor visual observations from a manned submersible, the six stations are classified into two categories: active vent and non-vent sites. This classification is strictly based on whether visible bubble emission was observed at the exact probe penetration point. Local topographic features are shown in Figure 1b–f. The six valid observations are numbered S01–S06. S01, S02, and S03 are classified as non-vent sites. They are located in areas with well-developed cold seeps, and the seafloor hosts seep-related organisms such as mussels and authigenic carbonates. No obvious active bubble vents were observed at the test sites. S04–S06 are, in another area, characterized by incipient cold-seep sediments. S04 is also a non-vent site. It is immediately adjacent to an active vent. S05 is located at active vent where bubble release was directly observed. S04 and S05 were two successive measurements using the same pore-pressure probe during a single dive, with a separation distance of approximately 1 m (Figure 1e). Penetration at S05 began approximately 60 s after the initiation of probe withdrawal from S04, including a 23 s interval following complete withdrawal. S06 is also classified as an active vent site, where active bubble release was directly observed.
Two vane-shear test locations, A1 and A2, were also investigated in the S06 survey area (Figure 1f). A1 was located within the cold-seep area but away from a visible active vent, whereas A2 was located in the active-vent area adjacent to, but separate from, the S06 pore-pressure measurement site. Vane-shear tests were performed at 60 cm at A1, and, at depths of 55, 70, and 85 cm, were performed sequentially during a single continuous penetration at A2. Table 1 summarizes the water depth, actual penetration depth, observation duration, and notes for each station.
Table 1.
Basic information for the six in situ observations.
2.2. In Situ Measurement Using an Excess Pore-Water Pressure Probe
To obtain the pore water pressure response and its vertical variation in shallow seafloor sediments under penetration disturbance, we conducted in situ measurements using a self-developed excess pore water pressure measurement system. The system consists of an independent battery housing, a connecting cable, and a measurement probe. The physical device and its in situ deployment on the seafloor are shown in Figure 2a and Figure 2b, respectively. The probe is about 110 cm long and integrates four independent pressure measurement units along its axis. It can simultaneously record excess pore pressure changes at different depths. The measurement points are shown in Figure 2c. They are numbered P1~P4 from shallow to deep, with a uniform spacing of 25 cm. The independent battery housing is placed on the seafloor and connected to the probe by an underwater cable. It powers the measurement units and performs data acquisition.
Figure 2.
Deep-sea in situ pore pressure measurement system and differential pressure measurement principle. (a) Photographs of the independent battery housing and the measurement probe integrated with four pressure sensors. (b) In situ deployment of the pore pressure measurement system on the seafloor, showing the measurement probe, battery housing, and connecting cable. (c) Schematic of the probe after penetration into sediment and an enlarged cross-section of the measurement unit. Ambient seawater pressure is transmitted through the oil bladder and oil-filled pressure transmission line to the reference pressure chamber of the sensor. Sediment pore water pressure is transmitted through the porous stone and water inlet to the measurement pressure chamber. The sensor obtains the pore pressure response from the pressure difference between the two chambers.
The study area has water depths of about 1365~1830 m. Hydrostatic pressure reaches 14~18 MPa. In contrast, penetration-induced excess pore pressure is only tens to hundreds of kPa. If absolute pore pressure were measured directly, the sensor would need to cover a large background pressure range. The excess pore pressure signal would account for a very small proportion, making resolution and accuracy difficult to guarantee. Therefore, this study adopts differential pressure measurement referenced to ambient seawater pressure. This eliminates the hydrostatic background pressure and improves the resolution of the excess pore pressure response. The four measurement units have a bidirectional differential-pressure measurement range of ±400 kPa, a nominal accuracy of ±0.05 kPa, and a sampling frequency of 5 Hz. The pressure calibration results for the four channels are provided in Supplementary Figure S1.
The structure of the measurement unit and the pressure transmission paths of the differential-pressure pore pressure probe are shown in the enlarged view in Figure 2c. Each measurement unit mainly consists of a porous stone, a water inlet, an oil-filled pressure transmission line, and a differential pressure sensor. During measurement, there are two independent pressure transmission paths. First, sediment pore water passes through the porous stone on the outer wall of the probe and enters the lower pressure chamber of the sensor through the water inlet. The porous stone transmits pore water pressure and blocks sediment particles. Second, the oil bladder and ambient seawater inlet are located in the upper section of the probe, above the sediment-penetrating section, and remain exposed to seawater throughout the measurement. Ambient seawater pressure acts on the oil bladder and is transmitted through the internal oil-filled pressure transmission line to the upper pressure chamber of the sensor, while the oil bladder prevents direct contact between seawater and the internal oil. The pressures from the two paths act on opposite sides of the sensor diaphragm, allowing the sensor to measure the pressure difference between sediment pore water and ambient seawater.
Synchronous multi-depth measurement can capture transient excess pore pressure responses at different measurement depths during penetration. It can also record continuous post-penetration pore pressure changes over time. This provides basic data for analyzing excess pore pressure dissipation, positive–negative excess pore pressure transitions, and short-period fluctuations at each depth. The sensor directly records the differential pressure response referenced to ambient seawater pressure. The excess pore pressure analyzed in this paper is obtained from this differential pressure after instrument background correction and local pressure baseline processing. The specific processing method is described in Section 2.4.
2.3. Joint Observation Workflow
This study used the Jiaolong manned submersible to conduct in situ excess pore pressure observations and vane-shear tests in seafloor sediments. The combined operation workflow is shown in Figure 3. After the submersible dives to the target area, test sites are selected based on seafloor morphology and cold-seep activity. The tool basket carries a pore-pressure probe, a vane shear device, environmental sensors, and a sediment sampler. After reaching the target site, the manipulator sequentially grasps the device, penetrates it, and performs in situ measurements. Probe penetration was carried out in stages using the manipulator. The probe was initially lowered toward the seabed using a rope attached to its upper section, with buoyant material helping maintain an approximately vertical orientation. After contact with the seabed, the probe penetrated the soft sediment under its self-weight and was allowed to stabilize. Additional downward force was then applied by the manipulator to the T-shaped head until the target penetration depth was reached. The complete penetration operation generally lasted less than one minute after initial seabed contact. Because penetration involved both the gravity-driven and manipulator-assisted stages, the penetration rate was not constant. The probe inclination was visually estimated to be less than approximately 5°, although no inclination sensor was installed for quantitative verification. The manipulator did not continuously grip the probe, and direct contact was limited to the downward pressing stage. During subsequent stationary monitoring, the probe was not touched by the manipulator.
Figure 3.
Schematic of the combined in situ pore-pressure and vane-shear test workflow [43]. The workflow shows the dive, in situ measurement with probe penetration, and ascent phases, together with the environmental sensor and sediment sampling modules.
After testing, the devices are recovered as the submersible ascends. During the S06 observation, the pore-pressure and vane-shear tests were conducted at adjacent but separate locations, approximately 1 m apart, and their measurement depths did not fully coincide. Therefore, the two datasets were used to compare local depth-dependent response characteristics rather than to establish direct stratigraphic correspondence. The pore-pressure probe continuously recorded penetration-induced excess pore pressure and its dissipation. The vane shear device simultaneously obtained the in situ shear strength of shallow sediments in this area. These two independent mechanical observations complement each other and provide constraints on the mechanistic interpretation of anomalous pore-pressure responses.
The in situ shear test used a self-contained deep-sea in situ vane-shear test system independently developed by our team [43]. The test consists of three consecutive stages: undisturbed shearing, rapid disturbance, and remolded shearing. First, the vane was rotated 90° at 0.2°/s to obtain the shear strength response of undisturbed sediment. Then, it was rotated another 720° at about 6°/s to disturb the sediment in the shear zone. Finally, the rotation rate was returned to 0.2°/s, and the vane was rotated another 90° to obtain the shear response of the remolded sediment. The torque and rotation angle were recorded continuously throughout the test. Shear strength was then calculated from these records. The peak undisturbed strength and remolded strength were extracted to evaluate the sediment structure and disturbance sensitivity. Environmental monitoring was conducted simultaneously with the mechanical tests. This provides constraints on the environmental background and geological interpretation of pore-pressure and strength responses.
2.4. Data Processing and Analysis Methods
Using station S06 and P4 as an example, Figure 4 presents the complete pressure record during deployment, which can be divided into five operational stages. During Stage I (descent), the raw differential pressure increased with increasing water depth, indicating a pressure-dependent response of the measurement system. During Stage II (pre-penetration), the probe remained in seawater near the seafloor, while the raw differential pressure gradually decreased despite the absence of sediment penetration. This time-dependent background may be associated with the pressure transmission characteristics of the shared oil-filled reference system. One possible cause is the insufficient volume compensation or restricted deformation of the oil bladder under high hydrostatic pressure, although the specific mechanism has not been confirmed. Stage II was therefore used to estimate the time-dependent instrumental background. Stage III comprises probe penetration and subsequent in situ monitoring, during which the background-corrected pressure records were used to characterize the sediment response. Following probe withdrawal (Stage IV), the measurement units were again exposed to seawater, but withdrawal may have altered the pressure balance of the measurement system, resulting in nonzero differential pressures and subsequent gradual changes. During Stage V (ascent and recovery), the raw differential pressure decreased as the submersible ascended and eventually returned to a plateau comparable to that observed before descent. The final part of Stage V also included instrument recovery and handling after reaching the surface.
Figure 4.
Complete P4 pressure record and background correction at site S06. The purple solid line shows the raw pressure, the blue dashed line the background fitted to Stage II and extrapolated forward, and the red solid line the corrected excess pore pressure; the green horizontal dashed line indicates the zero reference level. Stages I–V represent manned submersible descent, pre-penetration background decay, probe penetration and in situ monitoring, post-withdrawal seafloor operations, and ascent, recovery, and associated operations, respectively. Stage II provides the background data, whereas Stage III defines the analysis interval for the penetration response. The background correction was applied to Stage III for the analysis of sediment pore-pressure responses. The corrected values shown during Stages IV and V are provided only for visualization of the complete record and should not be interpreted as sediment excess pore pressures; the raw differential-pressure signal is used to assess the instrument response during ascent.
(1) Background fitting and excess pore pressure correction. Stage II records were used to determine the pre-penetration slowly varying background (Figure 4). For each channel, the valid continuous records were fitted independently using a nonlinear logarithmic function:
where time is referenced to the start of the background fitting interval as zero and is expressed in minutes; the fitted background and model parameters were determined independently for each channel. Furthermore, a locally stable time window selected within Stage II was used to calculate the mean difference between the raw pressure and the fitted background, which was taken as the zero offset. The fitted background was extrapolated to Stage III to calculate the corrected excess pore pressure:
ubg,i(t)=ai + biln(t + ci)
Δui(t)=uraw,i(t)-ubg,i(t)-zi
In Equation (2), the corrected excess pore pressure is obtained by sequentially subtracting the fitted background and the local zero offset from the raw pressure. After background removal and zero correction, the Stage II records in Figure 4 are close to the zero reference level, and the penetration-induced pressure increment and subsequent changes in Stage III are isolated. Records from Stages IV and V were retained to display the complete operational process but were not used for calculating penetration-response parameters. Following probe withdrawal (Stage IV), changes in the system pressure balance may cause deviations from zero. During ascent (Stage V), the seafloor-derived background correction is no longer applicable; instead, the raw signal returns toward its initial near-surface level. Therefore, Stages IV and V were excluded from the quantitative excess pore-pressure analysis.
As a quality-control check, the background model was independently evaluated using a 15-min pre-penetration seawater record at S06, following calibration of the model with the preceding 48 min of data. The prediction RMSEs ranged from 0.157 to 0.206 kPa across the four channels, and comparisons of the raw and corrected pressure records are provided in Supplementary Figure S2. A further sensitivity check showed that the late-stage negative responses at S05 and S06 were retained when the local zero-reference interval or background-fitting interval was slightly adjusted (Supplementary Figure S3).
(2) Characteristic decay time. For positive excess pore pressure decay in Stage III, a common reference time was selected within the same penetration, and each channel was normalized by its own reference positive pressure:
The reference pressure was positive; therefore, the normalized pressure at the reference time is 1. The times required for the normalized pressure to first continuously decrease to 0.5 and to the zero reference level were defined as the 50% characteristic decay time and the sustained return-to-zero time, respectively,
To reduce the influence of transient noise on threshold identification, a 31 s moving median was used to smooth the pore pressure series, and the continuous satisfaction of the threshold for 5 s was used as the criterion for the characteristic time. Negative pressure persistence was identified using a 30 s sliding window, requiring at least 90% of valid records within the window to be no greater than zero; on this basis, the proportion and average amplitude of negative pressure during the valid observation period were calculated.
(3) Residual analysis and short-time Fourier transform. For short-duration fluctuations superimposed on the slowly varying pore pressure in Stage III, a 180 s moving average was used to extract the trend, and the residual was calculated as follows:
In Equation (5), the second term on the right-hand side is the slowly varying trend. The negative pulse amplitude was determined from the pre-event reference level. The times at which the residual first reached 20% of this amplitude, reached the negative extreme, and reached 50% recovery sustained for at least 3 s were used to characterize the pulse onset, peak, and recovery, respectively. The short-time Fourier transform (STFT) was applied directly to the background-corrected pore pressure series:
where τ is the time-window position, f is frequency, w is the window function, and fs is the sampling frequency. The power spectral density was integrated over the 0.02–0.10 Hz band and converted to decibels relative to the maximum band power among the four channels during the analysis period, to compare the time-depth distribution of short-duration fluctuations.
(4) Sensitivity and mechanical indices. The peak undrained shear strength was extracted from the undisturbed vane shear curve, and the remolded residual strength was determined as the average strength over the last 30° of rotation of the remolded shear curve. Sensitivity was defined as follows:
On this basis, the undisturbed strength, remolded strength, and relative strength loss at different test depths were compared, and a horizon comparison was conducted with the characteristic times of adjacent pore pressure measurement points.
3. Results
3.1. Excess Pore Pressure Responses and Dissipation Characteristics at Different Sites
Penetration-induced excess pore pressure at different stations showed distinct response amplitudes and evolution characteristics (Figure 5). The S01 non-vent station (Figure 5a) showed small overall pore pressure changes. The amplitudes of the four depth curves remained within a narrow range. They maintained a vertical order of increasing amplitude with depth throughout (P4 highest, P1 lowest). During early penetration, all channels showed short-term fluctuations. P4 showed relatively obvious positive and negative pressure jumps. After penetration, excess pore pressure at all channels gradually fell and stabilized.
Figure 5.
In situ responses and temporal evolution of penetration-induced excess pore pressure at different observation sites. (a–d) Non-vent sites S01–S04; and (e,f) active vent sites S05 and S06. The insets in panels (e,f) provide enlarged views of the early pressure responses, highlighting the insertion-related fluctuations at S05 and the initial pressure evolution at S06. In each panel, time is relative to the onset of probe penetration for each test, and the vertical axis is background-corrected excess pore pressure. The four colored curves represent pore-pressure responses at depths P1–P4, respectively. Vertical dashed and dotted lines indicate recorded operation times, including penetration initiation, penetration completion, and probe withdrawal, where available. The horizontal dashed line denotes zero excess pore pressure.
The S02 non-vent station (Figure 5b) produced an obvious positive excess pore pressure response during penetration. The peak approached 200 kPa, one of the strongest responses among the six observations. After penetration, excess pore pressure at all channels decayed continuously with time. At about 14 min, it remained at about 50 kPa positive excess pore pressure. However, the residual pore pressure remained significantly above zero. Unlike S02, S03 (Figure 5c) had generally lower initial response amplitudes. Channels P1–P3 mainly fluctuated slightly around zero. P4 maintained relatively high positive excess pore pressure and showed multiple step-like changes. This indicates a clear depth-dependent feature: shallow channels had weak pore pressure responses to penetration, while the deep channel retained significant residual excess pore pressure. S02 and S03 both belong to non-vent stations, but they differ significantly in response intensity and vertical pattern.
The S04 non-vent station (Figure 5d) showed a relatively continuous process of positive excess pore pressure generation and dissipation. During early penetration, excess pore pressure at all channels increased rapidly to a peak. It then underwent two distinct stages: rapid initial decline and slow later decay. During the about 120 min observation, pore pressure at the four channels gradually approached zero. Compared with S02, S04 differed in initial response amplitude and subsequent decay. However, both were dominated by positive excess pore pressure decay during the valid quiescent observation period. They can be grouped into the same response mode.
Unlike the above stations, active vent stations S05 and S06 (Figure 5e,f) both showed a transition from positive to negative excess pore pressure. At S05, initial positive excess pore pressure decreased continuously with time. All channels successively crossed zero and gradually formed a negative excess pore pressure of about −20 kPa. They then remained relatively stable at negative values for a long period. This indicates that post-penetration pore pressure evolution was not simple positive pressure dissipation. Instead, it showed a clear negative deviation from hydrostatic conditions. S06 also showed the rapid decay of initial positive excess pore pressure, crossing zero, and entering a negative stage. Negative excess pore pressure persisted during subsequent observation. The response trends at the four depths were basically consistent, but amplitudes still differed.
Overall, the pore pressure evolution in the six observations can be summarized into two response modes. One is dominated by the generation and decay of positive excess pore pressure. The other transitions from positive excess pore pressure decay to a negative excess pore pressure stage. The two modes show systematic differences in the response amplitude, decay rate, sign of residual pore pressure, and vertical differences. The transition to sustained negative pressure was unique to the two active vent sites. In contrast, no such negative evolution was captured at any of the four non-vent stations during the available observation windows. The magnitude, duration, and vertical differences of negative excess pore pressure in the latter mode are further quantified in Section 3.2.
3.2. Negative Excess Pore Pressure Responses at Cold-Seep Vents and Their Vertical Characteristics
To quantify negative excess pore pressure responses at active vents, we extracted the time to first sustained zero crossing, minimum negative excess pore pressure, fraction of negative pressure duration, and mean magnitude during the negative pressure stage for the four measurement points at S05 and S06 (Figure 6). We compared the response characteristics of the two stations in terms of formation time, magnitude, and persistence.
Figure 6.
Quantitative characteristics of negative excess pore-pressure responses at active vent sites: (a) time to first sustained zero crossing; (b) minimum excess pore pressure; (c) fraction of the valid observation period with negative excess pore pressure, with the corresponding cumulative negative durations (min) indicated above the bars; and (d) time-averaged magnitude during the negative-pressure stage. Blue and green bars represent S05 and S06, respectively. Zero-crossing times are referenced to penetration initiation. The negative-duration fraction and mean magnitude are calculated from the cumulative negative duration and the pressure-time integral within the valid observation period, respectively.
The positive-to-negative transition times differed clearly between the two stations (Figure 6a). At S05, P1–P4 showed sustained zero crossing at about 0.3, 1.3, 2.1, and 3.2 min after penetration, respectively. The times were generally delayed with increasing depth. At S06, zero-crossing times ranged from 5.6 to 8.7 min. P1 and P2 were similar, and P4 was the latest. The vertical range of zero-crossing times was about 3 min at both stations. However, S05 entered the negative stage earlier at all depths. At S05, the earliest reported zero crossing (P1, approximately 0.3 min) occurred during probe insertion, whereas the later crossings at P2–P4 occurred after penetration completion (Figure 5e). The early crossing may have been influenced by insertion-induced disturbance and was therefore distinguished from the sustained negative responses during subsequent stationary monitoring.
The magnitude and persistence of negative excess pore pressure further revealed station differences (Figure 6b–d). The minimum negative excess pore pressure at S05 was −22.1 to −19.8 kPa, with a depth range of about 2.3 kPa. At S06, it was −27.3 to −22.0 kPa, with a range of about 5.3 kPa. The negative values were larger at shallow depths P1 and P2. The negative-pressure duration fractions were 88.0–98.9% at S05 and 92.0–96.0% at S06, corresponding to cumulative negative durations of 23.45–26.35 min and 99.22–102.35 min, respectively. S06 exhibited larger negative-pressure magnitudes and a later positive-to-negative transition than S05. This indicates that the formation time of negative pressure is not simply related to its subsequent magnitude and persistence.
To further analyze the vertical evolution of these differences, we calculated the excess pore pressure differences between adjacent measurement points and between P4 and P1. We also extracted synchronous pressure profiles for four representative periods (Figure 7). In the initial stage, the excess pore pressure at S05 generally increased with depth. At S06, P2–P4 were close to 80 kPa, and the initial vertical difference was relatively small. Because valid data for P1 at S06 were insufficient in this stage, its initial profile shows only P2–P4.
Figure 7.
Vertical pressure differences and stage-dependent evolution at active vent sites. (a,b) Temporal variations in excess pore-pressure differences between adjacent sensors and between P4 and P1 at S05 and S06, respectively. (c,d) Synchronous vertical pressure profiles at four characteristic times: initial response (i), sustained zero crossing of the four-sensor mean (ii), negative-pressure development (iii), and late negative-pressure stage (iv).
During the positive-to-negative transition stage, both stations showed the coexistence of positive and negative excess pore pressure at different depths (Figure 7c,d). At S05, at about 1.75 min, P1 and P2 had dropped to −7.9 and −1.9 kPa, respectively. P3 and P4 still remained positive at 1.6 and 8.1 kPa. The pressure difference between P4 and P1 was about 16.1 kPa. At S06, at about 6.47 min, P1–P3 had entered the negative stage. P4 still maintained a positive excess pore pressure of about 13.8 kPa. The deep–shallow pressure difference was about 19.4 kPa. This indicates that, when the four-channel mean crossed zero, the positive-to-negative transition was not completed synchronously at all depths. The deepest measurement point lagged relatively at both stations.
As each measurement point successively entered the negative stage, the vertical pressure differences gradually decreased (Figure 7a,b). At S05, the pressure difference between P4 and P1 decreased to 7.2 kPa at about 8.2 min. At S06, it decreased to 13.4 kPa at about 10.85 min. The differences between adjacent depths also showed different distributions at the two stations. At S05, the main pressure difference was concentrated between P1 and P2. At S06, it was concentrated between P3 and P4. In the late negative-pressure stage, the four-channel pressures at S05 were concentrated at −22.1 to −19.1 kPa at about 20.9 min, with a deep–shallow pressure difference of about 3.0 kPa. At S06, they were concentrated at −22.2 to −20.8 kPa at about 84.5 min, and the deep–shallow pressure difference decreased to about 1.3 kPa.
Overall, both active vents showed a staged evolution: the vertical coexistence of positive and negative pressures, successive entry of each depth into negative values, and later reduction of vertical pressure differences. S05 had an earlier positive-to-negative transition. S06 had larger negative pressure peaks and a higher duration fraction. However, both stations formed multi-depth negative responses with similar magnitudes in the late observation period. This indicates that negative excess pore pressure at active vents differs not only among stations. Its vertical distribution also changed over time from marked differentiation to gradual convergence.
3.3. Short-Term Pore Pressure Fluctuations and Spectral Characteristics at Active Vents
The sustained negative excess pore pressure record at S05 was superimposed with obvious short-term pressure fluctuations (Figure 8). All four measurement points showed a short-term pressure drop and subsequent recovery at about 20.85 min after penetration (Figure 8a). This indicates that, besides the slowly varying component, pressure evolution also contained a short-term common variation component.
Figure 8.
Short-term pore-pressure fluctuations and multi-depth responses at active vent site S05. (a) Background-corrected excess pore-pressure records and their 180 s moving-average trends. (b) Detrended residuals from 15 to 23 min after penetration initiation. (c) Onset, negative peak, and 50% recovery times of the main pulse, referenced to the common negative peak at 20.85 min. (d) Time-depth distribution of band-integrated spectral power obtained using the short-time Fourier transform.
Detrended residuals revealed the amplitude and depth differences of short-term fluctuations (Figure 8b). Before the main pulse, P2 showed a local positive residual of about 0.07 kPa at about 16 min. P1 showed a brief negative residual of about −0.15 kPa at about 18 min. Neither formed a consistent four-channel response. Subsequently, residuals at all four channels increased together after about 19 min and dropped rapidly near 20.85 min. The negative residual extremes for P1~P4 were −1.55, −1.13, −1.71, and −1.79 kPa, respectively. The corresponding pulse peak-to-trough amplitudes were 1.99, 1.39, 2.14, and 2.16 kPa. P3 and P4 had larger pressure fluctuations, while P2 had the smallest. This indicates that the common transient response had clear depth differences.
The characteristic times of the main pulse further indicate that the four depths responded nearly synchronously (Figure 8c). The pulse onset times at P2~P4 were about 1 s earlier than that at P1. All four channels reached negative extremes near 20.85 min. The times required to reach 50% recovery were 6, 3, 5, and 5 s for the four measurement points, respectively. P2 recovered fastest, and P1 recovered slowest. Thus, the negative extremes of the main pulse appeared nearly synchronously at the current 1 s time resolution. However, its pressure changes amplitudes and recovery processes showed vertical differences.
The short-time Fourier transform results further revealed spatiotemporal differences in pressure fluctuations (Figure 8d). During about 15~19 min, enhanced band power was mainly concentrated at shallow depths. This corresponded to local residual changes at P2 around 16 min and P1 around 18 min. In contrast, a high-power band covering all four observation depths formed near 20.85 min. This was consistent with the nearly synchronous response of the main negative pulse. The contrast between early localized shallow enhancement and later concentrated multi-depth enhancement indicates that short-term pore pressure changes at S05 had different spatial response characteristics. The main pulse was more prominent in both amplitude and band power.
Overall, the short-term pore pressure changes at S05 were characterized by the coexistence of local fluctuations and multi-depth common responses. The main pulse reached negative extremes nearly synchronously at the four measurement points. Its amplitude and recovery time differed with depth. This indicates that the records contain both multi-channel common changes and depth-dependent local responses. While the near-synchronous timing is clear, it does not, by itself, uniquely identify the source of the event. Without independent simultaneous observations (e.g., temporal changes in venting or temperature), the exact origin of this transient event remains open. It may reflect cold-seep-related pressure disturbances, the influence of the instrument’s common reference pressure, or a combination of both, which provides a basis for subsequent analysis.
3.4. In Situ Shear Strength Characteristics of Shallow Sediments in the Cold-Seep Area
To compare the mechanical responses of shallow sediments under different vent activity conditions in the cold-seep area, we analyzed the in situ vane shear results from non-vent test point A1 and active vent test point A2 (Figure 9). The test depth at A1 was 60 cm. The test depths at A2 were 55, 70, and 85 cm. Based on undisturbed and remolded shear curves, we compared the peak strength, post-peak softening, and remolded strength characteristics.
Figure 9.
In situ vane shear responses and post-peak softening of sediments at non-vent and active vent sites in the cold-seep area. Insets show corresponding in situ test photographs.
The peak undrained shear strength of A1 at 60 cm was 10.68 kPa. After reaching the peak, it gradually decreased and showed some recovery at the end of shearing (Figure 9a). The remolded-stage strength locally exceeded the residual strength at the end of the initial undisturbed shearing stage, although it remained below the undisturbed peak. This difference may reflect the distinct shearing histories and transient post-disturbance responses, but its specific origin remains uncertain. The peak strengths of A2 at 55 and 70 cm were 11.24 and 10.29 kPa, respectively. They then decreased continuously with increasing shear angle, dropping to 6.08 and 6.78 kPa at 90°, respectively (Figure 9b,c). In contrast, the peak strength of A2 at 85 cm increased to 22.73 kPa, about twice that of the other three test points. It reached the peak at about 10° and then decreased to 13.2 kPa at 90° (Figure 9d). The strengths of all four remolded shear curves were lower than the corresponding undisturbed peaks. Their average strengths over the final 30° shear angle range were 6.10, 4.41, 3.99, and 10.34 kPa, respectively.
Based on the undisturbed peak strength and the remolded strength in the final stage, the sensitivity of A1 at 60 cm was 1.75. At A2, the sensitivities at 55, 70, and 85 cm were 2.55, 2.58, and 2.20, respectively. The deep sediment at 85 cm at A2 had the highest undisturbed peak strength and remolded strength. However, its sensitivity was lower than those at 55 and 70 cm. This indicates that the increase in undisturbed strength was not accompanied by a proportional increase in remolded strength loss. A1 and A2 had similar peak strengths at comparable depths. However, their remolded strengths and sensitivities differed. These results indicate that the strength and post-disturbance response of sediments near active vents have vertical and local differences. This provides independent observational evidence for the mechanical analysis of pore pressure evolution. However, sediment samples or depth-specific sedimentological descriptions were not available for these test intervals, so this contrast cannot be attributed to a particular sediment layer, grain-size variation, or carbonate cementation.
4. Discussions
4.1. Differentiation of Post-Penetration Excess Pore Pressure Evolution Pathways at Active Vents and Its Interpretation
The positive-to-negative transition was observed at both active vent sites, whereas it was not recorded at the other four stations during the available observation periods.
The normalized curves from the six observations show that the main differences in post-penetration excess pore pressure are not only in the decay rate but also in the subsequent evolution pathway (Figure 10a). S01, S02, and S04 mainly show positive excess pore pressure decay. S03 shows an initial rise and non-monotonic changes. In contrast, active vents S05 and S06 both enter a sustained negative stage after positive pressure decline. At 12 min after the reference time, the normalized pressures at S04, S05, and S06 are 0.340, −0.970, and −0.207, respectively. Thus, judging the complete recovery process of sediments only from early pressure decline may overlook fundamental differences in the subsequent responses among stations. Chai et al. (2014) used model tests and numerical analysis to show that the initial excess pore pressure distribution generated by penetration affects subsequent dissipation [45]. Jia et al. (2024) further showed that the measurement position, over-consolidation ratio, and permeability can change the shape of dissipation curves [18]. These studies provide geomechanical explanations for response differences among stations. They also show that the influence of cold-seep activity cannot be judged only from non-monotonic curves. However, the two active vents in this study both show sustained negative evolution. The other four test sites did not show the same pattern during their valid observation periods. This suggests that the local environment at active vent sites may influence the subsequent pressure pathway, although the exact mechanism remains to be determined.
Figure 10.
Comparison of post-penetration excess pore-pressure pathways and a simplified decay model. (a) Normalized P4 excess pore-pressure records at six sites. (b) Normalized responses at non-vent site S04 and active vent site S05 from the same dive, together with their difference (U50–U40). Shading highlights the negative difference between the two pathways. (c) Observed responses at S04, S05, and S06 compared with a zero-asymptote single-exponential model fitted to the first 1.5 min after the selected reference time. Pressure is normalized using the selected reference time as the origin at each site, and negative values are retained.
Previous studies in the Qiongdongnan Basin have documented spatially variable cold-seep activity, fluid-migration pathways, and seafloor morphology [5]. Such regional heterogeneity provides a geological context for the different pore-pressure responses observed in this study. In addition to visible vent activity, variations in shallow sediment properties and local hydraulic conditions may contribute to the observed differences. However, these properties and the seepage histories of individual measurement points were not independently determined, and the observed spatial association does not establish a unique causal mechanism.
S04 and S05, deployed adjacent to each other during the same dive, further strengthen this understanding (Figure 10b). Both stations experienced post-penetration positive excess pore pressure decline. However, S04 remained positive and gradually decayed. S05 quickly crossed the zero reference level and formed sustained negative values. At 12 and 25 min after the reference time, the normalized pressure differences between the two stations were −1.310 and −1.335, respectively. This indicates that pathway differentiation persisted in subsequent observations. Elsworth et al. (2006) provided an important alternative explanation [19]. In silty soils with dilatancy, a non-uniform initial pressure distribution caused by penetration can make the pore pressure change from positive to below hydrostatic during dissipation. Therefore, a positive-to-negative transition alone cannot prove that cold-seep fluid activity is the only source of negative pressure. However, that study focused on specific dilatant soils. Its pressure reference definition and medium conditions differ from those in this study. This study also did not directly measure dilatant deformation. Although a causal link is not uniquely demonstrated, the field comparison between S04 and S05 shows that the presence of active venting at the test site is spatially associated with the differentiated post-penetration pressure pathway in adjacent sedimentary environments. Given the close spacing and short interval between the two penetrations, a possible influence of the preceding penetration at S04 on the subsequent pressure response at S05 cannot be entirely excluded.
This pathway differentiation is also reflected in the difference between early decay and a late response. Using a zero-asymptote single-exponential function to fit records from 1.5 min after the reference time, the apparent decay time scales of S04, S05, and S06 were 8.98, 1.42, and 3.00 min, respectively (Figure 10c). This model can describe early positive pressure decline. However, it cannot reproduce the subsequent negative values at active vents. At 12 min after the reference time, the model predictions for S05 and S06 were 0.0002 and 0.018, respectively. The observed values had dropped to −0.970 and −0.207. This deviation remained after changing the early fitting window. It should be noted that the model cannot produce negative values primarily because of its zero-asymptote assumption. Therefore, model deviation cannot independently prove a specific cold-seep discharge mechanism. Sultan and Lafuerza (2013), in a study of marine sediments, noted that predicting the in situ equilibrium pore pressure from partial dissipation records requires specific curve conditions [16]. Short-term data cannot always reliably constrain long-term pressure states. The comparison in this study further shows that the decay time scale obtained from early fitting can characterize the early response. However, it cannot represent the complete pressure evolution at active vents. It also cannot be used directly to infer their natural equilibrium pore pressure.
Overall, the anomaly identified in this study is not simply a non-monotonic dissipation or positive-to-negative pore pressure transition. Instead, a sustained divergence in pressure evolution pathways was observed between the active vent sites and the non-vent sites. While this phenomenon may include the effects of penetration disturbance and sediment mechanical properties, the most robust observation of this study is that sustained negative responses were recorded at both sites where active bubble venting was visually observed. The specific process responsible for generating these negative pressures—whether related to seep fluid activity, geomechanical effects, or a combination of both—remains unresolved and requires independent synchronous environmental observations to be uniquely identified. To further understand the relationship between these two effects, it is necessary to analyze the depth differences in pore pressure recovery and independent sediment mechanical evidence.
4.2. Vertical Variations in Excess Pore-Pressure Recovery and Sediment Mechanical Properties
Multi-depth excess pore pressure records at S06 show that post-penetration pressure recovery was not synchronous across the entire observation depth (Figure 11a,b). The reference positive excess pore pressures at P2~P4 were 45.55, 49.33, and 72.62 kPa, respectively. Their corresponding 50% characteristic decay times were 1.07, 1.25, and 1.90 min. Their sustained zero-crossing times were 3.07, 3.65, and 6.20 min, respectively. Even after removing the scale difference in reference pressure amplitude, the relative decay and zero-crossing process at deep P4 still lagged markedly. This indicates that pressure recovery has depth characteristics independent of initial amplitude differences.
Figure 11.
Comparison of depth-dependent pore-pressure characteristics at S06 and vane-shear properties at adjacent test locations. (a) Reference positive excess pore pressure, (uref blue solid line with filled circles, lower horizontal axis) and minimum normalized excess pore pressure Umin, (red dashed line with open squares, upper horizontal axis). P1–P4 represent pore-pressure sensors at depths of 10, 35, 60, and 85 cm, respectively. (b) Characteristic time to 50% pressure decay (t50, green solid line with filled circles) and time to sustained zero crossing (t0, orange dashed line with open squares). (c) Peak undrained shear strength (Su,undisturbed, blue solid line with circles), remolded shear strength (Su,remolded, orange solid line with squares), and sensitivity (St, green solid line with triangles). Shear strengths are referenced to the lower horizontal axis, whereas sensitivity is referenced to the upper horizontal axis. Filled symbols connected by lines represent the A2 measurements at 55, 70, and 85 cm, while open symbols represent the separate A1 measurement at 60 cm.
Adjacent vane-shear tests at A2 further reveal vertical differences in sediment mechanical properties (Figure 11c). The peak shear strengths at 55 and 70 cm were 11.24 and 10.29 kPa, respectively, with sensitivities of 2.55 and 2.58. At 85 cm, peak strength increased to 22.73 kPa, and the final remolded strength increased to 10.34 kPa. However, sensitivity decreased to 2.20. Combined with the shear curves in Figure 9, deep sediments have a higher absolute strength and still show obvious post-peak softening. This indicates that the undisturbed bearing capacity and relative strength loss after remolding do not have the same depth trend. In contrast, non-vent test point A1 at 60 cm had a peak strength of 10.68 kPa, close to the shallow results at A2. However, its sensitivity was only 1.75. This further indicates the differences in mechanical resistance responses among test sites.
At A2, both the peak strength and remolded strength at 85 cm were clearly higher than those at shallow depths, but the sensitivity was relatively lower. At the same time, P4 near S06 showed a longer characteristic decay time (Figure 11). This phenomenon indicates that the undisturbed bearing capacity, relative strength loss after disturbance, and pore pressure recovery rate do not show a consistent depth trend. Previous studies have shown that penetration-induced structural degradation and remolding softening can change local deformation and excess pore pressure distribution. They can also affect sediment mechanical responses through subsequent dissipation and reconsolidation [17,46,47]. Combined with the observations in this study, a higher peak strength at depth did not correspond to faster pressure recovery. This indicates that undisturbed strength alone cannot explain depth differences in pore pressure dissipation. Disturbance softening characteristics and associated structural changes may also participate in regulating early pore pressure recovery.
The depth-dependent variations in early excess pore pressure recovery at S06 are compatible with the vertical contrasts in strength and sensitivity observed in the adjacent sediments at A2. However, because A2 and S06 are separate measurement locations and the tested depths do not fully coincide, this relationship remains an indirect comparison. Nevertheless, it suggests that sediment mechanical heterogeneity may influence post-penetration pressure responses. Over time, the negative excess pore pressure at different depths gradually converged, indicating that early differentiated recovery and later multi-depth common changes constitute two distinct evolutionary features.
4.3. Conceptual Model of Post-Penetration Excess Pore Pressure Evolution in the Cold-Seep Area
The above station comparison and mechanical analysis show that early pressure recovery after penetration has clear depth differences. The subsequent evolution at active vents further shows sustained negative responses. S04 mainly shows positive excess pore pressure decay. S05 and S06 show multi-depth convergence to negative values and local short-term fluctuations after the positive-to-negative transition (Figure 7, Figure 8, and Figure 10). These phenomena indicate that local pressure changes caused by penetration disturbance and subsequent pressure evolution do not have completely identical spatiotemporal characteristics. On this basis, this paper establishes a conceptual model of post-penetration pore pressure evolution in the cold-seep area (Figure 12). Through a comparison between non-vent S04 and active vent sites, it analyzes the links among initial disturbance, depth-related pressure recovery, and subsequent negative responses.
Figure 12.
Conceptual model of post-penetration pore pressure evolution in the cold-seep area. (a) Non-vent site S04 is dominated by decay of penetration-induced positive excess pore pressure. (b) Active vent sites S05 and S06 show positive-to-negative excess pore pressure transition and sustained negative responses, while the possible influence of localized fluid activity is presented as an interpretative hypothesis. (c) Three stages of post-penetration pore pressure evolution at active vents, including penetration disturbance, depth-related pressure recovery, and sustained negative responses.
Figure 12a,b first show pressure pathway divergence under two test environments. Penetration changes the stress and deformation state of sediments around the probe and generates the initial positive excess pore pressure. After penetration stops, pressure gradually recovers. For non-vent S04, records mainly show the continuous decay of positive excess pore pressure. Active vents S05 and S06 further cross the zero-reference level and enter a negative stage. Previous studies have shown that non-uniform pressure distribution and soil shear characteristics caused by penetration can produce complex dissipation curves and even positive-to-negative pressure transitions [19]. Therefore, negative values are not unique to cold-seep activity. However, this study identified sustained negative evolution at both active vents confirmed by manned submersible. Through a comparison of adjacent S04 and S05, it reveals a spatial link between the subsequent pathway and the local vent environment. Soil responses related to penetration disturbance may affect early changes. Local hydraulic conditions at active vents may further regulate subsequent pressure pathways.
This process shows clear stages in the vertical direction (Figure 12c). In the early penetration stage, the positive excess pore pressure generated at different depths and its recovery time differ. Shallow measurement points enter negative values first. Deep conversion lags relatively. Over time, the pressure differences between P4 and P1 at S05 and S06 decreased from about 16.1 and 19.4 kPa during the transition stage to about 3.0 and 1.3 kPa in the late stage, respectively (Figure 7). Combined with adjacent vane shear results, vertical changes in sediment strength and disturbance softening characteristics may participate in regulating early pressure recovery. In the late stage, vertical differences decrease while negative values are maintained at all depths. This shows common change characteristics different from early differentiation. Thus, the complete response at active vents cannot be described only by independent positive excess pore pressure dissipation at each depth. It also requires considering the link between post-penetration pressure field evolution and local environmental conditions.
In situ cold-seep studies provide further evidence for understanding these subsequent changes. Sultan et al. (2020), using combined multi-depth pore pressure and temperature observations, linked some negative differential pressure events to shallow free gas migration and release [22]. Ferré et al. identified different pressure components in a Norwegian cold-seep area, including penetration pressure decay, tidal responses, and positive environmental excess pore pressure [26]. While these analogues demonstrate that gas migration and local hydraulic conditions can influence pore-pressure signals at other cold seeps, they do not, by themselves, prove that identical processes generated the anomalies observed in the present study. Our interpretation relies primarily on the local evidence obtained here, particularly the direct visual observations of active bubble venting at S05 and S06 and the contrasting pressure pathways between the adjacent non-vent site S04 and active vent site S05. This study uses the differential pressure measurement referenced to ambient hydrostatic pressure. It removes the slowly varying instrument response by background fitting before penetration. The sustained negative values identified represent dynamic pressure changes after penetration. Although the local evidence suggests that cold-seep-related fluid activity may contribute to the subsequent negative evolution, the specific formation process remains unresolved and requires further validation. If additional geophysical, geochemical, or sedimentological information were available for these exact locations, it would further strengthen this interpretation.
The subsequent response at active vents also includes short-time-scale changes. S05 showed local shallow fluctuations against a sustained negative background. A nearly synchronous negative pulse across four channels was recorded near 20.85 min. The change amplitude and recovery time differed among depths (Figure 8). Römer, using continuous acoustic observations, revealed temporal changes in cold-seep bubble release and their link to bottom pressure [25]. While this indicates that cold-seep activity can produce dynamic environmental responses, the exact source of the short-term pore pressure events observed in this study remains open. The visible bubbles in the field reflect the active characteristics of the test site. However, a direct correspondence between the two at the event time has not yet been obtained. Combined with the evolution process shown in Figure 12, pore pressure records at active vents include not only depth-related recovery processes but also superimposed short-term common changes. A joint analysis of these two types of signals will help further understand transient pressure responses in cold-seep activity environments.
Figure 12 links penetration disturbance, depth-related pressure recovery, and subsequent negative responses at active vents into a continuous evolution process. Non-vent sediments (e.g., S04) mainly show positive excess pore pressure decay. Records at active vents further include sustained negative changes and short-term pressure fluctuations. This indicates that in situ pore pressure records in the cold-seep area can not only reflect sediment mechanical responses to penetration disturbance but may also preserve pressure change information related to local fluid activity. Combined with manned submersible visual observations and multi-depth pressure records, this can further identify pressure response characteristics under different vent activity environments. It provides supplementary observational evidence for shallow fluid activity and hydraulic environment changes in cold seeps.
5. Conclusions and Outlook
This study investigated post-penetration excess pore-pressure evolution under different cold-seep vent conditions using in situ observations from the manned submersible Jiaolong. The main conclusions are as follows:
(1) At the non-vent stations investigated, positive excess pore-pressure dissipation dominated, whereas two active vents transitioned from initially positive pressures to sustained negative values. Adjacent non-vent (S04) and active-vent (S05) observations from the same dive further showed that the post-penetration pressure pathways diverged markedly after the early dissipation stage.
(2) At the two active-vent stations investigated, the positive-to-negative transition occurred progressively from shallow to deeper sediments, followed by decreasing vertical pressure differences and convergence toward similar negative values. Minimum excess pore pressures ranged from −22.1 to −19.8 kPa and from −27.3 to −22.0 kPa at the two active vents, with negative pressures persisting for 88.0–98.9% of the valid observation periods.
(3) Short-term pore-pressure fluctuations comprised localized variations and nearly synchronous multi-depth responses. The principal event showed a common positive excursion followed by a rapid pressure drop and recovery across all four depths, accompanied by concurrent spectral energy enhancement. These results indicate the coexistence of localized and multi-depth transient pressure variations superimposed on the sustained negative response.
(4) Early post-penetration excess pore-pressure recovery may be associated with sediment mechanical properties, whereas subsequent negative evolution may be influenced by local hydraulic conditions at active vents. Integrating the site comparison, vertical evolution, and short-term fluctuations, a conceptual model was established comprising penetration disturbance, depth-dependent pressure recovery, and subsequent sustained negative responses. It should be emphasized that the roles of sediment mechanical heterogeneity and local hydraulic conditions are presented as plausible hypotheses consistent with the observations, rather than established causal links.
The absence of site-specific temperature records and temperature-dependent sensor calibration in this study also leaves potential thermal effects on the differential-pressure measurements unresolved, despite the background correction and sensitivity checks performed. Future research should focus on clarifying the mechanisms of sustained negative excess pore pressure and its relationship with cold-seep fluid activity. Repeated and long-term observations at active-vent and non-vent sites, combined with sediment permeability, deformation, ambient pressure measurements, and site-specific sedimentological data such as grain size, lithology, and authigenic carbonate occurrence, could help distinguish the contributions of penetration disturbance, sediment heterogeneity, and local hydraulic conditions. Site-specific shallow acoustic and geophysical surveys could further help characterize shallow gas accumulations and fluid-migration structures and clarify their spatial relationships with the pore-pressure measurement sites. Coupled hydro-mechanical modeling could further quantify the relationship between sediment mechanical properties and pore-pressure recovery. In addition, synchronized bubble imagery, acoustic gas-release signals, and multi-depth pore-pressure records, together with temperature and methane measurements and temperature-dependent sensor calibration, are needed in order to establish direct temporal links between gas release and short-term pressure fluctuations. These integrated approaches would improve our understanding of negative excess pore-pressure generation, distinguish penetration-induced responses from seep-related pressure variations, and support a more reliable interpretation of in situ pore-pressure measurements in cold-seep sediments.
Supplementary Materials
The following supporting information can be downloaded at: https://www.mdpi.com/article/10.3390/jmse14212012/s1. Figure S1: Pressure–voltage calibration curves of the four differential-pressure sensors (P1–P4); Figure S2: Quality-control check of background correction at site S06; Figure S3: Raw differential-pressure records and sensitivity analysis of background correction at S05 and S06; Table S1: Pressure– voltage calibration data for the four differentialpressure sensors (P1–P4).
Author Contributions
Writing—original draft preparation, S.L. and L.L.; visualization, S.L. and W.W.; conceptualization, Y.L.; supervision and writing-review and editing, Y.L.; investigation, L.L. and Z.J.; data curation, L.L. All authors have read and agreed to the published version of the manuscript.
Funding
This research was funded by Laoshan Laboratory (Grant No. LSKJ202502701), the National Natural Science Foundation of China (Grant Nos. U25A20798 and U2444215), and the Qingdao Natural Science Foundation (Grant No. 25-1-1-188-zyyd-jch). All in situ measurements were conducted during annual expeditions from Laoshan Laboratory (LSZD2025-01).
Data Availability Statement
The data presented in this study are available upon request from the corresponding author.
Acknowledgments
All in situ measurements were conducted during annual expeditions from Laoshan Laboratory (LSZD2025-01).
Conflicts of Interest
The authors declare no conflicts of interest.
References
- Feng, D.; Qiu, J.W.; Hu, Y.; Peckmann, J.; Guan, H.; Tong, H.; Chen, C.; Chen, J.; Gong, S.; Li, N. Cold seep systems in the South China Sea: An overview. J. Asian Earth Sci. 2018, 168, 3–16. [Google Scholar] [CrossRef] [Scilit]
- Zhang, W.; Liang, J.; Liang, Q.; Wei, J.; Wan, Z.; Feng, J.; Huang, W.; Zhao, J.; Meng, M.; Deng, W. Gas Hydrate Accumulation and Occurrence Associated with Cold Seep Systems in the Northern South China Sea: An Overview. Geofluids 2021, 2021, 5571150. [Google Scholar] [CrossRef] [Scilit]
- Ye, J.; Wei, J.; Liang, J.; Lu, J.; Lu, H.; Zhang, W. Complex gas hydrate system in a gas chimney, South China Sea. Mar. Pet. Geol. 2019, 104, 29–39. [Google Scholar] [CrossRef] [Scilit]
- Wang, J.; Wu, S.; Kong, X.; Ma, B.; Li, W.; Wang, D.; Gao, J.; Chen, W. Subsurface fluid flow at an active cold seep area in the Qiongdongnan Basin, northern South China Sea. J. Asian Earth Sci. 2018, 168, 17–26. [Google Scholar] [CrossRef] [Scilit]
- Wan, Z.; Chen, C.; Liang, J.; Zhang, W.; Huang, W.; Su, P. Hydrochemical Characteristics and Evolution Mode of Cold Seeps in the Qiongdongnan Basin, South China Sea. Geofluids 2020, 2020, 4578967. [Google Scholar] [CrossRef] [Scilit]
- Geng, M.; Zhang, R.; Yang, S.; Guo, J.; Chen, Z. Focused Fluid Flow, Shallow Gas Hydrate, and Cold Seep in the Qiongdongnan Basin, Northwestern South China Sea. Geofluids 2021, 2021, 5594980. [Google Scholar] [CrossRef] [Scilit]
- Liu, S.; Feng, X.; Feng, Z.; Xiao, X.; Feng, L. Geochemical evidence of methane seepage in the sediments of the Qiongdongnan Basin, South China Sea. Chem. Geol. 2020, 543, 119588. [Google Scholar] [CrossRef] [Scilit]
- Vanneste, M.; Sultan, N.; Garziglia, S.; Forsberg, C.F.; L”Heureux, J.S. Seafloor instabilities and sediment deformation processes: The need for integrated, multi-disciplinary investigations. Mar. Geol. 2014, 352, 183–214. [Google Scholar] [CrossRef] [Scilit]
- Orange, D.L.; Breen, N.A. The effects of fluid escape on accretionary wedges 2. Seepage force, slope failure, headless submarine canyons, and vents. J. Geophys. Res. Solid Earth 1992, 97, 9277. [Google Scholar] [CrossRef] [Scilit]
- Wang, W.; Wu, N.; Wang, L.; Wang, L.; Liu, Z.; Li, Y. The interaction of gas hydrate with submarine landslides studied with cascading machine learning. Landslides 2026, 23, 1187–1200. [Google Scholar] [CrossRef] [Scilit]
- Teh, C.I.; Houlsby, G.T. An analytical study of the cone penetration test in clay. Géotechnique 1991, 41, 17–34. [Google Scholar] [CrossRef] [Scilit]
- Levadoux, J.N.; Baligh, M.M. Consolidation After Undrained Piezocone Penetration. I: Prediction. J. Geotech. Eng. 1986, 112, 707–726. [Google Scholar] [CrossRef] [Scilit]
- Baligh, M.M.; Levadoux, J.N. Consolidation After Undrained Piezocone Penetration. II: Interpretation. J. Geotech. Eng. 1986, 112, 727–745. [Google Scholar] [CrossRef] [Scilit]
- Li, Y.; Zhou, Y.; Zhang, Z.; Qi, M.; Zhang, Y.; Jiang, Y.; Ji, Y.; Meng, Q.; Sun, Y.; Wu, N. Stress-Induced Melting Controlled Failure Mechanisms of Methane Hydrate. Adv. Sci. 2026, 13, e18367. [Google Scholar] [CrossRef] [Scilit] [PubMed]
- Whittle, A.J.; Sutabutr, T.; Germaine, J.T.; Varney, A. Prediction and Measurement of Pore Pressure Dissipation for a Tapered Piezoprobe. Géotechnique 2001, 51, 601–617. [Google Scholar] [CrossRef]
- Sultan, N.; Lafuerza, S. In situ equilibrium pore-water pressures derived from partial piezoprobe dissipation tests in marine sediments. Can. Geotech. J. 2013, 50, 1294–1305. [Google Scholar] [CrossRef] [Scilit]
- Sabetamal, H.; Carter, J.; Zhang, X.; Sheng, D. Coupled analysis of full flow penetration problems in soft sensitive clays. Comput. Geotech. 2021, 133, 104054. [Google Scholar] [CrossRef] [Scilit]
- Jia, R.; Wu, Z.; Li, Y.; Lei, H. Factors influencing nonstandard piezocone dissipation curves and interpreting the coefficient of consolidation. Comput. Geotech. 2024, 175, 106690. [Google Scholar] [CrossRef] [Scilit]
- Elsworth, D.; Lee, D.S.; Hryciw, R.; Shin, S. Pore Pressure Response Following Undrained uCPT Sounding in a Dilating Soil. J. Geotech. Geoenvironmental Eng. 2006, 132, 1485–1495. [Google Scholar] [CrossRef] [Scilit]
- Chai, J.; Sheng, D.; Carter, J.P.; Zhu, H. Coefficient of consolidation from non-standard piezocone dissipation curves. Comput. Geotech. 2012, 41, 13–22. [Google Scholar] [CrossRef] [Scilit]
- Zhang, H.; Liu, X.; Jia, Y.; Du, Q.; Sun, Y.; Yin, P.; Shan, H. Rapid consolidation characteristics of Yellow River-derived sediment: Geotechnical characterization and its implications for the deltaic geomorphic evolution. Eng. Geol. 2020, 270, 105578. [Google Scholar] [CrossRef] [Scilit]
- Sultan, N.; Plaza, A.; Vadakkepuliyambatta, S.; Bünz, S.; Knies, J. Impact of tides and sea-level on deep-sea Arctic methane emissions. Nat. Commun. 2020, 11, 5087. [Google Scholar] [CrossRef] [Scilit] [PubMed]
- Liu, X.; Zhang, H.; Zheng, J.; Guo, L.; Jia, Y.; Bian, C.; Li, M.; Ma, L.; Zhang, S. Critical role of wave–seabed interactions in the extensive erosion of Yellow River estuarine sediments. Mar. Geol. 2020, 426, 106208. [Google Scholar] [CrossRef] [Scilit]
- Plaza-Faverola, A.; Sultan, N.; Lucchi, R.G.; El Bani Altuna, N.; Ramachandran, H.; Singhroha, S.; Cooke, F.; Vadakkepuliyambatta, S.; Ezat, M.M.; Rasmussen, T.L. Spatial Changes in Gas Transport and Sediment Stiffness Influenced by Regional Stress: Observations from Piezometer Data Along Vestnesa Ridge, Eastern Fram Strait. J. Geophys. Res. Solid Earth 2023, 128, e2022JB025868. [Google Scholar] [CrossRef] [Scilit]
- Römer, M.; Riedel, M.; Scherwath, M.; Heesemann, M.; Spence, G. Tidally controlled gas bubble emissions: A comprehensive study using long-term monitoring data from the NEPTUNE cabled observatory offshore Vancouver Island. Geochem. Geophys. Geosyst. 2016, 17, 3797–3814. [Google Scholar] [CrossRef] [Scilit]
- Ferré, B.; Barreyre, T.; Bünz, S.; Argentino, C.; Corrales-Guerrero, J.; Dølven, K.O.; Stetzler, M.; Fallati, L.; Sert, M.F.; Panieri, G.; et al. Contrasting Methane Seepage Dynamics in the Hola Trough Offshore Norway: Insights from Two Different Summers. J. Geophys. Res. Oceans 2024, 129, e2024JC020949. [Google Scholar] [CrossRef] [Scilit]
- Sultan, N.; Riboulot, V.; Ker, S.; Marsset, B.; Géli, L.; Tary, J.B.; Klingelhoefer, F.; Voisset, M.; Lanfumey, V.; Colliat, J.L.; et al. Dynamics of fault-fluid-hydrate system around a shale-cored anticline in deepwater Nigeria. J. Geophys. Res. Solid Earth 2011, 116, B12110. [Google Scholar] [CrossRef] [Scilit]
- Menapace, W.; Völker, D.; Sahling, H.; Zoellner, C.; dos Santos Ferreira, C.; Bohrmann, G.; Kopf, A. Long-term in situ observations at the Athina mud volcano, Eastern Mediterranean: Taking the pulse of mud volcanism. Tectonophysics 2017, 721, 12–27. [Google Scholar] [CrossRef] [Scilit]
- Flemings, P.B.; Long, H.; Dugan, B.; Germaine, J.; John, C.M.; Behrmann, J.H.; Sawyer, D.; Scientists, I.E. Pore pressure penetrometers document high overpressure near the seafloor where multiple submarine landslides have occurred on the continental slope, offshore Louisiana, Gulf of Mexico. Earth Planet. Sci. Lett. 2008, 269, 309–325. [Google Scholar] [CrossRef] [Scilit]
- Fang, W.W.; Langseth, M.G.; Schultheiss, P. Analysis and application of in situ pore pressure measurements in marine sediments. J. Geophys. Res. Solid Earth 1993, 98, 7921–7938. [Google Scholar] [CrossRef] [Scilit]
- Schultheiss, P.J.; McPhail, S.D. Direct indication of pore-water advection from pore pressure measurements in Madeira Abyssal Plain sediments. Nature 1986, 320, 348–350. [Google Scholar] [CrossRef] [Scilit]
- Schultheiss, P.J. Pore pressures in marine sediments: An overview of measurement techniques and some geological and engineering applications. Mar. Geophys. Res. 1990, 12, 153–168. [Google Scholar] [CrossRef] [Scilit]
- Schultheiss, P.J.; Mcphail, P.J.; Packwood, A.R.; Hart, B. Instrument to Measure Differential Pore Pressures in Deep Ocean Sediments: Pop-Up-Pore Pressure Instrument (PUPPI); Institute of Oceanographic Sciences: Wormley, UK, 1985. [Google Scholar]
- Bennett, R.H.; Faris, J.R. Ambient and dynamic pore pressures in fine-grained submarine sediments: Mississippi Delta. Appl. Ocean Res. 1979, 1, 115–123. [Google Scholar] [CrossRef] [Scilit]
- Sultan, N.; Cattaneo, A.; Sibuet, J.C.; Schneider, J.L.; Team, T.S.A. Deep sea in situ excess pore pressure and sediment deformation off NW Sumatra and its relation with the December 26, 2004 Great Sumatra-Andaman Earthquake. Int. J. Earth Sci. 2009, 98, 823–837. [Google Scholar] [CrossRef] [Scilit]
- Strout, J.M.; Tjelta, T.I. In situ pore pressures: What is their significance and how can they be reliably measured? Mar. Pet. Geol. 2005, 22, 275–285. [Google Scholar] [CrossRef] [Scilit]
- Long, H.; Flemings, P.B.; Germaine, J.T. Interpreting in situ pressure and hydraulic properties with borehole penetrometers in ocean drilling: DVTPP and Piezoprobe deployments at southern Hydrate Ridge, offshore Oregon. J. Geophys. Res. Solid Earth 2007, 112, B04101. [Google Scholar] [CrossRef] [Scilit]
- Christian, H.A.; Heffler, D.E.; Davis, E.E. Lancelot—An in situ piezometer for soft marine sediments. Deep Sea Res. Part I Oceanogr. Res. Pap. 1993, 40, 1509–1520. [Google Scholar] [CrossRef] [Scilit]
- Qiao, H.; Liu, L.; He, H.; Liu, X.; Liu, X.; Peng, P. The Practice and Development of T-Bar Penetrometer Tests in Offshore Engineering Investigation: A Comprehensive Review. J. Mar. Sci. Eng. 2023, 11, 1160. [Google Scholar] [CrossRef] [Scilit]
- Liu, T.; Wei, G.; Kou, H.; Guo, L. Pore pressure observation: Pressure response of probe penetration and tides. Acta Oceanol. Sin. 2019, 38, 107–113. [Google Scholar] [CrossRef] [Scilit]
- Sun, Z.; Li, Y.; Wu, N.; Fan, Z.; Li, K.; Sun, Z.; Song, X.; Xue, L.; Jia, Y. Dynamic Analysis of Subsea Sediment Engineering Properties Based on Long-Term In Situ Observations in the Offshore Area of Qingdao. J. Mar. Sci. Eng. 2025, 13, 723. [Google Scholar] [CrossRef] [Scilit]
- Wu, J.; Yu, L.; Guo, X.; Xie, Y.; Ma, Z. Application of resistivity in the characterization of shear failure process of gas bearing marine silt. Mar. Georesources Geotechnol. 2023, 41, 1001–1012. [Google Scholar] [CrossRef] [Scilit]
- Lu, L.; Li, Y.; Chen, D.; Jin, J.; Luo, S.; Chen, Q.; Jia, Y.; Wu, N.; Yushin, E. A manned submersible-based deep-sea in-situ vane shear system and its application in cold seep area. Ocean Eng. 2026, 359, 125913. [Google Scholar] [CrossRef] [Scilit]
- Zhang, W.; Liang, J.; Yang, X.; Su, P.; Wan, Z. The formation mechanism of mud diapirs and gas chimneys and their relationship with natural gas hydrates: Insights from the deep-water area of Qiongdongnan Basin, northern South China Sea. Int. Geol. Rev. 2020, 62, 789–810. [Google Scholar] [CrossRef] [Scilit]
- Chai, J.C.; Hossain, M.J.; Carter, J.; Shen, S.L. Cone penetration-induced pore pressure distribution and dissipation. Comput. Geotech. 2014, 57, 105–113. [Google Scholar] [CrossRef] [Scilit]
- Singh, V.; Stanier, S.; Bienen, B.; Randolph, M. A viscoplastic recoverable sensitivity model for fine-grained soils. Comput. Geotech. 2022, 147, 104725. [Google Scholar] [CrossRef] [Scilit]
- Li, Y.; Chen, M.; Zhang, Y.; Xu, H.; Deng, J.; Shen, K.; Jiang, Y.; Wu, N. Time-dependent deformation of marine gas hydrate-bearing strata conditioned to a wellbore: Experiments and implications. Ocean Eng. 2024, 308, 118220. [Google Scholar] [CrossRef] [Scilit]
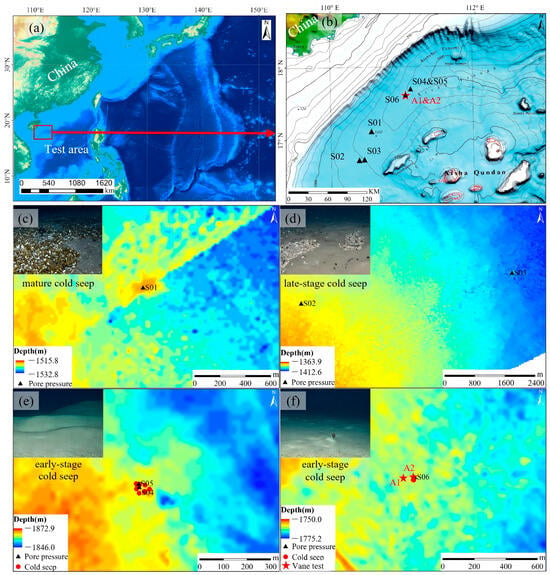
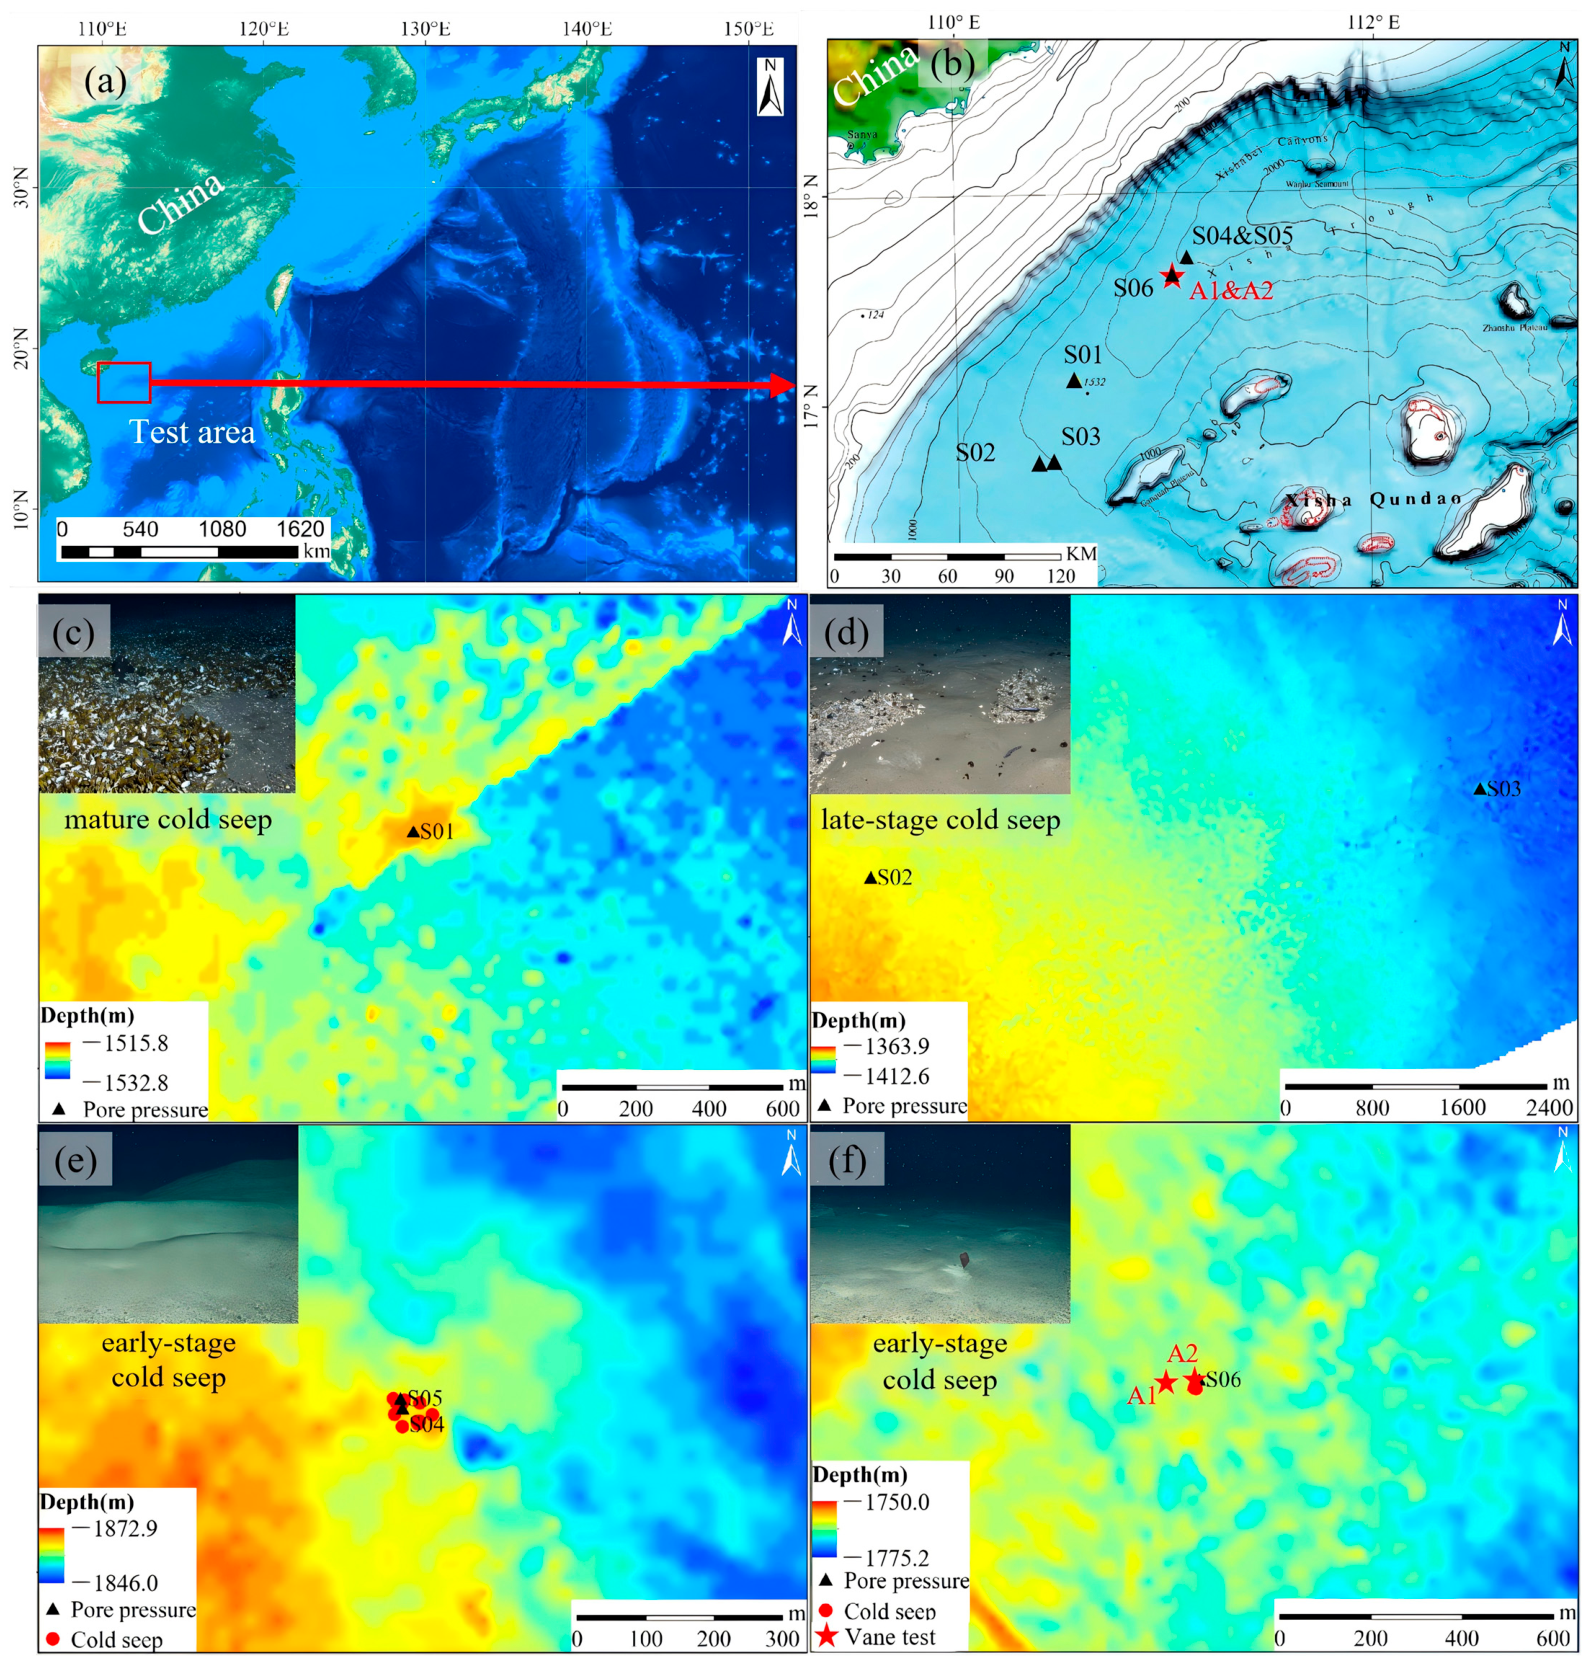
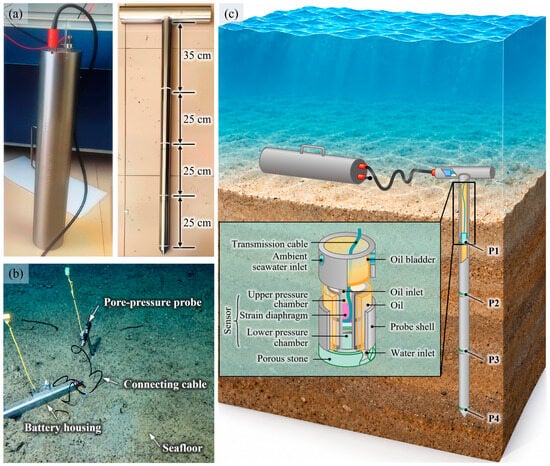
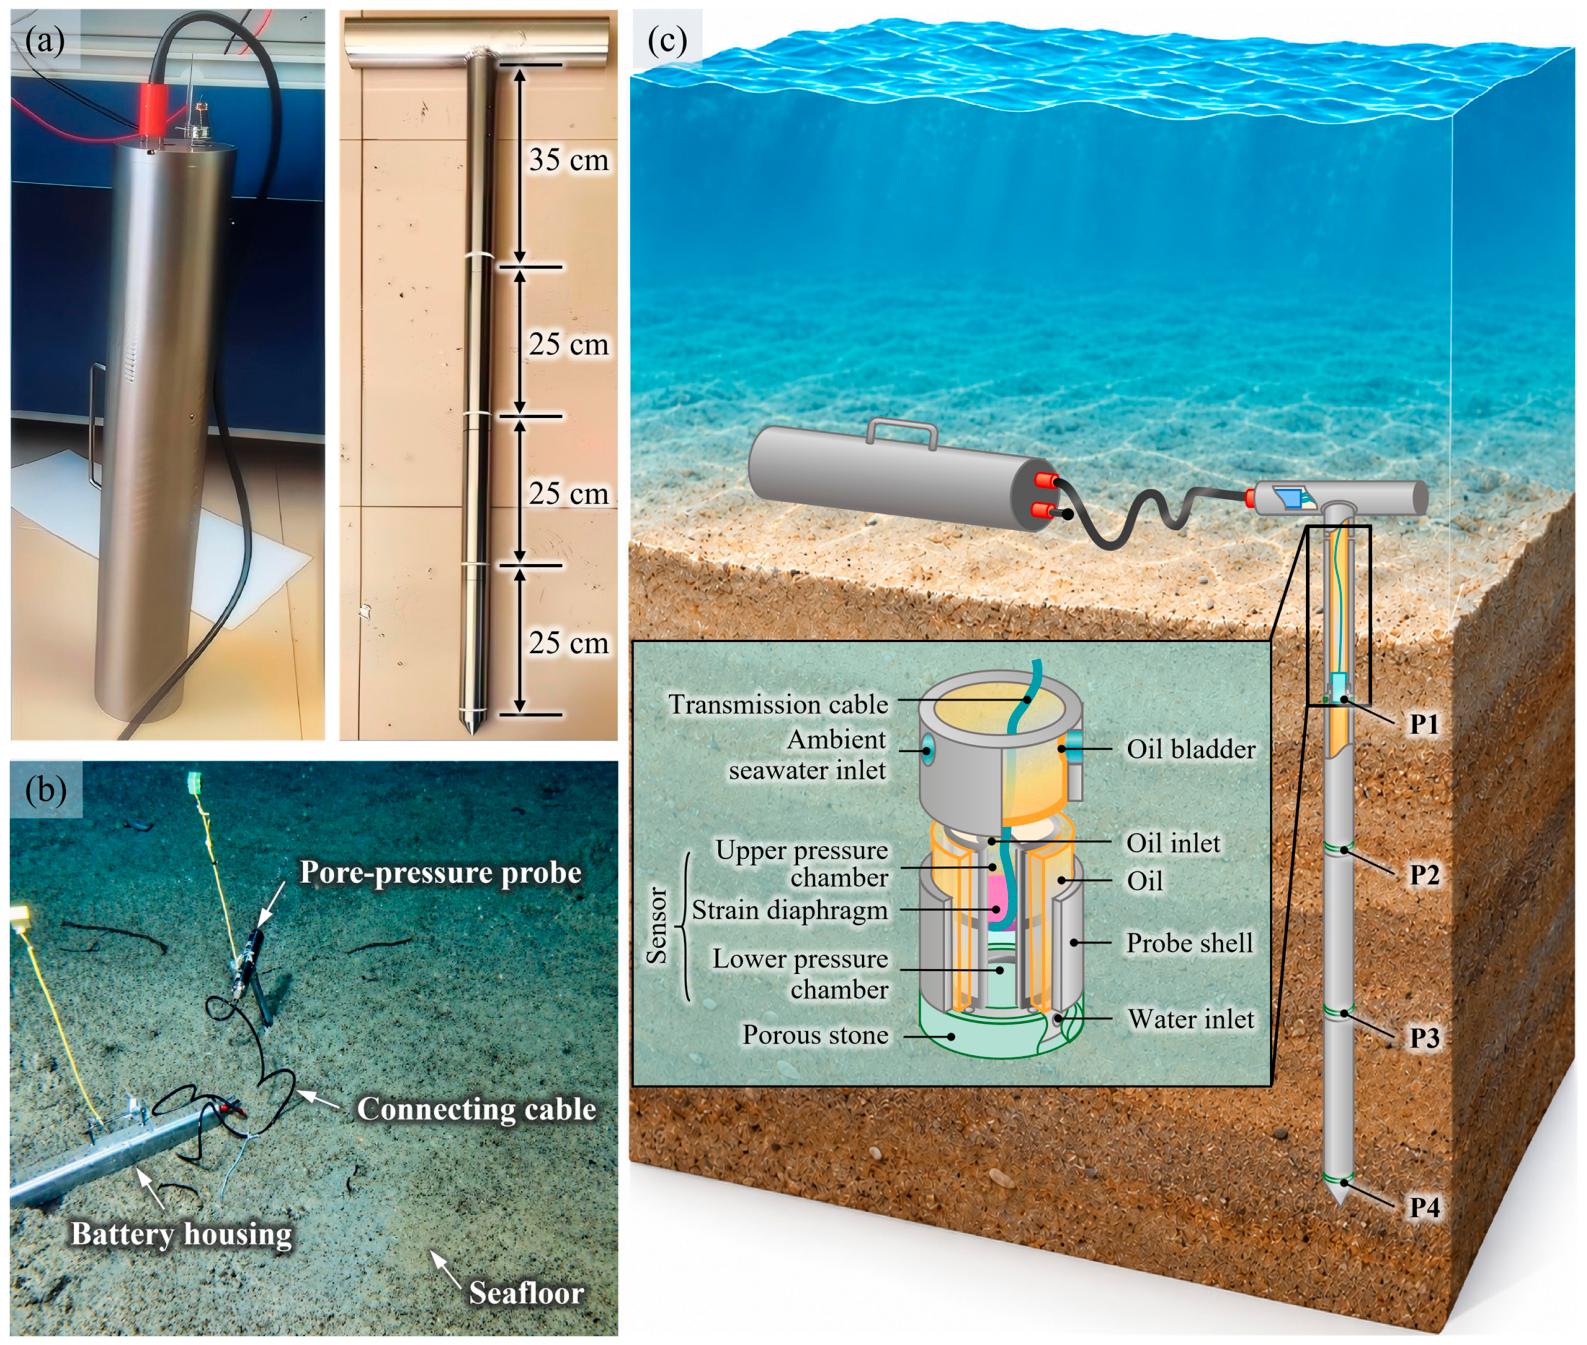
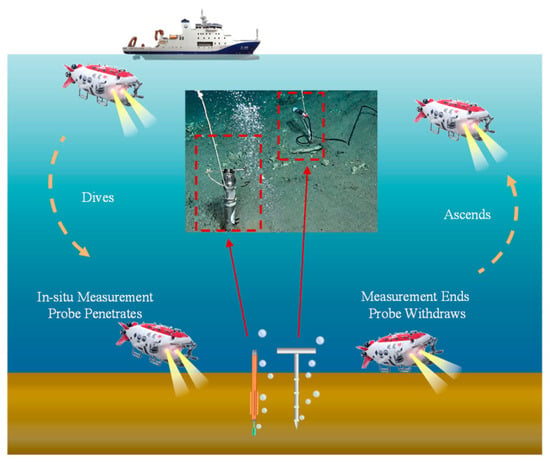
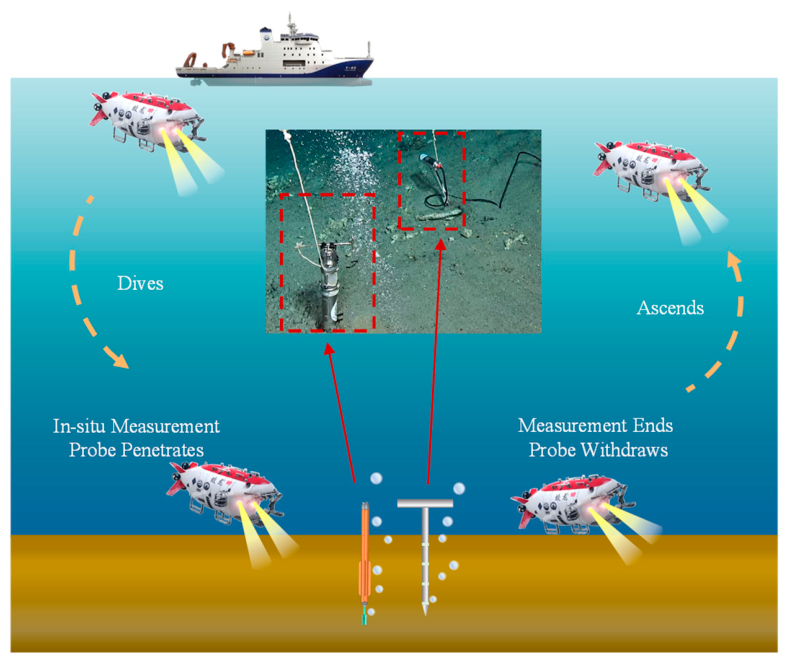
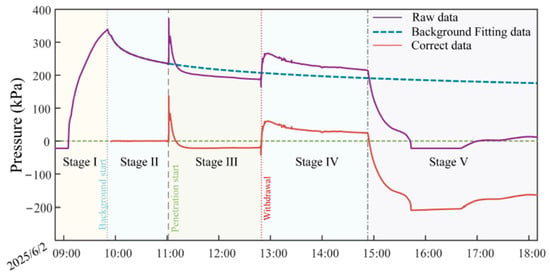
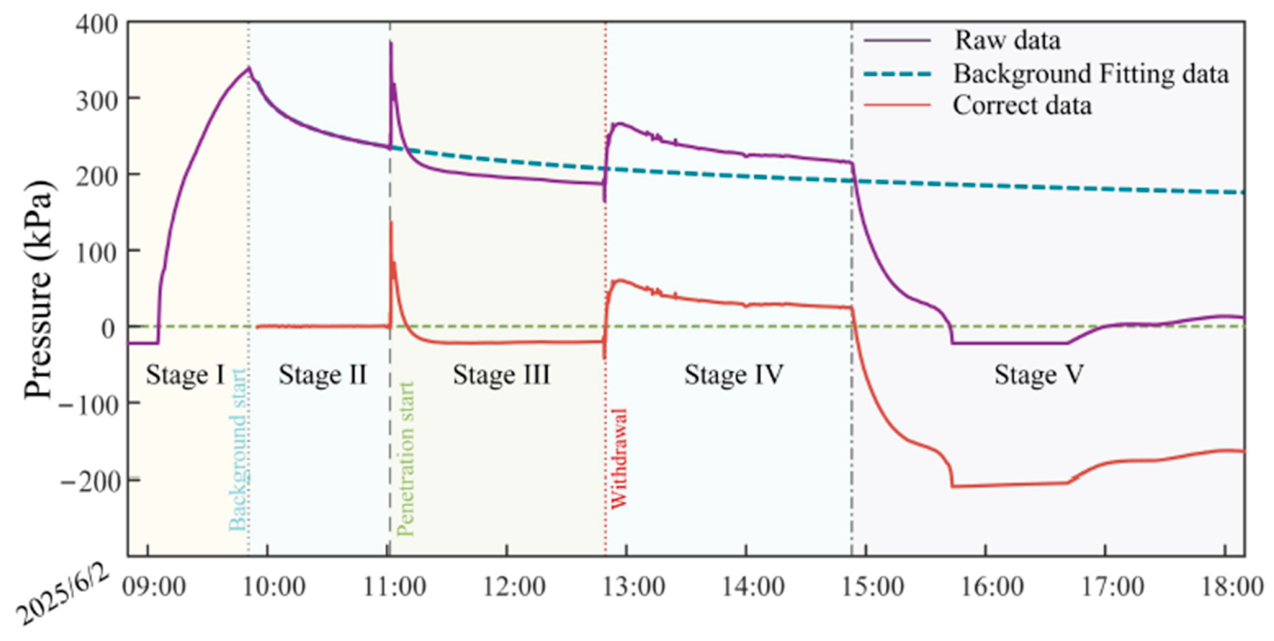
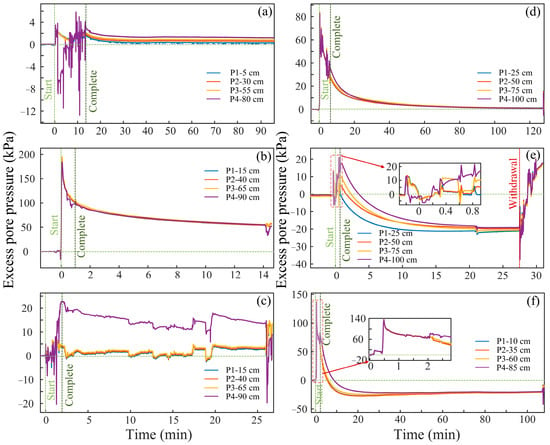
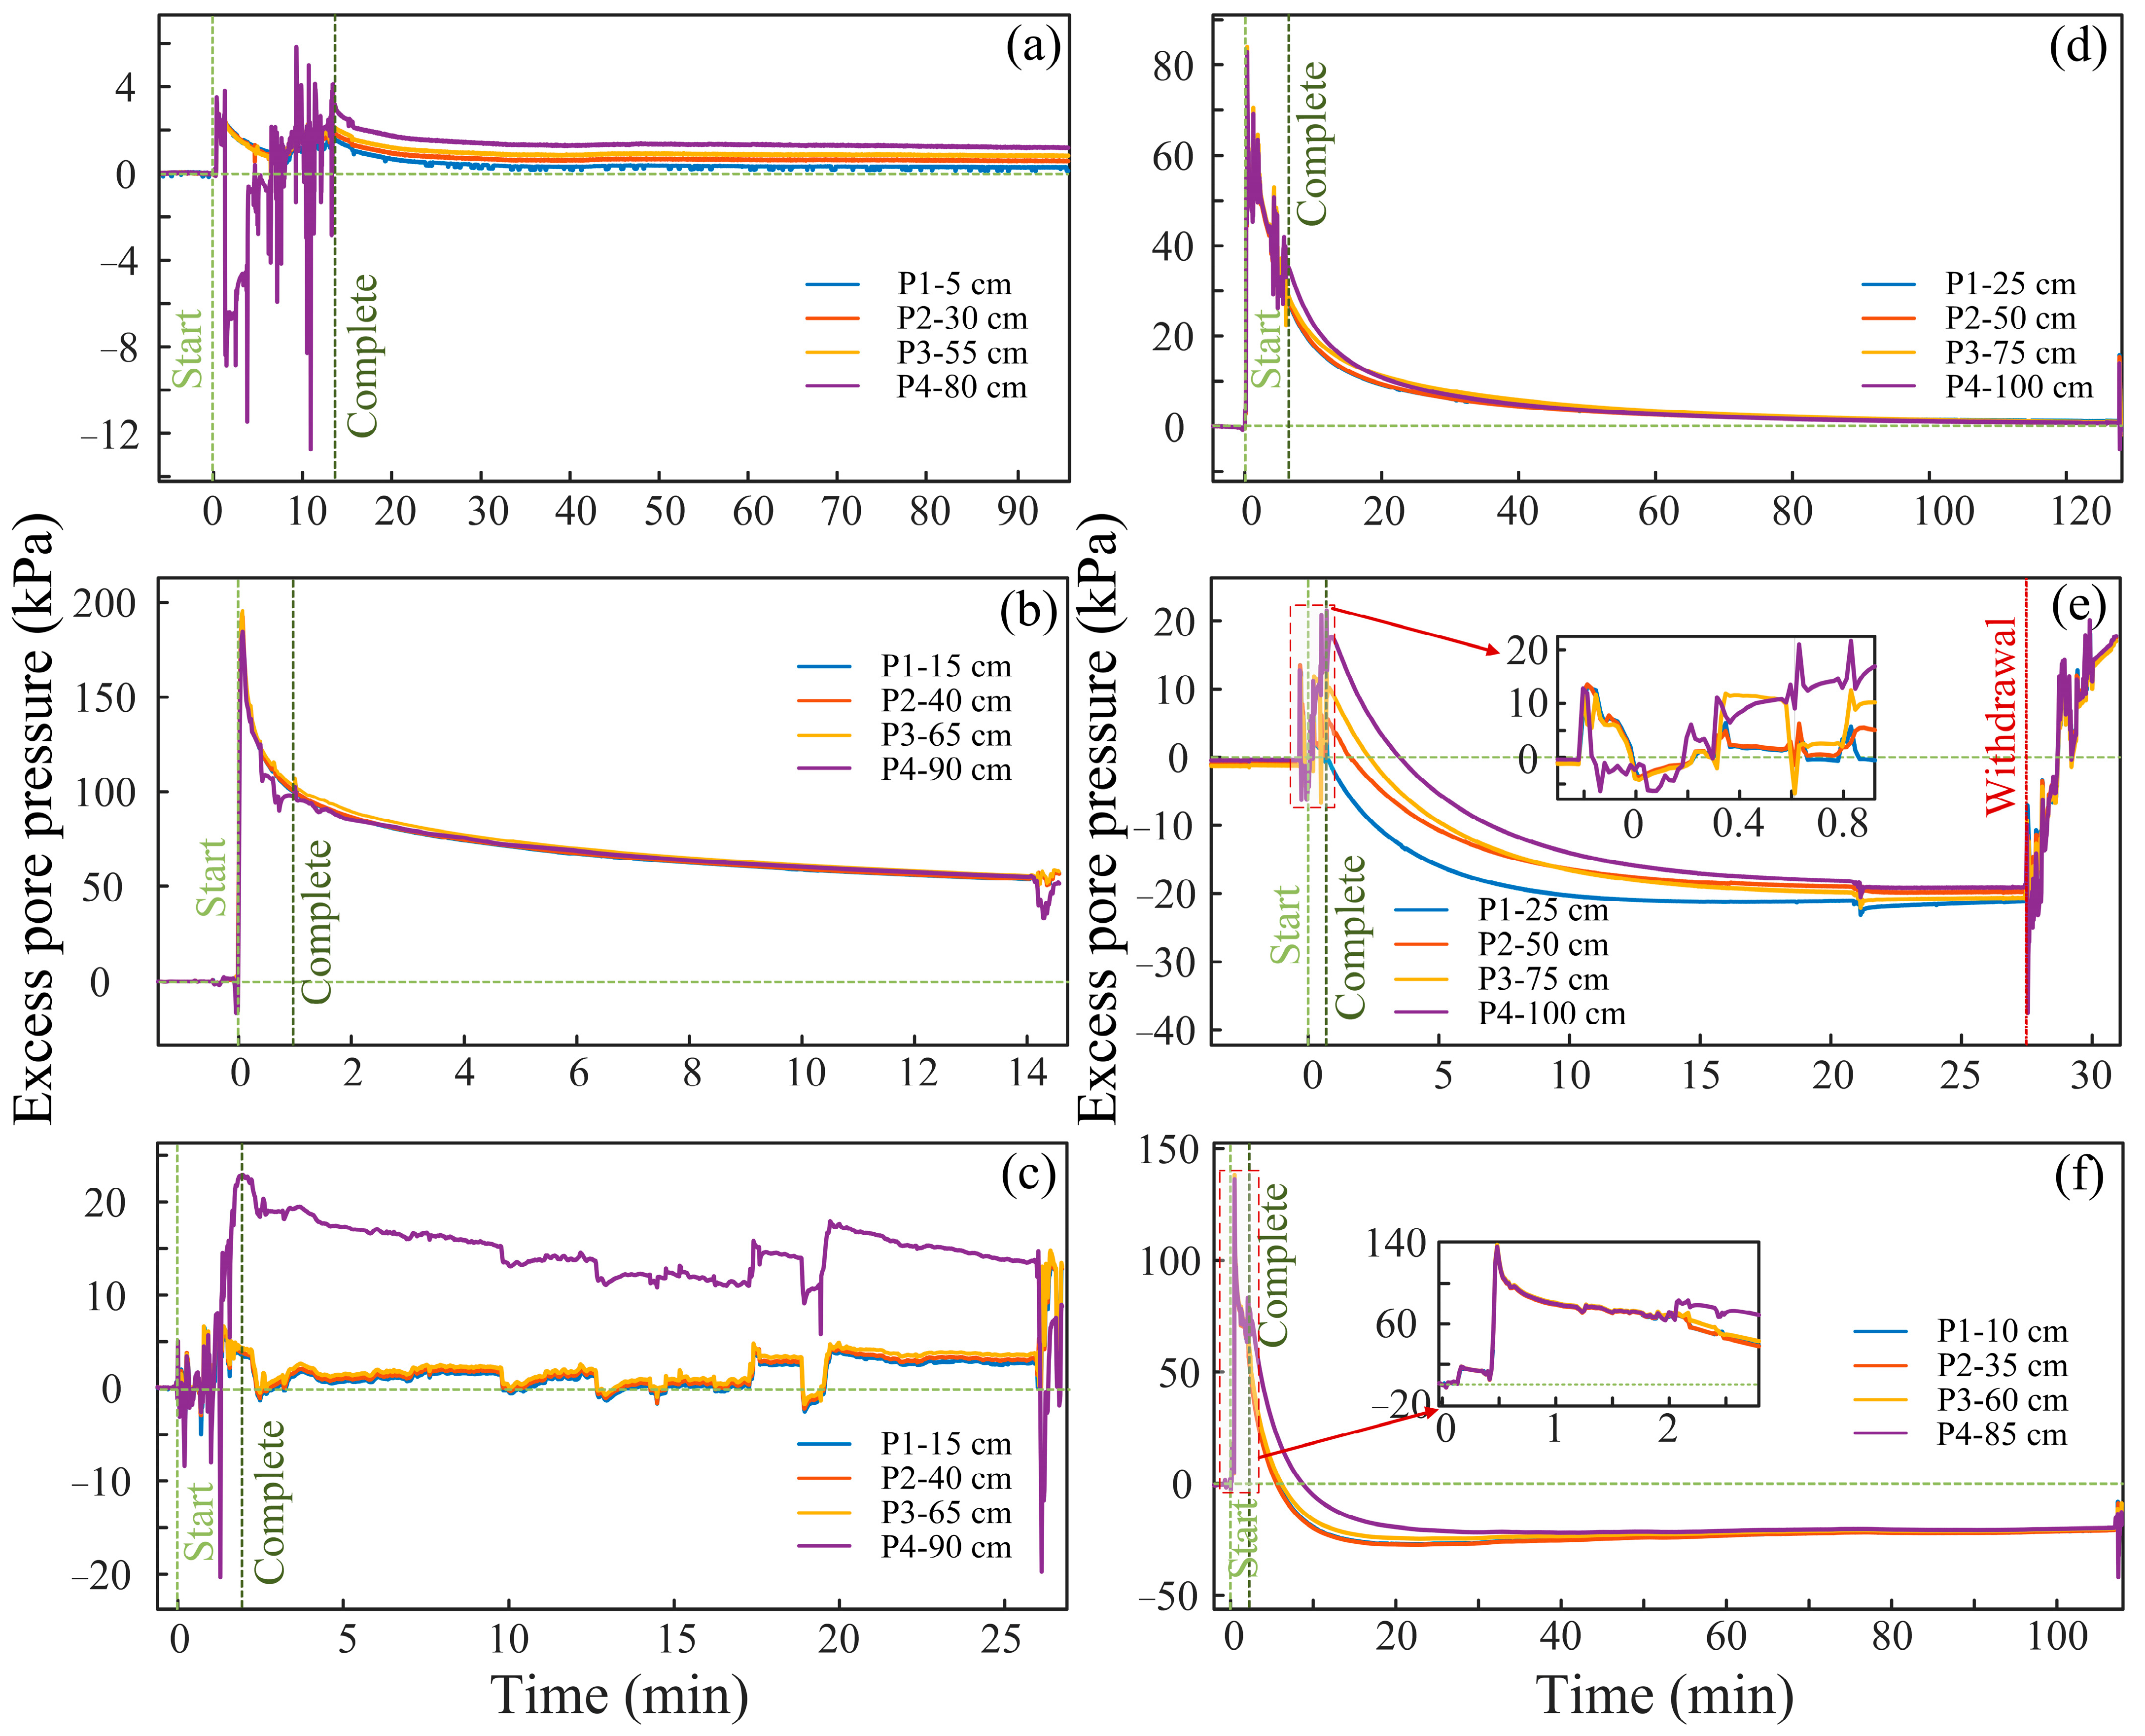
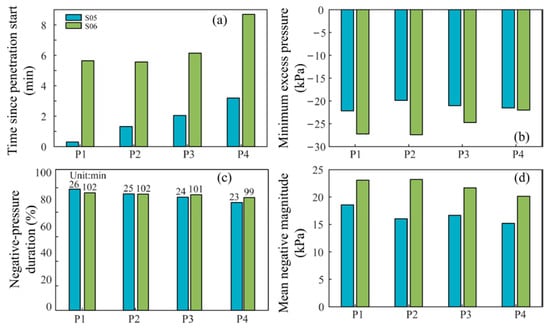
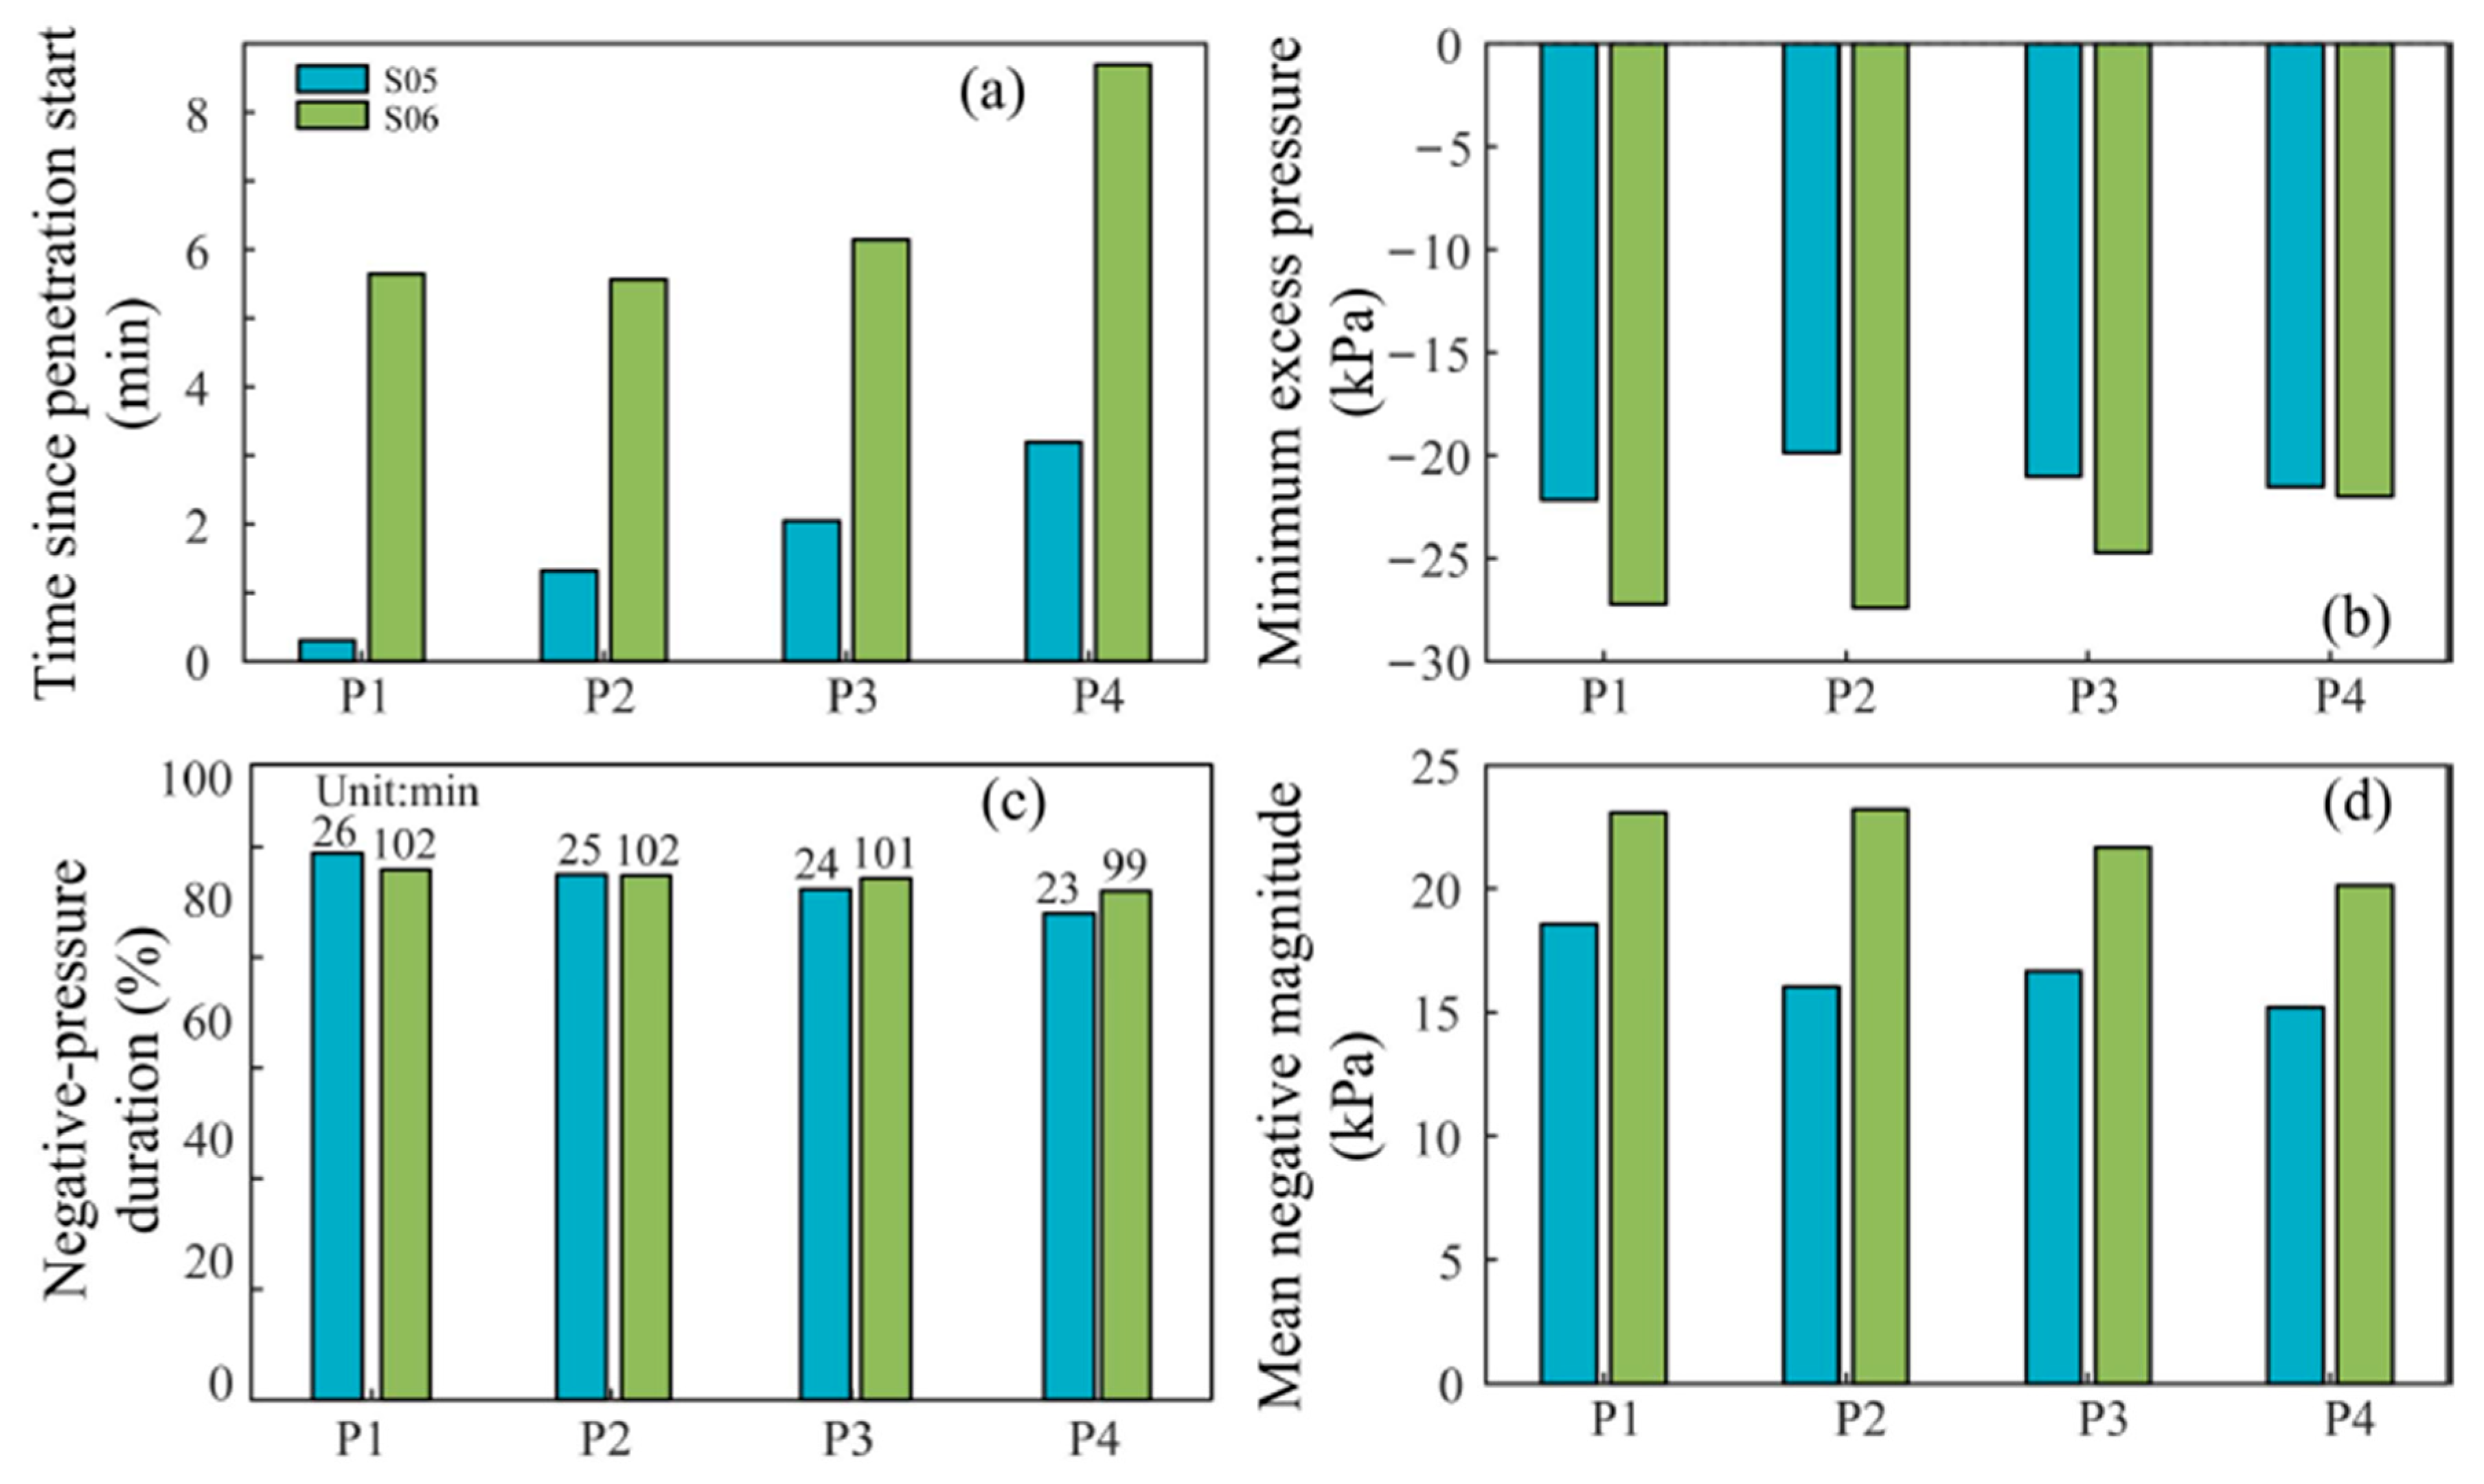
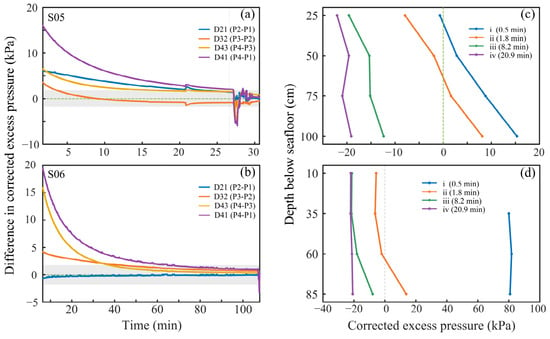
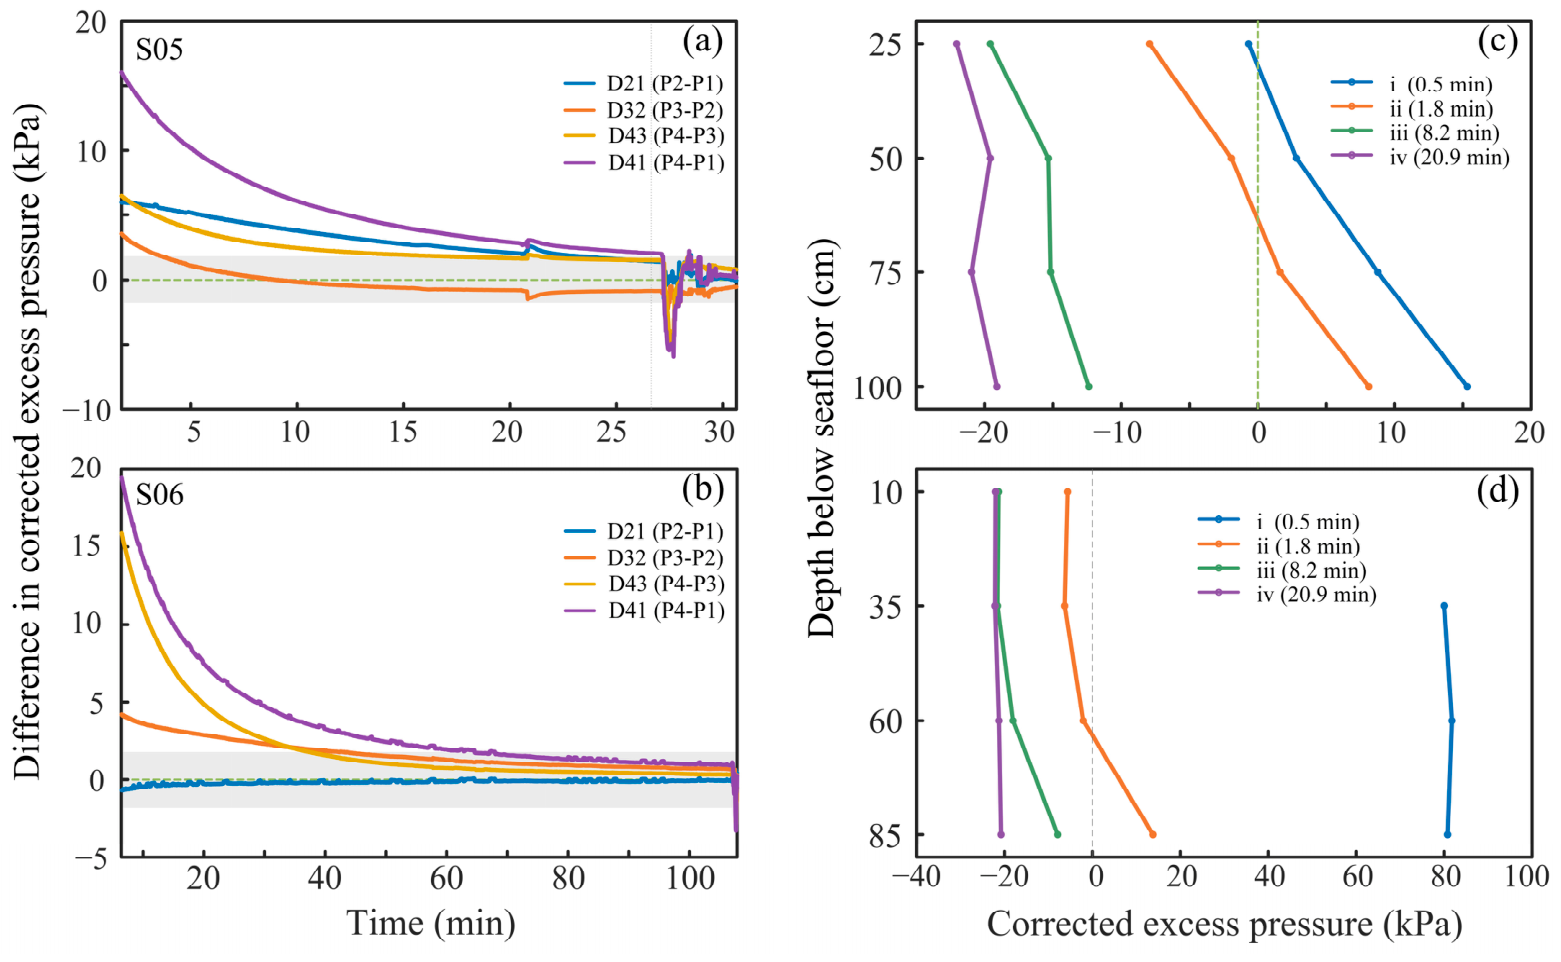
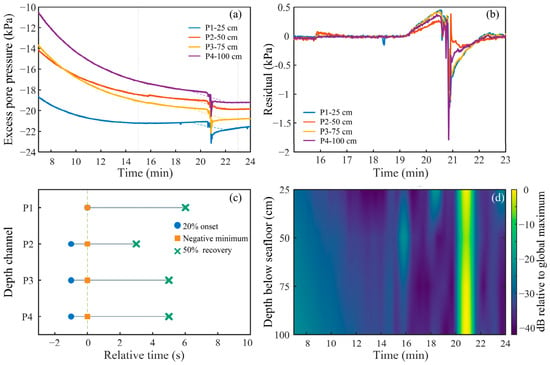
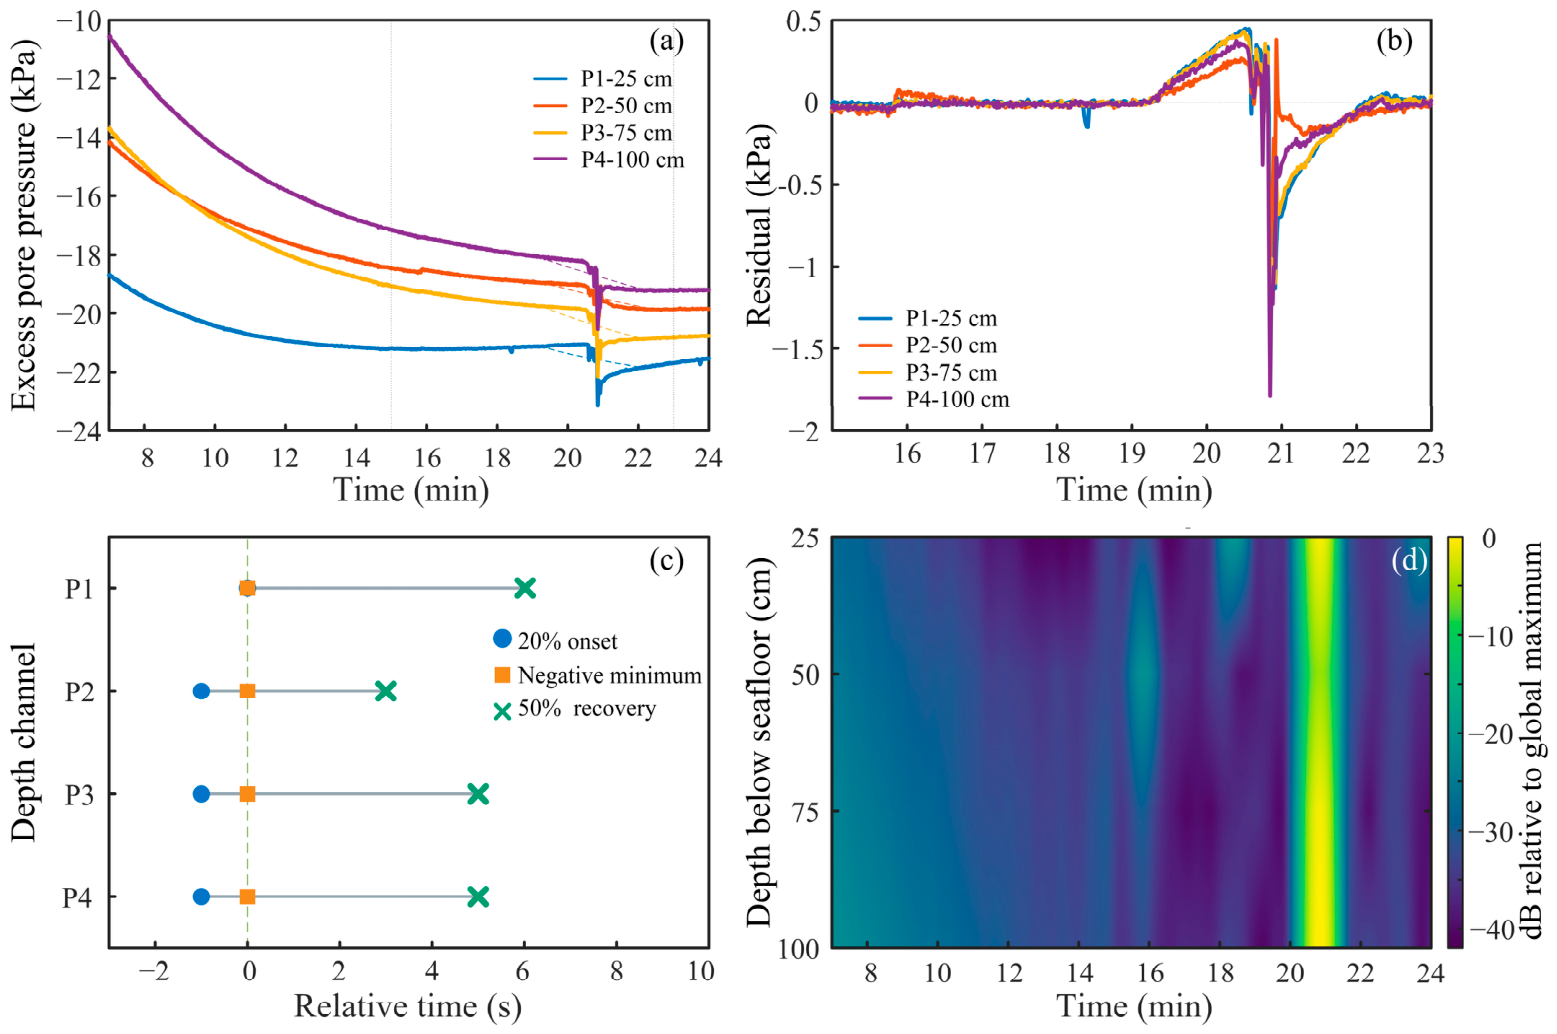
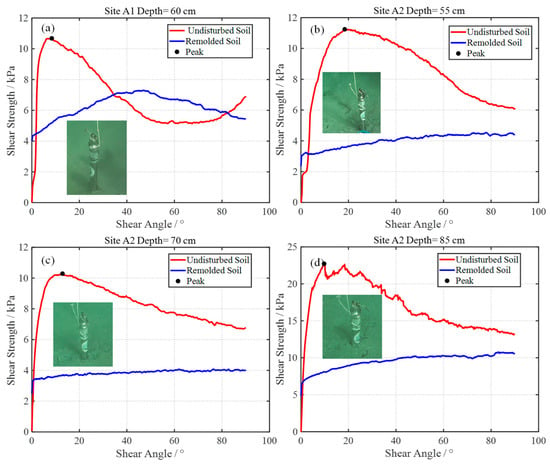
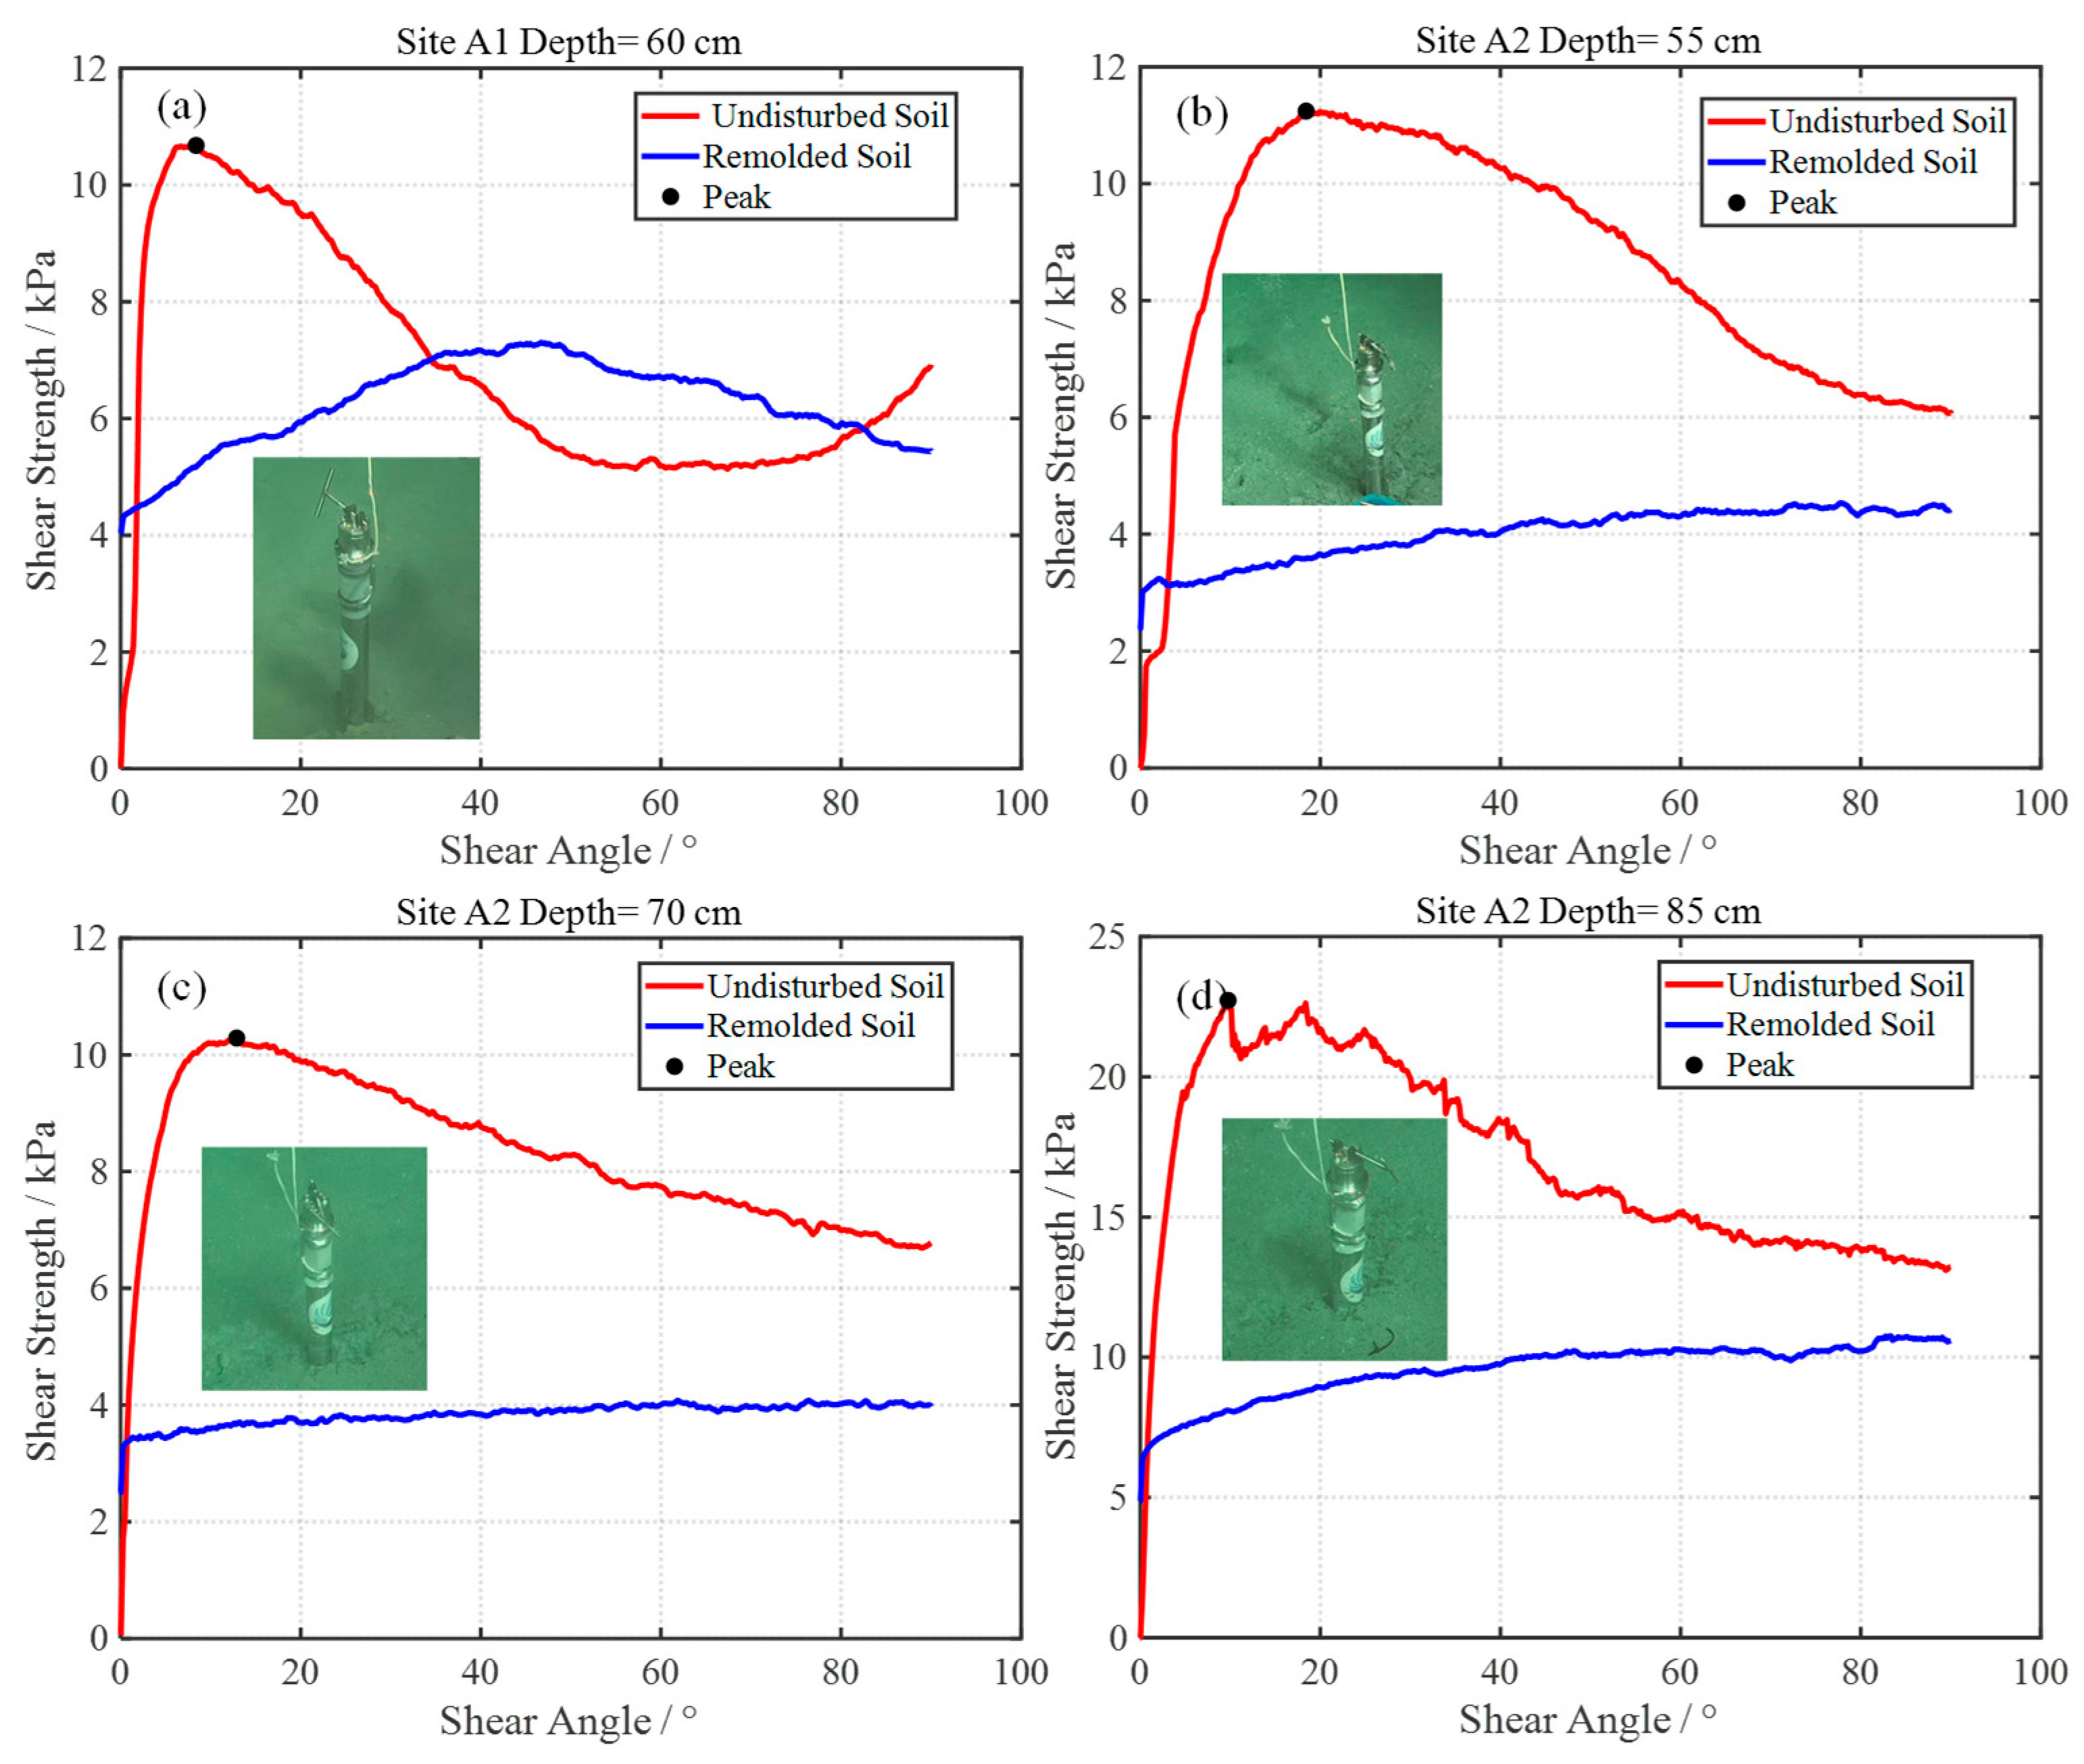
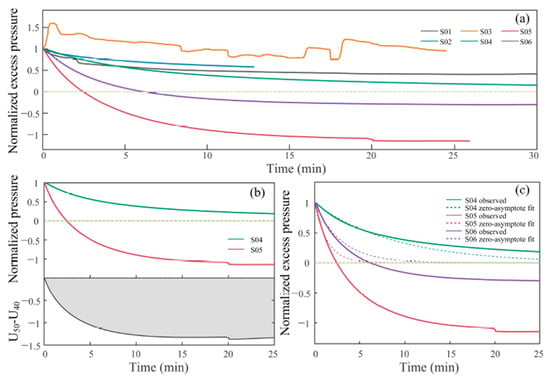
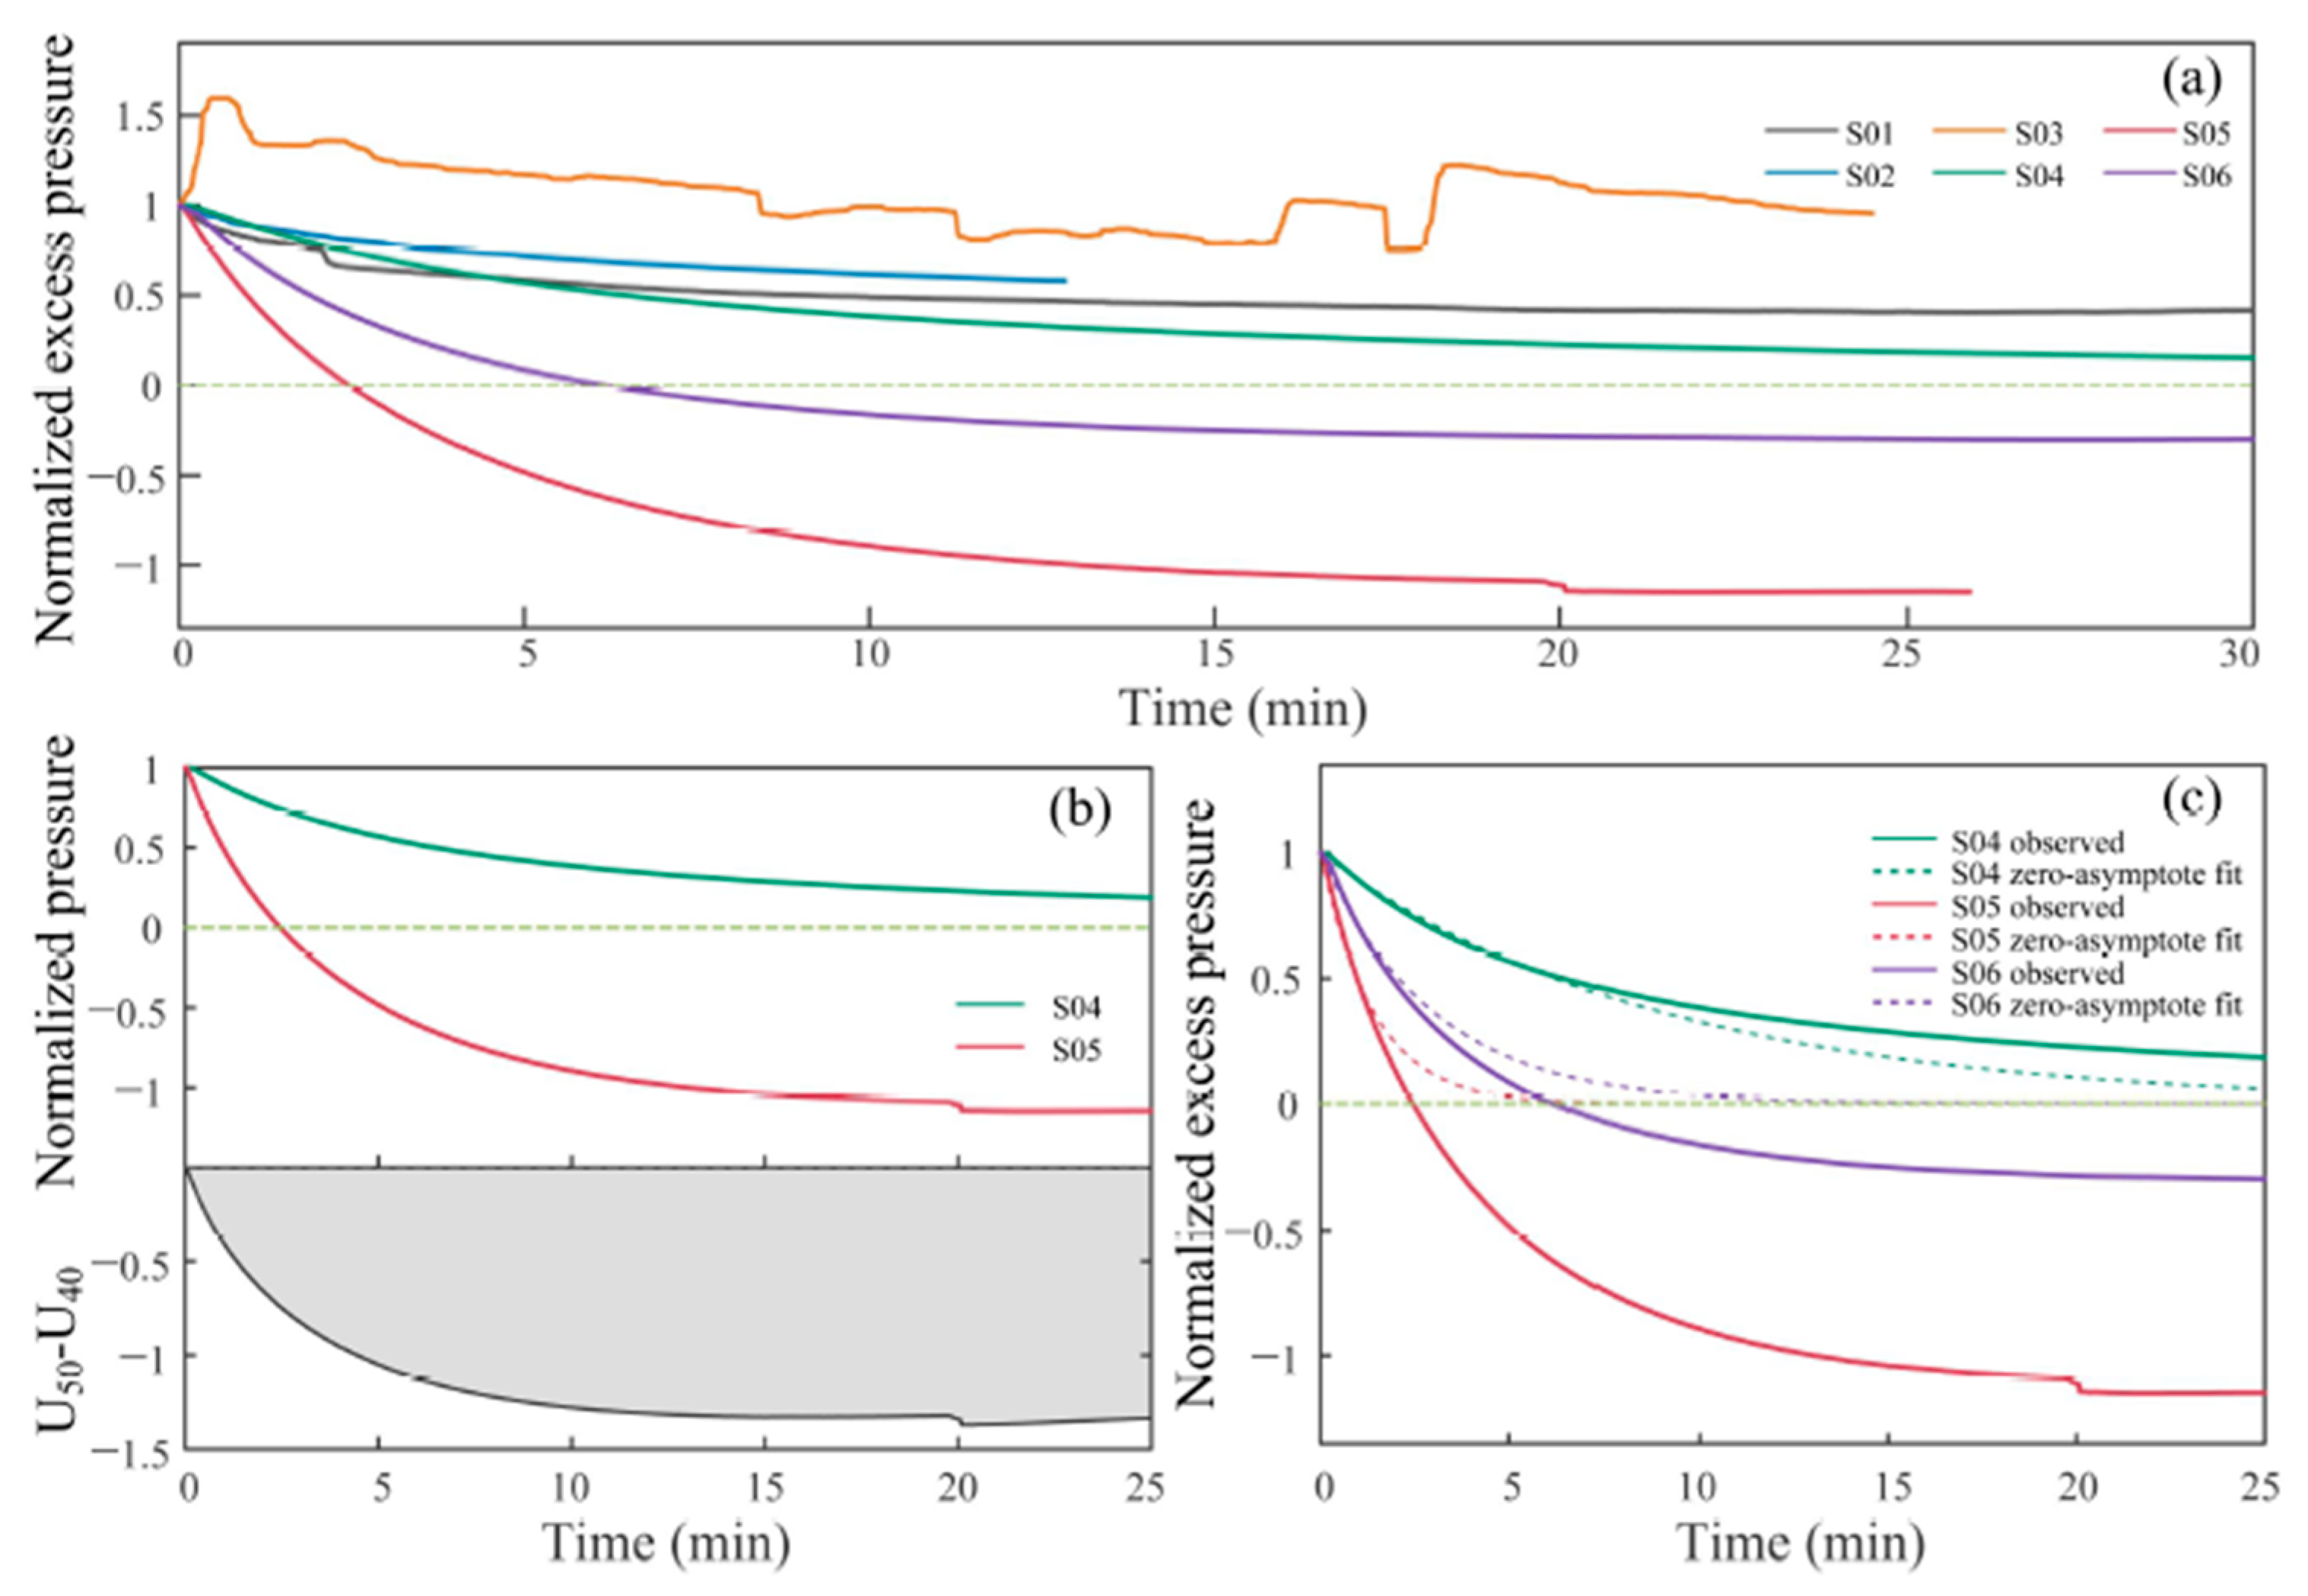
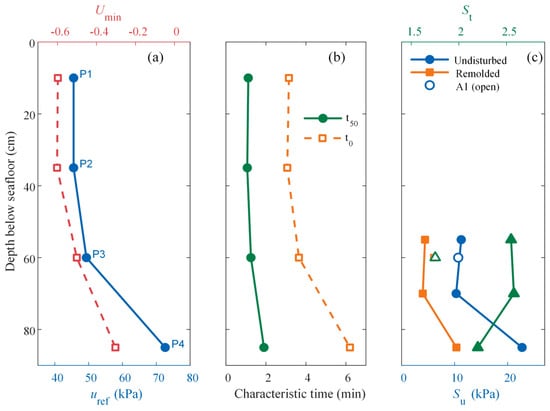
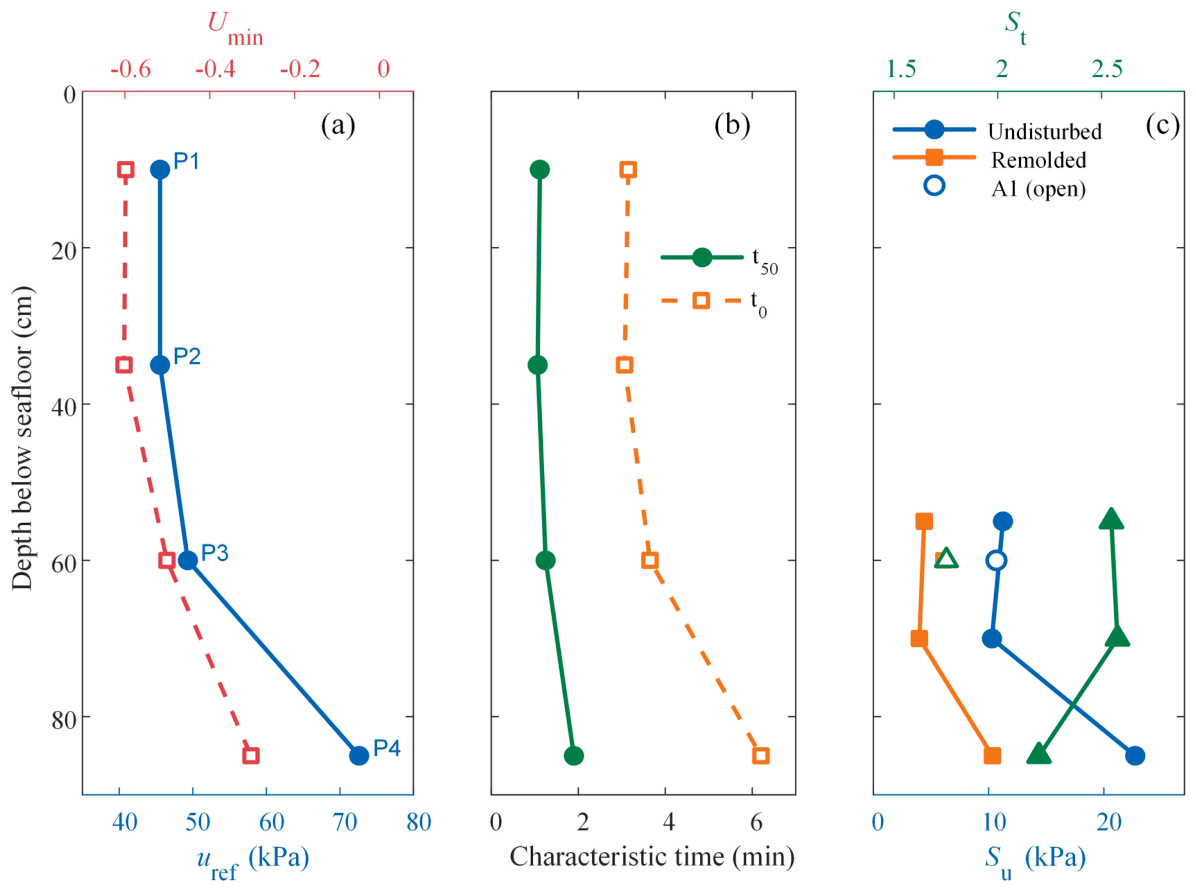
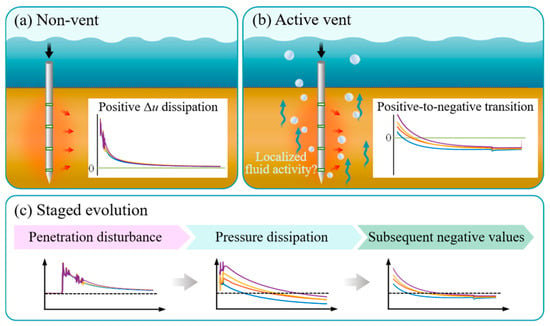
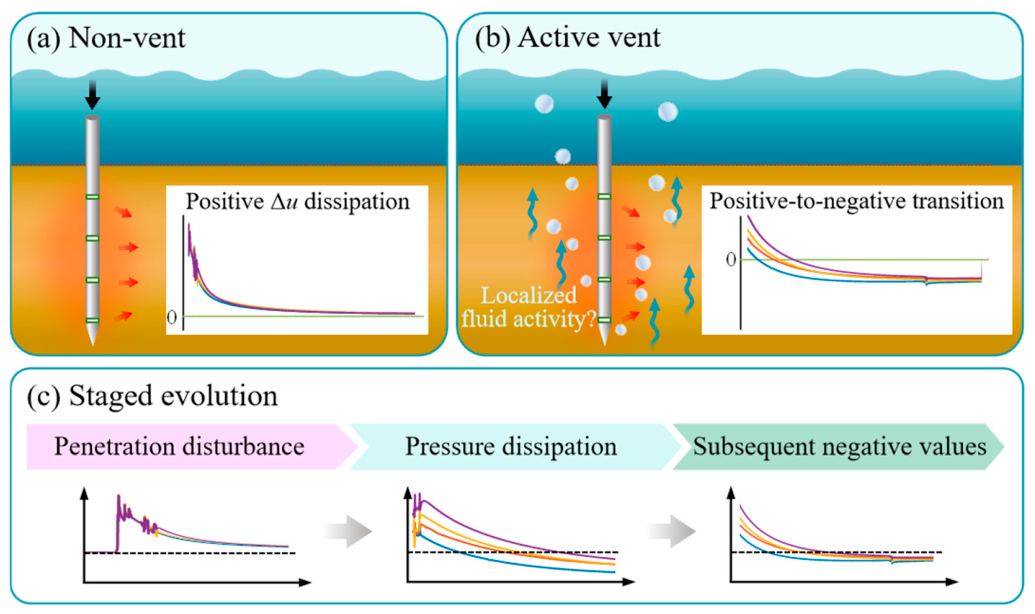

Disclaimer/Publisher’s Note: The statements, opinions and data contained in all publications are solely those of the individual author(s) and contributor(s) and not of MDPI and/or the editor(s). MDPI and/or the editor(s) disclaim responsibility for any injury to people or property resulting from any ideas, methods, instructions or products referred to in the content. |
© 2026 by the authors. Licensee MDPI, Basel, Switzerland. This article is an open access article distributed under the terms and conditions of the Creative Commons Attribution (CC BY) license.