


Abstract
Sub-mudline cutting of abandoned offshore wellbores requires complete separation of multi-layer casing–cement structures under conditions of casing eccentricity and varying jet propagation distances. This study used a rotary premixed ultra-high-pressure abrasive waterjet to conduct 19 concentric screening tests, one independent concentric confirmation test, and one eccentric circumferential severance test on full-scale four-layer casing–cement specimens. Under the tested conditions, increasing the combined pressure–flow input or extending the rotation period enhanced cutting capability, whereas abrasive volume fraction and particle size showed non-monotonic effects. A candidate combination was selected directly from the tested conditions: a pump pressure of 210 MPa, an abrasive volume fraction of 10.6%, garnet abrasive with a nominal median particle size (d50) of 0.18 mm, and a rotation period of 6 h/rev. Both concentric tests achieved V2, defined as penetration through all four casing layers and formation of a slit on the inner witness plate located 575 mm from the nozzle outlet. Applied without retuning to one specimen with a specified eccentric geometry, this combination achieved complete 360° severance and direct physical separation of the upper and lower sections after a cumulative effective cutting time of 6 h. The maximum distance from the nozzle outlet to the outer surface of the outermost casing was 346 mm. This study demonstrates severance feasibility for a single specimen with the specified tool configuration and eccentric geometry, providing a basis for estimating effective cutting time and resource requirements.
1. Introduction
Permanent plugging and abandonment (P&A) in offshore oil and gas operations requires long-term wellbore isolation and, where specified in the decommissioning plan, removal of wellhead and casing structures. Weather conditions, underwater accessibility, vessel selection, well integrity, and the condition of multiple cemented casing strings jointly influence operational costs and risks [1,2,3,4,5,6]. This study focuses on internal circumferential cutting of multi-layer casing–cement composite structures in abandoned offshore wellbores. Figure 1 illustrates the intended application scenario for sub-mudline cutting from inside the wellbore. Cement bonds the casing layers into a composite structure, and local penetration does not necessarily indicate that structural connections have been severed around the entire circumference. Residual steel bridges may also impede lifting and necessitate additional cutting. Therefore, the final evaluation endpoint in this study is circumferential severance of all four casing layers and direct physical separation of the upper and lower sections.
Figure 1.
Schematic of a typical abandoned offshore well and the sub-mudline cutting location.
Existing cutting methods include abrasive waterjet cutting, internal mechanical cutting, hydraulic sawing, diamond-wire sawing, plasma cutting, laser cutting, explosive cutting, and hybrid methods. Previous studies have established a technical basis for abrasive cutting, rotary internal cutting, and multi-layer casing cutting [7,8,9,10]. Robotic wire sawing has also been evaluated through full-scale physical model tests and offshore operations [11], while methods such as underwater sawing impose different requirements for access, clamping, and external working space [12]. For example, the 250 MPa-class system reported in reference [9] operated at 170 MPa and completed offshore cutting of three cemented casing layers in 7.8 h, after which the severed section was lifted out as a unit. Table 1 compares these cutting methods. This study uses a rotary jet inside the wellbore for non-contact material removal and examines the relationship between local penetration, residual cutting capability, and complete circumferential severance as the material path varies within a four-layer casing–cement structure.
Table 1.
Comparison of representative technologies for severing wellbores and offshore structures.
Fundamental research on abrasive waterjets has systematically examined particle acceleration, erosion, and slit formation in the processing of metals, composites, and rocks [16,17,18]. Studies on composites focus on surface quality, slit width, slit taper, and delamination [19,20,21], whereas research on rock cutting and jet-assisted drilling emphasizes cutting depth, material removal volume, and drilling loads [22,23,24]. These findings provide a basis for understanding parameter effects, but the specimen scales, material paths, and evaluation endpoints differ from those associated with complete circumferential severance of full-scale cemented casing structures.
Recent studies have investigated local abrasive waterjet erosion of casing under confining pressure [25], as well as abrasive entrainment, particle acceleration, and the resulting erosion pit morphology in self-suction abrasive jet nozzles [26]. The present study extends the evaluation to a full-scale four-layer steel–cement structure. Fixed witness interfaces are used to identify residual cutting capability after penetration through successive layers, and the candidate operating condition is subsequently assessed through direct physical separation of an eccentric specimen. This study provides evidence of parameter responses in a full-scale configuration and establishes an experimental link between local penetration and complete circumferential severance. The materials, structures, scales, and evaluation endpoints examined in related studies are summarized in Table 2.
Table 2.
Scale, materials, geometry, and evaluation endpoints in related abrasive waterjet studies.
Well integrity and structural severance should be assessed against separate acceptance criteria. API RP 65-3 and NORSOK D-010 address well plugging and well barrier integrity [27,28]. The target cutting depth in this study is approximately 3–5 m below the mudline, while the actual location should comply with the approved project plan. For example, on the U.S. Outer Continental Shelf, wellheads and casings generally must be removed to at least 15 ft (approximately 4.57 m) below the mudline unless an alternative depth is approved [29]. In this study, complete severance is determined by the absence of residual steel bridges across the slit and the ability to directly separate the upper and lower sections of the specimen. This criterion assesses specimen severance. Before offshore cutting, requirements for well plugging, barrier integrity, lifting safety, and other relevant aspects must also be met.
This study uses sequential one-factor-at-a-time screening in the concentric configuration to select a candidate operating condition with V2 structural evidence from the tested matrix. Following one independent concentric confirmation test, a 360° cutting feasibility demonstration is conducted on a single eccentric specimen. The evaluation covers severance results and corresponding resource estimates for the specified tool configuration, specimen materials, and eccentric geometry.
2. Theoretical Relationships and Parameter Characterization
2.1. Hydraulic Parameters
The abrasive–water two-phase flow is treated as an ideal incompressible medium, and the elevation difference between the nozzle inlet and outlet is neglected. The nozzle pressure drop is defined as the difference between the inlet pressure and the surrounding ambient pressure, rather than the static pressure at the free-jet outlet. In terms of the total slurry volumetric flow rate Qs and the effective discharge coefficient Cd, the ideal relationship is:
where Δpn = pn,in − pamb is the pressure difference between the nozzle inlet and the local environment (Pa), with both pressures expressed using the same pressure reference; ρm is the slurry density (kg/m3); Qs is the actual total slurry volumetric flow rate (m3/s); Cd is the dimensionless discharge coefficient; and d is the abrasive-slurry nozzle outlet diameter (m). The experimental pressure settings refer to the pump-side gauge pressure Pp, while the measured Qw represents the clean-water flow rate delivered by the pump. The difference between Pp and Δpn depends on line losses, hydrostatic head, and ambient back pressure.
The nominal mean velocity of the mixture at the nozzle outlet is:
where v is the nominal mixture velocity (m/s), which differs from the abrasive particle velocity.
The ideal hydraulic power across the nozzle is:
where Ph,n is the nozzle hydraulic power (W). The pump-side hydraulic input power is estimated as the product of the pump-side gauge pressure Pp and the clean-water flow rate Qw. This quantity, the nozzle hydraulic power, and the electrical input power to the equipment correspond to different energy boundaries.
Ph,n = Δpn ⋅ Qs
Equations (1)–(3) characterize the hydraulic input. Since pump pressure and clean-water flow rate vary simultaneously, the results of the pressure series are interpreted in terms of their combined effect.
2.2. Abrasive Mixing Ratio and Particle Input
The abrasive volume fraction Ca is defined as the ratio of the dry abrasive bulk volume to the sum of the dry abrasive bulk volume and the clean-water volume:
where ma and mw are the masses of abrasive and water, respectively; ρa is the abrasive bulk density, taken as 1.954 t/m3 for 80-mesh garnet; and ρw is the water density. Ca is defined using the bulk volume, including interparticle voids, and therefore cannot be used directly to calculate the slurry density or actual slurry volume.
For estimates based on the operating conditions, the clean-water flow rate and pre-calibrated mixing ratio are assumed to remain constant, and abrasive hold-up in the feeding system is neglected. The nominal abrasive mass flow rate is then:
where ṁa is the nominal abrasive mass flow rate (kg/s), and Qw is the clean-water volumetric flow rate (m3/s). In Equations (4) and (5), Ca is entered as a volume fraction between 0 and 1. Equation (5) is used to estimate the abrasive supply.
At a fixed Qw, increasing Ca increases the nominal abrasive input, but cutting capability also depends on particle acceleration and transport conditions. The concentration response and its possible mechanisms are discussed in Section 4.2 in conjunction with the structural evidence.
2.3. Rotation Period and Local Exposure Time
The rotation period Trev is the time required for the cutting head to complete one revolution. Its angular velocity ω is:
For a concentric evaluation interface at a constant radius Ri from the rotation axis, the nominal angular displacement and swept arc length during a steady cutting time t are:
where Δθ is expressed in radians, Ri is the interface radius measured from the rotation axis, and Si is the swept arc length. The jet propagation distances in this study are referenced to the nozzle outlet.
Si = Ri⋅Δθ
The nominal exposure time per unit arc length along this concentric interface is:
where τi has units of time per unit length. At a fixed Ri, increasing Trev extends the nominal exposure time per unit arc length. The jet intersection with an eccentric surface and the angle of incidence vary during rotation; therefore, the constant-radius relationships in Equations (8) and (9) are used only for concentric screening.
Equations (6)–(9) use consistent time units. The rotation period is reported in h/rev and converted to s/rev for calculations as needed. For screening runs completed normally, the nominal abrasive exposure time was 20 min. At rotation periods of 2, 4, 6, and 8 h/rev, the corresponding nominal angular displacements were 60°, 30°, 20°, and 15°, respectively. R06 and R12 were interrupted runs and are not treated as having completed the full 20 min. The effective exposure time for R20 is reported in Section 4.5.
3. Experimental Materials and Methods
3.1. Full-Scale Specimens and Experimental Design
A two-stage experimental design was adopted, linking parameter screening in a full-scale concentric configuration with a single-specimen feasibility demonstration of complete circumferential severance in a specified eccentric configuration (Figure 2).
Figure 2.
Configurations of the full-scale four-layer casing–cement specimens: (a) concentric specimen; (b) eccentric specimen. Magenta, green, dark blue, and cyan distinguish Casings #1–#4, respectively; the stippled regions represent oilwell cement.
The concentric stage included one independent confirmation test at the candidate operating condition, with the results reported in Section 4.5. The eccentric stage assessed complete separation of a single specified configuration under the candidate operating condition. Both specimen types comprised four steel casing layers and three cement annuli at full radial scale. Casings #1–#4 correspond, from innermost to outermost, to the production casing, intermediate casing, surface casing, and conductor casing, respectively. Table 3 lists the nominal dimensions, material parameters, and eccentric offsets of each casing layer in the concentric and eccentric specimens. The nominal radial gaps of the three concentric annuli were 35.41, 71.45, and 101.60 mm, respectively. Based on the eccentric casing center positions listed in Table 3 and a circular cross-section model, the nominal thicknesses of the corresponding eccentric annuli varied with azimuth over the ranges of 15.41–55.41, 46.45–96.45, and 81.60–121.60 mm, respectively.
Table 3.
Nominal dimensions and material parameters of the four casing layers.
The annuli were filled with API Class G oilwell cement at a water-to-cement mass ratio of 0.44 and a design slurry density of approximately 1.90 g/cm3. The original formulation contained fluid-loss additive and dispersant dosages of 5% and 0.2%, respectively. Water was added first, followed by gradual addition of cement under mechanical mixing. After continuous pouring, vibration and assisted venting were used to remove entrapped air, and the specimens were cured at room temperature for 7 d. Cement blocks were prepared using the same procedure, and cylindrical cores measuring 25 mm × 50 mm were drilled from these blocks. After the end faces were ground flat, the cores were loaded continuously in the axial direction. Compressive strength was calculated by dividing the peak load by the loaded cross-sectional area. The measured mean strength was 30 MPa, with a range of 26–34 MPa. API RP 10B-2 was used as a reference for slurry preparation and testing [30], and the cylindrical core results were used to characterize the cement cast for this study. The casing–cement interfaces were considered to have nominally intact contact formed by direct casting.
The concentric assembly used the axis of Casing #1 as the reference. Positioning supports were installed at both ends of each casing layer, and uniformly spaced circumferential spacer blocks maintained the annular gaps. Before casting, the gaps on opposing sides at both ends were checked and adjusted until approximately equal. The supports remained fixed during casting, vibration-assisted venting, and the 7 d curing period to limit relative lateral displacement between the casing layers.
The four-layer concentric specimen was used for laboratory parameter screening. Given the maximum test pressure of 270 MPa, the specimen was placed inside a protective enclosure comprising two steel plates, each 10 mm thick, and a crushed-stone energy-absorbing layer to prevent injury or equipment damage after jet penetration. The enclosure also intercepted the jet, abrasive, and debris and provided defined structural witness interfaces. The rotary cutting head had an outer diameter of 200 mm. The distances from the nozzle outlet to the outer surface of Casing #4, the inner protective steel plate (inner witness plate), and the outer protective steel plate (outer witness plate) were 281, 575, and 900 mm, respectively (Figure 3). Cutting marks on the protective steel plates were used to evaluate residual cutting capability after the jet had penetrated the four-layer structure.
Figure 3.
Protective enclosure and experimental arrangement for the four-layer concentric specimen: (a) enclosure structure and fixed witness locations; (b) actual specimen installation. In (a), the casing colors are the same as in Figure 2; yellow identifies the rotating cutting head and red identifies the nozzle assembly.
Complete circumferential cutting of the eccentric specimen was performed at an outdoor test site with a designated safety exclusion zone. The projection O of the tool rotation axis onto the cutting plane was taken as the coordinate origin. The +x direction was defined as the azimuth at which the distance from the nozzle outlet to the outer surface of Casing #4 was greatest. The nozzle outlet moved along a circular path centered at O with a radius rn = 100 mm. This radius was determined from the outer diameter of Casing #4 (762 mm) and the nozzle-to-outer-wall distance in the concentric configuration (281 mm), using the geometric relationships for a circular cross-section and radial jet discharge. The same nozzle rotation radius was used in the concentric and eccentric tests.
The cross-sectional centers O1–O4 of the casing layers lie on the same x-axis. The eccentric offset ei is defined as the distance from O to Oi, and the direction angle φi is measured counterclockwise from the +x-axis, where i = 1–4 identifies the casing layer. The tool axis O coincides with the center O1 of Casing #1; therefore, e1 = 0. The centers of Casings #2, #3, and #4 are offset along the +x direction by e2 = 20 mm, e3 = 45 mm, and e4 = 65 mm, respectively, with all three direction angles equal to 0°. The center-to-center distance between adjacent casing layers represents interlayer eccentricity. The center positions and eccentric offsets are marked in the enlarged view of the casing centers in Figure 4. In Figure 4, N denotes the nozzle outlet, and P denotes the intersection of the jet with the outer surface of Casing #4. The maximum standoff distance occurs at measurement point S8, where NP = 346 mm. As the jet passes through the casing–cement interfaces, its propagation distance, material path, and angle of incidence vary with the jet azimuth. These geometric relationships are subsequently used to convert positions along the local cutting segment into azimuth angles and to estimate the volume of steel removed from the outermost casing.
Figure 4.
Schematic of the four-layer eccentric casing–cement structure and rotary jet cutting geometry. Casing colors are the same as in Figure 2. The dashed circle denotes the nozzle exit trajectory, and the red line marks the jet direction at S8. The enlarged view shows the casing-center offsets.
Slit formation on the witness plate located 575 mm from the nozzle outlet in the concentric tests indicates that the jet retained material removal capability after penetrating the four-layer structure. Because the material paths and incidence conditions differ in the eccentric specimen, this evidence was used only for candidate-condition screening. Complete severance was ultimately verified by direct physical separation after 360° cutting.
3.2. Experimental System for Premixed Ultra-High-Pressure Abrasive Waterjet Cutting
Abrasive waterjet systems are generally classified as premixed or postmixed. The two types differ mainly in where the abrasive and water are mixed and the flow path downstream of the mixing point, as illustrated in Figure 5.
Figure 5.
Schematic of abrasive waterjet generation methods: (a) premixed; (b) postmixed.
This study used a premixed system in which the abrasive and water were mixed upstream in the high-pressure abrasive feeding system. High-pressure clean water passed through the motive nozzle to form a high-velocity jet, creating a local low-pressure region in the mixing chamber that drew in abrasive and formed a high-pressure slurry. The slurry was conveyed through high-pressure lines to the cutting head, where it was accelerated through the converging section and outlet of the abrasive slurry nozzle. Changing the orifice diameter of the motive nozzle altered the entrainment conditions and abrasive intake within the feeding unit. Under specified operating conditions, pre-test calibration established the relationship between the orifice diameter and abrasive volume fraction, allowing the concentration to be set by replacing the motive nozzle. In a postmixed system, abrasive entrainment and mixing occur in the mixing chamber inside the abrasive slurry nozzle. High-pressure clean water first passes through the water nozzle to form a high-velocity jet, which then entrains the abrasive before the mixture is discharged.
A fixed tool and nozzle configuration was used to investigate the effects of key operating parameters on cutting capability in the specified premixed system. The main equipment and rated parameters are listed in Table 4.
Table 4.
Main equipment and technical parameters of the experimental system for premixed ultra-high-pressure abrasive waterjet cutting.
The UHP AWJ cutting tool consists of a UHP abrasive slurry line, a hydraulic anchoring module, a rotational drive module, a rotating cutting head, and a nozzle assembly. The tool has an outer diameter of 200 mm and a maximum anchoring diameter of 336 mm when the anchoring claws are fully extended. The hydraulic anchoring module uses a hydraulic cylinder to extend the anchoring claws into firm contact with the inner wellbore wall, securing the tool in position and supporting the applied loads. The rotational drive module uses a hydraulic motor and two planetary gearboxes to deliver torque, driving the rotating cutting head and nozzle assembly at the preset speed to form a circumferential slit at the specified position on the specimen. The nozzle assembly comprises an abrasive waterjet (AWJ) nozzle and an annular air curtain (AAC) outlet. The AAC surrounds the AWJ to create a “non-submerged environment” underwater, reducing jet attenuation by the surrounding water and enhancing cutting capability [31]. The tool structure is shown in Figure 6.
Figure 6.
Structure of the premixed ultra-high-pressure abrasive waterjet tool for rotary cutting inside the wellbore.
The arrangement of the experimental system for premixed UHP abrasive waterjet cutting is shown in Figure 7.
Figure 7.
Experimental system for premixed UHP abrasive waterjet cutting: (a) system configuration and connections; (b) actual setup. HPU denotes the hydraulic power unit; arrows in (a) indicate flow directions.
The high-pressure hose has a rated working pressure of 280 MPa and a burst pressure of 600 MPa. The candidate pump pressure of 210 MPa and the maximum test pump pressure of 270 MPa are 70 MPa and 10 MPa below the rated working pressure, respectively. A safety valve and a rupture disc are installed on the pump side, with a pressure relief setting of 280 MPa. These static pressure margins do not constitute safety factors against transient overpressure or fatigue failure.
3.3. Experimental Procedure and Parameter Matrix
Before each test, the connections and seals of the high-pressure, compressed-air, and hydraulic lines were checked, and the abrasive mixing ratio was set using a pre-calibrated motive nozzle. After the tool was installed and anchored, the pressure and abrasive supplies were established, and the air curtain and rotation were activated. Upon completion of the prescribed cutting operation, abrasive feeding was stopped, residual abrasive was flushed out, and the system was depressurized. Table 5 presents the sequential one-factor-at-a-time test matrix. Only one factor was varied at a time, while the remaining parameters were maintained at their baseline settings of 210 MPa, 7.7%, d50 = 0.18 mm, and 6 h/rev. Within each parameter series, tests were conducted in ascending order of the parameter values without randomization. The same baseline run was shared across the series. This design supports engineering screening within the tested matrix; it does not evaluate parameter interactions or identify a global optimum.
Table 5.
Concentric one-factor-at-a-time screening matrix.
The parameter ranges were selected based on penetration requirements, abrasive delivery capacity, and the adjustable rotational speed range of the tool. Pump pressure ranged from 120 to 270 MPa in increments of 30 MPa, with the upper limit below the rated working pressure of the hose. Abrasive volume fraction ranged from 1.4% to 17.6%, covering conditions from low abrasive supply to high abrasive loading. The nominal particle size d50 ranged from 0.048 to 0.25 mm, covering fine, medium, and coarse size fractions. The rotation period ranged from 2 to 8 h/rev in increments of 2 h/rev. All series used the same specimen system, tool, and air curtain conditions, with a nominal cutting time of 20 min for runs completed normally.
3.4. Process Validity and Cutting Capability Assessment
This study records the cutting capability levels V0–V3 separately from the test process status. Capability levels are determined from structural evidence on the four casing layers and the protective steel plates.
The capability levels are ordinal categories; the spacing between levels does not represent equal increments in cutting distance or capability. Process failures, jet travel beyond the protective boundary, and reasons for shutdown are recorded separately. All distances are referenced to the nozzle outlet. In the concentric specimen, the outer surface of Casing #4, the inner witness plate, and the outer witness plate are located at 281, 575, and 900 mm, respectively. The correspondence between these locations and the cutting capability levels is shown in Figure 8.
Figure 8.
Correspondence between capability states and fixed structural witness locations in the four-layer concentric specimen, with the maximum standoff distance in the eccentric test shown for reference. Gray, blue, yellow, and orange indicate V0, V1, V2, and V3, respectively; green marks the maximum standoff distance in the eccentric test (346 mm).
- (1)
- V0: No penetration through the four-layer structure. Casing #4 is not penetrated, and the jet action terminates within the specimen. The termination position is recorded separately.
- (2)
- V1: Penetration through the four-layer structure. The jet penetrates Casing #4 at 281 mm, but no clear slit or erosion marks are observed on the steel substrate of the inner witness plate at 575 mm. Removal of surface rust alone, without removal of the underlying steel, is still classified as V1.
- (3)
- V2: Residual cutting capability after penetration. The jet penetrates Casing #4 and produces a clear slit or erosion marks on the steel substrate of the inner witness plate at 575 mm, indicating that the jet retains material removal capability after passing through the four-layer structure.
- (4)
- V3: Greater residual cutting capability. The V2 criteria are met, and a clear slit or erosion marks are also observed on the steel substrate of the outer witness plate at 900 mm. This indicates that the jet can still remove material at a more distant location after passing through the four-layer structure.
- (5)
- F: Process failure. Faults such as nozzle clogging, interruption of abrasive feeding, or inability to maintain the prescribed operating parameters occur during the test. F denotes a process failure; it is not a cutting capability level and does not indicate zero cutting depth.
These capability levels are used to assess local cutting in the concentric specimen and do not directly indicate complete circumferential severance. Complete severance of the eccentric specimen requires continuous, closed circumferential slits in all four casing layers, with no residual steel connecting the upper and lower sections across the slits. The two sections must separate directly without additional cutting, prying, or pulling to break residual connections. Assessment is based on macroscopic inspection of the slits and exposed cross-sections after testing, together with direct physical separation of the specimen. The result is jointly confirmed on site by the test participants.
At 270 MPa, slits formed on both the inner and outer witness plates, and the cutting capability was classified as V3. The test was shut down for safety because the jet extended beyond the protective boundary; this process status is recorded separately and is not classified as F. At an abrasive volume fraction of 17.6%, nozzle clogging occurred, and the process status was recorded as F without assigning a V0–V3 capability level.
3.5. Experimental Units and Data Processing
Each individually numbered slit in a full-scale specimen served as an experimental unit for parameter screening. A total of 19 screening runs were conducted, with the baseline shared across the four parameter series counted only once. Only the candidate operating condition underwent an additional independent concentric confirmation test, yielding two concentric results, R09 and R20; the other screening levels were not independently repeated. The eccentric circumferential test R21 used a single specimen. Together, the screening, concentric confirmation, and eccentric test comprised 21 runs. The concentric confirmation assessed consistency in the structural classification, while the single eccentric test evaluated severance feasibility for the specified configuration. These tests were not used to estimate repeatability across specimens, success probability, or statistical confidence, and no significance tests were performed between operating conditions. The operating conditions, structural evidence, and process status of each run are summarized in Appendix B.
When the jet action front terminated within the specimen and the cutting capability was classified as V0, the termination distance was measured at six positions along the same slit, and L was reported as their mean. The insets in the parameter plots show these measured means and error bars representing the mean ± one sample standard deviation, describing spatial variation along the slit. The six measurement points are spatial subsamples within a single experimental unit, rather than independent replicates. The error bars do not represent repeatability across independent tests or confidence intervals for the mean.
V1, V2, and V3 correspond to structural evidence at the outer surface of Casing #4, the inner witness plate, and the outer witness plate, respectively. Their fixed locations are 281, 575, and 900 mm from the nozzle outlet and are not treated as continuous measurements of L. In all four parameter plots, the main panels show the V0–V3 capability categories without connecting the categorical data points. The insets show the measured L values and spatial standard deviations for V0 conditions, with connecting lines serving only as guides to the eye. F is listed separately as a process failure, without assigning a capability level or an L value.
Pump pressure was measured using a WIKA dial pressure gauge with a range of 0–400 MPa and an accuracy class of 1.0 marked on the dial, corresponding to a nominal permissible error of ±4 MPa. Clean-water flow was measured using two electromagnetic flowmeters manufactured by Xi’an Yunyi Instrument Co., Ltd., installed at the pump suction inlet and branch outlet, respectively. Neither flowmeter was therefore required to withstand high pressure (Figure 9).
Figure 9.
Pressure and flow measurement instruments: (a) pressure gauge; (b) flowmeters and flow totalizer.
Neglecting bypass flow, leakage, and changes in the volume of water stored within the pump, the clean-water flow rate in the high-pressure circuit is:
where Qin is the total suction-inlet flow rate, and Qout is the branch-outlet flow rate. The difference between the two flow rates is displayed and recorded by the flow totalizer. Qw excludes the abrasive volume.
Qw = Qin − Qout
Pressure and flow rate were recorded at 2 min intervals. This study reports the measured clean-water flow rate corresponding to each pressure level. Standoff distances, structural dimensions, and nozzle orifice diameters were measured using a caliper with a scale division of 0.02 mm. The rotation period was calculated from the angular displacement and the corresponding effective operating time.
Following the Type B evaluation method in JCGM 100:2008 [32], the pressure gauge’s nominal permissible error of ±4 MPa was treated as a rectangular distribution. This yielded a standard uncertainty component of 2.31 MPa based on the instrument specification, corresponding to a relative component of 1.10% at 210 MPa.
The abrasive volume fraction was controlled using a motive nozzle calibrated before testing and is reported on the dry abrasive bulk-volume basis defined in Section 2.2. The value for the candidate operating condition was 10.6%. Abrasive consumption was estimated from the mixing ratio, clean-water flow rate, and cumulative effective cutting time. Hydraulic energy, volumetric removal rate, and specific energy consumption were calculated using the stated operating conditions and geometric model. The local calculation method is presented in Section 3.6, and model uncertainty and resource sensitivity analyses are discussed in Section 4.6.
3.6. Estimation of Material Removal Volume and Hydraulic Input
The material removal volume for the entire structure is geometrically defined over four steel layers and three cement layers. Let j denote the material region index, with seven regions in total; Aj denote the cross-sectional area of region j in a plane perpendicular to the wellbore axis; and denote the area-weighted mean axial width of material loss over the full circumference and thickness of that region. The total material removal volume is then:
where Vtot is the total material removal volume, and Vs and Vc are the volumes of steel and cement removed, respectively. Aj is calculated as the difference between the areas enclosed by the outer and inner boundaries of the region, and is the corresponding area-weighted mean width of material loss. Final slit data covering the full circumference and through-thickness direction were not obtained for the seven material regions. Equation (11) therefore defines the scope of a complete assessment but is not used to report a measured removal volume for the entire structure.
The volumetric removal rate Rv and pump-side hydraulic specific energy consumption eh are given by:
where t is the cumulative effective cutting time, and Eh is the hydraulic energy supplied at the pump side during this period, calculated as follows:
where τ is the time variable within the effective cutting period, and Pp(τ) and Qw(τ) are the pump-side gauge pressure and clean-water flow rate at the corresponding instant, respectively. For constant operating conditions, the approximate form of Equation (13) is used, with Pp and Qw representing the pressure and flow rate values for the specified condition.
Quantitative estimates were obtained for the segment of the outermost casing with recorded local slit widths. The segment length was estimated from the measuring-tape photograph. Approximate arc-length positions were assigned to the measurement points based on their spacing and then converted into jet azimuth angles relative to the tool axis using the eccentric geometry. The local effective sweep time was calculated from the angular span of the segment and the rotation period, corresponding to the estimated removal volume of the same segment.
The local removal volume was calculated using the inner and outer diameters of Casing #4 and its position relative to the tool axis. The measured slit widths at adjacent points were linearly interpolated, and the opening width at the outer surface was assumed to remain constant through the wall thickness. Integration over the corresponding segment of the steel annulus yielded an estimate of the local steel removal volume. Dividing this volume by the local effective sweep time gave the local volumetric removal rate. Dividing the pump-side hydraulic energy input during the same effective period by this volume gave the local apparent hydraulic specific energy consumption. This index uses the system hydraulic energy input as the numerator and the estimated removal volume of the outermost steel layer as the denominator. Its interpretation and model uncertainty are discussed in Section 4.6.
4. Experimental Results and Discussion
The following sections discuss the four parameter series, the candidate operating condition, and the eccentric circumferential severance results. The criteria for the capability categories are defined in Section 3.4, and the measured L values for V0 conditions and the meaning of the error bars are explained in Section 3.5.
4.1. Effects of Combined Pressure–Flow Input on Cutting Capability and Measured Distances for V0 Conditions
At the baseline abrasive volume fraction, particle size, and rotation period, pump pressures of 120, 150, and 180 MPa produced mean jet-action termination distances within the specimen of 103.2, 147.3, and 240.2 mm, respectively. V1 was achieved at 210 MPa and V2 at 240 MPa. At 270 MPa, V3 evidence was observed before the safety shutdown (Figure 10 and Table 6).
Figure 10.
Cutting capability categories and measured distances for V0 conditions in the concentric pressure–flow series. The main plot shows the V0–V3 capability categories; the inset shows the measured L values for V0 conditions (mean ± standard deviation; six spatial measurement points). Data processing is described in Section 3.5. Black squares in the main plot indicate the observed capability categories, and blue horizontal lines mark the category levels. Lines connecting the inset means serve only as guides to the eye.
Table 6.
Observed cutting capability and process status in the pressure series.
The pump pressures in this series were 120, 150, 180, 210, 240, and 270 MPa, with corresponding measured clean-water flow rates of 21.6, 24.2, 26.5, 28.6, 30.6, and 32.4 L/min, respectively. Because pressure and flow rate varied simultaneously, the results reflect their combined hydraulic input and do not isolate the effect of pressure at a constant flow rate.
At 210 MPa, Casing #4 was penetrated, while only surface rust removal marks were observed on the inner witness plate. No slit or clear erosion of the steel substrate was observed. The condition was therefore classified as V1 according to the decision rule in Section 3.4 (Figure 11).
Figure 11.
V1 evidence at the common baseline condition (210 MPa and 7.7% abrasive volume fraction): (a) slit penetrating Casing #4; (b) corresponding rust removal marks on the inner witness plate. The result of this single common baseline test was reused across the parameter series.
At 240 MPa, material removal produced a slit on the inner witness plate, indicating that the jet retained cutting capability after penetrating the four-layer concentric structure. This condition was classified as V2 (Figure 12).
Figure 12.
V2 evidence at 240 MPa: (a) slit in Casing #4; (b) corresponding slit on the inner witness plate at 575 mm.
At 270 MPa, a clear slit also formed on the outer witness plate, and the cutting capability reached V3 (Figure 13). This test was shut down for safety because the jet extended beyond the protective boundary. At the baseline abrasive volume fraction of 7.7%, V2 had already been achieved at 240 MPa, satisfying the candidate-condition screening requirement. The higher pressure of 270 MPa was therefore not selected as the candidate pressure.
Figure 13.
Structural evidence from the interrupted run at 270 MPa: (a) penetration through Casing #4; (b) slit on the inner witness plate; (c) material removal marks on the outer witness plate. The cutting capability of this condition was classified as V3.
With the nozzle configuration, abrasive volume fraction, particle size, and rotation period held constant, the simultaneous increases in pump pressure and clean-water flow rate increased the pump-side hydraulic input, favoring higher jet velocity and greater abrasive particle impact momentum. Based on the fixed abrasive mixing ratio, the estimated abrasive feed rate also increased with water flow rate, enhancing sustained erosion. This provides a mechanistic explanation for the outward advance of the jet action front and the retention of cutting capability after penetration through the multi-layer casing–cement structure.
4.2. Effects of Abrasive Volume Fraction on Cutting Capability and Measured Distances for V0 Conditions
At 210 MPa, d50 = 0.18 mm, and 6 h/rev, the abrasive volume fraction series exhibited a non-monotonic structural response (Figure 14 and Table 7).
Figure 14.
Cutting capability categories and measured distances for V0 conditions in the concentric abrasive volume fraction series. The main plot shows the V0–V3 capability categories; the inset shows the measured L values for V0 conditions (mean ± standard deviation; six spatial measurement points). The 17.6% condition was recorded as F due to nozzle clogging and is not plotted. Data processing is described in Section 3.5. Black squares in the main plot indicate the observed capability categories, and blue horizontal lines mark the category levels. Lines connecting the inset means serve only as guides to the eye.
Table 7.
Observed cutting capability and process status in the abrasive volume fraction series.
At abrasive volume fractions of 1.4% and 4.9%, the mean jet-action termination distances within the specimen were 19.0 and 121.5 mm, respectively. V1 was achieved at 7.7% and V2 at 10.6%. At 13.3% and 15.5%, the mean termination distances decreased to 266.3 and 147.5 mm, respectively. Nozzle clogging occurred at 17.6%, and no numerical penetration value was assigned to this run.
Nozzle clogging was observed once at 17.6%. Cutting capability had already declined at 13.3% and 15.5%, and the clogging event was accompanied by a rapid rise in pump pressure. To avoid reintroducing this risk, the condition at which clogging occurred was not repeated. This record documents a single process failure under the tested configuration; 17.6% is not defined as a universal clogging threshold.
An abrasive volume fraction of 10.6% produced the best structural performance among the levels tested in this series. Slit #4 and Slit #4-I in Figure 15 provide evidence of penetration through Casing #4 and material removal on the inner witness plate, respectively. All other parameters remained at their baseline settings, providing direct experimental support for this candidate combination.
Figure 15.
V2 evidence for the candidate condition in the original screening test: 210 MPa, an abrasive volume fraction of 10.6%, d50 = 0.18 mm, and a rotation period of 6 h/rev. (a) Slit #4 in Casing #4; (b) corresponding Slit #4-I on the inner witness plate.
The non-monotonic concentration response may arise from the combined effects of particle impact frequency, interparticle interactions, and liquid–solid momentum partitioning [16,22]. As abrasive input initially increases, more effective impacts promote sustained material removal. At higher concentrations, particle collisions and shielding affect particle motion and the likelihood of direct impacts on the target. Meanwhile, the finite momentum of the liquid flow is shared among more particles, limiting the acceleration of individual particles. These competing effects provide a mechanistic explanation for the initial increase and subsequent decline in cutting capability. Slurry rheology, pressure loss, sedimentation, and fluctuations in abrasive feeding are additional factors that may affect the effective nozzle input. The applicability of related studies must also be considered: concentration thresholds identified in low-velocity slurry erosion should not be directly applied to the present conditions [33], and increased viscosity does not necessarily reduce jet coherence [34]. Nozzle clogging was directly observed at 17.6% in this study. The declines in cutting capability at 13.3% and 15.5% should be discussed in relation to the factors above and are not taken as evidence of clogging.
4.3. Effects of Abrasive Particle Size on Cutting Capability and Measured Distances for V0 Conditions
With the other parameters held at their baseline settings, d50 values of 0.048, 0.075, 0.10, and 0.25 mm produced mean jet-action termination distances within the specimen of 116.0, 214.3, 229.2, and 181.2 mm, respectively. Among the tested particle sizes, only d50 = 0.18 mm achieved penetration through Casing #4 and reached V1 (Figure 16 and Table 8).
Figure 16.
Cutting capability categories and measured distances for V0 conditions in the concentric abrasive particle size series. The main plot shows the V0–V3 capability categories; the inset shows the measured L values for V0 conditions (mean ± standard deviation; six spatial measurement points). Data processing is described in Section 3.5. Black squares in the main plot indicate the observed capability categories, and blue horizontal lines mark the category levels. Lines connecting the inset means serve only as guides to the eye.
Table 8.
Structural responses in the particle size series.
The particle size response may reflect the combined effects of the impact capability of individual particles, particle number, and acceleration. Smaller particles accelerate more readily with the liquid phase, but their lower individual mass means that they carry less momentum and kinetic energy at similar impact velocities. Increasing particle size increases individual particle mass but reduces the number of particles at comparable abrasive dosages. Meanwhile, the acceleration response of larger particles and liquid–solid slip affect their actual impact velocity. The effect of particle size on cutting capability should therefore be interpreted by considering both individual particle impacts and the cumulative number of effective impacts. Increasing particle size does not necessarily lead to a sustained improvement in cutting capability.
In this series, the 0.18 mm condition achieved penetration through Casing #4 and reached V1, whereas cutting capability declined when the particle size increased to 0.25 mm. Based on the measured cutting results, 0.18 mm was selected as the candidate particle size within the tested matrix for the current nozzle configuration.
4.4. Effects of Cutting Head Rotation Period on Cutting Capability and Measured Distances for V0 Conditions
With the other parameters held at their baseline settings, rotation periods of 2 and 4 h/rev produced mean jet-action termination distances of 79.7 and 173.8 mm, respectively. V1 was achieved at 6 h/rev and V2 at 8 h/rev (Figure 17 and Table 9). Although the screening time was 20 min for all conditions, different rotation periods covered different angular spans. The results therefore reflect the combined effects of local dwell time and swept arc length.
Figure 17.
Cutting capability categories and measured distances for V0 conditions in the concentric rotation period series. The main plot shows the V0–V3 capability categories; the inset shows the measured L values for V0 conditions (mean ± standard deviation; six spatial measurement points). Data processing is described in Section 3.5. Black squares in the main plot indicate the observed capability categories, and blue horizontal lines mark the category levels. Lines connecting the inset means serve only as guides to the eye.
Table 9.
Observed cutting capability and process status in the rotation period series.
At the baseline abrasive volume fraction of 7.7%, increasing the rotation period to 6 h/rev resulted in penetration through Casing #4, achieving V1. Increasing it to 8 h/rev produced a slit on the inner witness plate, achieving V2 (Figure 18). In terms of exposure time, increasing the rotation period while holding pressure, flow rate, abrasive input, and nozzle configuration constant primarily reduces the angular velocity of the cutting head, increasing the jet exposure time per unit arc length along a concentric interface. Although the screening time was 20 min for all conditions, a longer rotation period resulted in a shorter swept arc length, allowing local regions to receive particle impacts for longer and promoting deeper cutting. This provides a physical explanation for the transition from V0 to V1 and V2 in this series.
Figure 18.
V2 evidence at a rotation period of 8 h/rev, with the other parameters held at their baseline settings: (a) Slit #5 in Casing #4; (b) corresponding Slit #5-I on the inner witness plate. Slit #5 in this figure and Slit #4 from the abrasive volume fraction series in Figure 15 were produced in different cutting runs; the two slits are merely adjacent in space.
Extending the rotation period also increases the time required to complete a 360° circumferential cut and, under the same water and abrasive supply conditions, increases resource consumption for the full circumference. Selection of the rotation period should therefore consider both cutting capability and circumferential cutting time. The results show that 8 h/rev was the tested rotation period that achieved V2 at the baseline abrasive volume fraction of 7.7%. Selection of the final candidate combination also considered the direct experimental results from the abrasive volume fraction series, as detailed in Section 4.5.
4.5. Selection of the Candidate Operating Condition
The candidate combination was selected directly from the abrasive volume fraction series: 210 MPa, an abrasive volume fraction of 10.6%, d50 = 0.18 mm, and a rotation period of 6 h/rev. Only the abrasive volume fraction differed from the common baseline of 7.7% (R04). The candidate condition achieved V2, with no nozzle clogging observed. As shown in Table 10, the candidate condition R09 achieved V2 at 210 MPa and 6 h/rev, without requiring an increase in pressure to 240 MPa or an extension of the rotation period to 8 h/rev. This complete combination was directly tested in the abrasive volume fraction series and represents an engineering choice within the tested matrix for the fixed tool configuration.
Table 10.
Candidate operating condition selected from the original abrasive volume fraction series.
The independent concentric confirmation test, the original screening tests, and the eccentric circumferential test were all completed during the original collaborative test campaign with the oilfield partner. R20 again achieved penetration through Casing #4 and produced a clear slit on the inner witness plate at 575 mm, yielding a V2 classification (Figure 19). The agreement between R09 and R20 supports the consistency of the structural classification at the candidate operating condition. Independent confirmation was performed only for this candidate combination. The effective abrasive exposure time for R20 was 20 min, corresponding to a nominal angular displacement of 20° at a rotation period of 6 h/rev.
Figure 19.
Independent concentric confirmation test R20 at the candidate operating condition: 210 MPa, 10.6%, d50 = 0.18 mm, and 6 h/rev. (a) Slit in Casing #4; (b) corresponding slit on the inner witness plate. The cutting capability was classified as V2; run details are provided in Appendix B.
4.6. Feasibility Demonstration of Complete Circumferential Severance in a Four-Layer Eccentric Specimen
The candidate combination of 210 MPa, an abrasive volume fraction of 10.6%, d50 = 0.18 mm, and 6 h/rev was used for circumferential cutting of a single four-layer eccentric specimen. The specimen was positioned vertically, and the tool was anchored inside Casing #1. The maximum distance from the nozzle outlet to the outer surface of Casing #4 was 346 mm. The candidate combination was applied without retuning for the eccentric configuration. After local penetration, the jet was observed exiting through the outer wall of the outermost casing (Figure 20a).
Figure 20.
Demonstration of 360° severance of a single four-layer eccentric specimen: (a) cutting process; (b) cross-section of the casing–cement structure after direct physical separation; (c) nozzle after a cumulative effective cutting time of 6 h. Measurement points from the intermediate local inspection are shown in Figure 21, and inspection results for each casing layer are presented in Table A3.
Cutting included one intermediate pause lasting less than 15 min in total, of which approximately 6 min was used for auxiliary flushing. Water and abrasive supplies were stopped during the subsequent observation and measurement stage. Slit observations and width measurements were performed on a local segment of the outermost casing spanning the maximum-eccentricity position S8. Slit widths at all 12 measurement points, S1–S12, were measured during this inspection. The cutting tool remained inside Casing #1. Access restrictions caused by the surrounding multi-layer casing–cement structure and the space occupied by the tool prevented slit-width measurements on the inner three casing layers.
The specimen underwent complete 360° circumferential cutting after a cumulative effective cutting time of 6 h. This duration excluded the flushing and inspection time described above. Including the intermediate pause, the elapsed time from the start of cutting to completion was less than 6 h 15 min. After cutting, all four casing layers exhibited closed circumferential slits, and macroscopic inspection revealed no residual steel bridges connecting the upper and lower sections. The upper section was supported by a crane, and the two sections were completely separated without pulling, prying, or additional cutting (Figure 20b). The separation result was jointly confirmed on site by the test participants. The final inspection of severance in each layer and the intermediate local slit-width measurements are presented separately in Table A3.
During cutting, pressure and flow rate were monitored using the pump-side pressure gauge and the clean-water flow totalizer, with readings recorded at 2 min intervals. The operating status of the rotational drive module was also observed. Changes in pressure and flow rate, together with equipment operation, provided supporting information for assessing whether cutting proceeded normally. After local penetration, jet discharge through the slit in the outermost casing was observed on site as an indication of local penetration during operation. During the single intermediate inspection stop, the outer slit spanning the maximum-eccentricity position S8 was observed and measured. Complete circumferential severance was confirmed by post-test inspection of the slit in each layer and direct physical separation of the upper and lower sections.
The abrasive-slurry nozzle outlet diameter was checked using a vernier caliper with a scale division of 0.02 mm. The measured diameter was 1.02 mm both before testing and after a cumulative effective cutting time of 6 h. No diameter change was detected at this measurement resolution, and visual inspection revealed no outlet edge chipping or macroscopic damage (Figure 20c). Post-test system inspection revealed no leakage at the sealed connections or rotary joints and no apparent external damage to the hoses or fittings. The flow passage in the mixing chamber and the motive nozzle showed no apparent erosion, wear, or clogging.
Figure 21a shows the local slit in the outermost casing measured during the single intermediate inspection stop described above, with S8 marking the maximum-eccentricity position. The 12 slit-width measurements had a mean of 8.56 mm, a sample standard deviation of 3.34 mm, and a range of 2.4–13.8 mm (Figure 21b). The minimum width was 2.4 mm at S6, while the width at S8 was 6.6 mm. These 12 measurements are spatial subsamples within one test, describing local variation at the time of the intermediate inspection; they are not independent experimental replicates. Final slit-width data covering the full circumference of each casing layer were not obtained in this test. Complete severance was determined from inspection of the slit in each layer and direct physical separation of the upper and lower sections.
Figure 21.
Local slit widths measured during a single intermediate inspection stop in the eccentric test: (a) measurement points S1–S12, with S8 marking the maximum-eccentricity position; (b) slit-width distribution, with a mean of 8.56 mm and a sample standard deviation of 3.34 mm. In (a), red points and vertical guide lines indicate measurement locations. In (b), blue squares denote measured slit widths, the red dashed line denotes the mean, and the shaded band represents the mean ± one standard deviation (5.22–11.90 mm), and the blue line serves only as a guide to the eye. This figure and Figure 20 document the same test.
During cutting, the pump pressure, abrasive mixing ratio, and rotation period were set to their candidate values, with the abrasive mixing ratio controlled using a pre-calibrated motive nozzle. Before reaching the outermost casing, the jet passed successively through the inner steel and cement layers. The eccentric geometry caused the jet propagation distance, material path, and angle of incidence to vary with azimuth. These geometric variations, together with the residual erosion capability and dispersion of the jet after passing through multiple material layers, may jointly influence the local slit-width distribution. The measurements show that the slit width at S6 was smaller than that at S8, the maximum-standoff position. Thus, the minimum slit width and maximum standoff distance did not occur at the same location within this segment.
Local removal volume and hydraulic input were estimated for the S1–S12 segment. Based on the 10.5–32.5 cm interval shown in the measuring-tape photograph, the segment arc length was estimated as 220 mm. The 12 measurement points were assigned approximately equal arc-length intervals, with adjacent points about 20 mm apart. Taking S8 as the origin of the arc-length coordinate, S1 and S12 were located at −140 and +80 mm, respectively. The calculation used this photograph-based length estimate and the approximate measurement-point coordinates, together with a circular cross-section, linear interpolation of slit widths between measurement points, and a geometric approximation of constant slit width through the wall thickness. The method is detailed in Section 3.6 and Appendix A.
Using a circular cross-section model of Casing #4 with an outer radius of 381 mm, a wall thickness of 25.40 mm, and a center offset of 65 mm from the tool axis, the segment corresponded to a tool angular displacement of approximately 28.3°. At a rotation period of 6 h/rev, the local effective sweep time was approximately 28.3 min. Interpolation of the 12 measured slit widths and integration under the constant-through-thickness width assumption described in Section 3.6 yielded an estimated local removal volume of approximately 44.5 cm3 for the outermost steel layer. The corresponding volumetric removal rate was approximately 1.57 cm3/min (1.57 × 103 mm3/min).
A pump pressure of 210 MPa and a clean-water flow rate of 28.6 L/min corresponded to a pump-side hydraulic power of approximately 100.1 kW and a hydraulic energy input of approximately 47.2 kWh during the local sweep period. Dividing this input by the estimated removal volume of the outermost steel layer yielded a local apparent hydraulic specific energy consumption of approximately 3.82 × 10³ J/mm3. The numerator of this supplementary operational index includes the hydraulic input associated with jet passage through the inner materials and transport, whereas the denominator includes only the removal volume of the outermost steel layer. It is therefore not treated as an intrinsic specific energy of material removal or a measured specific energy consumption for the entire structure, nor is it used to rank performance across technologies. Photograph readings, measurement-point registration, slit taper, opening deformation, and the actual through-thickness slit morphology contribute to model uncertainty that has not yet been quantified.
A cumulative effective cutting time of 6 h corresponded to an average rotational angular velocity of 60°/h. Based on the circumference of the outermost casing with an outer diameter of 762 mm, the equivalent circumferential feed rate was 6.65 mm/min, characterizing the overall progress of severance.
At the stated pump pressure and clean-water flow rate, estimates based on a cumulative effective cutting time of 6 h gave a pump-side hydraulic energy of approximately 600.6 kWh and a water supply volume of approximately 10.30 m3 for full-circumference cutting. At an abrasive volume fraction of 10.6%, the estimated abrasive bulk volume was approximately 1.22 m3. Using a bulk density of 1.954 t/m3 for 80-mesh garnet, the estimated abrasive mass was approximately 2.39 t. These engineering estimates apply only to the 6 h effective cutting stage. Flushing, inspection stops, auxiliary equipment, deployment, retrieval, and field operations are outside this accounting boundary; estimates for flushing and auxiliary energy use are discussed separately below. The results are summarized in Table 11.
Table 11.
Measured slit widths, local estimates, and full-circumference cutting metrics from the single eccentric severance test.
During auxiliary flushing, the measured clean-water flow rate was 28.6 L/min. For a flushing duration of approximately 6 min, the estimated water consumption was 0.172 m3, giving a combined total of approximately 10.47 m3 when added to the effective cutting stage. Water and abrasive supplies were stopped during the subsequent observation and measurement stage. Each additional minute of flushing increases water consumption by 0.0286 m3. At the stated flow rate and a flushing duration of 6 min, each 10 MPa increase in average flushing pump pressure increases the flushing hydraulic energy by approximately 0.477 kWh. This relationship allows the hydraulic energy for this stage to be calculated separately using the flushing pressure.
The nominal abrasive consumption during effective cutting was approximately 2.39 t, calculated from the calibrated mixing ratio, clean-water flow rate, and effective cutting time. Abrasive accounting for the complete task also requires distinguishing the initial and final system inventories, the amount discharged during flushing, and the amount recovered, to avoid counting residual abrasive already present in the system as newly supplied abrasive. These quantities were not weighed separately in this test and are therefore identified as unquantified influences on the abrasive resource estimate. The value of 2.39 t characterizes the abrasive supply requirement during effective cutting.
Electrical energy consumption of the pump unit was estimated using an overall efficiency parameter. At the baseline efficiency of 85%, a pump-side hydraulic energy of 600.6 kWh corresponds to an estimated electrical energy consumption of 706.6 kWh. The influence of overall efficiency was further examined: efficiencies of 80% and 90% give electrical energy consumptions of 750.8 and 667.3 kWh, respectively, representing an increase of 6.3% and a decrease of 5.6% relative to the baseline estimate. These results assess the influence of pump-unit efficiency on the estimated electricity demand during cutting.
Electrical energy consumption of the air compressor was estimated for an air-supply scenario with a gauge pressure of 0.7 MPa and an air flow rate of 0.87 m3/min. The air flow rate was treated as a volumetric flow rate at suction conditions. An isentropic compression model was used, with an ambient absolute pressure of 0.101 MPa, an air specific heat ratio of 1.4, and compression and motor efficiencies of 75% and 85%, respectively, as model parameters. The calculated electrical input power was approximately 6.49 kW, corresponding to approximately 38.9 kWh for continuous operation over 6 h under these air-supply conditions. The pump-unit and air-compressor electrical energy consumptions are engineering estimates under the stated parameter conditions. Electrical energy consumption for the complete operation must also include flushing and auxiliary equipment, such as the hydraulic power unit.
A normalized sensitivity analysis was performed with the other inputs held constant. A 1% change in clean-water flow rate or effective cutting time produces a corresponding 1% change in estimated water consumption, abrasive mass, and hydraulic energy. A 1% change in pump pressure produces a 1% change in hydraulic energy, while a 1% change in abrasive bulk density produces a 1% change in abrasive mass. Near an abrasive volume fraction of 10.6%, a relative change of 1% in the mixing ratio, equivalent to 0.106 percentage points, produces an approximately 1.12% change in abrasive mass. These values describe the local sensitivity of the calculation relationships; they do not represent instrument errors, measured fluctuations, or statistical confidence intervals.
The severance endpoint in this study is the elimination of continuous structural connections in the multi-layer structure. Cross-technology comparisons should use the same configurations and separation requirements, with deployment, inspection, recovery, waste treatment, and vessel time included in the total operating time and cost. Previous research on offshore abrasive cutting has also emphasized the substantial influence of time on site on service costs [35].
Reference [9] reported offshore cutting of three cemented casing layers at 170 MPa, followed by lifting the structure out as a unit after 7.8 h. The present study used a full-scale four-layer casing–cement specimen with a maximum outer diameter of 762 mm and achieved direct physical separation after a cumulative effective cutting time of 6 h at 210 MPa under onshore test conditions. The two studies differ in layer count, scale, and material path. Offshore wellbores are additionally constrained by soil, cement, and in-service structures, and the operation involves deployment and recovery. Pressure losses in long lines and ambient back pressure also affect the nozzle input. Lifting the structure out as a unit and directly separating the upper and lower sections both provide evidence of severance, but the operating environments and time-accounting boundaries differ. Cutting efficiency therefore cannot be compared solely on the basis of the 6 h and 7.8 h durations. This study adds experimental evidence linking parameter screening, classification using witness evidence, and direct physical separation for a specified four-layer eccentric configuration.
The cutting media are water and garnet, while the generated waste also includes steel chips, cement debris, and fine particles. Actual decommissioned wellbores may additionally introduce pre-existing contaminants into the waste stream. During concentric screening, the protective enclosure intercepted the jet after penetration and collected part of the debris. For offshore operations, waste-slurry collection, classification, recovery, and disposal methods should be determined from contaminant testing and the requirements applicable to the operating area. Separated steel can enter material recycling processes, while spent abrasive and cement residues should be managed according to their actual properties.
The tool is intended for structural severance after well plugging and verification of isolation. The operational sequence comprises confirmation of cutting depth and structural support, tool lowering and anchoring, circumferential cutting, separation inspection, lifting and transport, and sorting and recycling. Removal or leaving the structure in place should follow the approved plan. Direct physical separation evidence supports the decision to proceed with lifting, while remote operation and remotely operated vehicle (ROV) assistance can reduce the need for personnel to approach the cutting area.
Severance status is linked to lifting safety, operating time and consumables to cost, water supply and waste slurry to environmental management, and cutting depth and separation records to regulatory acceptance. Research on sustainable business models, political–economic–social–technological–legal–environmental (PESTLE) analysis, and circularity provides corresponding dimensions for decision-making [36,37,38]. The severance results and resource estimates presented here can provide technical inputs for subsequent environmental and economic assessments.
Offshore deployment requires consideration of the effects of pressure losses in long hoses, hydrostatic pressure, seawater conditions, and air curtain operation on the nozzle input. Table 12 distinguishes the experimental and equipment basis established in this study, the corresponding engineering assessments, and the field requirements that remain to be verified.
Table 12.
Experimental basis and priorities for offshore application and verification.
Transfer to offshore operations should begin with verification of delivery performance through long lines and under the intended water-depth conditions. This should be followed by controlled underwater system integration tests and tool-retrieval trials following failures, and then offshore pilot operations. Technology qualification can be structured with reference to DNV-RP-A203 [39]. Based on general technology readiness level (TRL) definitions, the integrated tool has completed functional verification under controlled conditions and may be self-assessed as TRL 4 [40].
4.7. Limitations and Future Work
This study used sequential one-factor-at-a-time screening. Only the candidate operating condition had two concentric results, R09 and R20, both of which achieved V2; the other parameter levels were not independently repeated. The eccentric test was a feasibility demonstration on a single specimen, and repeatability and applicability across different geometries require further verification. The candidate combination was selected within the tested matrix; parameter interactions and a global optimum were outside the scope of this assessment.
The results correspond to specimens cured for 7 d, nominally intact interfaces, the water environment used in the tests, and the geometry described in Section 3.1. The local volumetric removal rate and apparent hydraulic specific energy consumption are based on the model-estimated removal volume of the outermost steel layer within the measured segment. The principal uncertainties, calculation conditions for resource estimates, and sensitivity analyses are discussed in Section 4.6.
Future work will prioritize independent full-circumference repeat tests using newly prepared specimens with the same eccentric geometry to assess operational consistency. The eccentric offsets and directions will then be varied to examine applicability across different geometries. Inspection of the slit in each layer, slit-width measurements, effective cutting and downtime records, and resource records for the complete operation will also be improved so that the separation evidence, operating time, and consumption are assessed within consistent task boundaries.
For application to actual wellbores, further verification will address corrosion-related degradation, offshore back pressure, and delivery through long lines. Total operating time, resource consumption, and cost will be compared using consistent configurations, separation requirements, and task boundaries.
5. Conclusions
- (1)
- A two-stage method was established, linking concentric parameter screening with a complete circumferential severance demonstration in a specified eccentric configuration. The concentric stage assessed local cutting using the ordinal structural evidence levels V0–V3 and separately recorded process status. The eccentric stage determined complete severance of the specimen through direct physical separation of the upper and lower sections after cutting.
- (2)
- Within the tested matrix, increasing the combined pressure–flow input or extending the rotation period was generally associated with outward progression of structural evidence. Abrasive volume fraction and particle size exhibited non-monotonic responses, with 10.6% and 0.18 mm achieving the highest capability levels in their respective series. One nozzle clogging event occurred at 17.6%. The 270 MPa run was shut down for safety after V3 evidence was obtained, with its capability level and process status recorded separately.
- (3)
- The combination of 210 MPa, 10.6%, d50 = 0.18 mm, and 6 h/rev was selected directly from run R09 in the abrasive volume fraction series as the engineering candidate within the tested matrix. Both R09 and the independent concentric run R20 achieved penetration through all four casing layers and formed a slit on the inner witness plate at 575 mm. Both runs reached V2, demonstrating consistency in the structural classification.
- (4)
- Without retuning for the eccentric geometry, the candidate combination achieved complete 360° severance of a single specimen after a cumulative effective cutting time of 6 h, with a maximum distance of 346 mm from the nozzle outlet to the outer surface of the outermost casing. With the upper section supported by a crane, the two sections were completely separated without pulling, prying, or additional cutting. The equivalent circumferential feed rate was 6.65 mm/min. Estimated requirements for the effective cutting stage were approximately 10.30 m3 of clean water, 2.39 t of abrasive, and 600.6 kWh of pump-side hydraulic energy; consumption during stops and auxiliary operations is additional.
- (5)
- These eccentric results constitute a feasibility demonstration on a single specimen with a fixed tool configuration and specified geometry. Repeatability of eccentric severance and applicability across different configurations require assessment through independent tests. Offshore application requires further verification under conditions involving long lines, back pressure, and field deployment.
Author Contributions
Conceptualization, L.L., W.Z. and F.W.; methodology, L.L. and W.Z.; investigation, L.L., W.Z. and G.C.; resources, F.W.; data curation, L.L.; writing—original draft, L.L.; writing—review and editing, L.L., W.Z. and G.C.; funding acquisition, W.Z. All authors have read and agreed to the published version of the manuscript.
Funding
This research was funded by the National Natural Science Foundation of China, grant number 51874342.
Informed Consent Statement
Not applicable.
Data Availability Statement
The data supporting the conclusions of this study are included in the article and its appendices. Further inquiries can be directed to the corresponding author.
Acknowledgments
The authors gratefully acknowledge the technical staff of the State Key Laboratory of Deep Oil and Gas for their assistance with specimen preparation, full-scale cutting experiments, and post-test inspection.
Conflicts of Interest
Author Fangxiang Wang is employed by CNPC Bohai Drilling Engineering Co., Ltd. The company provided no funding or in-kind support for this study. The remaining authors declare no conflicts of interest.
Abbreviations
The following abbreviations and symbols are used in this manuscript:
| UHP; AWJ; P&A | Ultra-high pressure; abrasive waterjet; plugging and abandonment |
| HPU; AAC; ROV; TRL | Hydraulic power unit; annular air curtain; remotely operated vehicle; technology readiness level |
| CFRP; CFD–DEM; SD | Carbon fiber-reinforced polymer; computational fluid dynamics–discrete element method; sample standard deviation |
| PESTLE | Political, economic, social, technological, legal, and environmental analysis |
| Pp; pn,in; pamb; Δpn | Pump-side gauge pressure; nozzle inlet pressure; local ambient pressure; pressure difference between the nozzle inlet and the ambient environment (Pa) |
| Qw; Qs; Qin; Qout | Clean-water flow rate; actual total slurry volumetric flow rate; total pump suction-inlet flow rate; branch-outlet flow rate (m3/s) |
| ρm; ρa; ρw | Slurry density; dry abrasive bulk density; water density (kg/m3) |
| Cd; d; d50 | Discharge coefficient (dimensionless); abrasive-slurry nozzle outlet diameter; nominal median abrasive particle size (m) |
| ma; mw; Ca; ṁa | Abrasive mass and water mass (kg); abrasive volume fraction on a bulk-volume basis (0–1); nominal abrasive mass flow rate (kg/s) |
| v; Ph,n | Nominal mean mixture velocity (m/s); nozzle hydraulic power (W) |
| Trev; ω; t; Δθ | Rotation period (s/rev); angular velocity (rad/s); cumulative effective exposure time (s); swept rotation angle (rad) |
| Ri; Si; τi | Concentric interface radius and swept arc length (m); nominal exposure time per unit arc length (s/m) |
| V0–V3; F | Ordinal structural cutting capability categories; process-failure flag |
| Aj; | Cross-sectional area of a material region (m2); area-weighted mean axial width of missing material over the full circumference and wall thickness (m) |
| Vs; Vc; Vtot; Rv | Steel, cement, and total removal volumes (m3); volumetric removal rate (m3/s) |
| Eh; eh | Pump-side hydraulic energy input during the effective cutting interval (J); hydraulic specific energy consumption defined using the corresponding removal volume (J/m3) |
| O; Oi; N; P | Projection of the tool axis; center of Casing #i; nozzle outlet; intersection of the jet with the outer surface of the outermost casing |
| rn; ei; φi | Nozzle rotation radius and center offset of each casing layer (mm); eccentricity direction angle (°) |
| s; L | Outer-wall arc-length coordinate referenced to S8 (mm); measured mean jet-action termination distance inside the specimen for V0 (mm) |
| τ; i; j | Time variable within the effective cutting interval (s); casing number 1–4; material-region number 1–7 |
Appendix A. Local Slit Widths and Basis for Geometric Estimates
Figure A1 shows the measuring-tape photograph taken during the single intermediate inspection stop described above. Based on the 10.5–32.5 cm interval shown on the tape, the arc length of the local calculation segment was estimated as 220 mm. Using the measurement-point layout in Figure 21a, S1–S12 were assigned approximately equal arc-length intervals, with adjacent points about 20 mm apart and S8 taken as the origin of the arc-length coordinate. The 12 slit widths were measured using a caliper, whereas the arc-length positions are approximate coordinates used in the geometric calculation. The data are listed in Table A1.
Figure A1.
Local slit opening and measuring-tape record obtained during the intermediate inspection stop. The tape is used to determine the length of the local calculation segment; the slit widths measured using a caliper are listed in Table A1.
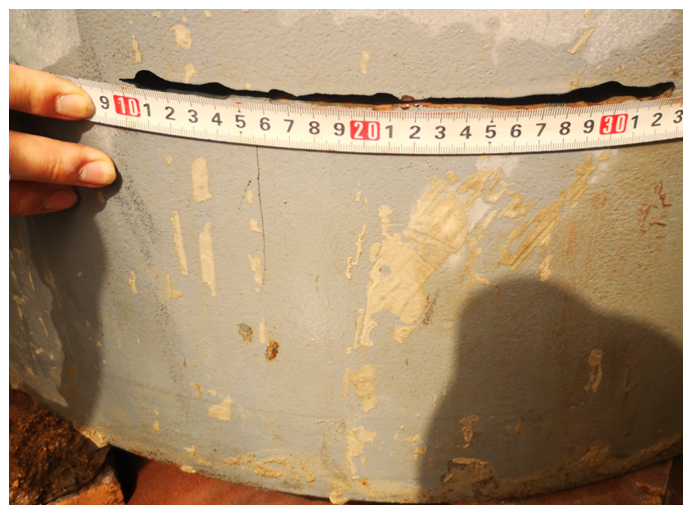
Table A1.
Measured local slit widths and arc-length positions used in the calculation. The arc-length coordinate s is referenced to S8 and determined by assigning approximately equal spacing to the measurement points within the 220 mm segment.
The calculation uses an outer radius of 381 mm, an inner radius of 355.6 mm, and a center offset of 65 mm. With s denoting the outer-wall arc-length coordinate relative to S8, the corresponding angle about the outer-circle center is s/381, with lengths expressed in mm. The jet polar angle is determined from the direction of the corresponding point on the outer circle relative to the tool axis. Slit widths between adjacent measurement points are linearly interpolated, and integration is then performed over the area of the outer steel annulus within the corresponding angular segment. This calculation distinguishes the outer-wall arc length from the tool angular displacement.
Appendix B. Summary of Test Conditions and Evidence
Table A2 summarizes 19 concentric screening runs, one independent concentric confirmation test, and one single-specimen eccentric circumferential severance demonstration. R01–R21 are the run identifiers assigned in this study. The common baseline shared across the four screening series corresponds to R04 and is counted as a single run.
Table A2.
Test conditions, structural evidence, and process status.
Table A3.
Severance evidence and slit-width measurement records for each casing layer in the single eccentric test.
References
- Wang, C.; Liu, Y.Z.; Lian, X.L.; Luo, J.J.; Liang, C.P.; Ma, H.F. Dynamic risk assessment of plugging and abandonment operation process of offshore wells based on Dynamic Bayesian Network. Ocean Eng. 2023, 270, 113625. [Google Scholar] [CrossRef] [Scilit]
- Ahiaga-Dagbui, D.D.; Love, P.E.D.; Whyte, A.; Boateng, P. Costing and technological challenges of offshore oil and gas decommissioning in the U.K. North Sea. J. Constr. Eng. Manag. 2017, 143, 05017008. [Google Scholar] [CrossRef] [Scilit]
- Fam, M.L.; Konovessis, D.; Ong, L.S.; Tan, H.K. A review of offshore decommissioning regulations in five countries-Strengths and weaknesses. Ocean Eng. 2018, 160, 244–263. [Google Scholar] [CrossRef] [Scilit]
- Sommer, B.; Fowler, A.M.; Macreadie, P.I.; Palandro, D.A.; Aziz, A.C.; Booth, D.J. Decommissioning of offshore oil and gas structures-Environmental opportunities and challenges. Sci. Total Environ. 2019, 658, 973–981. [Google Scholar] [CrossRef] [Scilit] [PubMed]
- Chukwuemeka, A.O.; Oluyemi, G.; Mohammed, A.I.; Njuguna, J. Plug and abandonment of oil and gas wells-A comprehensive review of regulations, practices, and related impact of materials selection. Geoenergy Sci. Eng. 2023, 226, 211718. [Google Scholar] [CrossRef] [Scilit]
- Fowler, A.M.; Macreadie, P.I.; Jones, D.O.B.; Booth, D.J. A multi-criteria decision approach to decommissioning of offshore oil and gas infrastructure. Ocean Coast. Manag. 2014, 87, 20–29. [Google Scholar] [CrossRef] [Scilit]
- Kaiser, M.J.; Byrd, R.C. The non-explosive removal market in the Gulf of Mexico. Ocean Coast. Manag. 2005, 48, 525–570. [Google Scholar] [CrossRef] [Scilit]
- Sun, Q.; Tian, J.; Jin, Y.; Feng, D.; Hou, L. Modeling and Research on Offshore Casing Cutting of Hydraulic Internal Cutting Device. J. Mar. Sci. Eng. 2024, 12, 1026. [Google Scholar] [CrossRef] [Scilit]
- Ma, R.; Li, G.; Wang, C.; Ju, S.; Liu, Z.; Xu, H. Downhole Inner Cutting Technology Based on 250 MPa Ultra High Pressure Abrasive Water Jet. China Pet. Mach. 2015, 43, 50–53. (In Chinese) [Google Scholar] [CrossRef]
- Brandon, J.W.; Ramsey, B.; Macfarlane, J.W.; Dearman, D. Abrasive Water-Jet and Diamond Wire-Cutting Technologies Used in the Removal of Marine Structures. In Proceedings of the Offshore Technology Conference, Houston, TX, USA, 1–4 May 2000. Paper OTC-12022-MS. [Google Scholar] [CrossRef] [Scilit]
- Molfino, R.M.; Zoppi, M. A robotic system for underwater eco-sustainable wire-cutting. Autom. Constr. 2012, 24, 213–223. [Google Scholar] [CrossRef] [Scilit]
- International Association of Oil & Gas Producers. Oxy-Arc Underwater Cutting Recommended Practice; IOGP Report 471. IOGP: London, UK, 2023. Section 2. Available online: https://www.iogp.org/bookstore/wp-content/uploads/sites/2/woocommerce_uploads/2016/10/471.pdf (accessed on 30 September 2026).
- Liu, P.; Liu, Y.; Wang, Q.; Wu, X.; Ma, C. Study on plasma arc penetration process of abandoned offshore wells. Mar. Struct. 2025, 104, 103889. [Google Scholar] [CrossRef] [Scilit]
- Linyaev, E.J.; Marshall, S.A.; Grubb, D.L.; De Witt, R.A.; Deutch, P.D.; Faircloth, B.O.; Fraze, J.D.; Zediker, M.S. High Power Laser Offshore Decommissioning Tool, System and Methods of Use. U.S. Patent Application US20170266760A1, 21 September 2017. [Google Scholar]
- Alharith, A.M. Hybrid Milling High Power Laser Tool. U.S. Patent Application US20250027371A1, 23 January 2025. [Google Scholar]
- Hashish, M. Abrasive Waterjet Machining. Materials 2024, 17, 3273. [Google Scholar] [CrossRef] [Scilit] [PubMed]
- Anu Kuttan, A.; Rajesh, R.; Dev Anand, M. Abrasive water jet machining techniques and parameters: A state of the art, open issue challenges and research directions. J. Braz. Soc. Mech. Sci. Eng. 2021, 43, 220. [Google Scholar] [CrossRef] [Scilit]
- Natarajan, Y.; Murugesan, P.K.; Mohan, M.; Liyakath Ali Khan, S.A. Abrasive Water Jet Machining process: A state of art of review. J. Manuf. Process. 2020, 49, 271–322. [Google Scholar] [CrossRef] [Scilit]
- Pahuja, R.; Ramulu, M.; Hashish, M. Surface quality and kerf width prediction in abrasive water jet machining of metal-composite stacks. Compos. Part B Eng. 2019, 175, 107134. [Google Scholar] [CrossRef] [Scilit]
- Alberdi, A.; Artaza, T.; Suárez, A.; Rivero, A.; Girot, F. An experimental study on abrasive waterjet cutting of CFRP/Ti6Al4V stacks for drilling operations. Int. J. Adv. Manuf. Technol. 2016, 86, 691–704. [Google Scholar] [CrossRef] [Scilit]
- MM, I.W.; Azmi, A.I.; Lee, C.C.; Mansor, A.F. Kerf taper and delamination damage minimization of FRP hybrid composites under abrasive water-jet machining. Int. J. Adv. Manuf. Technol. 2018, 94, 1727–1744. [Google Scholar] [CrossRef] [Scilit]
- Oh, T.M.; Joo, G.W.; Cho, G.C. Effect of Abrasive Feed Rate on Rock Cutting Performance of Abrasive Waterjet. Rock Mech. Rock Eng. 2019, 52, 3431–3442. [Google Scholar] [CrossRef] [Scilit]
- Mahdevari, S.; Sayehvand, H.; Bakhtiari Haftlang, P. Numerical modeling of abrasive waterjet to optimize rock cutting parameters. Sci. Rep. 2025, 15, 15212. [Google Scholar] [CrossRef] [Scilit] [PubMed]
- Lu, Y.; Tang, J.; Ge, Z.; Xia, B.; Liu, Y. Hard rock drilling technique with abrasive water jet assistance. Int. J. Rock Mech. Min. Sci. 2013, 60, 47–56. [Google Scholar] [CrossRef] [Scilit]
- Mi, J.; Tang, J.; Liu, W.; Lu, Y.; Liu, H.; Tian, Z.; Lan, Y.; Yan, X. Erosion characteristics and parameter optimization for casing eroded by abrasive water jet under confining pressure: An integrated experimental-numerical-data-driven study. Phys. Fluids 2026, 38, 046602. [Google Scholar] [CrossRef] [Scilit]
- Tang, J.; Yan, X.; Liu, W.; Zhang, H.; Cui, J.; Zhang, Z. Structural optimization of self-suction abrasive jet nozzle for casing cutting in oil and gas wells: CFD-DEM and experimental study. Powder Technol. 2025, 465, 121313. [Google Scholar] [CrossRef] [Scilit]
- American Petroleum Institute. API Recommended Practice 65-3: Wellbore Plugging and Abandonment, 1st ed.; API: Washington, DC, USA, 2021. [Google Scholar]
- Standards Norway. NORSOK D-010:2021+AC:2024: Well Integrity in Drilling and Well Operations. Consolidated edition. 2024. Available online: https://online.standard.no/en/norsok-d-010-2021ac-2024 (accessed on 30 September 2026).
- Bureau of Safety and Environmental Enforcement. 30 CFR § 250.1716: To What Depth Must I Remove Wellheads and Casings? Available online: https://www.ecfr.gov/current/title-30/chapter-II/subchapter-B/part-250/subpart-Q/section-250.1716 (accessed on 30 September 2026).
- American Petroleum Institute. API Recommended Practice 10B-2: Recommended Practice for Testing Well Cements, 3rd ed.; API: Washington, DC, USA, 2024. [Google Scholar]
- Shimizu, S.; Nishikata, H.; Peng, G.; Oguma, Y. Submerged cutting characteristics of abrasive suspension jet. Trans. JSME 2015, 81, 15-00361. (In Japanese) [Google Scholar] [CrossRef] [Scilit][Green Version]
- Joint Committee for Guides in Metrology. Evaluation of Measurement Data-Guide to the Expression of Uncertainty in Measurement; JCGM 100:2008; BIPM: Sèvres, France, 2008. [Google Scholar] [CrossRef] [Scilit]
- Rasse, C.; Mary, N.; Abe, H.; Watanabe, Y.; Normand, B. Role of the Jet Angle, Particle Size, and Particle Concentration in the Degradation Behavior of Carbon Steel under Slow Slurry Erosion-Corrosion Conditions. Metals 2021, 11, 1152. [Google Scholar] [CrossRef] [Scilit]
- Nguyen, T.; Shanmugam, D.K.; Wang, J. Effect of liquid properties on the stability of an abrasive waterjet. Int. J. Mach. Tools Manuf. 2008, 48, 1138–1147. [Google Scholar] [CrossRef] [Scilit]
- Kaiser, M.J.; Pulsipher, A.G.; Byrd, R.C. Cost of Abrasive Cutting in Decommissioning Operations in the Gulf of Mexico. J. Constr. Eng. Manag. 2005, 131, 137–148. [Google Scholar] [CrossRef] [Scilit]
- Basile, V.; Capobianco, N.; Vona, R. The usefulness of sustainable business models: Analysis from oil and gas industry. Corp. Soc. Responsib. Environ. Manag. 2021, 28, 1801–1821. [Google Scholar] [CrossRef] [Scilit]
- Capobianco, N.; Basile, V.; Loia, F.; Vona, R. Toward a Sustainable Decommissioning of Offshore Platforms in the Oil and Gas Industry: A PESTLE Analysis. Sustainability 2021, 13, 6266. [Google Scholar] [CrossRef] [Scilit]
- Capobianco, N.; Basile, V.; Loia, F.; Vona, R. End-of-life management of oil and gas offshore platforms: Challenges and opportunities for sustainable decommissioning. Sinergie Ital. J. Manag. 2022, 40, 299–326. [Google Scholar] [CrossRef] [Scilit]
- DNV. DNV-RP-A203: Technology Qualification; September 2019 Edition, Amended September 2021. Available online: https://www.dnv.com/energy/standards-guidelines/dnv-rp-a203-technology-qualification/ (accessed on 30 September 2026).
- National Aeronautics and Space Administration. NPR 7123.1D: NASA Systems Engineering Processes and Requirements. Appendix E: Technology Readiness Levels. Effective 5 July 2023; updated with Change 2. Available online: https://nodis3.gsfc.nasa.gov/displayDir.cfm?Internal_ID=N_PR_7123_001D_&page_name=AppendixE (accessed on 30 September 2026).
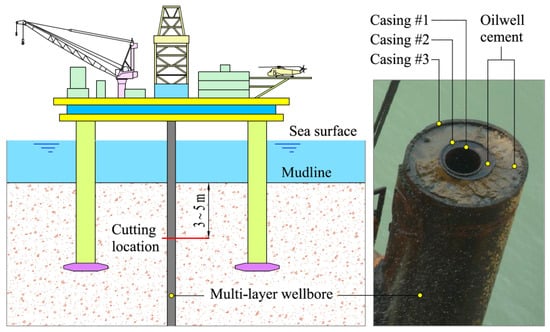
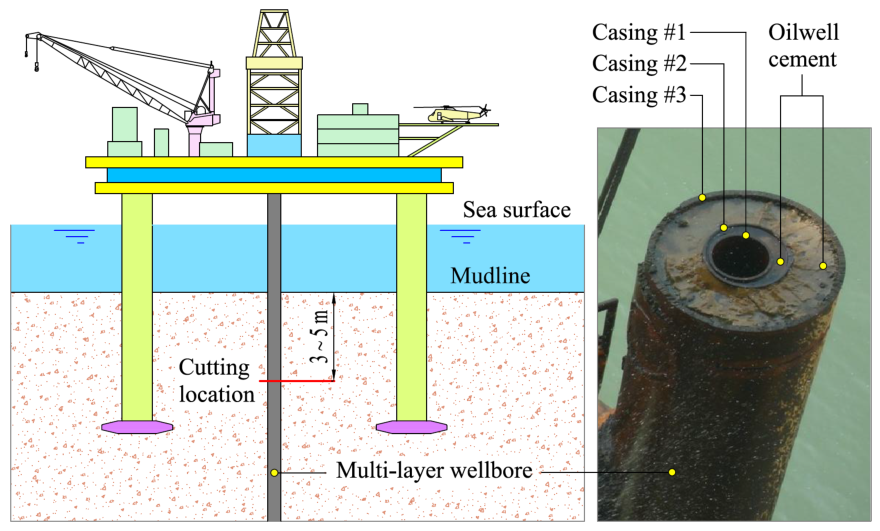
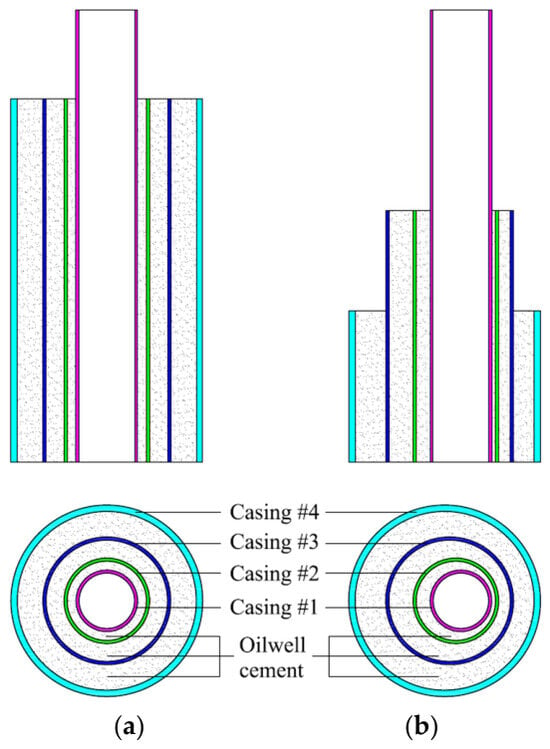
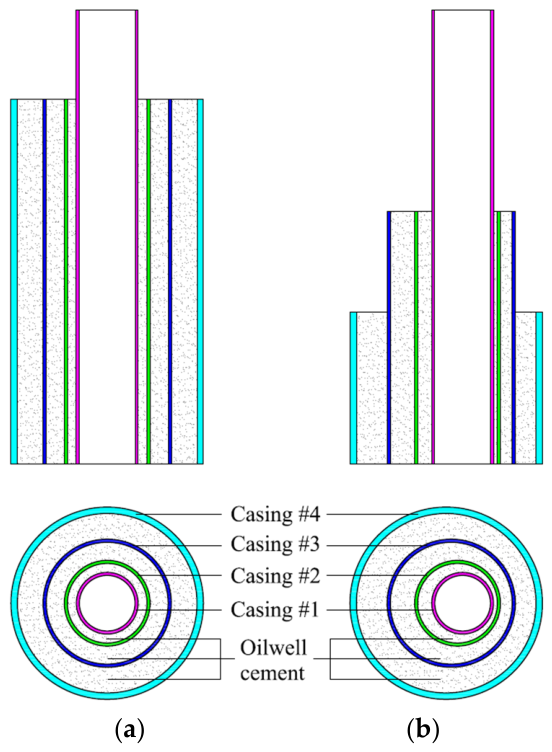
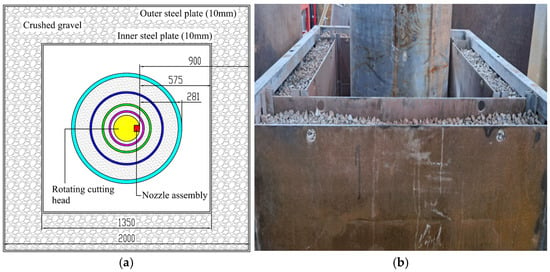
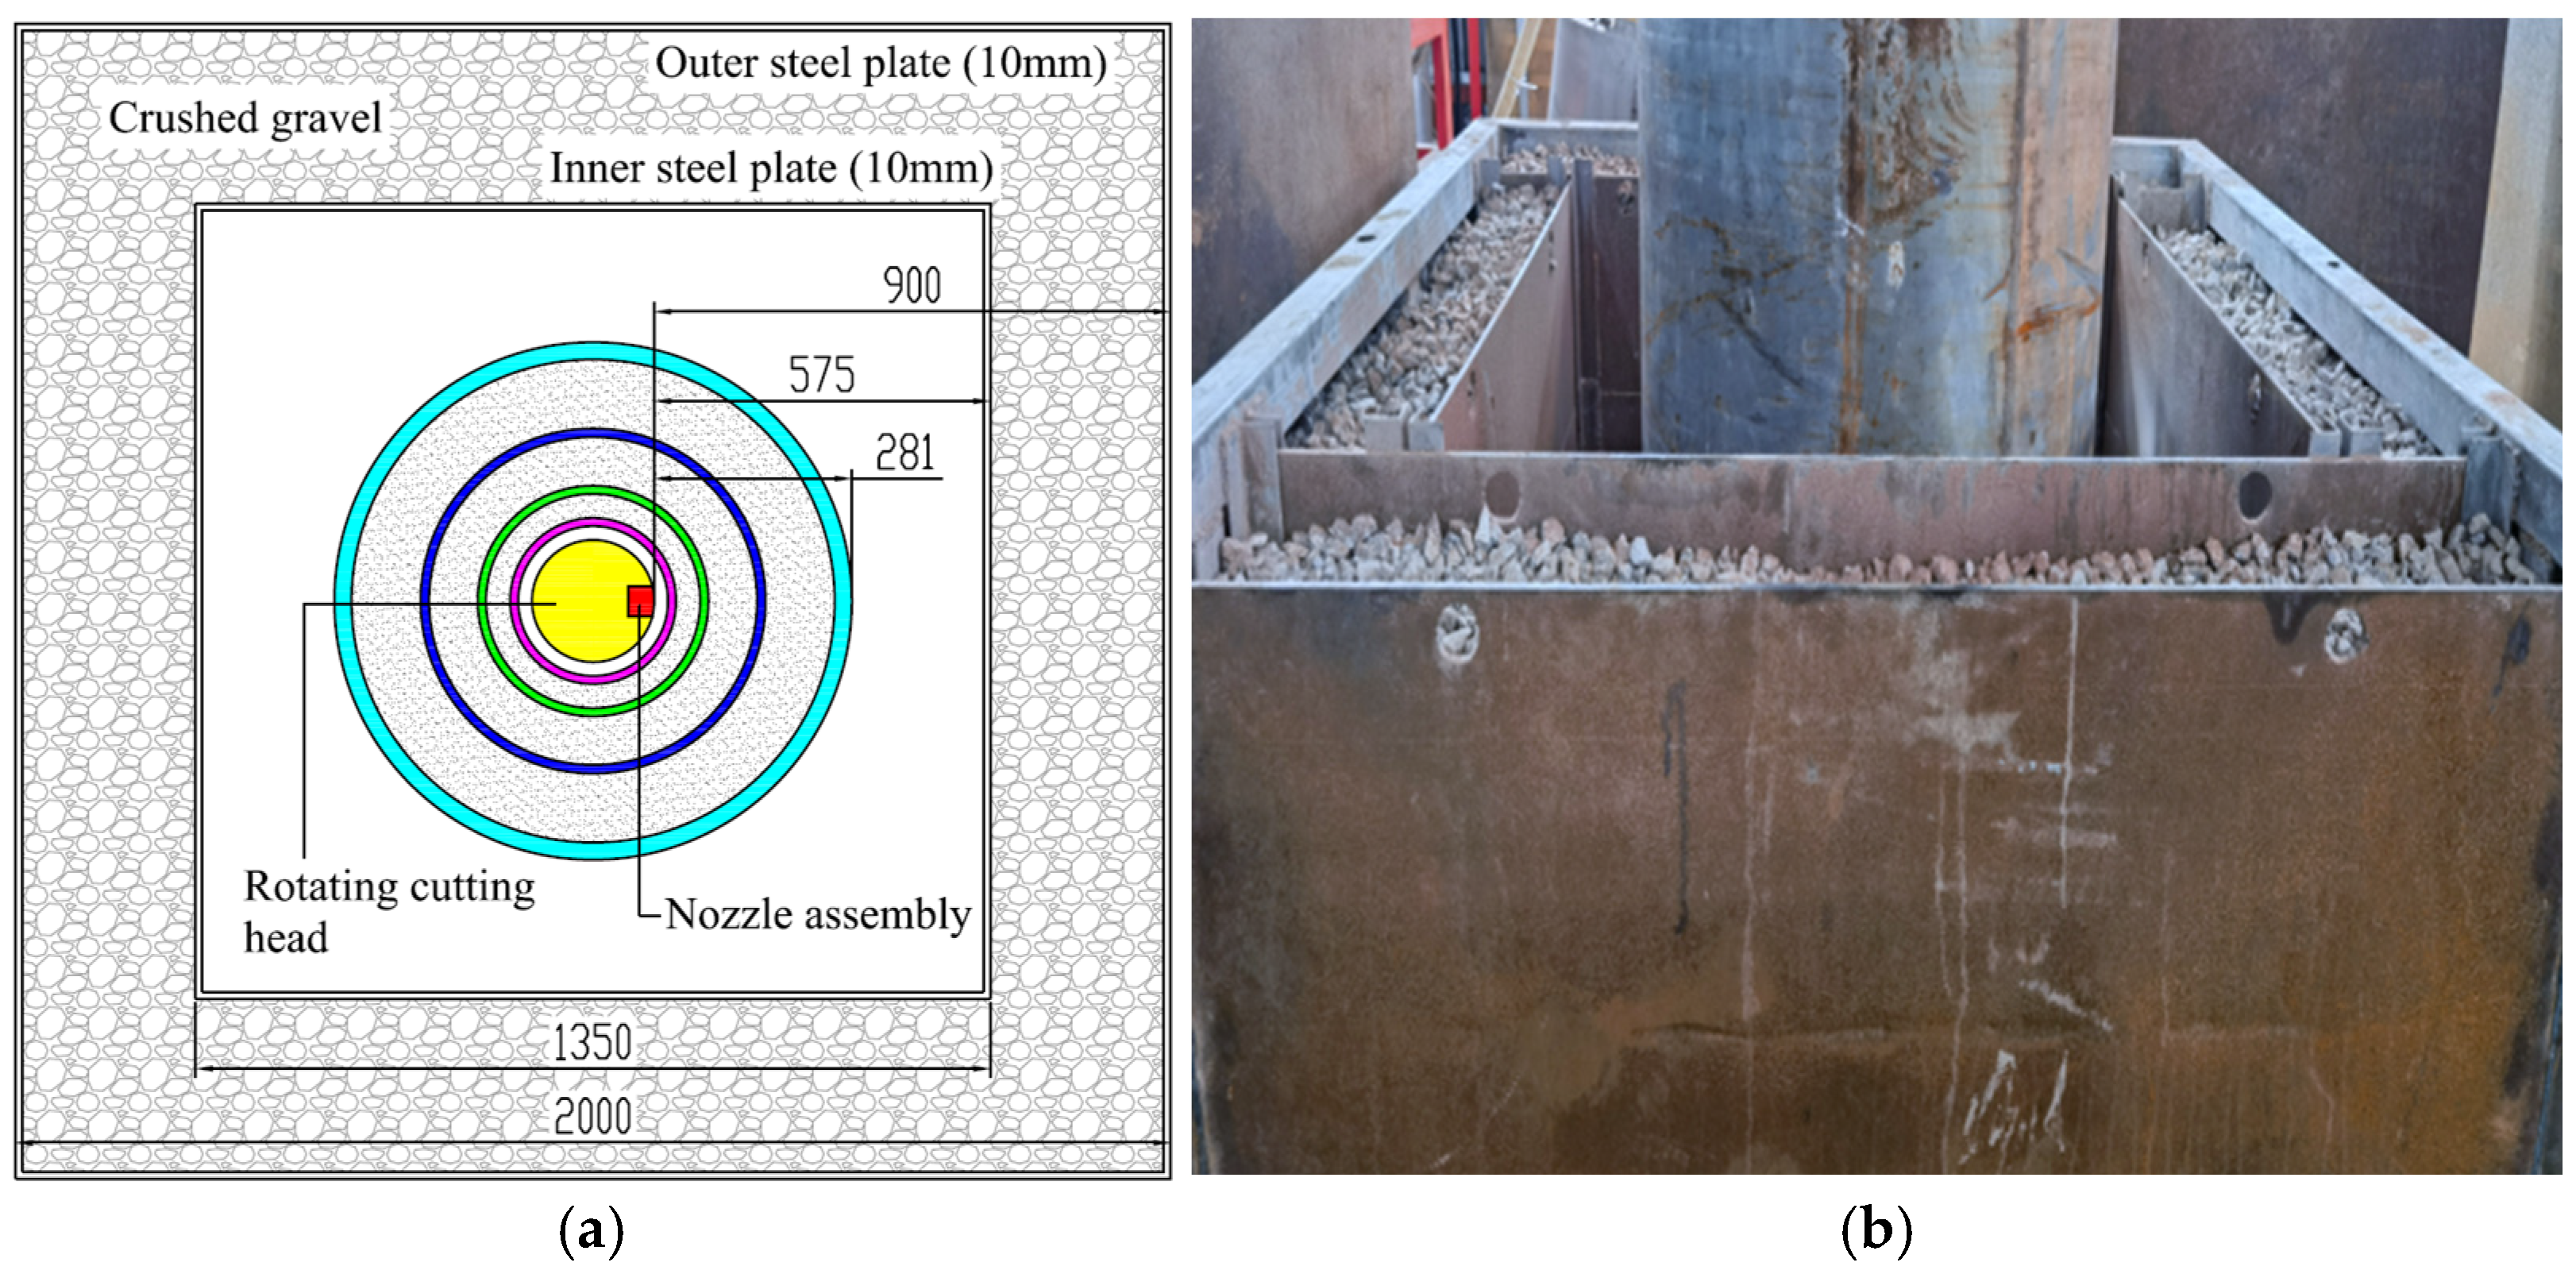
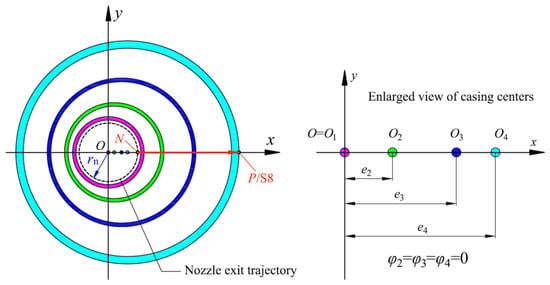
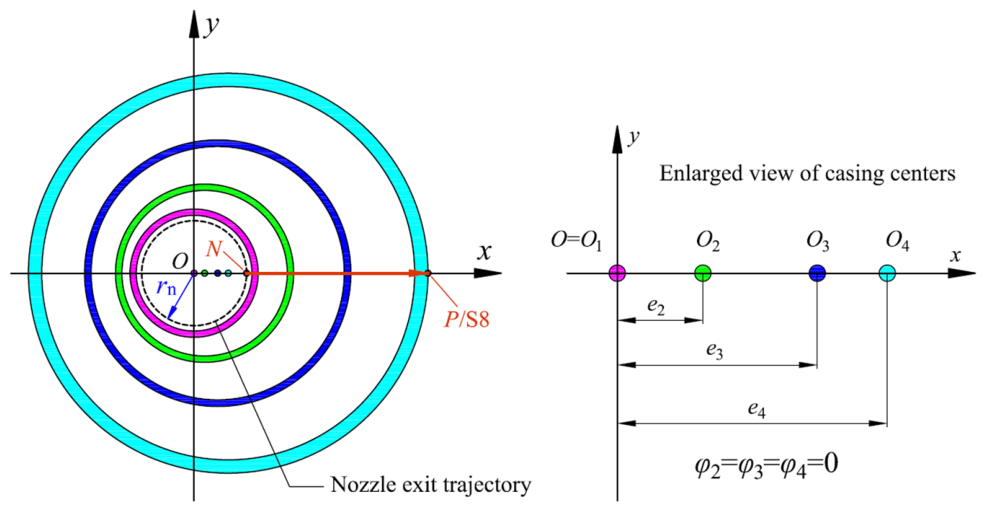
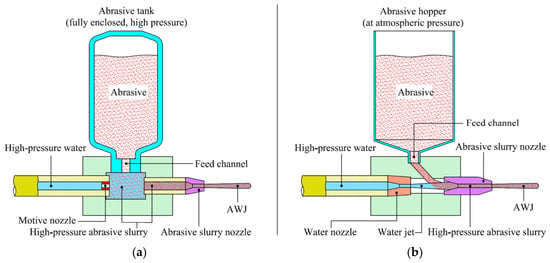
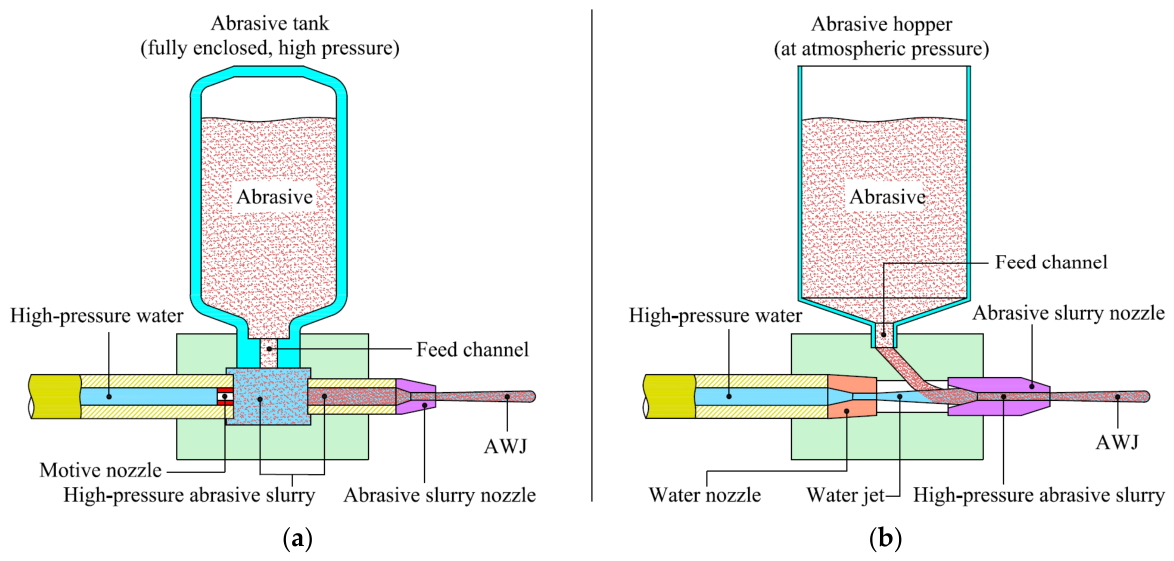
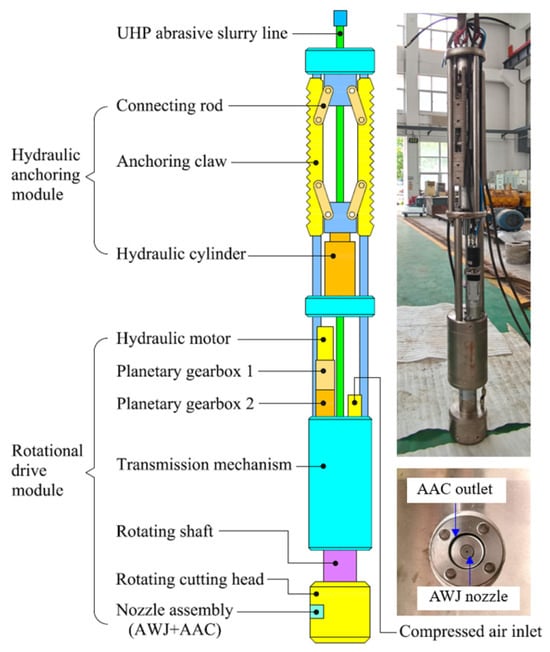
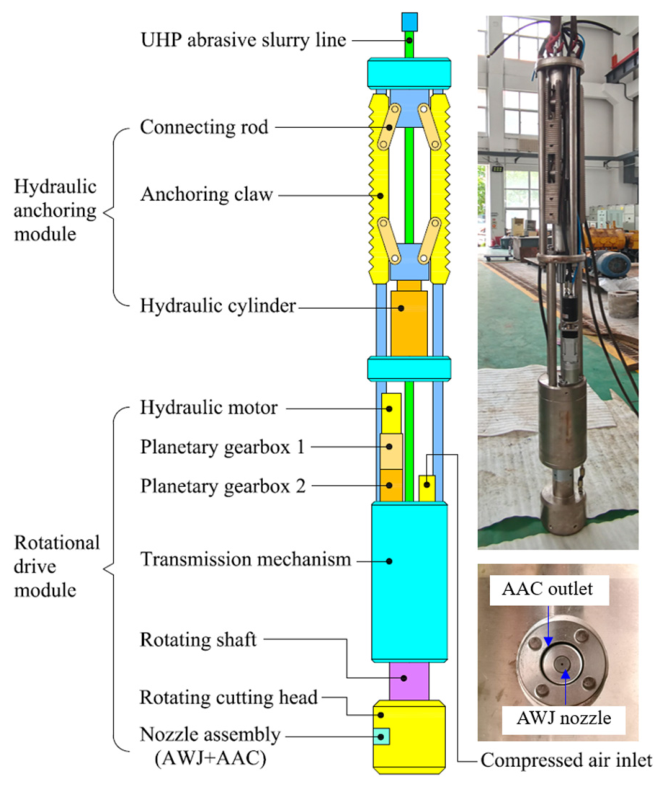
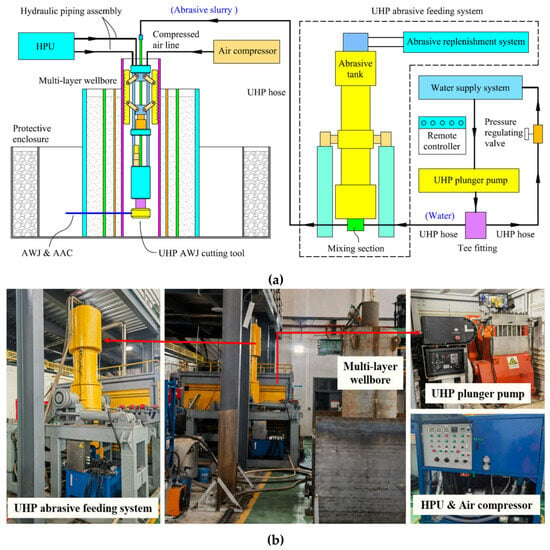
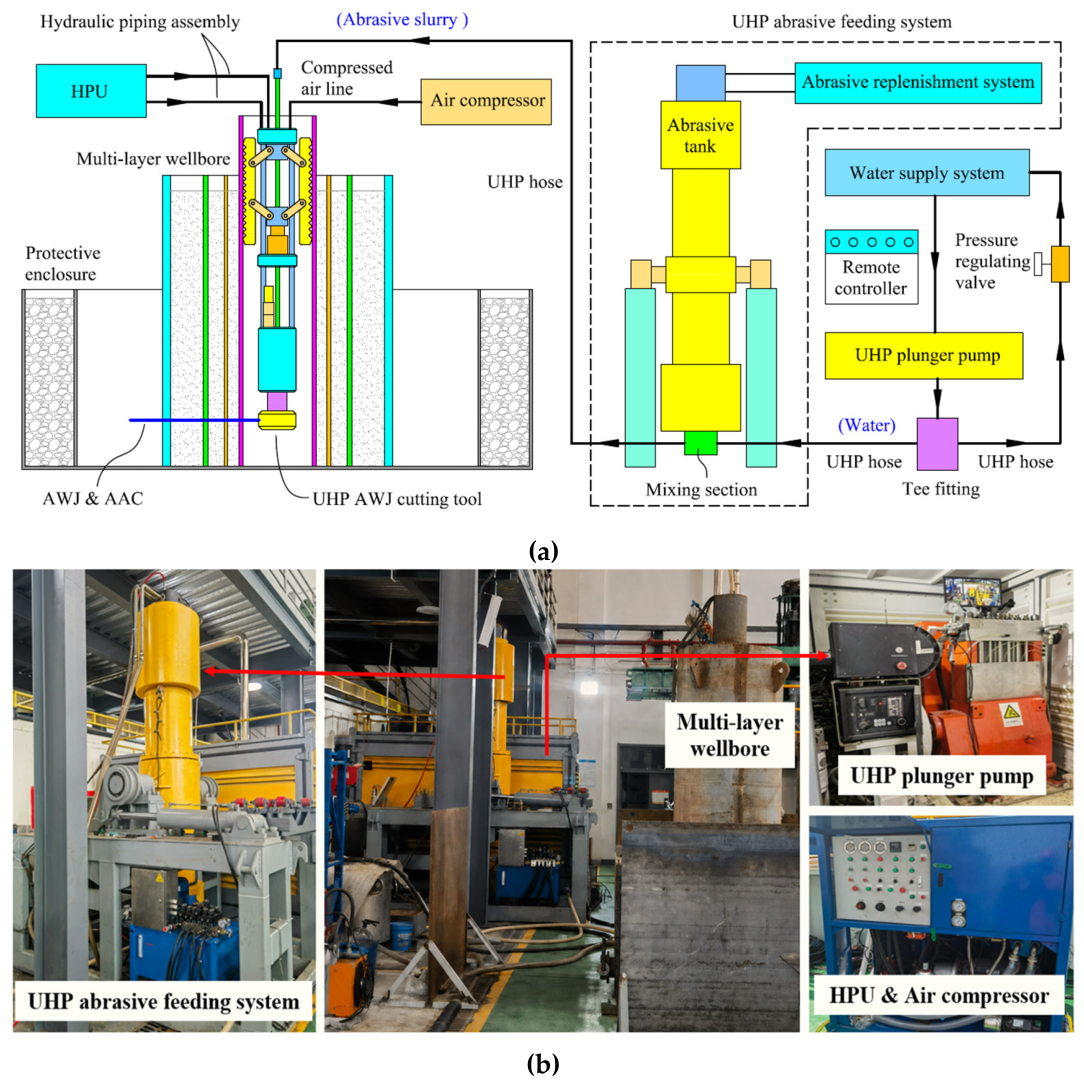
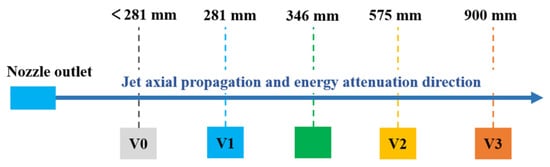
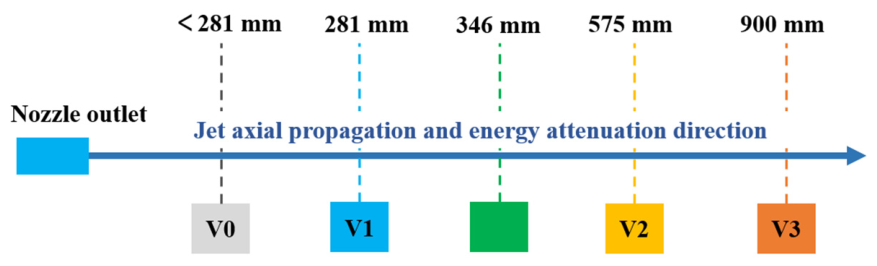
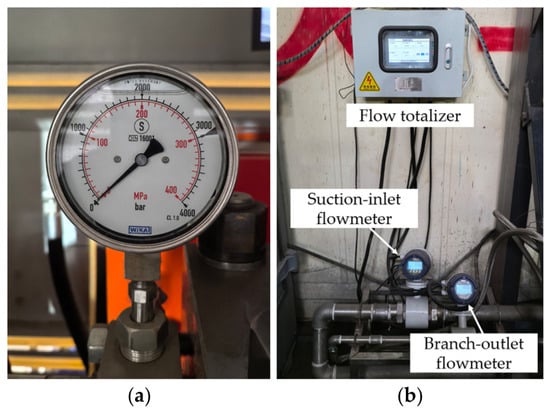
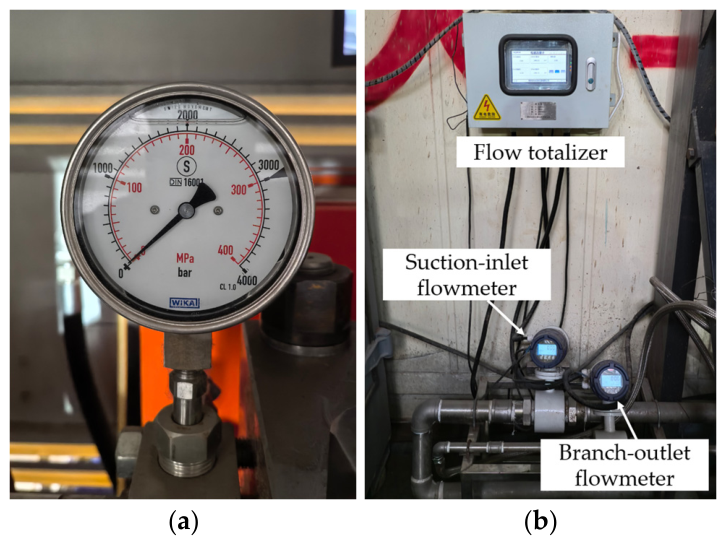
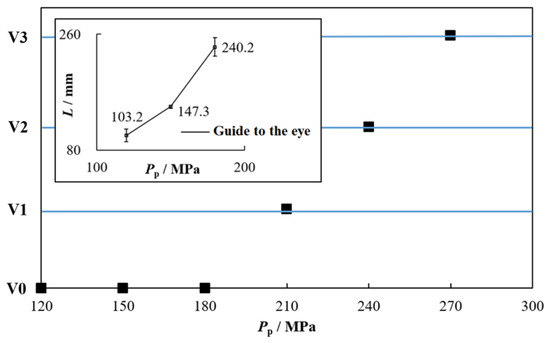
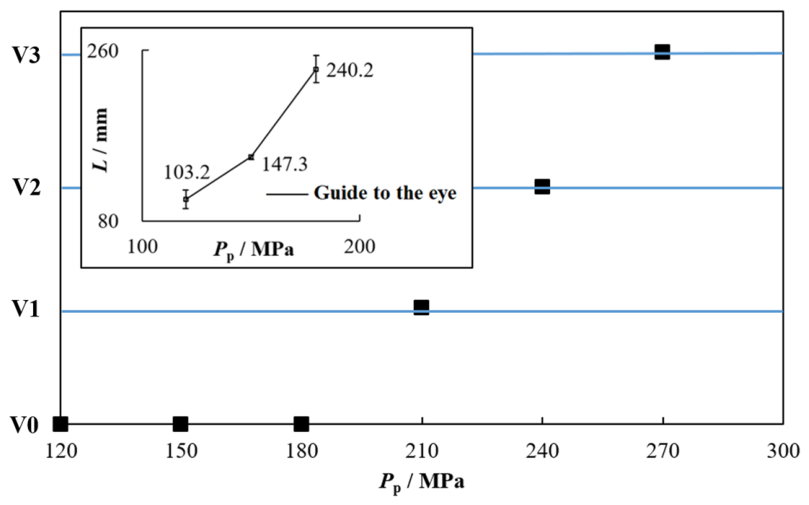
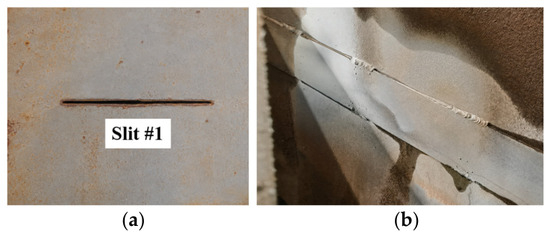
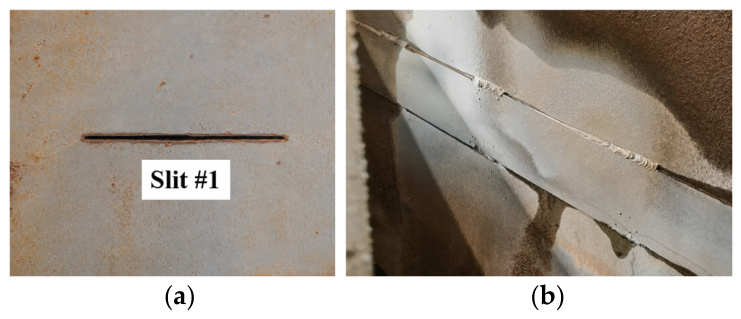
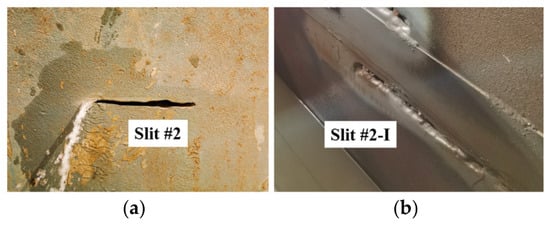
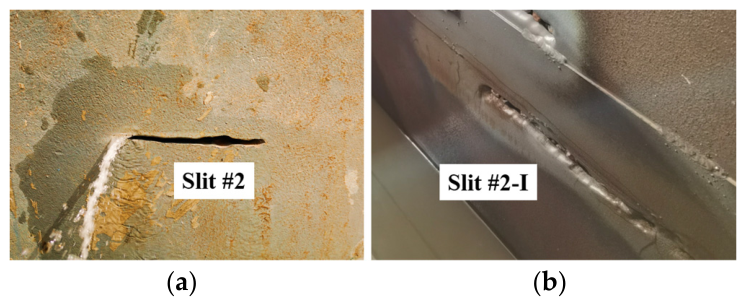
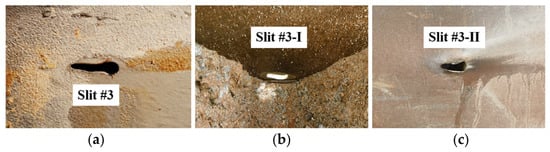
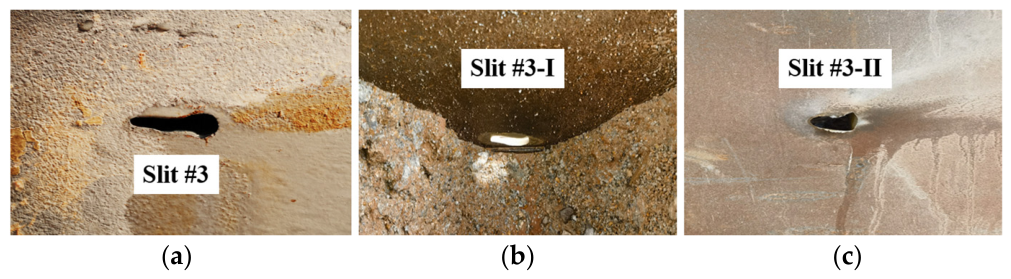
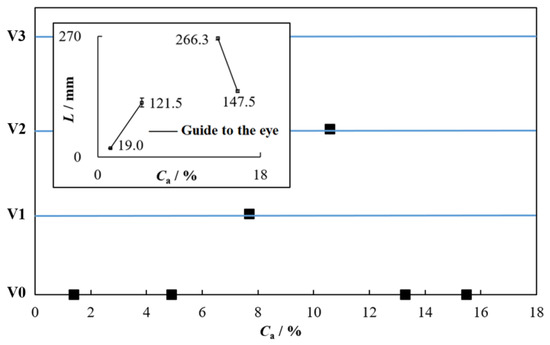
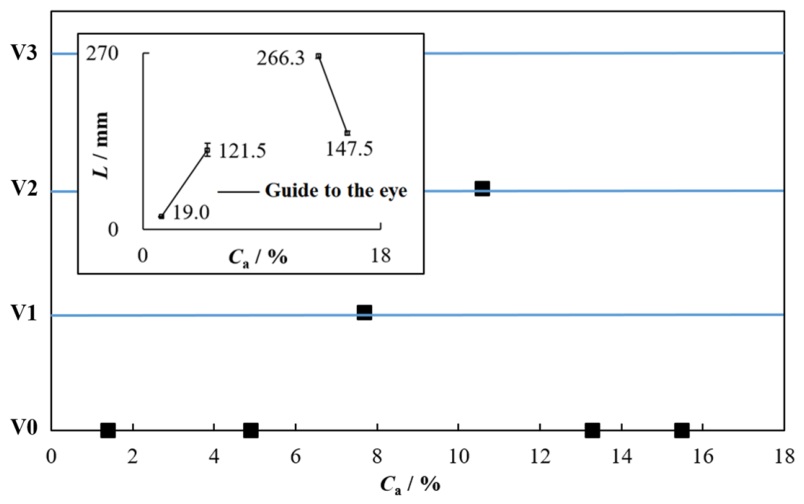
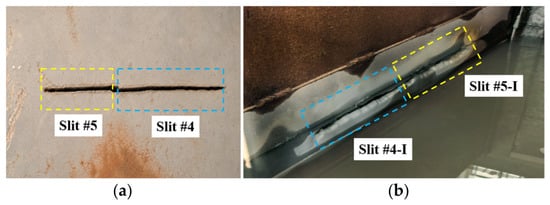
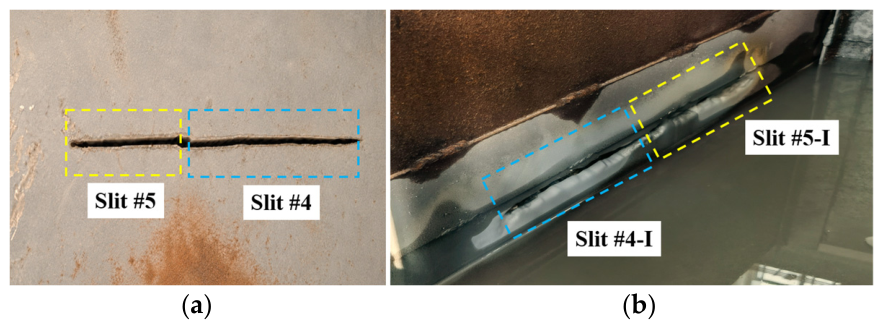
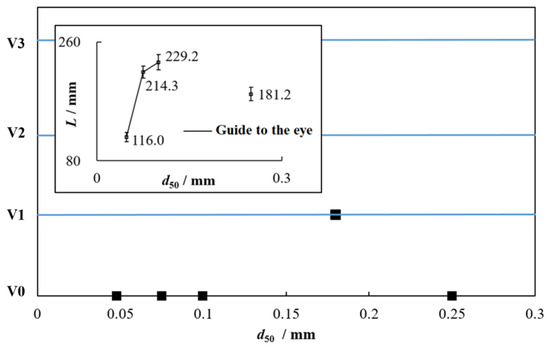
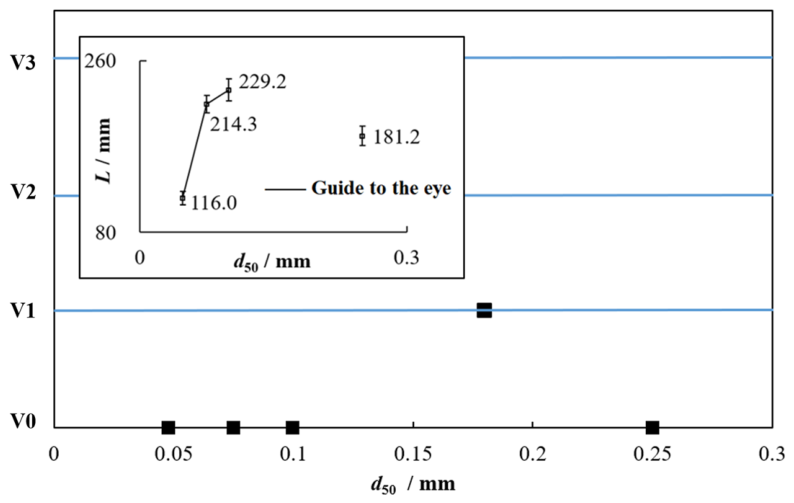
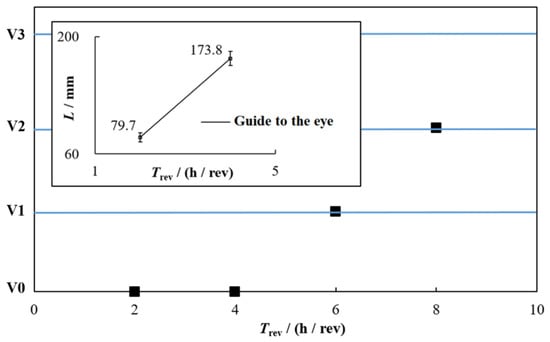
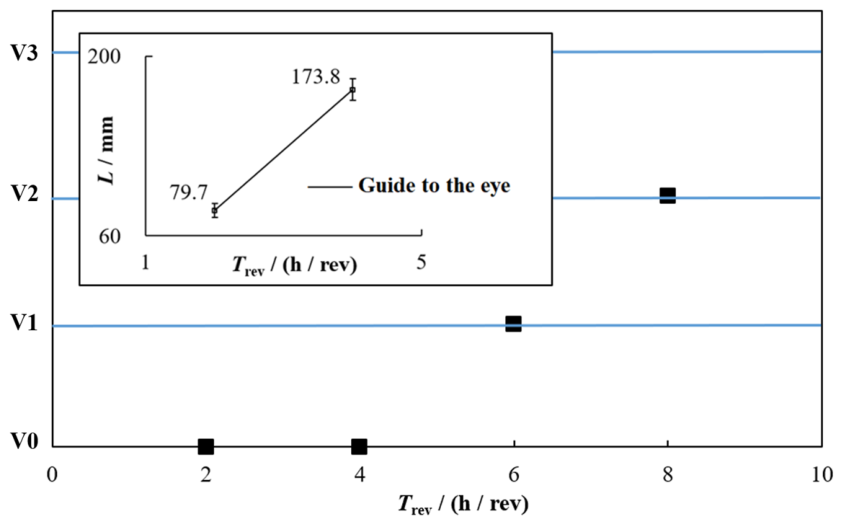
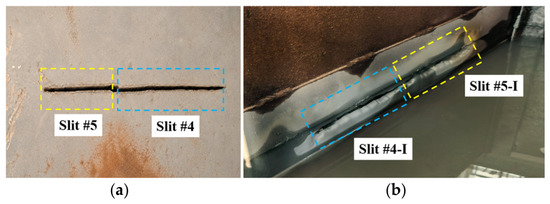
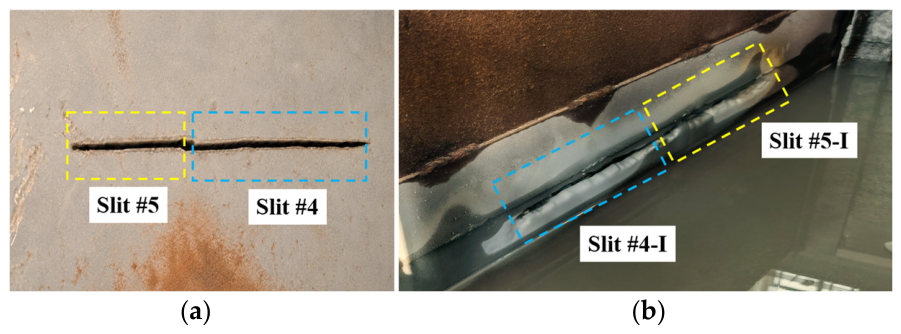
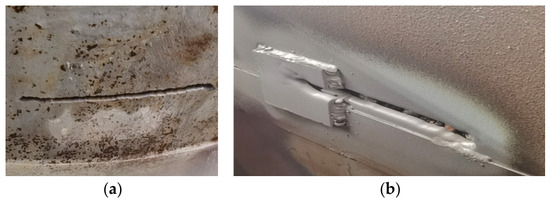
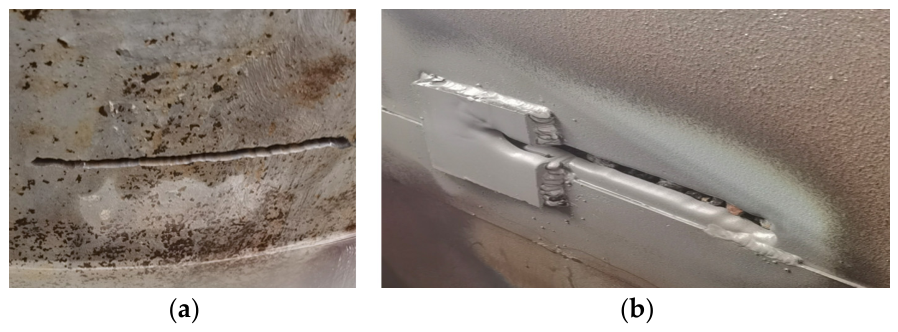
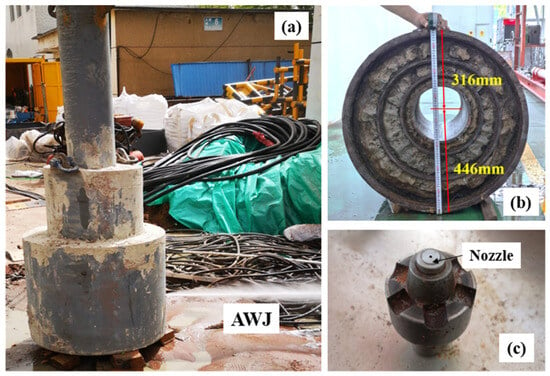
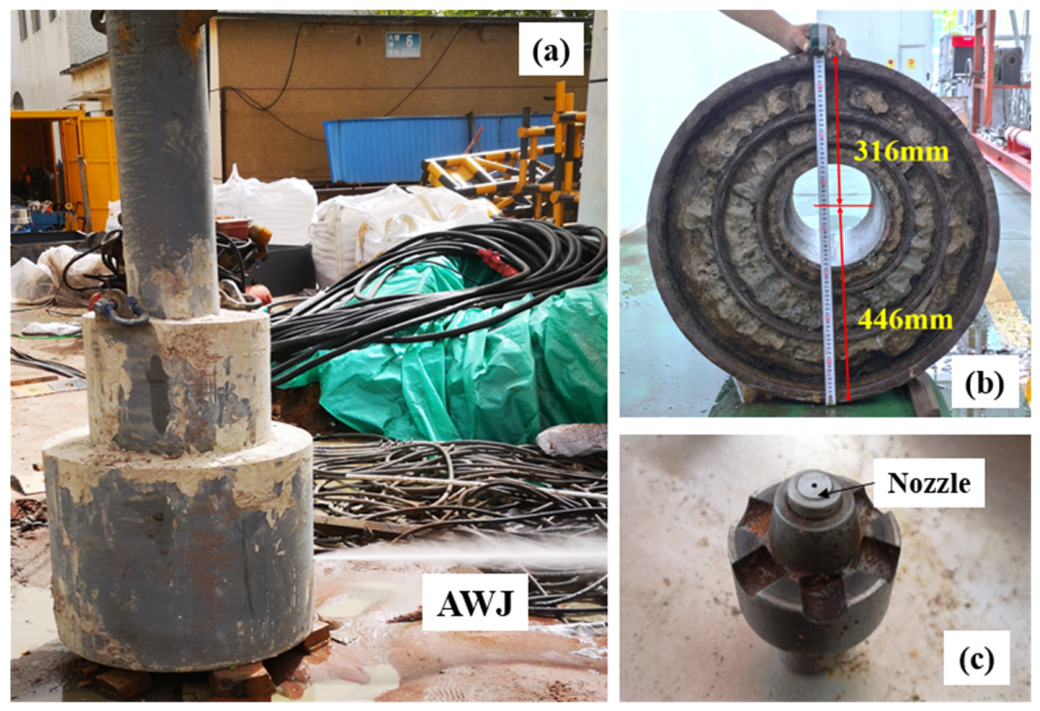
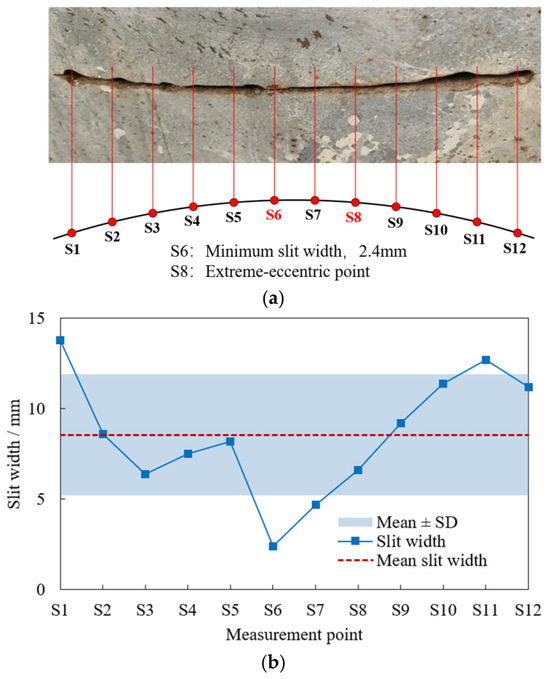
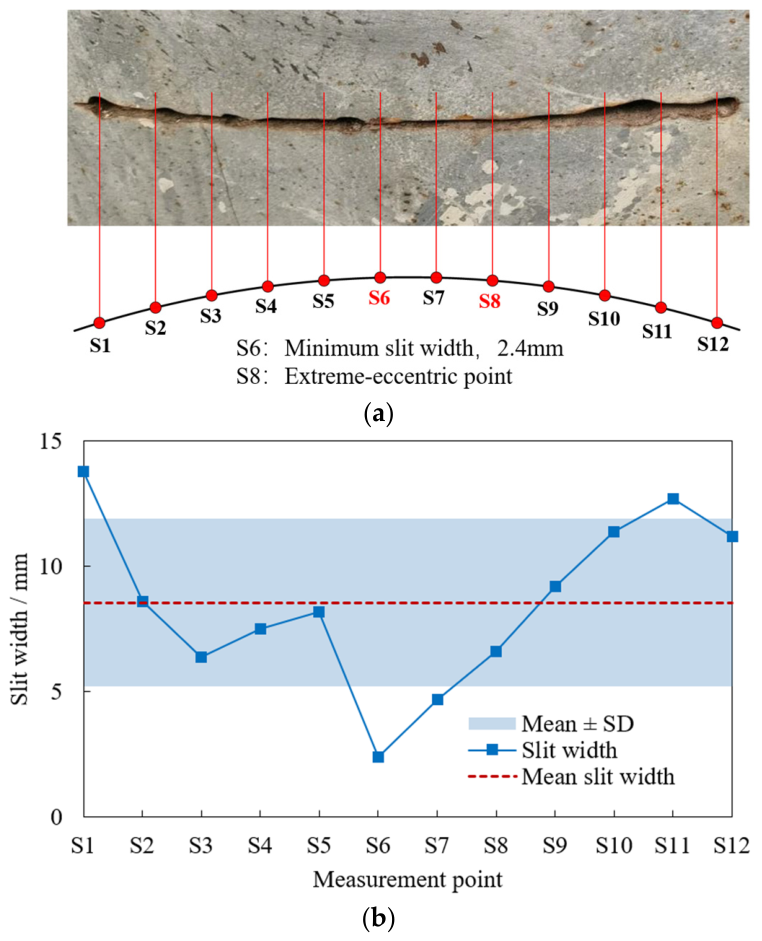

Disclaimer/Publisher’s Note: The statements, opinions and data contained in all publications are solely those of the individual author(s) and contributor(s) and not of MDPI and/or the editor(s). MDPI and/or the editor(s) disclaim responsibility for any injury to people or property resulting from any ideas, methods, instructions or products referred to in the content. |
© 2026 by the authors. Licensee MDPI, Basel, Switzerland. This article is an open access article distributed under the terms and conditions of the Creative Commons Attribution (CC BY) license.