


Abstract
Ground fault detection in DC-links of high-voltage AC drives is challenging because faults may not produce large currents, while neutral-point voltage monitoring can lose sensitivity under nearly balanced pole-to-ground conductances. This paper develops a physics-based mathematical model and a multipath detection framework for the 5 kV DC-link of the GE MV7306 drive. A closed-form expression for the neutral-point voltage is derived using Kirchhoff’s current law in terms of equivalent pole-to-ground conductances. A normalized conductance asymmetry index characterizes near-balanced conditions, and logarithmic resistance sensitivity identifies the characteristic transition, , beyond which the neutral-point voltage approaches saturation. The analytical model is also used to relate the fixed voltage threshold to the corresponding fault conductance and fault resistance boundaries. A multipath architecture combining fixed-threshold and robust adaptive-threshold paths is then developed. Circuit-model-based simulations consider degradation–recovery, variable-resistance surface leakage, and near-symmetric conductance oscillation scenarios. The proposed method detects all three scenarios with delays of 1.213, 0.031, and 0.141 s, respectively. For the two scenarios detected by both the proposed method and the fixed-threshold baseline, the mean detection delay decreased from 0.822 to 0.622 s, a 24.3% reduction. The results establish a direct link between the conductance model, nonlinear sensitivity characteristics, and multipath ground fault detection.
1. Introduction
Recent advances in electric machines and power electronic conversion technologies have enabled voltage source inverter (VSI)-based AC drive systems to simultaneously satisfy the high power density, redundancy, and fault tolerance requirements of large-scale high-voltage marine propulsion systems [1,2]. These systems must ensure precise control of propulsion motors, including induction and synchronous machines, while operating under harsh marine conditions characterized by limited installation space, high humidity, and mechanical vibration [3]. Electric propulsion offers several advantages, including improved dynamic performance, increased flexibility in the onboard layout, reduced shaft-line complexity or compatibility with podded propulsion, enhanced fuel efficiency through optimal operation of prime movers, reduced vibration and improved comfort, and reduced manpower requirements through increased automation [4].
The DC-link of an AC drive serves as the central energy buffer in high-power-conversion systems and interfaces with the main generator, vacuum circuit breaker, phase-shifting transformer, and 12- or 24-pulse diode front-end (DFE) rectifier. In marine propulsion systems and large industrial drives, the DC-link is typically operated in a floating or high-impedance ground-reference configuration corresponding to an IT-type grounding system [5].
This structure enables continuous operation under a single line-to-ground fault because such a fault does not immediately result in large fault currents [5,6,7,8]. Such characteristics are advantageous for applications where operational continuity is critical, including operating rooms and communication systems [9], mining power systems [10,11], and marine electrical systems [12]. In addition, this configuration provides operational flexibility through fault location identification and planned fault removal after the occurrence of a first ground fault [13,14,15].
However, if a first ground fault remains undetected, the resulting increase in the ground potential of the healthy phase and associated insulation stress can expand leakage paths, potentially leading to a second ground fault or arcing fault [16,17,18,19]. Ground faults are among the most frequently reported fault types in electrical systems [20], which highlights the need for monitoring schemes that can detect early-stage abnormalities while maintaining system continuity. This issue has been extensively addressed in various DC applications, including railway DC traction systems [16,21,22], DC microgrids [23,24,25], shipboard medium voltage direct current (MVDC) systems [26,27,28], large-scale photovoltaic DC systems [29,30,31], and battery energy storage systems [32,33], and numerous protection and detection methods have been proposed [34,35,36,37]. Beyond power-system applications, multiview and multidimensional sensing approaches have also been shown to improve feature recognition and spatial localization in complex environments, as demonstrated in GPR-based underground pipeline recognition and localization [38]. Nevertheless, most existing ground fault studies focus on protection at the distribution or system level. To the best of the authors’ knowledge, limited work has focused on the mathematical modeling of neutral-point voltage behavior within the internal DC-link of power-electronic-based AC drives and on the nonlinear response and sensitivity characteristics associated with pole-to-ground conductance variations.
In practical high-voltage AC drives, DC-link ground faults are treated as critical fault modes that can trigger protective actions such as a system trip under specific conditions [39]. Nevertheless, the relationship between the neutral-point voltage, conductance imbalance, nonlinear fault resistance transition, and sensitivity degradation has not been systematically formulated.
This paper considers the 5 kV DC-link of the GE MV7306 high-voltage AC drive (GE Power Conversion, Massy, France) and establishes an equivalent conductance model based on its physical configuration. Based on this model, a closed-form expression for the neutral-point voltage is derived using Kirchhoff’s current law (KCL). The formulation shows that is governed by the conductance imbalance between the two rails relative to the total ground-referenced conductance. A normalized conductance asymmetry index is introduced to characterize balanced and near-balanced conductance conditions. Furthermore, the nonlinear single-pole ground fault response is analyzed in the resistance domain, and a logarithmic resistance sensitivity is formulated to identify the characteristic transition condition. The analysis also demonstrates the saturation behavior of as the fault conductance becomes dominant.
The analytical characteristics are subsequently used to interpret the fixed-threshold boundary in terms of the corresponding fault conductance and fault resistance. Although is structurally reduced under near-balanced conditions, it is already measured and monitored in the MV7306 drive considered in this study, which enables implementation without requiring additional sensing channels. On this basis, a multipath ground fault detection architecture using as the single measurement signal is proposed. The resulting structure combines a fixed-threshold protection path and a robust statistics-based adaptive-threshold path in parallel. Temporal validation and freeze–track threshold adaptation are incorporated to respond to fault signatures with different temporal and statistical characteristics. In this context, a recent governance study has discussed the role and limitations of explicit constraints in adaptive and autonomous systems [40]. Although the proposed detector is not an AI- or learning-based method, this perspective is relevant to its bounded adaptive logic, in which adaptation is deterministic and constrained by predefined physical thresholds, while the fixed-threshold protection path operates independently in parallel.
The proposed framework is evaluated through circuit-model-based simulations reflecting the actual drive configuration and parameters. Three physically distinct fault scenarios are considered: (i) a degradation–recovery fault model dominated by mean shift, (ii) a variable-resistance surface leakage model characterized by increased variability, and (iii) a near-symmetric conductance oscillation model in which the conductance imbalance is minimized. These scenarios represent mean-shift-dominant, variance-dominant, and sensitivity-degraded conditions, respectively, and provide a quantitative basis for evaluating the multipath detection architecture. The simulation results show that the proposed method detects all three evaluated scenarios, including the near-symmetric condition that is not detected by the fixed-threshold baseline.
The main contributions of this paper are summarized as follows:
- A KCL-based mathematical model of the DC-link neutral-point voltage is formulated using equivalent pole-to-ground conductances, explicitly describing the effects of conductance imbalance and multiple parallel grounding paths on .
- The nonlinear single-pole ground fault response is analytically characterized using logarithmic resistance sensitivity, and the characteristic transition condition is identified. A normalized conductance asymmetry index is also introduced to characterize the structural reduction in under balanced and near-balanced conductance conditions.
- The analytical model is linked to fixed-threshold selection by deriving the relationship between the voltage threshold and the corresponding fault conductance and fault resistance boundaries. Based on these characteristics, a multipath detection architecture combining fixed-threshold and robust adaptive-threshold paths is developed.
- The proposed framework is quantitatively evaluated using three representative fault scenarios covering mean-shift-dominant, variance-dominant, and near-symmetric sensitivity-degraded conditions.
The remainder of this paper is organized as follows: Section 2 presents the DC-link ground fault equivalent circuit based on the MV7306 drive and develops the mathematical formulation and nonlinear sensitivity analysis of the neutral-point voltage. Section 3 describes the proposed multipath ground fault detection architecture, including fixed- and adaptive-threshold generation and alarm logic. Section 4 evaluates the detection performance under three representative fault scenarios and further examines disturbance robustness, parameter sensitivity, and comparative performance. Finally, Section 5 concludes this paper and discusses directions for future research.
2. DC-Link Ground Fault Modeling
This section develops a mathematical model of the neutral-point voltage in a high-voltage DC-link under ground fault conditions. An equivalent circuit representing the MV7306 drive is constructed, and KCL is applied to derive the analytical expression for . The effects of conductance imbalance and fault conductance variation on the response and sensitivity characteristics of the neutral-point voltage are subsequently analyzed.
The analysis assumes quasi-steady operating conditions, in which the DC-link is represented by an average-conductance equilibrium at each instant. Thus, slow variations in the DC-link voltage and effective pole-to-ground conductances are allowed, whereas inverter switching, rectifier commutation, and capacitor-transient dynamics are excluded from the analytical model. The influence of such non-ideal high-frequency disturbances on the proposed detector is evaluated separately in Section 4.4.
2.1. Physical Configuration and Equivalent Circuit
This subsection establishes a mathematical ground fault model for the DC-link of the GE MV7306 high-voltage AC drive used in marine propulsion systems. The drive employs a 12-pulse diode front-end rectifier, and the rated DC-link voltage is 5 kV. An induction motor rated at 6.9 MW, 1350 A, and 3.3 kV is used for propulsion.
Figure 1a illustrates the electrical configuration of the DC-link, whereas Figure 1b shows the actual DC-link structure and measurement boards inside the drive. Voltage-measurement boards are installed at the DC+ and DC− rails, and the DC0-to-ground (GND) voltage, denoted by , is measured through the zero-sequence measurement board. A high-impedance reference resistor is connected between DC0 and GND, with a measured resistance of 125 kΩ. The manual earthing switch remains open under normal operation. Consequently, the DC-link neutral point is not solidly grounded but is referenced to ground through the high-impedance resistor . Figure 1c,d shows actual photographs of the earthing switch in its open and closed states, respectively.
Figure 1.
DC-link system of the GE MV7306 AC drive. (a) Electrical configuration of the DC-link; (b) Actual DC-link and measurement boards; (c) Actual earthing switch in the open state; (d) Actual earthing switch in the closed state.
In practical operating environments, insulation degradation, moisture ingress, and surface contamination can create weak leakage paths from the DC+ and DC− rails to GND. These leakage paths are represented by the leakage resistances and . When a ground fault develops, an additional conductive path is formed between the affected DC-link rail and GND, generally reducing the effective insulation resistance. These paths are represented by fault resistances and .
The leakage and fault paths associated with each DC-link rail are modeled as parallel rail-to-ground paths, while DC0 is referenced to GND through . This configuration is represented by the equivalent circuit shown in Figure 2.
Figure 2.
Equivalent grounding circuit model of the DC-link.
2.2. Mathematical Formulation of the Neutral-Point Voltage
In the equivalent circuit shown in Figure 2, the total conductance of each node with respect to GND is defined as follows:
Conductances and represent the total conductance from the DC+ and DC− nodes to ground, respectively. In (1) and (2), each conductance is decomposed into a leakage component and a fault-related component . The conductance represents the grounding conductance of the center node DC0. The relative magnitudes of these conductance paths determine the ground-referenced potential shift in the DC-link.
It should be noted that and are equivalent total conductances and should not be interpreted as conductances associated only with a single physical grounding point. In practical marine and industrial DC-link systems, multiple weak leakage paths can be produced by insulation degradation, moisture ingress, contamination, cable aging, or surface conduction. Furthermore, one or more fault-related grounding paths can form under more severe grounding conditions. Under the quasi-steady neutral-point potential analysis considered in this paper, the distributed leakage paths and fault-related grounding paths can be represented as parallel conductance components and aggregated into equivalent conductances.
In general, leakage conductances can be interpreted as the equivalent conductances of distributed weak leakage paths as follows:
Similarly, the fault conductances can be interpreted as the equivalent conductances of additional fault-related grounding paths as follows:
where and represent the number of weak leakage paths, and and denote the number of fault-related grounding paths on the DC+ and DC− sides, respectively. Therefore, total conductances and in (1) and (2) include the distributed leakage paths and possible fault-related grounding paths through their equivalent parallel conductance representations.
For compact notation, , , , and in (1) and (2) are interpreted as equivalent resistances corresponding to the aggregated leakage and fault conductances. Thus, in the subsequent analysis and simulations, the grounding paths are represented by their equivalent resistances or conductances rather than by individual physical locations. This equivalent-conductance representation should not be interpreted as a means to identify or localize individual grounding points. Instead, the proposed formulation can capture the net electrical effect of the equivalent conductance imbalance produced by the aggregated leakage and fault-related grounding paths.
This lumped conductance representation is valid for the quasi-steady neutral-point voltage analysis considered in this paper, where the DC+ and DC− rails are assumed to behave as approximately equipotential conductors over the detection time scale. Accordingly, high-frequency electromagnetic transients, long-cable propagation effects, and dominant distributed capacitive effects are beyond the scope of the present formulation.
To reflect the internal analysis coordinate system of the MV7306 drive, the DC+ and DC− rail voltages are defined with respect to the DC0 reference potential as follows:
In this representation, the DC+ and DC− rails are expressed as symmetrical potentials around the DC0 node.
The DC-link voltage is defined as and is maintained at a constant value of 5 kV under normal operating conditions in the MV7306 drive. When a ground fault occurs, the absolute potentials of the DC+, DC−, and center node DC0 with respect to ground shift simultaneously. The node voltages are redefined as ground-referenced absolute potentials to represent this behavior consistently as follows:
The DC-link voltage enforces a fixed potential difference between DC+ and DC−, and therefore, the three nodes do not behave independently with respect to ground. Instead, they form a single electrically coupled potential system referenced to ground through .
Applying KCL to this coupled system yields the following governing equation for the neutral-point voltage:
Substituting (10) and (11) into (12) and rearranging the terms yields the neutral-point voltage:
This expression shows that is governed by the conductance imbalance between the two DC-link rails relative to the total ground-referenced conductance. The numerator determines the polarity and magnitude of the neutral-point shift associated with the conductance imbalance, whereas the denominator normalizes this imbalance by the total conductance connected to ground. Within the present quasi-steady conductance model, normal drive transients such as motor-load changes, inverter startup, and DC-link capacitor charging are not treated as ground fault mechanisms because they do not directly create additional pole-to-ground conductance paths. From (13), variations alone do not produce a ground fault signature when , although they can scale an existing offset under conductance asymmetry. Detailed simulation of these transients requires a full drive-system model and is beyond the scope of the present formulation.
In addition, (13) explains the effect of multiple simultaneous grounding paths. If aggregated grounding paths are concentrated on one pole, the resulting conductance imbalance increases and the response becomes more pronounced. Conversely, if multiple weak grounding paths are distributed in a nearly balanced manner between the DC+ and DC− poles, the equivalent conductances satisfy ≈ , and the response is structurally suppressed even when the total grounding conductance increases.
A normalized conductance asymmetry index is defined to quantify the degree of imbalance between the positive and negative ground-conductance paths as follows:
Since and are nonnegative conductances, , and therefore whenever . If the denominator of the index, , approaches zero, remains bounded, but its limiting value depends on the relative rates at which and approach zero. At the exact point , the index is mathematically undefined because both the numerator and denominator vanish. This singular case is outside the physical domain considered here because and include finite background leakage conductances.
As approaches zero, the two conductance paths become nearly symmetric. Under this condition, the conductance-difference term in the numerator of (13) decreases, and the corresponding response is structurally reduced. Accordingly, is used in this paper to characterize balanced and near-balanced conductance conditions. This index also provides an analytical basis for the near-symmetric conductance oscillation scenario considered in the subsequent simulations.
The conductance-based formulation is intended for quasi-steady and low-frequency ground fault behavior. For a ground path with resistance and parasitic capacitance , the admittance is . Thus, the resistive approximation is valid when ). For = 1 MΩ, the resistive and capacitive terms become equal at = 1.59 nF at 100 Hz and 0.159 nF at 1 kHz. For = 125 kΩ, the corresponding values are 12.7 nF and 1.27 nF. Therefore, parasitic capacitances may affect the neutral-point voltage at sufficiently high frequencies, where a complex-admittance model is required. Because the actual MV7306 parasitic capacitances were not measured, such device-specific high-frequency modeling is beyond the scope of this study.
2.3. Nonlinear Characteristics and Sensitivity
According to (13), is determined by the relative magnitudes of the conductances between the DC-link nodes and ground. Under a single-pole ground fault, the fault conductance is treated as the primary varying quantity, whereas the background leakage conductance is assumed to remain approximately constant.
Consider a single ground fault on the DC+ side. In this case, no fault path exists on the DC− side and the fault conductance . Substituting this condition into (13) gives the following expression:
For analytical characterization, symmetric background leakage is assumed. Accordingly, , and (15) simplifies to
For analytical convenience, the reference conductance is defined as
Equation (16) shows that the response of is governed by the relative magnitude of with respect to . When , the fault path is weak relative to the reference conductance and the neutral-point voltage shift remains small. When becomes comparable to , a pronounced nonlinear transition occurs. When , the fault conductance dominates the denominator of (16), and asymptotically approaches the saturation limit of .
Because ground fault resistance generally varies over several orders of magnitude, as represented by the logarithmic resistance axis in Figure 3, the transition characteristics are evaluated using logarithmic resistance sensitivity. The dimensionless quantity is used to avoid direct logarithmic scaling of a dimensional resistance. The logarithmic resistance sensitivity is defined as follows:
Figure 3.
Ground-referenced DC-link voltages versus single-pole ground fault resistance. (a) Variation with ; (b) Variation with .
The sensitivity in (18) reaches its unique maximum when . Therefore, the analytically defined transition condition is , or equivalently . At this transition point, the magnitude of the neutral-point voltage becomes . Thus, the transition condition identifies the region in which the response changes most rapidly with fault resistance on a logarithmic scale.
For the AC drive considered in this paper, the measured grounding resistance is kΩ. When the insulation leakage resistance is sufficiently high, becomes small relative to , and approaches . Consequently, the characteristic transition resistance approaches and lies approximately in the Ω range. More generally, the exact transition location is determined by , indicating that both the grounding resistance and background insulation condition affect the transition.
A corresponding relationship is obtained for a single ground fault on the DC− rail. Under the same symmetric-leakage assumption, the neutral-point voltage is expressed as follows:
The DC− ground fault case has the same nonlinear magnitude and logarithmic sensitivity characteristics as the DC+ ground fault case, while the polarity of is reversed. Therefore, the corresponding transition condition is , or .
Figure 3a illustrates the variations in , , and with , whereas Figure 3b presents the corresponding responses with . As described in Section 2.2 and Equations (6) and (7), and represent the equivalent pole-to-ground resistances associated with aggregated fault-related grounding paths rather than the insulation resistances of specific marine equipment. In both cases, the pronounced transition around the Ω resistance range is consistent with the analytical condition . This region corresponds to the maximum logarithmic resistance sensitivity of . At the exact transition point, . For the 5 kV DC-link considered in this paper, this corresponds to a neutral-point voltage magnitude of 1.25 kV.
As the fault resistance decreases further, asymptotically approaches for a DC+ ground fault and for a DC− ground fault. Conversely, as the fault resistance increases beyond the transition region, approaches zero. These results confirm the nonlinear transition and saturation characteristics predicted by the analytical model.
Figure 4 shows the response of under simultaneous variations in the positive- and negative-pole fault resistances. A pronounced voltage shift occurs when the grounding conductance of one pole becomes dominant relative to that of the opposite pole. In contrast, when the positive- and negative-pole conductances become comparable, their effects partially or completely cancel in the numerator of (13), and is consequently suppressed.
Figure 4.
Three-dimensional response surface of under simultaneous variations in and .
This behavior is consistent with the normalized conductance asymmetry index defined in (14). As approaches zero, the neutral-point voltage response is structurally reduced even when the total grounding conductance increases.
The results in Figure 3 and Figure 4 establish the two principal response characteristics considered in this paper. The first is the nonlinear transition and saturation associated with the magnitude of the fault conductance. The second is the suppression of under balanced or near-balanced conductance conditions. These characteristics provide the analytical basis for the ground fault detection architecture developed in Section 3.
3. DC-Link Ground Fault Detection Based on Neutral-Point Voltage
The neutral-point voltage model derived in Section 2 shows that shifts nonlinearly according to the relative magnitudes of the conductances between the DC-link nodes and ground. Under a single-pole ground fault, the logarithmic resistance sensitivity reaches its maximum at the transition condition . As the fault conductance increases beyond this transition region, progressively approaches the saturation limit of .
In the MV7306 drive considered in this paper, is already measured and monitored as part of the drive protection and diagnostic system. Therefore, this signal can be utilized for ground fault detection without introducing additional voltage or current sensors. Based on the analytical characteristics identified in Section 2, this section develops a multipath ground fault detection architecture using as the single measurement signal. The proposed architecture combines a fixed-threshold protection path and a robust statistics-based adaptive path to respond to fault signatures with different temporal and statistical characteristics.
3.1. Neutral-Point Voltage Criterion
The proposed detection approach utilizes the neutral-point voltage as the primary measurement signal. As demonstrated in Section 2, a single-pole ground fault causes to shift from its normal operating level, with the polarity of the shift determined by the faulted DC-link rail. As the fault conductance increases, varies nonlinearly and progressively approaches the saturation limit of , depending on the faulted DC-link rail.
Based on this characteristic, the absolute magnitude of the neutral-point voltage is used as the fixed-threshold detection variable. The corresponding criterion is defined as
where denotes the predefined voltage threshold. The absolute value is used because DC+ and DC− ground faults produce neutral-point voltage shifts with opposite polarities. Accordingly, (20) provides a common magnitude-based criterion for both fault polarities.
Figure 5 illustrates the ground fault detection logic implemented in the MV7306 drive. The measured neutral-point voltage is processed through signal selection (SEL), moving-average filtering (MEAN), absolute-value operation (ABS), and low-pass filtering (FILTER), after which it is compared with the threshold. This structure demonstrates that is already available as a measurement signal in the actual drive and can be used for magnitude-based ground fault detection without introducing additional voltage or current sensors.
Figure 5.
Ground fault detection logic of the GE MV7306 high-voltage AC drive.
In the proposed architecture, the criterion in (20) is employed as the fixed-threshold protection path. The selection of is discussed in Section 3.2 based on the nonlinear characteristics of established in Section 2.
3.2. Fixed-Threshold Selection Based on Nonlinear Transition Characteristics
The nonlinear transition analysis in Section 2 shows that the magnitude of under a single-pole ground fault is determined by the fault conductance relative to the reference conductance . Therefore, the fixed threshold introduced in (20) can be related analytically to a corresponding fault conductance and fault resistance boundary. This relationship provides a physical basis for selecting the fixed threshold used in the subsequent simulations.
Because DC+ and DC− single-pole ground faults exhibit identical magnitude characteristics, is used here to represent the fault conductance of the faulted rail. At the fixed-threshold boundary, the single-pole ground fault relationship derived in Section 2 gives the following condition:
where denotes the fault conductance corresponding to the fixed-threshold boundary. Rearranging (21) gives the corresponding conductance and resistance boundaries:
Section 2 showed that the maximum logarithmic resistance sensitivity occurs at the characteristic transition resistance . Therefore, the relative location of the fixed-threshold boundary with respect to the transition point can be expressed as follows:
Equation (23) provides a direct interpretation of the threshold level. For the 5 kV DC-link considered in this paper, 50, 250, and 450 V correspond to single-pole fault resistance boundaries of approximately 49, 9, and 4.56, respectively. Thus, the 50 V setting extends the fixed-threshold boundary substantially toward the high-resistance region, whereas the 450 V setting places the boundary closer to the characteristic transition point.
Based on this comparison, 250 V is selected as the nominal fixed threshold. This value corresponds to , placing the fixed-threshold boundary approximately one decade above the characteristic transition resistance on the logarithmic fault resistance scale. Accordingly, the fixed-threshold path can respond before the maximum logarithmic sensitivity point is reached, while providing an intermediate boundary between the substantially extended high-resistance region associated with the 50 V setting and the more restrictive boundary associated with the 450 V setting. The 250 V value is therefore adopted as the nominal fixed threshold for the MV7306 case study and is used consistently in the subsequent simulations.
For the MV7306 drive considered in this paper, the measured resistance between DC0 and ground is kΩ. The exact transition and threshold boundaries are determined through . When the background leakage conductance is small relative to , approaches , and the characteristic transition resistance correspondingly approaches . Thus, the measured grounding resistance provides a physical reference for the nonlinear transition characteristics, whereas the exact fixed-threshold boundary is determined by (22).
Figure 6 illustrates the alarm regions obtained for the three fixed-threshold settings under simultaneous variations in and . The complete two-pole alarm boundaries are determined from the general neutral-point voltage relationship in (13), whereas (21)–(23) provide the analytical interpretation of the corresponding single-pole boundaries. The variation among the three threshold settings confirms that determines the fault resistance range covered by the fixed-threshold path and supports the selection of 250 V as the nominal threshold for the subsequent simulations.
Figure 6.
Comparison of ground fault alarm boundaries for different fixed-threshold values. (a) = 50 V; (b) = 250 V; (c) = 450 V.
The corresponding effects of on detection delay and false-alarm behavior are evaluated quantitatively in Section 4.5.
3.3. Robust Adaptive Threshold and Multipath Alarm Architecture
The fixed-threshold criterion defined in Section 3.1 provides a deterministic protection path based on the absolute magnitude of . The nominal threshold selected in Section 3.2 establishes a physically interpretable fault resistance boundary for the MV7306 case study. However, ground fault signatures can exhibit different temporal and statistical characteristics, and a single fixed-threshold path may not respond uniformly to all such conditions.
To complement the fixed-threshold path, a robust adaptive-threshold path is introduced using statistical characteristics extracted from the same signal. The adaptive path is designed to adjust its decision threshold according to the recent signal distribution while maintaining predefined physical bounds. In addition, a freeze–track mechanism is incorporated to prevent the adaptive threshold output from following short-duration large-amplitude excursions.
Figure 7 shows the overall structure of the proposed multipath detection architecture.
Figure 7.
Block diagram of the proposed multipath ground fault detection architecture using .
The measured signal is first conditioned and converted into a magnitude-based feature. The resulting feature is then processed through two parallel decision paths. The fixed-threshold path applies the nominal threshold , whereas the adaptive path applies a time-varying threshold obtained from robust statistical estimation. Temporal validation is subsequently performed using debounce and latch mechanisms according to the role of each path. The detailed procedures for signal conditioning, adaptive-threshold generation, freeze–track operation, and temporal validation are described in Section 3.3.1, Section 3.3.2, Section 3.3.3, Section 3.3.4 and Section 3.3.5, while the final alarm fusion is presented in Section 3.4.
3.3.1. Signal Conditioning and Feature Extraction
The measured neutral-point voltage contains the physical voltage response described in Section 2 together with measurement noise. The discrete-time measured signal is represented as follows:
where represents zero-mean Gaussian white noise with a standard deviation of . The sampling frequency is set to = 1 kHz.
The raw signal is first processed using a causal second-order Butterworth low-pass filter with a cutoff frequency of = 100 Hz. A 10-sample moving-average filter is subsequently applied, corresponding to a 10 ms averaging window at the selected sampling frequency. These filtering operations attenuate high-frequency measurement noise and short-duration fluctuations while preserving the lower-frequency variations in associated with the ground fault conditions considered in this paper. Both filtering stages are implemented using present and past samples only, allowing the signal-conditioning process to operate in real time.
The conditioned neutral-point voltage is denoted by . A polarity-independent magnitude feature is then defined as . The absolute-value operation allows the voltage responses produced by DC+ and DC− ground faults to be processed using a common magnitude variable despite their opposite polarities. The resulting feature is used as the common input to both the fixed-threshold and adaptive-threshold paths described in the following subsections.
3.3.2. Robust Adaptive Threshold Generation
The adaptive threshold is computed based on the sliding window of the most recent = 300 samples of the magnitude feature . At the sampling frequency of = 1 kHz, this window corresponds to 0.3 s. The window is defined as follows:
At the beginning of the measurement sequence, the available samples up to the current instant are used. Thus, the window contains only present and past samples and can be updated causally in real time.
Robust statistics based on the median and median absolute deviation (MAD) are computed over . The robust location and scale estimates are defined as follows:
where 1.4826 is the Gaussian consistency factor for converting the MAD to a robust estimate of standard deviation. Compared with conventional mean- and standard-deviation-based estimation, the median–MAD formulation reduces the influence of isolated large-amplitude samples on the threshold estimate.
The statistical threshold is then defined as follows:
where controls the statistical margin above the recent robust distribution, and = 2.4 is used. The parameter-robustness analysis in Section 4.5 evaluates over the range 1.5–3.3 under the variance-dominant condition. The causal detection delay and final false-alarm behavior remain unchanged throughout this range, indicating low sensitivity to under the evaluated conditions. Therefore, = 2.4 is retained as an interior nominal value within this stable region rather than as a uniquely optimized value. If is used alone, the adaptive threshold can become excessively low under steady conditions. Therefore, a physical lower bound is introduced to prevent excessive downward adaptation. Excessive upward adaptation is addressed separately by the cap constraint and freeze–track mechanism described in Section 3.3.3. The physical lower bound is defined as follows:
where is a scaling factor that defines the physical lower bound relative to . As quantified in the parameter-robustness analysis in Section 4.5, was varied from 0.10 to 0.90 and exhibited the strongest parameter dependence among the evaluated settings. Very small values increased the pre-debounce threshold-crossing susceptibility, whereas large values substantially increased the causal detection delay under the near-symmetric condition. The value = 0.35 is therefore selected within the practical robust region between these two behaviors. For = 250 V, this corresponds to a physical lower bound of 87.5 V. The final lower-bound threshold is defined as follows:
Consequently, follows changes in the recent robust statistical distribution of while remaining above the prescribed minimum threshold level. The online threshold update is conceptually related to autonomous online-learning schemes that adapt their strategies from sequential observations [41]. However, the present method does not employ learned policies or model training. Instead, it uses deterministic robust statistical updates constrained by predefined physical bounds.
3.3.3. Freeze–Track Mode Switching and Protection Logic
Although the median–MAD estimator reduces the influence of isolated samples, a short-duration high-amplitude event can still increase the recent statistical estimates and consequently raise . If the adaptive threshold directly follows this increase, it may become temporarily elevated during a significant voltage excursion. To limit this behavior, a separate short sliding window comprising = 50 samples is introduced to identify recent high-amplitude events independently of the = 300-sample window used for robust statistical estimation.
The short sliding window corresponds to 0.05 s at = 1 kHz and is defined as follows:
Because , responds more rapidly to recent large-amplitude variations than the statistical floor estimator. The 99th percentile of the short-window samples is calculated as follows:
The percentile-based quantity characterizes the upper-tail magnitude of the recent signal window while being less dependent on a single-sample maximum. The freeze condition is represented by the following binary indicator:
where represents the indicator function, and is a scaling factor set to 1.2. That is, a short-duration event is identified when the 99th percentile exceeds 120% of . This design limits the effect of sporadic outliers while preventing the adaptive threshold output from following short-duration high-amplitude excursions. Hereafter, the binary variable is referred to as the strong-event indicator.
When , the system operates in the track mode, in which the adaptive threshold follows within a prescribed upper bound. The upper bound is defined as follows:
where is set to 1.0. Accordingly, = 250 V for the nominal fixed threshold used in this paper. In the track mode, the adaptive magnitude threshold is defined as follows:
When , the system enters the freeze mode. In this mode, adaptation of the threshold output is suspended and the adaptive magnitude threshold is set to the nominal fixed threshold .
The complete freeze–track threshold is therefore expressed as follows:
With = 0.35 and = 1.0, the adaptive magnitude threshold is constrained within the range 87.5 V 250 V for the parameter values used in this paper.
The track mode allows the threshold to follow changes in the recent robust statistical distribution, whereas the freeze mode temporarily sets the adaptive threshold to , thereby suspending event-driven tracking of the statistical floor.
3.3.4. Fixed-Threshold Path and Latch Preservation
The fixed-threshold path evaluates the magnitude feature using the fixed-threshold criterion defined in (20). The resulting threshold-exceedance condition is processed through two distinct temporal functions: debounce validation and latch preservation. These functions are applied independently because they serve different purposes in the multipath architecture.
For the debounce function, an alarm is validated only when the fixed-threshold condition persists for at least = 50 consecutive samples. At the sampling frequency of = 1 kHz, this corresponds to a debounce interval of 50 ms. Short-duration threshold exceedances that do not satisfy this persistence requirement are rejected, whereas sustained exceedances generate the “Fixed: Debounce” output.
In parallel, the fixed-threshold condition is also applied directly to the latch function without passing through the debounce stage. When the threshold is exceeded, the “Fixed: Latch” output is activated immediately and is maintained for = 100 samples, corresponding to 0.1 s at = 1 kHz. Continued or repeated threshold exceedances retrigger the latch and extend the active interval accordingly. This output-retention mechanism enables short-duration but high-amplitude events to remain observable by subsequent alarm-fusion or supervisory functions.
The debounce and latch therefore perform complementary temporal functions. The debounce emphasizes persistence by rejecting threshold exceedances shorter than 50 ms, whereas the latch emphasizes event preservation by retaining a threshold-crossing event for at least 0.1 s. The 50 ms debounce interval and 0.1 s latch duration are fixed design parameters used throughout the simulations and represent a balance between response speed, transient rejection, and alarm-output persistence.
Table 1 summarizes the functional distinction between the debounce and latch mechanisms.
Table 1.
Comparison between the debounce and latch mechanisms.
3.3.5. Robust Adaptive Threshold Path
The robust adaptive-threshold path compares the magnitude feature with the time-varying adaptive threshold defined in (36). An adaptive threshold-exceedance condition occurs when . Because is determined from the recent robust statistical characteristics of within the prescribed lower and upper bounds, the adaptive path provides a time-varying decision boundary that complements the fixed-threshold criterion.
The same debounce condition used in the fixed-threshold path is applied to the adaptive threshold-exceedance condition. A valid “Adaptive: Debounce” alarm is declared only when the exceedance persists for at least = 50 consecutive samples, corresponding to 50 ms at = 1 kHz. This temporal validation prevents short-duration exceedances of the adaptive threshold from being interpreted directly as sustained alarm conditions.
Unlike the fixed-threshold path, no latch mechanism is applied to the adaptive path. The adaptive path is intended to respond to sustained or recurrent deviations relative to the time-varying threshold, and an additional latch would retain the alarm beyond the interval supported by the adaptive threshold condition. Therefore, only the debounce function is used for temporal validation in this path. The resulting “Adaptive: Debounce” output is subsequently combined with the “Fixed: Latch” output in the alarm-fusion logic described in Section 3.4.
3.4. Alarm Fusion and Global Decision
The final global alarm is generated by combining the “Fixed: Latch” and “Adaptive: Debounce” outputs using a logical OR operation and is delivered through the global alarm channel. The fixed-latch path retains events triggered by the fixed-threshold condition for 100 samples, corresponding to 0.1 s at = 1 kHz. This allows short-duration, high-amplitude threshold-crossing events to remain active for a prescribed duration. In contrast, the adaptive-debounce path applies the 50-sample debounce condition to the time-varying adaptive threshold , enabling the detection of sustained or statistically varying deviations relative to the adaptive decision boundary.
These two paths are designed to respond to fault signatures with different temporal and statistical characteristics. The fixed-latch path provides a direct response to exceedances of the nominal fixed threshold and preserves short-duration events, whereas the adaptive-debounce path responds to deviations evaluated relative to the robust adaptive threshold. The logical OR operation activates the global alarm whenever either of these two outputs becomes active, thereby combining the complementary characteristics of the two detection paths.
Meanwhile, the “Fixed: Debounce” output of the fixed-threshold path is not directly included in the global alarm and is provided separately through an auxiliary alarm channel. This auxiliary path functions as an independent monitoring channel that identifies sustained exceedances of the nominal fixed threshold regardless of variations in the adaptive threshold. Such channel separation provides additional information on the persistence of fixed-threshold exceedances while maintaining the independence of the adaptive decision path.
Although logical OR fusion increases the number of conditions capable of activating the global alarm, the two constituent outputs are constrained before the fusion stage. The fixed-latch path is activated directly by an exceedance of the nominal fixed threshold and preserves the resulting event for the prescribed latch duration, whereas the adaptive path incorporates the floor–cap constraints, freeze–track switching, and debounce validation described in Section 3.3.2, Section 3.3.3, Section 3.3.4 and Section 3.3.5. Therefore, the fusion stage itself introduces no additional detection criterion and simply combines the outputs of the two parallel paths.
The fixed-threshold and adaptive-threshold paths are coordinated through a common input signal and a common decision time base. Both paths use the same conditioned neutral-point voltage magnitude feature and are evaluated using the same discrete-time index . The fixed-threshold path provides an absolute magnitude-based criterion, whereas the adaptive-threshold path provides a time-varying criterion based on recent robust statistical characteristics. Their temporally processed outputs are synchronized at the decision level and combined through logical OR fusion.
This multipath structure is particularly relevant when the characteristics of the ground fault response vary in magnitude and temporal behavior. In addition, reliable detection becomes more challenging under near-balanced conductance conditions because the corresponding response is structurally reduced, as demonstrated in Section 2. The proposed framework requires only signal filtering, robust statistical estimation, threshold comparison, debounce/latch processing, and logical operations. Consequently, the computational structure remains relatively simple and is compatible with real-time implementation.
4. Simulation and Validation
This section presents the quantitative validation of the operational characteristics and structural performance of the proposed neutral-point voltage-based multipath detection algorithm. Simulations were conducted based on the analytical model and static sensitivity analysis presented in Section 2. Unless otherwise specified, all simulations were performed over s, with the fault interval defined by = 1.0 s and = 2.5 s, while the background leakage resistances were fixed at 1 MΩ. A fixed random seed of 7 was used for stochastic fault generation and Gaussian measurement noise to ensure reproducibility. The evaluations focus on three representative scenarios: (i) a mean-shift-dominant fault, (ii) a variance-dominant variable leakage fault, and (iii) a near-symmetric conductance condition (degraded sensitivity). The selected scenarios were not intended to exhaustively represent all possible ground fault conditions. Nevertheless, they represent three distinct fault-response patterns relevant to practical AC drive DC-link systems.
In particular, the third scenario constitutes the most challenging case among the three evaluated scenarios. Therefore, these scenarios provide a structured basis for evaluating the proposed framework across three distinct fault-response patterns. Through these scenarios, the fixed-threshold path, adaptive-threshold path, and latch preservation mechanism are systematically evaluated and compared under their respective operating conditions.
4.1. Degradation–Recovery Fault (Mean-Shift-Dominant Condition)
4.1.1. Scenario Definition and Modeling Assumptions
This scenario emulates gradual insulation degradation and subsequent recovery in the DC+ path. In the present model, the cumulative effect of insulation degradation is represented as a low-frequency variation in the equivalent insulation resistance rather than as individual high-frequency transient events.
is maintained at 10 MΩ to isolate the mean-shift effect, while is modeled as a time-varying parameter. Starting from = 10 MΩ, the resistance decays exponentially after the fault inception at and recovers exponentially after , as described by the first-order exponential functions in (37) and (38).
During the degradation phase ( ≤ ≤ ), the resistance evolves as follows:
During the recovery phase (> , the resistance is expressed as follows:
where and represent the degradation and recovery rate constants, and represents the minimum resistance reached at the end of the degradation phase, expressed as .
As shown in Figure 8, this model is designed to reproduce the mean-shift behavior, which is characterized by a gradual drift in the mean offset of rather than isolated transients. This setup enables a systematic evaluation of the mean-offset sensitivity and response of the adaptive threshold.
Figure 8.
Fault resistance trajectories under a degradation–recovery fault condition.
4.1.2. Time-Domain Response and Alarm Behavior
Figure 9a shows the time-domain responses of the raw and filtered neutral-point voltages , together with the fixed thresholds ± and the adaptive magnitude threshold .
Figure 9.
Time-domain response of and multipath alarm behavior under a degradation–recovery fault condition. (a) response; (b) Alarm timelines; (c) Global binary alarm.
Conductance imbalance increases as decreases exponentially, which results in a gradual drift in the mean offset of without impulsive or transient peaks. Although the conditioned magnitude initially remains below , the accumulated mean shift eventually causes to exceed Figure 9b shows the corresponding alarm channel responses under the fault condition.
The “Fixed: Debounce” path activates after a debounce delay because the threshold exceedance must persist for samples. In contrast, the “Fixed: Latch” path is triggered immediately and retains the alarm for a duration of , demonstrating a protection-oriented response.
In the adaptive path, robust statistics (, ) track the mean shift, which results in an increase in and . In the track mode, the cap constraint ensures that , which prevents the excessive relaxation of the threshold. Once the mean shift becomes sufficiently large, the “Adaptive: Debounce” path also generates an alarm.
As shown in Figure 9c, the “Global Alarm” formed through the logical OR of the “Fixed: Latch” and “Adaptive: Debounce” is activated during the later stage of the degradation phase and remains active into the initial recovery period. During recovery, the conductance imbalance decreases with an increase in , and the mean offset of gradually returns to its steady state. The debounce outputs are deactivated as their respective threshold-exceedance conditions disappear, whereas the fixed-latch output is released after the prescribed latch interval.
These results confirm that the proposed architecture responds to low-frequency mean-shift faults rather than impulsive events and enables the systematic detection of offset-based potential transitions.
4.1.3. Adaptive Threshold Evolution
Figure 10a shows and , and Figure 10b shows the strong-event indicator. During the degradation phase, increases in response to the mean shift in , which leads to a corresponding increase in . Over a certain interval, reaches the cap level, which causes to saturate. This behavior reflects the intent of the design to prevent the adaptive threshold from exceeding the predefined upper threshold bound.
Figure 10.
Adaptive threshold evolution under a degradation–recovery fault condition. (a) Adaptive signals; (b) Strong-event indicator.
During the recovery phase, both and gradually return to their steady-state values with a decrease in the mean offset. The strong-event indicator is activated only in isolated instances because this scenario lacks sudden high-amplitude transients.
Table 2 summarizes the activation timing and duration for each alarm channel. The “Fixed: Latch” is activated earliest, yielding the shortest detection delay among the evaluated alarm channels. The corresponding first-trigger time and detection delay are = 2.213 s and = 1.213 s, respectively, with and = 1.0 s. The “Fixed: Debounce” and “Adaptive: Debounce” are triggered almost simultaneously after a sufficient accumulation of the mean shift. Consequently, the “Global Alarm,” which incorporates the latch output, shares the same initial trigger time as the “Fixed: Latch.” No independent alarm episode was observed during the predefined healthy intervals in the three evaluated scenarios. A separate false-alarm assessment over an aggregate 295 s is presented in Section 4.5. These finite-duration evaluations should not be interpreted as establishing a universal statistical false-alarm rate. Overall, the Case 1 results confirm that the proposed architecture detects the evaluated low-frequency mean-shift fault.
Table 2.
Trigger summary for Case 1: degradation–recovery condition.
4.2. Variable-Resistance Surface Leakage (Variance-Dominant Condition)
4.2.1. Scenario Definition and Modeling Assumptions
The variable-resistance surface leakage (VRSL) scenario is constructed to emulate time-varying surface leakage in practical drive environments, where the effective leakage path can vary because of moisture or conductive contamination. Under these conditions, insulation resistance does not decrease monotonically. Instead, the effective path length and cross-sectional area vary, resulting in stochastic fluctuations over a wide range.
In this scenario, is characterized by increased statistical variance and intermittent high-amplitude peaks rather than being dominated by a long-term mean shift. The DC− path is maintained at = 10 Ω to isolate this behavior, while the DC+ fault resistance is modeled as a time-varying parameter during the fault interval (). As shown in Figure 11, is generated by combining a first-order correlated random component with a correlation time of 7 ms and intermittent dip events with a probability of 0.053 per sample. The correlated component is smoothed over 50 ms, whereas the dip component is shaped using a 50 ms exponential kernel with a 20 ms decay constant; the two components are combined with weights of 0.90 and 0.50 and nonlinearly mapped between = 2 Ω and = 8.1 MΩ using an exponent of 2.3, followed by 20 ms output smoothing and 6 ms edge tapering. This represents a variance-dominant fault and provides a challenging test case for evaluating the adaptive-threshold structure when mean-offset-based detection is marginal.
Figure 11.
Fault resistance trajectories under the variable-resistance surface leakage (VRSL) condition.
4.2.2. Time-Domain Response and Alarm Behavior
Figure 12a presents the time-domain responses of the raw and filtered signals together with the fixed thresholds and the adaptive magnitude threshold during the VRSL fault scenario.
Figure 12.
Time-domain response of and multipath alarm behavior under the VRSL fault condition. (a) response; (b) Alarm timelines; (c) Global binary alarm.
Due to the irregular fluctuations in , exhibits transient high-amplitude peaks without a sustained mean shift. As shown in Figure 12b, during certain intervals, the conditioned magnitude momentarily exceeds , and the “Fixed: Latch” path is immediately triggered and maintains the alarm for a predefined duration. In contrast, the “Fixed: Debounce” path does not respond unless the exceedance persists, which makes it less responsive to transient fluctuation-dominant signatures.
A key feature of the VRSL scenario is the increase in statistical variability. During the fault, the robust standard deviation increases, which leads to a rise in and . Recurrent peaks exceed the adaptive threshold, activating the “Adaptive: Debounce” channel. This indicates that the proposed architecture responds to variance-driven fault signatures through the adaptive-threshold path. As observed in Figure 12c, the “Global Alarm,” defined by the logical OR of the “Fixed: Latch” and “Adaptive: Debounce,” responds to both short-duration high-amplitude events and increased statistical variability.
4.2.3. Adaptive Threshold Evolution
Figure 13a illustrates the time-domain variation in and , whereas Figure 13b presents the strong-event indicator.
Figure 13.
Adaptive threshold evolution under the VRSL condition (floor constraint and strong-event indicator). (a) Adaptive signals; (b) Strong-event indicator.
As increases, tends to increase accordingly, whereas remains governed by the cap constraint and freeze–track switching logic defined in Section 3.3.3.
Intervals where reflect the activation of the cap constraint or freeze logic, demonstrating the combined operation of the floor–cap constraints and event-driven switching logic. Table 3 summarizes the trigger timing and duration of each alarm channel. The “Adaptive: Debounce” path is triggered first, which reflects its earlier response to the variance-dominant characteristics of the VRSL fault. These results confirm the complementary operation of the two detection paths. The fixed-threshold path responds to sufficiently large voltage excursions, whereas the adaptive path provides additional sensitivity to statistically varying fault signatures.
Table 3.
Trigger summary for Case 2: variable-resistance surface leakage (VRSL) condition.
4.3. Near-Symmetric Conductance Oscillation (Sensitivity-Degraded Condition)
4.3.1. Scenario Definition and Modeling Assumptions
This scenario is designed to evaluate the sensitivity of the proposed -based detector under balanced or near-balanced conductance conditions. The normalized conductance asymmetry index defined in (14) is used to characterize the degree of imbalance between the two pole-to-ground conductance paths. The ground conductance paths of the DC+ and DC− rails are nearly balanced when is small, and the neutral-point voltage response is structurally suppressed.
Based on the static sensitivity characteristics derived in Section 2, this section defines the near-symmetric condition as the “near-balanced conductance condition.” The mean offset decreases as approaches because the conductance-difference term in the numerator of (13) decreases. Therefore, even if insulation degradation is present on both rails, mean-offset-based detection is intrinsically limited under this balanced condition.
Such conditions can arise in the DC-link when surface leakage paths on the positive and negative poles vary simultaneously because of humidity, temperature variation, or vibration. In practical systems, this near-balanced condition can be produced by the collective effect of multiple weak leakage or grounding paths distributed on both rails. These paths are aggregated into the equivalent conductances and , as described in Section 2.2, and their combined effect can yield even when several local insulation degradations are present. Therefore, the near-symmetric conductance oscillation considered in this scenario should be interpreted as an equivalent representation of the balanced multipath leakage condition and not merely as a single-pair grounding case. This scenario represents a sensitivity-degraded condition for evaluating the detection margin of the proposed algorithm.
To recreate this dynamic near-balanced scenario, the reference fault resistances are set to = = 10 MΩ, with antiphase sinusoidal modulations imposed during the fault interval as follows:
where = 1.2 Hz and = 0.9. The amplitude is selected such that the conditioned magnitude approaches but remains below throughout the fault interval. This corresponds to a threshold-adjacent condition intentionally constructed to challenge fixed-threshold-based detection.
Figure 14 illustrates the antiphase oscillations of the fault resistances.
Figure 14.
Fault resistance trajectories under the near-symmetric conductance oscillation condition.
4.3.2. Time-Domain Response and Alarm Behavior
Figure 15a illustrates the raw and filtered signals together with the fixed thresholds ± and the adaptive magnitude threshold under the near-symmetric conductance oscillation condition.
Figure 15.
Time-domain response of and multipath alarm behavior under the near-symmetric conductance oscillation condition. (a) response; (b) Alarm timelines; (c) Global binary alarm.
During the fault (), oscillates symmetrically around 0 V because of the antiphase conductance variations. Although the conditioned magnitude approaches , it remains below the fixed threshold. Consequently, both the “Fixed: Debounce” and “Fixed: Latch” paths remain inactive, as observed in Figure 15b. This indicates the structural sensitivity limit of mean-offset-based detection.
However, the statistical variability increases significantly. During the fault, this increased variability raises the robust standard deviation , which in turn raises the robust floor and adaptive threshold. Nevertheless, recurrent peaks of remain above for sufficient durations to satisfy the 50 ms debounce condition, thereby activating the “Adaptive: Debounce” path. Figure 15c demonstrates that the “Global Alarm” is activated by the “Adaptive: Debounce” output through the logical OR operation with the “Fixed: Latch” path. Consequently, fault signatures are detected based on increased statistical variability even under conditions where the mean offset is structurally suppressed.
4.3.3. Adaptive Threshold Evolution
Figure 16a depicts and over time, whereas Figure 16b provides the corresponding strong-event indicator. Under the condition, the mean offset is limited, while the statistical variability in increases during the fault interval. Accordingly, increase. In this scenario, cap constraints or freeze transitions are not dominant, and = is maintained. The strong-event indicator remains inactive, which indicates that voltage variation is not driven by impulsive high-amplitude events but rather by statistical oscillations under a near-symmetric structure.
Figure 16.
Adaptive threshold evolution under the near-symmetric conductance oscillation condition. (a) Adaptive signals; (b) Strong-event indicator.
Table 4 summarizes the trigger behavior of each alarm channel. Unlike the fixed-threshold paths, which remain inactive throughout the fault interval, the “Adaptive: Debounce” path successfully activates the “Global Alarm” output. This result confirms that the proposed architecture can detect near-symmetric conductance oscillations based on statistical variability, even under the evaluated sensitivity-degraded condition, where the mean-offset-based fixed-threshold paths remain inactive.
Table 4.
Trigger summary for Case 3: near-symmetric conductance oscillation condition.
The reduced detection margin in this case is consistent with the small value of , indicating that the DC+ and DC− ground conductance paths remain nearly balanced. This confirms that provides a useful normalized measure of conductance asymmetry for interpreting the structural reduction in .
Across the three evaluated scenarios, the proposed multipath architecture detects fault signatures associated with mean shift, increased variance, and sensitivity-degraded conditions.
4.4. Robustness Under Power-Electronic Disturbances
The simulations in Section 4.1, Section 4.2 and Section 4.3 use the Gaussian measurement-noise model defined in (24). To further evaluate the robustness of the proposed framework against deterministic disturbances associated with power-electronic operation, an additional test was performed for Case 3, which represents the most challenging sensitivity-degraded condition among the three evaluated scenarios. The original Gaussian noise with = 50 V was retained, and the same Gaussian-noise realization was used for all disturbance profiles so that the influence of the additionally imposed deterministic components could be evaluated independently.
For this robustness test, the measurement model in (24) is extended as follows:
where denotes the neutral-point voltage obtained from the conductance model in (13) using the time-varying DC-link voltage , denotes the zero-mean Gaussian measurement noise defined in (24), and = 1 kHz. For the 60 Hz supply condition considered in this robustness test, = 720 Hz and = 1440 Hz represent the 12-pulse and higher-order rectifier-related ripple components, respectively. Their normalized amplitudes are denoted by and , with = 0.3, and the phase of the 1440 Hz component is set to . These components are introduced through the differential DC-link voltage .
The term represents switching-related high-frequency (HF) disturbances coupled to the ground-referenced measurement. The prescribed frequencies are = {2460, 2670, 2790} Hz, with phases = {1.10, 0.30, 2.00} rad. The individual amplitudes are defined as , where {0.30, 1.00, 0.45}/1.75.
These deterministic components are introduced as controlled robustness-test conditions and are not intended to reproduce a measured MV7306 disturbance spectrum. At the 1 kHz detector sampling frequency, components above the Nyquist frequency appear in the sampled signal through their corresponding discrete-time aliases. Figure 17b reports the prescribed disturbance components at their physical frequency labels, whereas their corresponding aliases at the 1 kHz detector sampling rate are analyzed in Figure 18. This extension is used only for the robustness evaluation and does not modify the quasi-steady conductance model developed in Section 2.
Figure 17.
Robustness evaluation for Case 3 under imposed power-electronic disturbances. (a) Rectifier-related DC-link ripple for the moderate and severe disturbance profiles; (b) Prescribed deterministic disturbance components shown at their prescribed physical frequencies. The 720 and 1440 Hz components are introduced through the differential DC-link voltage, whereas the HF components are coupled to the ground-referenced measurement; (c) response and detection thresholds under the severe disturbance profile; (d) “Adaptive: Debounce” and “Global Alarm” responses.
Figure 18.
Frequency-domain characteristics of the causal signal-conditioning stage. (a) Combined magnitude response of the second-order Butterworth low-pass and 10-sample moving-average filters, with the alias frequencies corresponding to the disturbance components evaluated in Section 4.4; (b) Combined causal group delay.
Three disturbance profiles were considered. The Gaussian-only profile corresponds to the original Case 3 simulation, with = = 0 and = 0. For the moderate profile, = 0.005, corresponding to a 25-V peak amplitude of the 720 Hz 12-pulse component for the nominal 5 kV DC-link voltage, and = 25 V. For the severe profile, = 0.010, corresponding to a 50-V peak amplitude of the 720 Hz component, and = 50 V.
Figure 17 illustrates the imposed disturbances and the resulting detector response for Case 3. Figure 17a,b shows the rectifier-related DC-link ripple and the prescribed deterministic disturbance components, respectively. Figure 17c,d shows the response and alarm behavior under the severe profile. Despite the added disturbances, the “Adaptive: Debounce” path retains the same four alarm episodes observed under the Gaussian-only condition, and the corresponding “Global Alarm” behavior remains unchanged. Using = 1.2 from Section 3.3.3 and the nominal = 250 V, the freeze condition corresponds to > 300 V. No activation of the freeze mode was observed under the severe disturbance profile, indicating that the imposed disturbances did not spuriously trigger the freeze logic.
Table 5 summarizes the robustness results. The detection delay for Case 3 is 0.141 s under the Gaussian-only condition and remains 0.141 s under both the moderate and severe disturbance profiles at the 1 ms simulation resolution. The numbers of adaptive and global alarm episodes also remain four in all three conditions. These results indicate that, within the evaluated disturbance levels, the imposed rectifier-related ripple and HF-coupled disturbances do not alter the detection outcome, and no change in detection delay is observed at the simulation resolution considered.
Table 5.
Robustness of the proposed method for Case 3 under imposed power-electronic disturbances.
To further characterize and justify the causal signal-conditioning stage, Figure 18 shows the combined frequency response of the second-order Butterworth low-pass filter and the 10-sample moving-average filter. The 100 Hz cutoff and 10 ms averaging window provide a practical trade-off between preserving the lower-frequency variations associated with ground faults and suppressing higher-frequency disturbances while maintaining a short causal delay. At = 1 kHz, the disturbance components at 720, 1440, 2460, 2670, and 2790 Hz considered in Section 4.4 appear at alias frequencies of 280, 440, 460, 330, and 210 Hz, respectively. The combined filter attenuates these components by 45.20, 68.59, 75.84, 49.20, and 41.20 dB, respectively. Because the cascaded filter does not have linear phase owing to the Butterworth stage, its delay is characterized using the frequency-dependent group delay. As shown in Figure 18b, the combined group delay is 6.676 ms at DC and reaches a maximum of 7.250 ms near 70.29 Hz, while remaining between 4.734 and 5.197 ms at the five alias frequencies. The high-frequency components used in this analysis are prescribed robustness-test disturbances and are not derived from an experimentally measured MV7306 switching spectrum. These results characterize the causal preprocessing stage independently and do not redefine the detection-delay metric reported above.
4.5. Parameter Sensitivity and Robustness Analysis
The sensitivity of the fixed threshold was first evaluated over = 50–450 V in 50-V increments using the fixed-threshold baseline with a causal 50 ms debounce. Detection delay was evaluated for Cases 1 and 2, and false-alarm behavior was assessed over 295 s under a controlled non-fault operating-variation condition including temporary leakage asymmetry and a 5.0-to-4.2 kV DC-link voltage variation. Here, denotes the percentage of the evaluated non-fault duration for which an alarm is active. For comparison, the mean detection delay of Cases 1 and 2 was normalized to its value at = 250 V. As shown in Figure 19, the observed reached zero at 250 V, whereas the normalized mean delay increased to 1.306 at 300 V and Case 1 was not detected for 350 V. These results support 250 V as a practical compromise between false-alarm suppression and detection sensitivity.
Figure 19.
Sensitivity of the fixed-threshold baseline to in terms of normalized mean detection delay and observed under the controlled non-fault operating-variation condition.
The adaptive parameters were subsequently evaluated using a one-at-a-time sensitivity analysis for , , the statistical-window duration , and the freeze-window duration , while all other detector parameters were maintained at their nominal values defined in Section 3.3.2, Section 3.3.3 and Section 3.3.4. In particular, = 1.2, = 1.0, the debounce interval was 50 ms, and the fixed-latch duration was 0.10 s. The evaluated ranges were = 1.5–3.3, = 0.10–0.90, = 0.10–0.50 s, and = 0.02–0.10 s. Because the parameters affect different functions of the adaptive detector, and were evaluated using the variance-dominant Case 2, whereas and were evaluated using the sensitivity-degraded Case 3. Detection delay was defined using the causal 50 ms debounce-confirmation time. False-alarm behavior was evaluated over an aggregate 295 s of healthy-operation simulations using independent noise realizations.
To compare the sensitivity trends across the two scenarios without depending on the absolute delay of a particular noise realization, the detection delay was normalized by the value obtained at the nominal parameter setting for the corresponding scenario. Here, denotes the causal detection delay measured from fault inception to the first confirmed Global Alarm, and denotes the corresponding delay obtained using the nominal parameter set ( = 2.4, = 0.35, = 0.30 s and = 0.05 s). The normalized detection delay is defined as . Thus, = 1 represents the nominal response for the corresponding scenario, whereas values greater than unity indicate an increase in detection delay. Table 6 summarizes the resulting parameter sensitivity and practical design regions.
Table 6.
Sensitivity and robustness of the adaptive detector parameters.
The results indicate that and have little influence on detection performance within the evaluated ranges, whereas an excessively short significantly increases the detection delay. The strongest parameter dependence is observed for . Small values reduce the physical lower bound of the adaptive threshold and increase pre-debounce threshold-crossing susceptibility, whereas large values substantially delay detection of the near-symmetric fault signature. No false Global Alarm was observed for any evaluated parameter setting during the 295 s healthy-operation assessment. Accordingly, the selected values = 2.4, = 0.35, = 0.30 s, = 0.05 s lie within practical robust operating regions rather than representing isolated tuned points.
The sensitivity analysis is not intended to identify a unique optimum for each parameter. Instead, it demonstrates that the adopted settings provide stable detection performance over finite parameter neighborhoods while avoiding the degraded behavior observed at the boundaries of the tested ranges.
4.6. Comparison with Representative Ground Fault Detection Methods
Table 7 compares the proposed framework with representative ground fault detection methods reported for ungrounded, IT-grounded, converter-fed, and MVDC systems. The selected methods include active signal-injection approaches [5,7,21], a decentralized model-based method for MVDC shipboard power systems [27], and a recent grounding-voltage-based method for converter-interfaced DC systems [42]. Because these methods differ substantially in system topology, available measurements, hardware requirements, fault types, and diagnostic objectives, their reported numerical detection times or accuracy measures are not directly comparable under the present -only simulation conditions. Accordingly, Table 7 focuses on sensing and implementation requirements, diagnostic capability, validation level, and principal limitations.
Table 7.
Literature-based comparison with representative ground fault detection methods.
Active injection methods improve the observability of high-resistance or first ground faults by deliberately exciting the system. Peña-Alzola et al. [5] combine AC signal injection with a sliding discrete Fourier transform to estimate fault impedance, whereas Liu et al. [7] increase fault leakage current through DC current injection. Park [21] employs a probe unit and analyzes the response to DC or swept-frequency AC probe voltages for both detection and location. These approaches provide enhanced diagnostic information but require dedicated injection or probing hardware. In contrast, the decentralized model-based approach in [27] achieves detection and isolation of multiple converter and cable faults in MVDC shipboard systems using protection-zone models and observer banks. The recent method in [42] uses grounding-related voltage characteristics, frequency analysis, and converter switching behavior to detect, locate, and estimate the severity of ground faults in converter-interfaced DC systems.
Compared with the methods in Table 7, the proposed framework is deliberately focused on reducing the sensing and implementation burden. It uses only the signal already available in the investigated MV7306 drive and requires neither active signal injection nor additional sensing hardware. This reduced sensing burden is achieved at the expense of fault-location capability; individual grounding locations cannot be identified from alone. Thus, the principal contribution lies not in extending fault-isolation capability but in robust ground fault detection using a single neutral-point voltage measurement under fault signatures with different temporal and statistical characteristics.
For a controlled quantitative assessment, Table 8 retains the fixed-threshold method as an internal benchmark under exactly the same signal-conditioning and fault-scenario conditions. The baseline corresponds to the “Fixed: Debounce” path and uses the same conditioned magnitude feature , fixed threshold , and 50 ms debounce as the proposed framework, but without adaptive thresholding or latch processing. False-positive behavior under healthy operation is also compared over an aggregate 295 s evaluation period. This comparison therefore isolates the performance gain provided by the additional detection mechanisms of the proposed architecture and is not intended as a substitute for the external literature comparison in Table 7.
Table 8.
Controlled quantitative comparison between the fixed-threshold baseline and the proposed method. (A) Scenario comparison; (B) Overall performance summary.
Under identical test conditions, the proposed method detects all three evaluated scenarios, whereas the fixed-threshold baseline fails to detect the near-symmetric Case 3. For the two scenarios detected by both methods, the mean detection delay decreases from 0.822 s to 0.622 s, corresponding to a 24.3% reduction. Thus, Table 7 and Table 8 provide complementary perspectives: Table 7 positions the proposed method relative to representative external approaches, whereas Table 8 quantifies the incremental benefit of the proposed multipath architecture under controlled simulation conditions.
5. Conclusions
In this paper, the neutral-point voltage characteristics under ground fault conditions are analyzed using a physics-based mathematical model of the 5 kV DC-link of the GE MV7306 high-voltage AC drive. Based on the equivalent conductance model, a closed-form expression for is derived by applying Kirchhoff’s current law (KCL) to the DC-link equivalent circuit. The derived formulation shows that is governed by the conductance imbalance between the positive and negative DC-link rails relative to the total ground-referenced conductance. A normalized conductance asymmetry index is used to characterize the structural suppression of under balanced and near-balanced conditions. Furthermore, the nonlinear single-pole ground fault response is characterized using logarithmic resistance sensitivity, whose maximum occurs at the characteristic transition condition . As the fault conductance becomes dominant beyond this transition region, progressively approaches its saturation limit. These characteristics follow directly from the derived conductance model and provide the mathematical basis for interpreting the neutral-point voltage response under different grounding conditions.
The analytical model is further linked to fixed-threshold selection by relating the voltage threshold to the corresponding fault conductance and fault resistance boundaries. Based on these characteristics, a multipath ground fault detection architecture is developed using only the neutral-point voltage signal already available in the MV7306 drive measurement system, without requiring additional sensors. The proposed structure includes a fixed-threshold protection path and a robust statistics-based adaptive-threshold path arranged in parallel, enabling complementary responses to fault signatures with different temporal and statistical characteristics. The freeze–track mechanism, debounce validation, and latch preservation are incorporated while maintaining a relatively simple implementation structure.
Three representative scenarios are evaluated using circuit-model-based simulations: mean-shift-dominant, variance-dominant, and near-symmetric conductance oscillation conditions. The proposed framework successfully detected all three scenarios, with detection delays of 1.213, 0.031, and 0.141 s after fault inception, respectively. In the near-symmetric conductance oscillation scenario, the fixed-threshold paths remained inactive, whereas the adaptive path generated four alarm episodes with a total duration of 0.391 s. These results demonstrate that the adaptive path remains responsive under the evaluated near-symmetric condition despite the structural reduction in the neutral-point voltage response.
A quantitative comparison with the fixed-threshold baseline further demonstrates the complementary detection capability of the proposed framework. For the two scenarios detected by both methods, the mean detection delay decreased from 0.822 s for the fixed-threshold baseline to 0.622 s for the proposed method, corresponding to a 24.3% reduction. Furthermore, the proposed method detected all three evaluated scenarios, whereas the fixed-threshold baseline detected two of the three scenarios and did not detect the near-symmetric conductance oscillation condition.
Unlike approaches focused primarily on system-level ground fault protection, this study targets the internal DC-link of power-electronic-based AC drives and mathematically formulates the relationship between the neutral-point voltage and the equivalent pole-to-ground conductance structure. Although the case study considers a 5 kV marine AC drive with a 12-pulse rectifier, the underlying principle can be extended to other floating or high-impedance-ground-referenced DC-link drive systems that provide an accessible neutral point or equivalent DC-link reference voltage. Different DC-link voltage levels primarily affect the magnitude of , and the fixed and adaptive thresholds can be rescaled according to the corresponding system parameters.
This study focuses on physics-based mathematical modeling and circuit-model-based simulation. The proposed framework incorporates causal low-pass and moving-average filtering together with robust adaptive-threshold estimation based on the median and MAD to reduce sensitivity to measurement noise and statistical outliers. The filter parameters and window lengths can also be rescaled for different sampling frequencies while preserving equivalent time-domain characteristics. Nevertheless, experimental validation under actual operating conditions, including measurement noise, switching ripple, full drive operating transients such as motor-load changes and inverter startup, DC-link capacitor dynamics, parameter uncertainties, and varying sampling rates, remains an important subject for future research.
Balanced multipath grounding should also be regarded as a limiting condition of the present single-measurement approach. When multiple grounding paths exist on both the DC+ and DC− rails with comparable equivalent conductances, the conductance imbalance can become small, and the corresponding response can be structurally suppressed, thereby reducing the available detection margin. Under such conditions, individual grounding locations cannot be uniquely identified from alone. Future studies will therefore investigate experimental validation and the incorporation of additional measurable information or model-based conductance estimation to improve directional discrimination and fault localization under balanced multipath grounding conditions.
Author Contributions
Conceptualization, J.L., H.Z., Y.S. and Y.L.; methodology, J.L., K.R., H.Z., J.A. and Y.L.; software, J.L., K.R., J.A. and Y.L.; validation, J.L., Y.S., J.A. and Y.L.; formal analysis, K.R., Y.S. and Y.L.; investigation, J.L., K.R. and Y.L.; resources, J.L., Y.S. and Y.L.; data curation, K.R. and Y.S.; writing—original draft preparation, J.L., H.Z. and Y.L.; writing—review and editing, J.L., H.Z., Y.S. and Y.L.; visualization, J.L., K.R. and H.Z.; supervision, Y.S. and Y.L.; project administration, Y.L.; funding acquisition, J.L. All authors have read and agreed to the published version of the manuscript.
Funding
This research was supported by the Korea Institute of Marine Science & Technology Promotion (KIMST), funded by the Ministry of Oceans and Fisheries (RS-2025-02304428, PM65261).
Data Availability Statement
The datasets used and/or analyzed during the current study are available from the corresponding author upon reasonable request.
Conflicts of Interest
The authors declare no conflicts of interest.
References
- Pucci, M.; Accetta, A.; Di Piazza, M.C.; Luna, M.; La Tona, G.; Pietra, A. Electric Ship Propulsion Improvement by Increasing Efficiency of Adjustable-Speed Motor Drives. In Proceedings of the 2018 IEEE International Conference on Environment and Electrical Engineering and 2018 IEEE Industrial and Commercial Power Systems Europe (EEEIC/I&CPS Europe), Palermo, Italy, 12–15 June 2018; pp. 1–5. [Google Scholar] [CrossRef] [Scilit]
- Kirtley, J.L.; Banerjee, A.; Englebretson, S. Motors for Ship Propulsion. Proc. IEEE 2015, 103, 2320–2332. [Google Scholar] [CrossRef] [Scilit]
- Dimitrov, L.; Kanturska, S. Features in the Selection and Operation of AC Motors for Electric Propulsion System in Ship. In Proceedings of the 2017 15th International Conference on Electrical Machines, Drives and Power Systems (ELMA), Sofia, Bulgaria, 1–3 June 2017; pp. 228–232. [Google Scholar] [CrossRef] [Scilit]
- Sulligoi, G.; Vicenzutti, A.; Menis, R. All-Electric Ship Design: From Electrical Propulsion to Integrated Electrical and Electronic Power Systems. IEEE Trans. Transp. Electrif. 2016, 2, 507–521. [Google Scholar] [CrossRef] [Scilit]
- Peña-Alzola, R.; Sztykiel, M.; Jones, C.E.; Norman, P.J.; Moore, G.; Pou, J. First-Fault Detection in DC Distribution with IT Grounding Based on Sliding Discrete Fourier-Transform. IEEE Trans. Power Electron. 2021, 36, 3649–3654. [Google Scholar] [CrossRef] [Scilit]
- Sarangi, R.R.; Ray, P.K.; Mohanty, A.; Khadem, S.; Patra, S. Enhancing DC Microgrid Security: A Comprehensive Review of Protection Challenges and Solutions. Int. J. Electr. Power Energy Syst. 2025, 168, 110687. [Google Scholar] [CrossRef] [Scilit]
- Liu, Y.-C.; Chang, E.-C.; Lee, Y.-L.; Lin, Y.-Z. Detection of Ground Insulation Faults in Ungrounded DC Power Supply Systems by Using a DC Current Injection Method. Energy Procedia 2019, 156, 349–355. [Google Scholar] [CrossRef] [Scilit]
- Somani, A.; Johnson, B.K.; Hess, H.L. Evaluation of Grounding and Protection Methods for a Shipboard Power System. In Proceedings of the 2005 IEEE Electric Ship Technologies Symposium, Philadelphia, PA, USA, 25–27 July 2005; pp. 117–124. [Google Scholar] [CrossRef] [Scilit]
- Jullien, F.; Héritier, I. The IT Earthing System (Unearthed Neutral) in LV; Cahier Technique No. 178; Schneider Electric: Rueil-Malmaison, France, 1999. [Google Scholar]
- Novak, T.; Kohler, J.L. Technological Innovations in Deep Coal Mine Power Systems. IEEE Trans. Ind. Appl. 1998, 34, 196–204. [Google Scholar] [CrossRef] [Scilit]
- Zeng, X.; Li, K.K.; Chan, W.L.; Su, S.; Wang, Y. Ground-Fault Feeder Detection with Fault-Current and Fault-Resistance Measurement in Mine Power Systems. IEEE Trans. Ind. Appl. 2008, 44, 424–429. [Google Scholar] [CrossRef] [Scilit]
- Meijer, C.; van der Ven, J.-K.; Ross, R. EMC and Electrical Safety on Board Ships: How EMI Filters Undermine the Protection Against Electric Shock. In Proceedings of the 2013 International Symposium on Electromagnetic Compatibility (EMC Europe), Brugge, Belgium, 2–6 September 2013; pp. 1034–1038. Available online: https://ieeexplore.ieee.org/document/6653454 (accessed on 16 October 2026).
- Lubich, D.H. High-Resistance Grounding and Fault Finding on Three-Phase Three-Wire (Delta) Power Systems. In Proceedings of the 1997 IEEE Annual Textile, Fiber and Film Industry Technical Conference (TEXCON), Greenville, SC, USA, 6–8 May 1997; pp. 10–14. [Google Scholar] [CrossRef] [Scilit]
- Nelson, J.P.; Sen, P.K. High-Resistance Grounding of Low-Voltage Systems: A Standard for the Petroleum and Chemical Industry. IEEE Trans. Ind. Appl. 1999, 35, 941–948. [Google Scholar] [CrossRef] [Scilit]
- Das, J.C.; Osman, R.H. Grounding of AC and DC Low Voltage and Medium-Voltage Drive Systems. IEEE Trans. Ind. Appl. 1998, 34, 205–216. [Google Scholar] [CrossRef]
- Chen, Z.; Li, X.; Yang, C.; Peng, T.; Yang, C.; Karimi, H.R.; Gui, W. A Data-Driven Ground Fault Detection and Isolation Method for Main Circuit in Railway Electrical Traction System. ISA Trans. 2019, 87, 264–271. [Google Scholar] [CrossRef] [Scilit]
- Li, Y.; Xu, J.; Wang, P.; Li, G. Research on Arc Extinguishing Characteristics of Single-Phase Grounding Fault in Distribution Network. Energies 2025, 18, 256. [Google Scholar] [CrossRef] [Scilit]
- Li, Y.; Meng, X.; Song, X. Application of Signal Processing and Analysis in Detecting Single Line-to-Ground (SLG) Fault Location in High-Impedance Grounded Distribution Network. IET Gener. Transm. Distrib. 2016, 10, 382–389. [Google Scholar] [CrossRef] [Scilit]
- Wang, X.; Zhang, H.; Shi, F.; Wu, Q.; Terzija, V.; Xie, W. Location of Single-Phase-to-Ground Faults in Distribution Networks Based on Synchronous Transients Energy Analysis. IEEE Trans. Smart Grid 2020, 11, 774–785. [Google Scholar] [CrossRef] [Scilit]
- ABB Marine Academy. H869 HV Power Distribution System Course; Course Material; ABB: Singapore, 2014. [Google Scholar]
- Park, J.D. Ground Fault Detection and Location for Ungrounded DC Traction Power Systems. IEEE Trans. Veh. Technol. 2015, 64, 5667–5676. [Google Scholar] [CrossRef] [Scilit]
- Li, B.; Chen, D.; He, J.; Wang, C.; Song, J.; Lyu, H. Fault Analysis and Protection in Flexible DC Traction Power Supply System. IEEE Trans. Transp. Electrif. 2024, 10, 5599–5613. [Google Scholar] [CrossRef] [Scilit]
- Bayati, N.; Balouji, E.; Baghaee, H.R.; Hajizadeh, A.; Soltani, M.; Lin, Z.; Savaghebi, M. Locating High-Impedance Faults in DC Microgrid Clusters Using Support Vector Machines. Appl. Energy 2022, 308, 118338. [Google Scholar] [CrossRef] [Scilit]
- Gupta, A.; Sarangi, S.; Singh, A.K. A Local Fault Detection Technique for DC Microgrid Using DC Components. In Proceedings of the 2025 IEEE 5th International Conference on Sustainable Energy and Future Electric Transportation (SEFET), Jaipur, India, 9–12 July 2025; pp. 1–6. [Google Scholar] [CrossRef] [Scilit]
- Li, W.; Han, H.; Sun, Y.; Chen, S.; Liu, H.; Zheng, X. A Novel Fault Diagnosis Scheme Based on Local Fault Currents for DC Microgrids. IEEE Trans. Power Deliv. 2025, 40, 570–583. [Google Scholar] [CrossRef] [Scilit]
- Ciezki, J.G.; Ashton, R.W. Selection and Stability Issues Associated with a Navy Shipboard DC Zonal Electric Distribution System. IEEE Trans. Power Deliv. 2000, 15, 665–669. [Google Scholar] [CrossRef] [Scilit]
- Wang, T.; Liu, W.; Hao, Z. A Decentralized Model-Based Fault Detection and Isolation Scheme for MVDC Shipboard Power Systems. IEEE Trans. Transp. Electrif. 2024, 10, 7804–7815. [Google Scholar] [CrossRef] [Scilit]
- Nourmohamadi, H.; Gohil, G.; Balsara, P.T. Fault Location and Classification for MVDC Networks. IEEE J. Emerg. Sel. Top. Power Electron. 2022, 10, 589–603. [Google Scholar] [CrossRef] [Scilit]
- Karmacharya, I.M.; Gokaraju, R. Fault Location in Ungrounded Photovoltaic System Using Wavelets and ANN. IEEE Trans. Power Deliv. 2018, 33, 549–559. [Google Scholar] [CrossRef] [Scilit]
- Lee, S.H.; Lee, K.S.S. Proposal of DC Ground Fault Detection and Interruption Method in the Ungrounded Photovoltaic Array. In Proceedings of the 2019 IEEE 46th Photovoltaic Specialists Conference (PVSC), Chicago, IL, USA, 16–21 June 2019; pp. 1357–1362. [Google Scholar] [CrossRef] [Scilit]
- Gopi, G.; Sangani, P.; Ramisetti, S.; Valluru, R.; Reddy, Y.R.; Dv, B.P. The Analysis and Detection of Single-Line-to-Ground Fault in Ungrounded Solar Plant. In Proceedings of the 2021 IEEE 48th Photovoltaic Specialists Conference (PVSC), Fort Lauderdale, FL, USA, 20–25 June 2021; pp. 2043–2046. [Google Scholar] [CrossRef] [Scilit]
- Ling, Z.-B.; Cao, Y.; Ma, Q.-D.; Chen, M.; Guo, H.-F.; Li, Y.-Q. Grounding Faults of Cascade Battery Energy Storage System. In Proceedings of the 2014 IEEE PES General Meeting, National Harbor, MD, USA, 27–31 July 2014; pp. 1–5. [Google Scholar] [CrossRef] [Scilit]
- Singh, A.; Gupta, A.; Sarangi, S.; Singh, A.K. Detection of HRF in Battery Energy Storage System. In Proceedings of the 2024 23rd National Power Systems Conference (NPSC), Indore, India, 14–16 December 2024; pp. 1–6. [Google Scholar] [CrossRef] [Scilit]
- Zhao, J.; Hou, H.; Gao, Y.; Huang, Y.; Gao, S.; Lou, J. Single-Phase Ground Fault Location Method for Distribution Network Based on Traveling Wave Time-Frequency Characteristics. Electr. Power Syst. Res. 2020, 186, 106401. [Google Scholar] [CrossRef] [Scilit]
- Chen, Y.; Yin, J.; Li, Z.; Wei, R. Single-Line-to-Ground Fault Location in Resonant Grounded Systems Based on Fault Distortions. IEEE Access 2021, 9, 34325–34337. [Google Scholar] [CrossRef] [Scilit]
- Ryu, K.T.; Lee, Y.H. Ground-Fault Recognition in Low-Voltage Ships Based on Variation Analysis of Phase-to-Ground Voltage and Neutral-Point Voltage. IEEE Access 2024, 12, 123166–123176. [Google Scholar] [CrossRef] [Scilit]
- Qin, S.J. Survey on Data-Driven Industrial Process Monitoring and Diagnosis. Annu. Rev. Control 2012, 36, 220–234. [Google Scholar] [CrossRef] [Scilit]
- Lv, H.; Li, C.; Dai, J.; Zhang, Y.; Fan, Z.; Tan, Y.; Wang, D.; Xie, B. Lightweight Framework for Underground Pipeline Recognition and Spatial Localization Based on Multiview 2-D GPR Images. IEEE Trans. Geosci. Remote Sens. 2025, 63, 1–15. [Google Scholar] [CrossRef] [Scilit]
- GE Energy Power Conversion. MV7000 NPP (3 kV) User Manual, Section 5: Protection and Diagnostics; GE Energy Power Conversion: Boston, MA, USA, 2013. [Google Scholar]
- Chen, L. Beyond External Constraints: The Missing Dimension of AI Governance. SSRN Electron. J. 2026, 1–45. [Google Scholar] [CrossRef] [Scilit]
- Wu, X.; Wang, H.; Zhang, Y.; Zou, B.; Hong, H. A Tutorial-Generating Method for Autonomous Online Learning. IEEE Trans. Learn. Technol. 2024, 17, 1558–1567. [Google Scholar] [CrossRef] [Scilit]
- Blázquez-Campanon, A.; Pérez-García, J.M.; Mahtani, K.; Eguía, P.; Larruskain, M.; Guerrero, J.M. Ground Fault Location and Severity Estimation Method for DC/DC Converters. IET Power Electron. 2026, 19, e70204. [Google Scholar] [CrossRef] [Scilit]
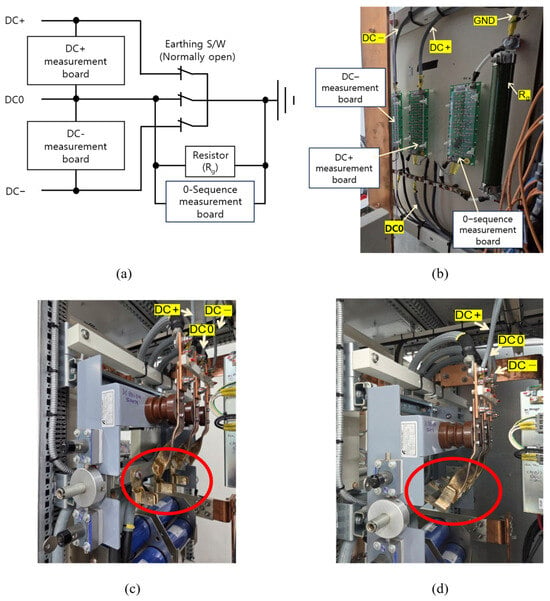
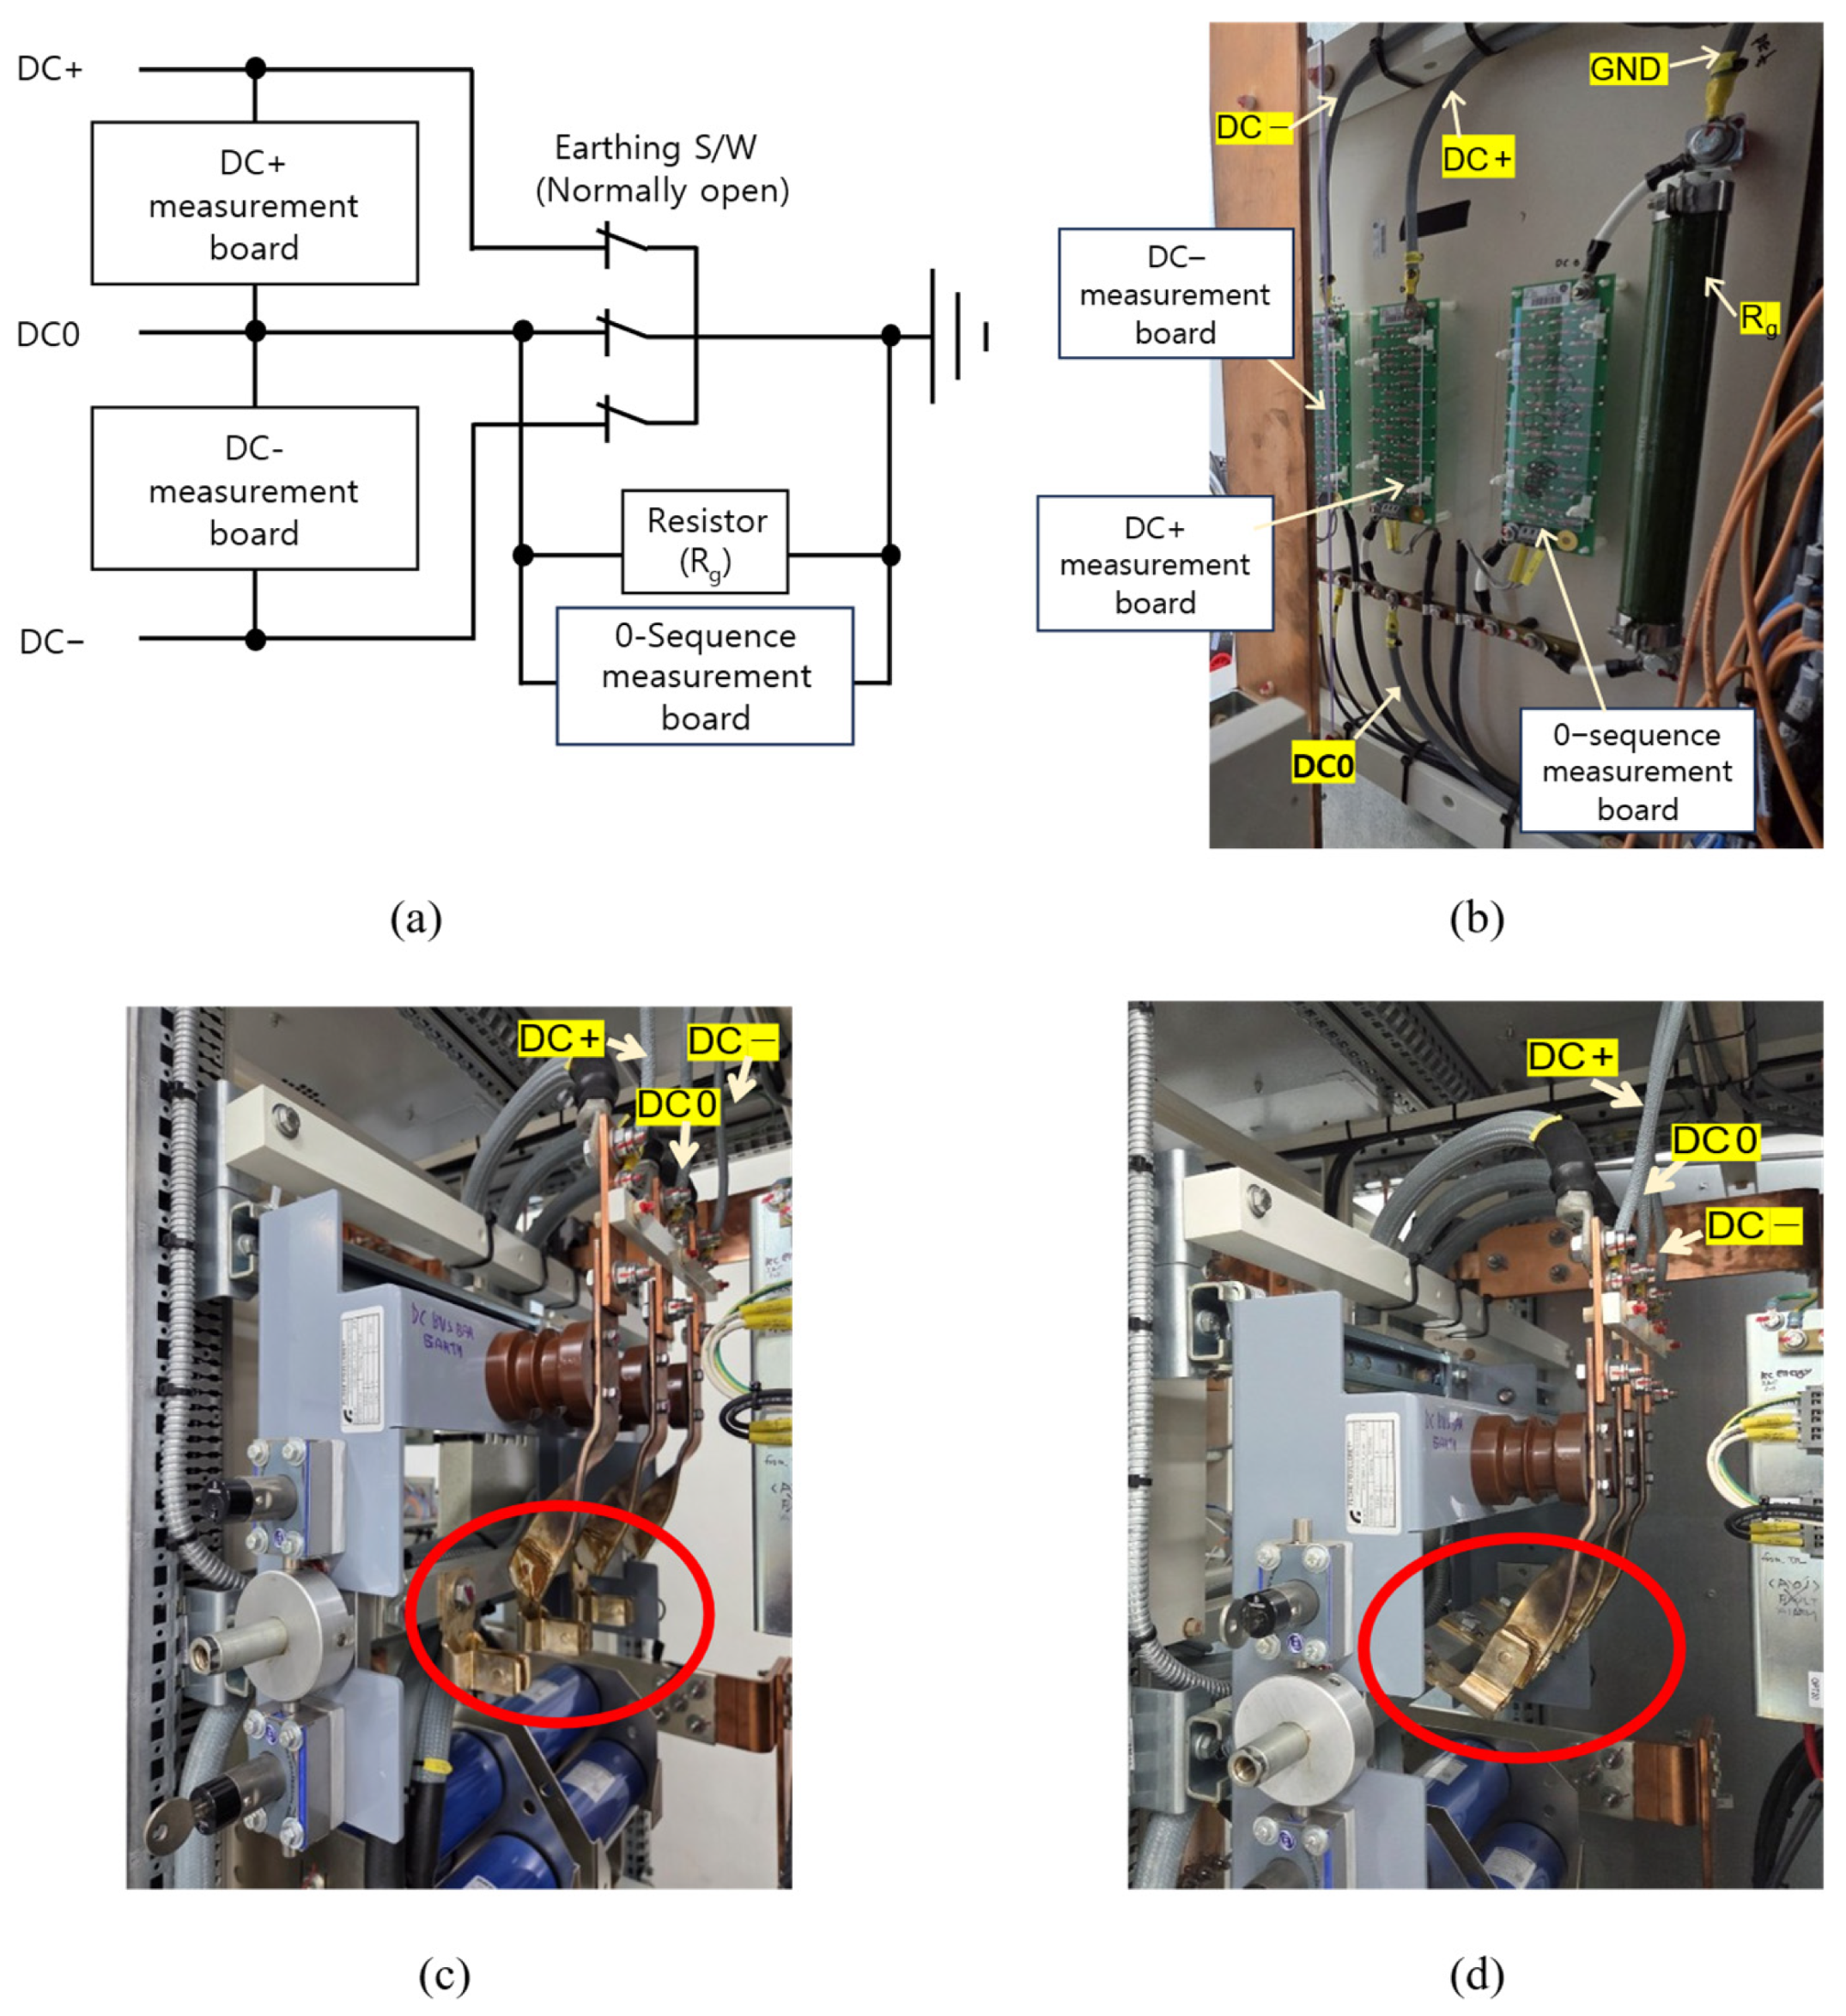
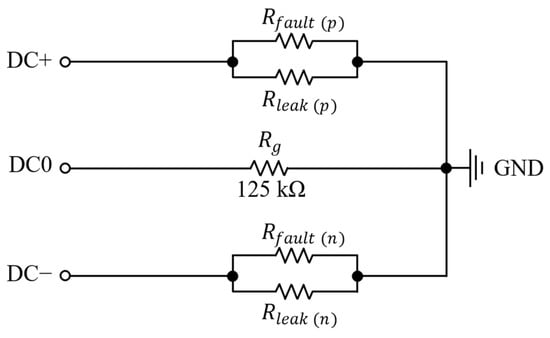
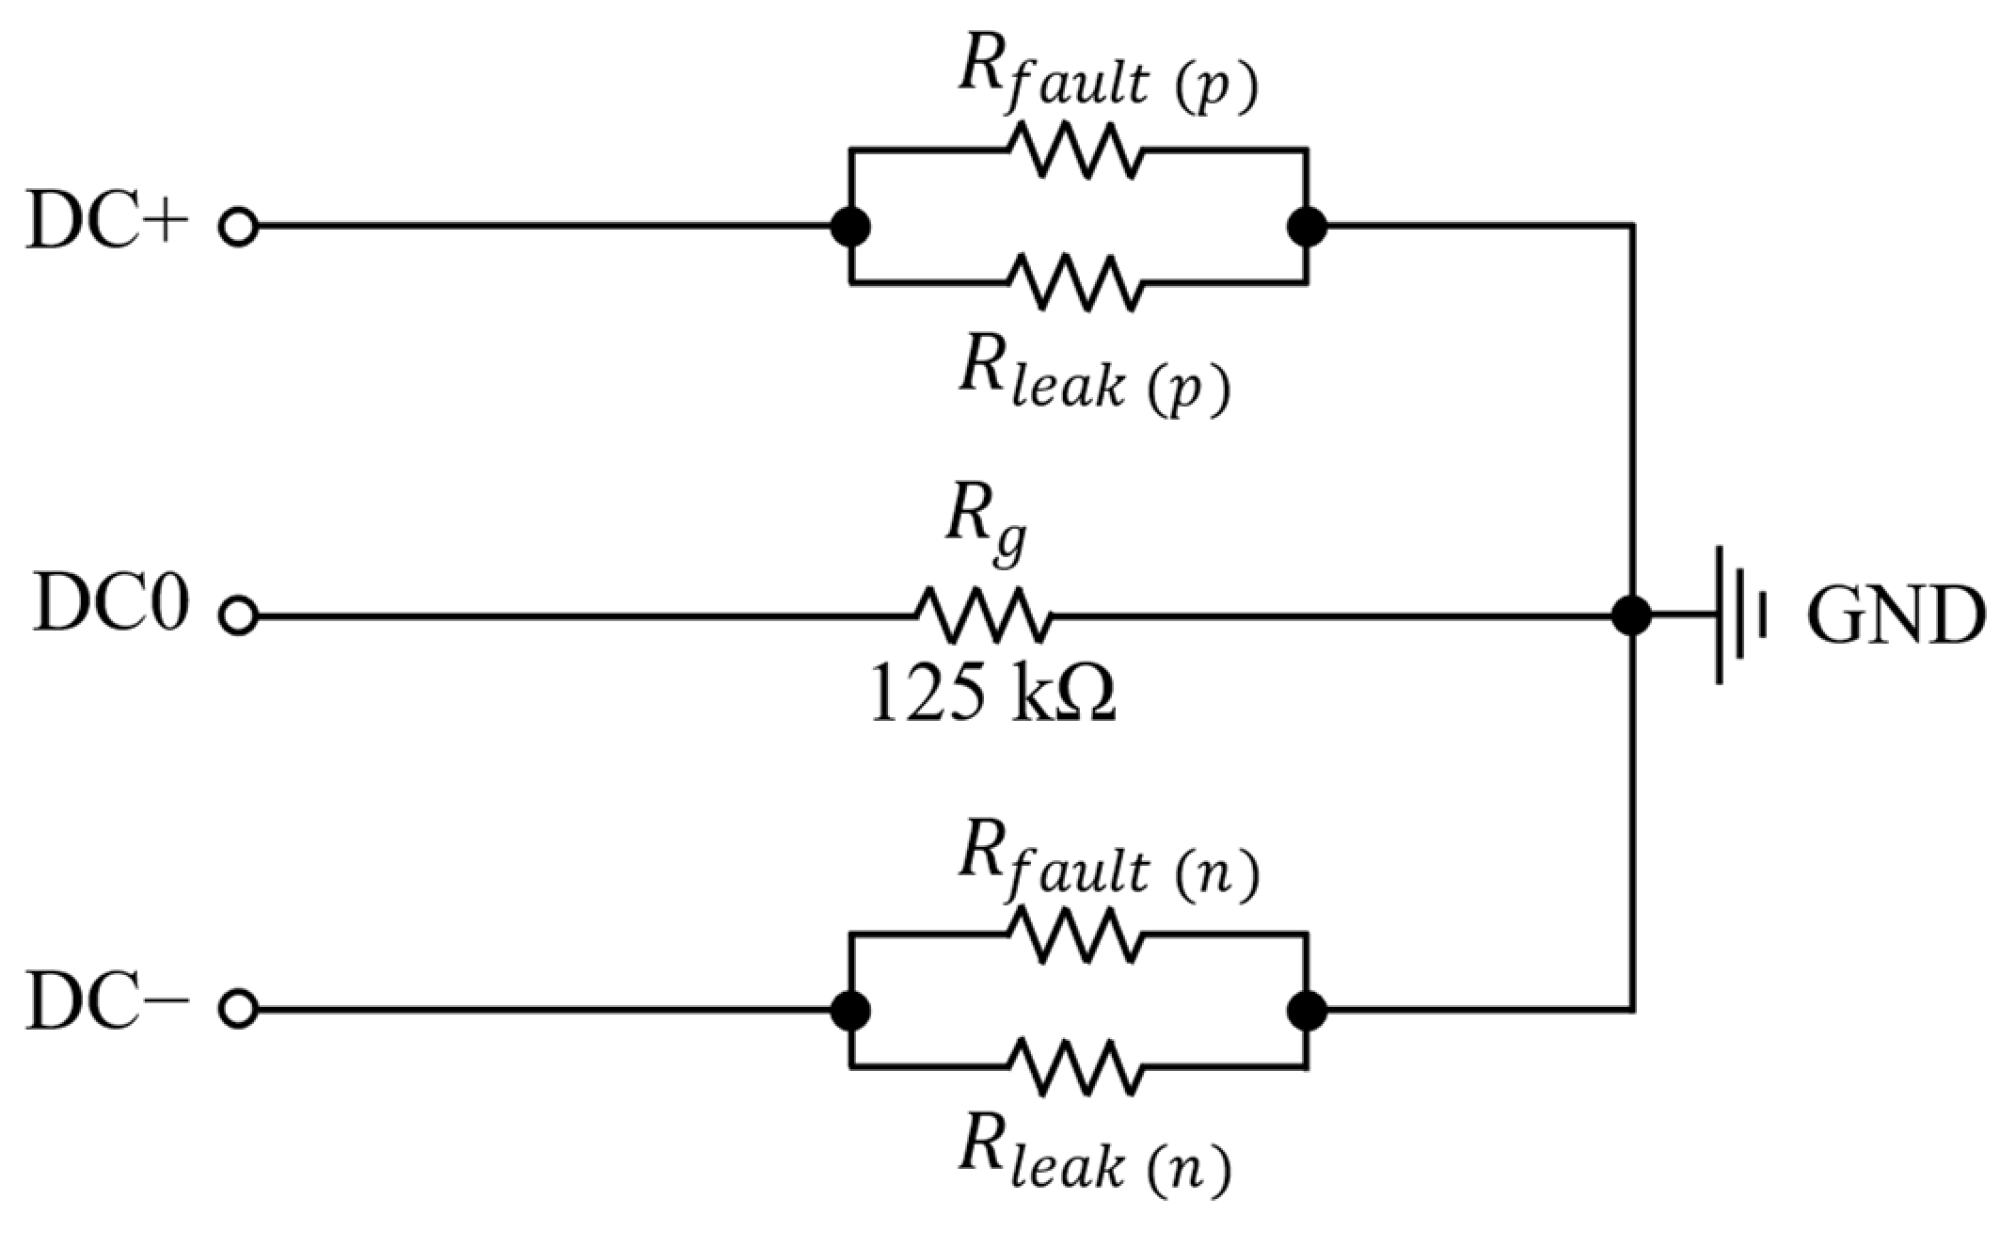
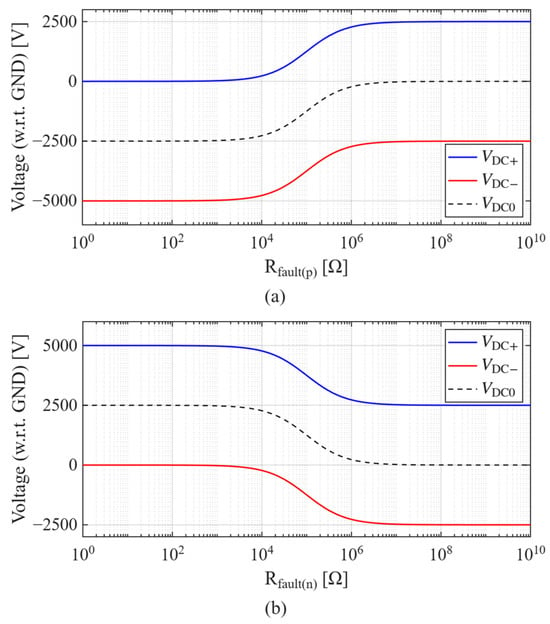
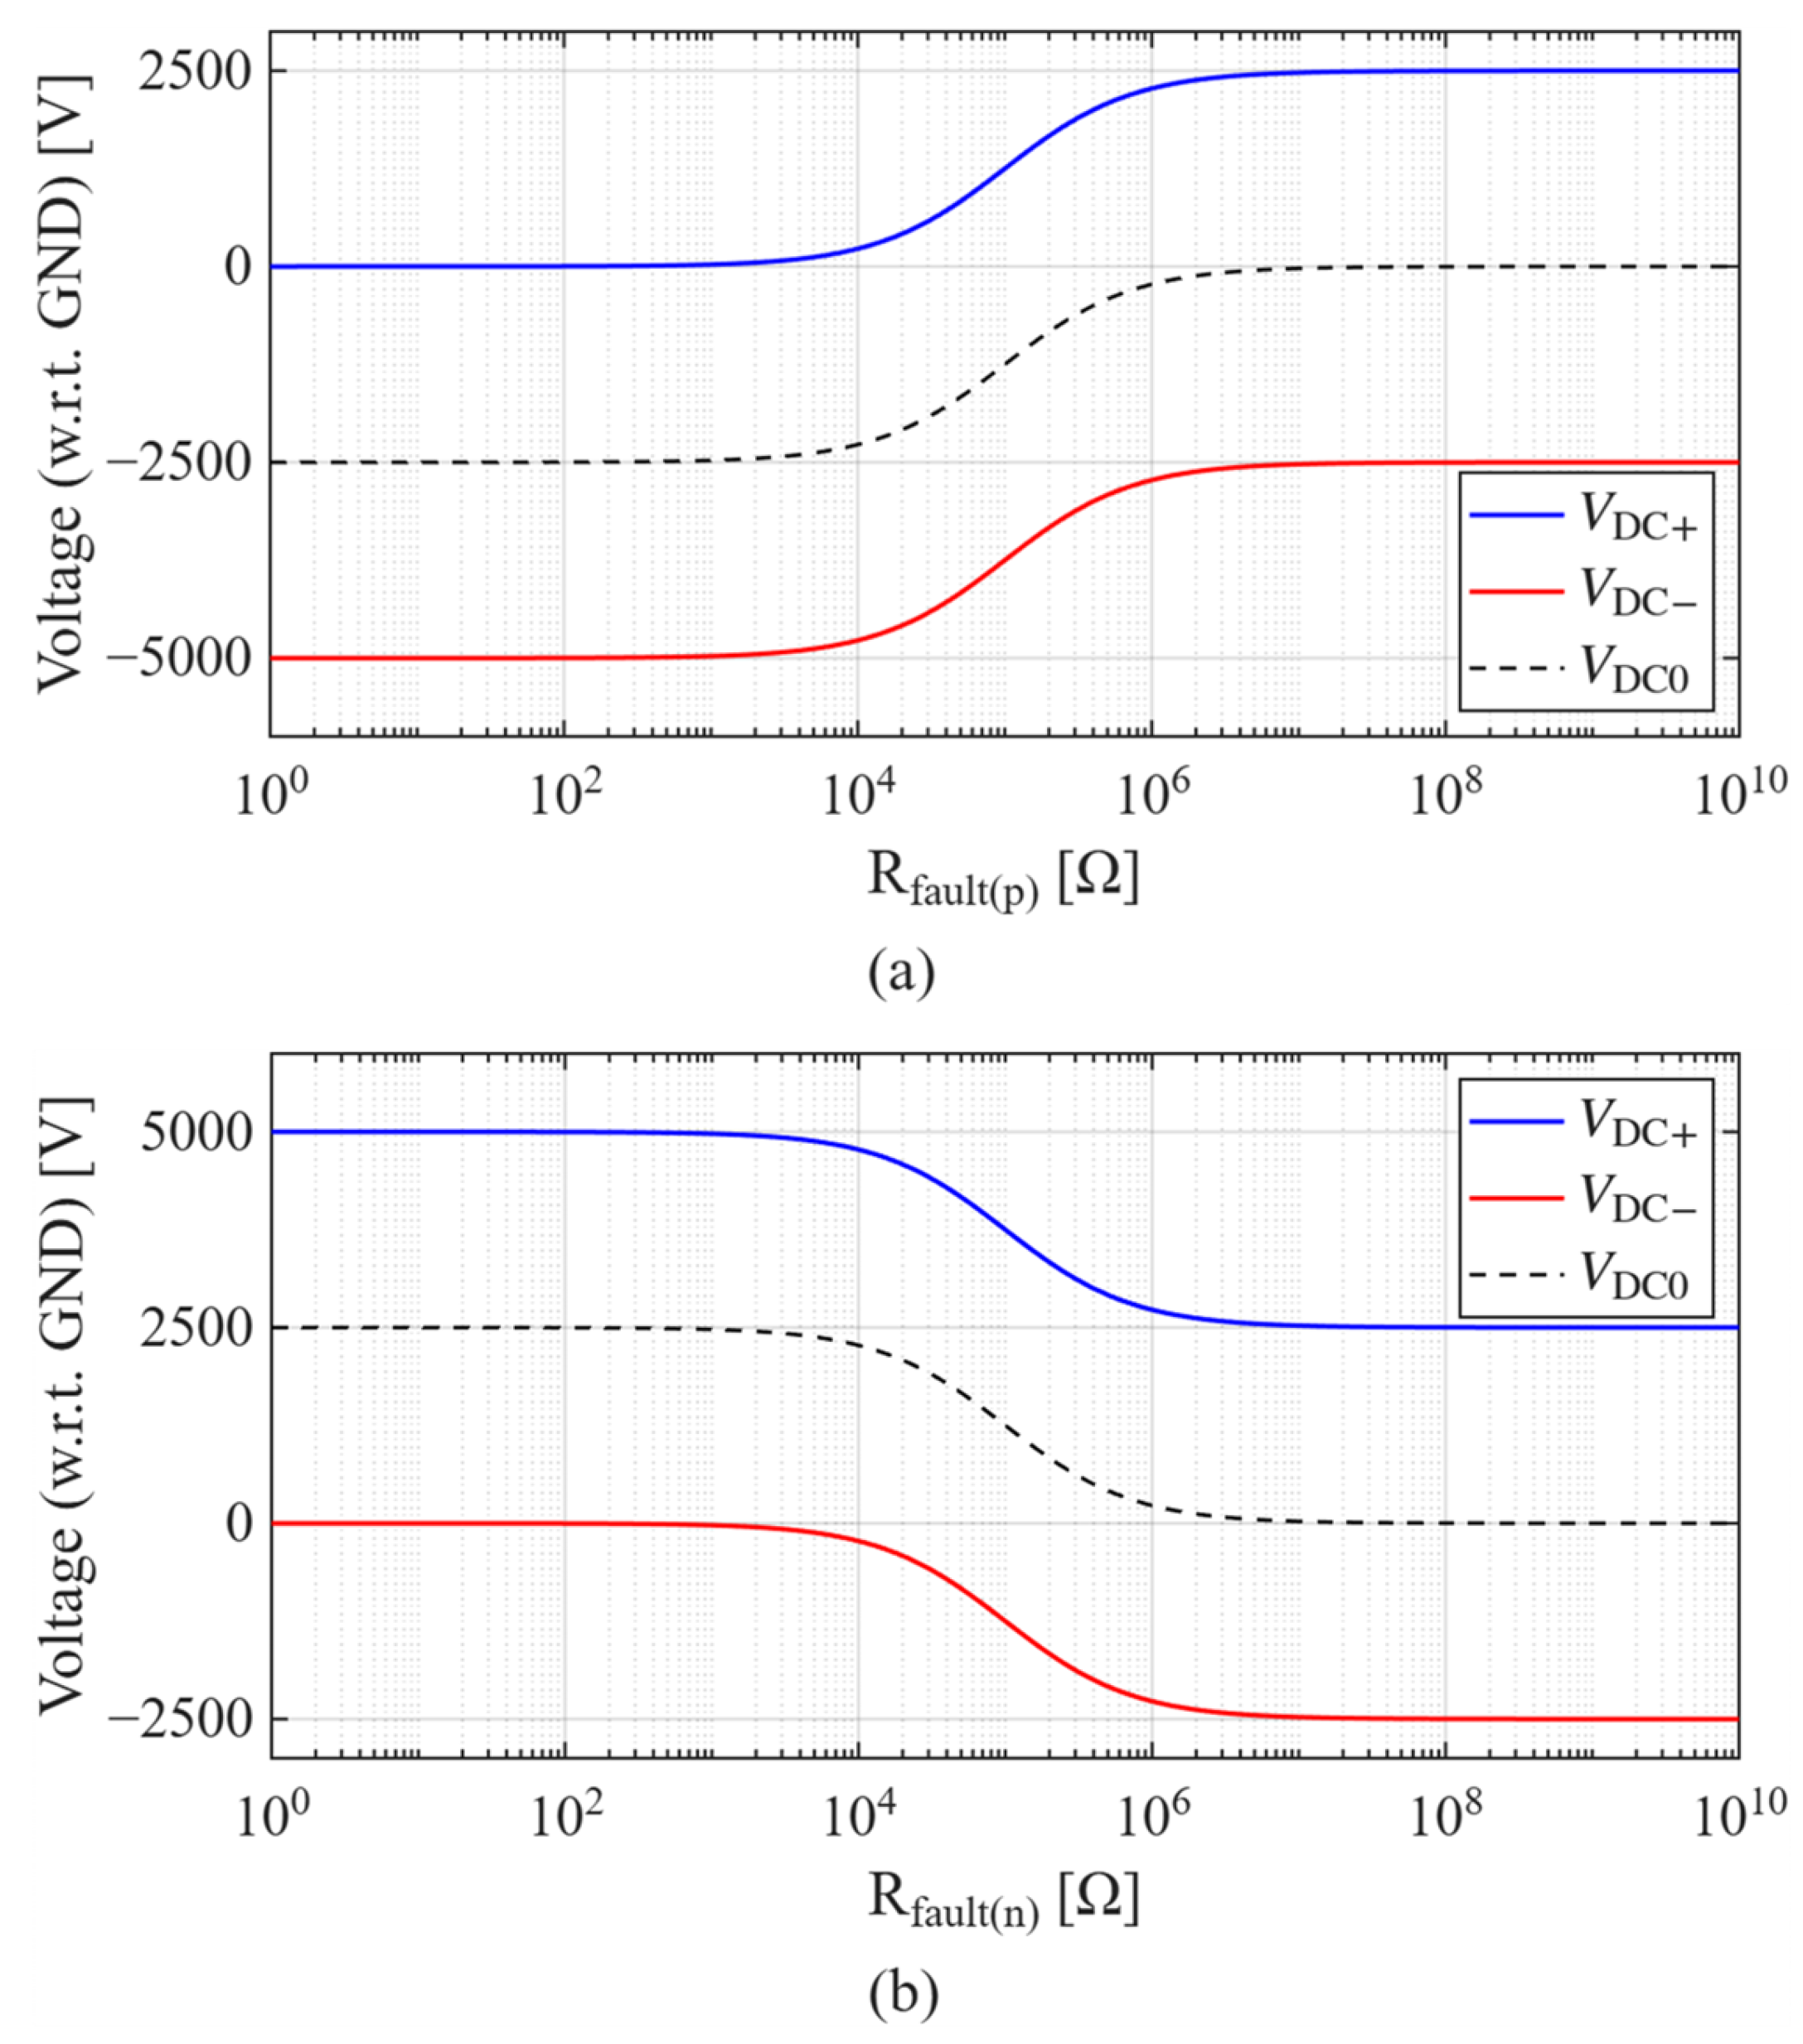
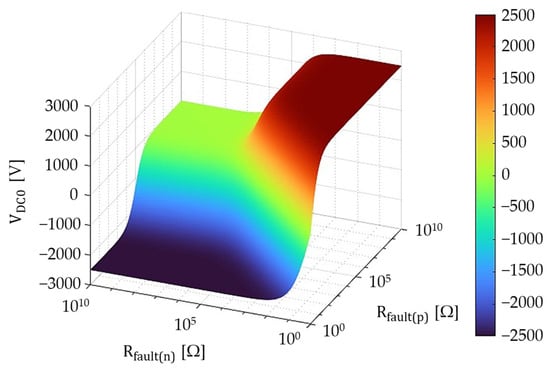
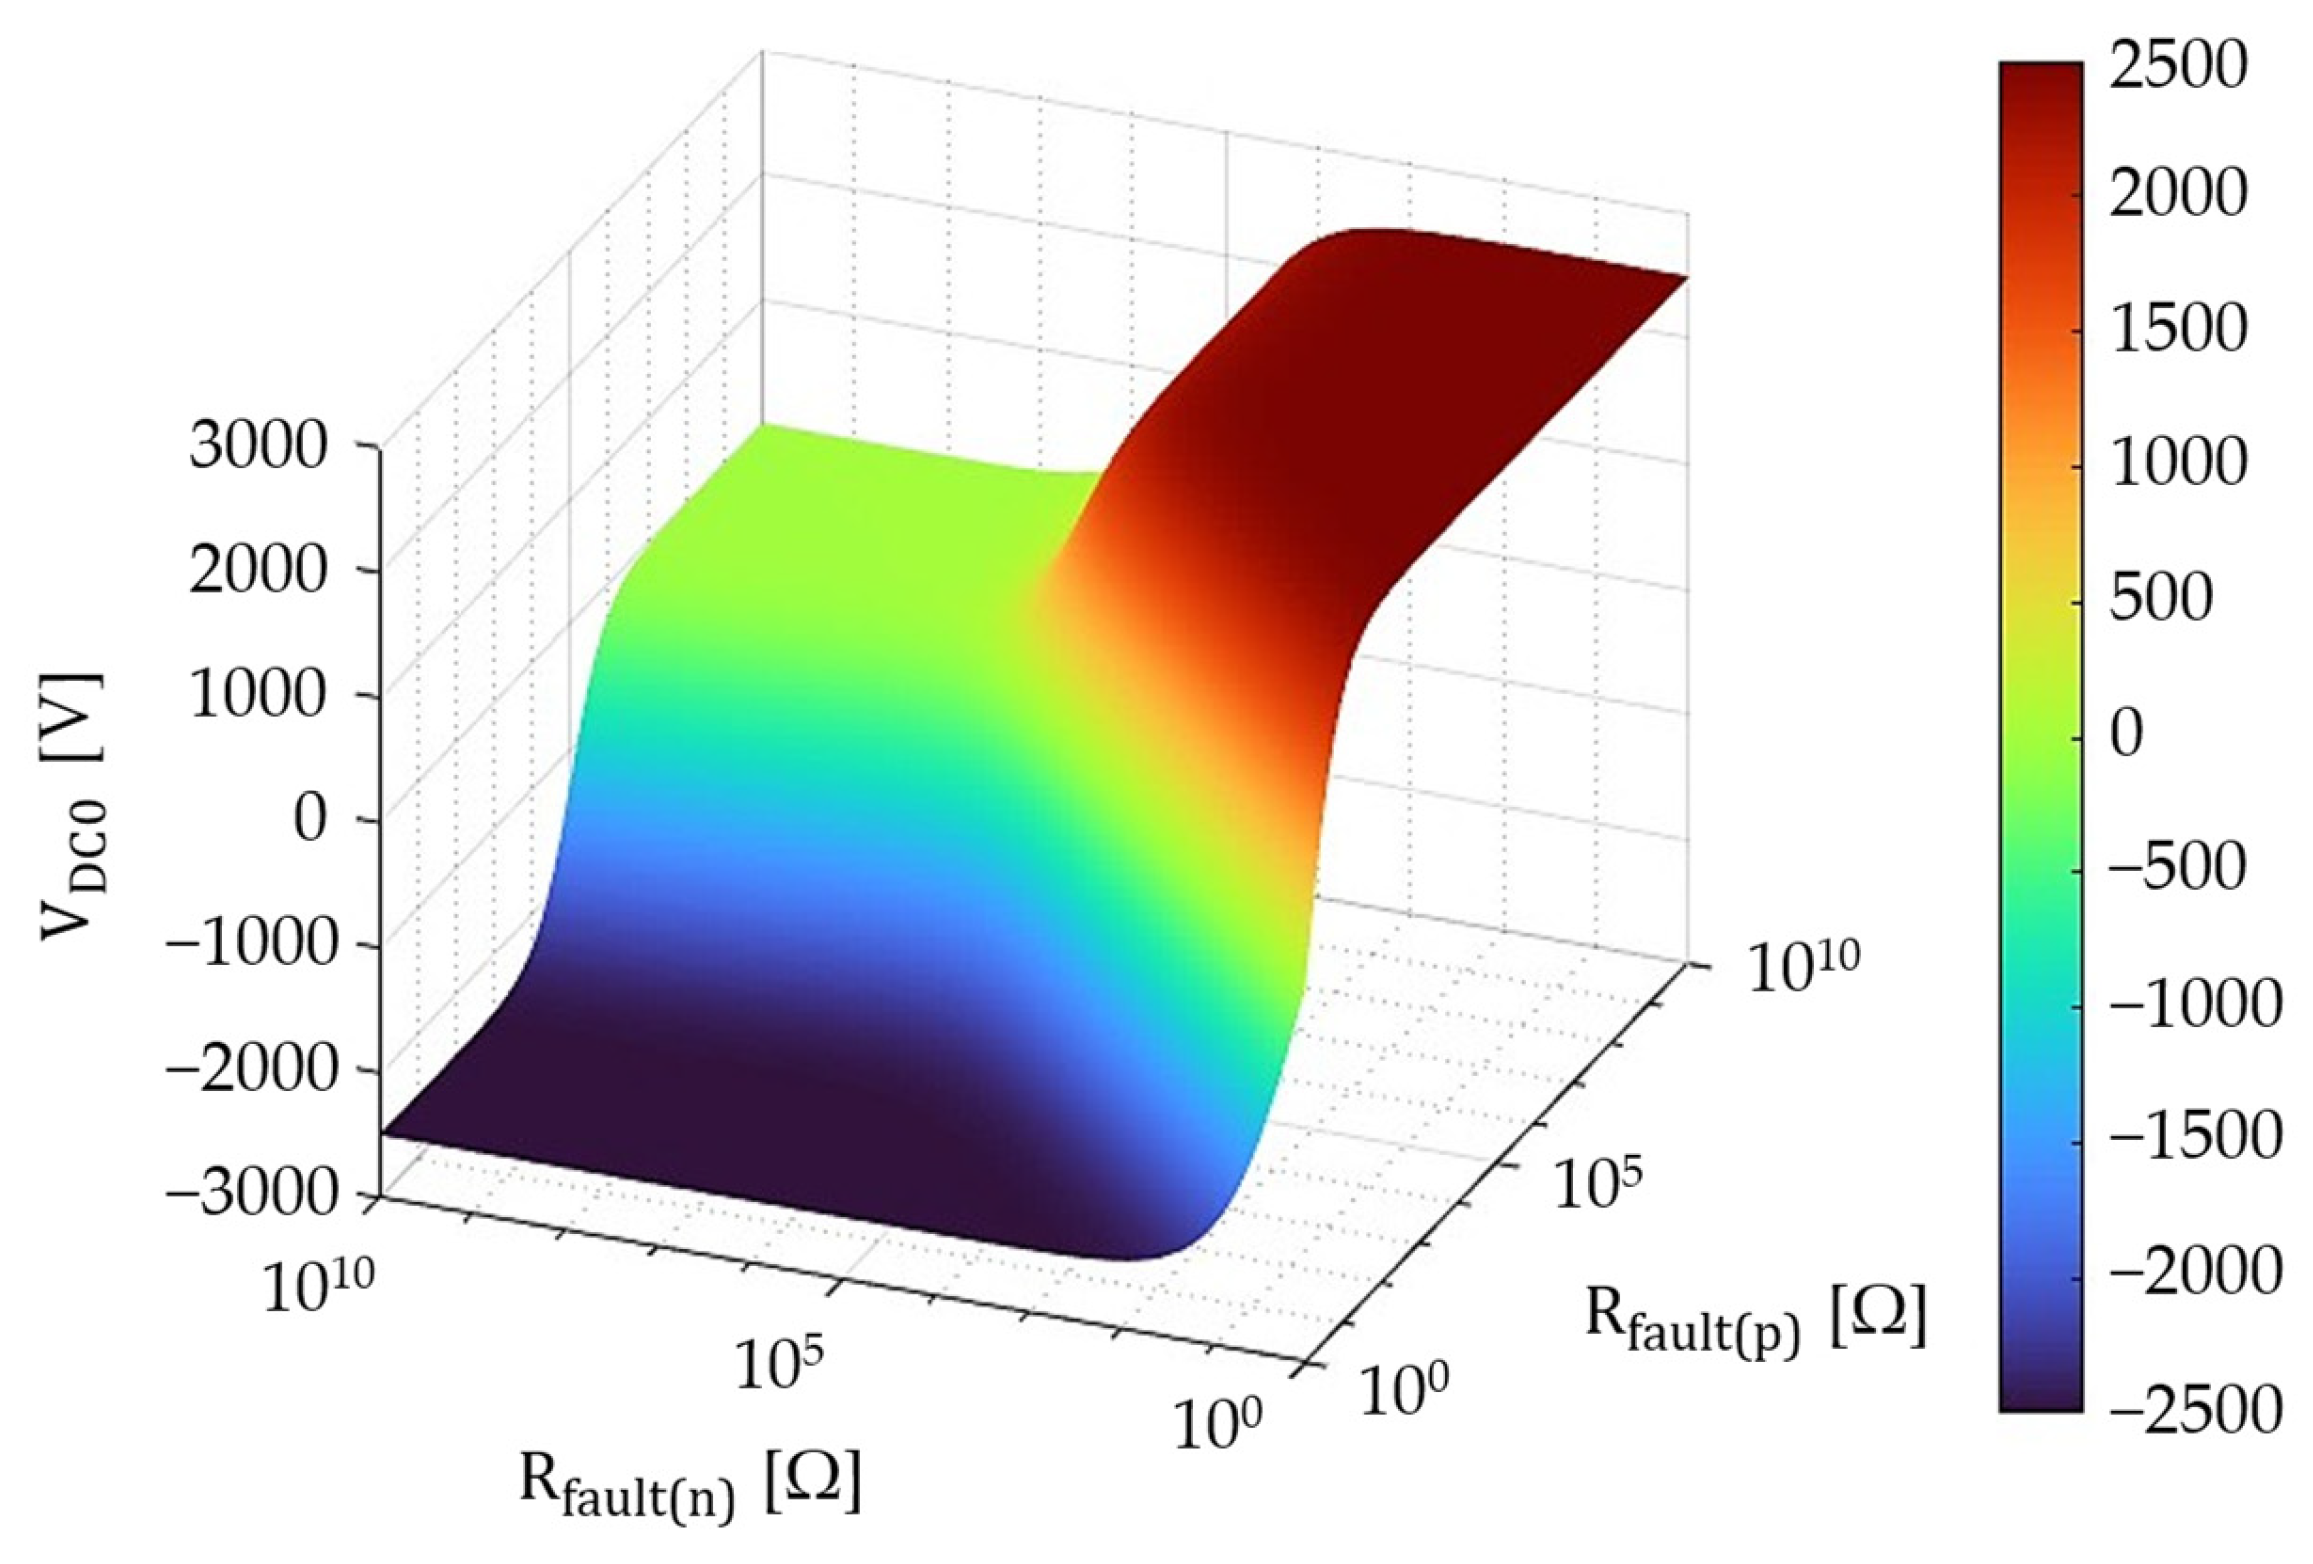
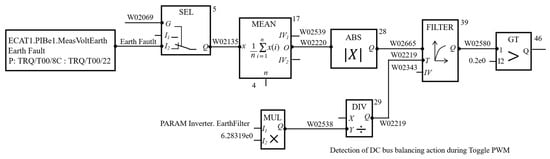
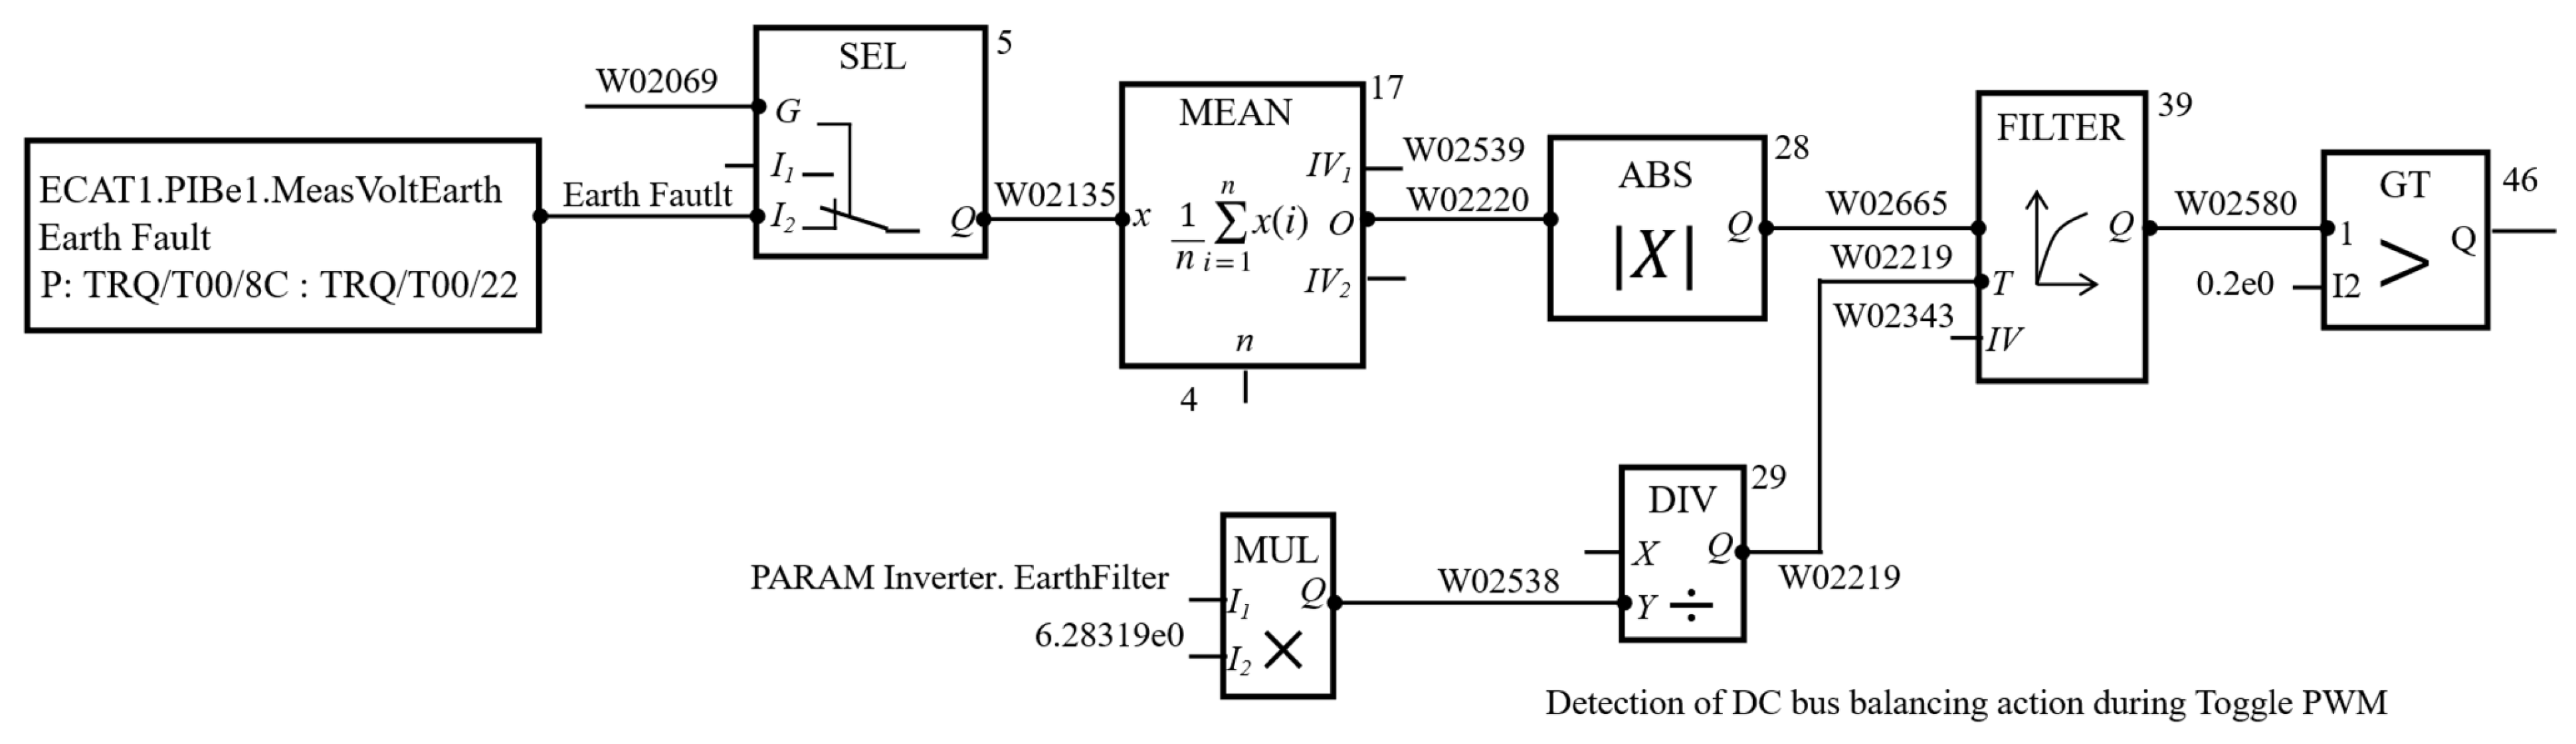
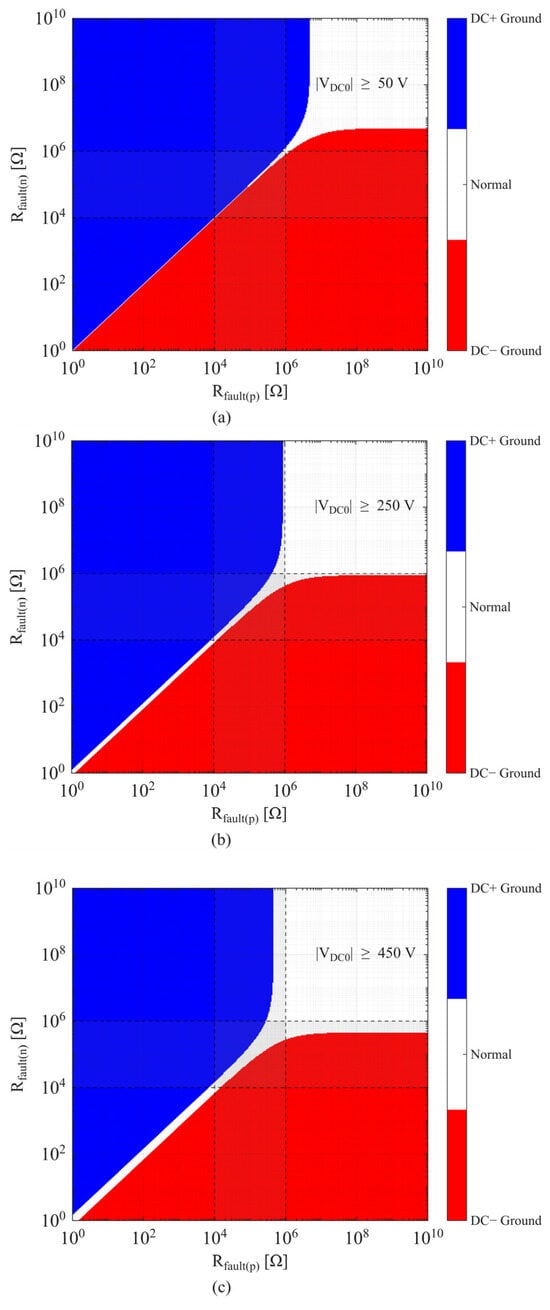
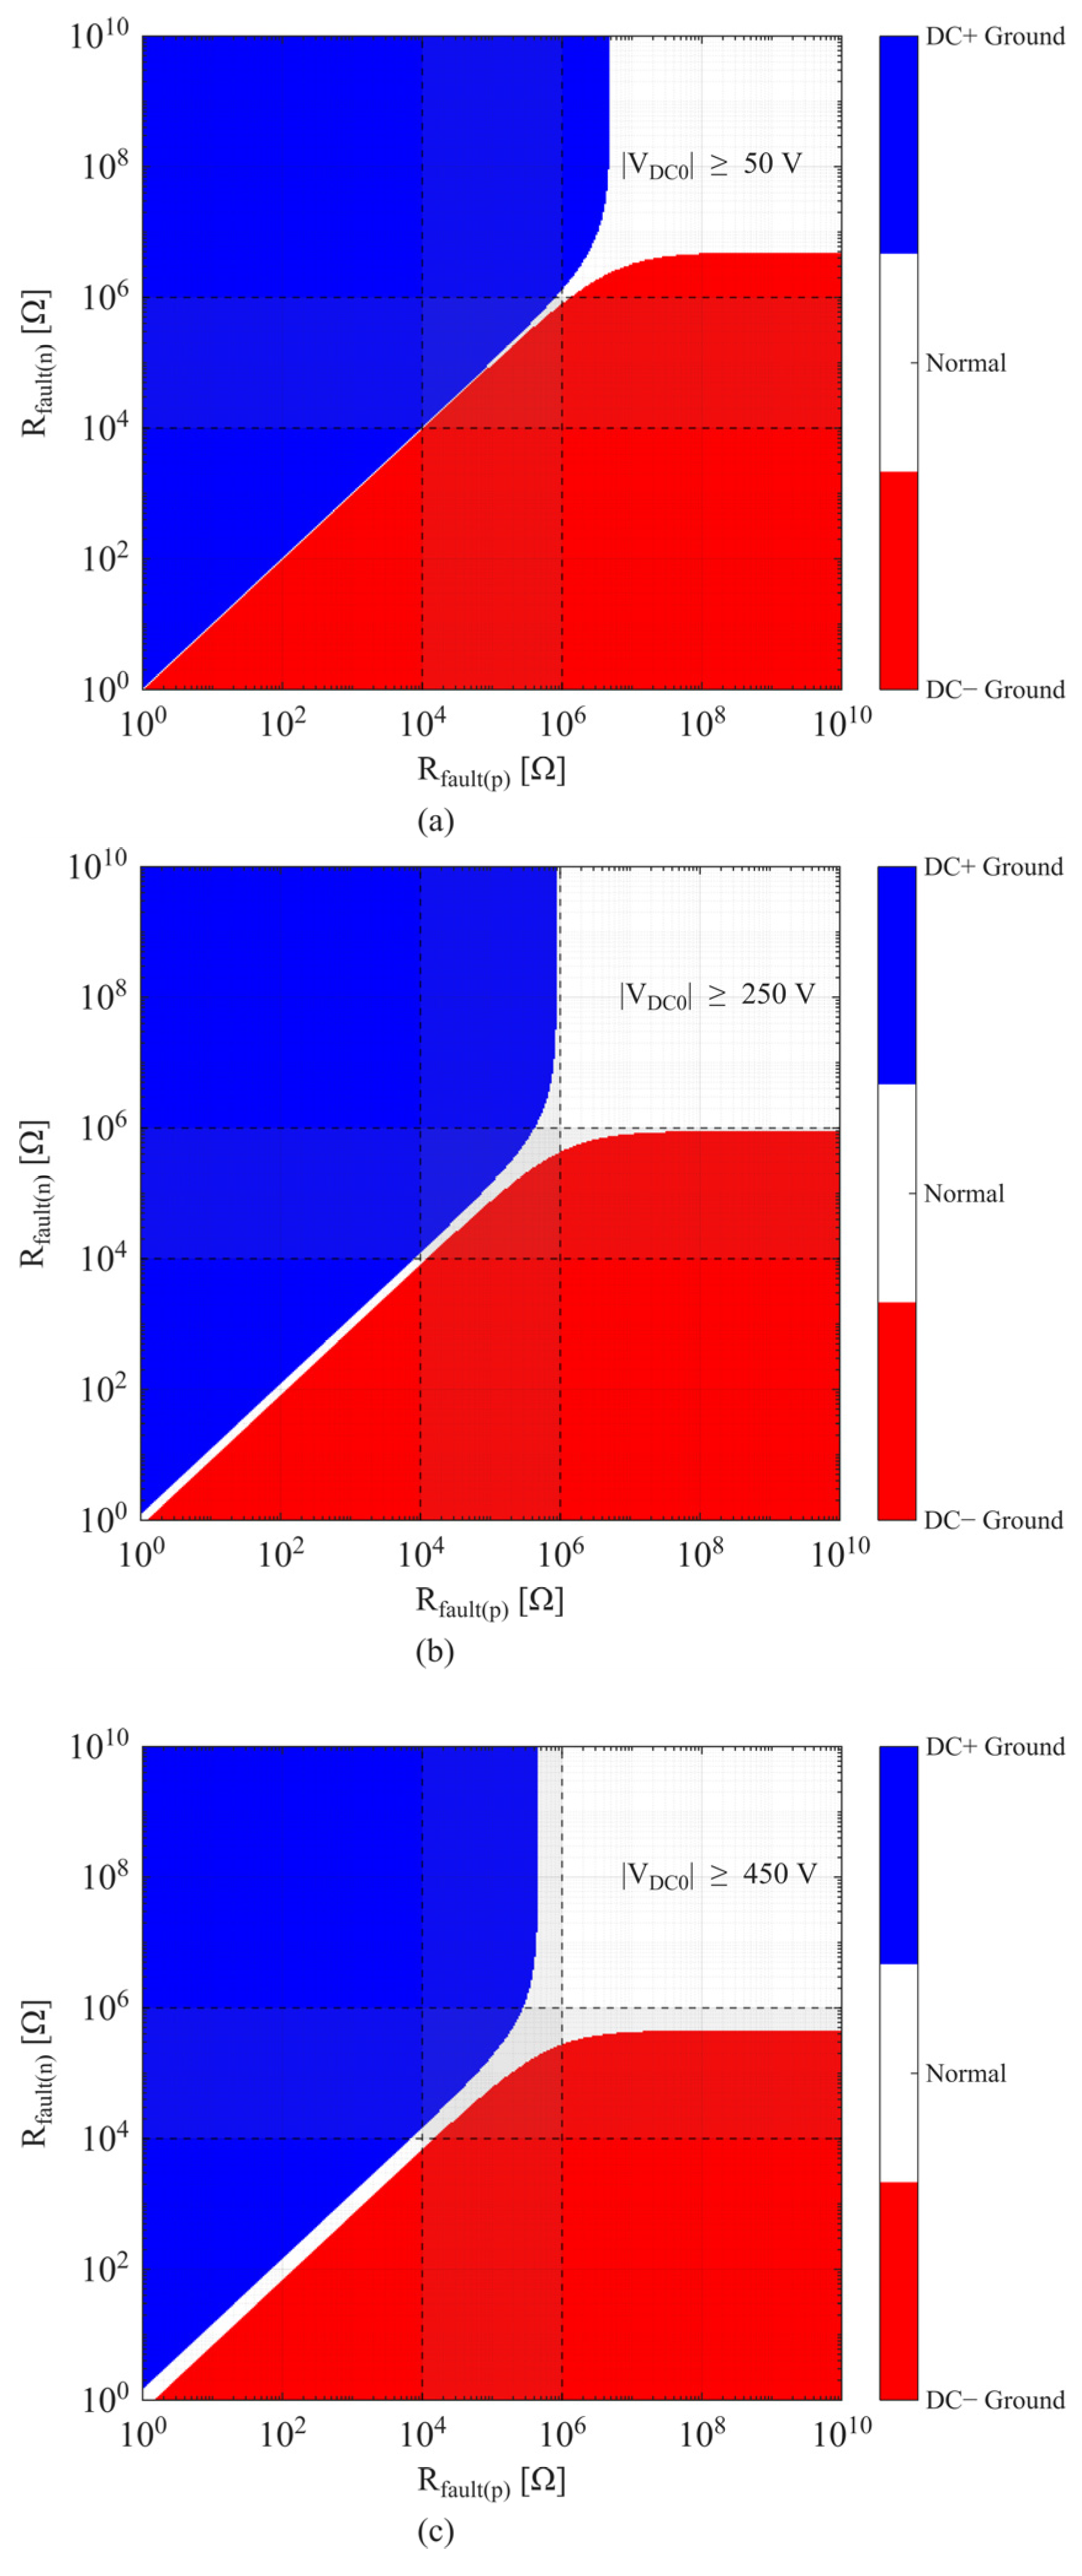
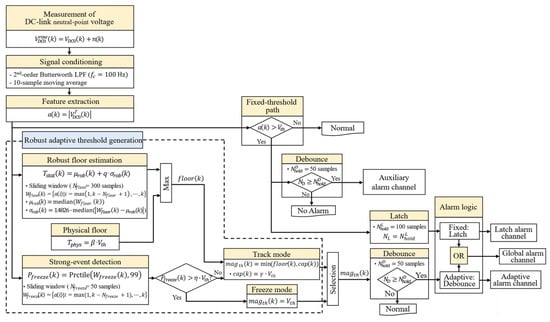
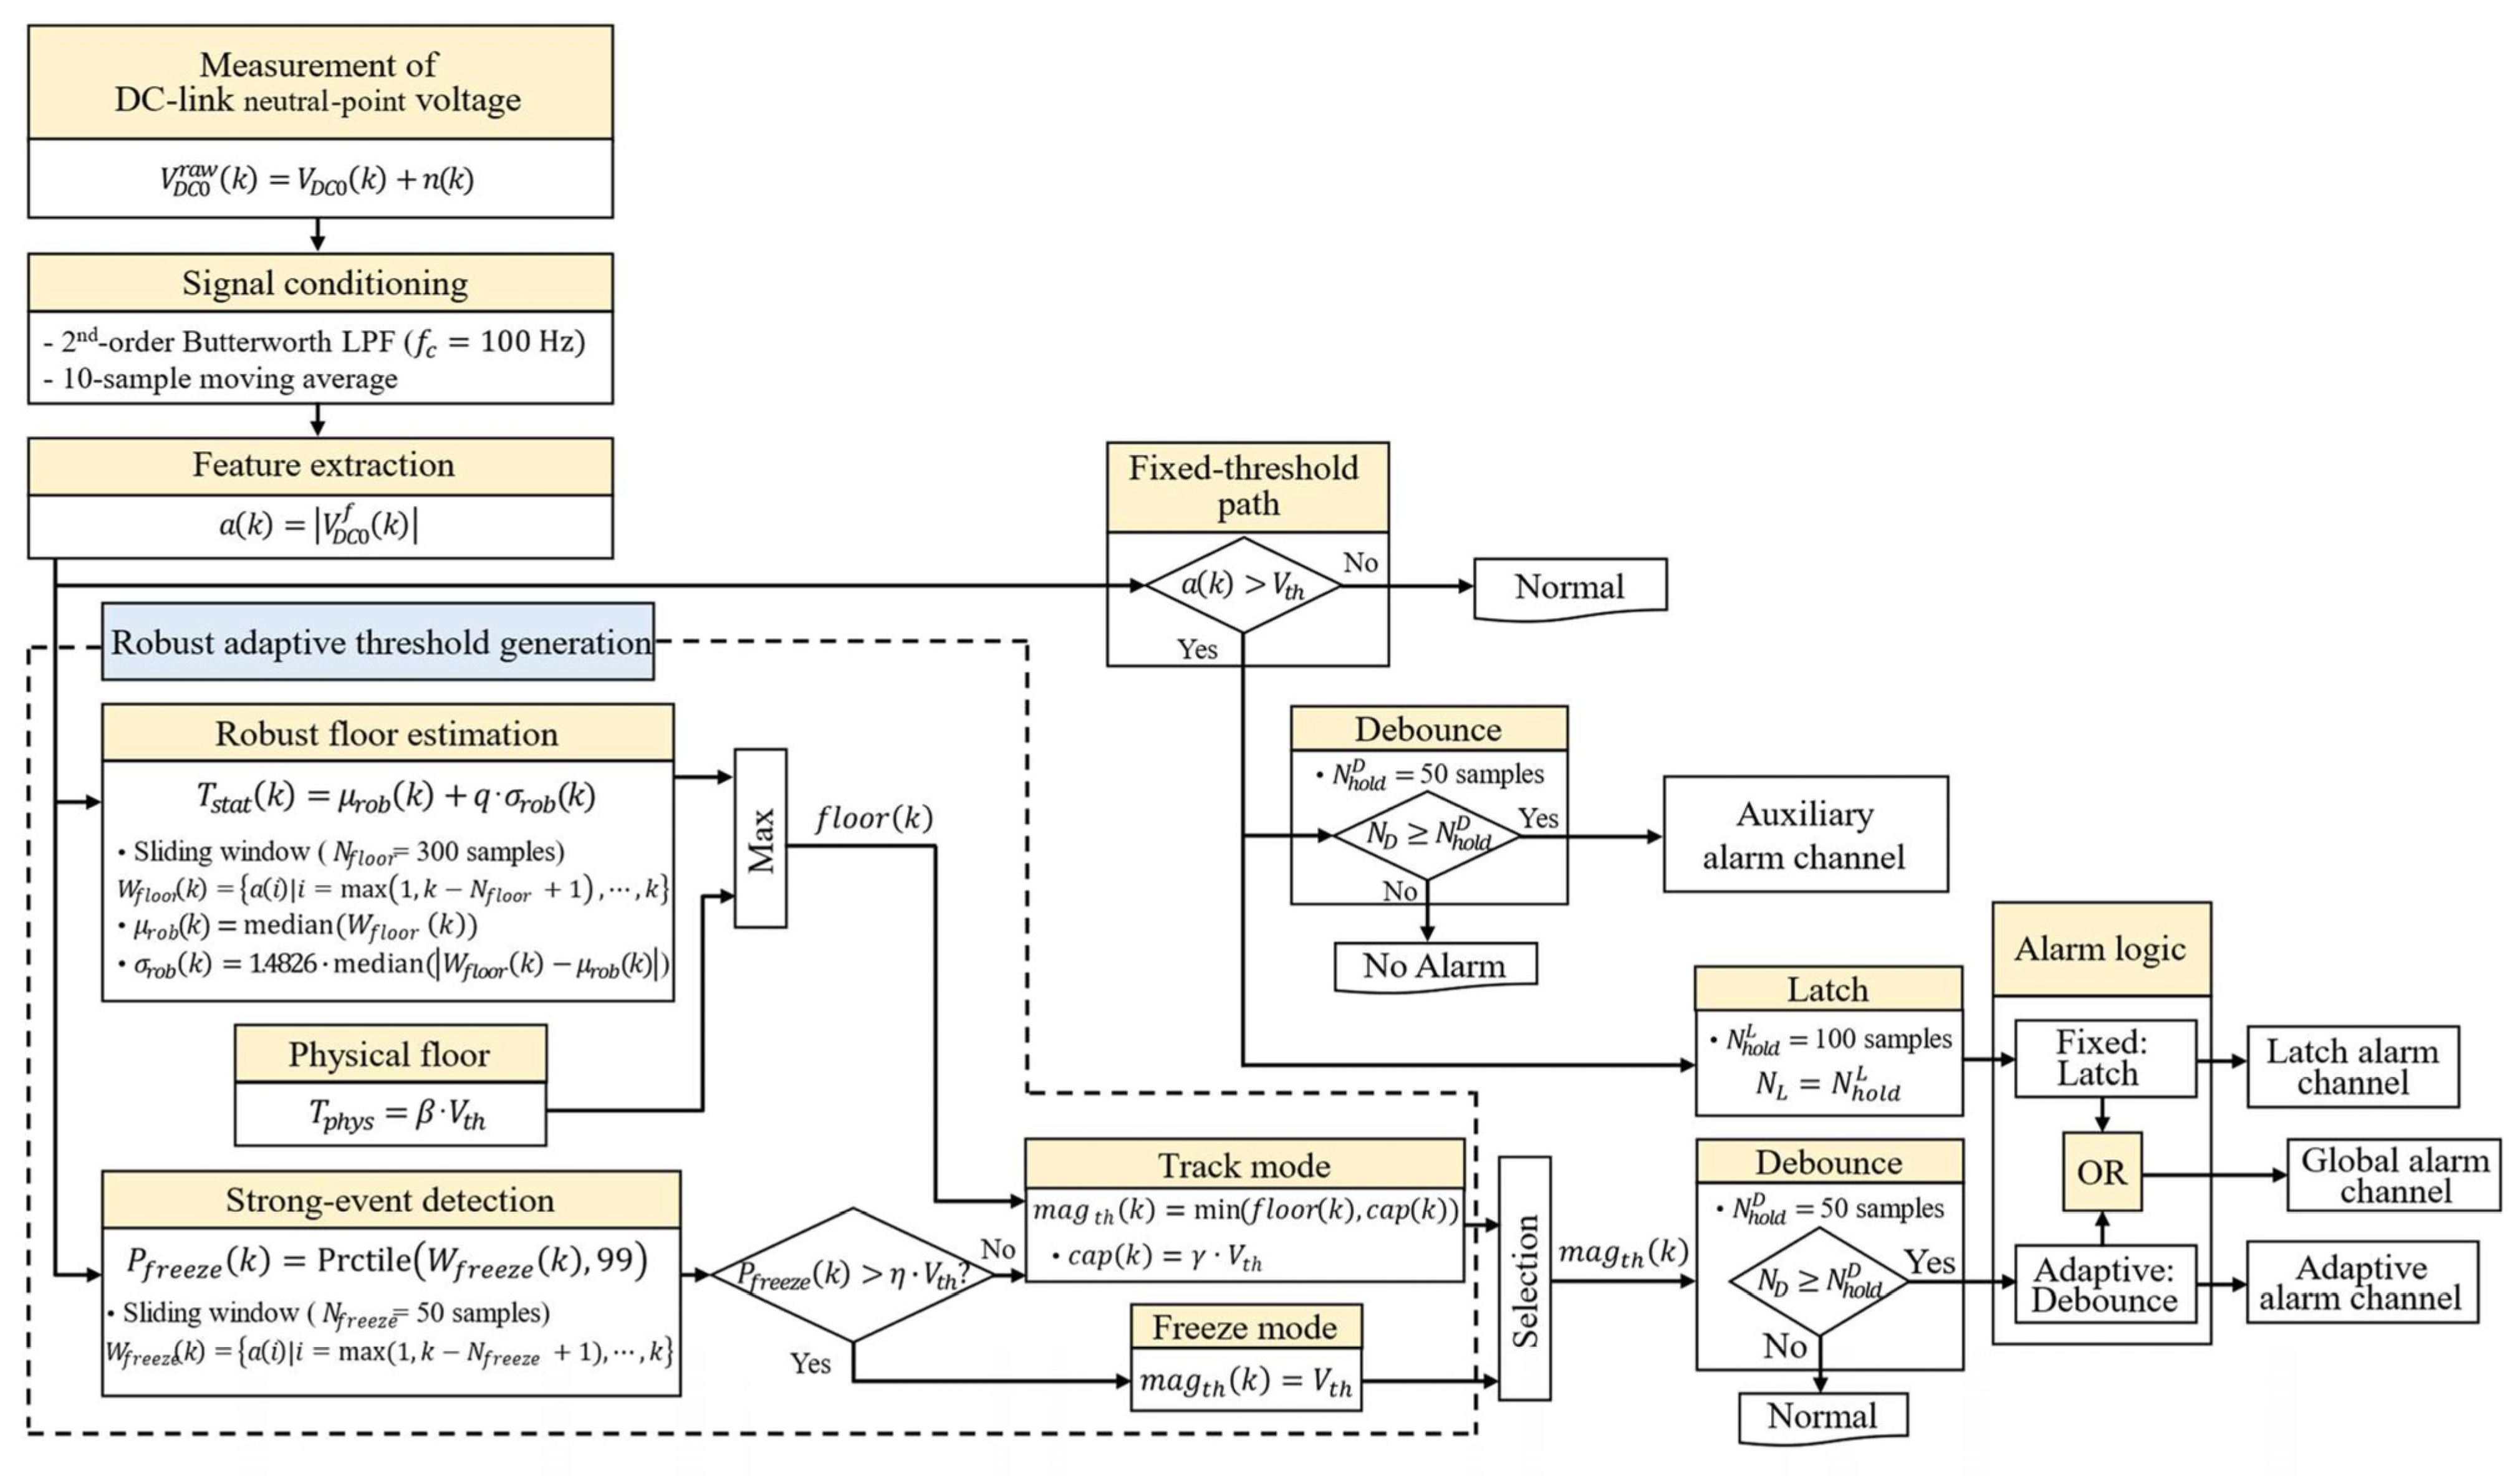
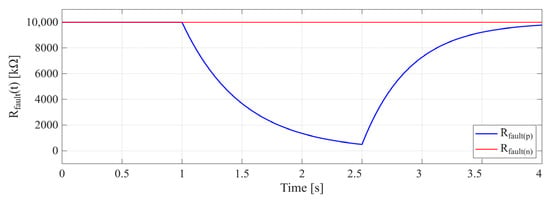
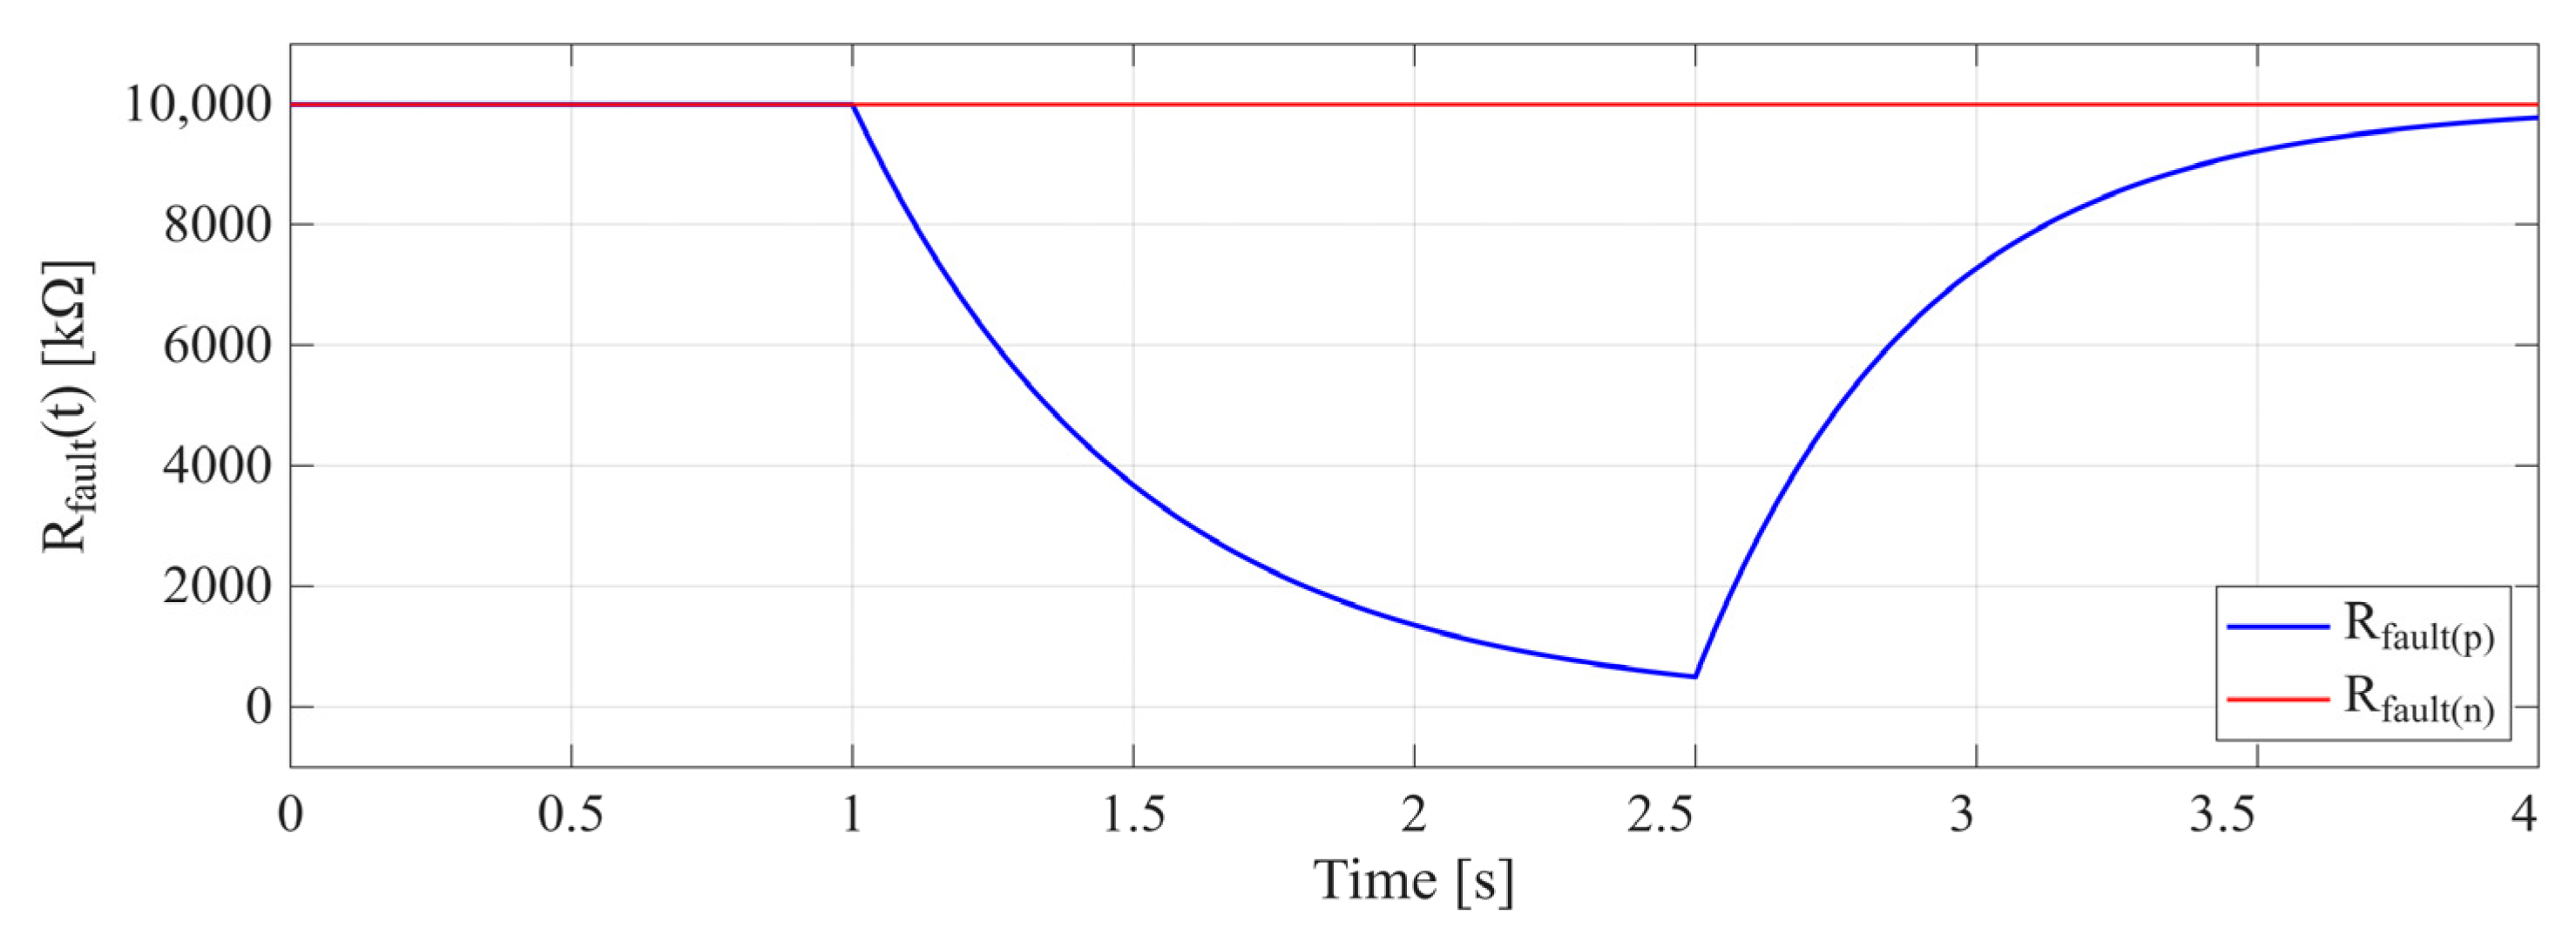
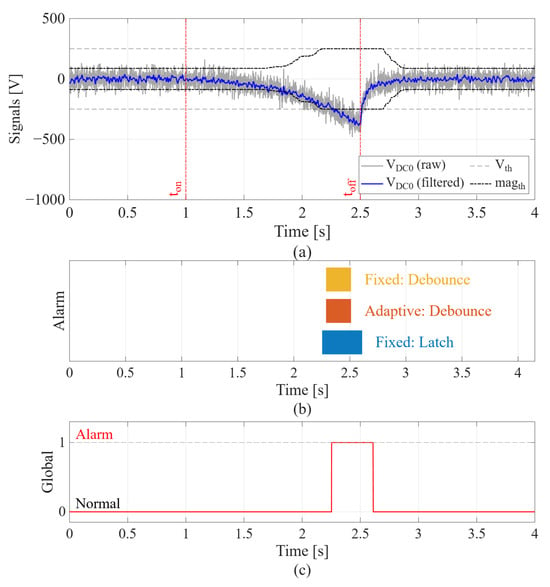
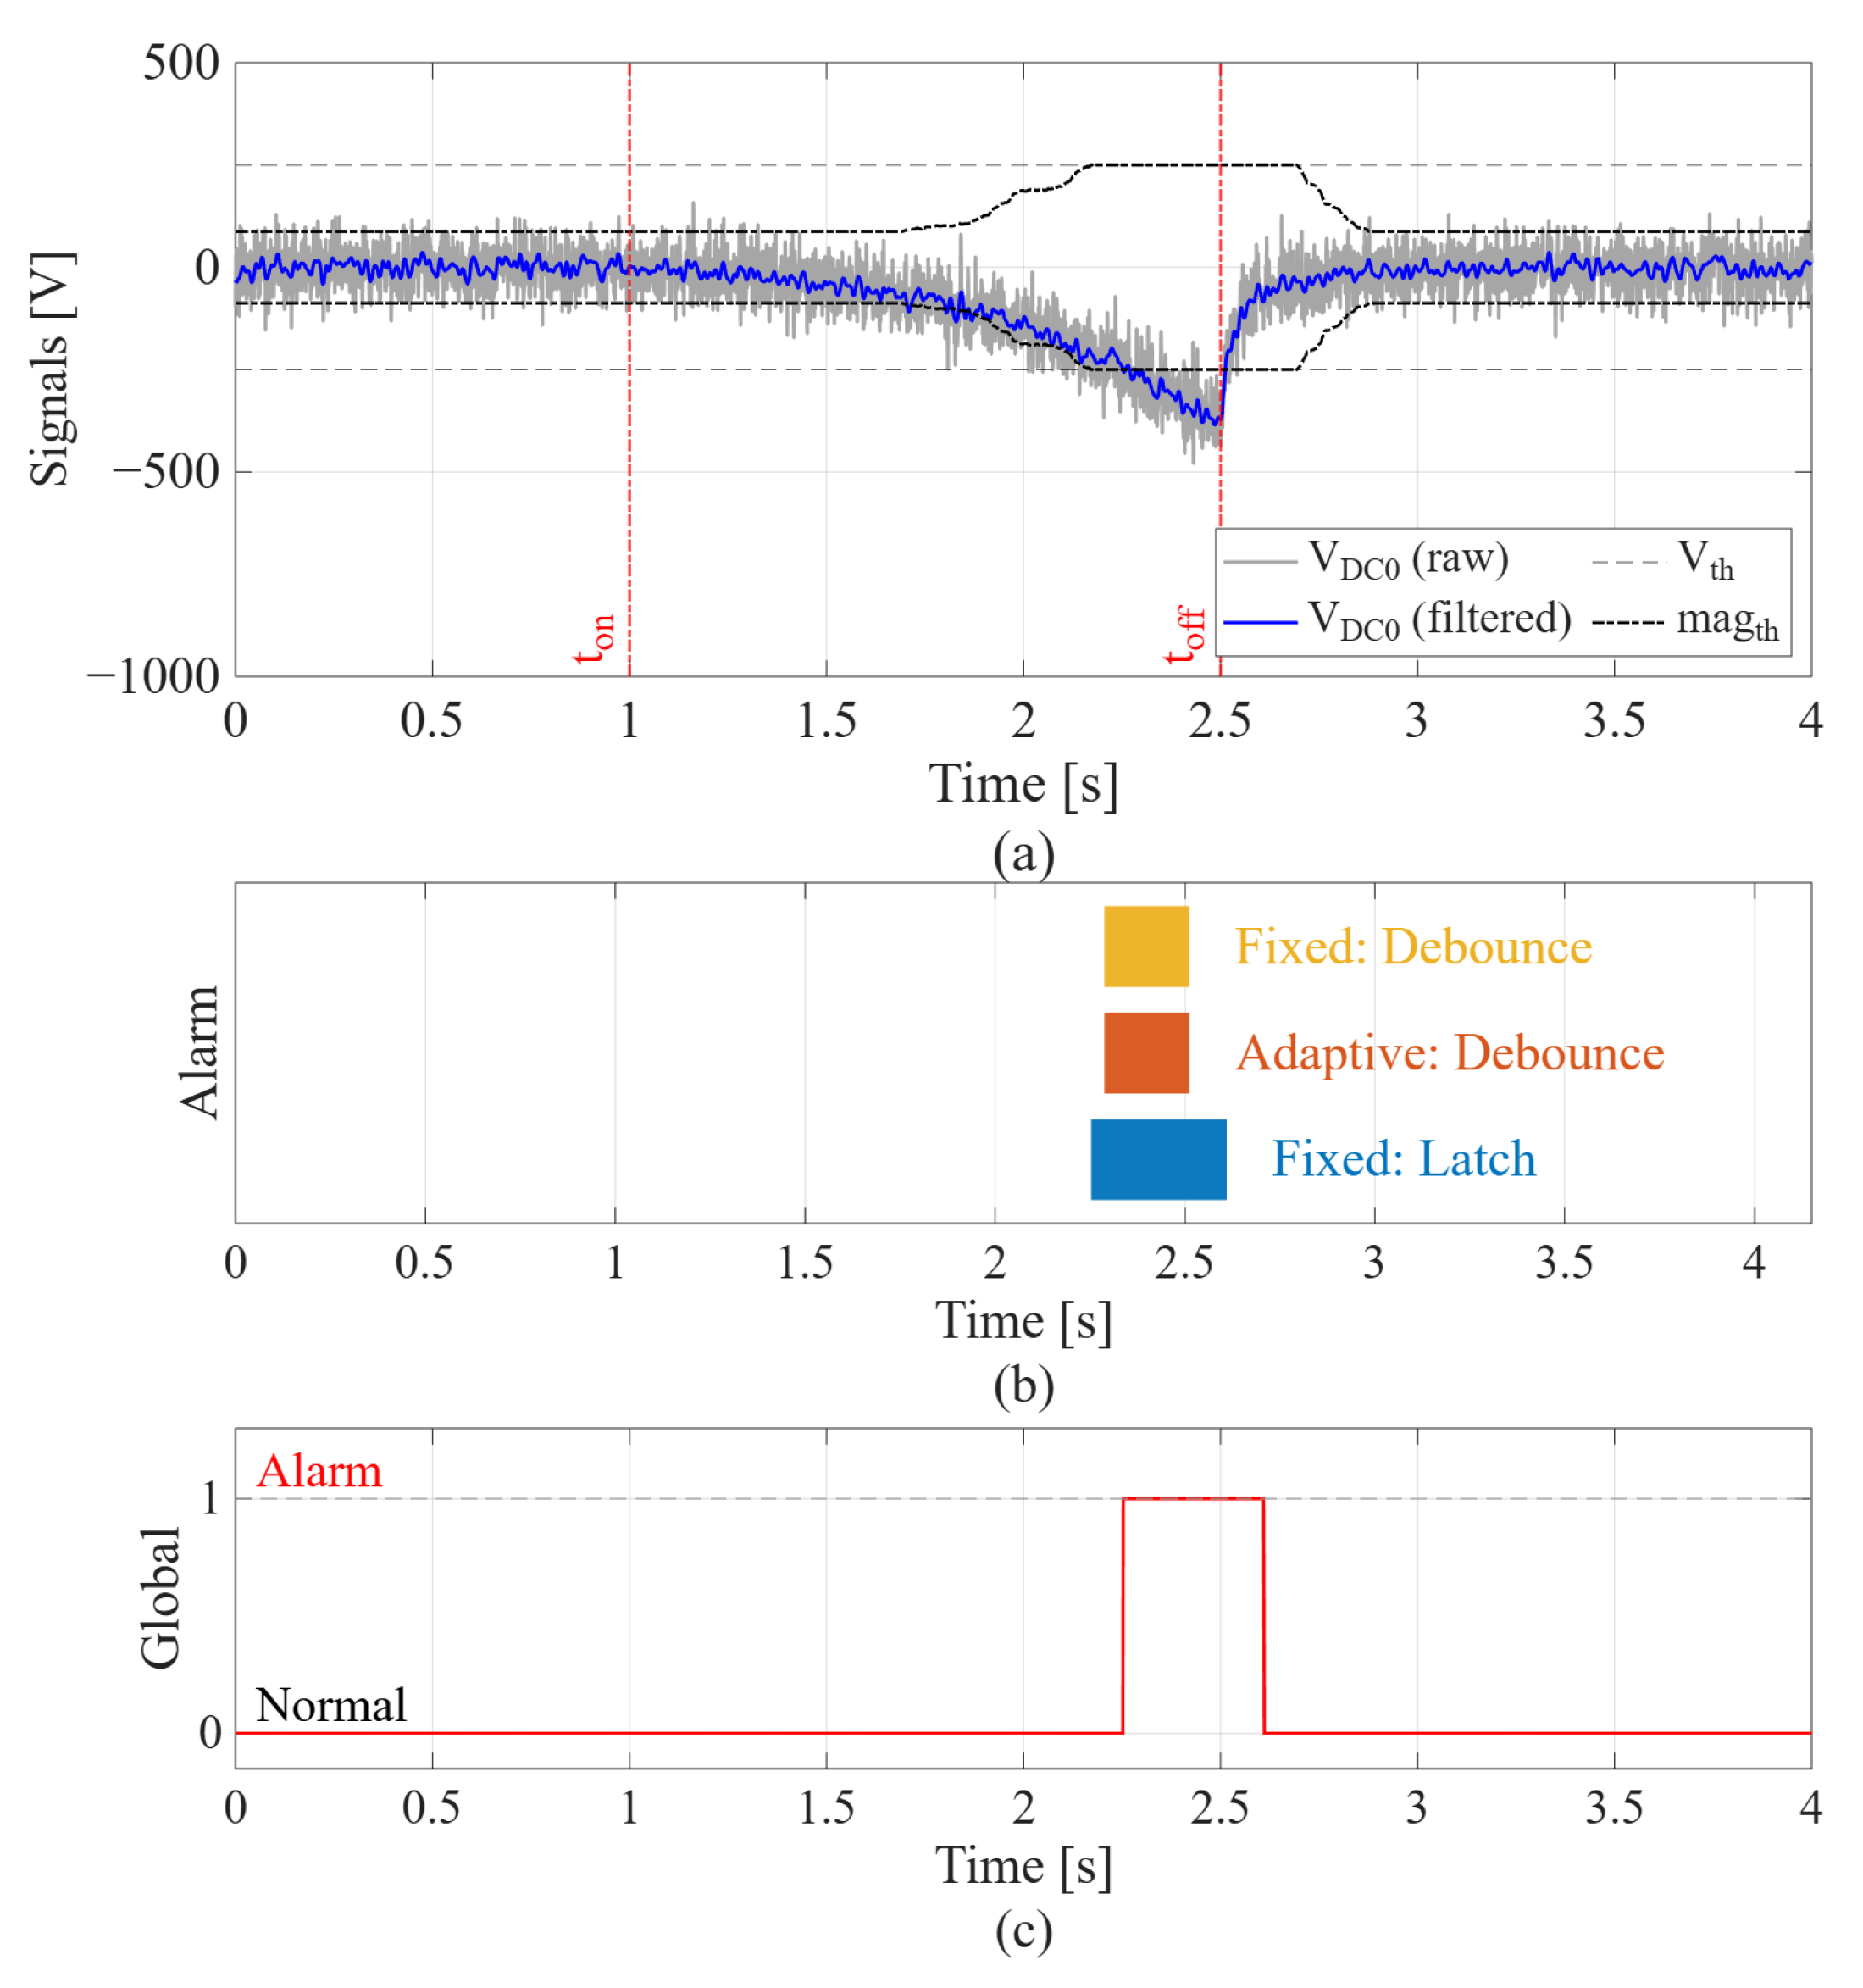
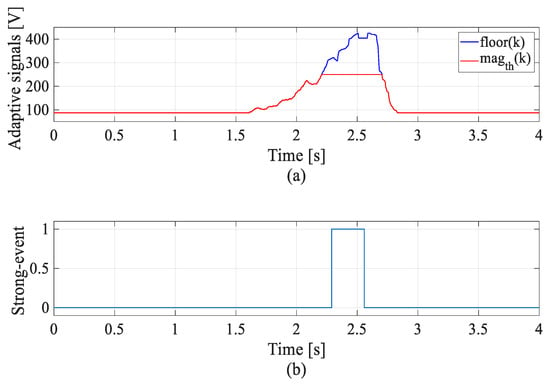
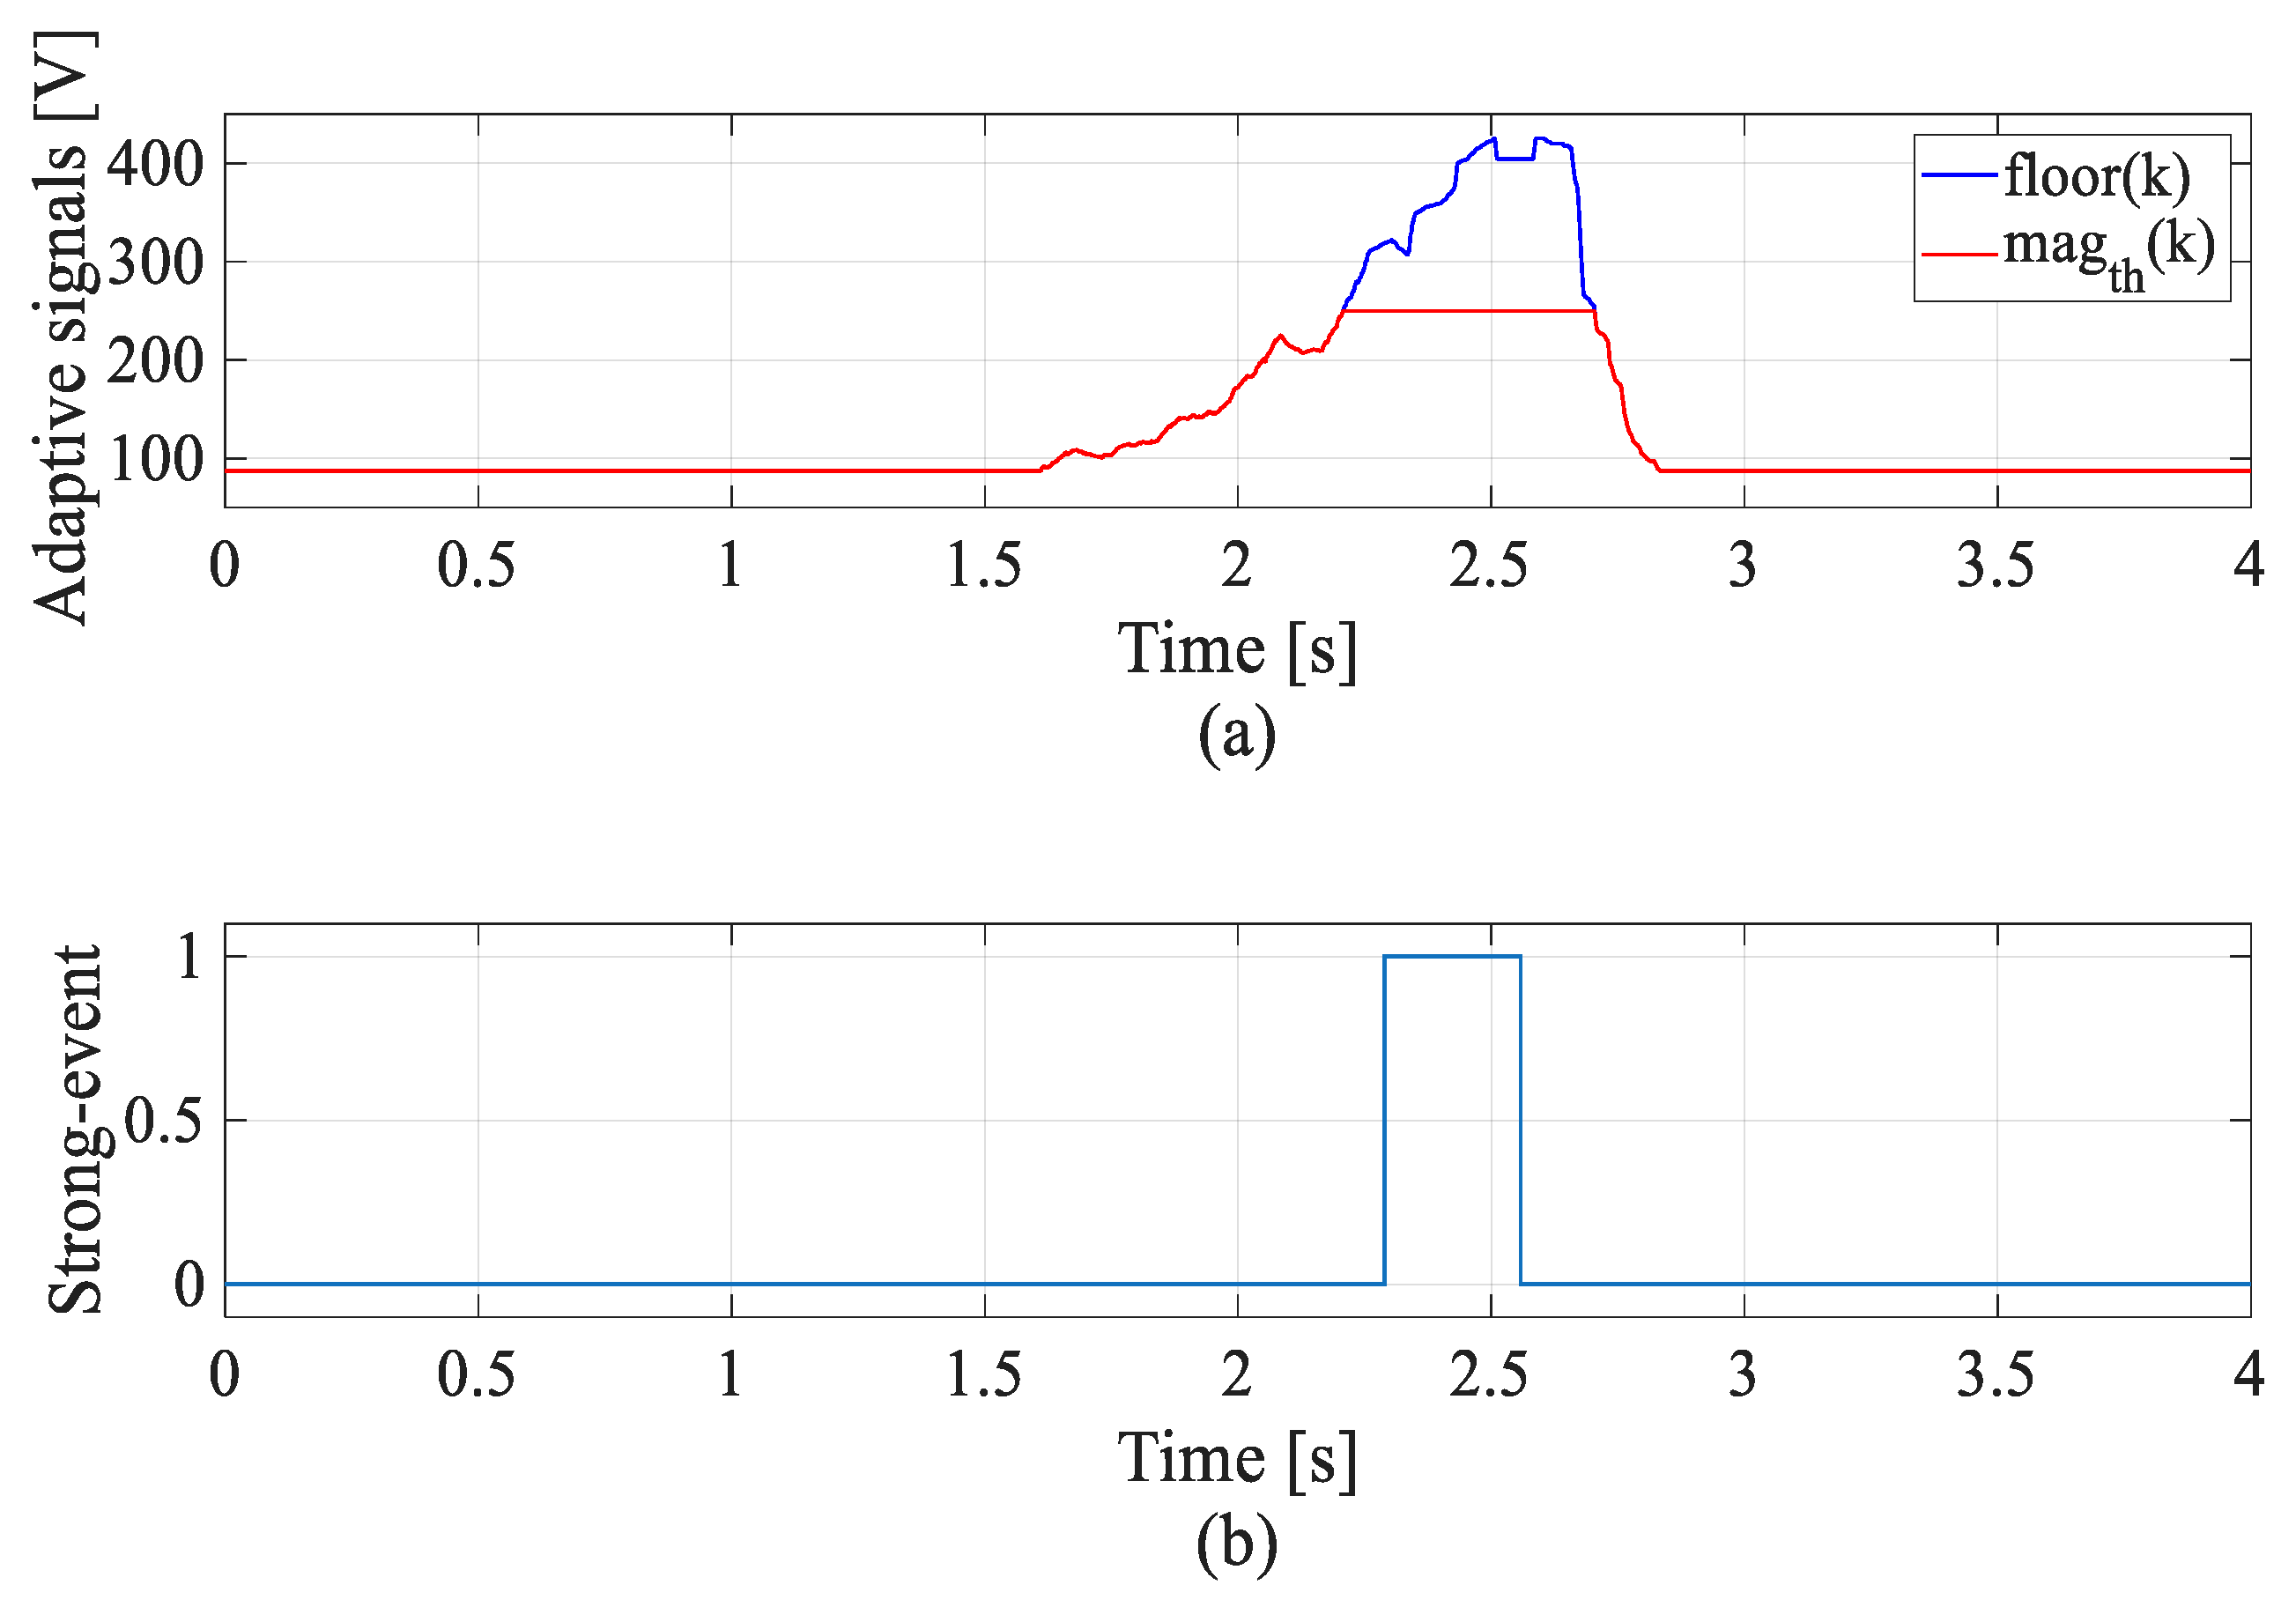
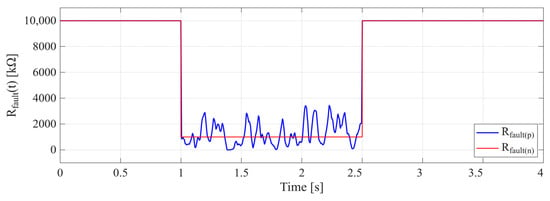
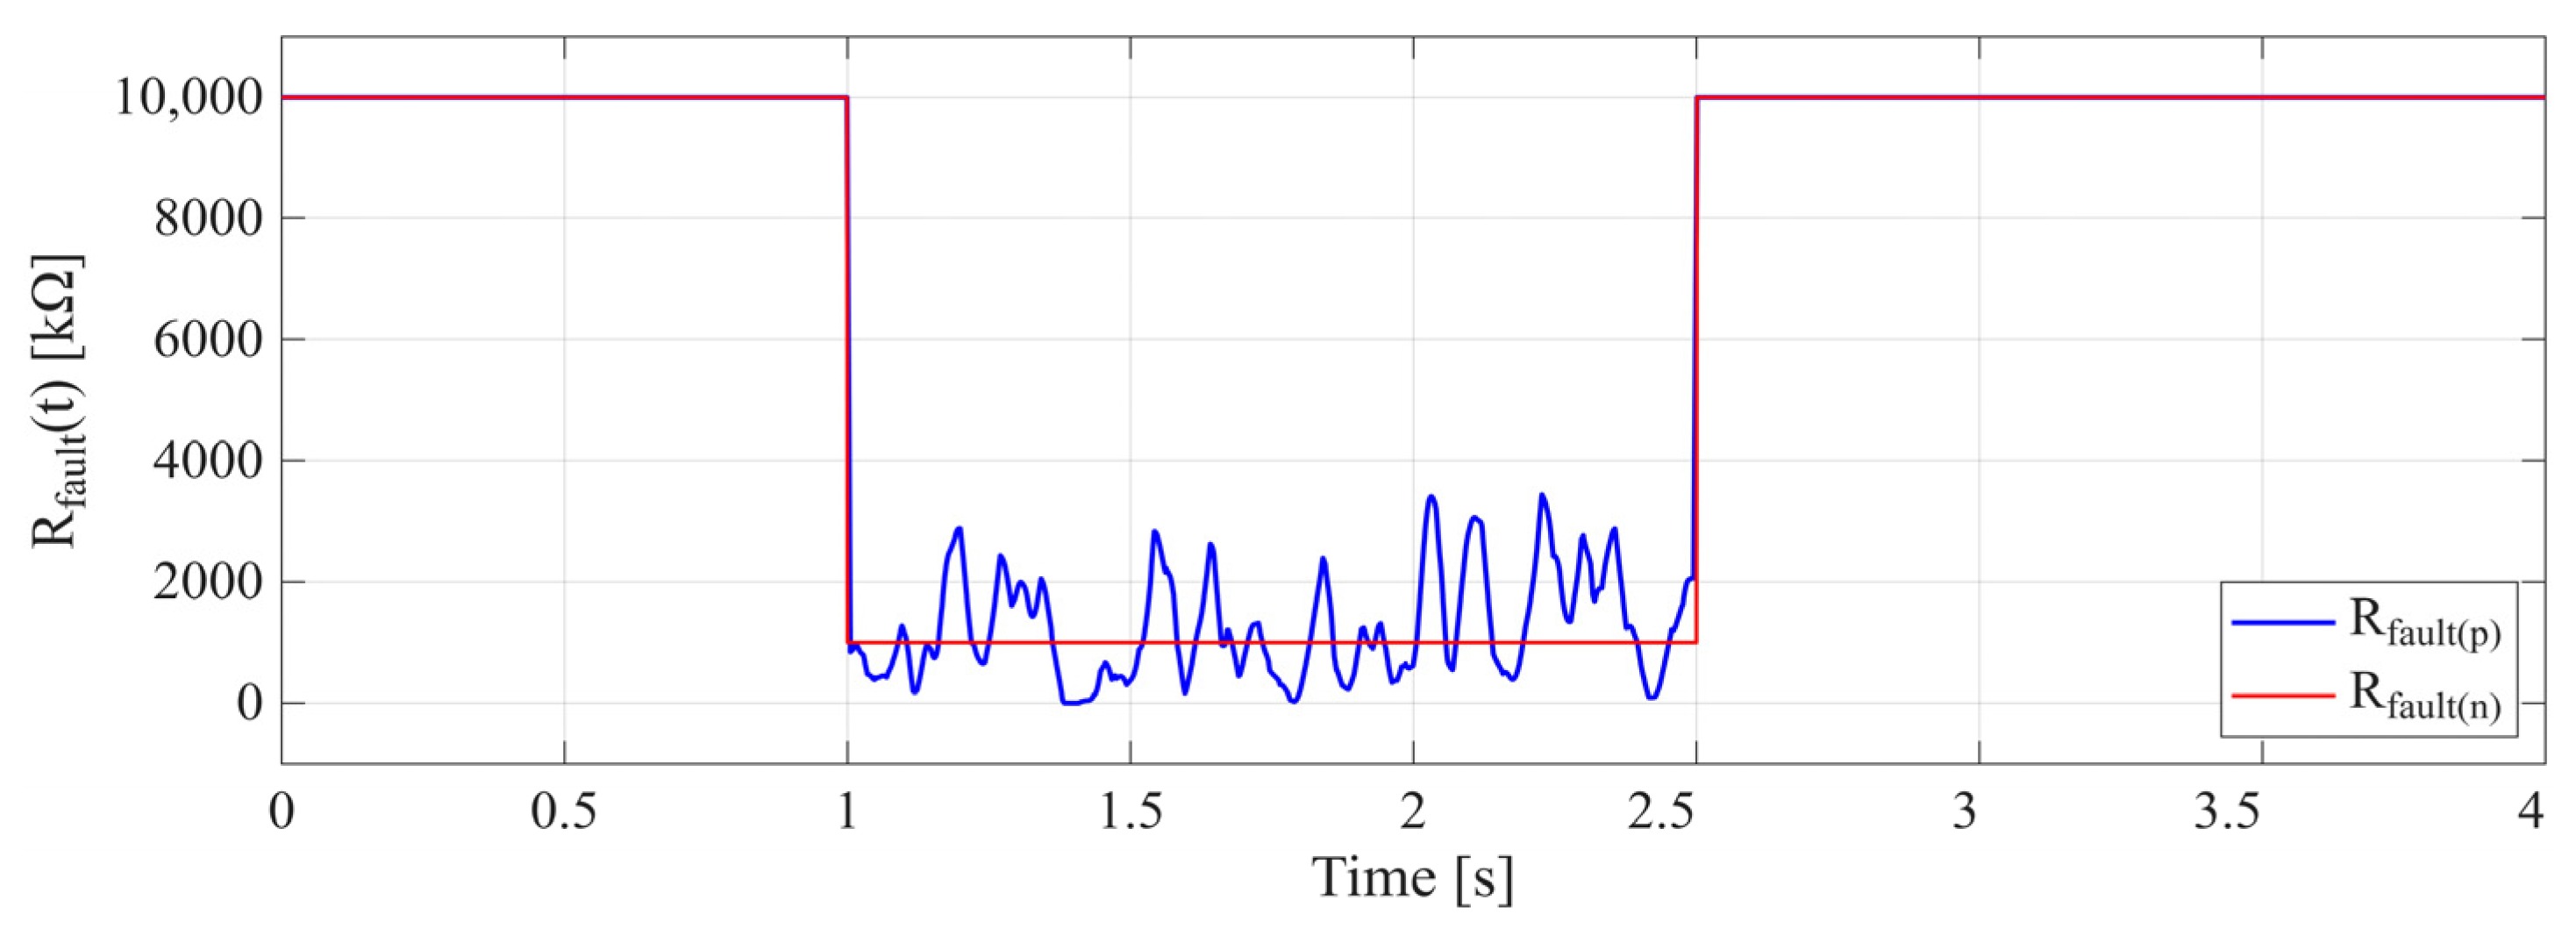
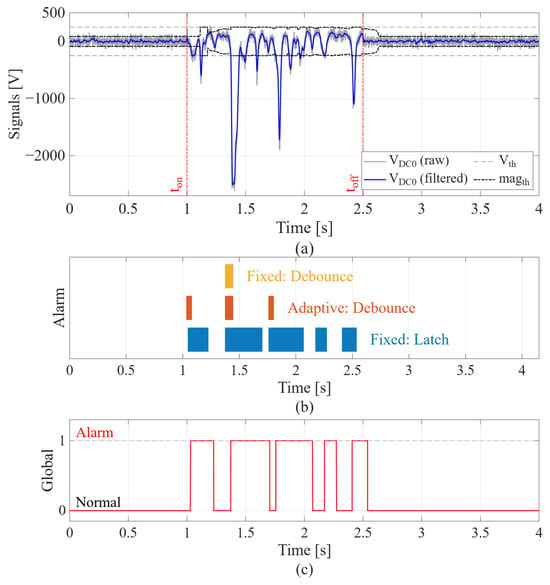
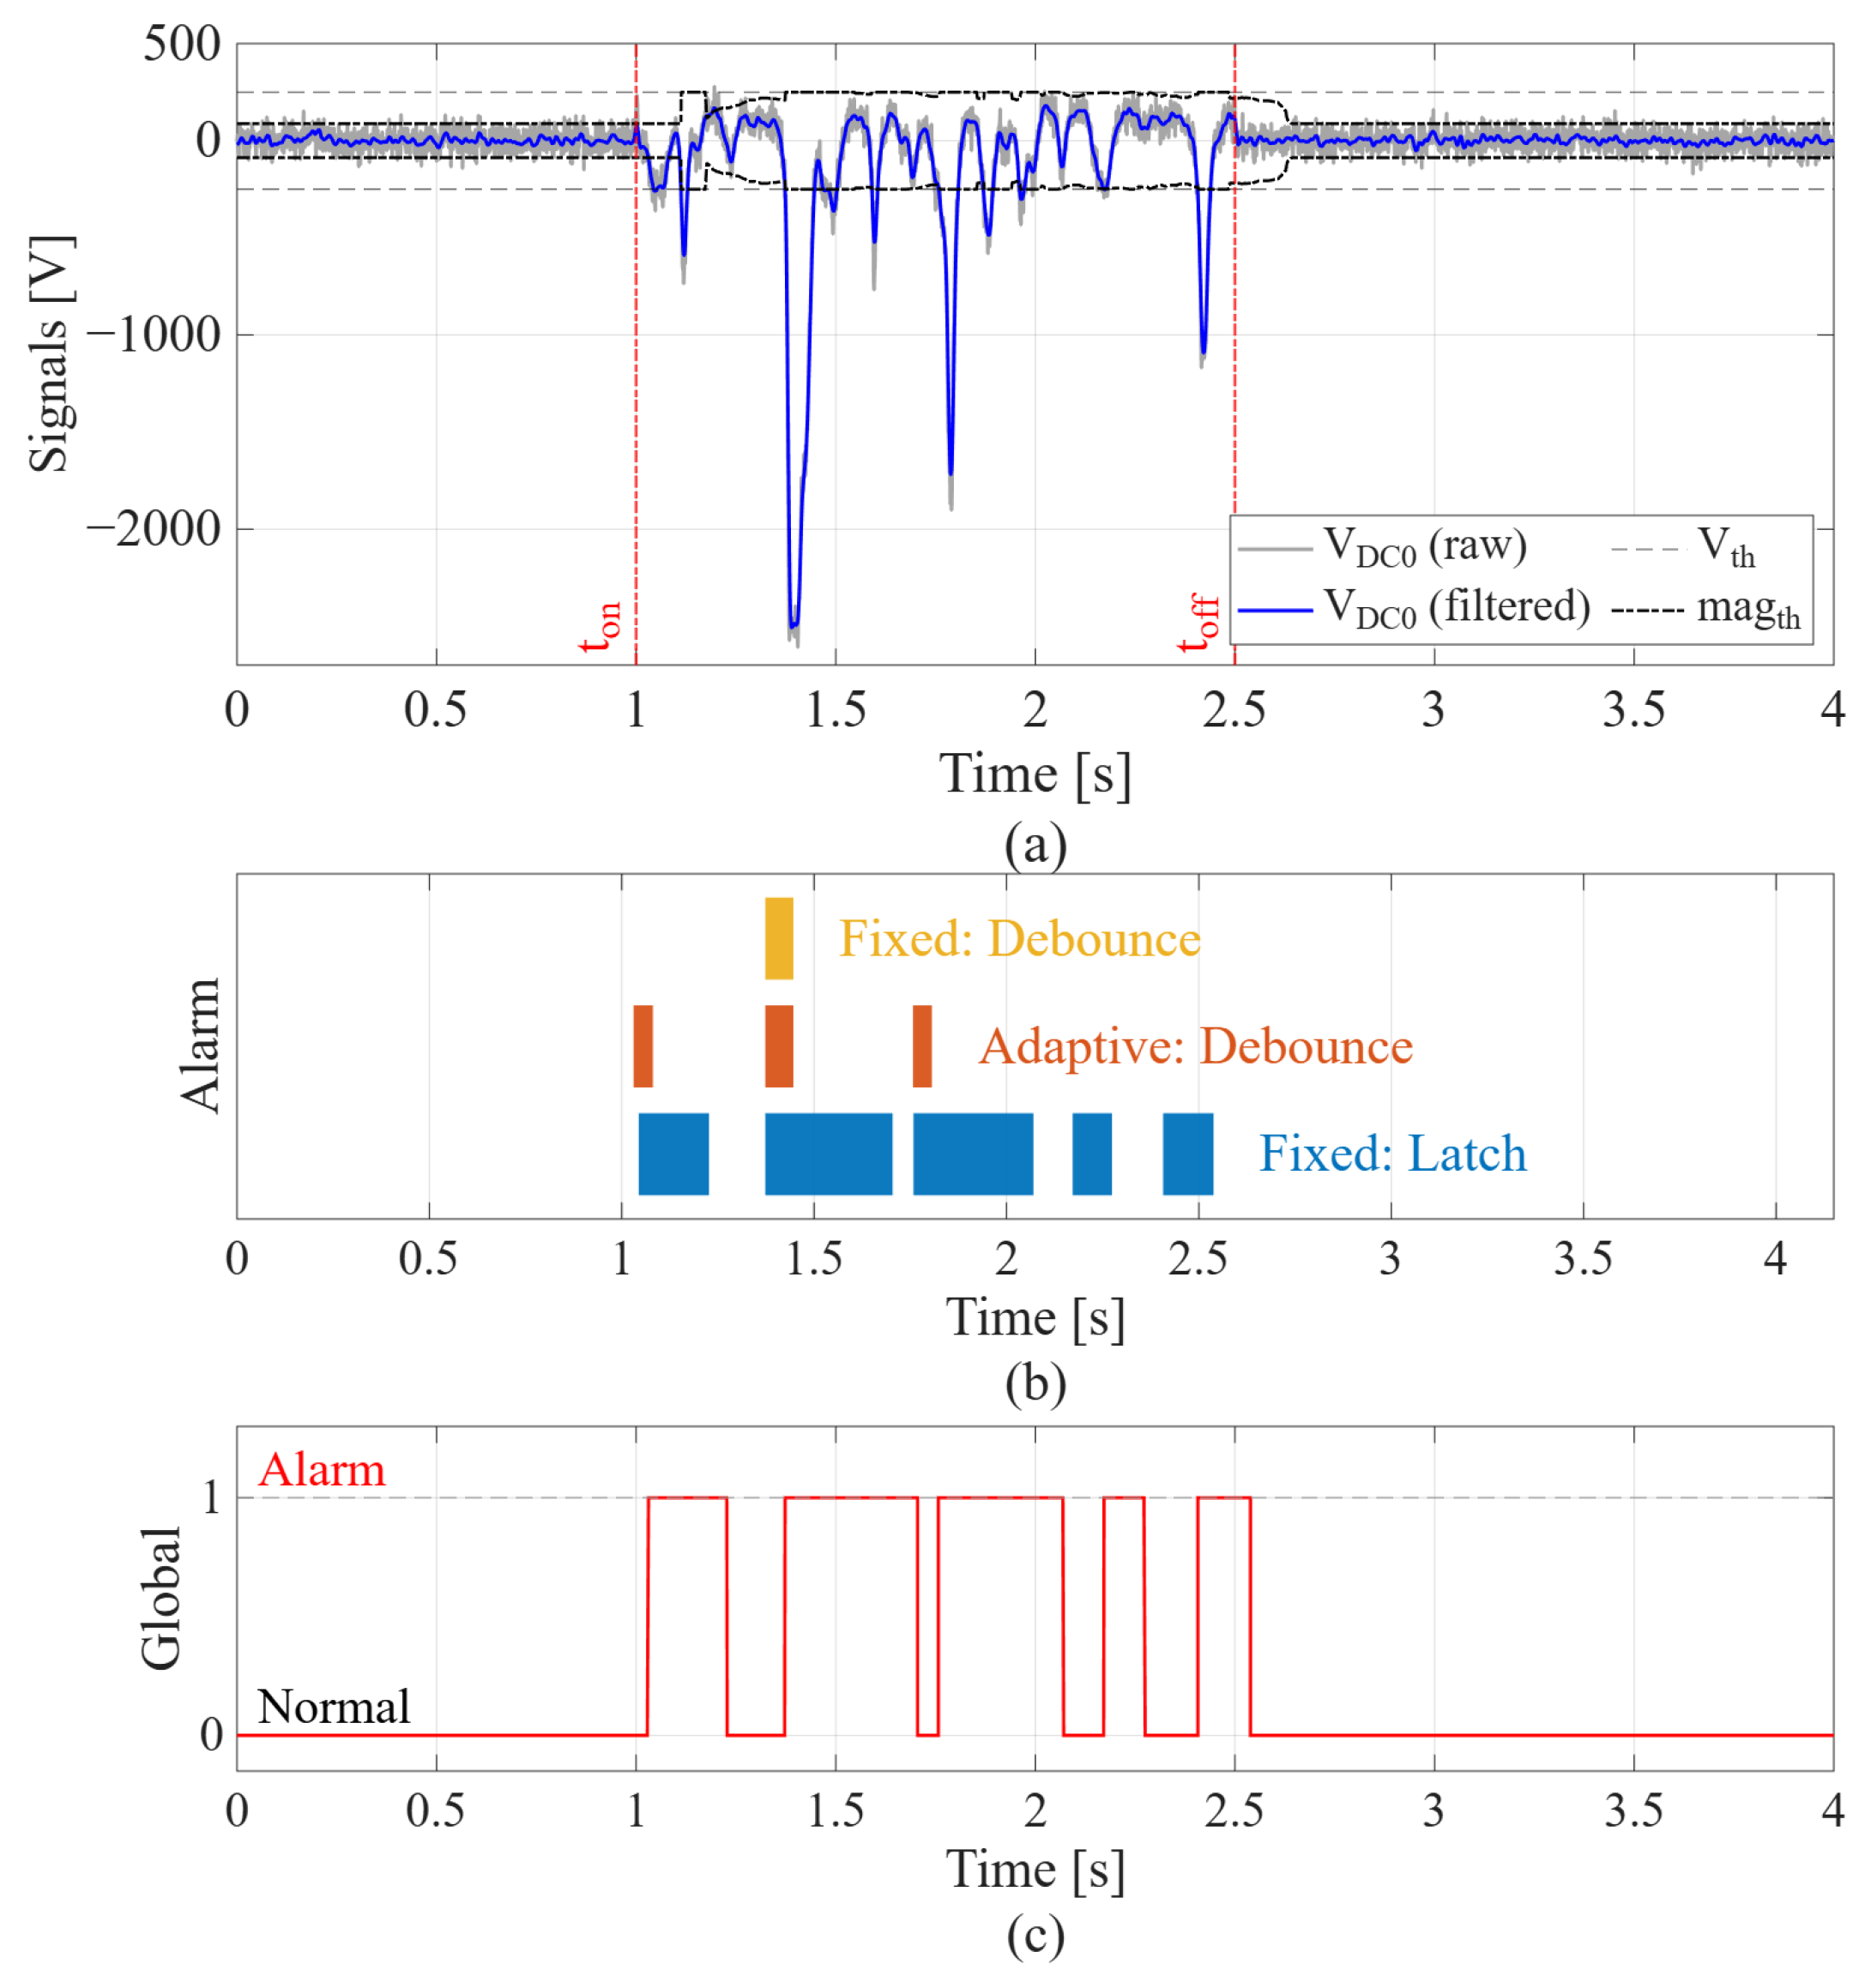
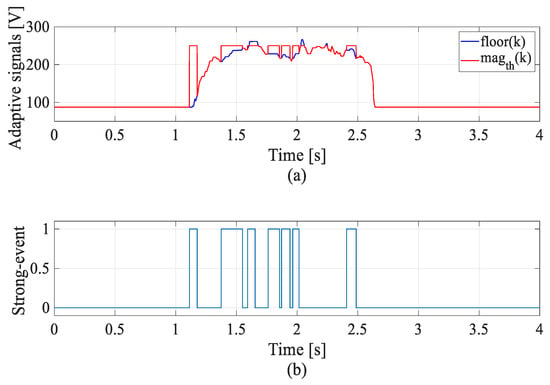
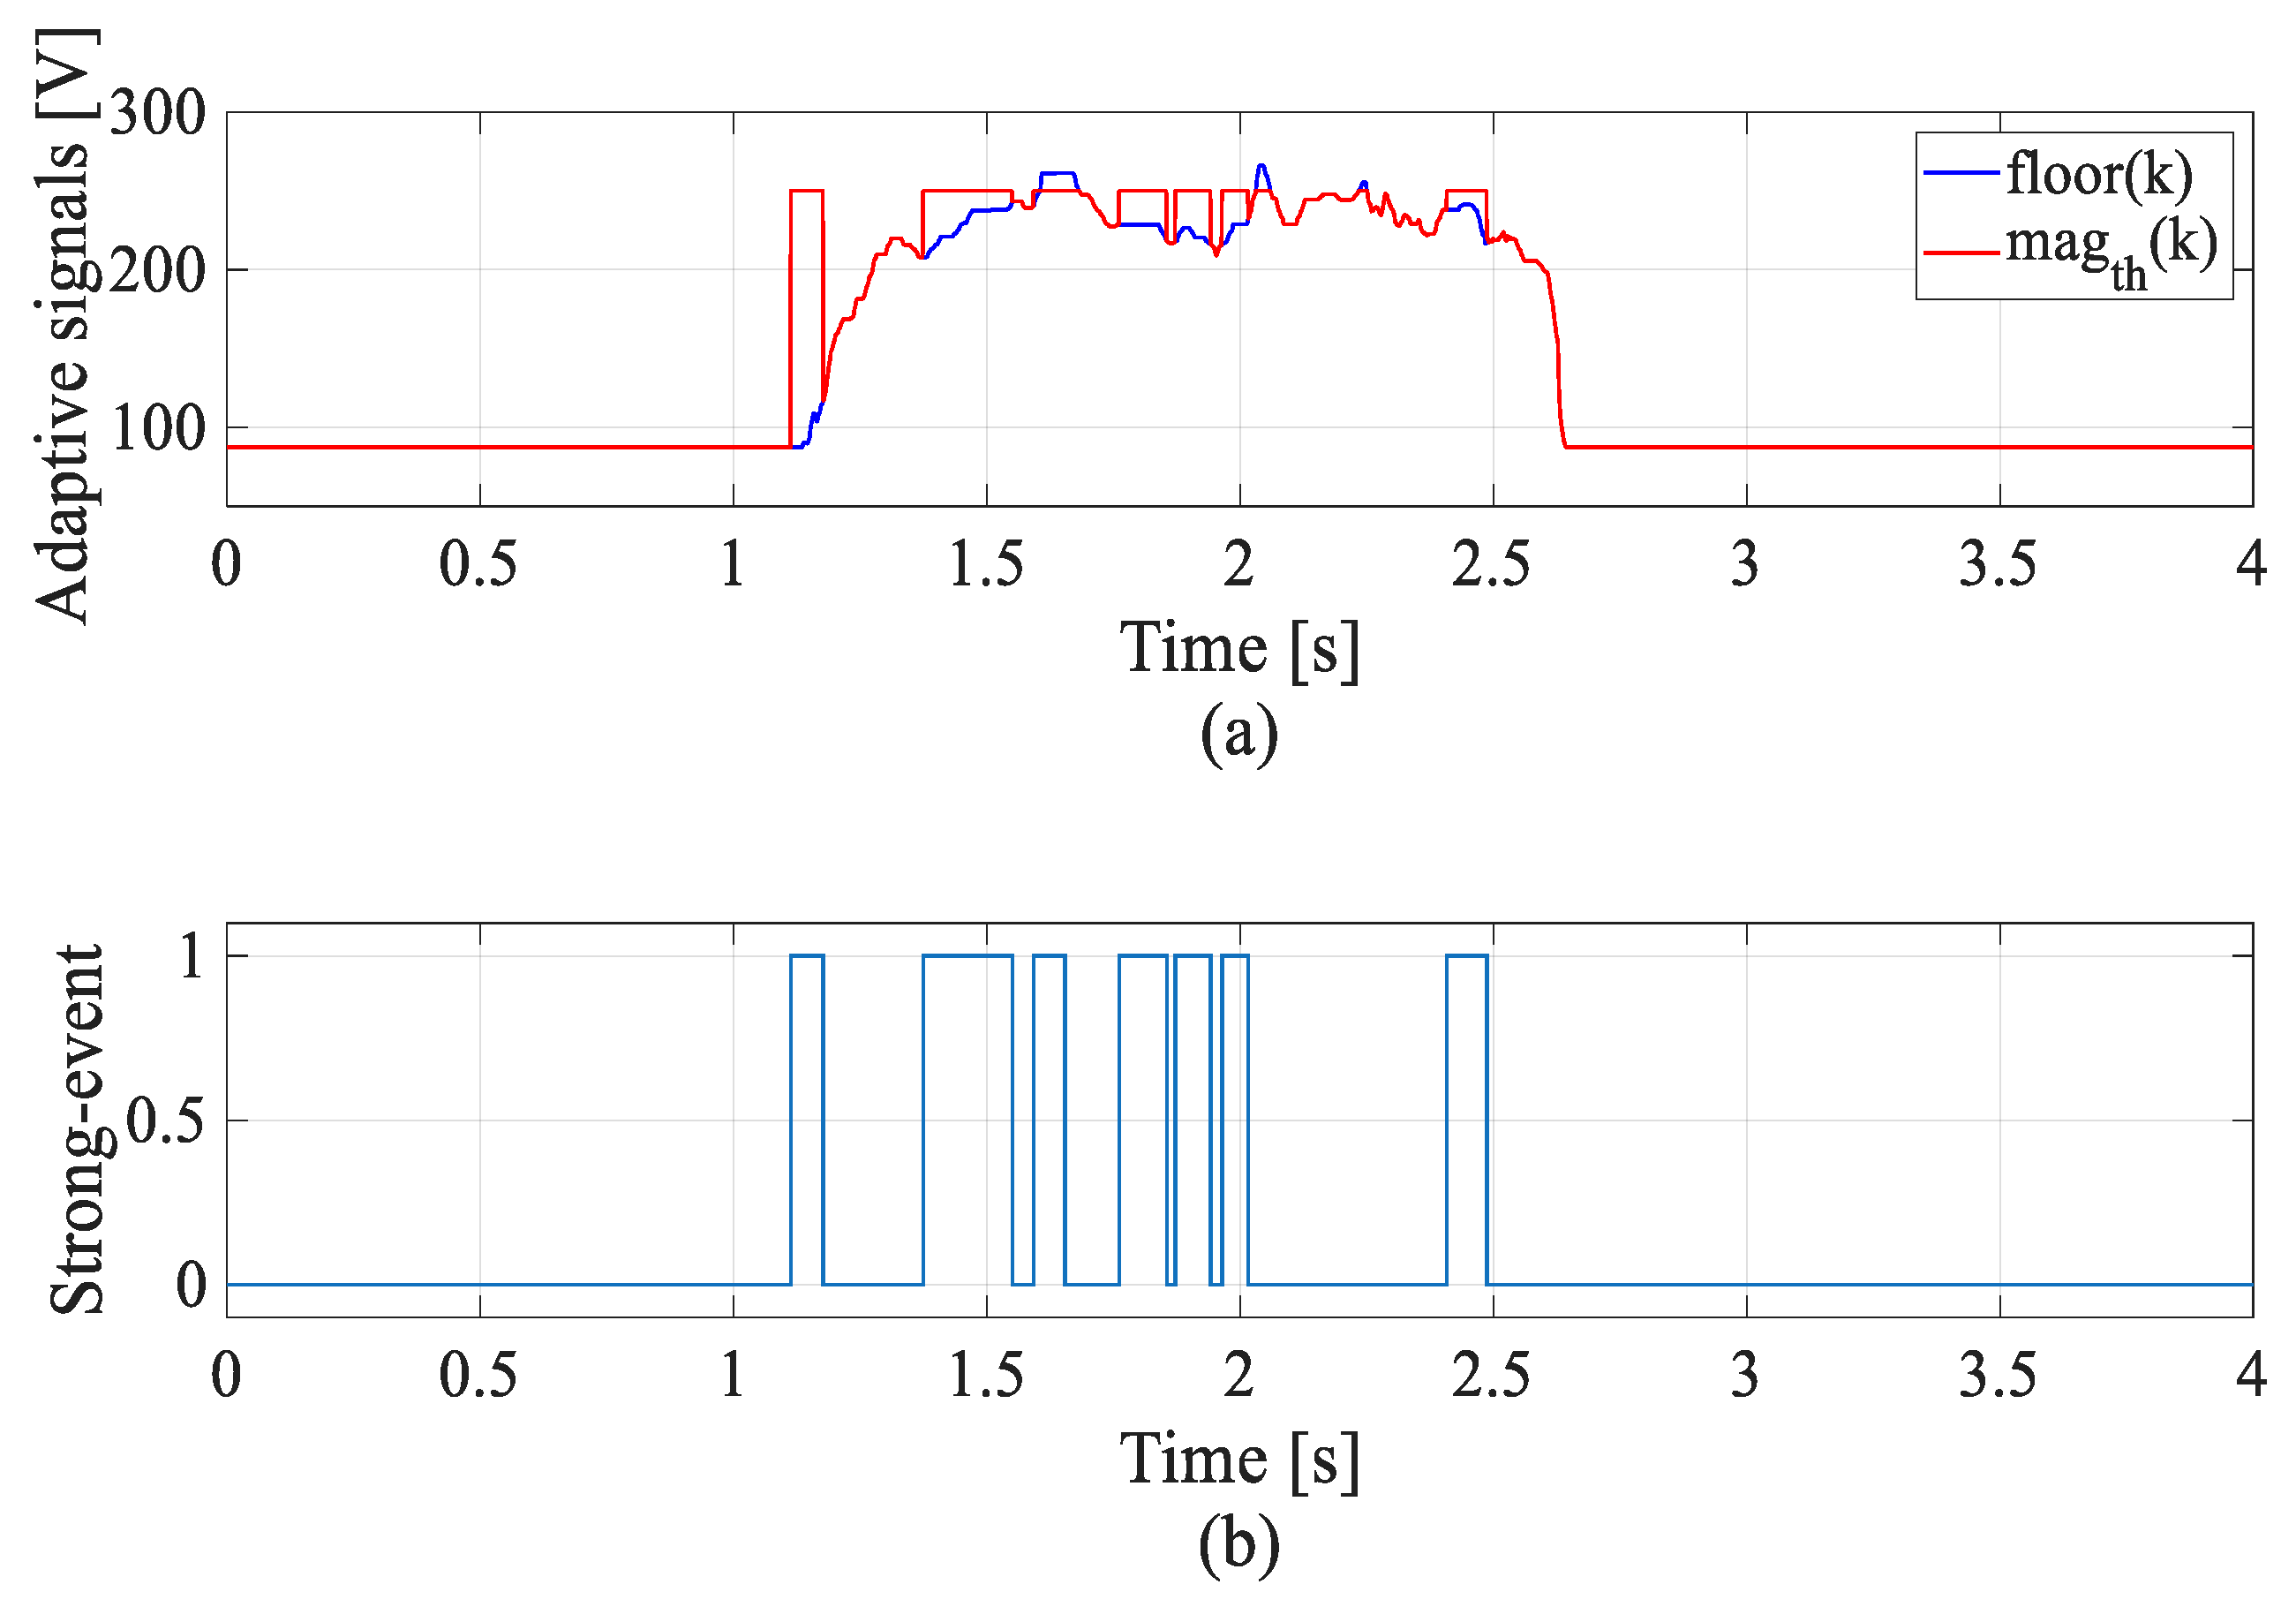
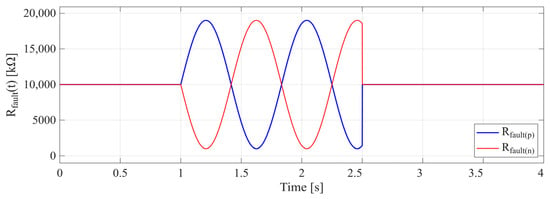
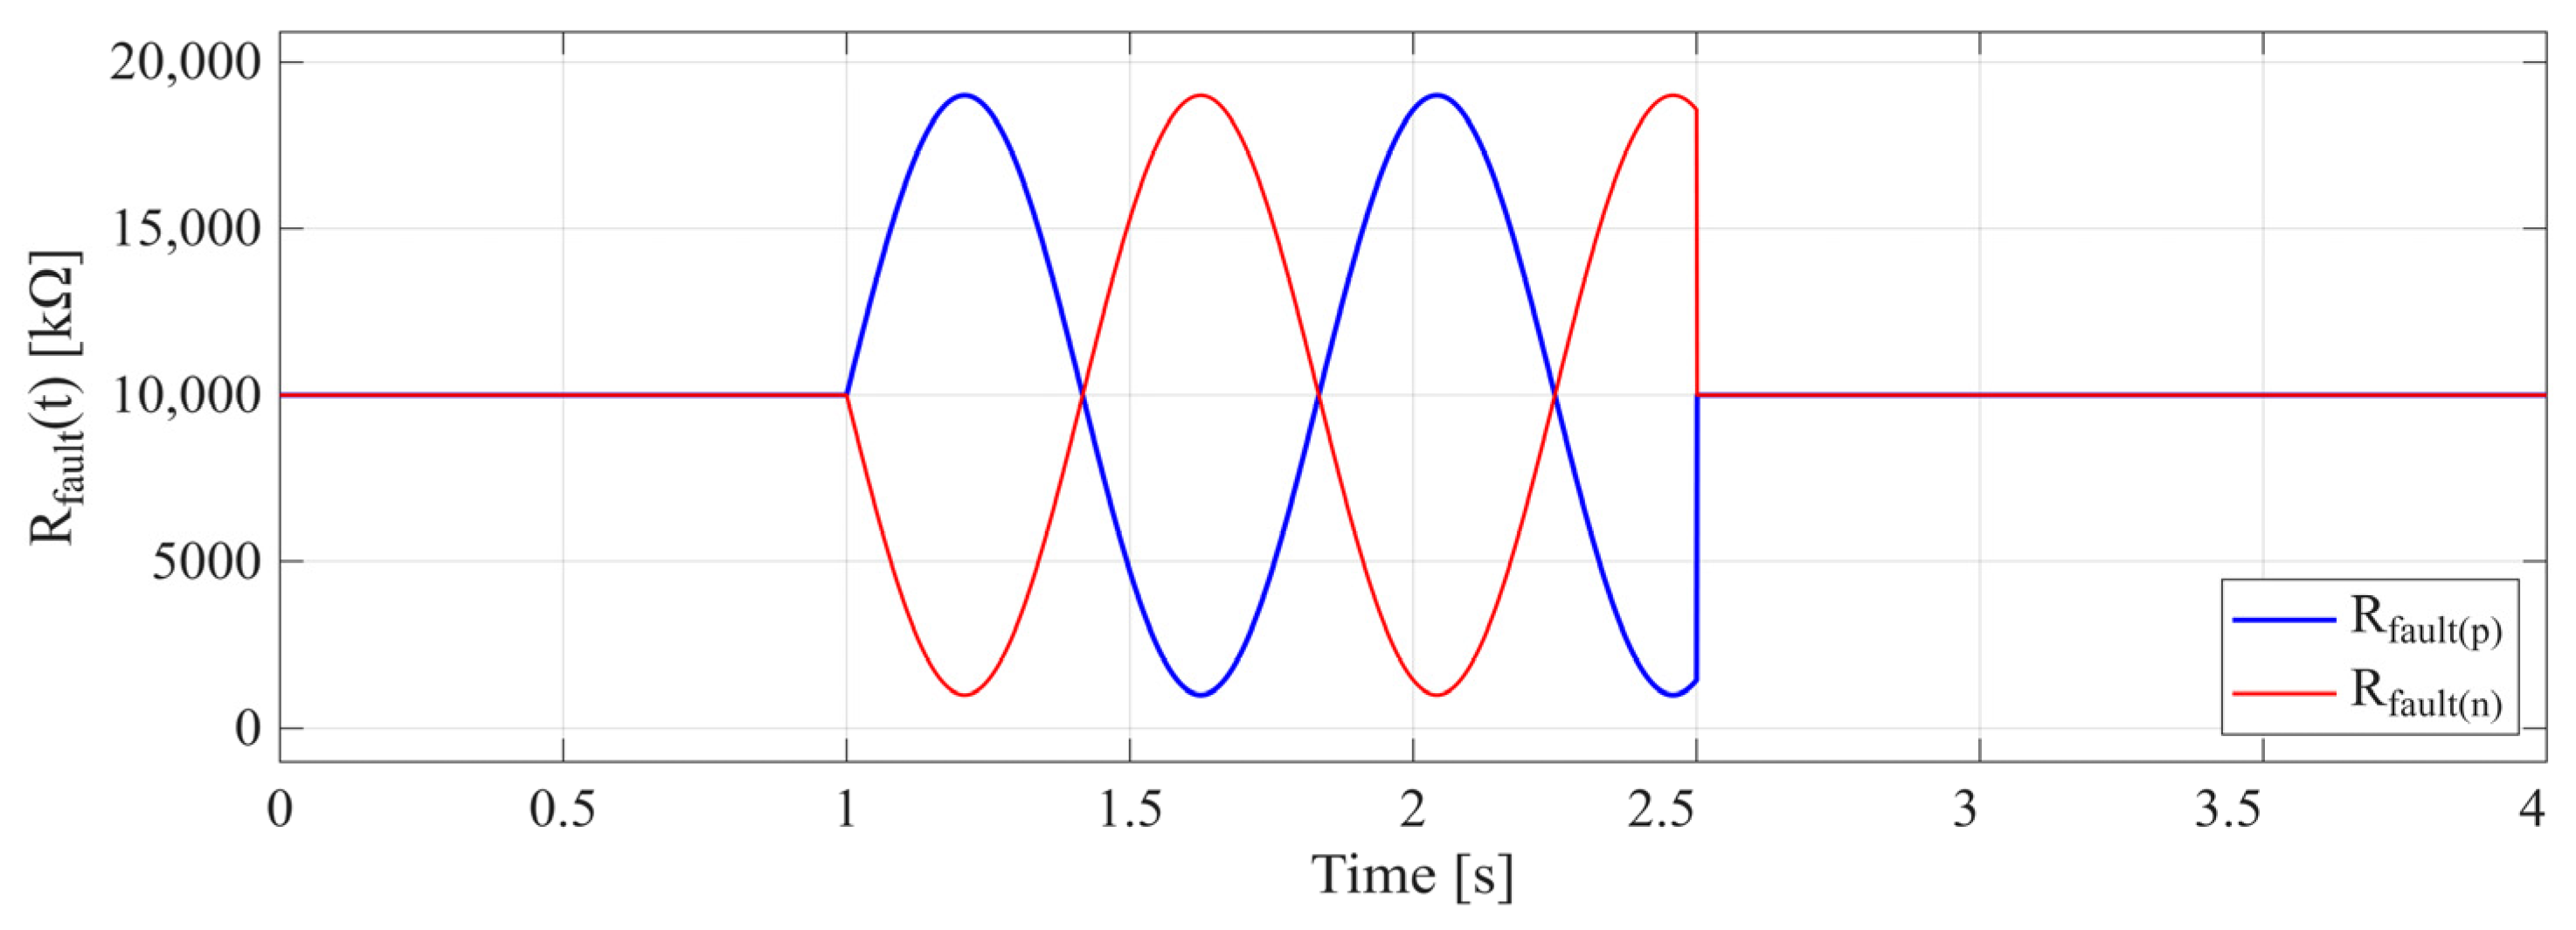
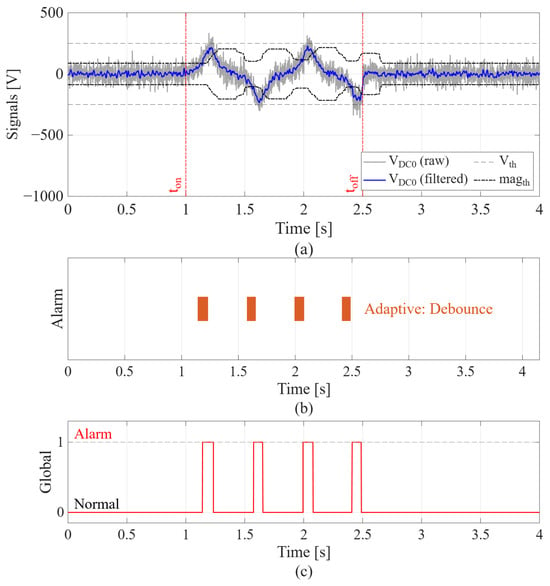
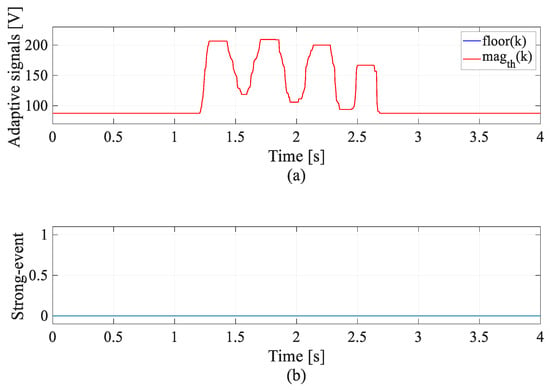
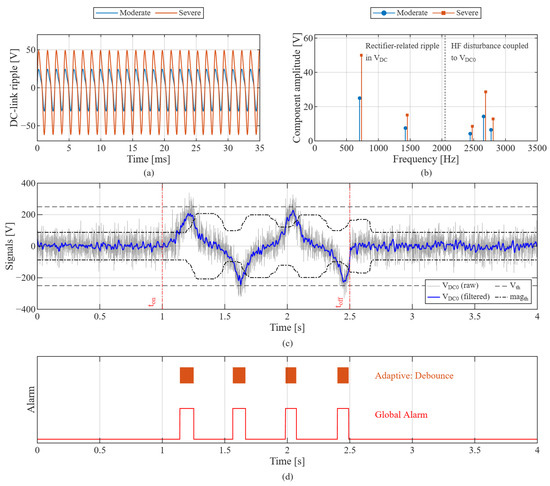
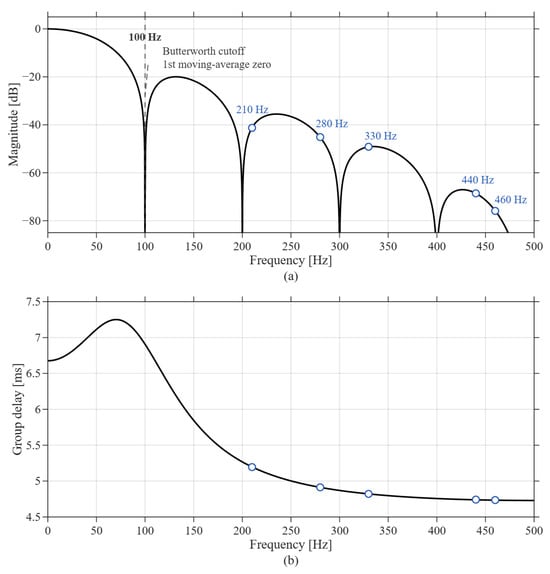
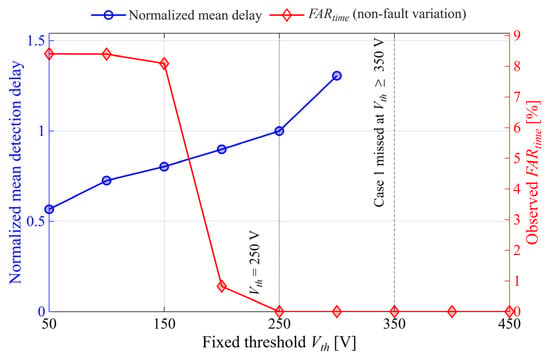
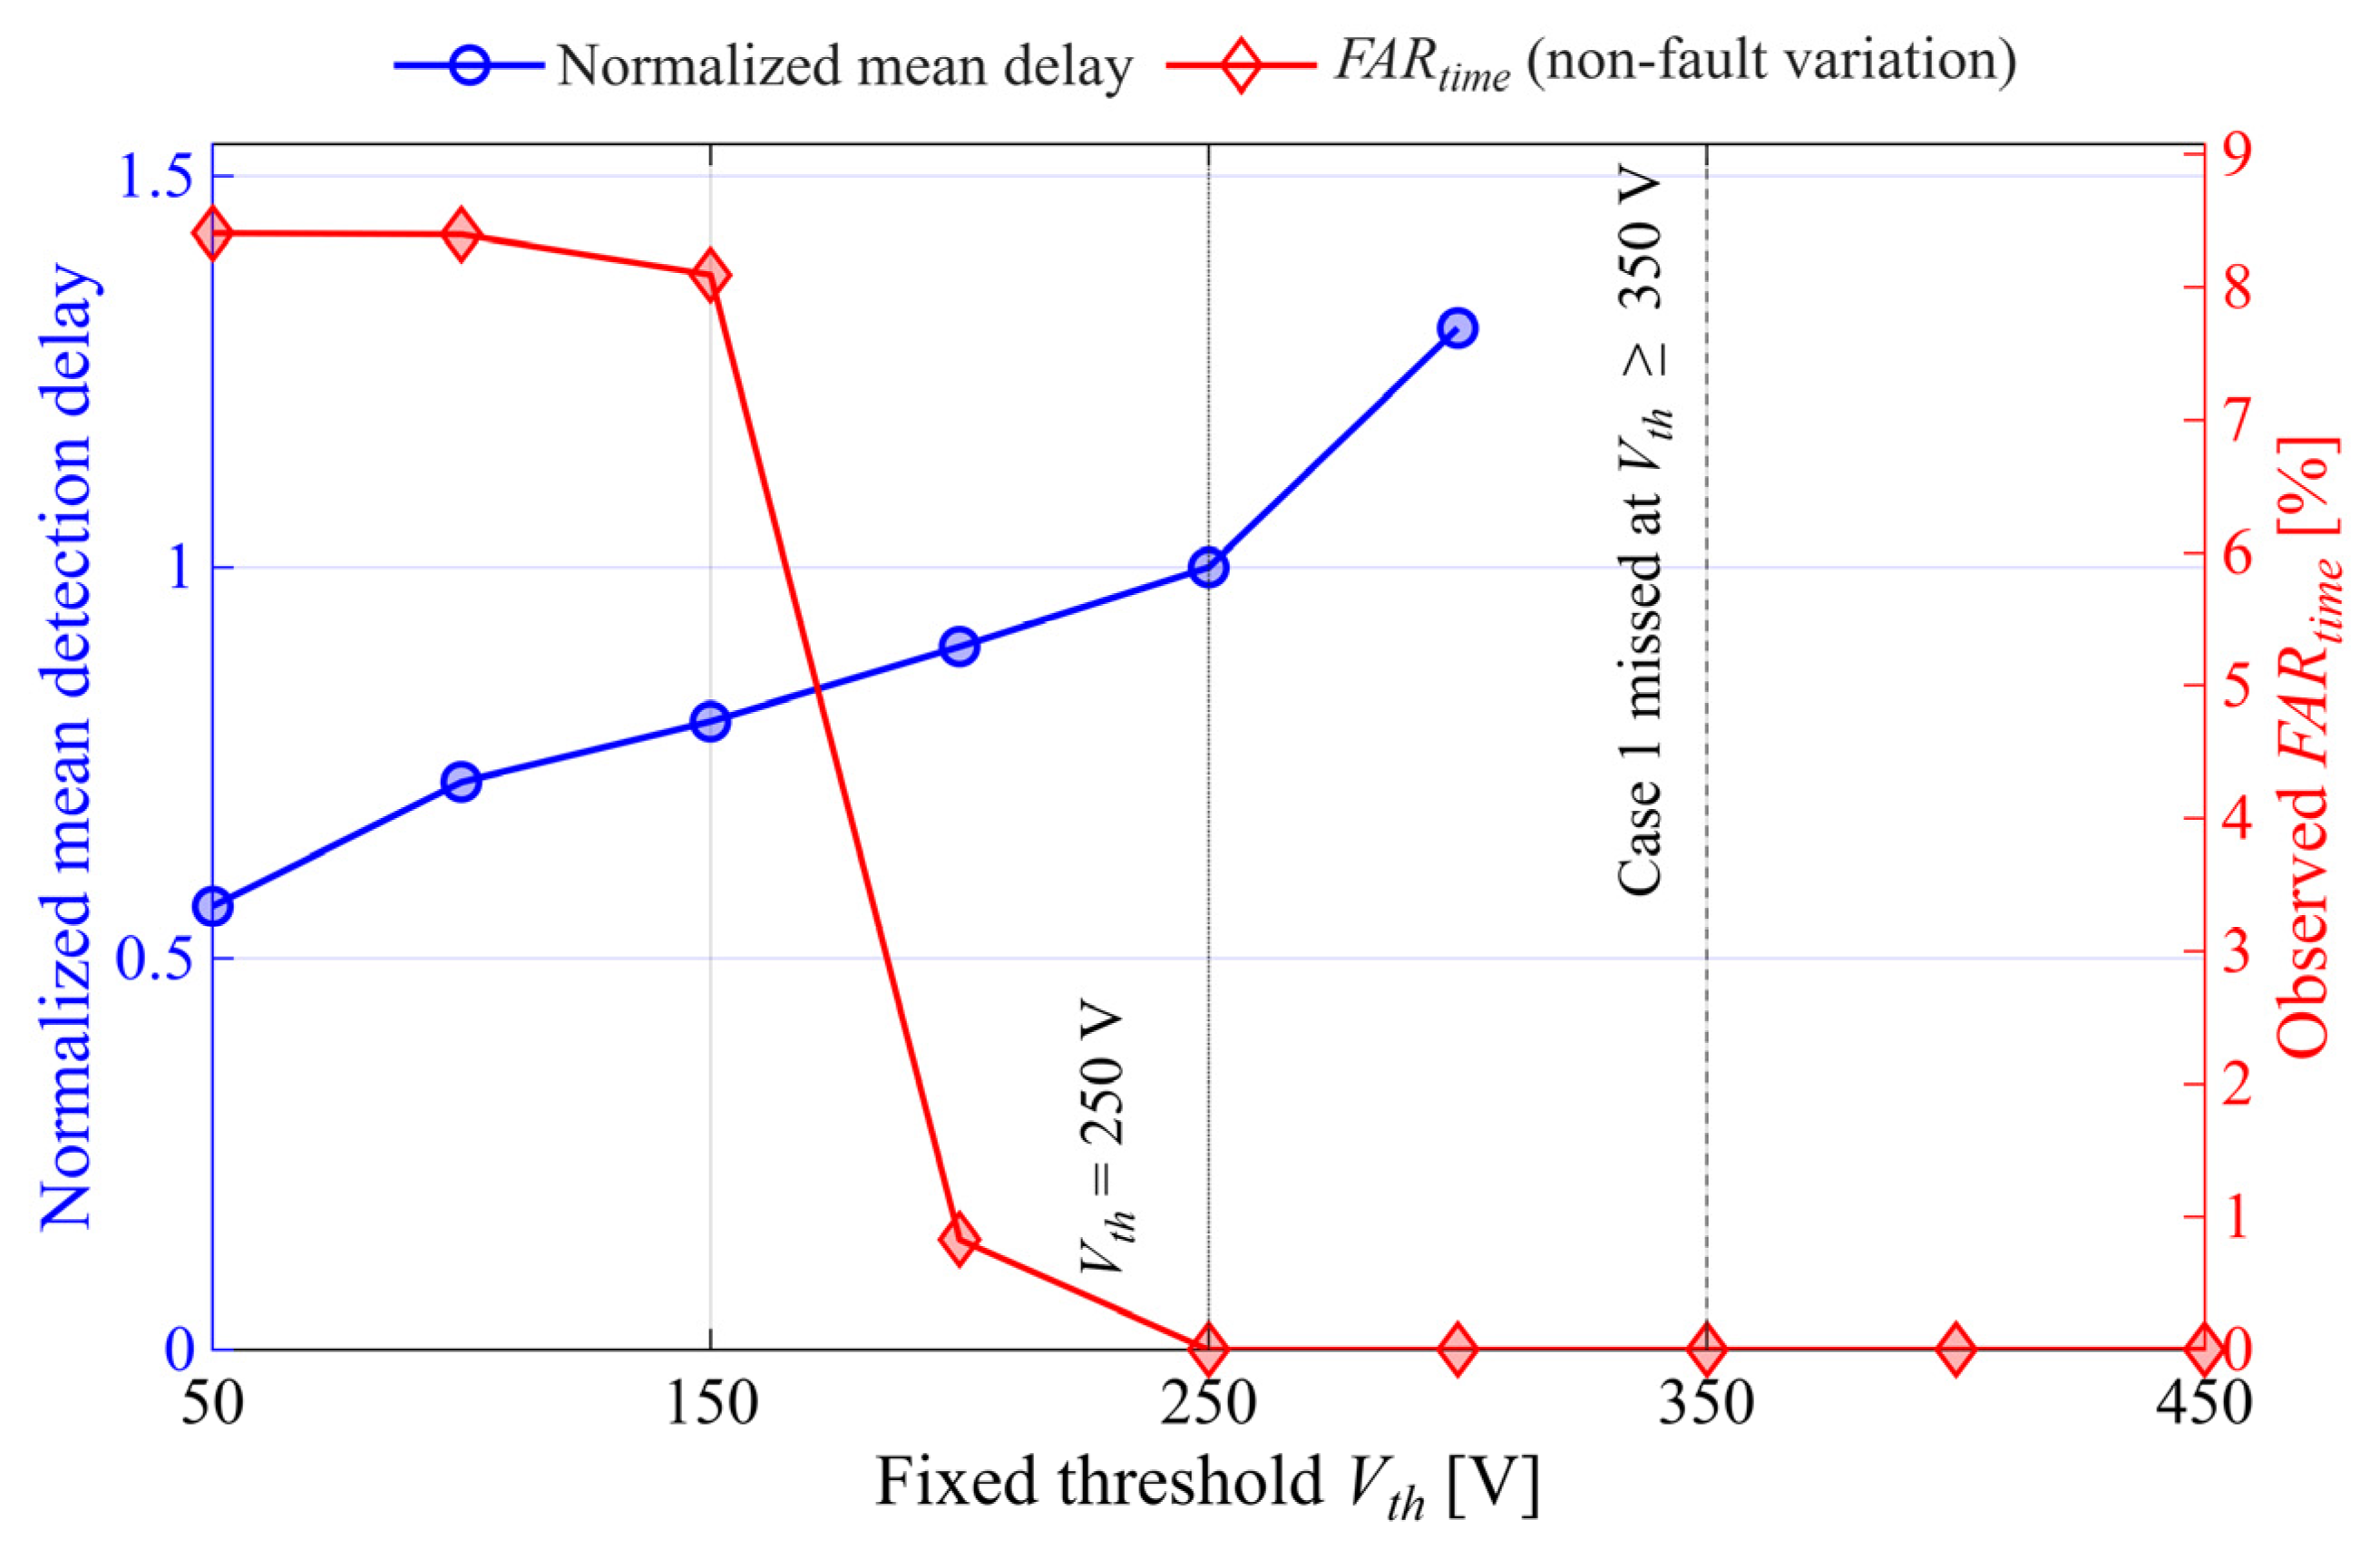

Disclaimer/Publisher’s Note: The statements, opinions and data contained in all publications are solely those of the individual author(s) and contributor(s) and not of MDPI and/or the editor(s). MDPI and/or the editor(s) disclaim responsibility for any injury to people or property resulting from any ideas, methods, instructions or products referred to in the content. |
© 2026 by the authors. Licensee MDPI, Basel, Switzerland. This article is an open access article distributed under the terms and conditions of the Creative Commons Attribution (CC BY) license.