


Abstract
Conventional underwater optical tags have limited operating range and reliability, whereas active acoustic tags require onboard power and periodic maintenance, restricting long-term deployment. This study proposes a passive underwater acoustic tag that encodes information in a two-dimensional array of strongly scattering corner reflectors and weakly scattering, sound-absorbing coating elements. A coupled acoustic–structure frequency-response model was established to quantify the scattering and absorption characteristics of the two element types. A multifrequency imaging and decoding method was then developed by combining near-field delay-and-sum (DAS) beamforming with an adaptive threshold derived from the prescribed number of black elements. Coupled acoustic–structure finite-element simulations were performed for five representative 4 × 4 patterns over 65–70 kHz. Under ideal free-field conditions, the two element types remained acoustically distinguishable throughout the simulated band, and the proposed method recovered all five prescribed patterns. These results demonstrate the feasibility of the concept under the modeled conditions. Because the tag contains no onboard power supply or integrated circuitry, it may provide a simple, low-maintenance platform for long-term underwater identification. Potential applications include equipment localization and traceability, subsea pipeline tagging, and robotic inspection and navigation.
1. Introduction
As marine-resource development, subsea-infrastructure operation and maintenance, and autonomous missions extend into deeper and more remote waters, underwater vehicles must obtain reliable positioning, navigation, and target identity information in poor visibility, strong reverberation, and complex currents. Underwater tagging technology has therefore become essential to the long-duration autonomous operation of marine equipment. Existing unmanned underwater vehicles typically navigate by combining inertial measurements, terrain and visual matching, acoustic navigation references, and other observations; among these, acoustic systems remain the primary means of medium- and long-range localization and information acquisition [1]. Although optical tags are intuitive and can provide high information density, their recognition range and reliability are constrained by absorption, scattering, turbidity, and variations in illumination [2]. Acoustic beacons, transponders, and active sonar systems widely used in engineering achieve reliable ranging and inter-node communication by actively transmitting sound waves. Such active acoustic tags require a power supply and periodic maintenance and are therefore costly when deployed densely or left in place for extended periods [3]. The long-term operation of underwater acoustic tags is constrained by limited node battery capacity and the difficulty of underwater maintenance, issues that have been investigated in previous studies [4]. These constraints also highlight the importance of reducing local power requirements in acoustic tagging systems intended for long-term underwater deployment [5]. There is therefore a clear engineering need for passive underwater acoustic tags that require no local power supply and can retain identity information during long-term deployment.
Research on passive underwater tags has established a common approach in which engineered structures encode identity information in their acoustic echoes. Holm et al. achieved passive fish identification through the combined resonances of micromachined cavities [6], and Islas-Cital et al. demonstrated the feasibility of the enhanced passive sonar reflector SonarBell for locating seabed equipment [3]. Srivastava et al. subsequently developed the AcoustiCode acoustic tag based on Bragg backscattering from periodic structures [7]. Satish et al. proposed horizontally layered-medium tags [8], radially layered omnidirectional acoustic identification (AID) tags [9], and multilayer shell tags [10]. Matched filtering was further introduced to improve their detectability in reverberant environments [10]. Zhou et al. investigated frequency-, time-, and bearing-domain coding using Rayleigh-wave resonances of polymer spheres and scattering features produced by ribs and helical grooves [11,12]. More recently, acoustic-tag research has expanded to ultrasound-powered underwater backscatter tags, multistatic localization of multiple tags, and broadband battery-free high-data-rate communication [13,14,15]. These studies demonstrate that structural echoes can carry identity information. Existing approaches, however, generally encode serial features in the frequency, delay, or bearing domain, and their code elements typically consist of individual or layered structures, resulting in limited information capacity. Relatively little work has examined encoding and decoding within a regular two-dimensional spatial array by exploiting contrasts between strong and weak scattering.
The structural design of passive acoustic tags is closely related to research on acoustic metamaterials and metasurfaces. Acoustic metamaterials and metasurfaces can use subwavelength unit cells to control the amplitude, phase, and propagation path of a sound field [16,17], but the high acoustic impedance of water and fluid added mass substantially alter structural vibration, scattering, and absorption. Existing studies have developed underwater subwavelength sound-insulation panels, passive polyurethane sound-absorbing layers, and perforated-plate acoustic carpet cloaks [18,19,20]. Related work has also advanced analysis and validation methods for measuring the sound absorption of underwater materials, characterizing uncertainty in rubber acoustic coatings, and numerically computing scattering from complex boundaries [21,22,23,24]. These findings show that material impedance and geometric resonance can be tailored to produce stable echo elements with enhanced or attenuated responses. Most existing research, however, focuses on acoustic cloaking, sound insulation, or sound-field control and has not fully translated metasurface concepts into two-dimensional tag elements designed to carry information.
At the decoding stage, advances in imaging sonar, broadband classification, robust array beamforming, and active-sonar echo enhancement have laid the foundation for spatial discrimination in complex environments [25,26,27,28]. Conventional frequency-domain beamforming, two-dimensional imaging with MIMO sonar, and deconvolution-based forward-looking imaging can further improve image resolution and suppress beam sidelobes [29,30,31]. These methods, however, primarily address imaging of continuous targets or source distributions. For waves scattered by passive acoustic structures, reliable assignment of near-field image intensities to individual code elements requires the tag structure, sonar band, and decision threshold to be designed jointly.
Accordingly, this study proposes a design and recognition method for a passive underwater two-dimensional acoustic code tag. The tag consists of strongly scattering corner-reflector elements (white code elements) and weakly scattering acoustic-coating elements (black code elements). A regular 4 × 4 array provides two-dimensional spatial encoding of binary information, while active sonar interrogates the tag and records its scattered echoes for imaging and decoding the structural information. The study addresses the limited capacity of existing one-dimensional underwater acoustic codes and the high power consumption and maintenance costs of active tags. First, a coupled acoustic-structure frequency-response model is established for the underwater two-dimensional acoustic code elements, and the resonant scattering of the corner reflector and impedance-matched absorption of the acoustic coating are analyzed to guide the design of strongly and weakly scattering elements. Second, several representative topological configurations are constructed from the selected element parameters, and their scattering responses in the target band are investigated. Finally, a broadband near-field DAS imaging and adaptive-threshold decoding method is developed, and finite-element simulations are used to evaluate the feasibility of the proposed encoding and decoding scheme under the prescribed conditions.
2. Acoustic Scattering by Individual Code Elements
A conventional two-dimensional code is typically composed of black and white cells arranged in a two-dimensional grid. On this basis, the proposed two-dimensional acoustic code exploits the different scattering characteristics of two passive element types to implement binary black-and-white encoding analogous to that of a conventional two-dimensional code. The strongly scattering corner reflector serves as the white element representing 1, whereas the acoustic-coating element serves as the black element representing 0; together, they form the coding basis of the two-dimensional acoustic code. A coupled underwater acoustic-structure frequency-response model and finite-element simulations are used to quantify the scattering behavior of the two basic elements and determine their structural dimensions, thereby providing a theoretical basis for encoding complete configurations.
2.1. Design of the White Code Element Based on a Corner Reflector
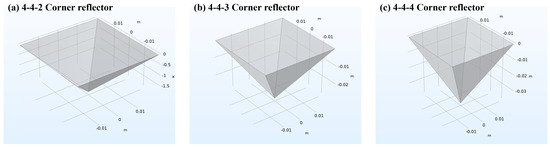
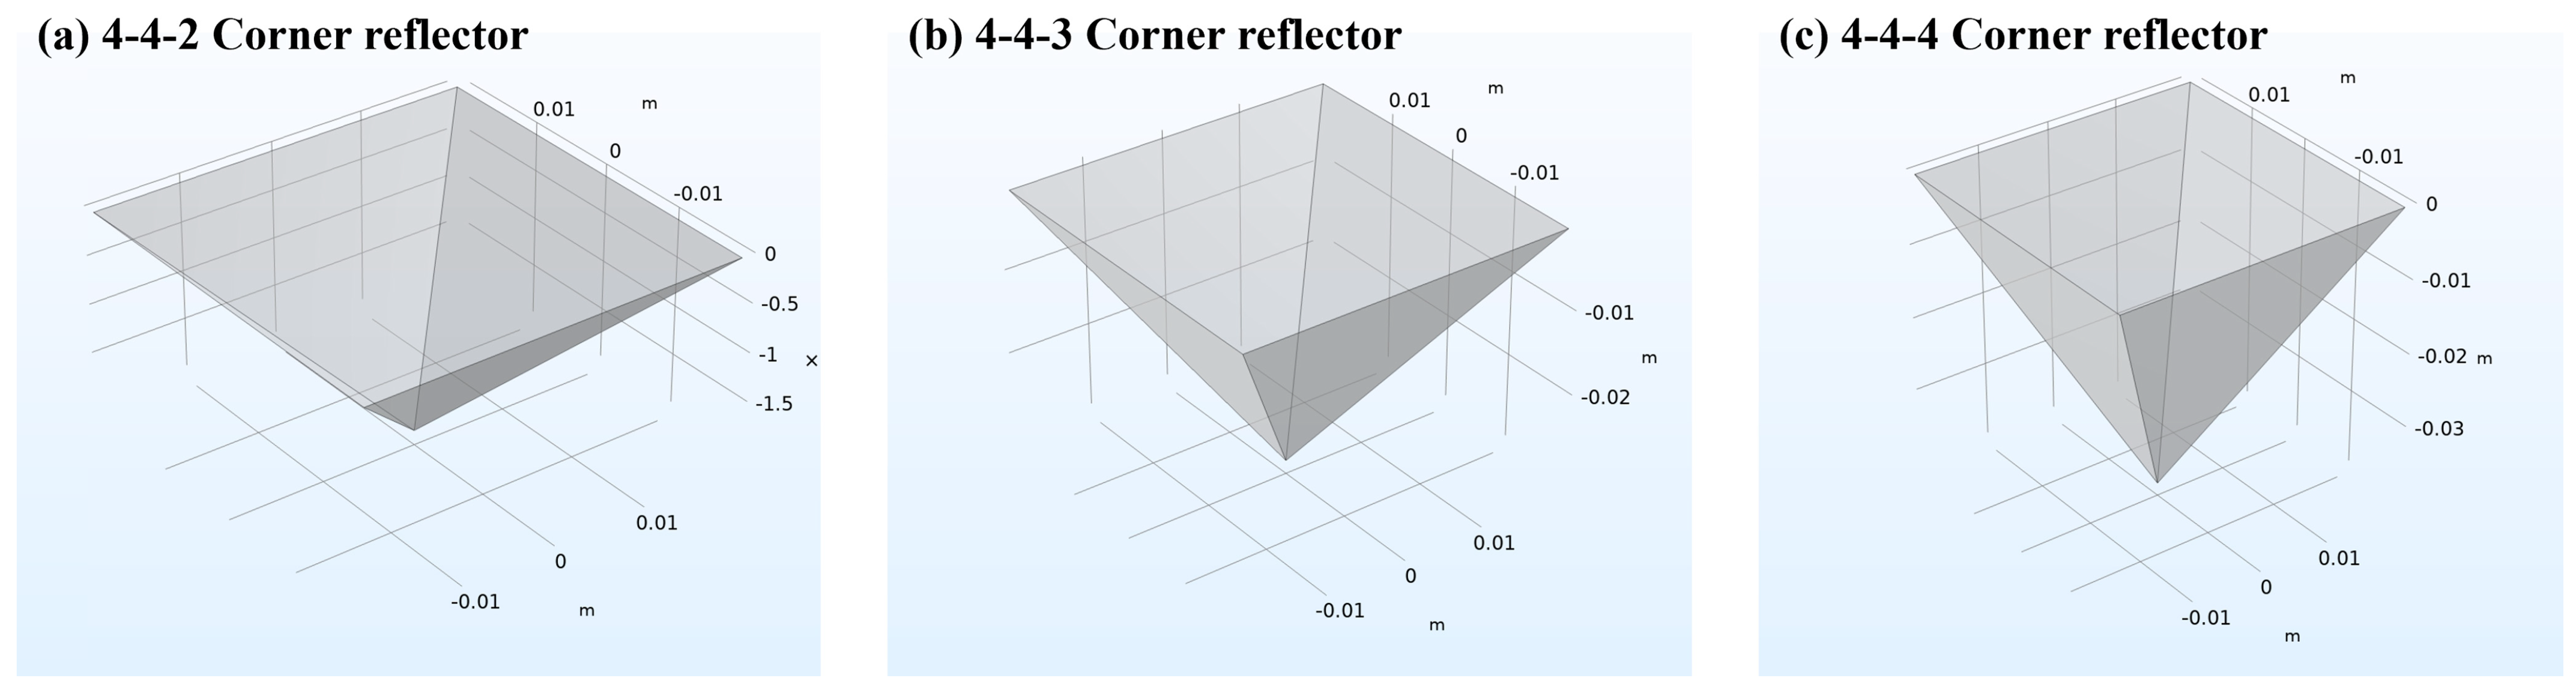
A square-based corner reflector with a base side length of 4 cm is designed as the strongly scattering element of the two-dimensional acoustic code. Corner reflectors with heights of 2, 3, and 4 cm are considered to investigate the effect of structural dimensions on underwater scattering. The elements are made of stainless steel with a density of 7870 kg/m3, Young’s modulus of 2.11 × 10¹¹ Pa, Poisson’s ratio of 0.3, and a wall thickness of 2 mm. Figure 1 illustrates the three corner-reflector geometries.
Figure 1.
Geometries of the three corner reflectors.
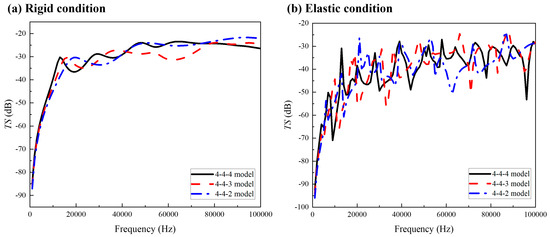
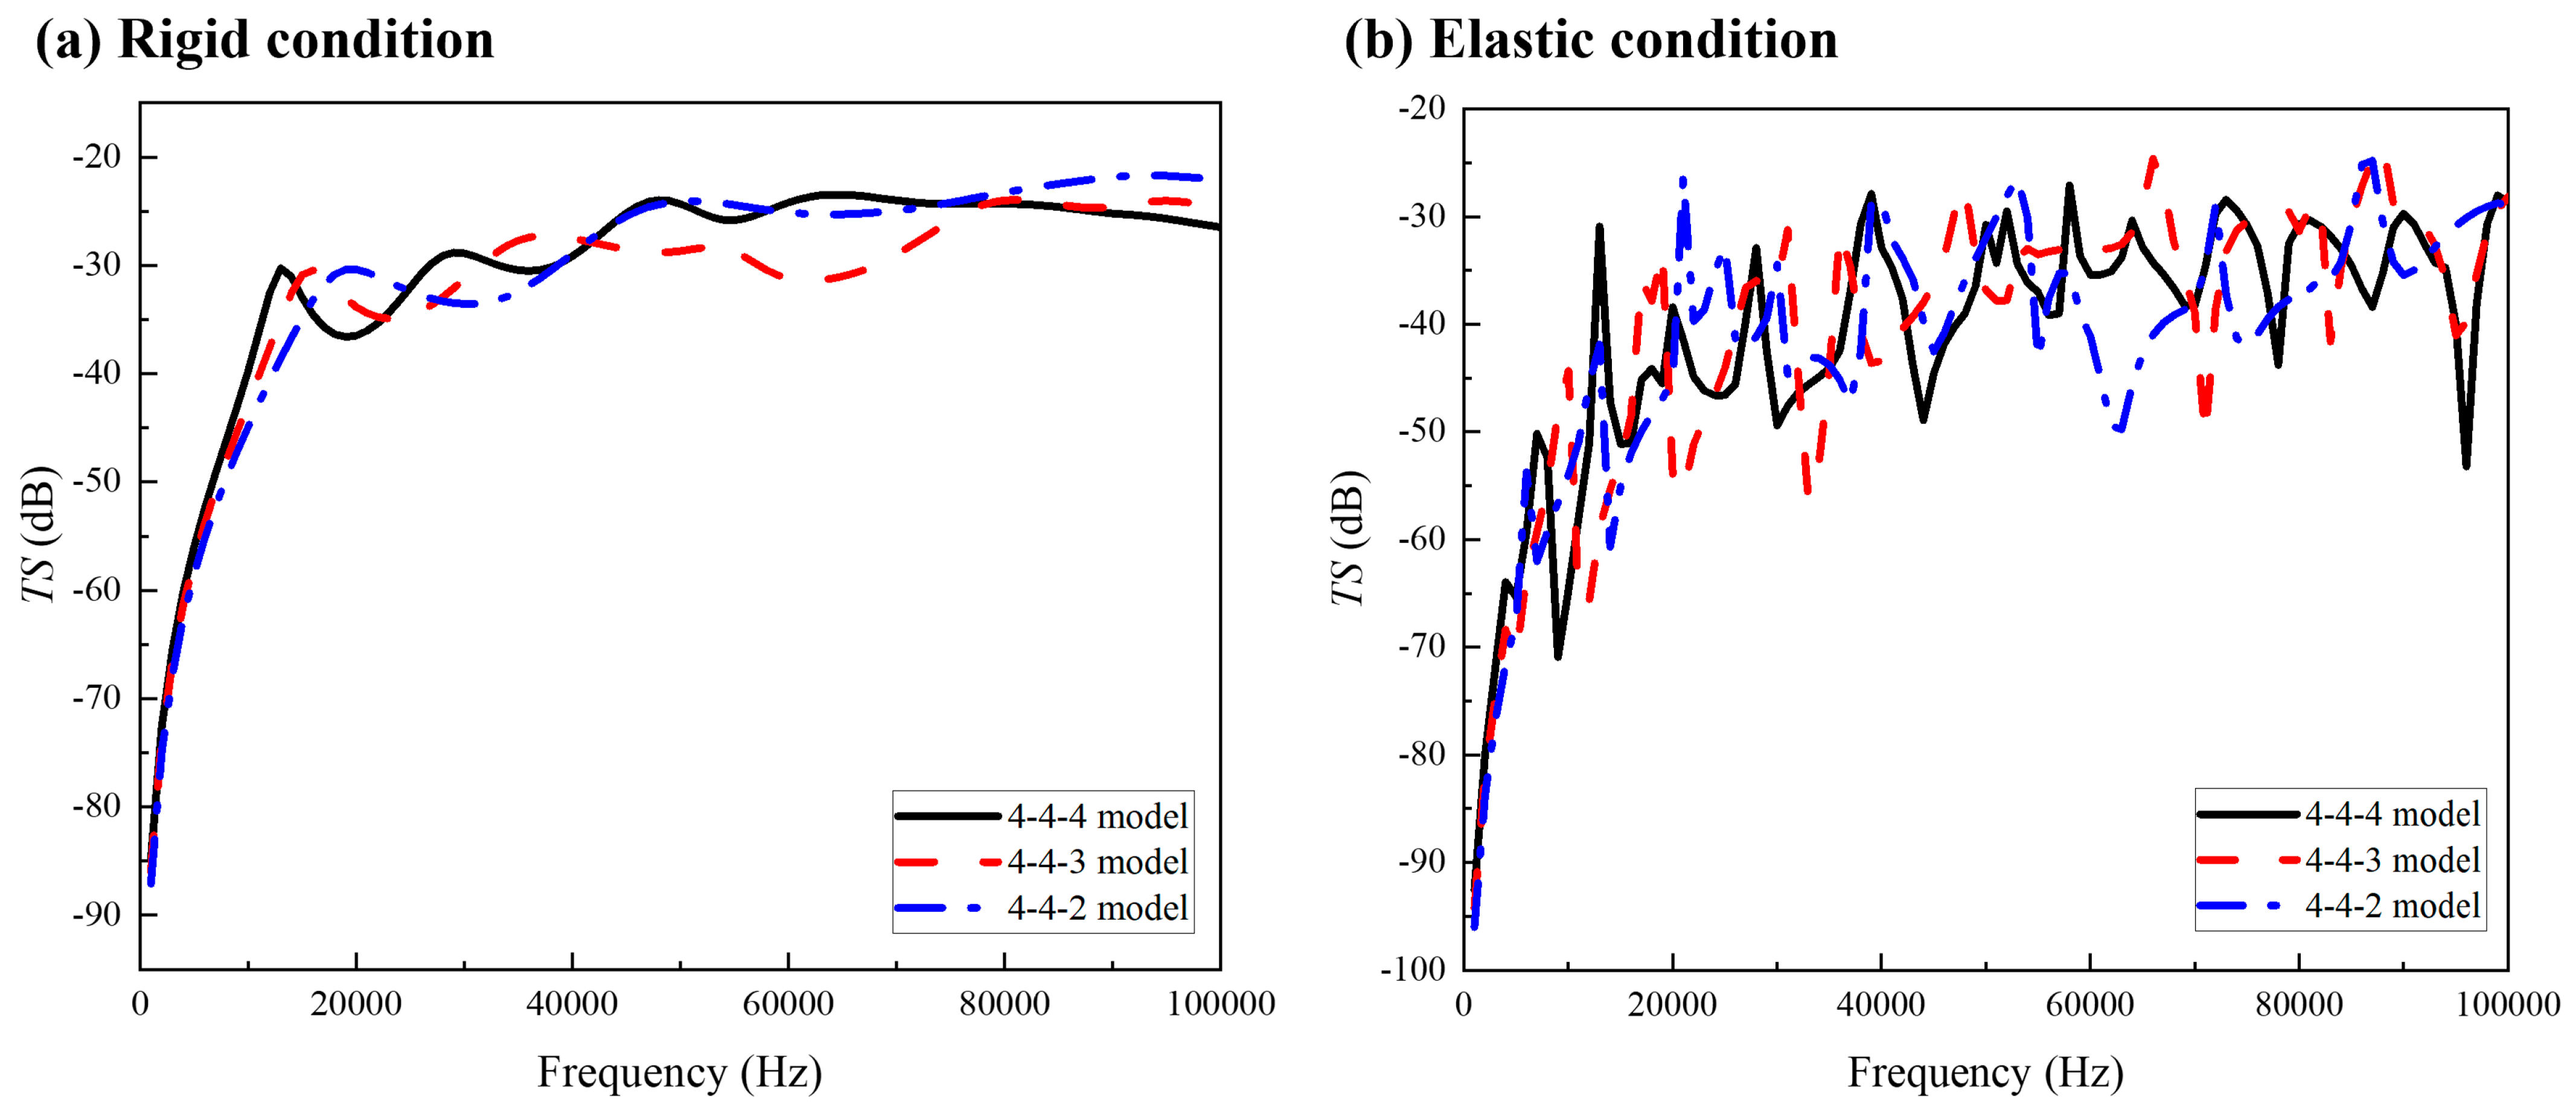
Simulations are performed in COMSOL Version 6.3 Multiphysics using the Acoustic-Shell Interaction interface over 1–100 kHz. Results are obtained for both perfectly rigid and elastic conditions, as shown in Figure 2.
Figure 2.
Target strength spectra of the three corner reflectors.
The rigid and elastic simulations in Figure 2 show that the target strength of the corner reflector generally increases with frequency while exhibiting pronounced oscillations. Comparing the target strengths of reflectors with different heights reveals only small differences among the three geometries at high frequencies.
In Figure 2a, the rigid condition excludes structural resonance, so the simulated target strength reflects only acoustic scattering governed by the reflector geometry. The frequency of the first target-strength peak decreases as the reflector height increases. With the opening size held constant, increasing the height lengthens the acoustic propagation paths within the reflector that contribute most strongly to scattering. These longer paths allow similar phase conditions for coherent enhancement to be satisfied at lower frequencies. From an acoustic perspective, a greater height is therefore preferable for the corner-reflector design.
Figure 2b shows the simulated target-strength spectra of the three structures under elastic conditions. These spectra reflect the combined effects of geometric scattering and structural dynamics. For a thin-walled stainless-steel corner reflector under normally incident plane-wave excitation, the frequency-domain governing equation for the coupled acoustic-structure vibration, including both structural and fluid-loading parameters, is [32]
where is the angular frequency of the incident wave and f is the operating frequency; is the equivalent mass of the metal structure; is its equivalent bending stiffness; is the internal loss damping coefficient of stainless steel; is the frequency-dependent added mass induced by the surrounding water and varies nonlinearly with frequency; is the fluid radiation damping, which represents the energy dissipated as the vibrating structure radiates sound into the water; is the complex displacement-amplitude vector of the structure in the frequency domain; and is the acoustic excitation force obtained by integrating the incident plane-wave pressure over the structural wall. By neglecting the damping terms near resonance and adopting an equivalent single-mode approximation, the underwater resonance frequency can be estimated implicitly as [32]
Equations (1) and (2) explain the low-frequency shift of the peak for the taller corner reflector in Figure 2. The stiffnesses of corner reflectors of different heights differ only slightly. Increasing the structural height, however, increases both the equivalent mass and the wetted area, thereby further increasing and ultimately lowering the peak frequency. Taken together, the acoustic and structural analyses indicate that taller corner reflectors provide a more favorable scattering response. The 4 cm high corner reflector is therefore selected as the white code element of the two-dimensional acoustic code.
2.2. Design of the Black Code Element Based on an Acoustic Coating
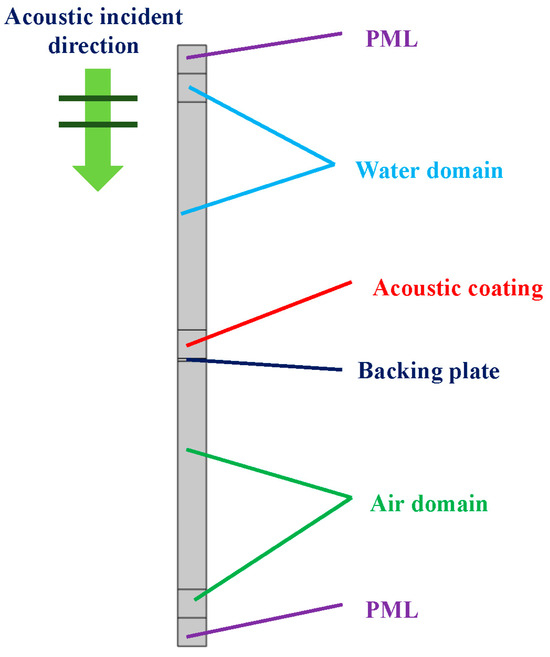
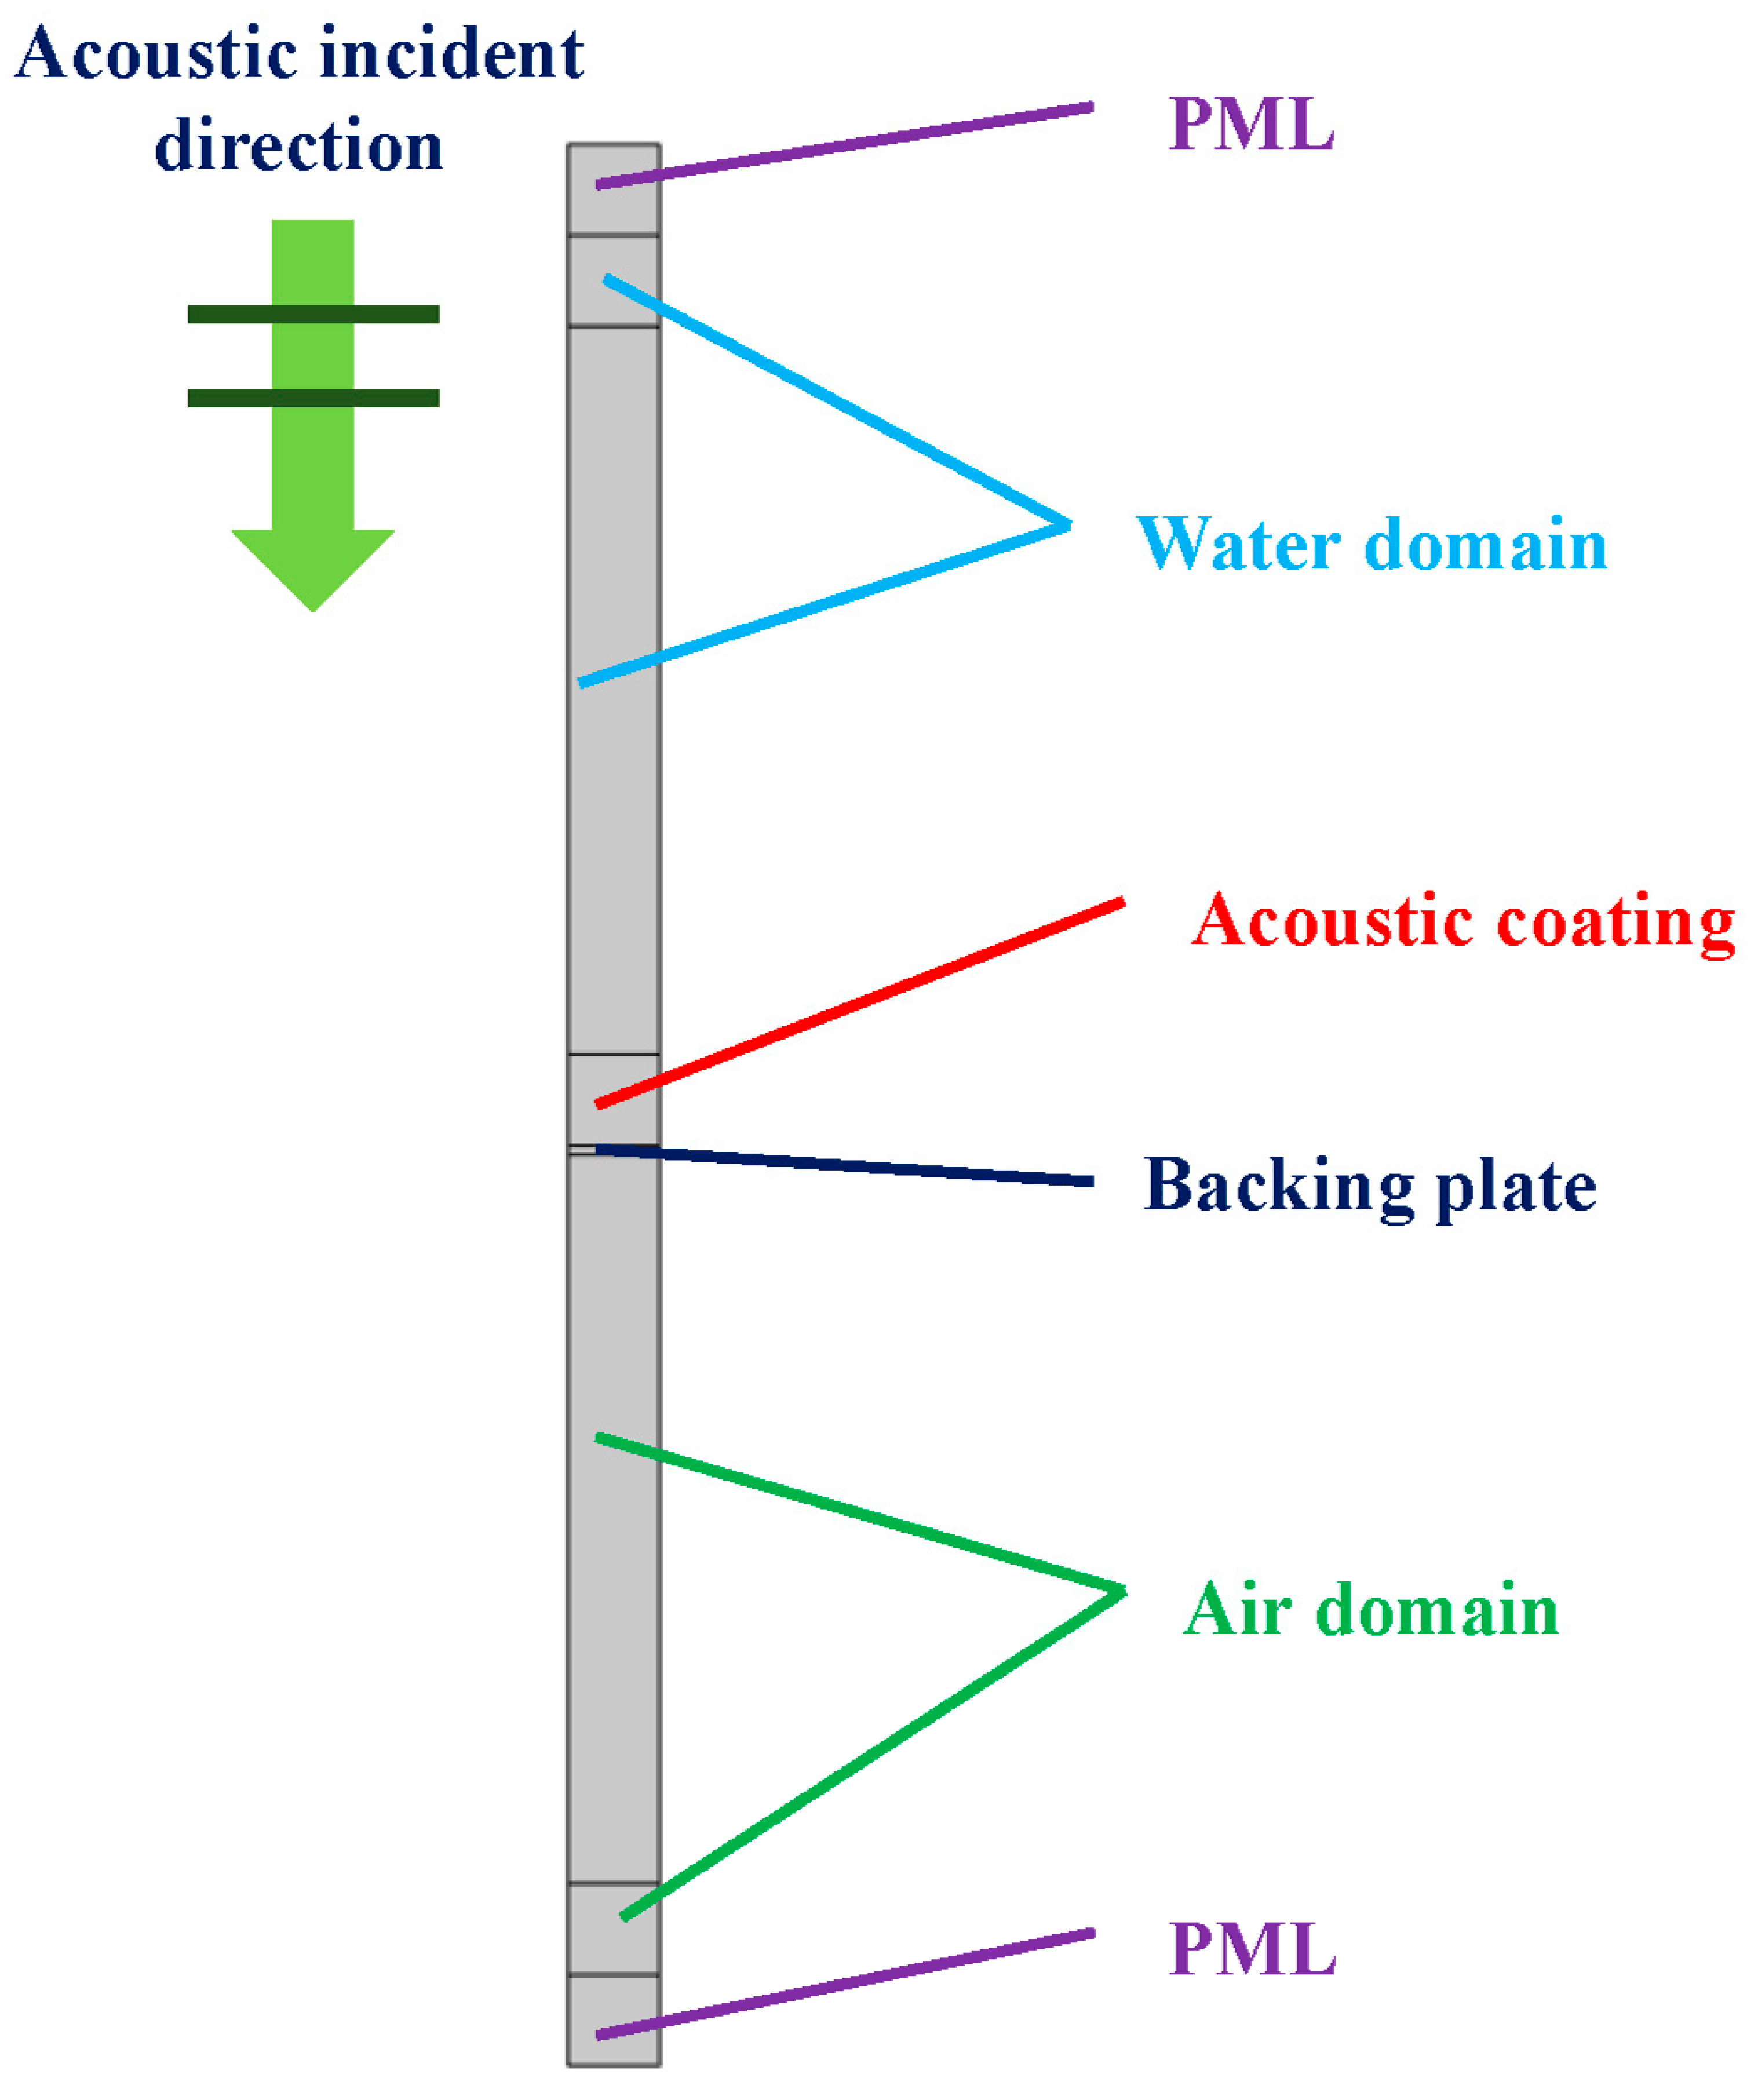
The black code element is designed to reduce acoustic reflection through impedance matching and absorb acoustic energy, thereby creating a clear scattering-strength contrast with the corner-reflector element. A coupled fluid–structure impedance-matching model is established from multilayer acoustic theory, and COMSOL is used to calculate the reflection and absorption coefficients. The Acoustic-Solid Interaction interface in COMSOL is used primarily to evaluate the reflection coefficient of the acoustic coating. To reduce computation time, a two-dimensional periodic model is adopted to simulate coatings of different thicknesses, as shown in Figure 3. Stainless steel is used as the backing material for all black code elements, with a thickness of 2 mm. Uniform acoustic coatings 1, 2, 3, and 4 cm thick are applied to the upper surface of the plate, which is in contact with water, while an air domain is placed below the plate. A representative rubber material is used for the coating. The material properties are listed in Table 1.
Figure 3.
COMSOL model of the acoustic coating.
Table 1.
Material parameters used in the acoustic-coating simulations.
The finite-element model in COMSOL yields the scattered acoustic pressure in the water domain. The scattered and incident pressures are averaged along a far-field sampling line parallel to the coating surface and located near the outer boundary of the water domain. The acoustic-pressure reflection coefficient is then calculated as [19]
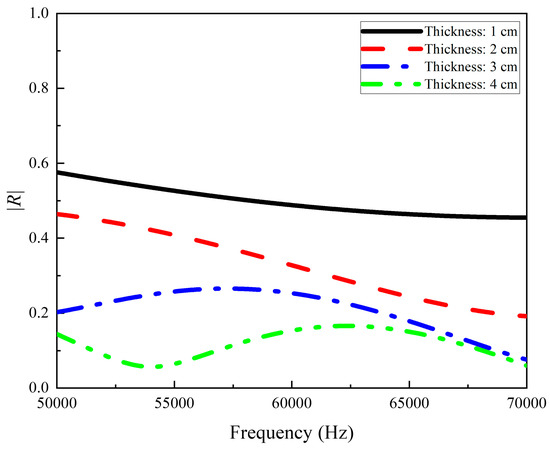
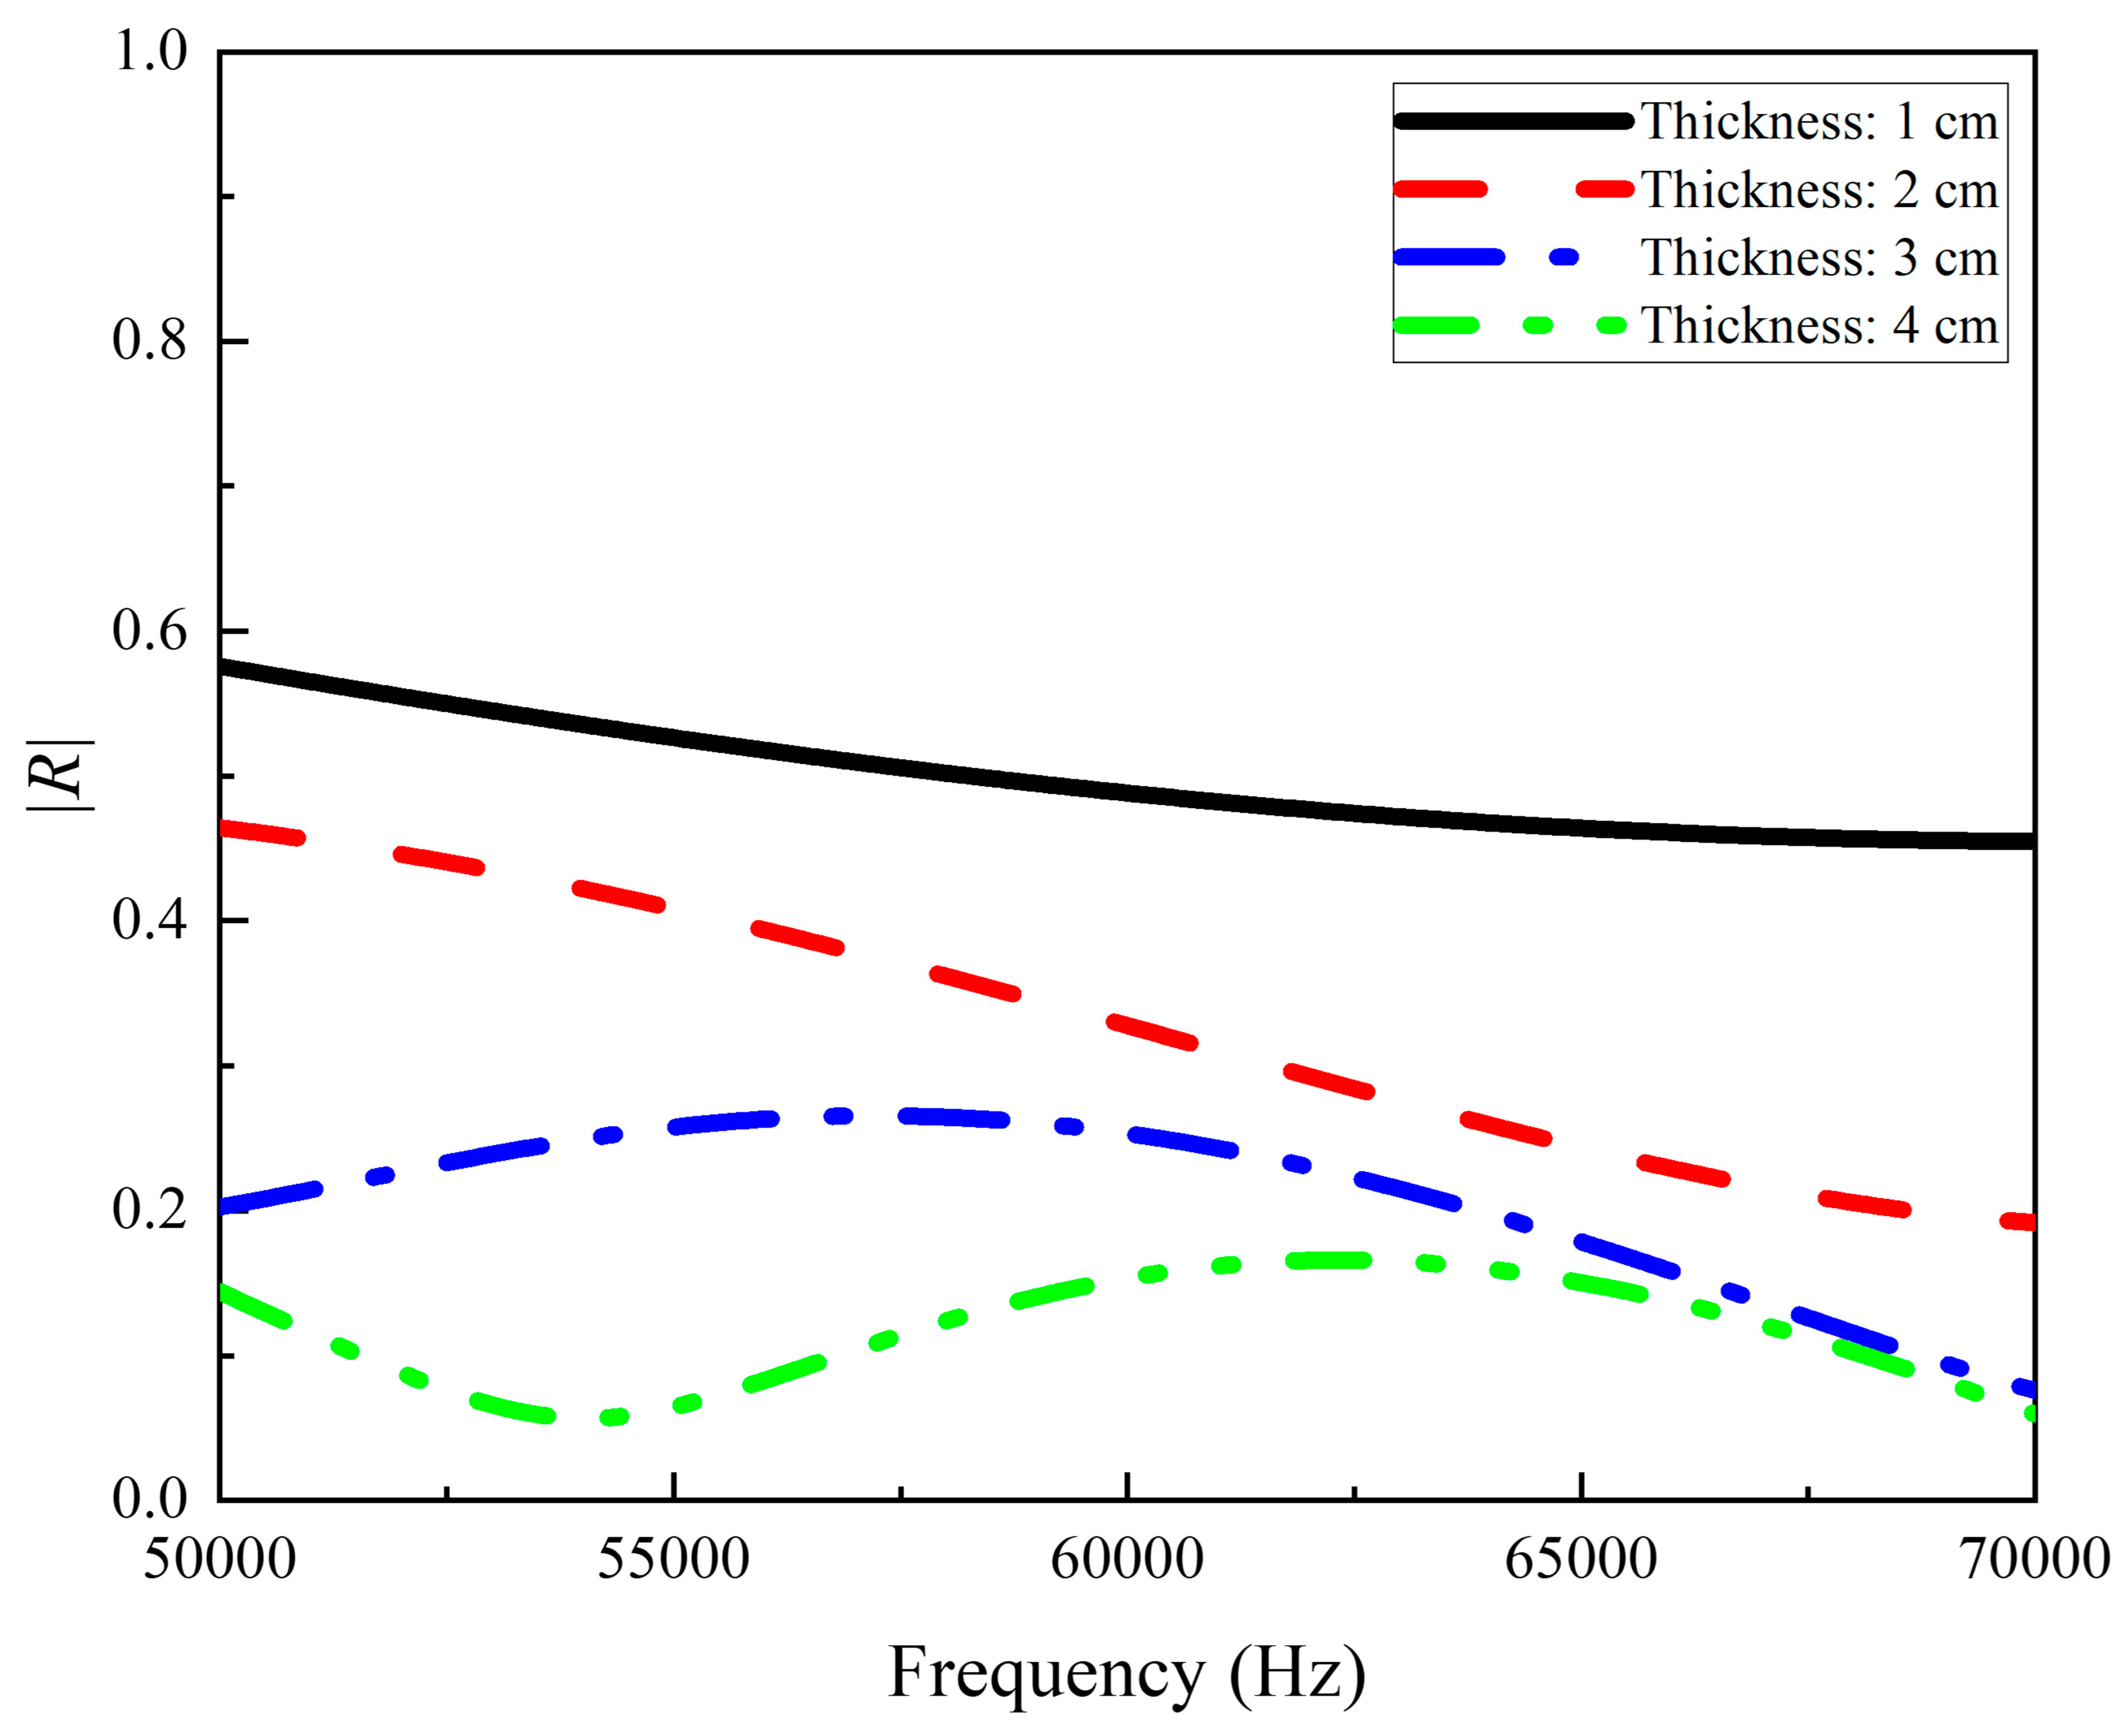
where is the scattered acoustic pressure at point r on the line, is the incident acoustic pressure at point i, and n is the number of mesh points on the line. Equation (3) is used to calculate the frequency-dependent magnitude of the reflection coefficient for coatings of different thicknesses, as shown in Figure 4.
Figure 4.
Frequency-dependent reflection coefficients of acoustic coatings with different thicknesses.
Figure 4 shows that acoustic coatings of different thicknesses applied to a 2 mm-thick steel backing plate exhibit different absorption responses. In general, the reflection coefficient decreases as the incident frequency increases, and thicker coatings produce smaller reflection coefficients. The representative rubber coating therefore provides appreciable sound absorption primarily at high frequencies and for thicker coatings. Within 65–70 kHz, both the 3 cm and 4 cm coatings provide good sound absorption. Given the need for a lightweight two-dimensional acoustic code structure, a coating thickness of 3 cm is selected. The 3 cm coating has an average reflection coefficient of approximately 0.12 over 65–70 kHz. Because the model is backed by an air cavity, acoustic transmission can be neglected [22]. The absorption coefficient is therefore obtained from the reflection coefficient as [21]:
where Nf is the number of frequency points. The resulting average absorption coefficient is approximately 0.98, which is used as the reference value for the black code element in subsequent simulations of the two-dimensional acoustic code. Considering both reflection suppression within the study band and the required structural dimensions, 3 cm is selected as the coating thickness.
3. Construction of the Underwater Two-Dimensional Acoustic Code
3.1. Model Construction
The simulations in Section 2 establish the strong-scattering advantage of the 4 cm stainless-steel corner-reflector element and the weak-scattering, sound-absorbing characteristics of the 3 cm rubber acoustic-coating element. Over 65–70 kHz, the two elements exhibit a pronounced contrast in scattering response, satisfying the fundamental requirement for binary encoding. To realize a structured, array-based passive underwater acoustic tag that can be reliably recognized, this section uses the selected dimensions and material properties to develop a standardized two-dimensional acoustic code array. It also defines the array layout and coding topology for subsequent analysis of multiple configurations and numerical validation of imaging and decoding.
The final model is a regular 4 × 4 array with a square outline and overall dimensions of 16 cm × 16 cm × 4 cm. The array is divided into 16 identical 4 cm × 4 cm × 4 cm subelements, ensuring equal acoustic apertures and uniform insonification for all code elements and avoiding inherent scattering bias caused by differences in element size. Following the grid-based logic of a two-dimensional code, each cell is treated as the smallest coding unit. Assigning either element type to each cell produces a two-dimensional binary pattern. A flat steel plate serves as the substrate to provide uniform structural stiffness and reduce spurious scattering from uncoded regions, so that bright and dark image regions are governed primarily by the contrast between the two element types under the modeled conditions.
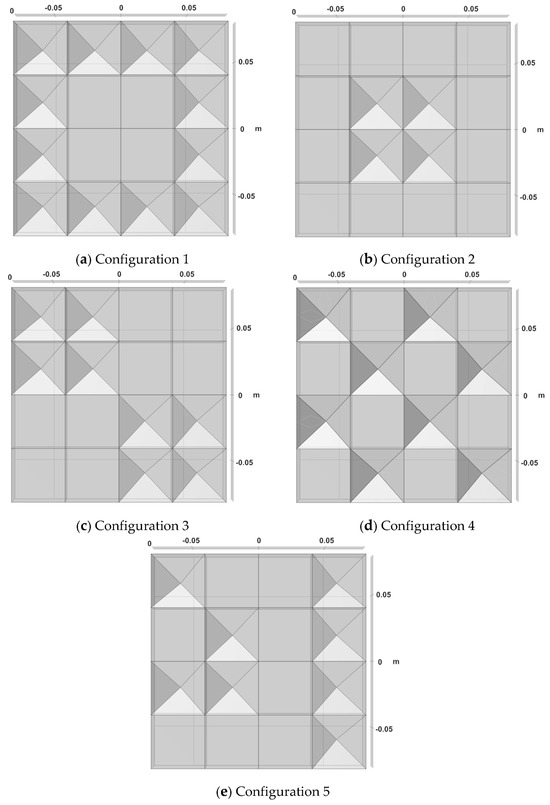
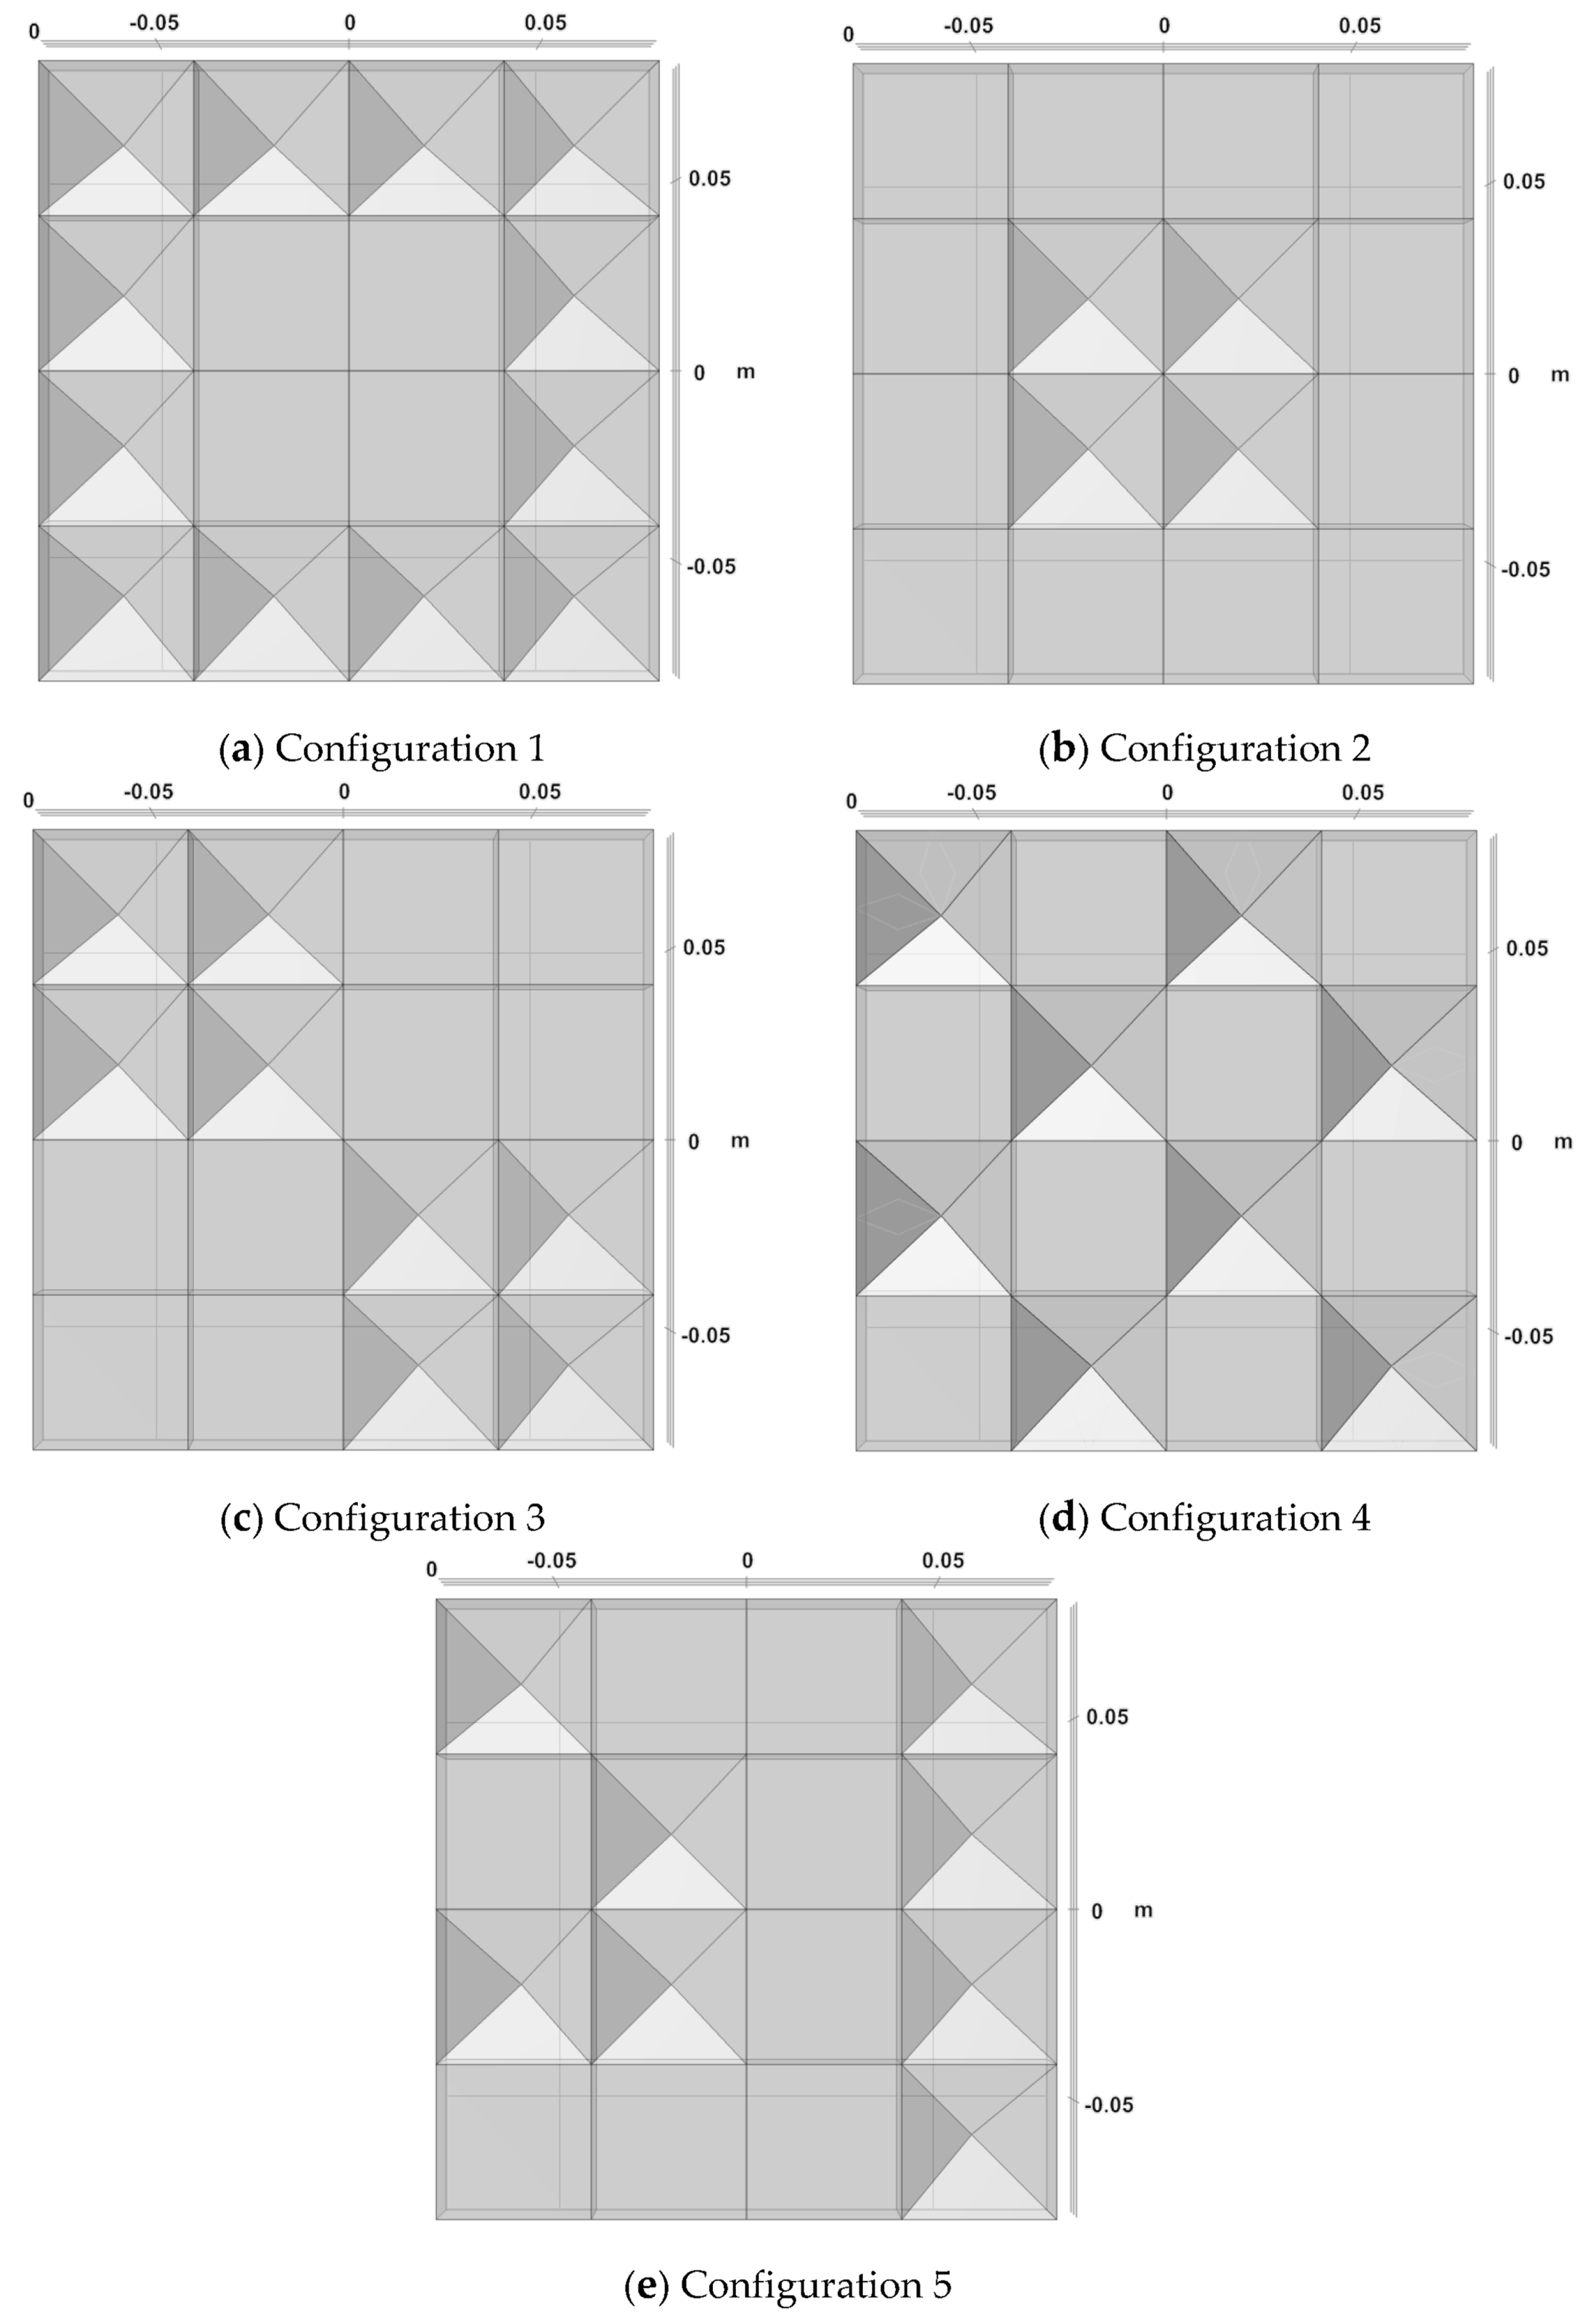
To assess the applicability of the proposed method to different topologies, five representative code configurations are examined. Their basic geometries are shown in Figure 5.
Figure 5.
Code configurations of the two-dimensional acoustic code.
The five configurations in Figure 5 encompass complementary patterns, non-axisymmetric patterns, regular arrays, and irregular distributions. Configurations 1 and 2 are global complements and therefore form a complementary pair. Configuration 3 is non-axisymmetric but centrosymmetric. Configuration 4 is also non-axisymmetric and alternates the two element types between adjacent cells. Configuration 5 is a random pattern in which the black and white elements can occupy arbitrary positions, representing an unrestricted coding arrangement.
3.2. Acoustic Characteristics of the Complete Two-Dimensional Acoustic Code
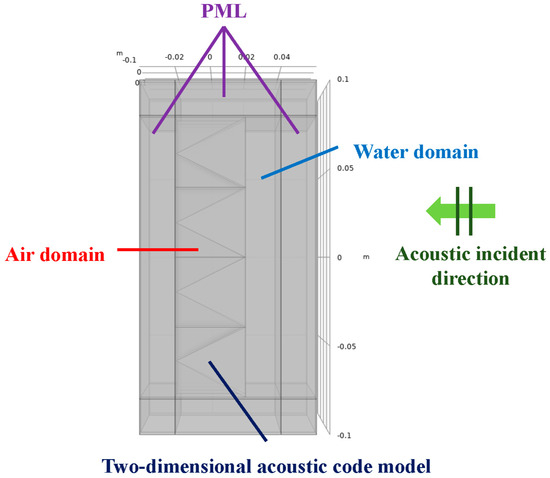
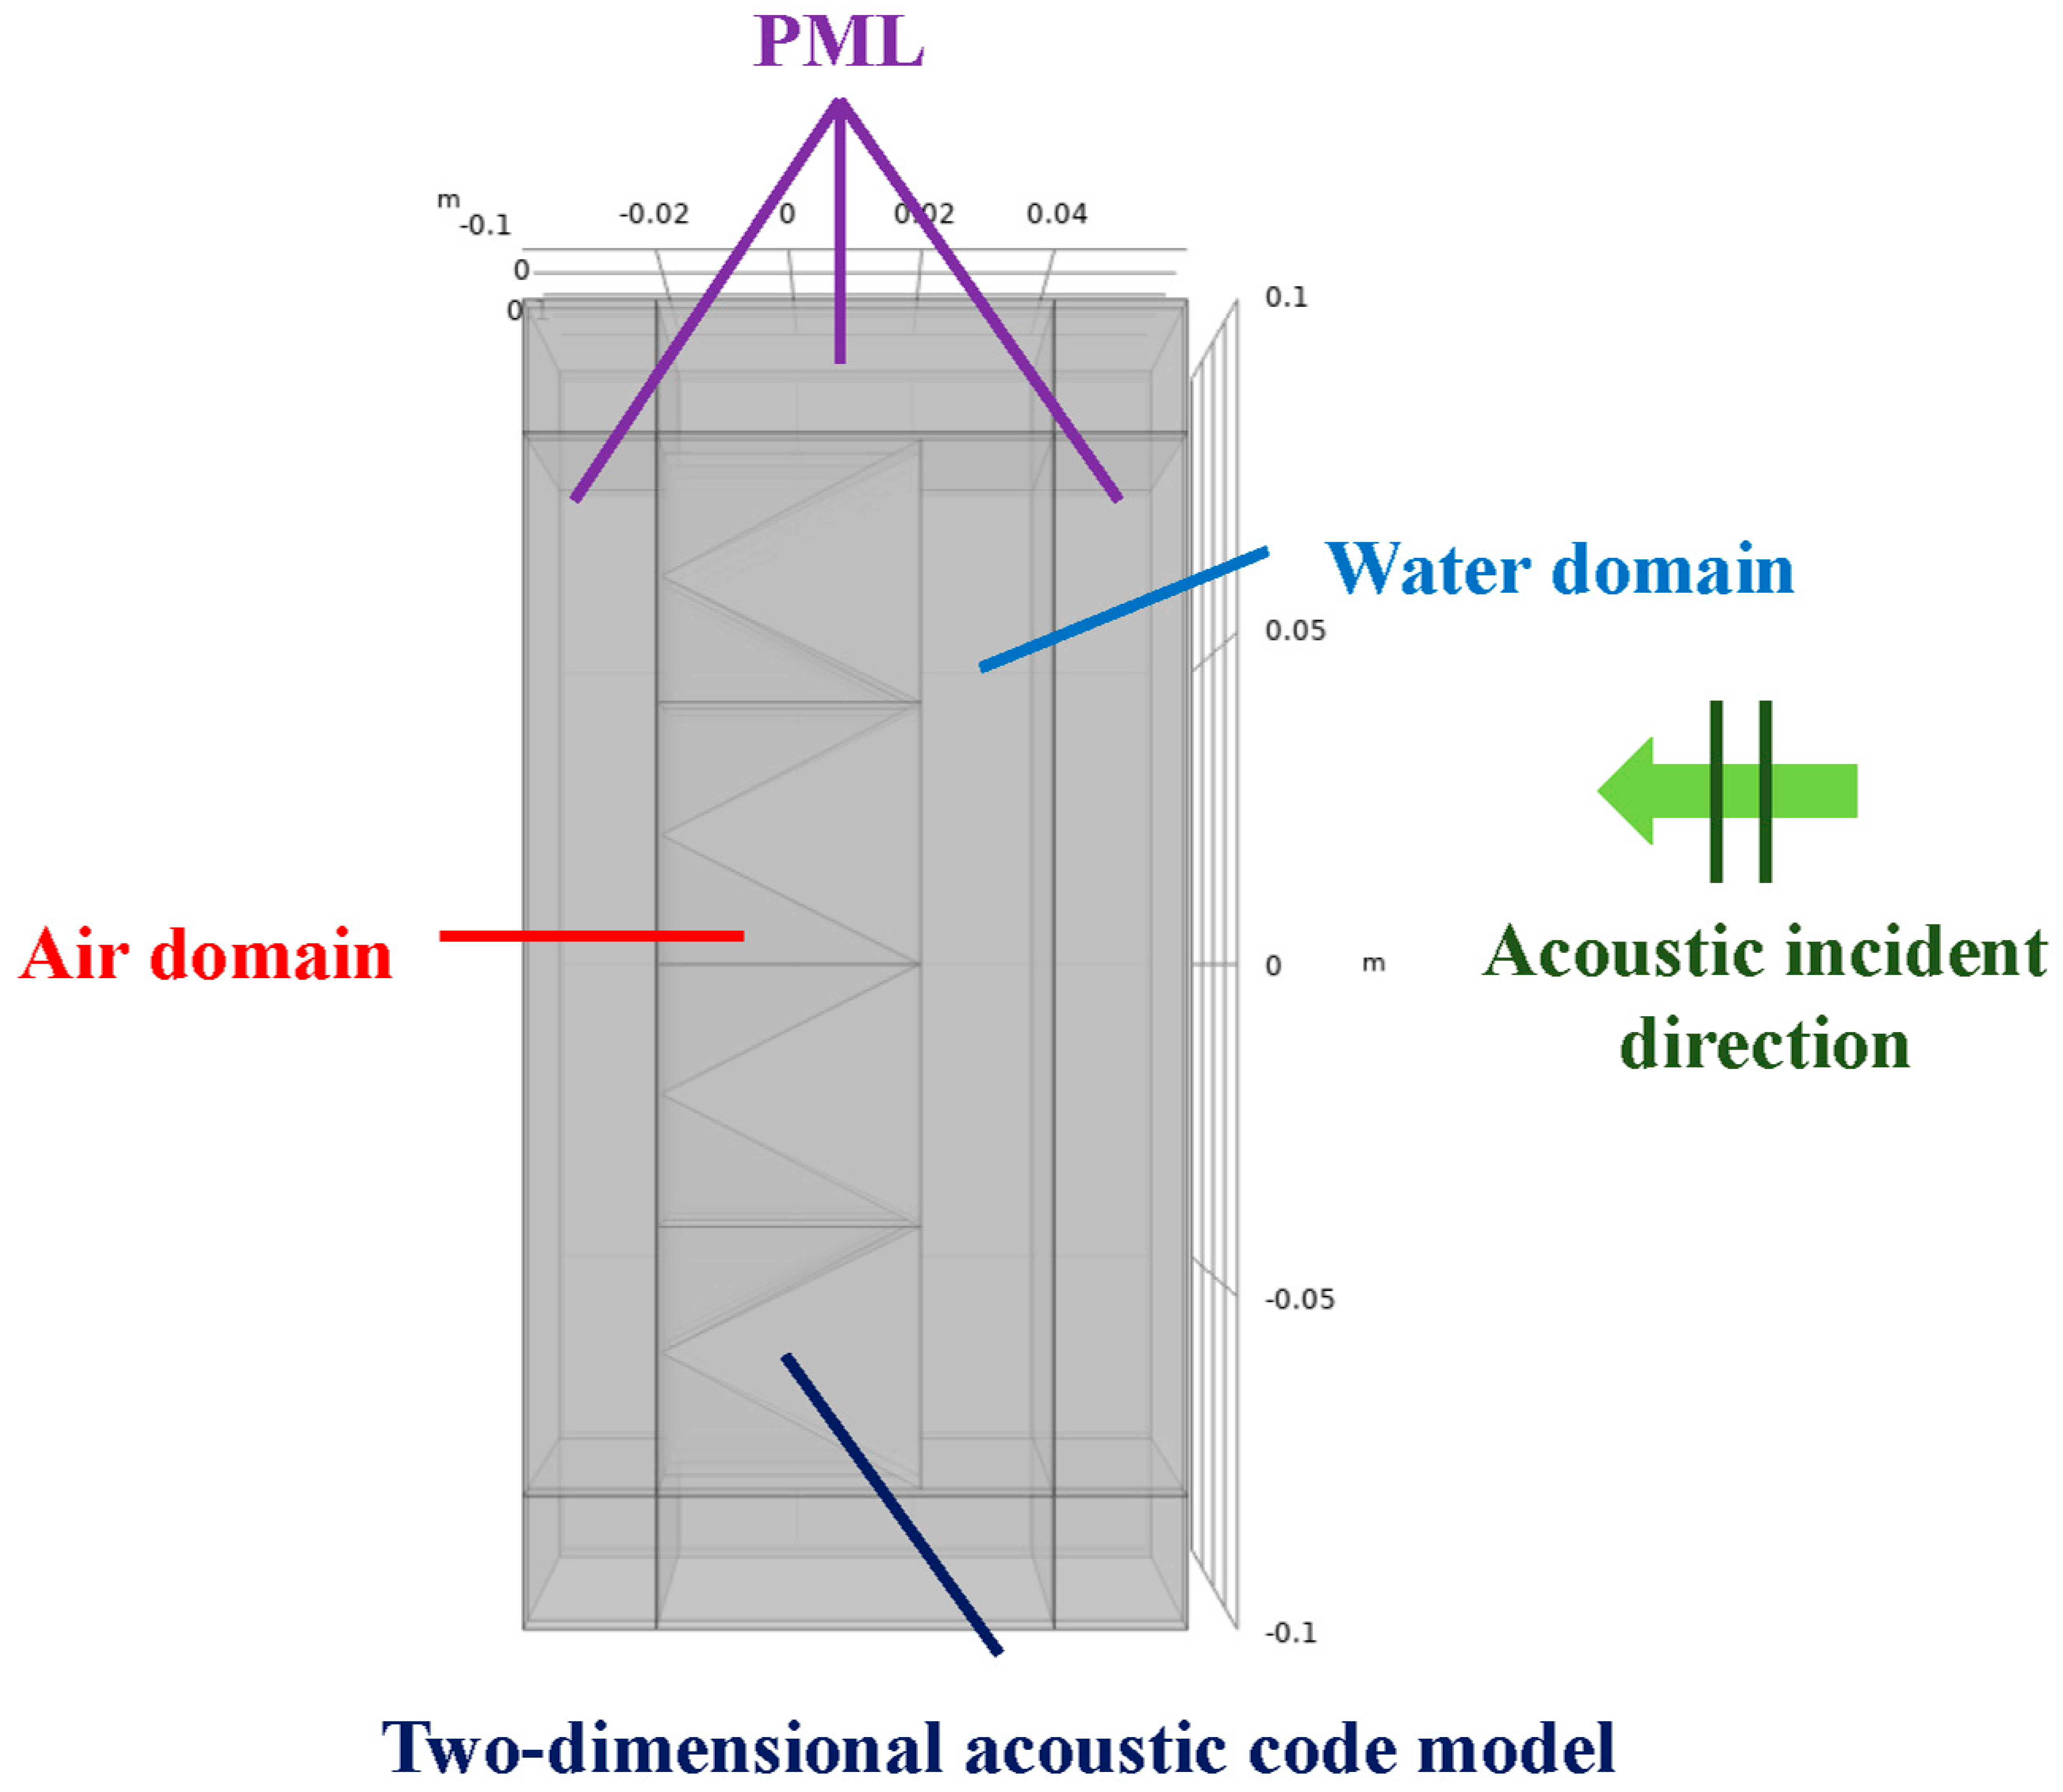
Acoustic-scattering simulations are performed in COMSOL for the five geometries shown in Figure 5. The simulations primarily use the Pressure Acoustics and Solid Mechanics physics interfaces, with the linear systems solved using the MUMPS direct solver. To ensure accuracy, the finite-element model shown in Figure 6 incorporates the required acoustic–structure coupling, boundary conditions, and surrounding perfectly matched layer (PML). A PML surrounds the water domain to suppress reflections from the computational boundary and approximate free-field conditions. The PML uses a Cartesian coordinate system and is discretized into eight mesh layers through its thickness. Air domains are defined inside the structural elements to reproduce the cavities of the physical model and maintain the intended acoustic-structure coupling conditions. A plane wave normally incident on the code plane is used as the acoustic source, with an incident pressure amplitude of 1 Pa and a frequency range of 65–70 kHz. A frequency step of 10 Hz is used. The mesh is refined around the code elements, and the element size is kept below one-sixth of the minimum acoustic wavelength to improve the accuracy of the high-frequency scattering solution and provide reliable data for subsequent imaging and decoding.
Figure 6.
COMSOL model of the two-dimensional acoustic code.
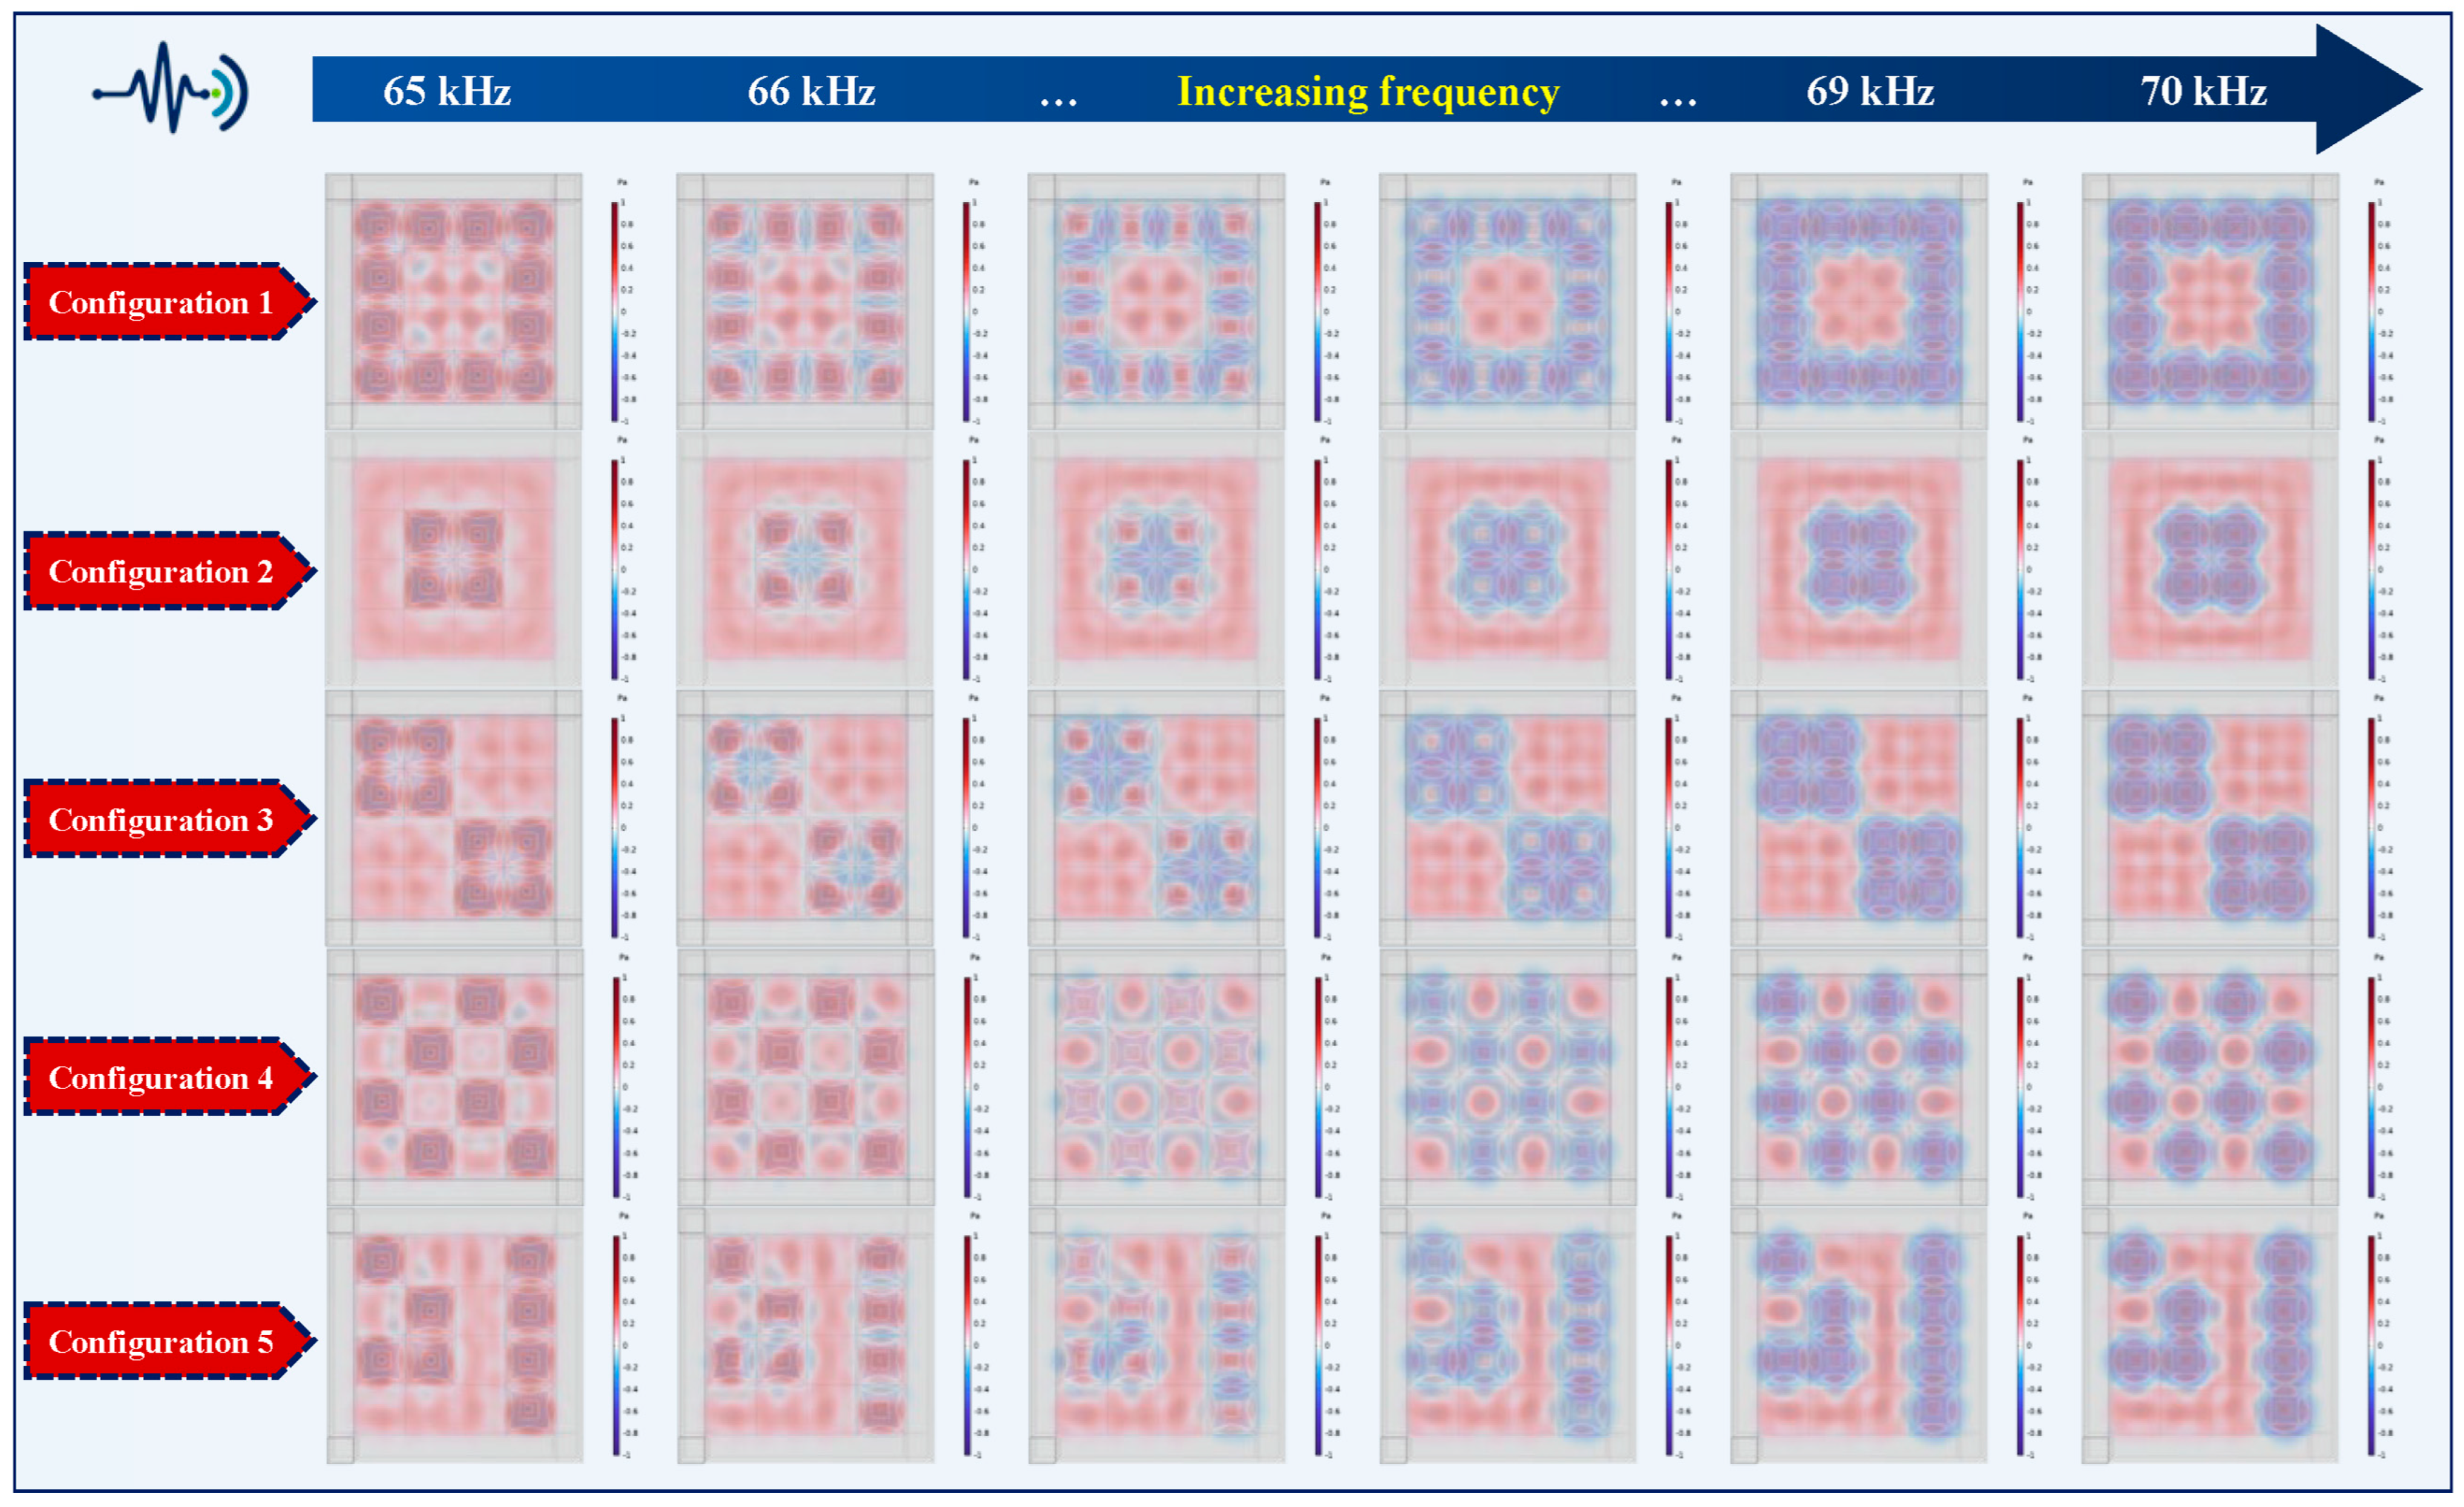
The COMSOL results provide the scattered-field distributions produced by the five configurations at different frequencies, as shown in Figure 7.
Figure 7.
Frequency-dependent scattered-field distributions for representative two-dimensional acoustic code configurations.
Figure 7 shows that, throughout 65–70 kHz, all five configurations exhibit spatial scattering patterns that correspond to their prescribed coding topologies. Pronounced local pressure variations occur near the corner-reflector elements, whereas the acoustic-coating elements respond more weakly, indicating that the scattering contrast between the two element types produces a distinguishable spatial code. Although the local phase distribution and fine details change with frequency, the principal strong- and weak-response regions and their topological relationships remain essentially unchanged, with no marked degradation of the encoded pattern. The structure therefore preserves the principal strong- and weak-scattering regions throughout the simulated band. These results indicate that the two element types are acoustically distinguishable in the representative configurations and support subsequent broadband array imaging and information decoding.
4. Broadband Beamforming Imaging and Adaptive Decoding
4.1. Near-Field DAS Beamforming
Decoding a two-dimensional acoustic code requires reconstruction of the spatial scattering-intensity distribution over the code surface from the propagation delays and phase differences among the array channels. This distribution reveals the relative scattering strengths of the surface elements and thus the encoded information. Delay-and-sum (DAS) beamforming is used here to generate a focused array image of the waves scattered by the code. Each candidate location in the imaging plane is scanned sequentially. The multichannel signals are compensated for the propagation delay or phase associated with the distance from the candidate location to each receiving element and are then summed coherently. When the scan location coincides with an actual strong scatterer, the channel signals align approximately in phase and produce an enhanced focused output. Away from a strong scatterer, residual phase differences reduce the coherent sum. The procedure therefore localizes the strong scatterers and estimates their relative intensities.
Because the receiving array is close to the two-dimensional acoustic code, wavefront curvature across the aperture cannot be neglected. Near-field DAS based on a spherical-wave propagation model is therefore used. Let the 9 × 9 planar array contain M receiving elements, with the coordinates of the m-th element denoted by . Let an arbitrary candidate point in the code imaging plane be . The propagation distance from this point to the m-th element and the corresponding propagation time are
where c is the speed of sound in water. In the preceding scattering model, the incident field is a plane wave propagating normal to the code, and all candidate points lie in the same fixed imaging plane. The incident-wave phase is therefore common to all positions in that plane and is incorporated into the effective scattering response of each pixel. Imaging consequently requires compensation primarily for the spherical propagation phase from each candidate point to each receiving element.
For the complex scattered pressures calculated in COMSOL, phase-compensated DAS imaging can be implemented directly in the frequency domain. Let denote the complex scattered pressure received by element m at frequency f, let k = 2πf/c be the wavenumber, and let be the beamforming weight for receiving element m. The normalized focused amplitude at candidate point q is [33]
The exponential term compensates for spherical-wave phase propagation, and represents amplitude attenuation due to geometric spreading. The denominator reduces amplitude-scaling differences caused by variations in the distance between the array and the scan locations. When q coincides with a strong scatterer, the compensated complex pressures at the array elements are nearly phase-aligned and add coherently to produce a large array gain, which appears as a high-amplitude region in the image. When q is displaced from the scatterer, the compensated phases are less consistent, the coherent array gain is lower, and the image appears darker. Increasing the number of receiving elements improves the focusing gain for the scattered field and the ability to distinguish adjacent code elements.
Because the scattering responses of both the corner-reflector and acoustic-coating elements vary with frequency, single-frequency images are sensitive to local frequency-response fluctuations and array sidelobes. To improve image stability, near-field focusing is performed separately at each frequency over 65–70 kHz, and the resulting single-frequency energies are combined incoherently to obtain the final DAS image [29].
where is the weight assigned to the l-th frequency in the weighted incoherent sum; the weights sum to unity. Combining image energies across multiple frequencies suppresses the influence of isolated peaks and troughs at individual frequencies while retaining the stable scattering contrast among code elements across the study band. To further clarify the effect of multifrequency fusion on imaging performance, Appendix A describes and compares the single-frequency and multifrequency DAS imaging methods. The continuous DAS image is then divided into 4 × 4 coding regions according to the physical dimensions of the two-dimensional acoustic code. The mean energy in each region is calculated, and black and white elements are classified from the difference in scattered energy between the corner-reflector and acoustic-coating elements. This procedure provides the basis for subsequent decoding and feasibility assessment.
4.2. Array Design and Time-Domain Echo Characteristics
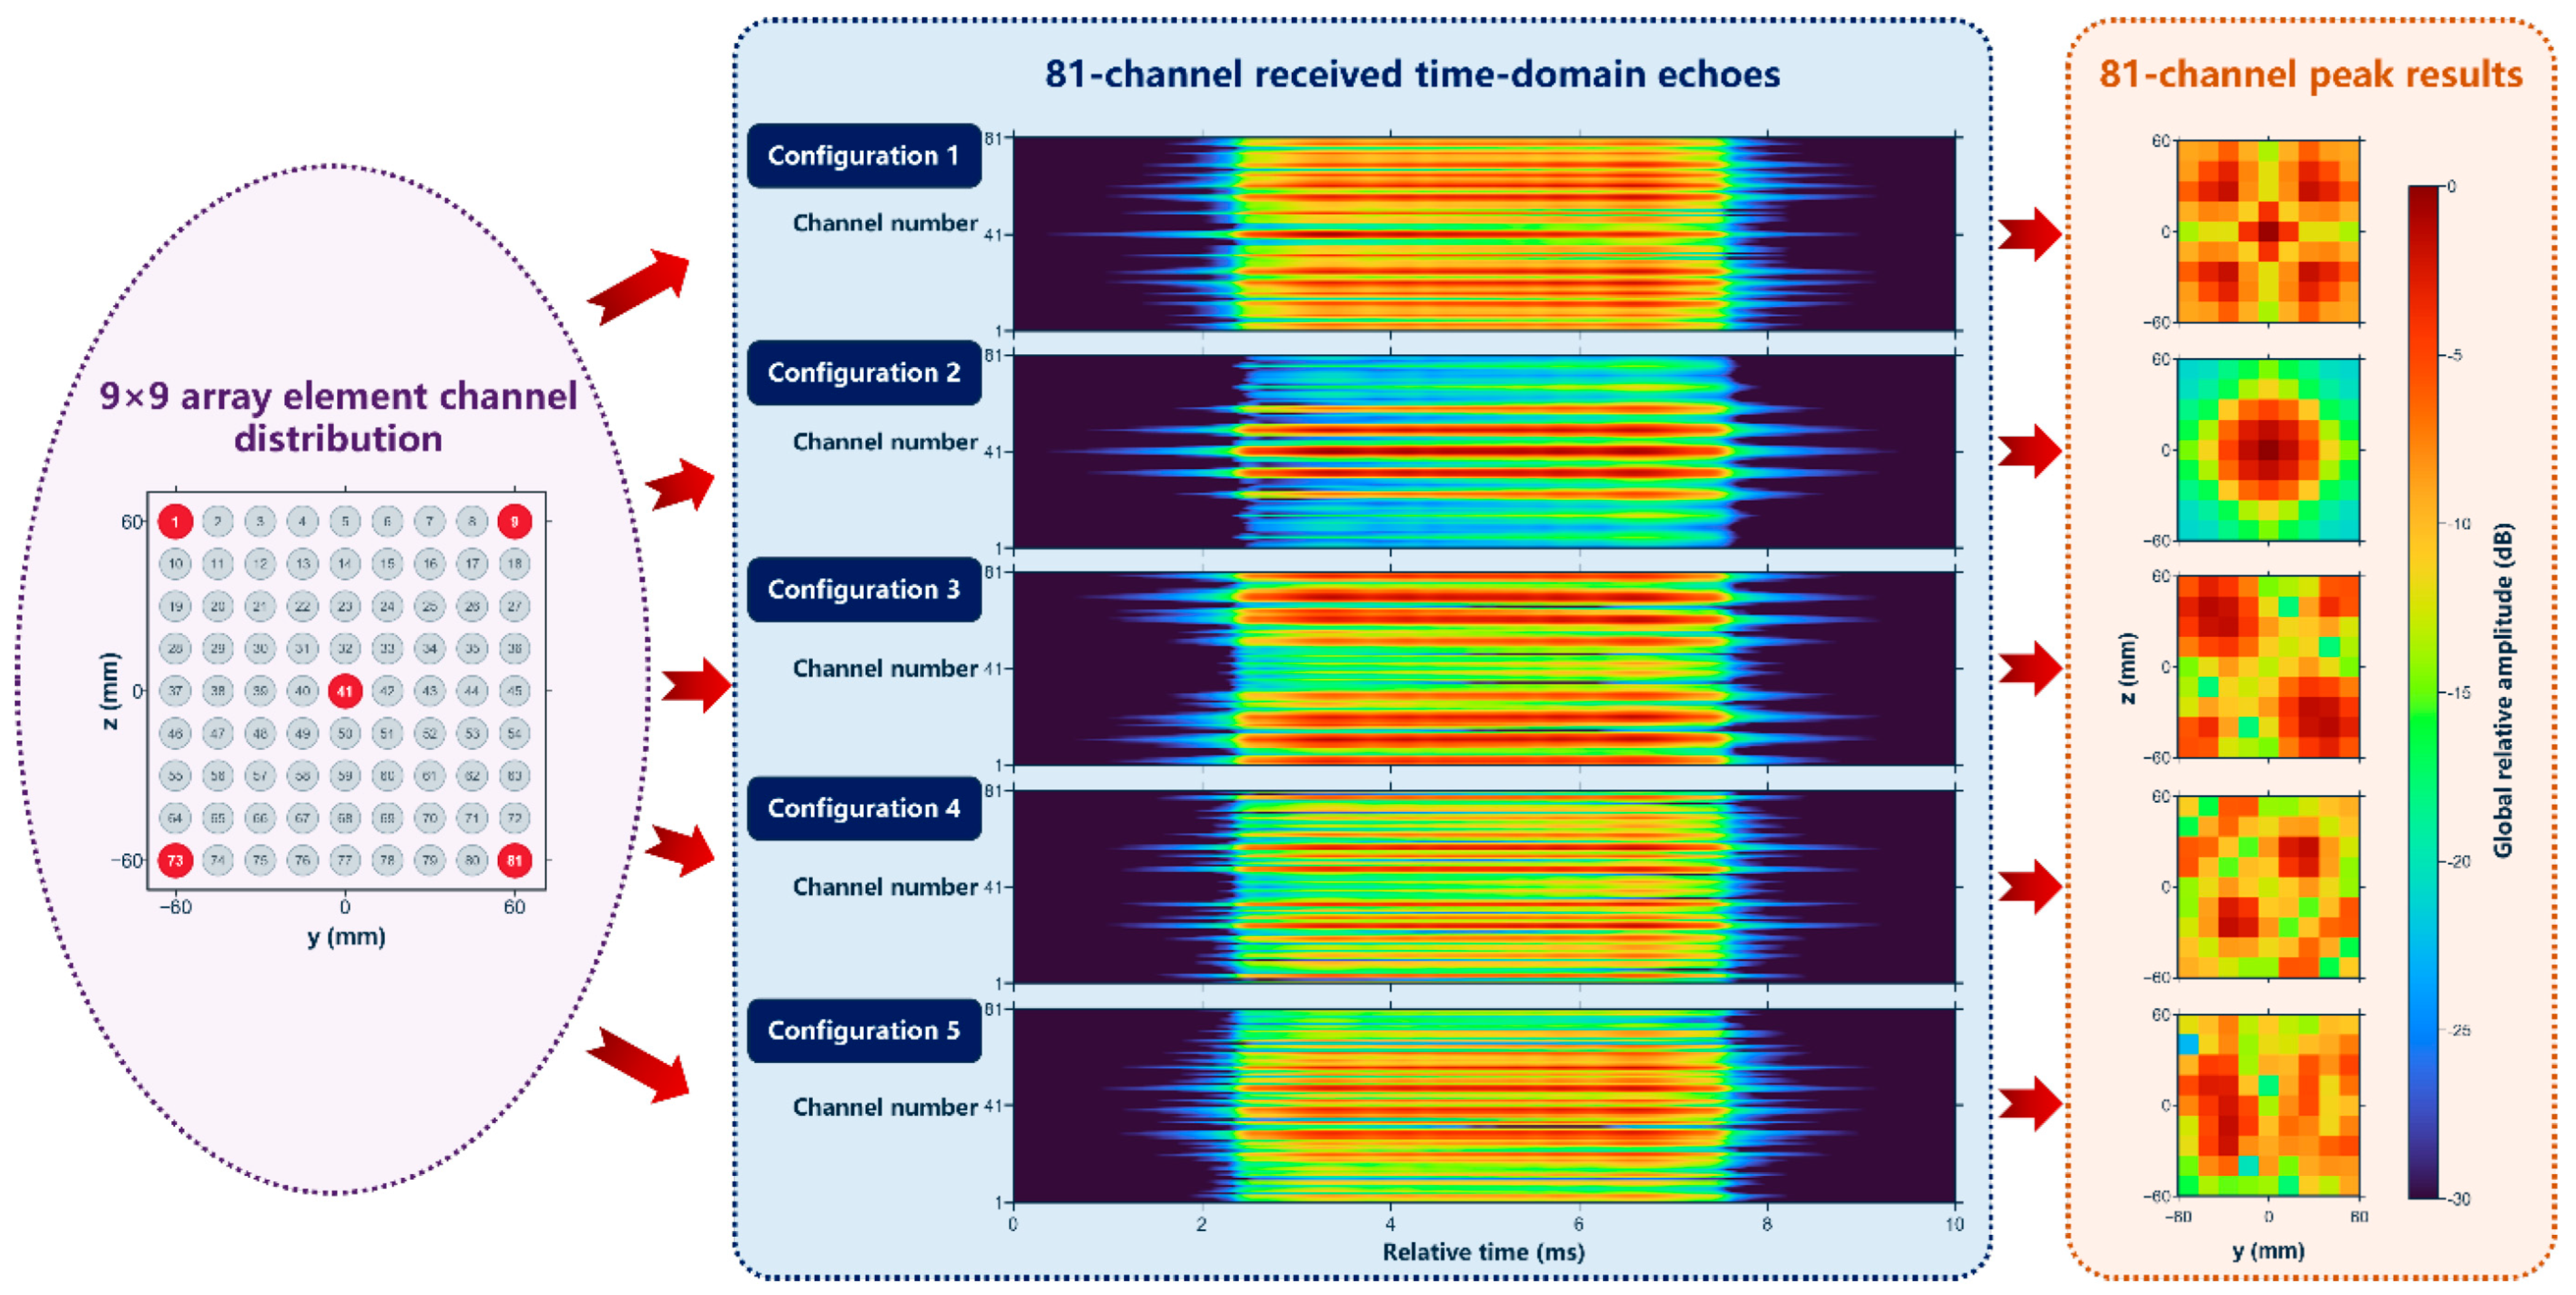
Based on the DAS beamforming principle and the overall dimensions of the code and its cells, a 9 × 9 uniform planar array is designed to receive the scattered field and form images. The aperture and element count are determined as follows. The array should use as few receivers as possible while retaining sufficient resolution to distinguish the code elements. The two-dimensional acoustic code has a side length of 160 mm, with four 40 mm code elements along each side. The operating range for tag recognition is set to 0.2 m in this study. This distance is not a fixed parameter imposed by the decoding algorithm. In practice, the distance between the tag and the receiving array can be estimated from the propagation delay between transmission and echo arrival, together with the sound speed and transmitter–receiver geometry, and used for subsequent near-field imaging. To avoid angular ambiguity in the beamforming result, the element spacing is determined from the highest simulated frequency of 70 kHz, which corresponds to a minimum wavelength of 21.43 mm. Because the imaging region must cover the entire code, its four corners represent the most demanding scan directions. From the relative geometry, the distance from the array center to a corner is
where R is the distance from the array center to the center of the two-dimensional acoustic code, and a is half the code side length. The maximum direction cosine at a corner in either the y or z direction is 0.348. For a uniform array that must scan to a maximum direction cosine umax, the element spacing required to avoid periodic grating lobes within the visible imaging region is
Substitution into Equation (10) gives a maximum element spacing dmax of 15.9 mm. A center-to-center spacing of 15 mm was therefore selected, satisfying this requirement.
After the element spacing is set, the array aperture is determined from the 40 mm resolution required for the code elements. For a uniform rectangular array, the lateral resolution at the first null in the paraxial direction can be approximated by [34]
where D is the effective aperture along one array axis. The resolution requirement for the code elements gives from Equation (11). Using the lowest simulated frequency of 65 kHz, the minimum required aperture along one axis is 115.4 mm. With an element spacing of 15 mm, at least nine elements are required along each axis. The selected 9 × 9 planar array therefore contains 81 uniformly spaced receivers and has an effective aperture of 120 mm in both directions, providing the aperture required to resolve the 40 mm code elements over 65–70 kHz.
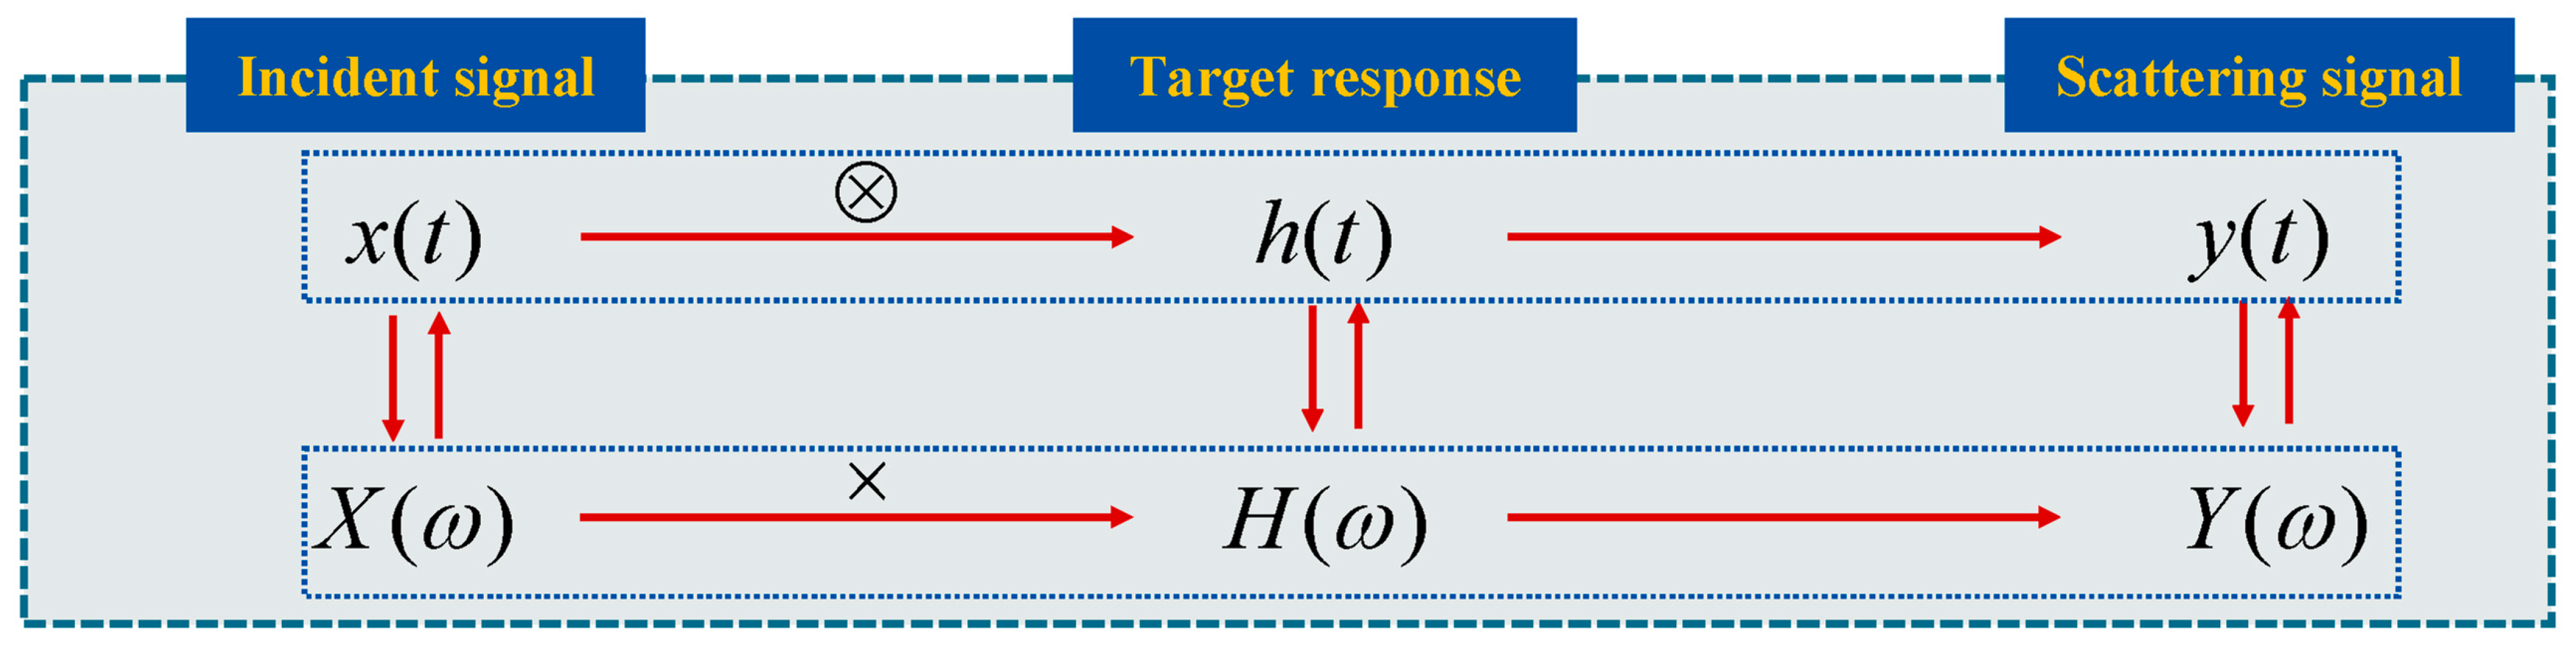
The frequency-domain scattered pressures received by the elements of the 9 × 9 planar array in COMSOL are converted to time-domain echoes using an indirect frequency-domain method. The underwater target is first treated as a linear system, with the incident acoustic signal transmitted from the source as the input. By linear-system theory, the scattered signal generated by the target under this excitation is the output; the system representation is shown in Figure 8. The target transfer function obtained in the frequency domain is multiplied by the spectrum of the incident signal to obtain the target-echo spectrum. An inverse Fourier transform then yields the time-domain target echo.
Figure 8.
Principle of the indirect frequency-domain method.
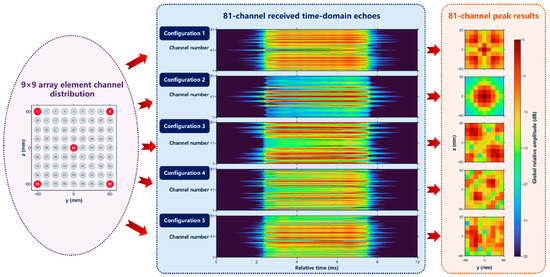
Echoes are simulated individually from the frequency-domain scattered pressures received by all elements of the 9 × 9 planar array, yielding time-domain responses for 81 channels. The simulated echoes for each configuration are shown in Figure 9.
Figure 9.
Array geometry and normalized time-domain echoes for the 81 receiving elements.
Figure 9 shows clear differences among the time-domain echoes produced by the different configurations. The 81-channel results also vary substantially among receiving elements for a given configuration, as well as across configurations. This variation reflects the pronounced spatial dependence of the scattered field received at different positions under near-field conditions. Near-field processing therefore cannot assume plane-wave reception; it must account for both amplitude decay and phase variation along the propagation path from each scattering point to each receiver. These simulations indicate that the 9 × 9 array captures configuration-dependent differences in the simulated scattered field.
4.3. Information Decoding Using an Adaptive Threshold
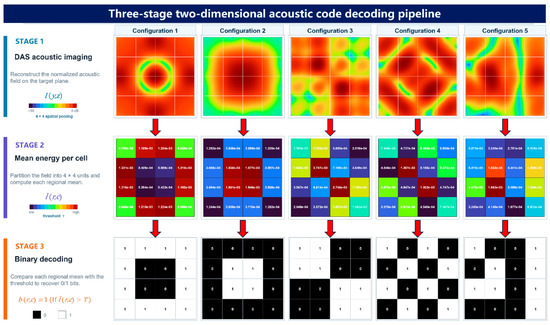
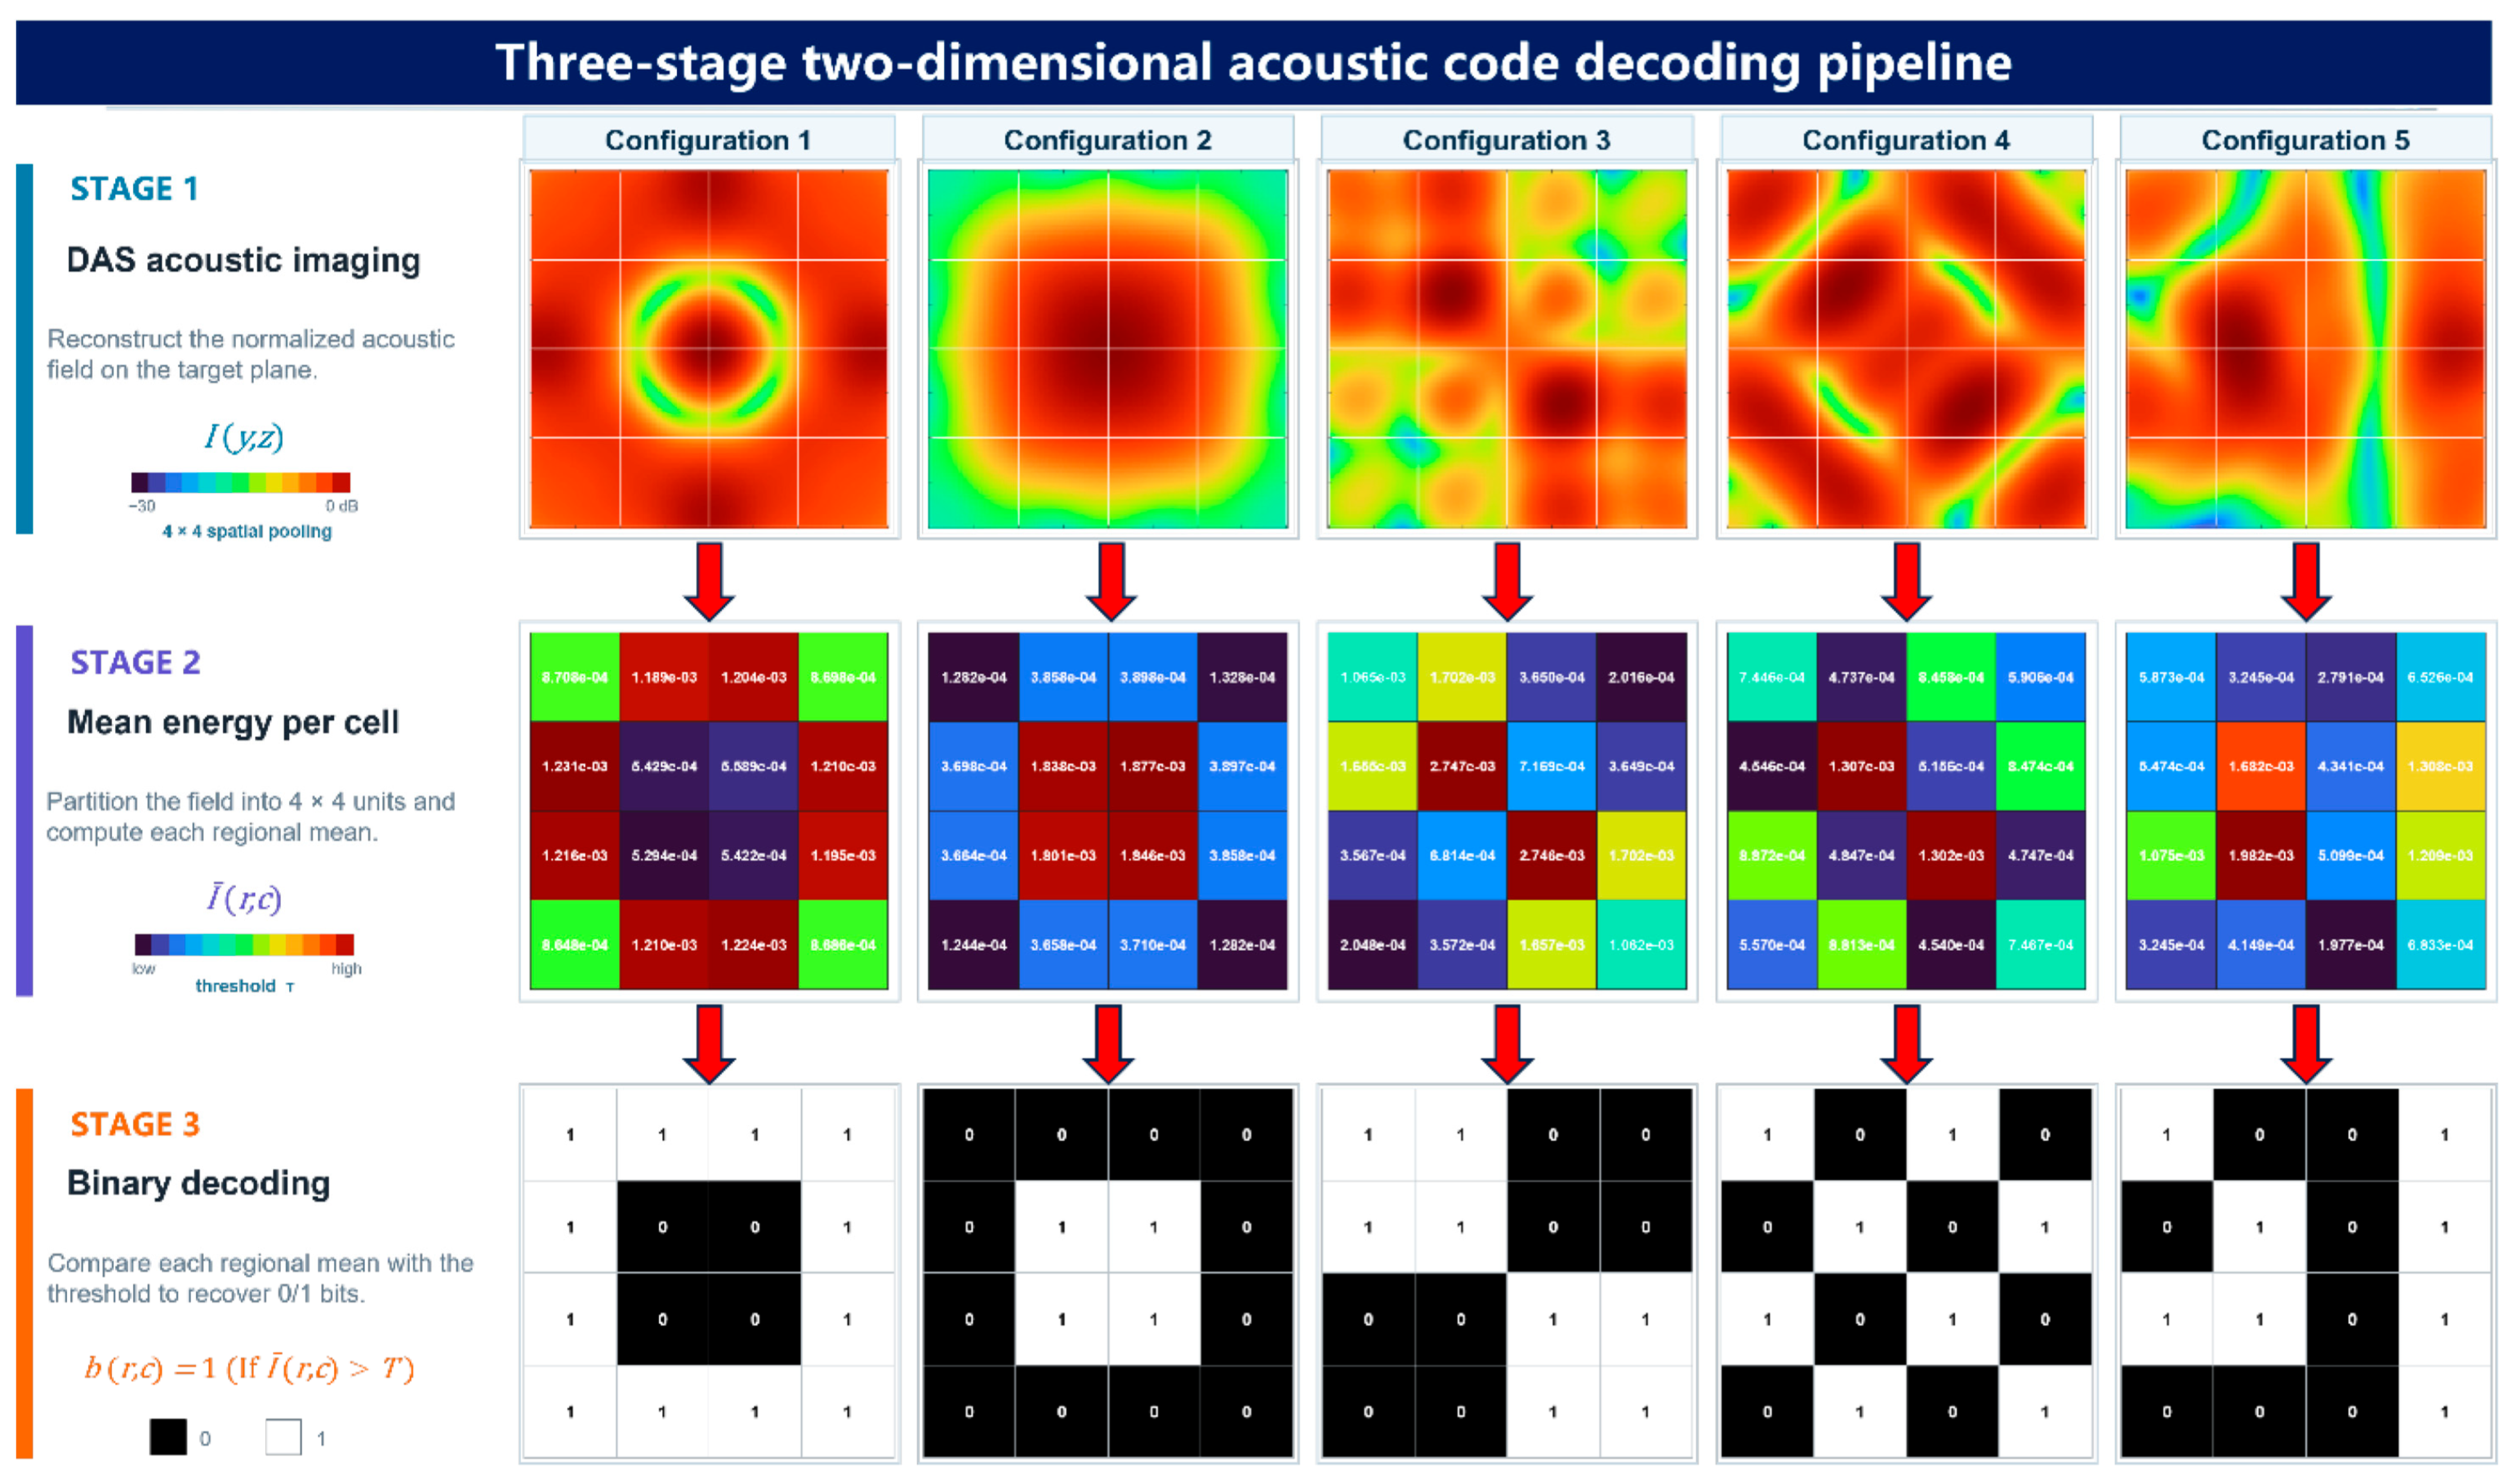
The scattered pressures received by the array are imaged with DAS over 65–70 kHz, and the single-frequency image energies are averaged to obtain the DAS image reconstructed from the 81 array channels shown in the first stage of Figure 10. This image is then decoded. Based on the physical dimensions of the code, the 160 mm-square imaging region is divided into 16 nonoverlapping regions corresponding to the physical code elements. Let Ωij denote the set of pixels in the element at row i and column j, where the first row is at the top of the image, and the first column is at the left. Let be the linear DAS energy at image-plane pixel , and let be the number of pixels in Ωij. The energy of the element is defined as the arithmetic mean of the linear energies of all pixels in the region:
Figure 10.
Complete information decoding process and results for the two-dimensional acoustic code.
Averaging energy over each region reduces the influence of isolated pixel peaks, sidelobes, and local frequency-response fluctuations on the decoding decision, allowing each code element to be represented by its overall mean scattered energy.
After the mean energies of the 16 elements have been obtained, a rank-based adaptive threshold is constructed from the known number of black elements in the design. The number of black code elements, , is supplied to the decoder as a known structural design parameter and used to decode the two-dimensional acoustic code. The element energies are sorted in ascending order as . The energy whose rank equals the black-element count is treated as the upper bound for black elements, and the next-ranked energy as the lower bound for white elements. Their arithmetic mean defines the adaptive decision threshold T:
The adaptive threshold automatically adjusts the boundary between black and white elements according to the element scattering energies in each configuration. Under the current coding rule, an element with higher scattered energy is classified as a white element and assigned 1, whereas an element with lower scattered energy is classified as a black element and assigned 0. The decision rule is
The acoustic image is decoded using a strict greater-than-threshold operation to generate the 4 × 4 binary matrix . Reading the matrix from top to bottom and left to right yields the information code carried by the current two-dimensional acoustic code. Figure 10 presents the complete decoding process for all five configurations: the scattered pressures received by the 9 × 9 planar array are transformed into acoustic images, regional mean energies, and finally binary code elements.
For every configuration in Figure 10, the acoustic image and decoded output correspond exactly to the prescribed configuration. At each corner-reflector location, the decoder classifies the cell as white and assigns it a value of 1; at each acoustic-coating location, the decoder classifies the cell as black and assigns it a value of 0. The complete workflow accurately converts the structural code into an array image of the scattered field and then into the decoded information, demonstrating the complete encoding, imaging, and decoding workflow of the two-dimensional acoustic code. To further assess the applicability of the method to different coding patterns, Appendix B presents supplementary imaging and decoding results for nine additional configurations of the two-dimensional acoustic code. All nine configurations were also decoded correctly.
To further characterize the distribution and range of element energies within the operating band, the mean element energies obtained after multifrequency image fusion are analyzed. Across the five test configurations in Figure 10, the energies of black code elements range from 1.24 × 10⁻⁴ to 7.17 × 10⁻⁴, whereas those of white code elements range from 5.87 × 10⁻⁴ to 2.74 × 10⁻³. Although these overall energy ranges overlap across configurations, within each configuration the minimum white-element energy exceeds the maximum black-element energy, enabling accurate discrimination by the adaptive threshold. The minimum discrimination margin is defined as the difference between the minimum white-element energy and the maximum black-element energy. For Configurations 1–5, the respective minimum margins are 3.06 × 10⁻⁴, 1.41 × 10⁻³, 3.45 × 10⁻⁴, 1.54 × 10⁻⁴, and 3.99 × 10⁻⁵. These margins depend on both the number of black and white elements and their spatial arrangement. Although the proposed adaptive threshold accommodates variations in scattering-energy contrast between strong and weak elements and enables accurate decoding of the acoustic images, noise and other disturbances must be considered in practical environments. Code configurations should therefore be designed to maximize the minimum discrimination margin and improve robustness to such disturbances.
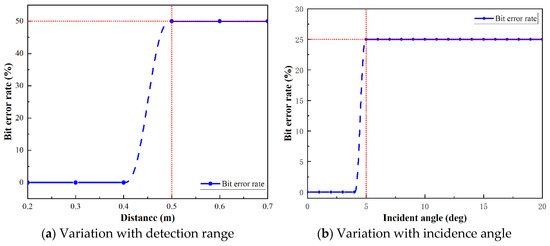
To further assess how detection range and incidence direction affect acoustic imaging and information decoding of the two-dimensional acoustic code, the decoding accuracy of Configuration 1 is evaluated at different detection ranges and incidence angles. The results are shown in Figure 11.
Figure 11.
Bit-error-rate curves for decoding the two-dimensional acoustic code under different detection conditions.
Figure 11 shows that decoding errors occur as the detection range and incidence angle increase beyond certain limits. Information decoding of the two-dimensional acoustic code relies on the energy distribution in the acoustic image reconstructed from the receiving-array data. According to beamforming theory, the array’s lateral resolution is governed primarily by the probing-signal wavelength, detection range, and array aperture. Under the present simulation conditions, the probing signal and receiving-array aperture are fixed. As the detection range increases, the minimum lateral separation that the array can resolve also increases. The resulting image blurring makes it difficult to distinguish the scattering contributions of neighboring code elements, degrading image quality and ultimately causing decoding errors. Under oblique incidence, changes in the scattering characteristics of individual code elements alter the energy distribution in the reconstructed image and also lead to decoding errors. These results show that the decoding performance of the two-dimensional acoustic code is sensitive to detection range and incidence angle. For Configuration 1, reliable decoding was achieved at detection ranges of up to 0.4 m and incidence angles of up to 4° in the respective simulations.
Different information codes can be written by arranging the structural elements at different positions within the code. The scattered field is then imaged by beamforming with the uniform planar array, and an adaptive decision threshold accurately decodes the pattern. Under the prescribed ideal free-field conditions, the decoded results of all five representative configurations match their predefined codewords. These end-to-end simulations demonstrate the feasibility of the proposed encoding scheme for a passive underwater two-dimensional acoustic code tag. For the current 4 × 4 design, 12,870 distinct spatial arrangements are possible when all tags in a given batch contain eight black elements and eight white elements. This corresponds to a theoretical maximum information capacity of approximately 13.65 bits. This value represents an upper bound under ideal conditions. The usable capacity may be lower because of requirements for tag orientation determination and error-correction redundancy.
5. Conclusions
To address the high power consumption and limited information capacity of conventional underwater tag technologies during long-term deployment, this study integrates theoretical modeling, structural parameter selection, and beamforming-based imaging and decoding to propose a design scheme for a passive underwater two-dimensional acoustic code tag. The main conclusions are as follows:
- (1)
- A coupled acoustic-structure response model was established for the passive underwater two-dimensional acoustic code tag. Analysis of resonant scattering by the corner-reflector element and impedance-matched absorption by the acoustic-coating element clarified the physical mechanisms that produce strong and weak scattering, providing a theoretical basis for element design and parameter selection.
- (2)
- The structural parameters of the strong- and weak-scattering elements were selected through parametric comparison. For the material properties and operating band considered here, the 4 cm × 4 cm × 4 cm corner reflector and the 3 cm thick acoustic coating maintain a relatively stable scattering contrast over 65–70 kHz and meet the coding requirements of the two-dimensional acoustic code. The design balances recognition stability against size constraints.
- (3)
- A broadband near-field DAS imaging and adaptive-threshold decoding method was developed. Under ideal free-field conditions, the finite-element simulations show that the method correctly recovers the encoded information of multiple representative configurations, demonstrating the feasibility of the proposed passive underwater two-dimensional acoustic code tag and its imaging and decoding method.
The proposed underwater two-dimensional acoustic code tag requires no onboard power supply or integrated circuitry. Its relatively simple structure may reduce manufacturing and maintenance costs. Information is encoded in the two-dimensional spatial arrangement of its code elements. It provides a potential approach for localization and traceability of underwater equipment, subsea pipeline tagging, and inspection and navigation by underwater robots. Future work will evaluate the decoding performance of the two-dimensional acoustic code under multipath propagation and reverberation and explore improvements to the imaging algorithm to enhance decoding accuracy under oblique incidence. Practical tag configurations will also be developed for engineering applications based on the proposed design scheme, and experiments will be conducted to assess system stability and engineering applicability in complex underwater environments.
Author Contributions
J.X.: Conceptualization, Methodology, Investigation, Formal analysis, Writing—original draft. F.Z.: Conceptualization, Resources, Methodology, Funding acquisition. Z.W.: Conceptualization, Methodology. Y.X.: Supervision, Investigation. H.B.: Conceptualization, Supervision. X.Y.: Conceptualization, Supervision. Y.L.: Conceptualization, Supervision. All authors have read and agreed to the published version of the manuscript.
Funding
This work was supported by the Fundamental and Interdisciplinary Disciplines Breakthrough Plan of the Ministry of Education of China (Grant No. JYB2025XDXM805) and the National Natural Science Foundation of China (Grant No. 12674551 and No. U2241277).
Data Availability Statement
Data will be made available on request.
Conflicts of Interest
The authors declare no conflicts of interest.
Appendix A
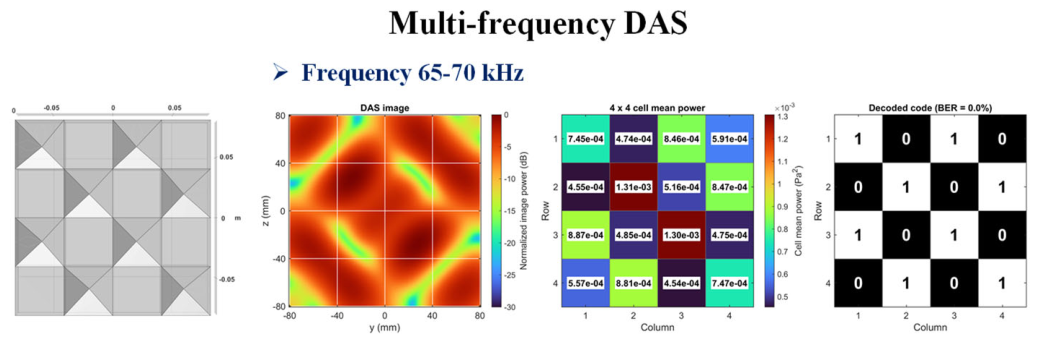
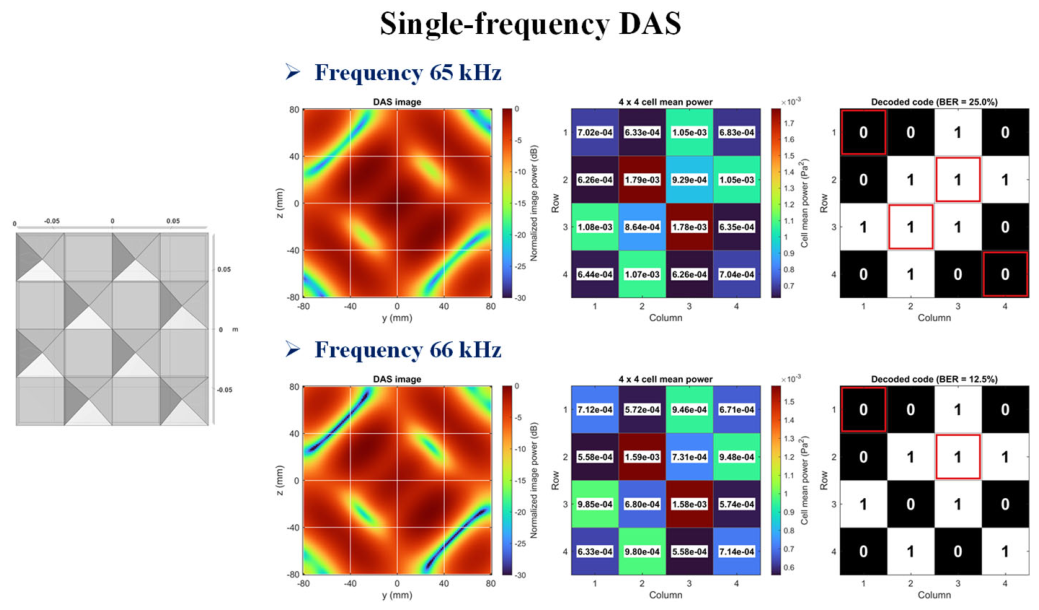
To evaluate the effect of multifrequency fusion on imaging and decoding performance, multifrequency and single-frequency delay-and-sum (DAS) beamforming were compared using Configuration 4 as the test structure. The encoded information was recovered from the acoustic images generated by each method, and decoding accuracy was used as the evaluation metric. Multifrequency DAS beamforming was performed using the scattered acoustic pressures received by the array over 65–70 kHz. For comparison, single-frequency DAS beamforming was performed separately at 65 and 66 kHz using the corresponding scattered-pressure data. The resulting acoustic images and decoding results are presented in Figure A1.
Figure A1.
Comparison of multifrequency and single-frequency DAS results.
Appendix B
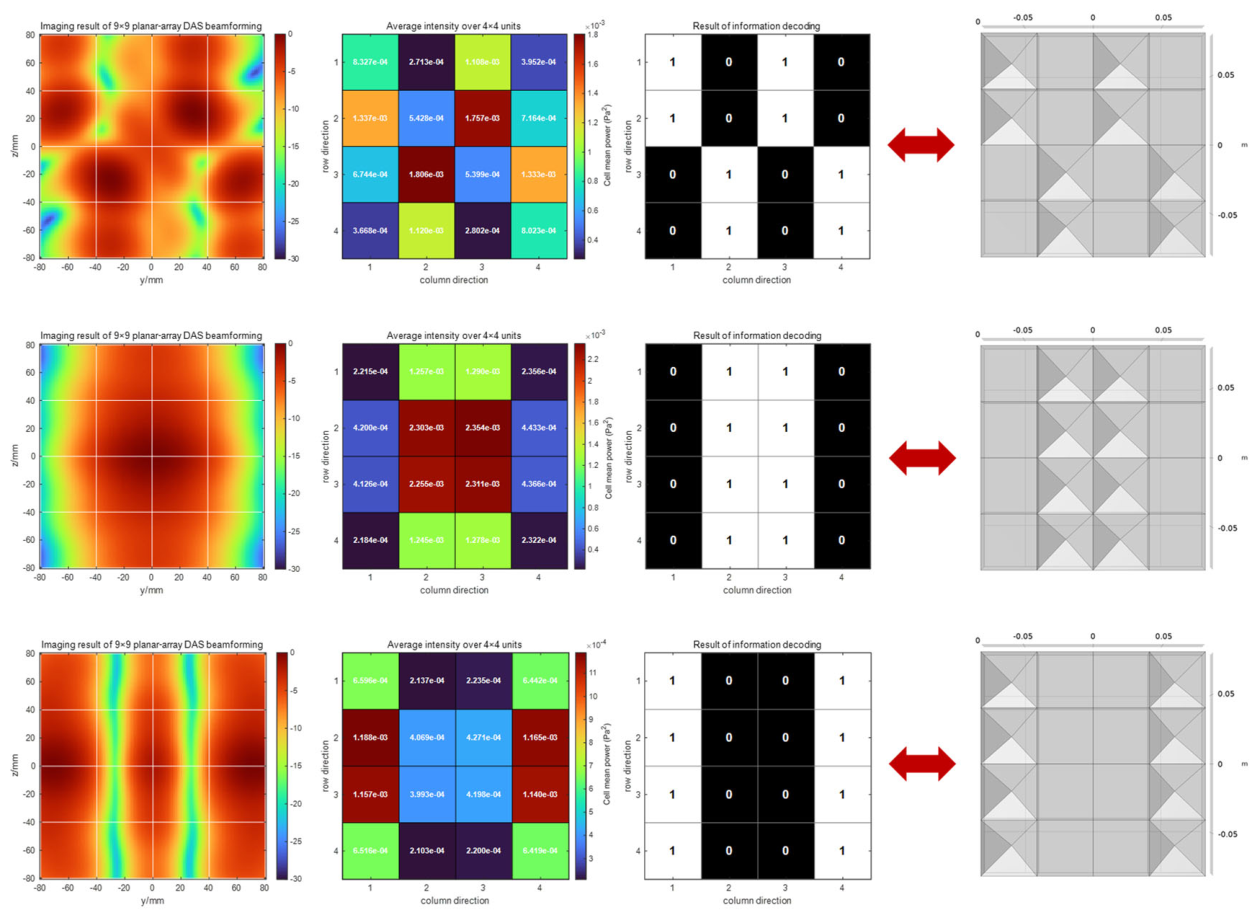
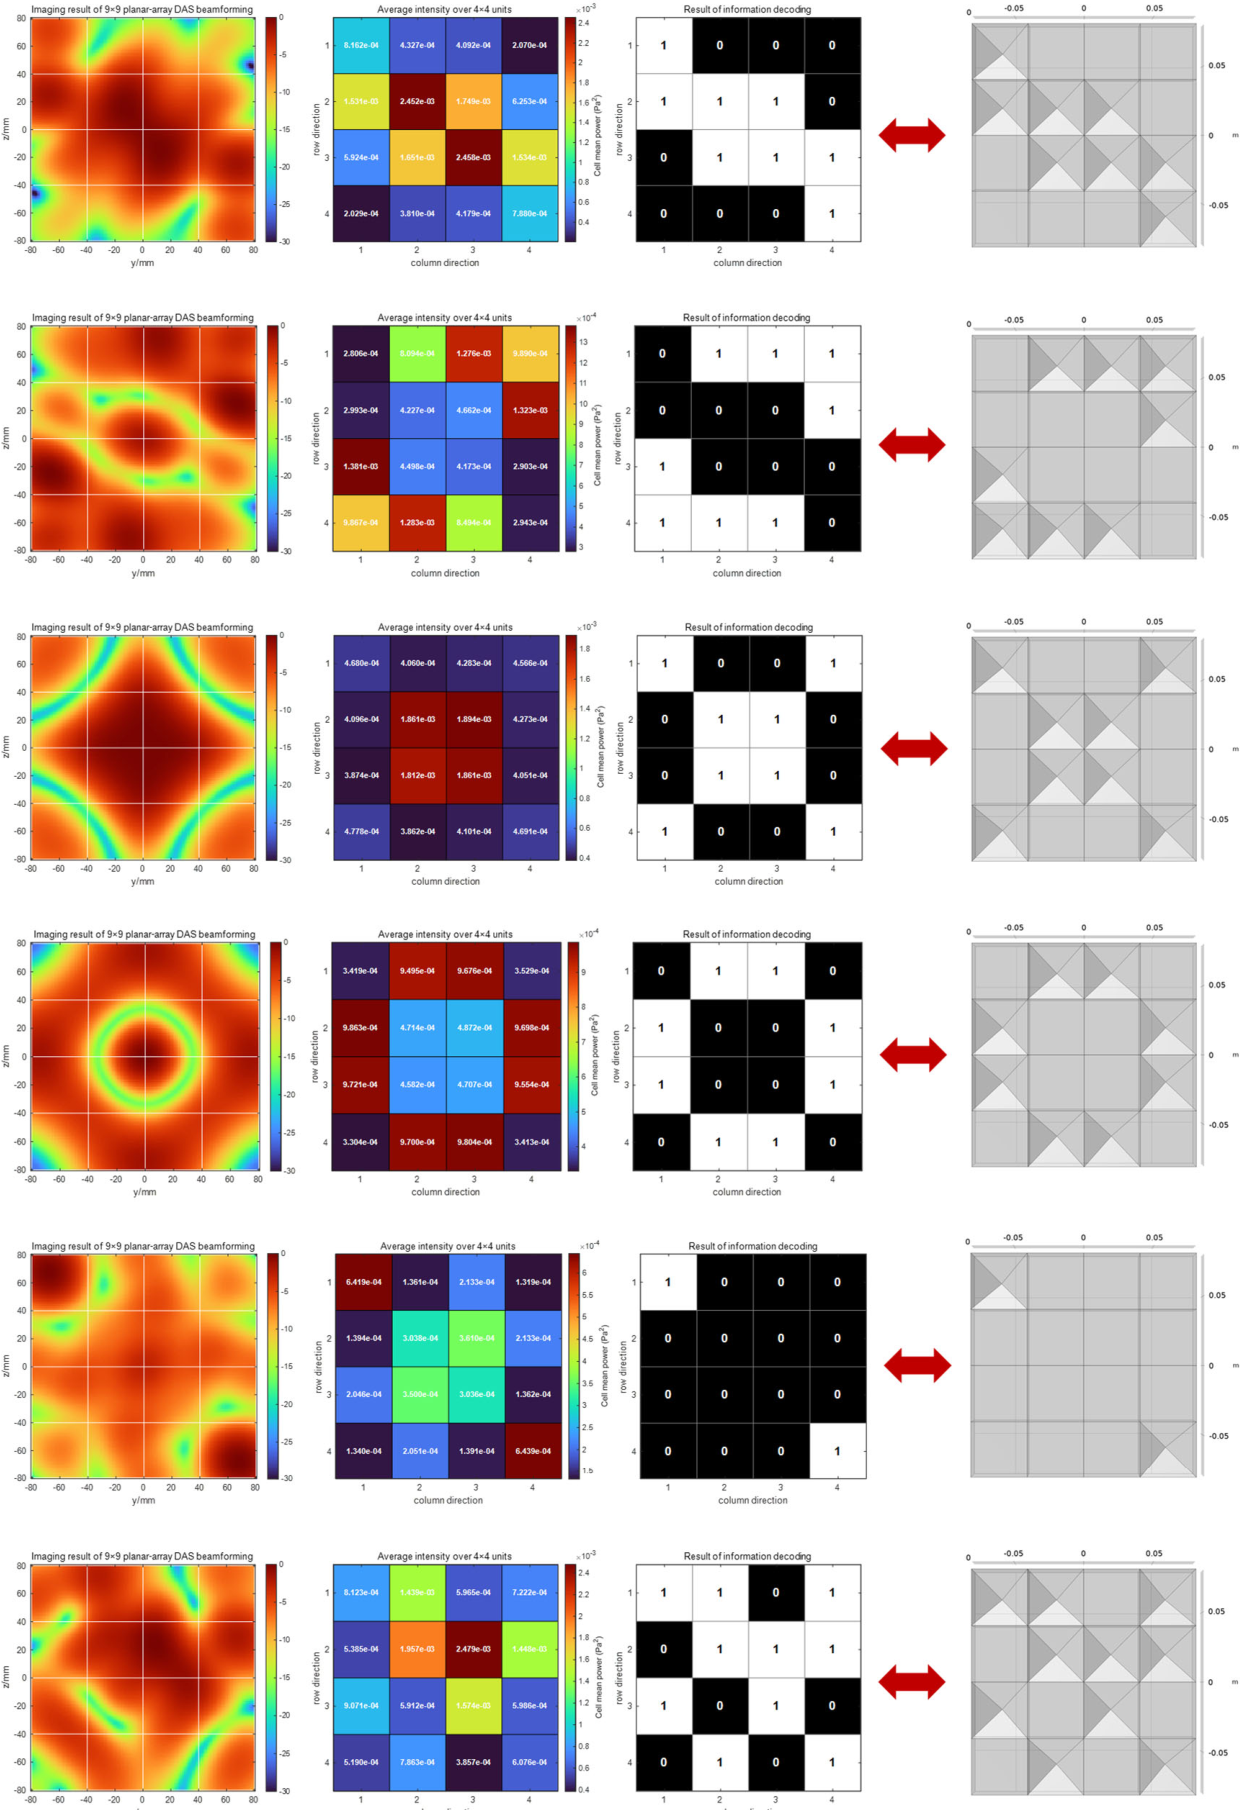
Nine additional configurations of the two-dimensional acoustic code were selected for supplementary simulations. These configurations include varying numbers of black and white code elements, spatially isolated elements, and arrangements with adjacent elements of the same type. Together, they provide representative variations in element composition and spatial arrangement, allowing a broader assessment of the proposed encoding and decoding workflow. The corresponding acoustic images and decoding results are presented in Figure A2.
Figure A2.
Information encoding and decoding results for additional representative two-dimensional acoustic code configurations.
References
- Paull, L.; Saeedi, S.; Seto, M.; Li, H. AUV Navigation and Localization: A Review. IEEE J. Ocean. Eng. 2014, 39, 131–149. [Google Scholar] [CrossRef] [Scilit]
- Schechner, Y.Y.; Karpel, N. Recovery of Underwater Visibility and Structure by Polarization Analysis. IEEE J. Ocean. Eng. 2005, 30, 570–587. [Google Scholar] [CrossRef] [Scilit]
- Islas-Cital, A.; Atkins, P.; Gardner, S.; Tiltman, C. Performance of an enhanced passive sonar reflector SonarBell: A practical technology for underwater positioning. Underw. Technol. 2013, 31, 113–122. [Google Scholar] [CrossRef] [Scilit]
- Hassan, E.S. Energy-Efficient Multi-Level Adaptive Clustering for Enhanced Performance in Underwater Sensor Networks. Concurr. Comput. Pract. Exp. 2025, 37, e70246. [Google Scholar] [CrossRef] [Scilit]
- Akyildiz, I.F.; Pompili, D.; Melodia, T. Underwater acoustic sensor networks: Research challenges. Ad. Hoc Netw. 2005, 3, 257–279. [Google Scholar] [CrossRef] [Scilit]
- Holm, S.; Brungot, J.; Rønnekleiv, A.; Hoff, L.; Jahr, V.; Kjølerbakken, K.M. Acoustic passive integrated transponders for fish tagging and identification. Aquac. Eng. 2007, 36, 122–126. [Google Scholar] [CrossRef] [Scilit]
- Srivastava, P.; Nichols, B.; Sabra, K.G. Passive underwater acoustic markers using Bragg backscattering. J. Acoust. Soc. Am. 2017, 142, EL573–EL578. [Google Scholar] [CrossRef] [Scilit] [PubMed]
- Satish, A.; Nichols, B.; Trivett, D.H.; Sabra, K.G. Passive underwater acoustic tags using layered media. J. Acoust. Soc. Am. 2019, 145, EL84–EL89. [Google Scholar] [CrossRef] [Scilit] [PubMed]
- Satish, A.; Trivett, D.; Sabra, K.G. Omnidirectional passive acoustic identification tags for underwater navigation. J. Acoust. Soc. Am. 2020, 147, EL517–EL522. [Google Scholar] [CrossRef] [Scilit] [PubMed]
- Satish, A.; Sabra, K.G. Passive underwater acoustic identification tags using multi-layered shells. J. Acoust. Soc. Am. 2021, 149, 3387–3405. [Google Scholar] [CrossRef] [Scilit] [PubMed]
- Zhou, Y.; Fan, J.; Huang, J.; Wang, B. Passive underwater acoustic barcodes using Rayleigh wave resonance. J. Appl. Phys. 2022, 131, 124901. [Google Scholar] [CrossRef] [Scilit]
- Zhou, F.; Fan, J.; Wang, B.; Zhou, Y.; Huang, J. Acoustic barcode based on the acoustic scattering characteristics of underwater targets. Appl. Acoust. 2022, 189, 108607. [Google Scholar] [CrossRef] [Scilit]
- Bhardwaj, A.; Allam, A.; Erturk, A.; Sabra, K.G. Ultrasound-Powered Wireless Underwater Acoustic Identification Tags for Backscatter Communication. IEEE Trans. Ultrason. Ferroelectr. Freq. Control 2024, 71, 304–313. [Google Scholar] [CrossRef] [Scilit] [PubMed]
- Somaan, N.; Bhardwaj, A.; Sabra, K.G. Passive acoustic identification tags for marking underwater docking stations. JASA Express Lett. 2024, 4, 126001. [Google Scholar] [CrossRef] [Scilit] [PubMed]
- Bhardwaj, A.; Erturk, A.; Sabra, K.G. Broadband wireless battery-free acoustic identification tags for high data-rate underwater backscatter communication. J. Acoust. Soc. Am. 2025, 157, 445–458. [Google Scholar] [CrossRef] [Scilit] [PubMed]
- Cummer, S.A.; Christensen, J.; Alù, A. Controlling sound with acoustic metamaterials. Nat. Rev. Mater. 2016, 1, 16001. [Google Scholar] [CrossRef] [Scilit]
- Assouar, B.; Liang, B.; Wu, Y.; Li, Y.; Cheng, J.-C.; Jing, Y. Acoustic metasurfaces. Nat. Rev. Mater. 2018, 3, 460–472. [Google Scholar] [CrossRef] [Scilit]
- Hicks, A.J.; Haberman, M.R.; Wilson, P.S. Subwavelength acoustic metamaterial panels for underwater noise isolation. J. Acoust. Soc. Am. 2015, 138, EL254–EL257. [Google Scholar] [CrossRef] [Scilit] [PubMed]
- Jayakumari, V.G.; Shamsudeen, R.K.; Ramesh, R.; Mukundan, T. Modeling and validation of polyurethane based passive underwater acoustic absorber. J. Acoust. Soc. Am. 2011, 130, 724–730. [Google Scholar] [CrossRef] [Scilit] [PubMed]
- Kerrian, P.A.; Hanford, A.D.; Capone, D.E.; Beck, B.S. Development of a perforated plate underwater acoustic ground cloak. J. Acoust. Soc. Am. 2019, 146, 2303–2308. [Google Scholar] [CrossRef] [Scilit] [PubMed]
- Sun, L.; Hou, H. Measurement of sound absorption by underwater acoustic material using pulse-separation method. Appl. Acoust. 2014, 85, 106–110. [Google Scholar] [CrossRef] [Scilit]
- Weeratunge, H.; Shireen, Z.; Iyer, S.; Menzel, A.; Phillips, A.W.; Halgamuge, S.; Sandberg, R.; Hajizadeh, E. A machine learning accelerated inverse design of underwater acoustic polyurethane coatings. Struct. Multidiscip. Optim. 2022, 65, 213. [Google Scholar] [CrossRef] [Scilit]
- Sohrabi, S.H.; Ketabdari, M.J. Stochastic modeling and sensitivity analysis of underwater sound absorber rubber coating. Appl. Acoust. 2020, 164, 107282. [Google Scholar] [CrossRef] [Scilit]
- Zhao, C.; Zhang, T.; Hou, G. Finite-difference time-domain modeling for underwater acoustic scattering applications based on immersed boundary method. Appl. Acoust. 2022, 193, 108764. [Google Scholar] [CrossRef] [Scilit]
- Parsons, M.J.G.; Fenny, E.; Lucke, K.; Osterrieder, S.; Jenkins, G.; Saunders, B.J.; Jepp, P.; Parnum, I.M. Imaging Marine Fauna with a Tritech Gemini 720i Sonar. Acoust. Aust. 2017, 45, 41–49. [Google Scholar] [CrossRef] [Scilit]
- Verma, A.; Kloser, R.J.; Duncan, A.J. Potential Use of Broadband Acoustic Methods for Micronekton Classification. Acoust. Aust. 2017, 45, 353–361. [Google Scholar] [CrossRef] [Scilit]
- Lu, D.; Xing, G.; Luo, T.; Zhang, Q. On Robust Beamforming for Distorted Towed Linear Array Using Product Theorem. Acoust. Aust. 2020, 48, 211–219. [Google Scholar] [CrossRef] [Scilit]
- Yang, Y.; Yang, S.; Ding, Y. Research on Active Sonar Object Echo Signal Enhancement Technology in the Spatial Fractional Fourier Domain. Acoust. Aust. 2021, 49, 495–504. [Google Scholar] [CrossRef] [Scilit]
- Padois, T.; Fischer, J.; Doolan, C.; Doutres, O. Acoustic imaging with conventional frequency domain beamforming and generalized cross correlation: A comparison study. Appl. Acoust. 2021, 177, 107914. [Google Scholar] [CrossRef] [Scilit]
- Liu, X.; Wei, T.; Sun, C.; Yang, Y.; Zhuo, J. High-resolution two-dimensional imaging using MIMO sonar with limited physical size. Appl. Acoust. 2021, 182, 108280. [Google Scholar] [CrossRef] [Scilit]
- Liu, X.; Fan, J.; Sun, C.; Yang, Y.; Zhuo, J. High-resolution and low-sidelobe forward-look sonar imaging using deconvolution. Appl. Acoust. 2021, 178, 107986. [Google Scholar] [CrossRef] [Scilit]
- Kwak, M.K.; Kim, K.C. Axisymmetric vibration of circular plates in contact with fluid. J. Sound Vib. 1991, 146, 381–389. [Google Scholar] [CrossRef] [Scilit]
- Sarradj, E. Three-dimensional acoustic source mapping with different beamforming steering vector formulations. Adv. Acoust. Vib. 2012, 2012, 292695. [Google Scholar] [CrossRef] [Scilit]
- Movahed, A.; Waschkies, T.; Rabe, U. Air ultrasonic signal localization with a beamforming microphone array. Adv. Acoust. Vib. 2019, 2019, 7691645. [Google Scholar] [CrossRef] [Scilit]

Disclaimer/Publisher’s Note: The statements, opinions and data contained in all publications are solely those of the individual author(s) and contributor(s) and not of MDPI and/or the editor(s). MDPI and/or the editor(s) disclaim responsibility for any injury to people or property resulting from any ideas, methods, instructions or products referred to in the content. |
© 2026 by the authors. Licensee MDPI, Basel, Switzerland. This article is an open access article distributed under the terms and conditions of the Creative Commons Attribution (CC BY) license.