


Abstract
Ocean winds and waves play a vital role in maritime navigation safety, offshore operations, and coastal zone dynamics. Although both factors have been widely studied individually, the joint characterization of wind and wave events remains limited in the North Indian Ocean. This study, utilizing ERA5 reanalysis data from 1980 to 2022, statistically analyzed the distribution and variation patterns of both wind speed and significant wave height, investigating the occurrence, affected area proportion, frequency, and intensity of SBLWEs. To understand the cause of Strong Breeze and Large Wave Events (SBLWEs), their connections with other phenomena, such as tropical cyclones, were also explored. The results show that regions with strong breezes and large waves are mainly concentrated in the central and western Arabian Sea near Africa and the central and western Bay of Bengal. Monthly averages indicate that wind and wave intensity are much higher during the summer monsoon than in other seasons, with high intensity, probability, and extensive affected areas of SBLWEs. The occurrence probability of SBLWEs is highest in the central and western Arabian Sea (up to ~40%), and the highest probability in the Bay of Bengal is about 20% near the eastern coast of Sri Lanka. The peak period of SBLWEs occurs from June to August, with the largest affected area in July, reaching almost 25%. Over the past 40 years, the number of SBLWEs has shown an increasing trend, with an average of 0.7 events annually. The intensity distribution of SBLWEs resembles that of wind speed and wave height, with the highest intensity areas concentrated in the Bay of Bengal, affected by tropical cyclones. This study can serve as a scientific reference for maritime route planning and offshore operations, helping to reduce the negative impacts of large wind and wave events and enhance navigation safety.
1. Introduction
The North Indian Ocean (NIO), comprising the Arabian Sea and the Bay of Bengal, is enclosed on three sides by the landmasses of Africa and Asia, giving it a unique geographical configuration [1]. This region exhibits complex wind-wave dynamics, with frequent extreme wind-wave events, not only posing a threat to maritime navigation but also impacting offshore operations and coastal safety [2,3,4]. Therefore, understanding the distribution patterns, intensity, and trends of strong breeze and large wave events (SBLWEs) in NIO is scientifically important and practically necessary for ensuring maritime traffic safety, optimizing marine offshore operations, and enhancing the efficiency of offshore engineering [5,6].
Due to the seasonal transitions of atmospheric systems, the NIO experiences distinct winter and summer monsoons, with wind directions reversing semi-annually. These monsoons are crucial in wind and wave variability in the NIO. Notably, the summer monsoon is considerably stronger than the winter monsoon, during which extreme waves also predominantly occur [7,8,9]. Liu et al. [10] analyzed wind and wave patterns in the NIO, concluding that maritime navigation faces extreme hazards during the summer monsoon, whereas the transitional phases between the two monsoons exhibit the lowest risk levels. Moreover, the high frequency of tropical cyclone formation in this region also intensifies severe wind and wave events. Tropical cyclones are highly destructive, generating violent winds and massive waves at sea, and cause significant loss of life and property along coastal areas such as India and Bangladesh [11].
The wind speed and significant wave height (SWH) in the NIO have generally exhibited an increasing trend [2,7,12]. Satellite remote sensing data indicate that, under climate change, wind and waves are intensifying in the NIO, and their combination with storms may directly impact coastal areas [13,14]. Kerkar et al. [7] found that SWH in the Arabian Sea is higher than in the Bay of Bengal, especially in the western Arabian Sea. Additionally, the annual mean SWH shows an increasing trend. In the eastern Arabian Sea, the annual mean wind speed displays a statistically significant decreasing trend, while the annual mean SWH shows a slight increase. However, both the annual maximum wind speed and SWH present an increasing trend [15]. In the Bay of Bengal, both annual mean wind speed and SWH show an increasing trend; however, the upward trend of SWH is smaller [16]. Using ERA5 data, Bhaskaran et al. [17] investigated extreme swell characteristics in the Indian Ocean under climate change, indicating that extreme swell heights are increasing at a rate of 0.27 cm/year. This is moderate compared with other parts of the Earth, where 90th percentile trends reach ~1.0 cm/year in the Southern Ocean and ~0.8 cm/year in the North Atlantic (1985–2018), and mean trends of ~1.0 cm/year are found in the North Atlantic between 50–70° N over the 20th century [12,18]. Overall, the ongoing intensification of wind speed and wave height in the NIO may have more severe impacts in the future.
Although wind speed and wave height have been widely investigated as individual factors, their synergistic effects remain insufficiently explored, particularly in the North Indian Ocean (NIO). To address this limitation, this study introduces a dimensionless Joint Intensity Index that integrates wind speed and wave height, allowing event intensity to be quantified according to the dominant hazard at each moment and providing a more physically meaningful representation of compound wind–wave extremes. Due to the need for high spatial and temporal resolution data, numerical models and their derived products are particularly important [19,20,21,22,23]. Among the available options, ERA5 has been proven suitable for wind and wave analysis in the NIO, with its wind speed and SWH showing good agreement with satellite and buoy observations [6,17,22,24,25,26]. Therefore, this study employs the ERA5 reanalysis dataset (1980–2022) to conduct a comprehensive assessment of SBLWEs in the NIO, defining SBLWEs by integrating wind speed and wave height levels, making the classification more intuitive. Furthermore, we implement an object-based spatiotemporal tracking algorithm to characterize SBLWEs as evolving physical entities rather than discrete grid points. Furthermore, the study calculates the occurrence probability, frequency, and intensity based on the statistical analysis of the spatiotemporal variation patterns of wind speed and SWH, providing a comprehensive characterization of SBLWEs in the NIO. By moving beyond univariate statistics to a unified hazard framework, this study provides practical scientific guidance for maritime navigation and offshore engineering in this strategically important region.
2. Materials and Methods
2.1. Data
The primary data used in this study is from the ERA5 reanalysis dataset, the fifth-generation atmospheric reanalysis of the global climate produced by the European Centre for Medium-Range Weather Forecasts (ECMWF), which provides data from 1940 to about 5 days before the present. The “single level” dataset includes 10 m u/v wind components, SWH combining wind waves and swell, and other variables such as mean wave direction and mean wave period. The highest temporal resolution provided for the data is 1 h, with a spatial resolution of 0.5° × 0.5° for wave, and 0.25° × 0.25° for 10 m wind speed. In this study, the data were processed to obtain daily averages, and wind speed was resampled to a 0.5° grid to ensure spatial consistency. The dataset is publicly available at https://cds.climate.copernicus.eu (accessed on 6 January 2026).
The typhoon best-track datasets were obtained from the International Best Track Archive for Climate Stewardship (IBTrACS). It is the most complete global collection of tropical cyclones available, synthesizing observational data from multiple agencies, including the Joint Typhoon Warning Center and the India Meteorological Department. The dataset provides information on cyclone position, intensity, and other related parameters [27]. The data can be downloaded from https://www.ncei.noaa.gov/products/international-best-track-archive (accessed on 6 January 2026).
2.2. Methods
2.2.1. Definition of Strong Breeze and Large Wave Events
There are international standards for classifying wind speed and wave height. Wind speed can be classified according to the Beaufort scale, and wave height according to the Douglas scale. At a Force 6 wind (Strong breeze, 10.8–13.8 m/s) on the Beaufort scale, large waves begin to form [28,29], indicating sea conditions already necessitating caution for offshore operations. Typically, a Force 6 wind is associated with Sea State 5 on the Douglas scale, known as a “rough sea,” with a SWH ranging from 2.5 to 4 m. Although wind and wave conditions are often assessed separately, evaluating only one of the two factors is insufficient, as wind and wave extremes are not always simultaneously aligned. Therefore, a comprehensive assessment reflecting the risks associated with both is necessary. For convenience, this study defines “Strong Breeze and Large Wave Events” based on the classification thresholds of both wind and waves. An event is identified when either the wind speed or the SWH at a grid point reaches the lower threshold—10.8 m/s for wind or 2.5 m for wave height—corresponding to Force 6 wind and Sea State 5, respectively. To ensure the significance of the detected events, those affecting only a relatively limited area are excluded. The number of SBLWEs was determined using a spatiotemporal tracking algorithm, which consists of two main steps. First, for each daily time step, we identified spatial clusters of grid points that exceeded the defined thresholds using a 4-connectivity neighborhood search. Then, these spatial clusters were tracked through time. An event on Day N is considered a continuation of an event on Day N − 1 if their spatial footprints overlap. This ensures that a single physical system (e.g., a tropical cyclone or a persistent monsoon surge) moving across the ocean is counted as one unique event rather than multiple isolated occurrences. Regarding duration, due to the destructive potential of strong breezes and large waves, even short-lived events can pose serious hazards. Therefore, events lasting only one day are also included in the analysis.
2.2.2. Intensity
Both wind speed and wave height have corresponding classification scales. SBLWEs also require intensity classification, and the event intensity should be defined based on a combined measure incorporating both parameters, ensuring a more comprehensive representation of the associated hazard. The intensity of each event is thus calculated as follows:
Here, and are the threshold values used to determine whether a strong breeze and large wave event has occurred. The operator max() selects the greater of the two normalized exceedances. I represents the percentage by which the observed values exceed the thresholds. A value of I ≥ 0 indicates an SBLWE, while I < 0 indicates otherwise. This approach ensures that both wind and wave indicators are considered, avoiding misjudgment caused by one variable being smaller than the corresponding threshold.
3. Results
3.1. Analysis of Climatological Characteristics and Spatiotemporal Variations in Wind Speed and SWH
3.1.1. Long-Term Mean Wind Speed and SWH
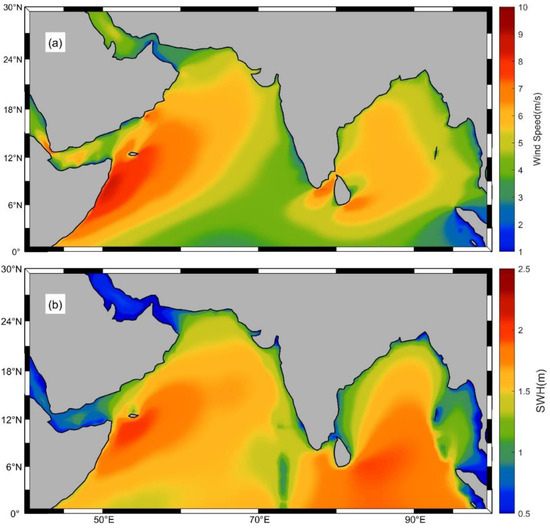
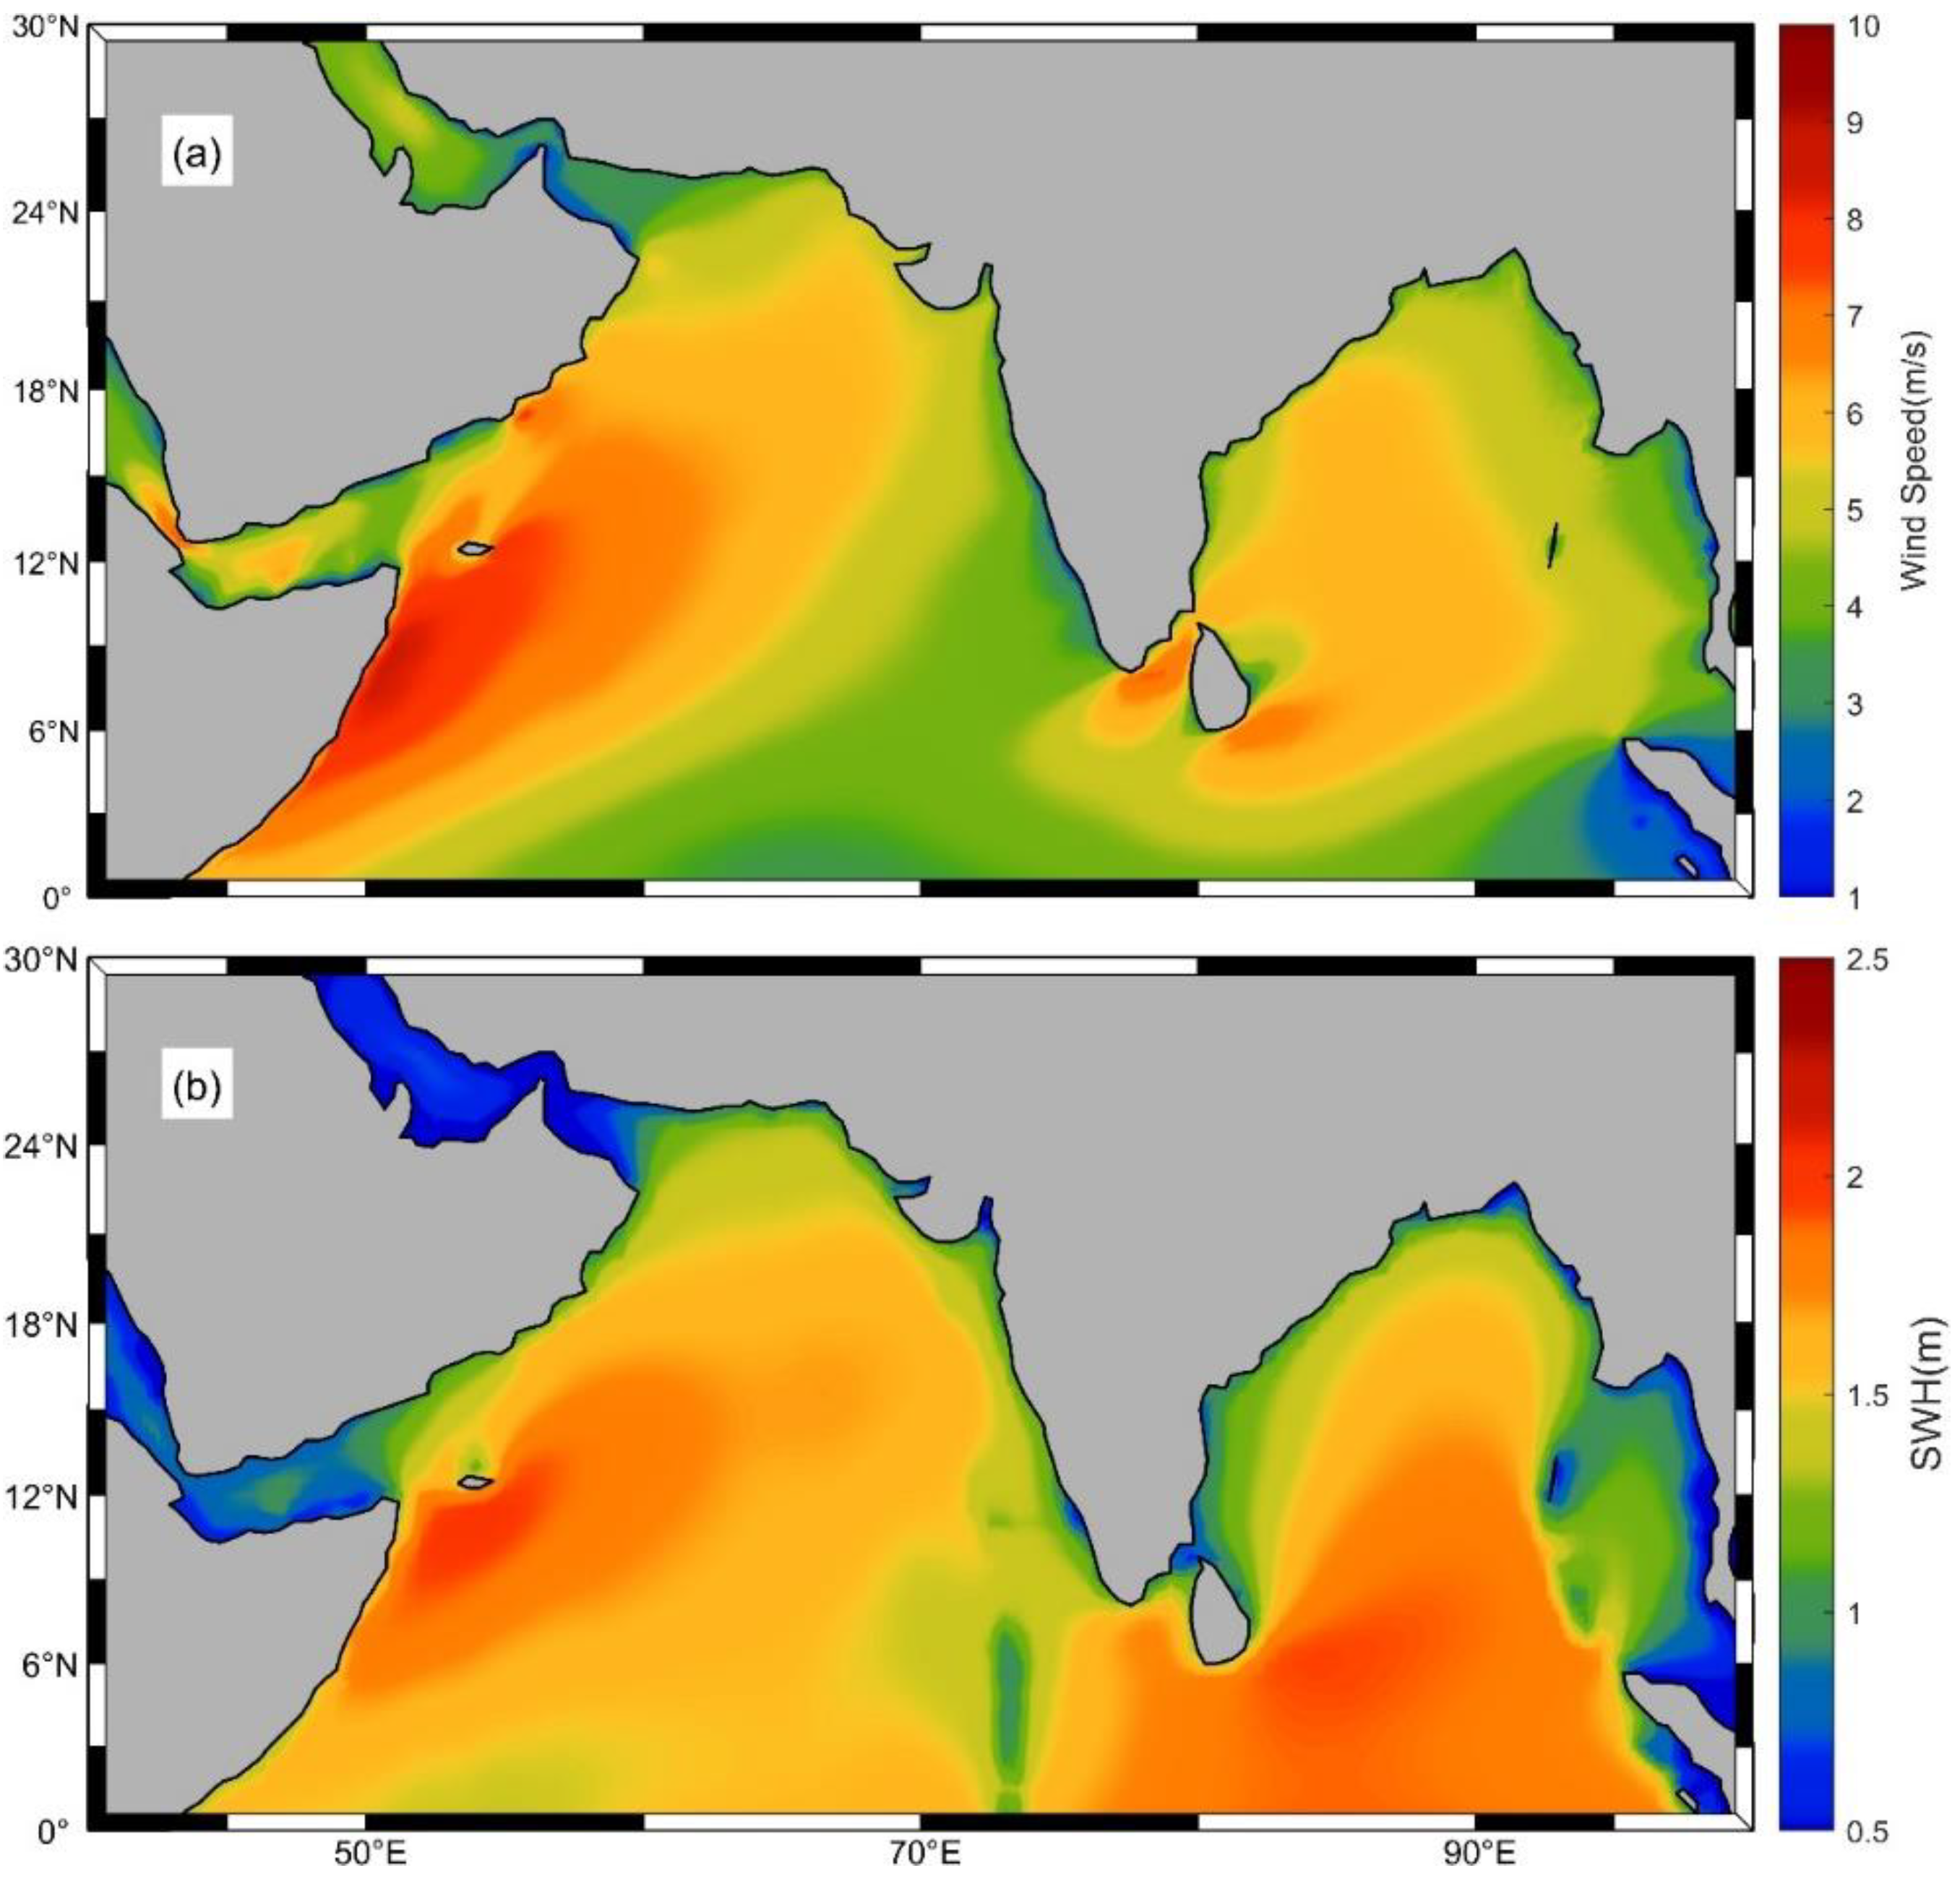
To understand the long-term average characteristics of wind speed and SWH in the NIO (40–100° E, 0–30° N), reanalysis data spanning 43 years from 1980 to 2022 were utilized to calculate the mean wind speed and SWH, as shown in Figure 1. Figure 1a indicates that the areas with high wind speeds are primarily concentrated in two regions. The first region is located in the central and western Arabian Sea near the coast, specifically east of the Horn of Africa, extending from southwest to northeast, with a maximum mean wind speed reaching approximately 10 m/s. The second region is in the central and western Bay of Bengal, where the highest values are found northwest and southeast of Sri Lanka, with a maximum mean wind speed of about 8 m/s. As depicted in Figure 1b, the high SWH regions are mainly located in the central and western Arabian Sea and the southern Arabian Sea. Notably, the high SWH region in the Arabian Sea is slightly northward compared to the high wind speed region, with a maximum mean SWH of approximately 2.3 m. A distinct difference compared to the wind speed distribution is observed in the Bay of Bengal, where the high SWH region is connected to the equator, while the high wind speed region is detached from the equator. SWH is not only driven by local surface wind stress but also influenced by swells propagating from the Southern Indian Ocean, as well, which explains the connection of the high SWH region to the equator [3,30].
Figure 1.
Forty-three-year climatology of wind speed (a) and SWH (b) over the NIO.
3.1.2. Interannual Variation in Wind Speed and SWH
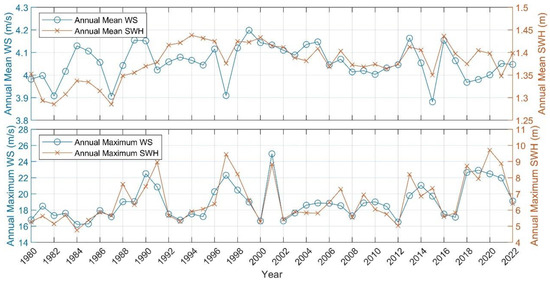
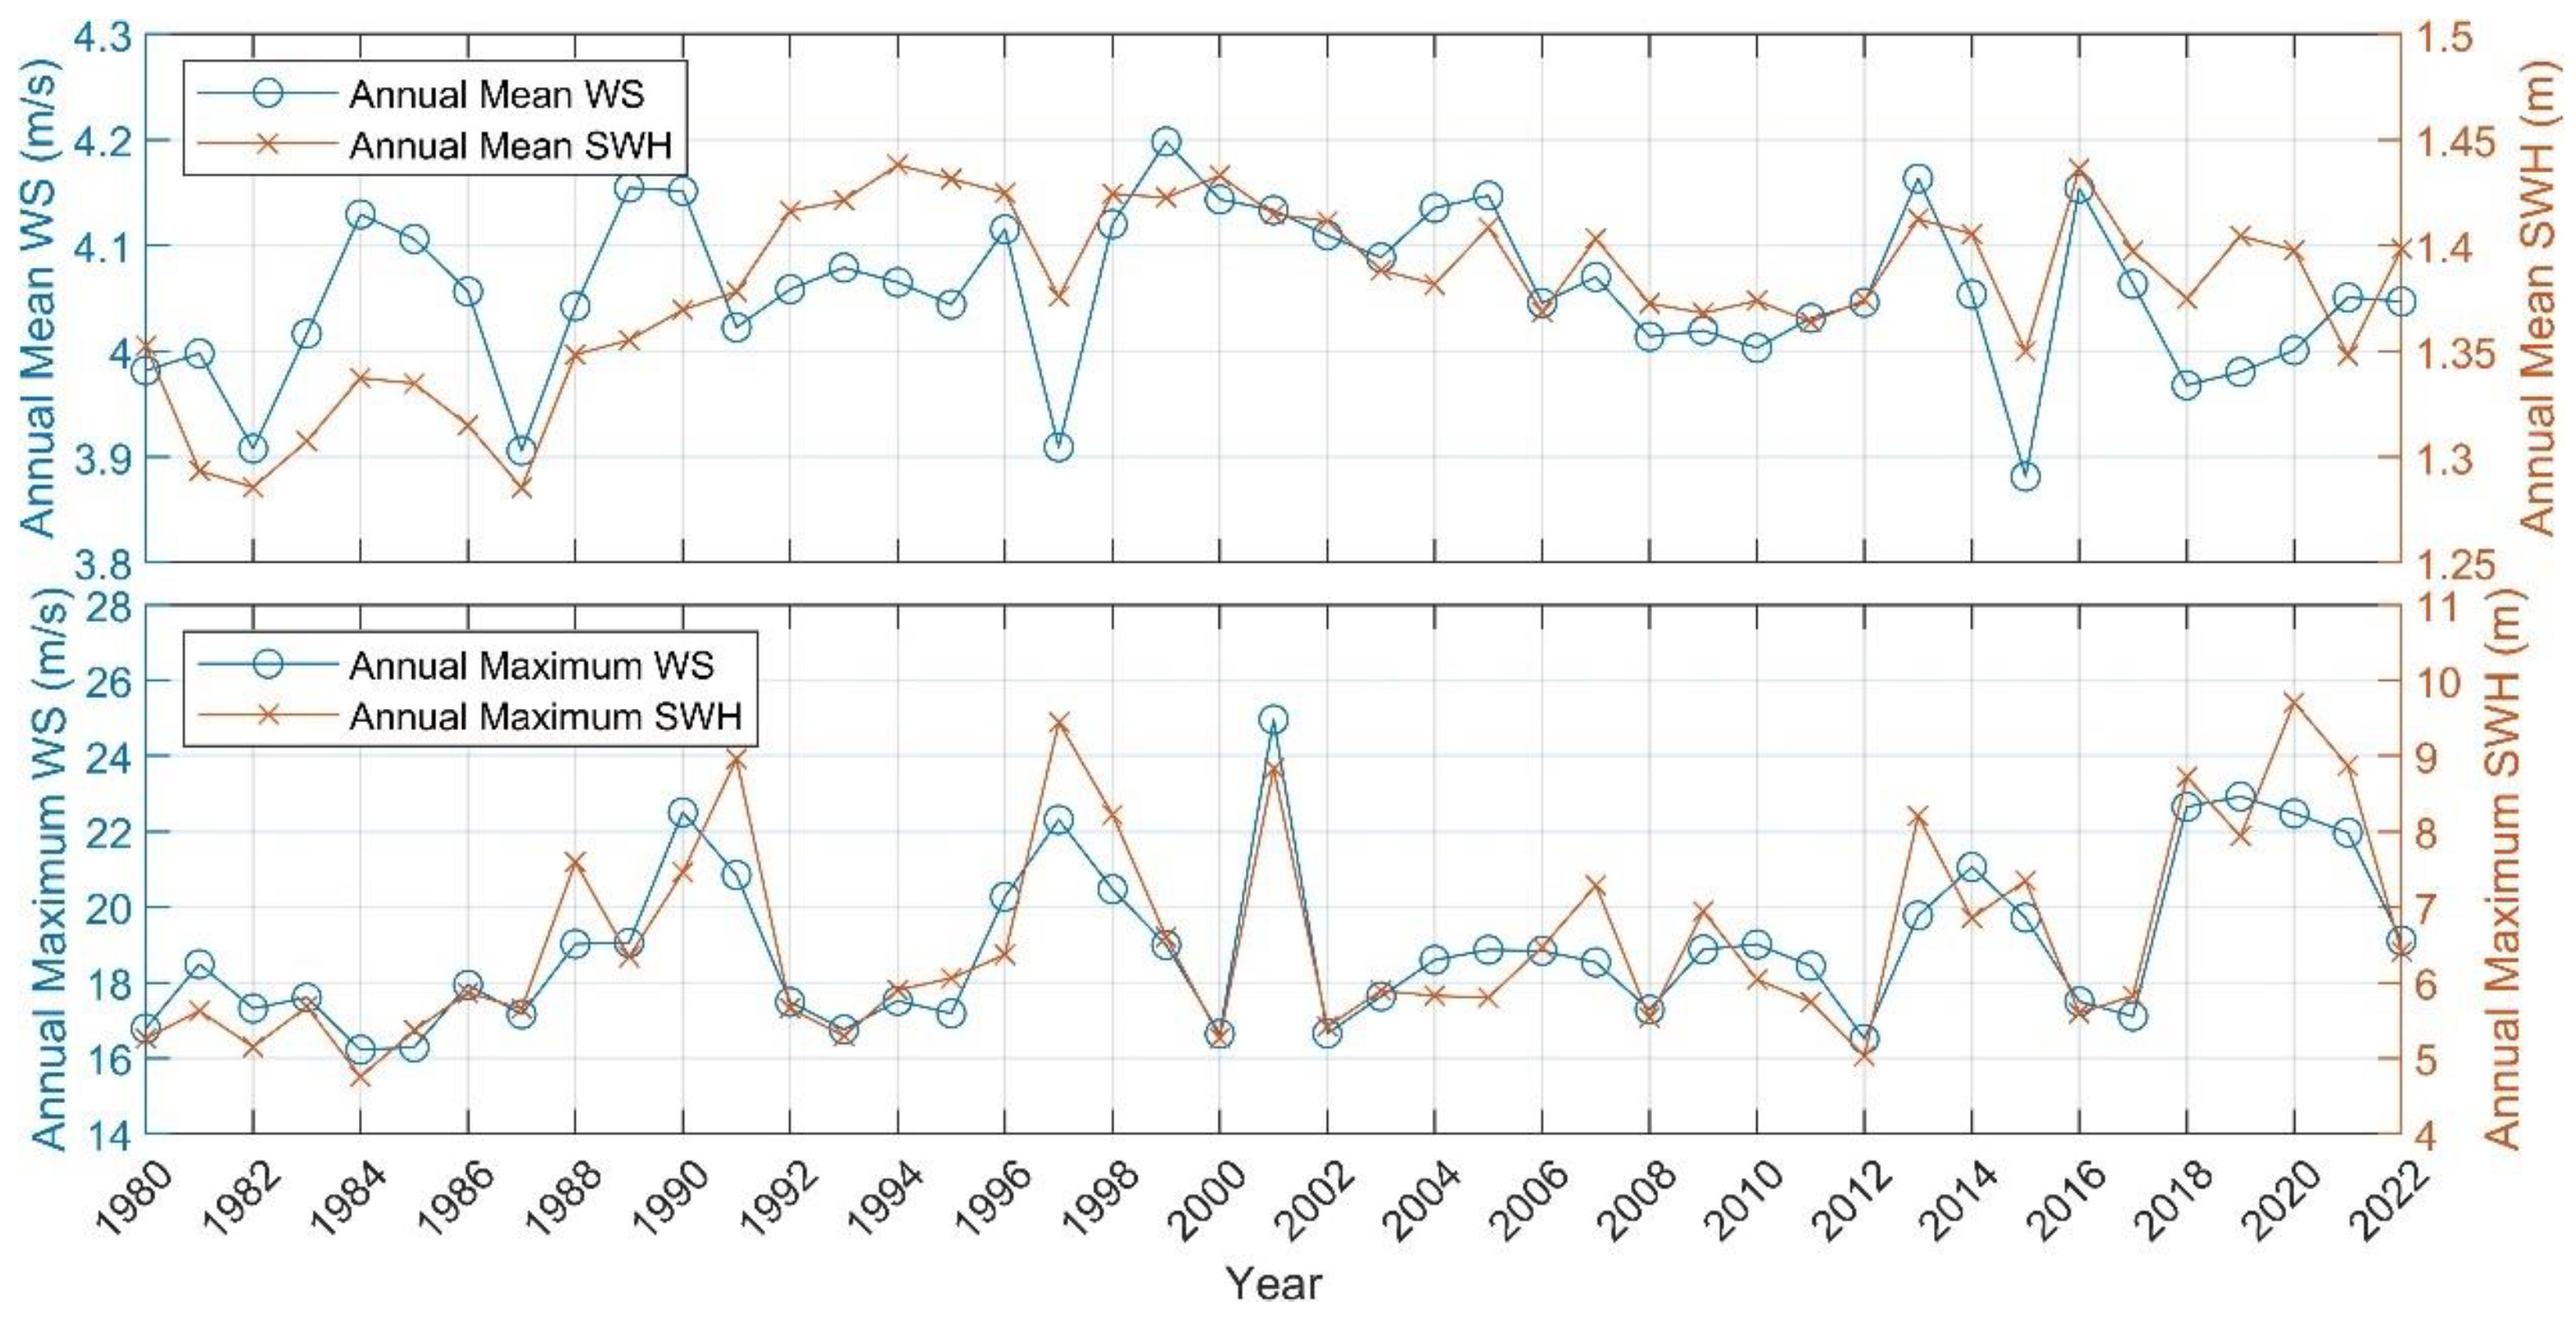
To further understand the interannual variability of wind and waves in the NIO, the annual maximum and mean values of wind speed and SWH were plotted, as shown in Figure 2. It can be observed that the variations in both the maximum and mean values of wind speed and SWH are largely consistent, though this correlation manifests differently in mean and extreme values. For the mean values, the average wind speed primarily ranges from 3.9 to 4.1 m/s. The mean SWH generally ranged between 1.3 and 1.35 m during 1980–1990, not exceeding 1.37 m; however, after 1990, the mean SWH has generally remained above 1.35 m. As for the annual maximum values, the wind speed typically falls between 16 and 22 m/s, with the highest recorded value of approximately 25 m/s in 2001. The SWH mainly ranges from 5 to 9 m, reaching its peak of 9.71 m in 2020.
Figure 2.
Mean and annual maximum values for wind speed (WS) and SWH over the NIO.
3.1.3. Monthly Variation in Wind Speed and SWH
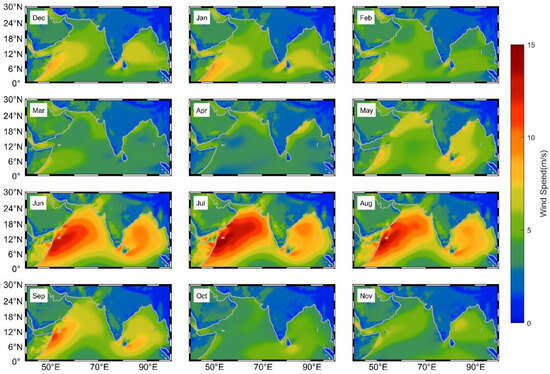
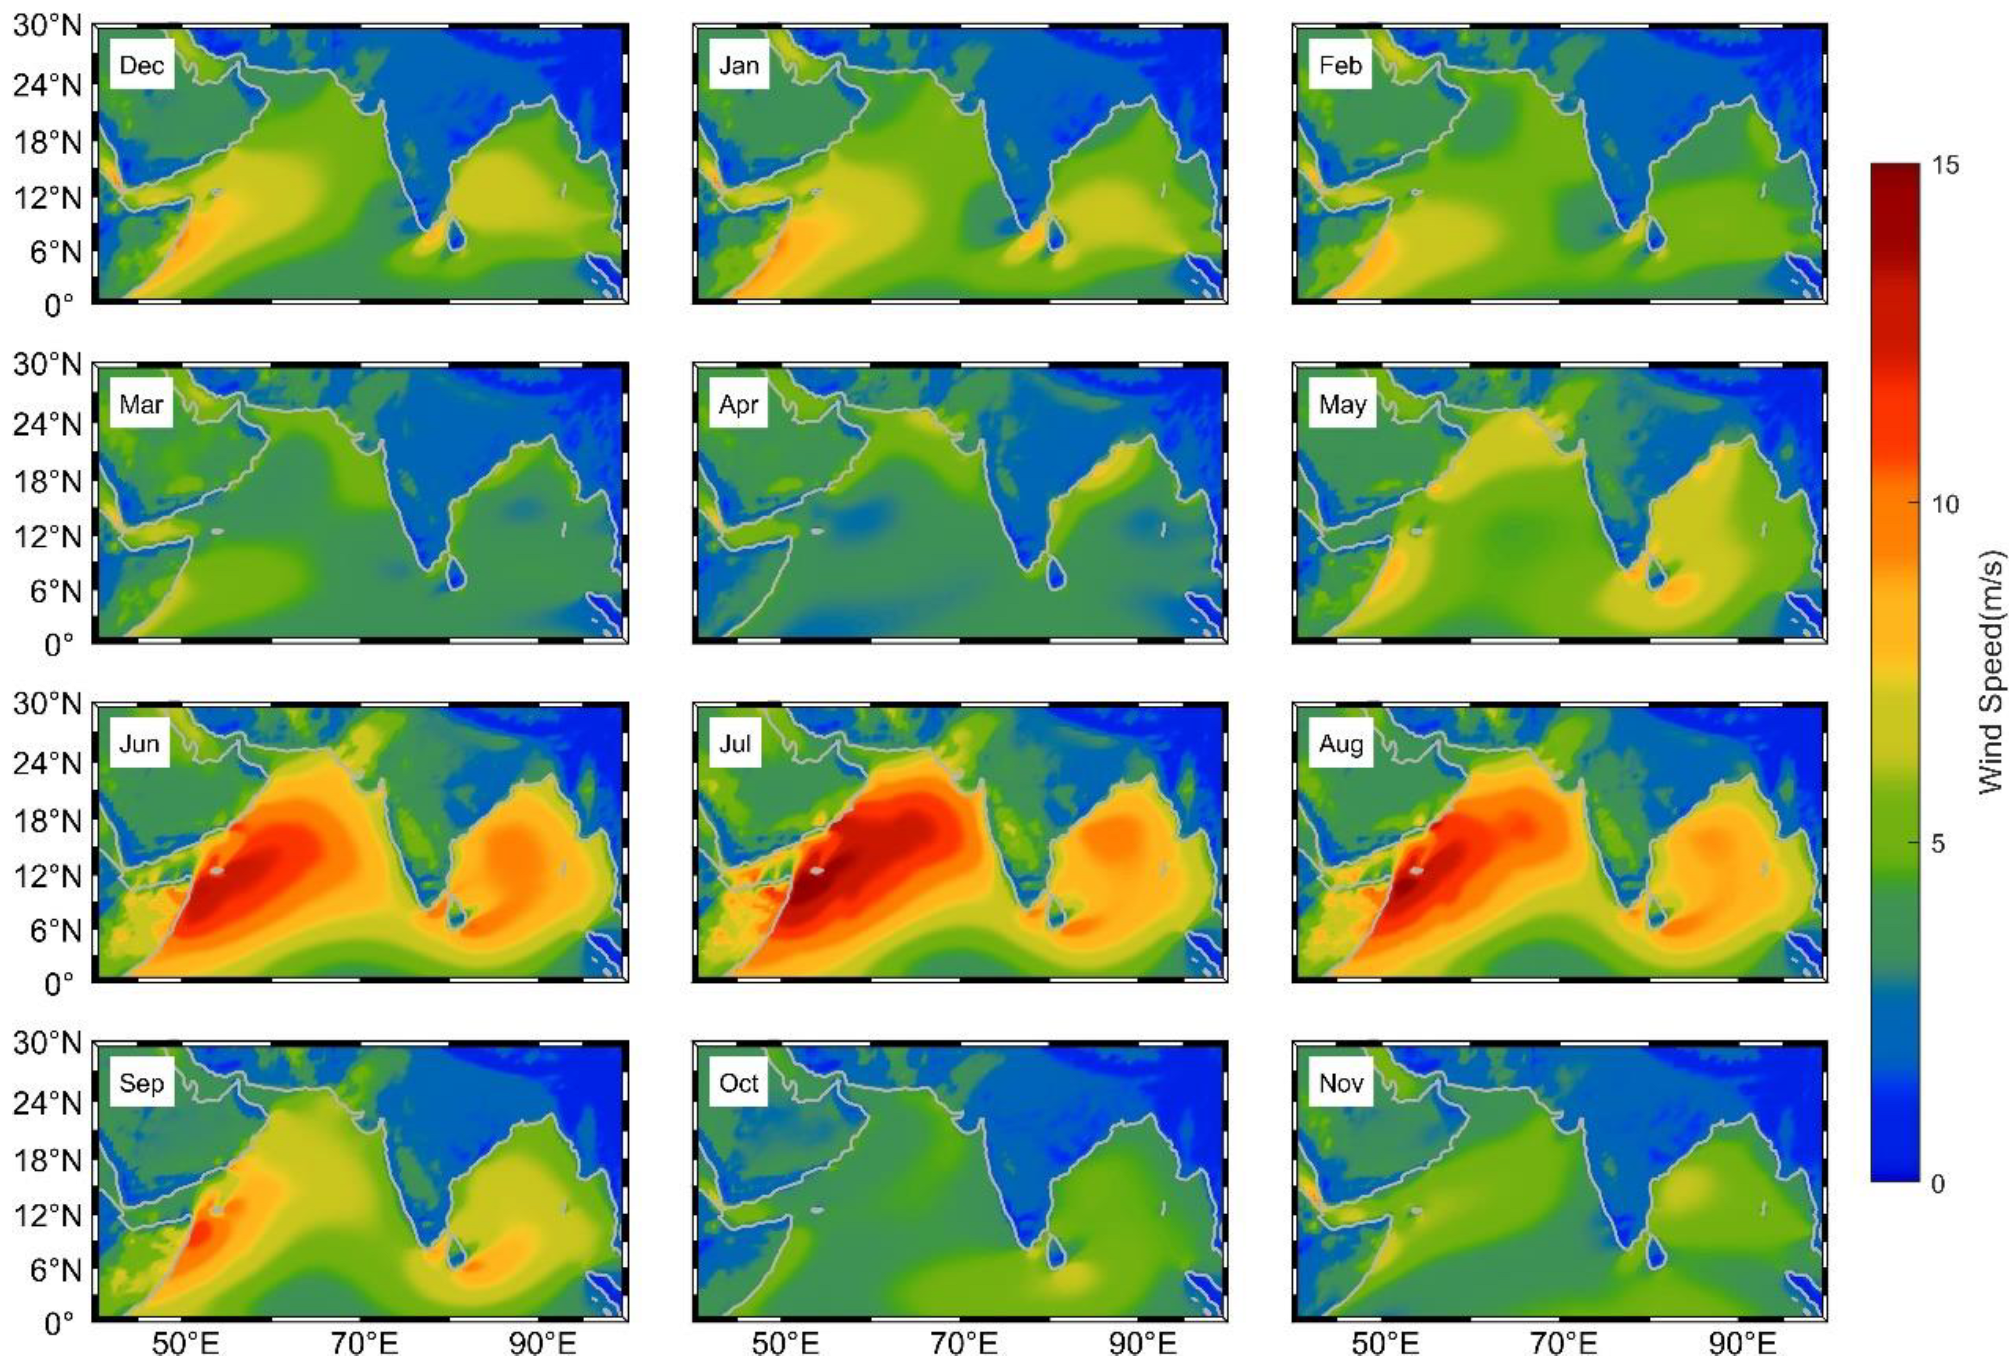
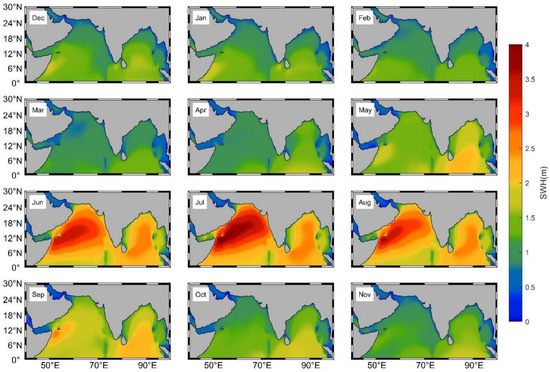
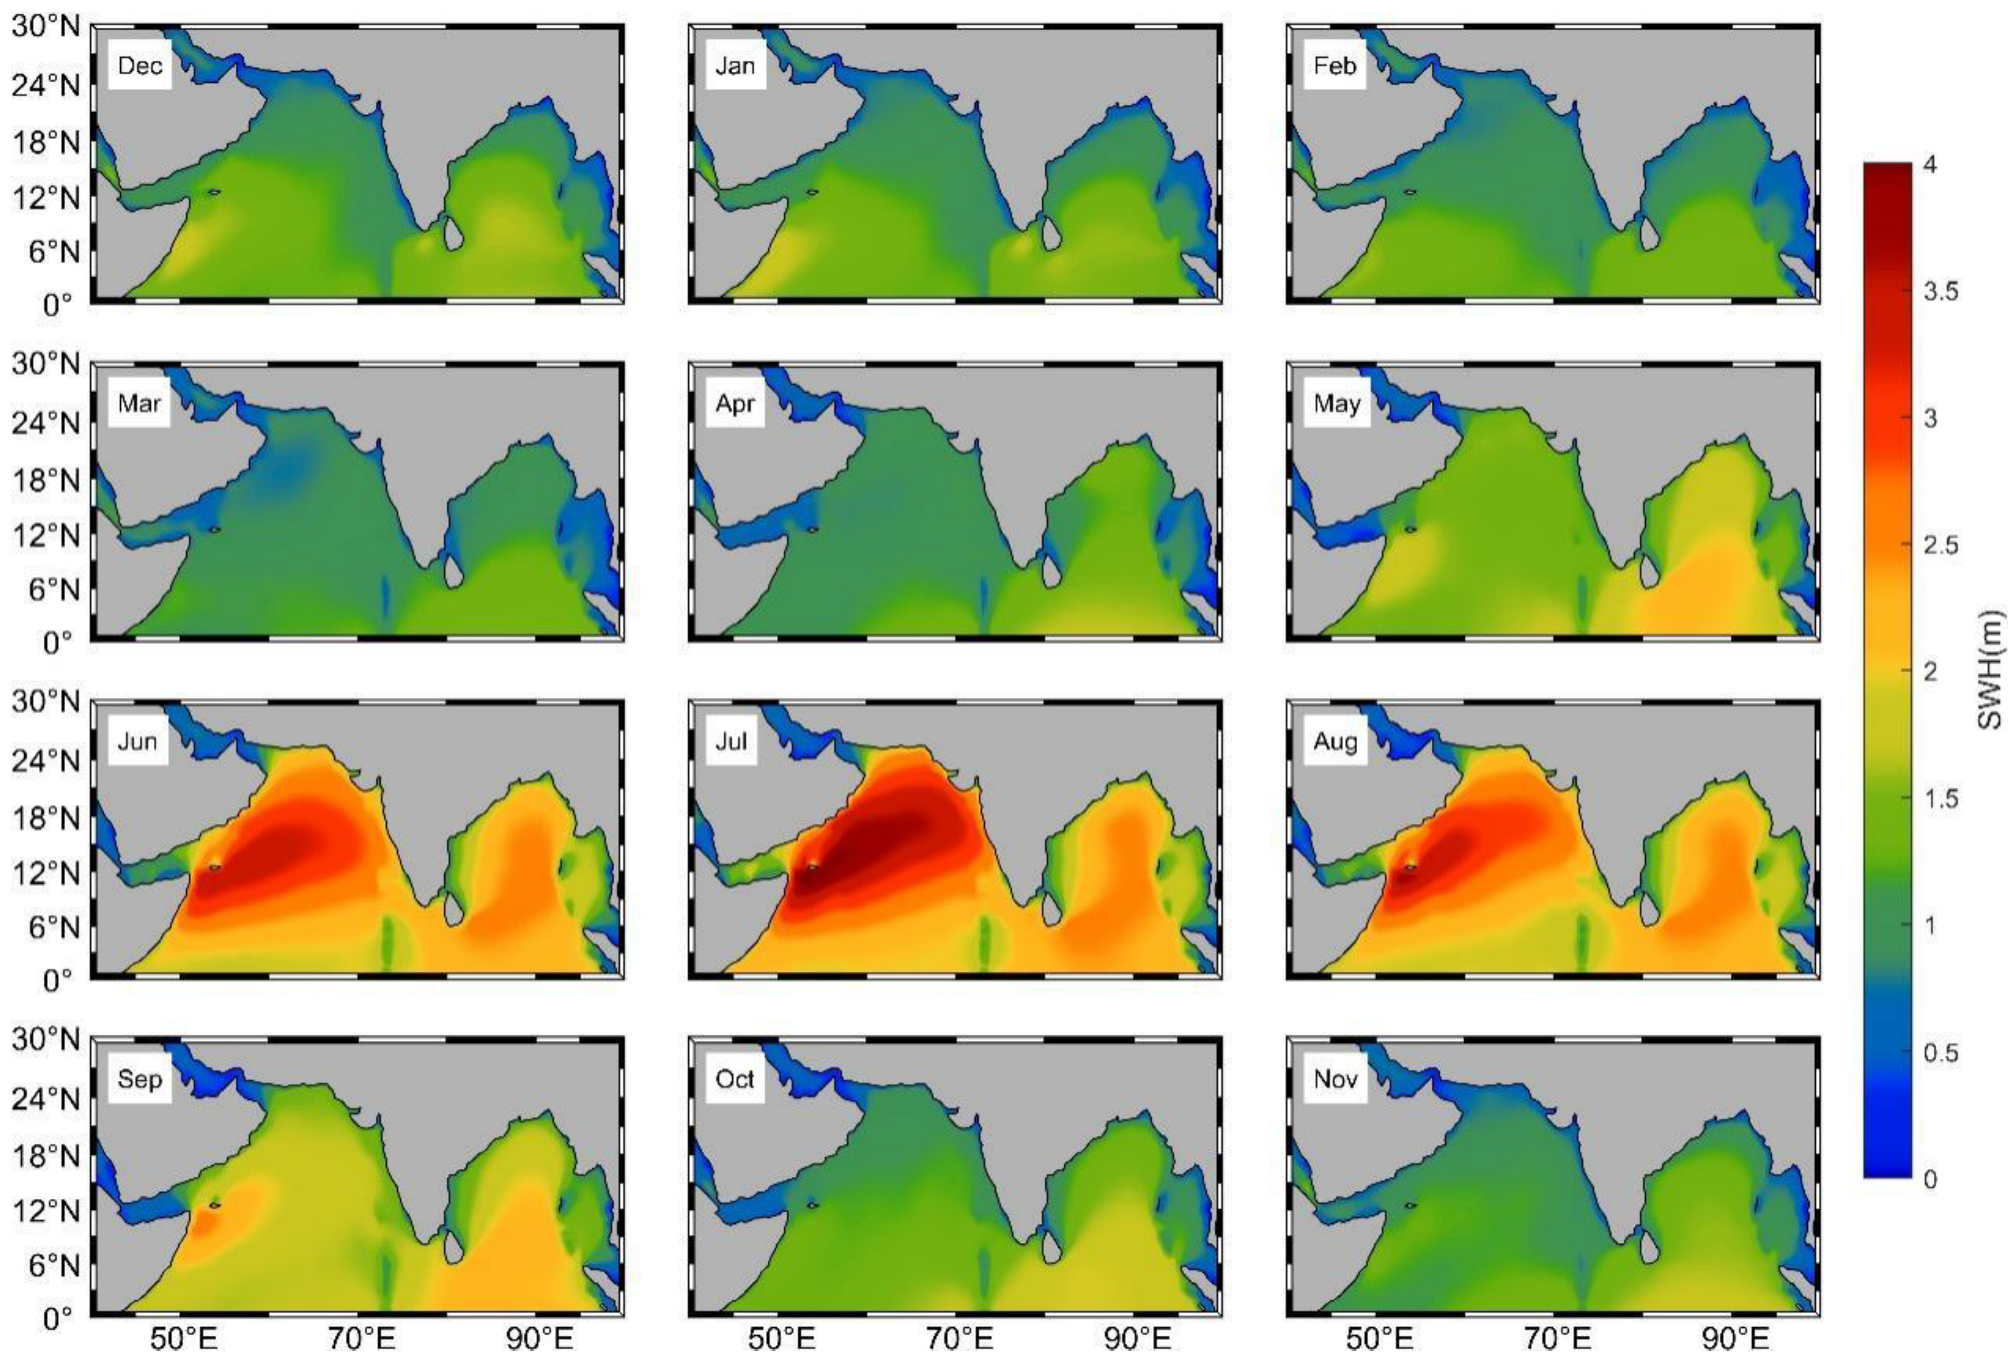
The NIO is significantly affected by monsoons, and its seasonal wind and wave patterns are closely linked to monsoon transitions. To understand the dynamics of wind speed and SWH on a monthly scale, maps showing the monthly variations in the multi-year mean wind speed (Figure 3) and SWH (Figure 4) were plotted. The monthly variation in wind speed exhibits two prominent peaks each year, corresponding to the summer monsoon (May to September) and the winter monsoon (November to March of the following year). During the intense summer monsoon, maximum wind speeds can exceed 15 m/s; driven by these strong winds, SWH values also peak, reaching over 4 m. Within the summer monsoon, wind speeds from June to August are significantly higher than in other months, with a peak in July. During the winter monsoon, the strongest winds occur in January. The presence of barriers, such as the coral reefs of the Maldives archipelago situated between the Arabian Sea and the eastern equatorial region, effectively reduces SWH. This contributes to a partial separation between the high SWH zones of the Arabian Sea and the Bay of Bengal, though these barriers have minimal impact on wind speed distribution.
Figure 3.
Monthly mean wind speed.
Figure 4.
Monthly mean SWH.
3.2. A Strong Breeze and Large Wave Event
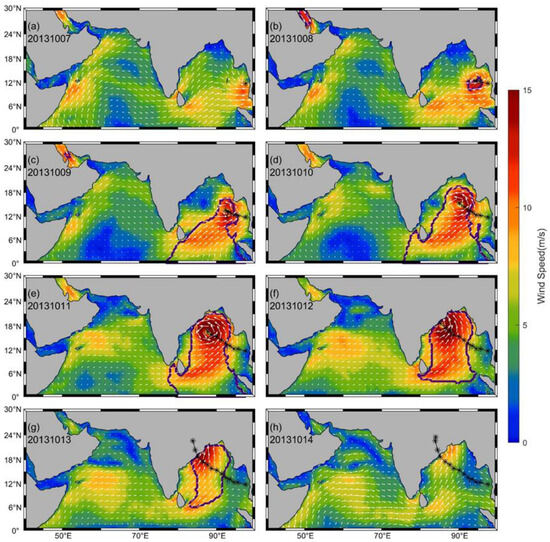
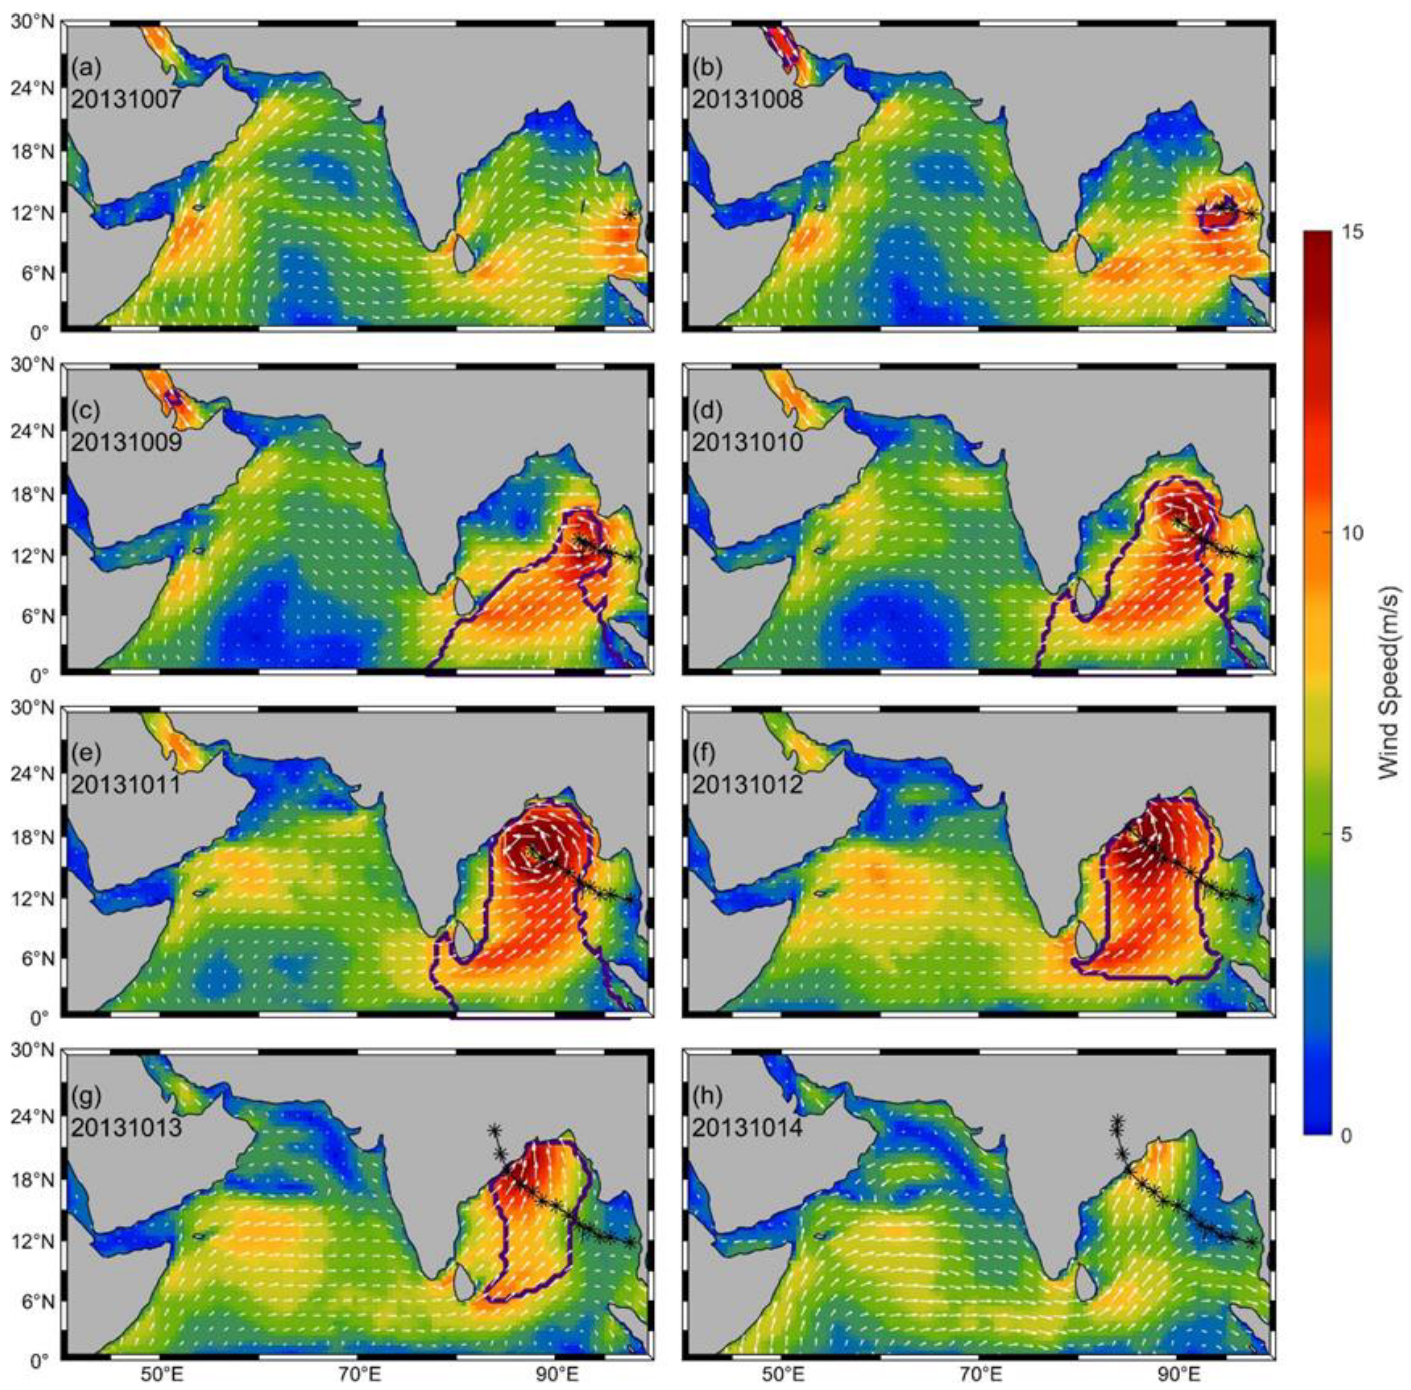
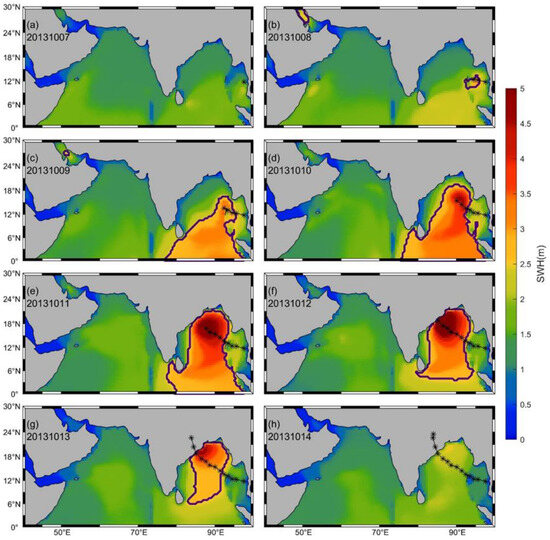
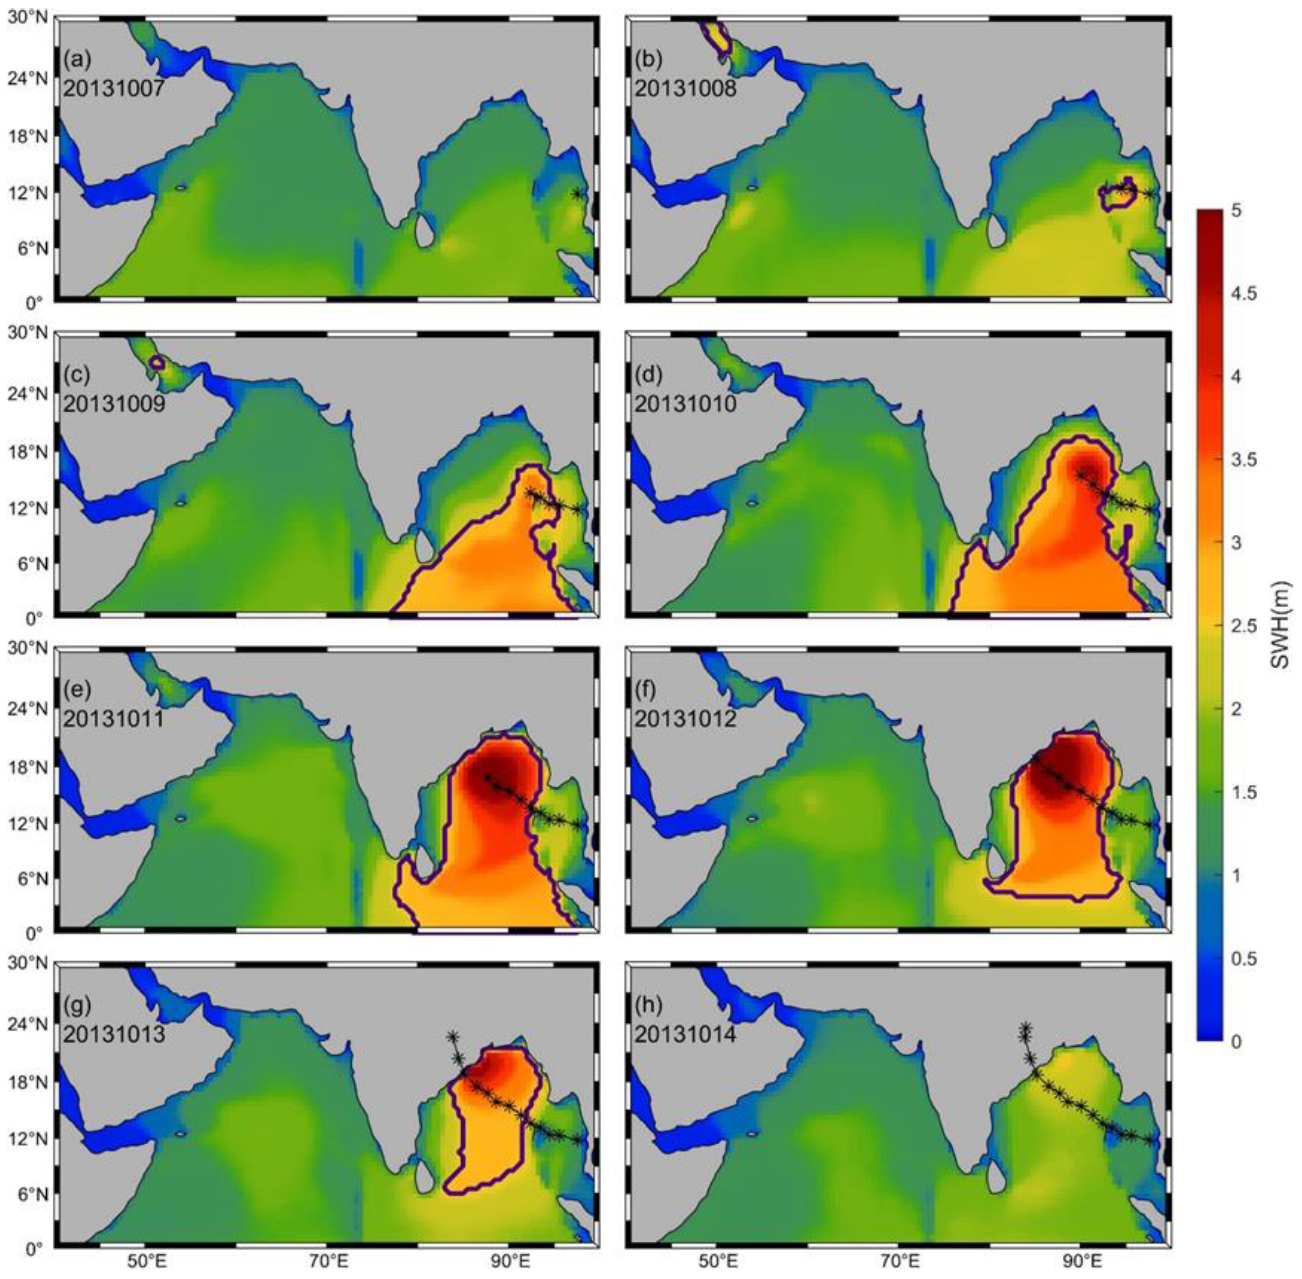
Here, Super Cyclonic Storm Phailin is taken as an example to illustrate a complete SBLWE, as shown in Figure 5 and Figure 6. Phailin was the most intense tropical cyclone in the NIO in 2013. Its maximum wind speed reached 72 m/s, and its minimum central pressure dropped to 895 hPa.
Figure 5.
Variation in wind speed during the SBLWE caused by Tropical Cyclone PHAILIN. The area enclosed by dark purple contours indicates the region experiencing SBLWE, the black asterisks (*) represent the track of the tropical cyclone, and the arrows show wind vectors.
Figure 6.
Same as Figure 5, but shows SWH.
Phailin formed on 5 October 2013, in the Gulf of Thailand, and entered the NIO on 7 October. It was upgraded to a depression on the 8th, beginning to cause localized SBLWE. In a small area south of the cyclone center, wind speed and SWH had already exceeded the thresholds for SBLWEs. On the 9th, it intensified into a tropical storm, leading to a widespread SBLWE. A large region extending from the southern flank of the cyclone down to the equator experienced SBLWEs. In the southernmost portion of this region, while wind speeds did not exceed the wind threshold, the SWH surpassed the wave threshold. It reached Super Cyclonic Storm intensity during 11–12 October, made landfall over India on the 13th, and subsequently weakened rapidly. The associated SBLWE had dissipated by 14 October.
3.3. Probability and Number of SBLWEs
3.3.1. Occurrence Probability and Area of SBLWEs
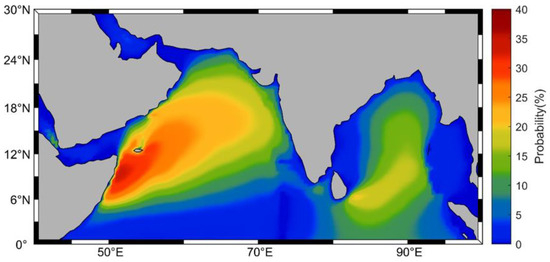
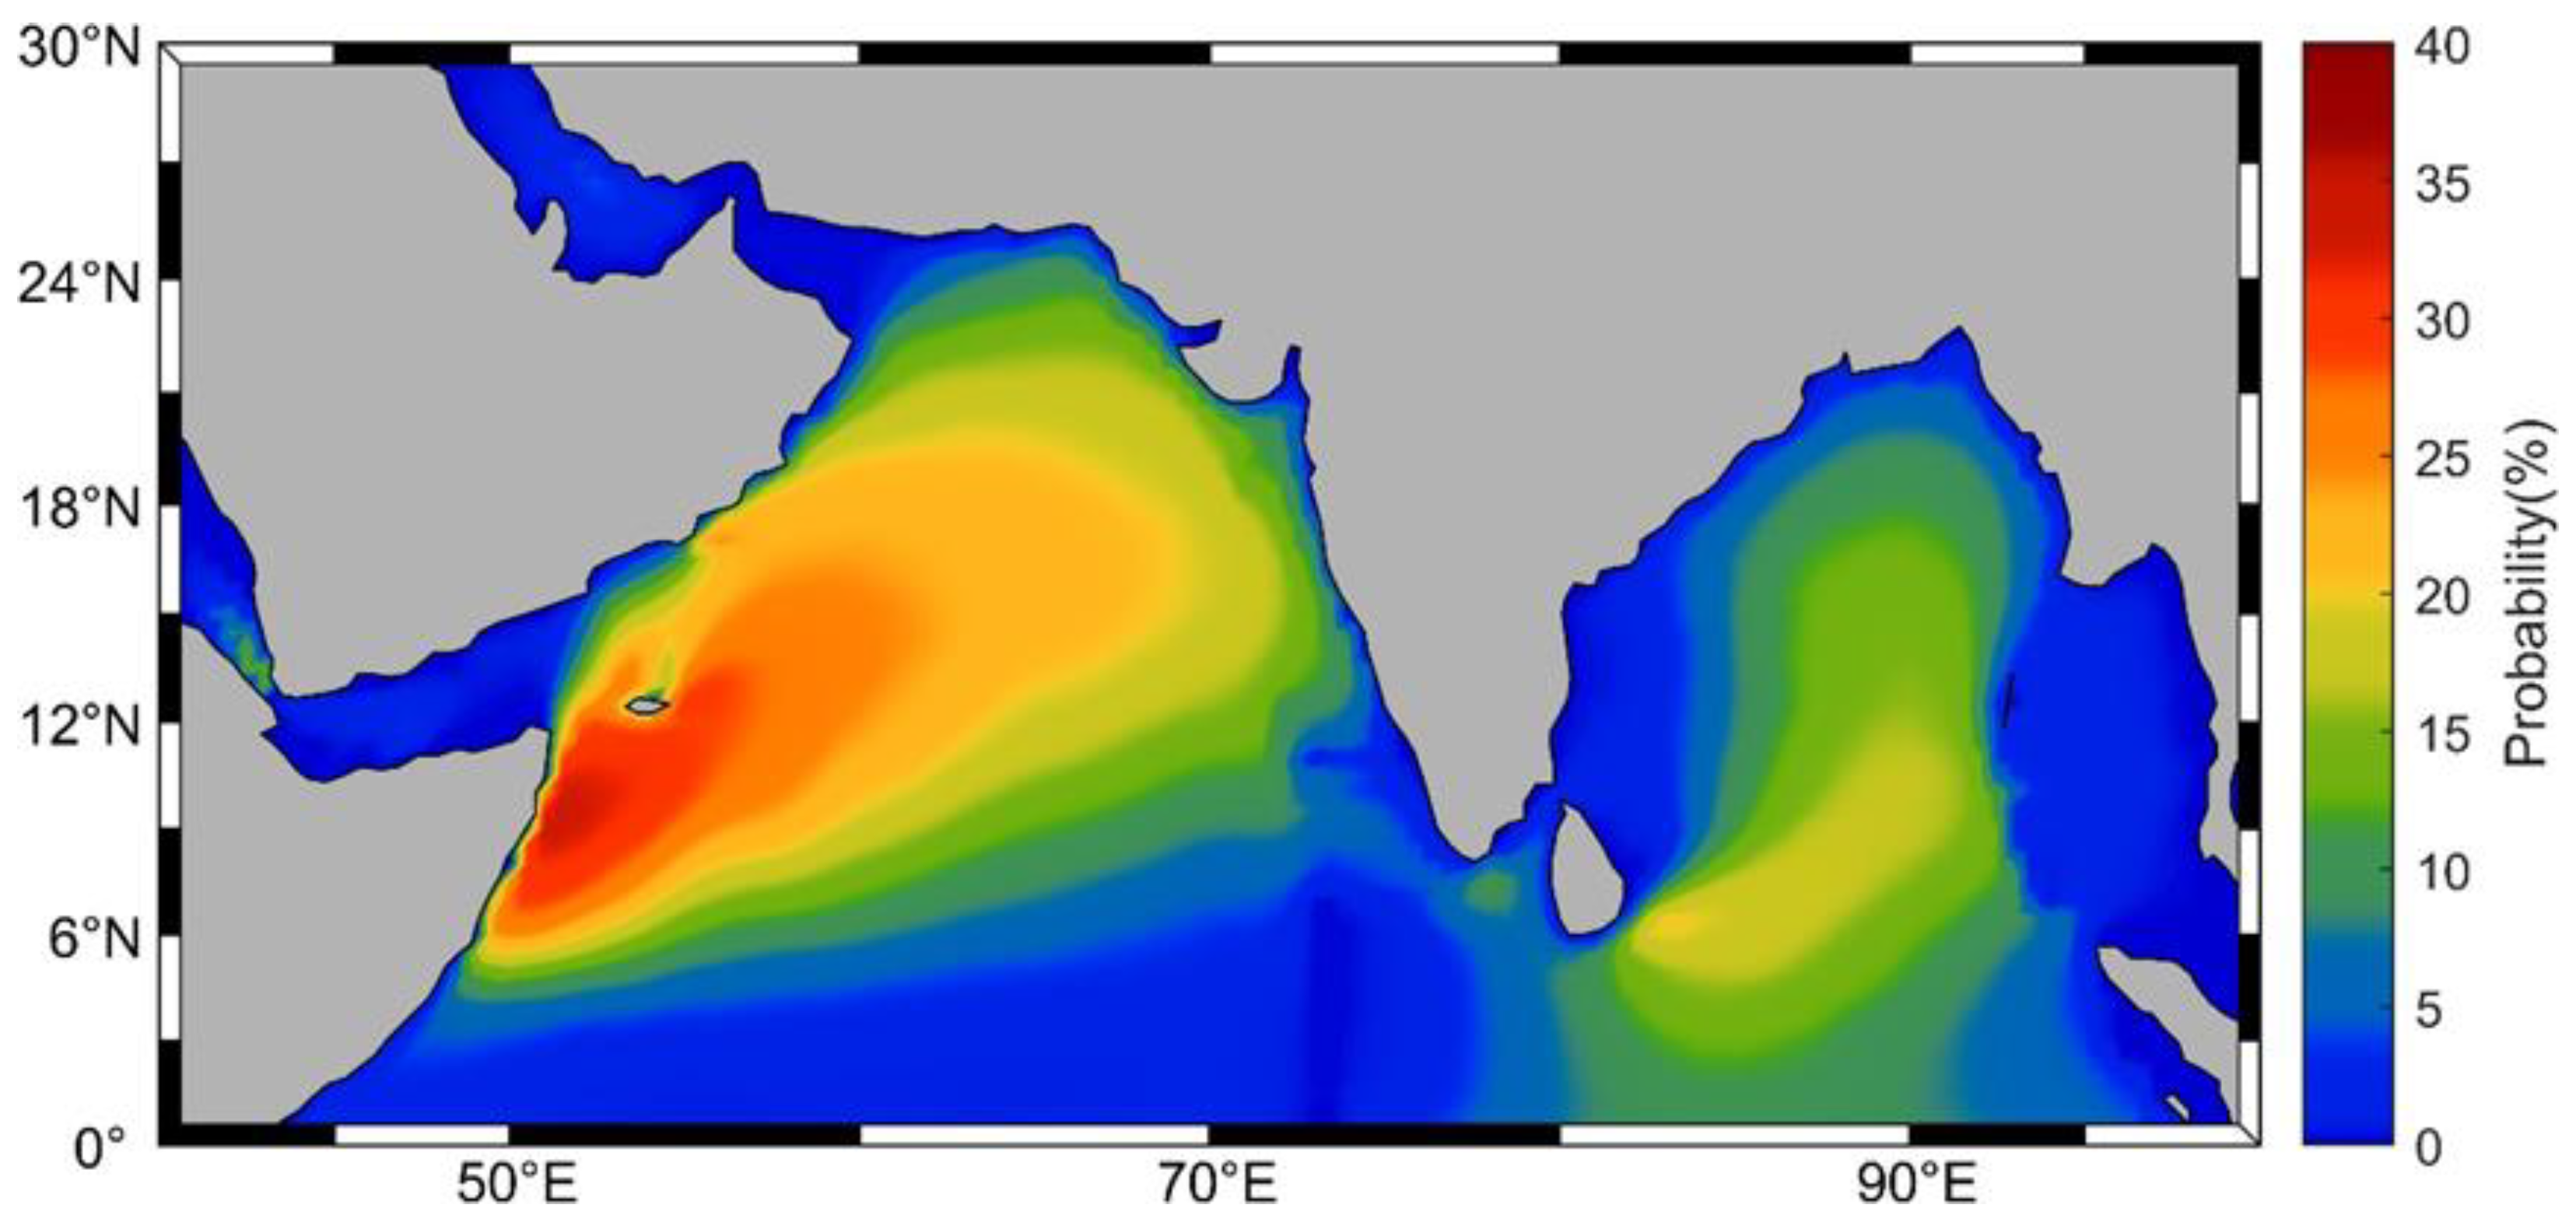
The occurrence probability of Strong Breeze and Large Wave Events (SBLWEs) was calculated at each grid point based on whether the wind or wave conditions exceeded the defined thresholds. The spatial distribution of this probability, derived from statistical analysis, is presented in Figure 7. The highest occurrence probabilities are found in the central and western Arabian Sea, particularly near the Horn of Africa, where it approaches 40%. This probability generally decreases towards the northeast. Notably, the probability is significantly lower northeast of Socotra Island compared to the surrounding areas, suggesting that the dominant winds or waves contributing to SBLWEs in this region originate from the southwest, consistent with the summer monsoon flow. In the Bay of Bengal, the peak occurrence probability is approximately 20%, primarily located east of Sri Lanka.
Figure 7.
Occurrence probability of SBLWEs (1980–2022).
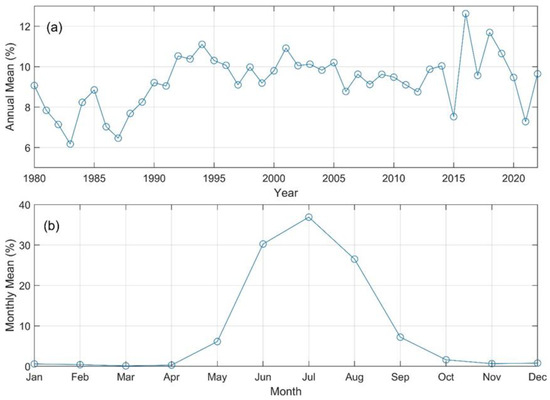
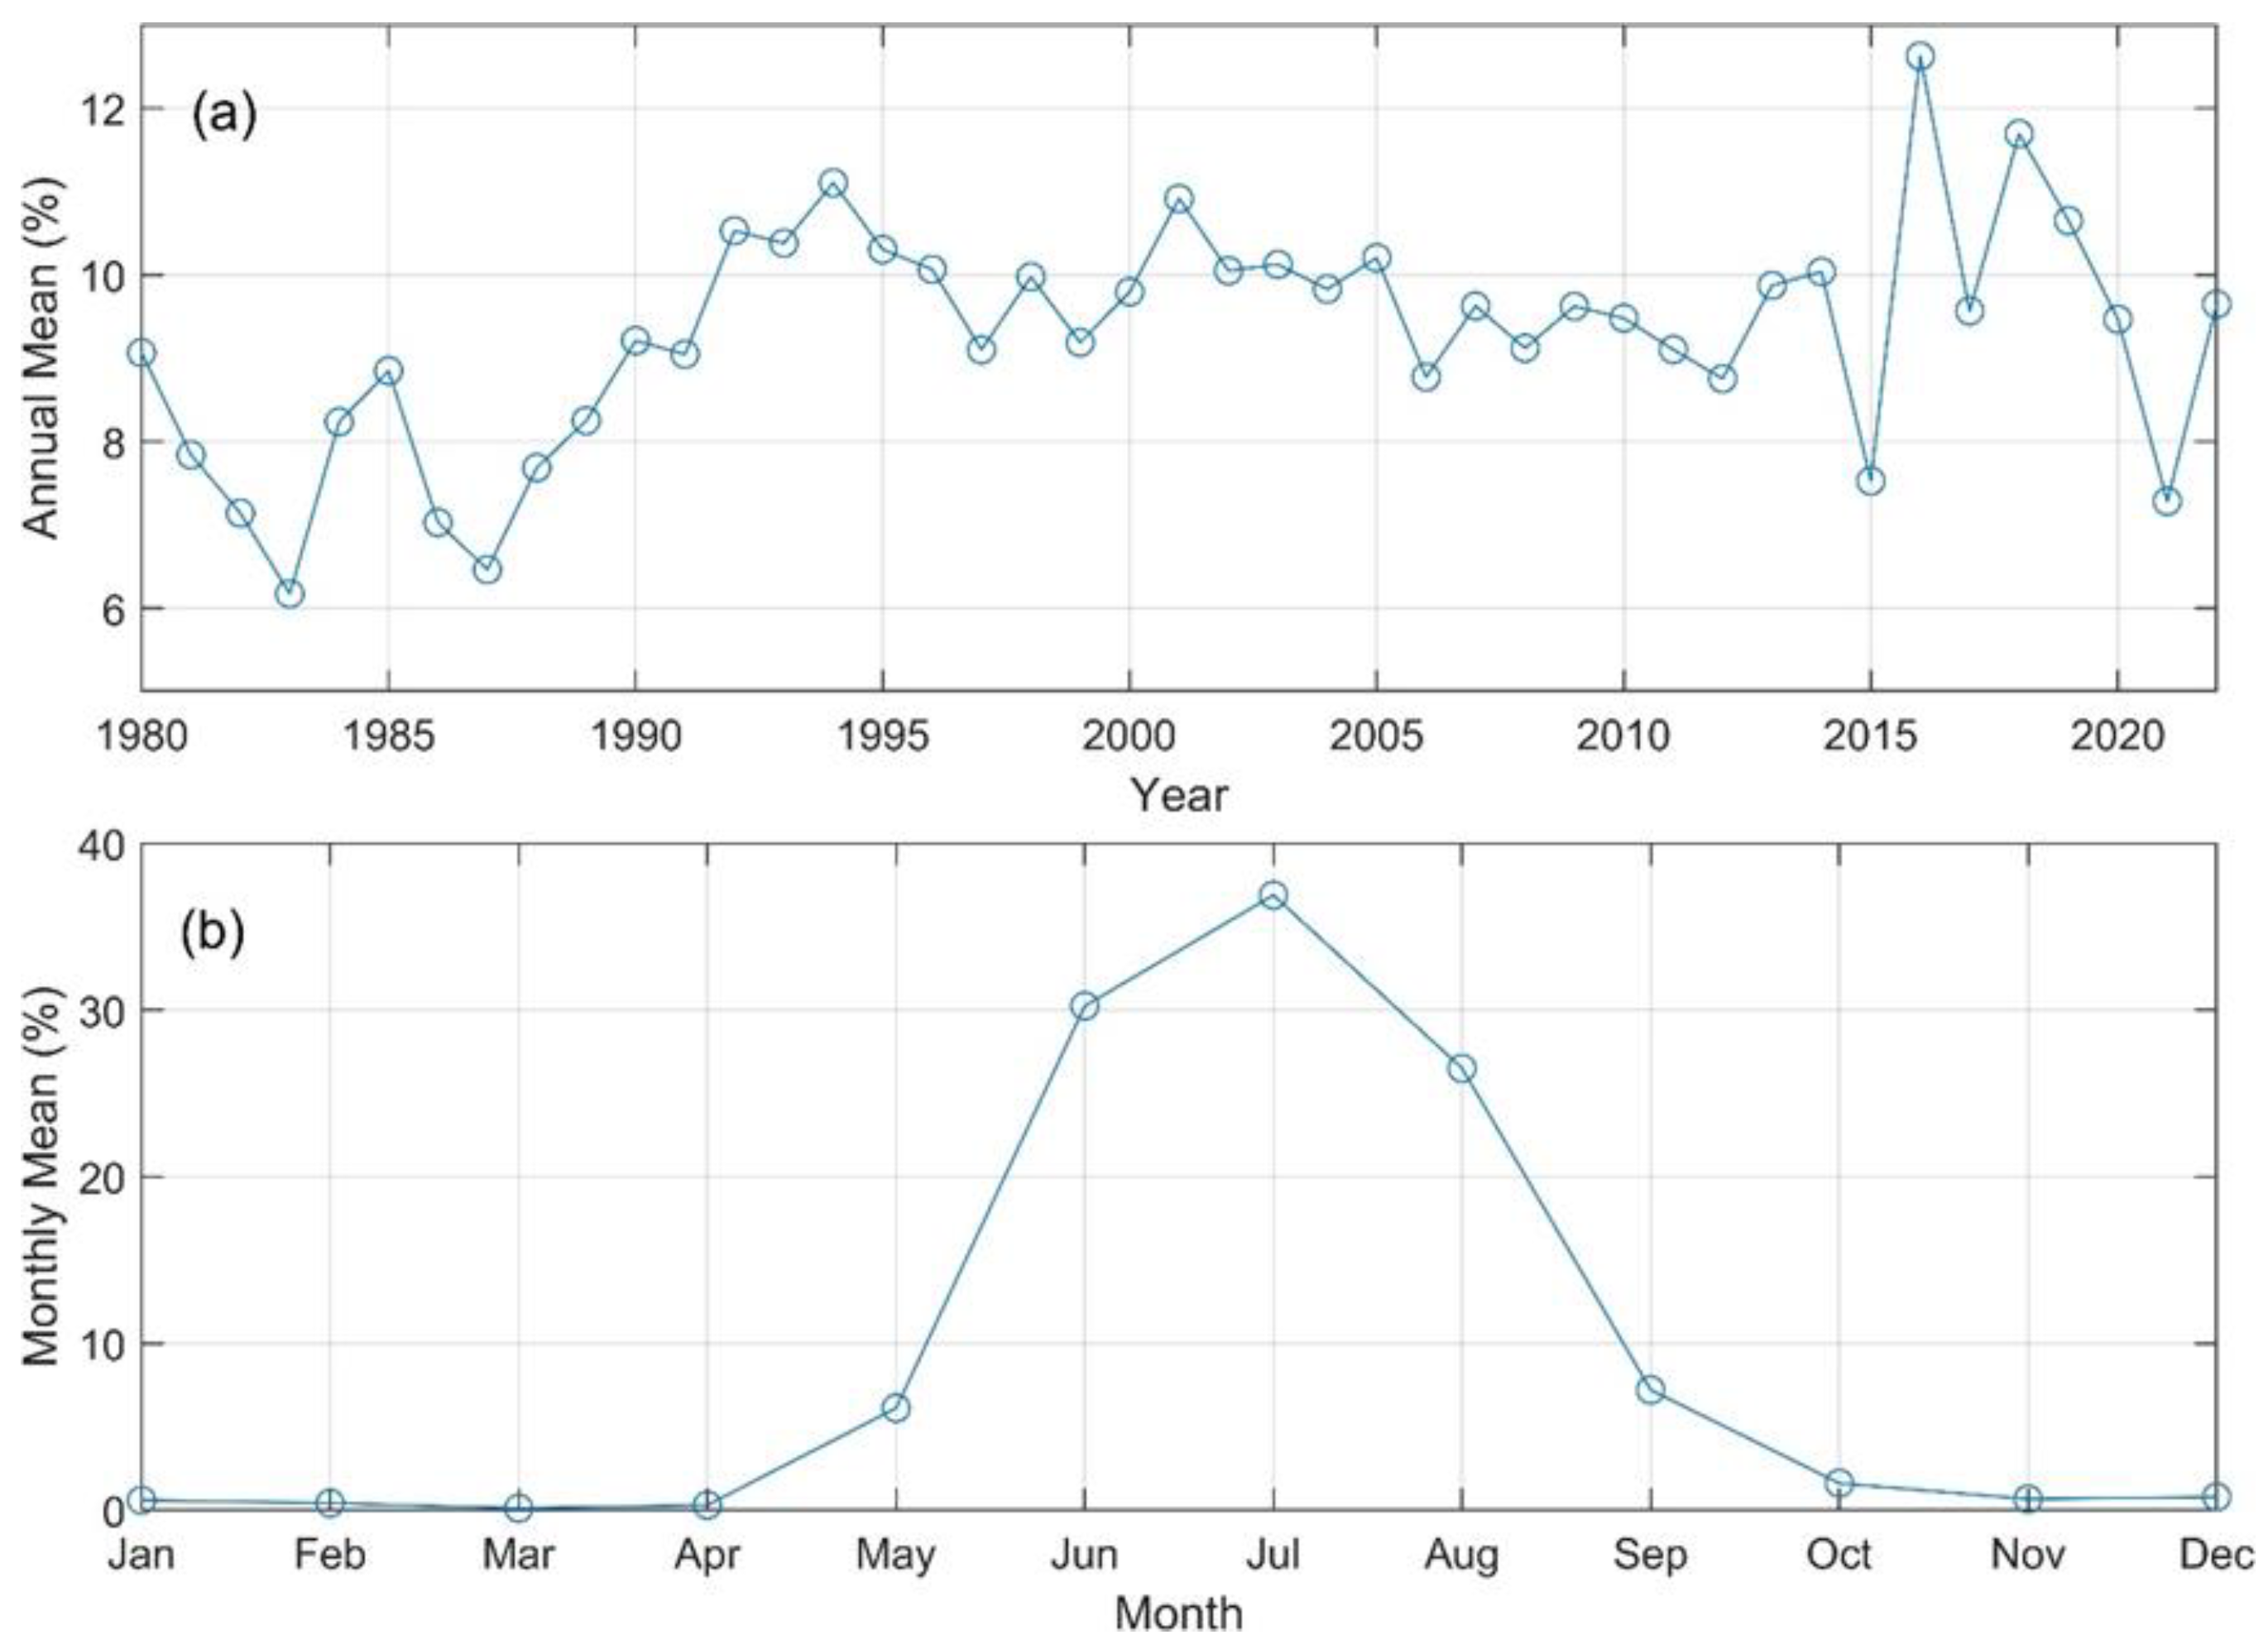
The total area affected by SBLWEs at each time step was determined by summing the areas of all grid points experiencing such conditions. By averaging these instantaneous values, the daily mean of the SBLWE-affected area can be computed for both annual and monthly time scales. To provide a clearer perspective, the affected area was expressed as a percentage of the total NIO sea surface area, of which interannual variability and monthly climatology patterns were analyzed and presented in Figure 8.
Figure 8.
Interannual variation (a) and monthly climatology (b) of the average area percentage affected by SBLWEs relative to the total NIO area.
Figure 8a captures the long-term climatological trend and significant interannual fluctuations of SBLWEs. On an interannual basis, the average annual percentage of the NIO affected by SBLWEs generally ranges between 7% and 11%. Notably, the historical minima (approximately 6%) occurred in 1983 and 1987; these dips may be closely associated with the dynamic suppression of the monsoon during strong El Niño events (see Section 4.1 for a detailed physical discussion).
In contrast, the monthly climatology (Figure 8b) identifies the critical operational windows for maritime safety. The results reveal a distinct seasonal cycle, with the affected area percentage increasing from January to July and peaking at approximately 38%. This pattern emphasizes that widespread SBLWE hazards occur predominantly during the summer monsoon season, specifically during June, July, and August, when the affected areas are substantially larger than in other months.
3.3.2. Annual Frequency of SBLWEs
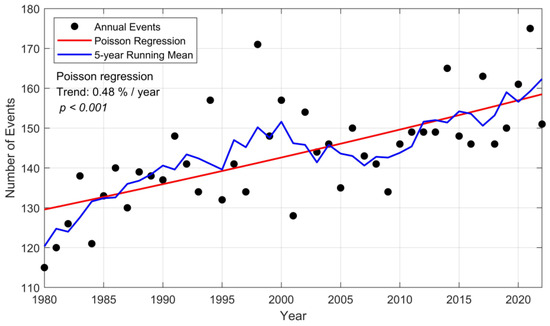
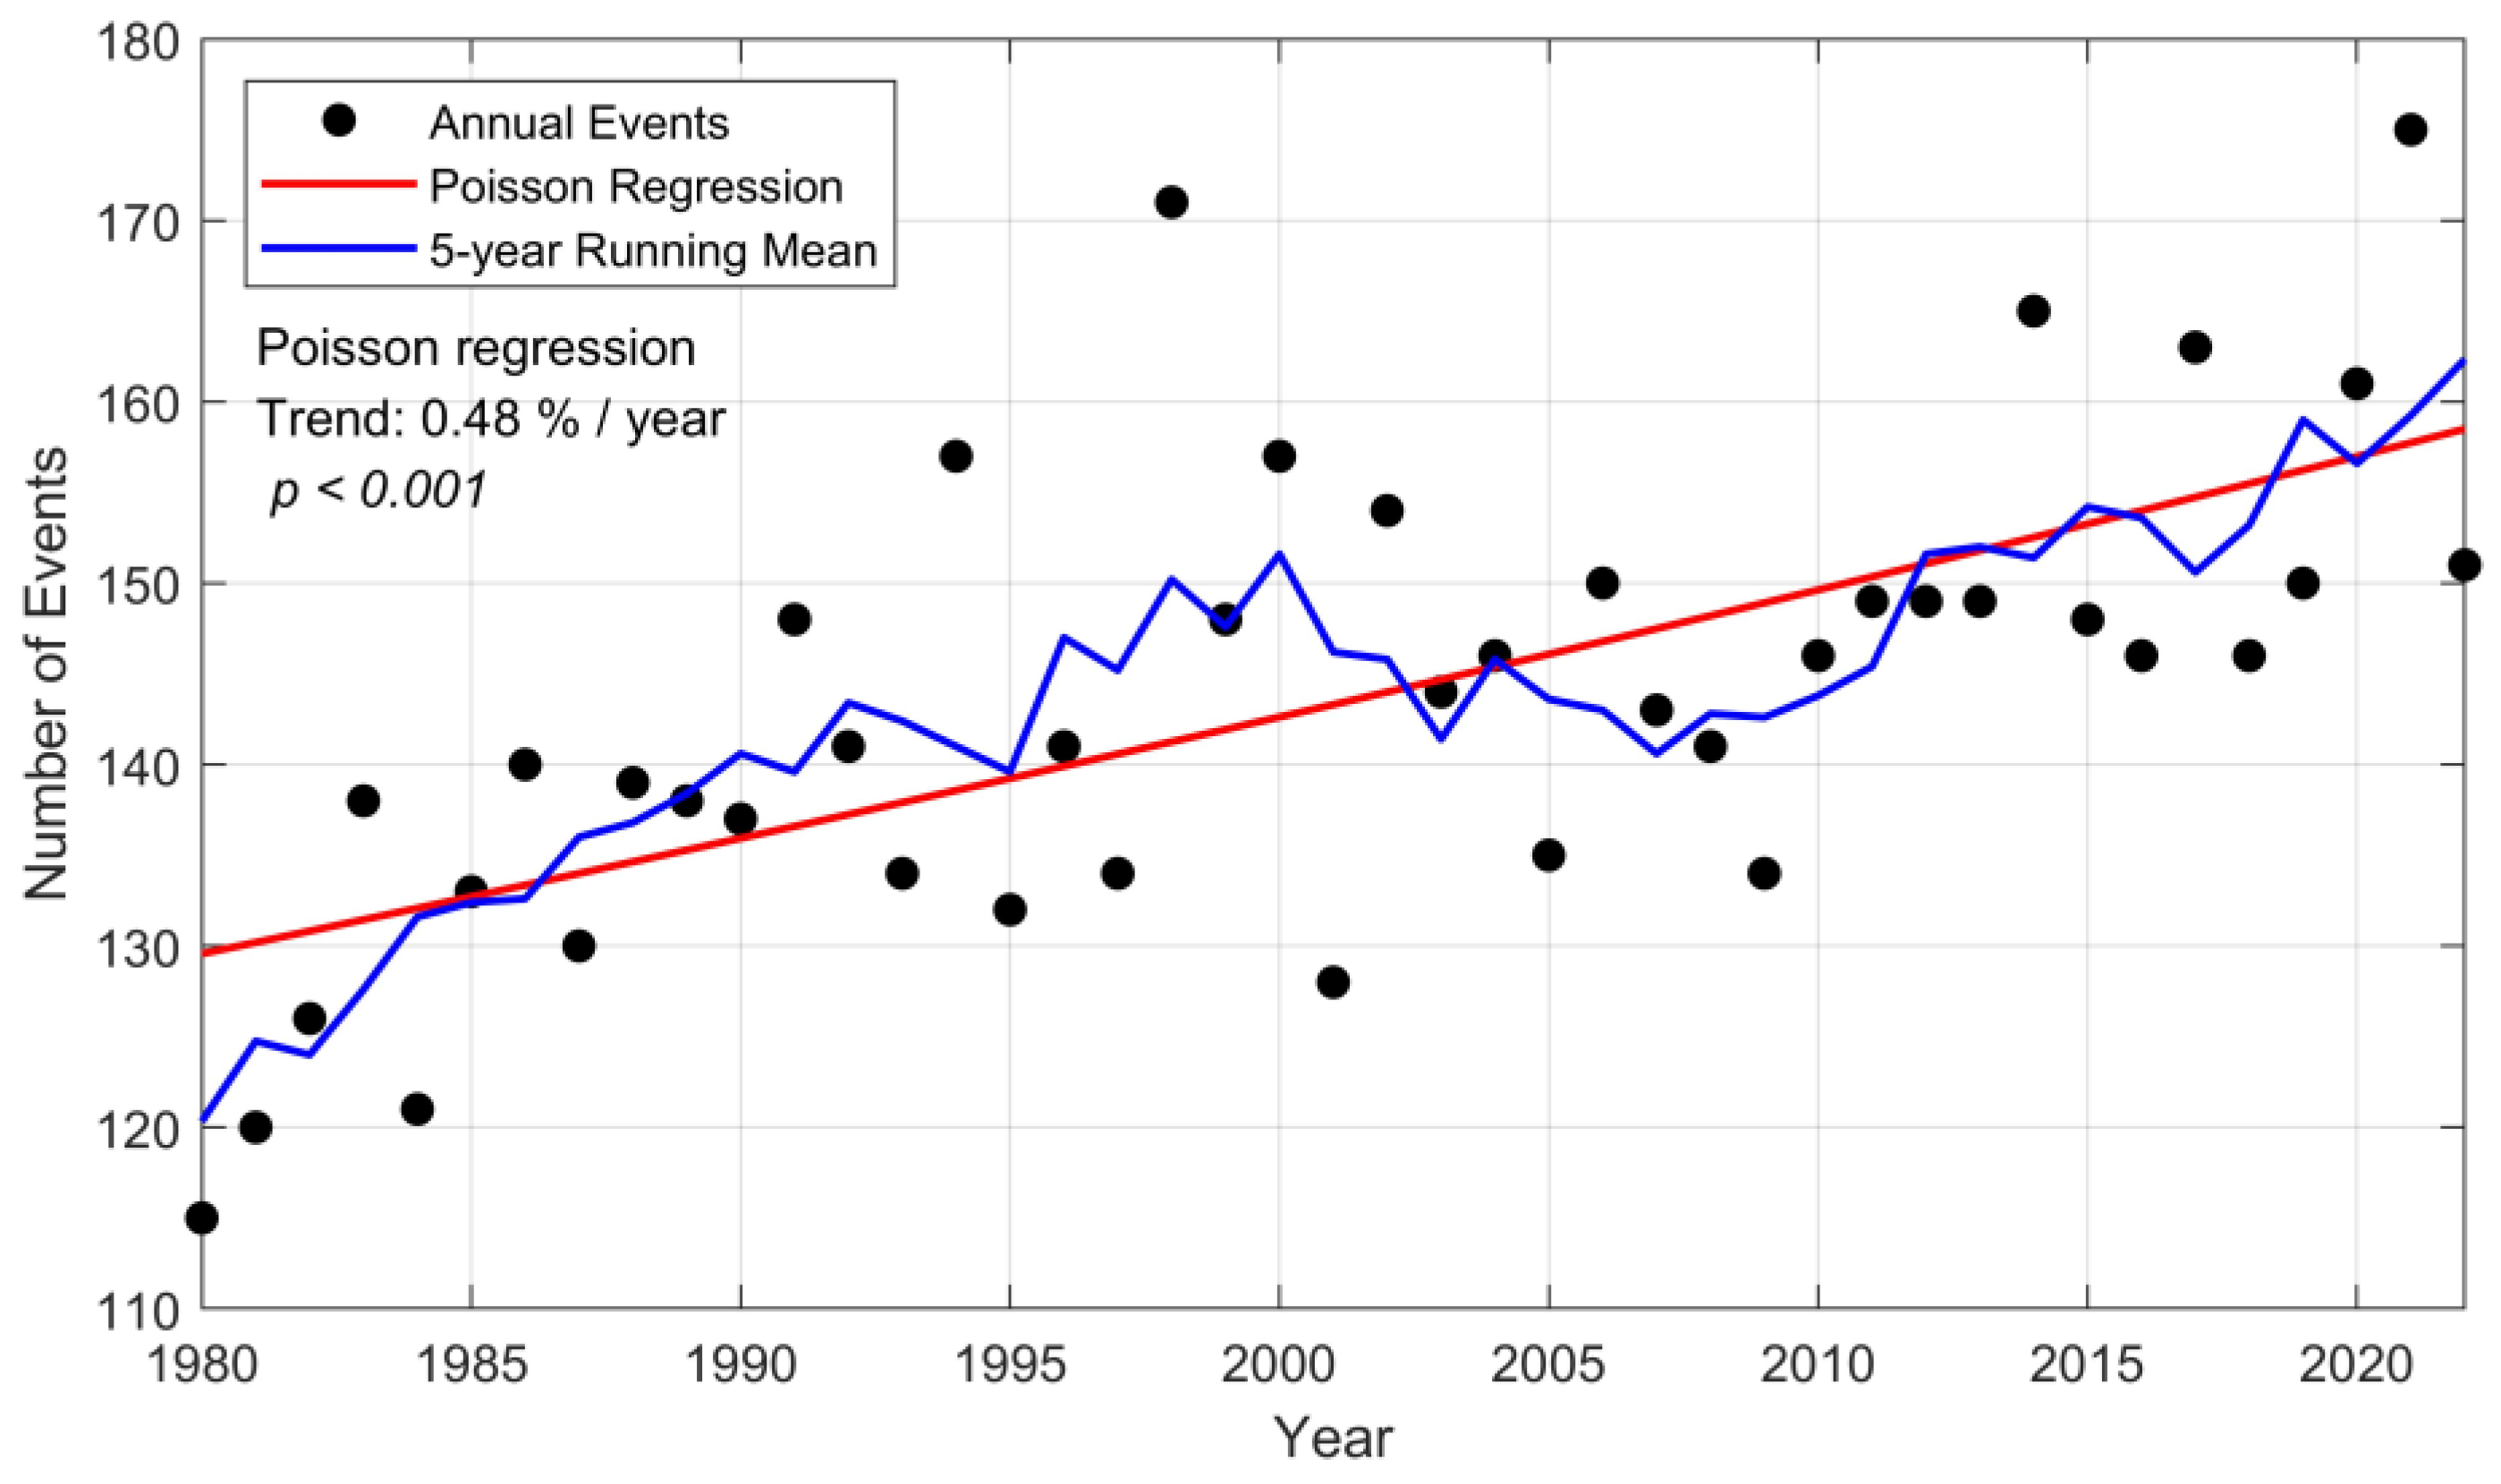
The annual number of SBLWEs was counted and is presented in Figure 9. The annual frequency typically falls between 130 and 160 events for most years within the study period. To quantitatively assess the long-term trend, a Poisson regression model was applied to the annual events. The results indicate a statistically significant increasing trend (p < 0.001), corresponding to an average growth rate of approximately 0.48% per year, which translates to an increase of about 0.7 events per year based on the mean annual frequency. While the growth rate is modest, the fitted Poisson trend exhibits a slight upward (exponential) curvature in the original scale, more accurately reflecting the accelerating nature of extreme events under global warming than a simple linear fit. A 5-year running mean is included to illustrate low-frequency variability, showing an initial increase, reaching a peak around 1998, followed by a decline to a minimum around 2009, and a subsequent rise thereafter. Notably, since 2010, the annual frequency has consistently remained at or above 145 events, with four years exceeding 160 events, whereas before 2010, only one year exceeded 160 events.
Figure 9.
Annual number of SBLWEs over the NIO during 1980–2022.
3.3.3. Intensity of SBLWEs
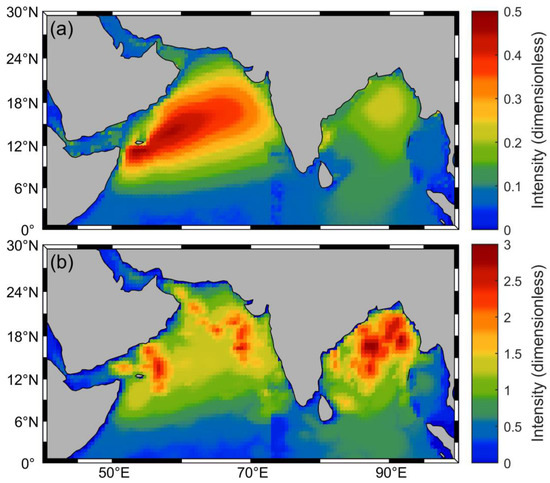
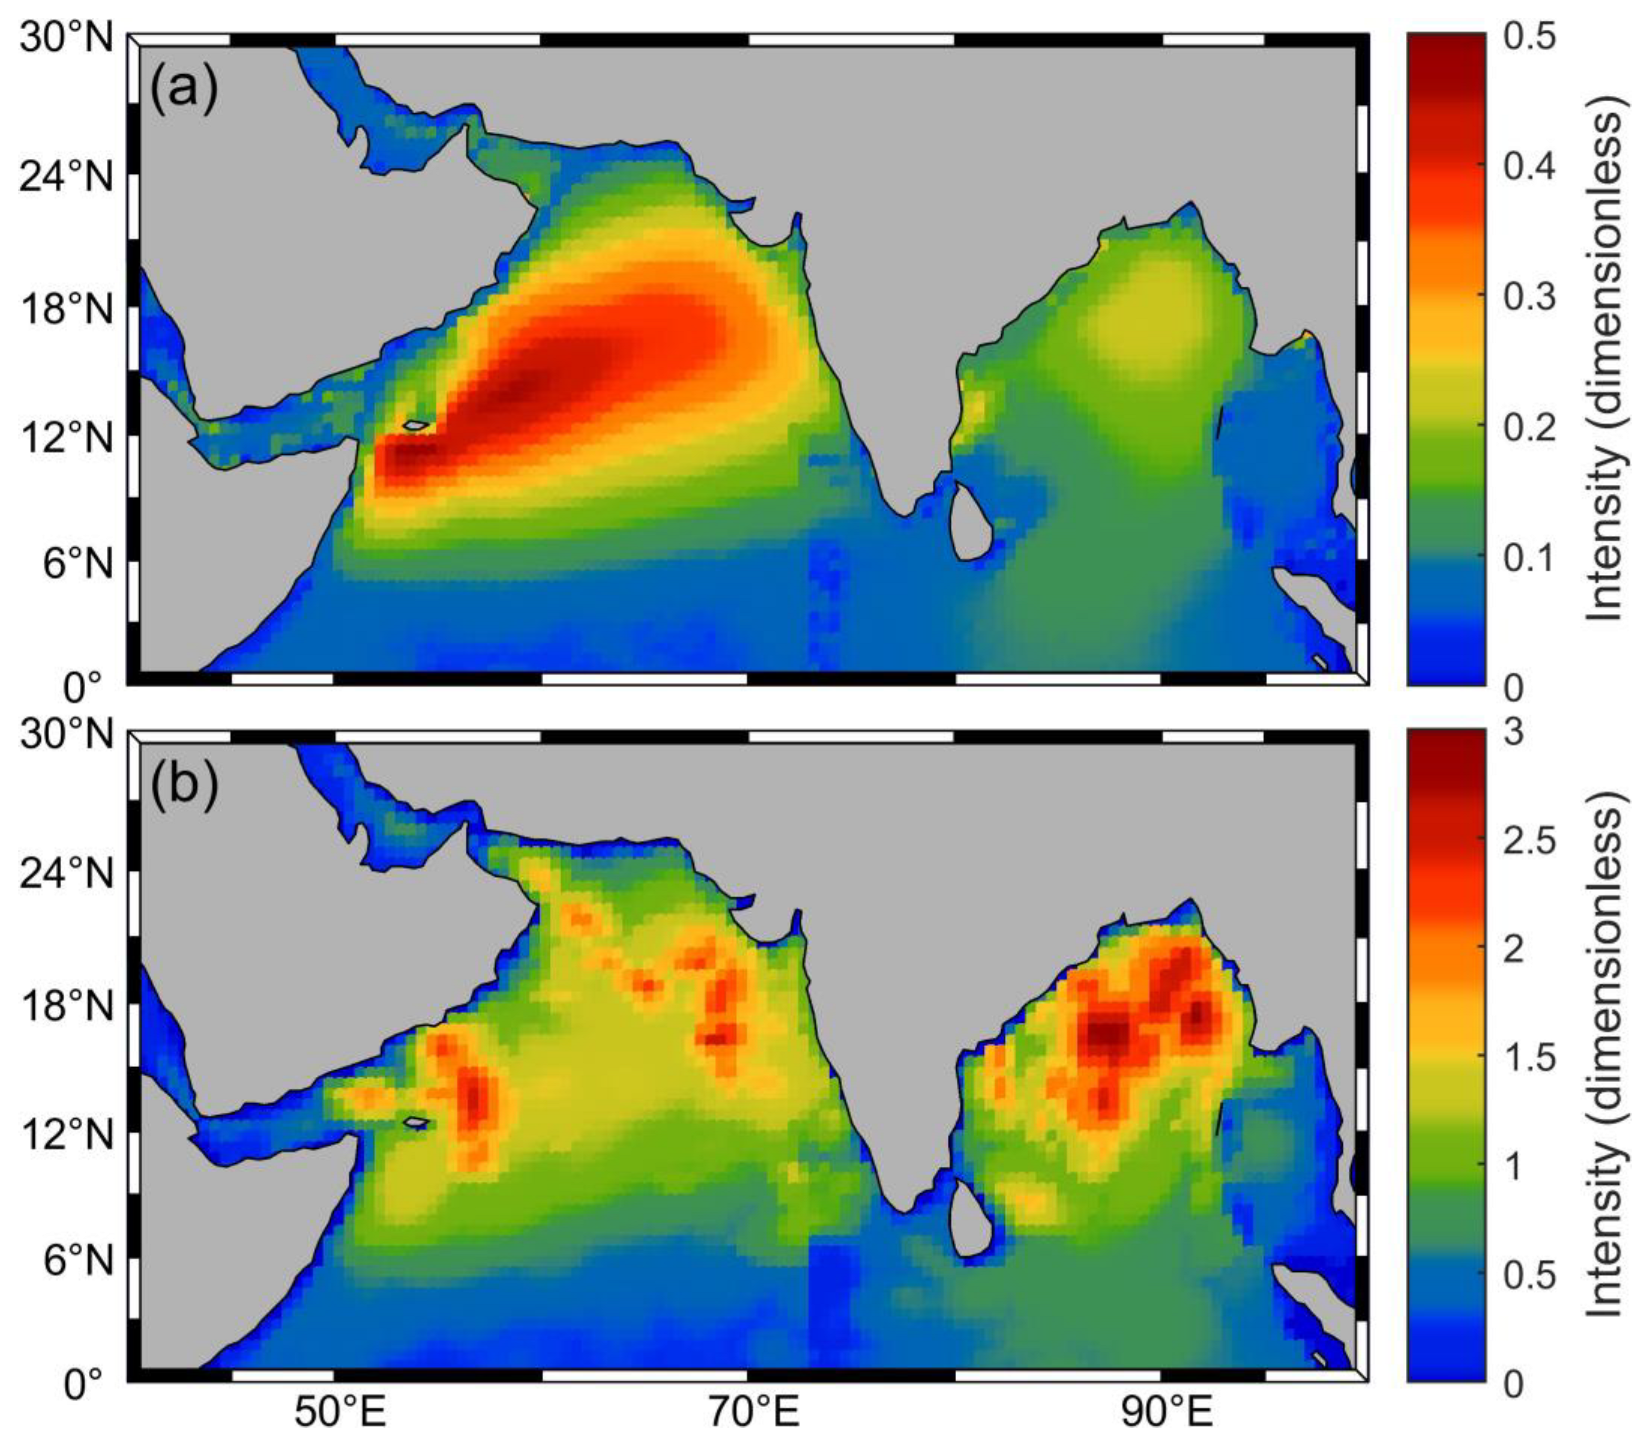
To more accurately assess SBLWEs, this section employs the previously defined intensity metric for quantitative analysis. Figure 10 illustrates the spatial distribution of the mean and maximum intensity of SBLWEs across 43 years in the NIO. The average intensity (Figure 10a) identifies consistent climatological hazard hotspots, whereas the maximum intensity (Figure 10b) captures the absolute historical survival limits (worst-case scenarios) essential for offshore engineering design. In terms of average intensity, the Arabian Sea shows significantly higher values than the Bay of Bengal. The overall distribution pattern resembles that of summer wind speed and wave height, likely influenced by the summer monsoon. Specifically, the peak average intensity in the Arabian Sea is just below 0.5, with high values mainly located in the central and western regions, aligning with areas of strong summer monsoon winds. In contrast, the highest average intensity in the Bay of Bengal is below 0.25, with high values concentrated in its northern part. For maximum intensity, high-value areas are mostly located north of 8° N and exhibit a patchy distribution, likely linked to localized tropical cyclones. The maximum intensity in the Arabian Sea is slightly lower than that in the Bay of Bengal. High-intensity zones are located east and north of Socotra Island and sporadically in the northeastern Arabian Sea, with peak values of about 2.5. In the Bay of Bengal, high-value areas are concentrated in the north, with the maximum intensity slightly below 3.
Figure 10.
Spatial distribution of average (a) and maximum (b) dimensionless intensity of SBLWEs.
4. Discussion
4.1. Physical Drivers of SBLWEs
To clarify the physical mechanisms controlling SBLWEs, we examine their relationships with thermal conditions and large-scale climate variability.
- (1)
- Long-term Thermodynamic Forcing
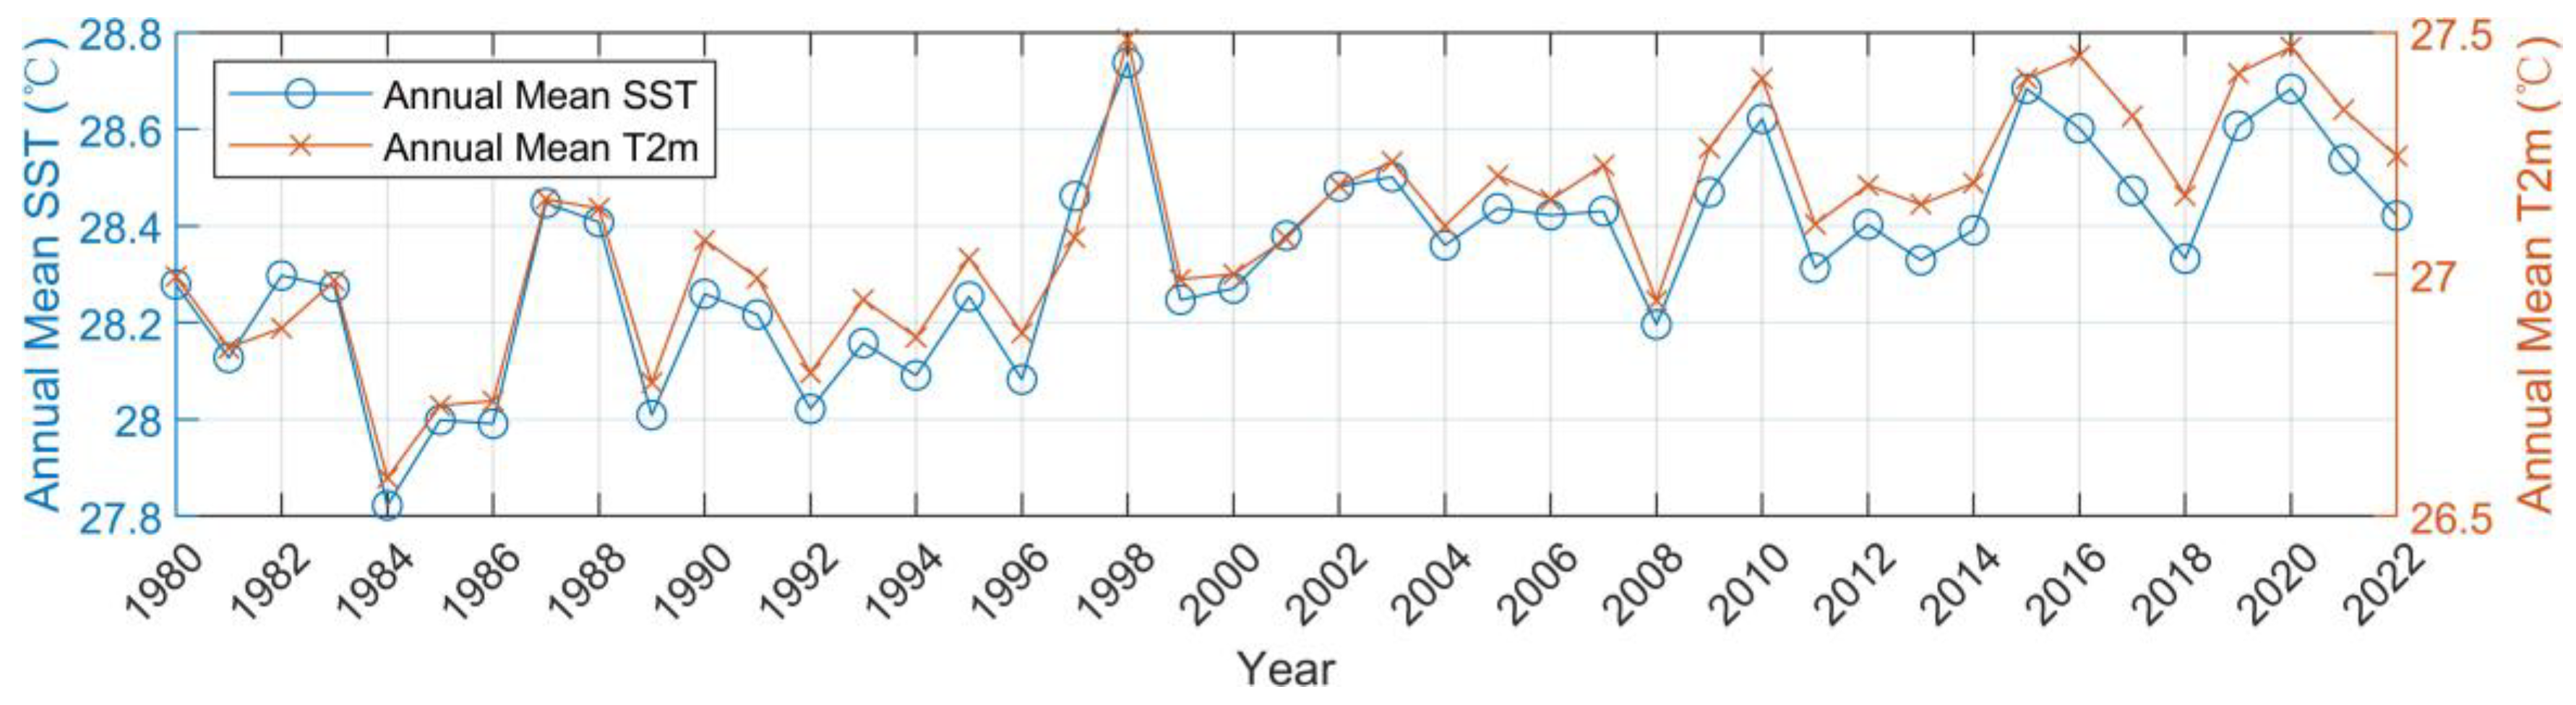
Between 1980 and 2022, the annual mean sea surface temperature (SST) and 2 m air temperature (T2m) over the North Indian Ocean exhibit a persistent warming trend (Figure 11). A statistically significant positive correlation is found between SST and the annual frequency of SBLWEs (R = 0.486, p < 0.001), indicating that warmer oceanic conditions favor more frequent SBLWEs.
Figure 11.
Mean SST and T2m over the NIO (1980–2022).
Ocean warming enhances air–sea heat fluxes and supports stronger wind–wave coupling under monsoon-driven and synoptic-scale atmospheric conditions, thereby increasing the likelihood that events exceed the fixed SBLWE thresholds.
In addition, the rise in SST under global warming increases the potential intensity of tropical cyclones [31]. Although tropical cyclones contribute only a fraction of total SBLWEs, they dominate the most extreme tail of the distribution. Their enhanced intensity leads to stronger extreme winds and wave heights, which further contribute to the observed increase in SBLWE frequency.
- (2)
- Interannual Dynamic Modulation
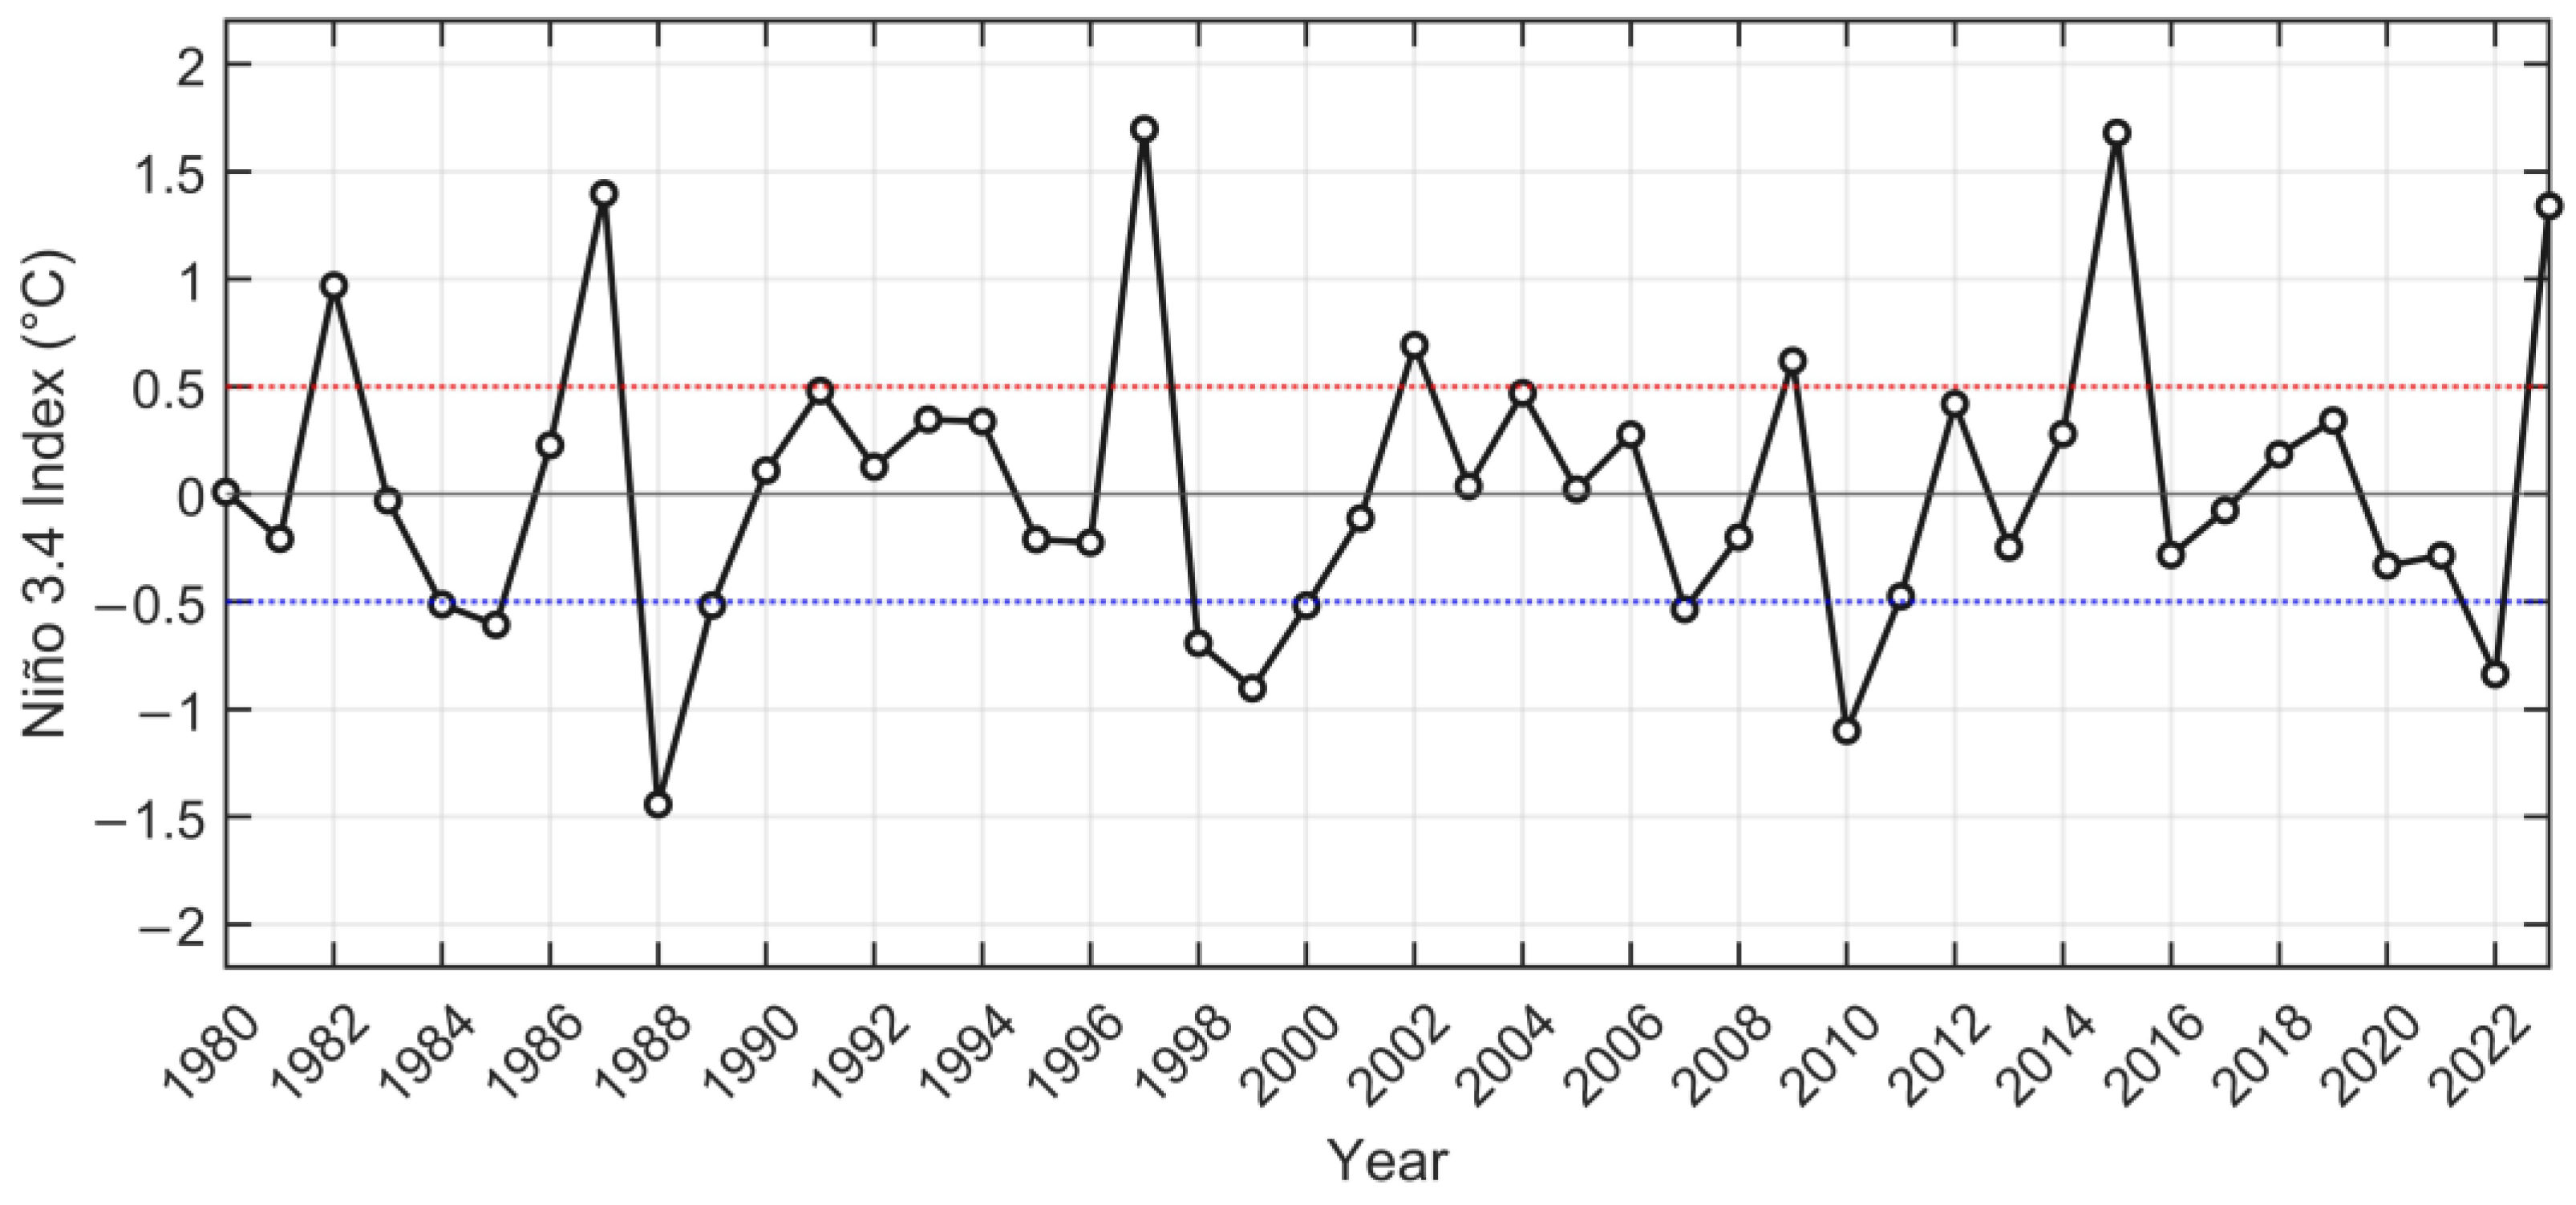
In contrast, the annual affected area of SBLWEs shows only a weak correlation with SST (R = 0.15), indicating limited sensitivity to long-term thermodynamic forcing. Instead, pronounced reductions in affected area occur during strong El Niño years (e.g., 1983, 1987, and 2015), consistent with the JJAS-mean Niño 3.4 index (Figure 12).
Figure 12.
JJAS (June–September) mean Niño 3.4 index during 1980–2022. The dotted lines indicate the ±0.5 °C thresholds used to identify El Niño and La Niña events.
Strong El Niño events induce anomalous Walker circulation that weakens the Indian Summer Monsoon, suppressing the large-scale coherence and persistence of wind–wave fields. As a result, although SBLWEs may still occur frequently under a warm background state, their spatial extent is substantially reduced during El Niño years.
Overall, global warming acts to increase the frequency of joint wind–wave extremes, whereas interannual climate variability primarily modulates their spatial extent. This scale-dependent response highlights the importance of jointly considering event frequency and spatial coverage when assessing wind–wave hazards in the North Indian Ocean.
4.2. Influence of Tropical Cyclones on SBLWEs
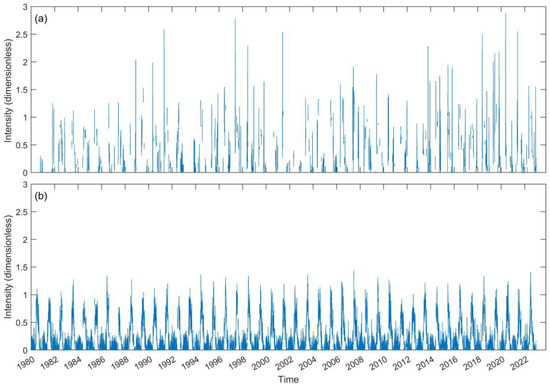
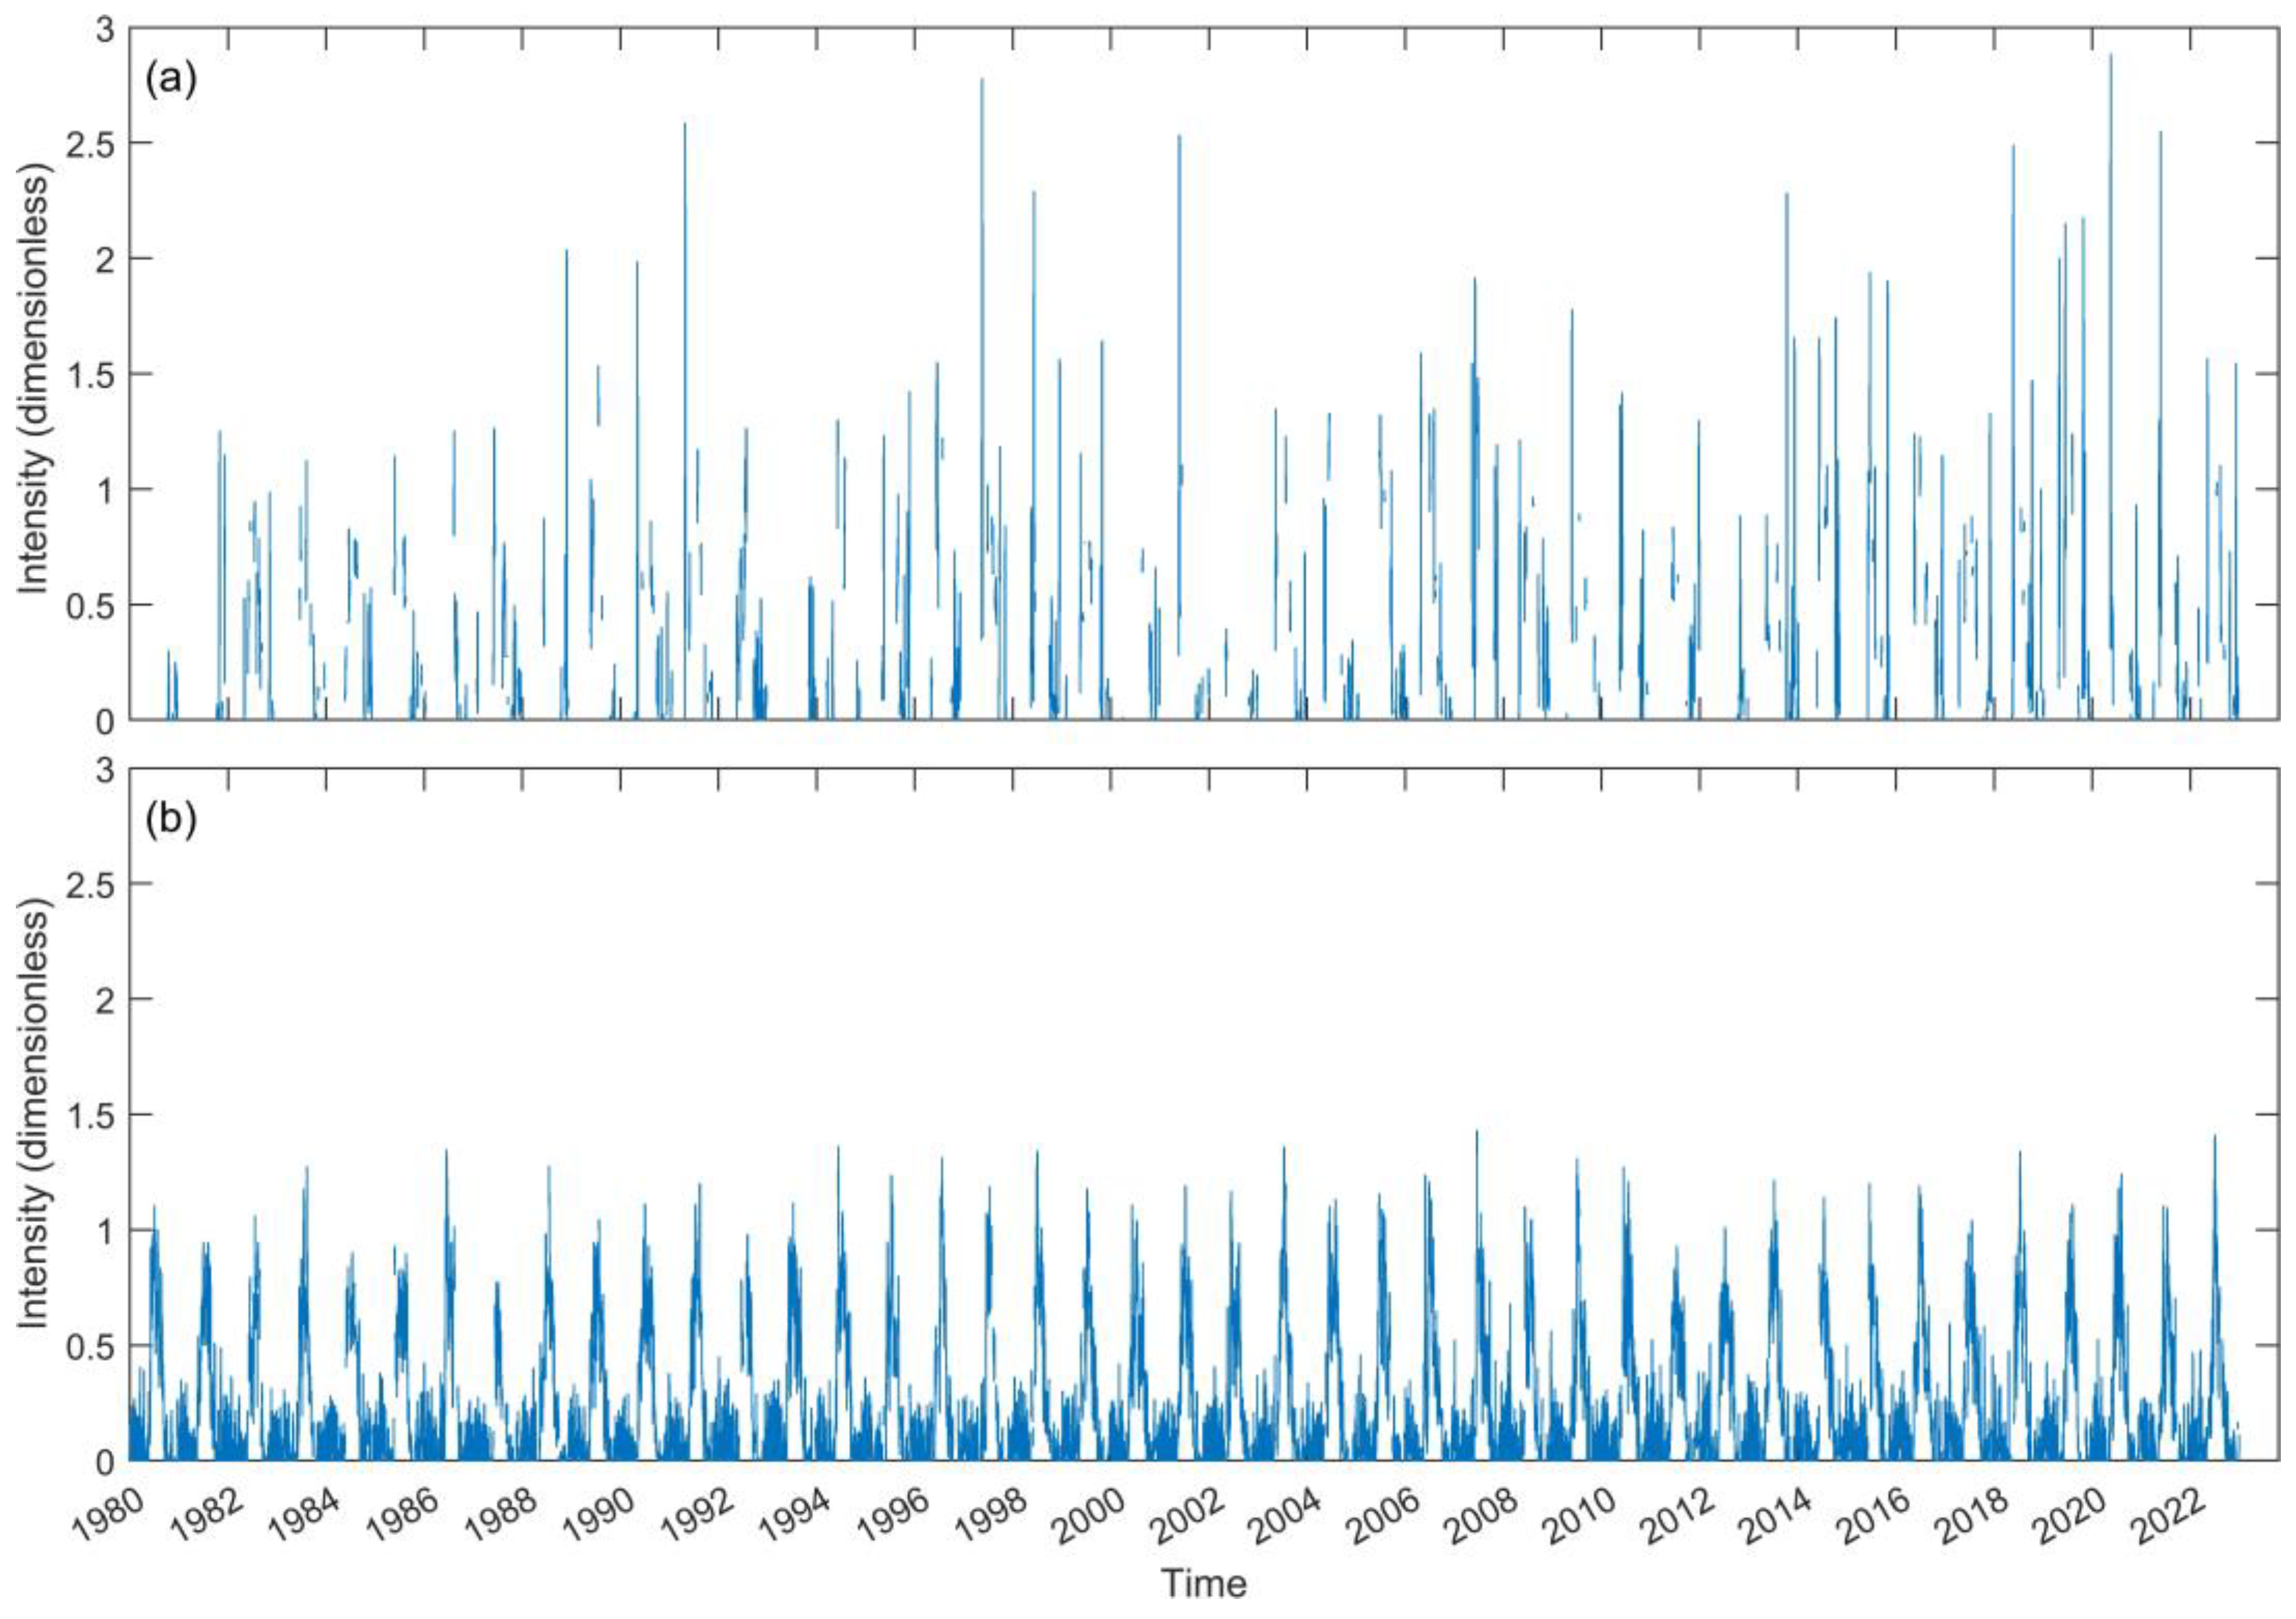
In NIO, there is a significant positive correlation between tropical cyclones and extreme SWH and wind speed [8]. To better understand the impact of tropical cyclones on SBLWEs, best track data from IBTrACS were used to extract the periods with and without cyclone activity. The daily maximum intensity of wind and waves within the study area was calculated, respectively, for cyclone and non-cyclone periods, as shown in Figure 13. Figure 13 presents the daily maximum intensity during cyclone periods (Figure 13a) and non-cyclone periods (Figure 13b) from 1980 to 2022.
Figure 13.
Daily maximum intensity of SBLWEs during cyclone (a) and non-cyclone (b) periods.
During tropical cyclone periods, the intensity of SBLWEs is significantly enhanced, and events with intensity above 1.5 only happen during cyclone periods. This phenomenon indicates that tropical cyclones are the primary driver of extreme SBLWEs. Due to the relatively short duration of tropical cyclones, their pronounced impact on SBLWEs is not easily discernible in the statistics of average intensity. For non-cyclone periods, the variation in SBLWE intensity follows a more regular pattern, aligning with the seasonal changes in the summer and winter monsoons. This suggests that in the absence of cyclones, the intensity of SBLWEs is mainly influenced by seasonal climatic variations. Each year during the summer monsoon, the maximum SBLWE intensity usually exceeds 0.5 and often surpasses 1, while during the winter monsoon, it remains below 0.5.
4.3. Influence of Monsoons on SBLWEs
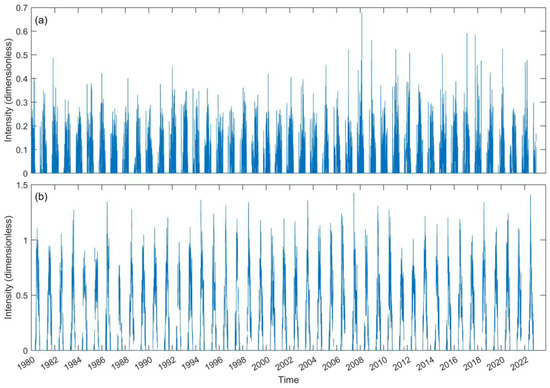
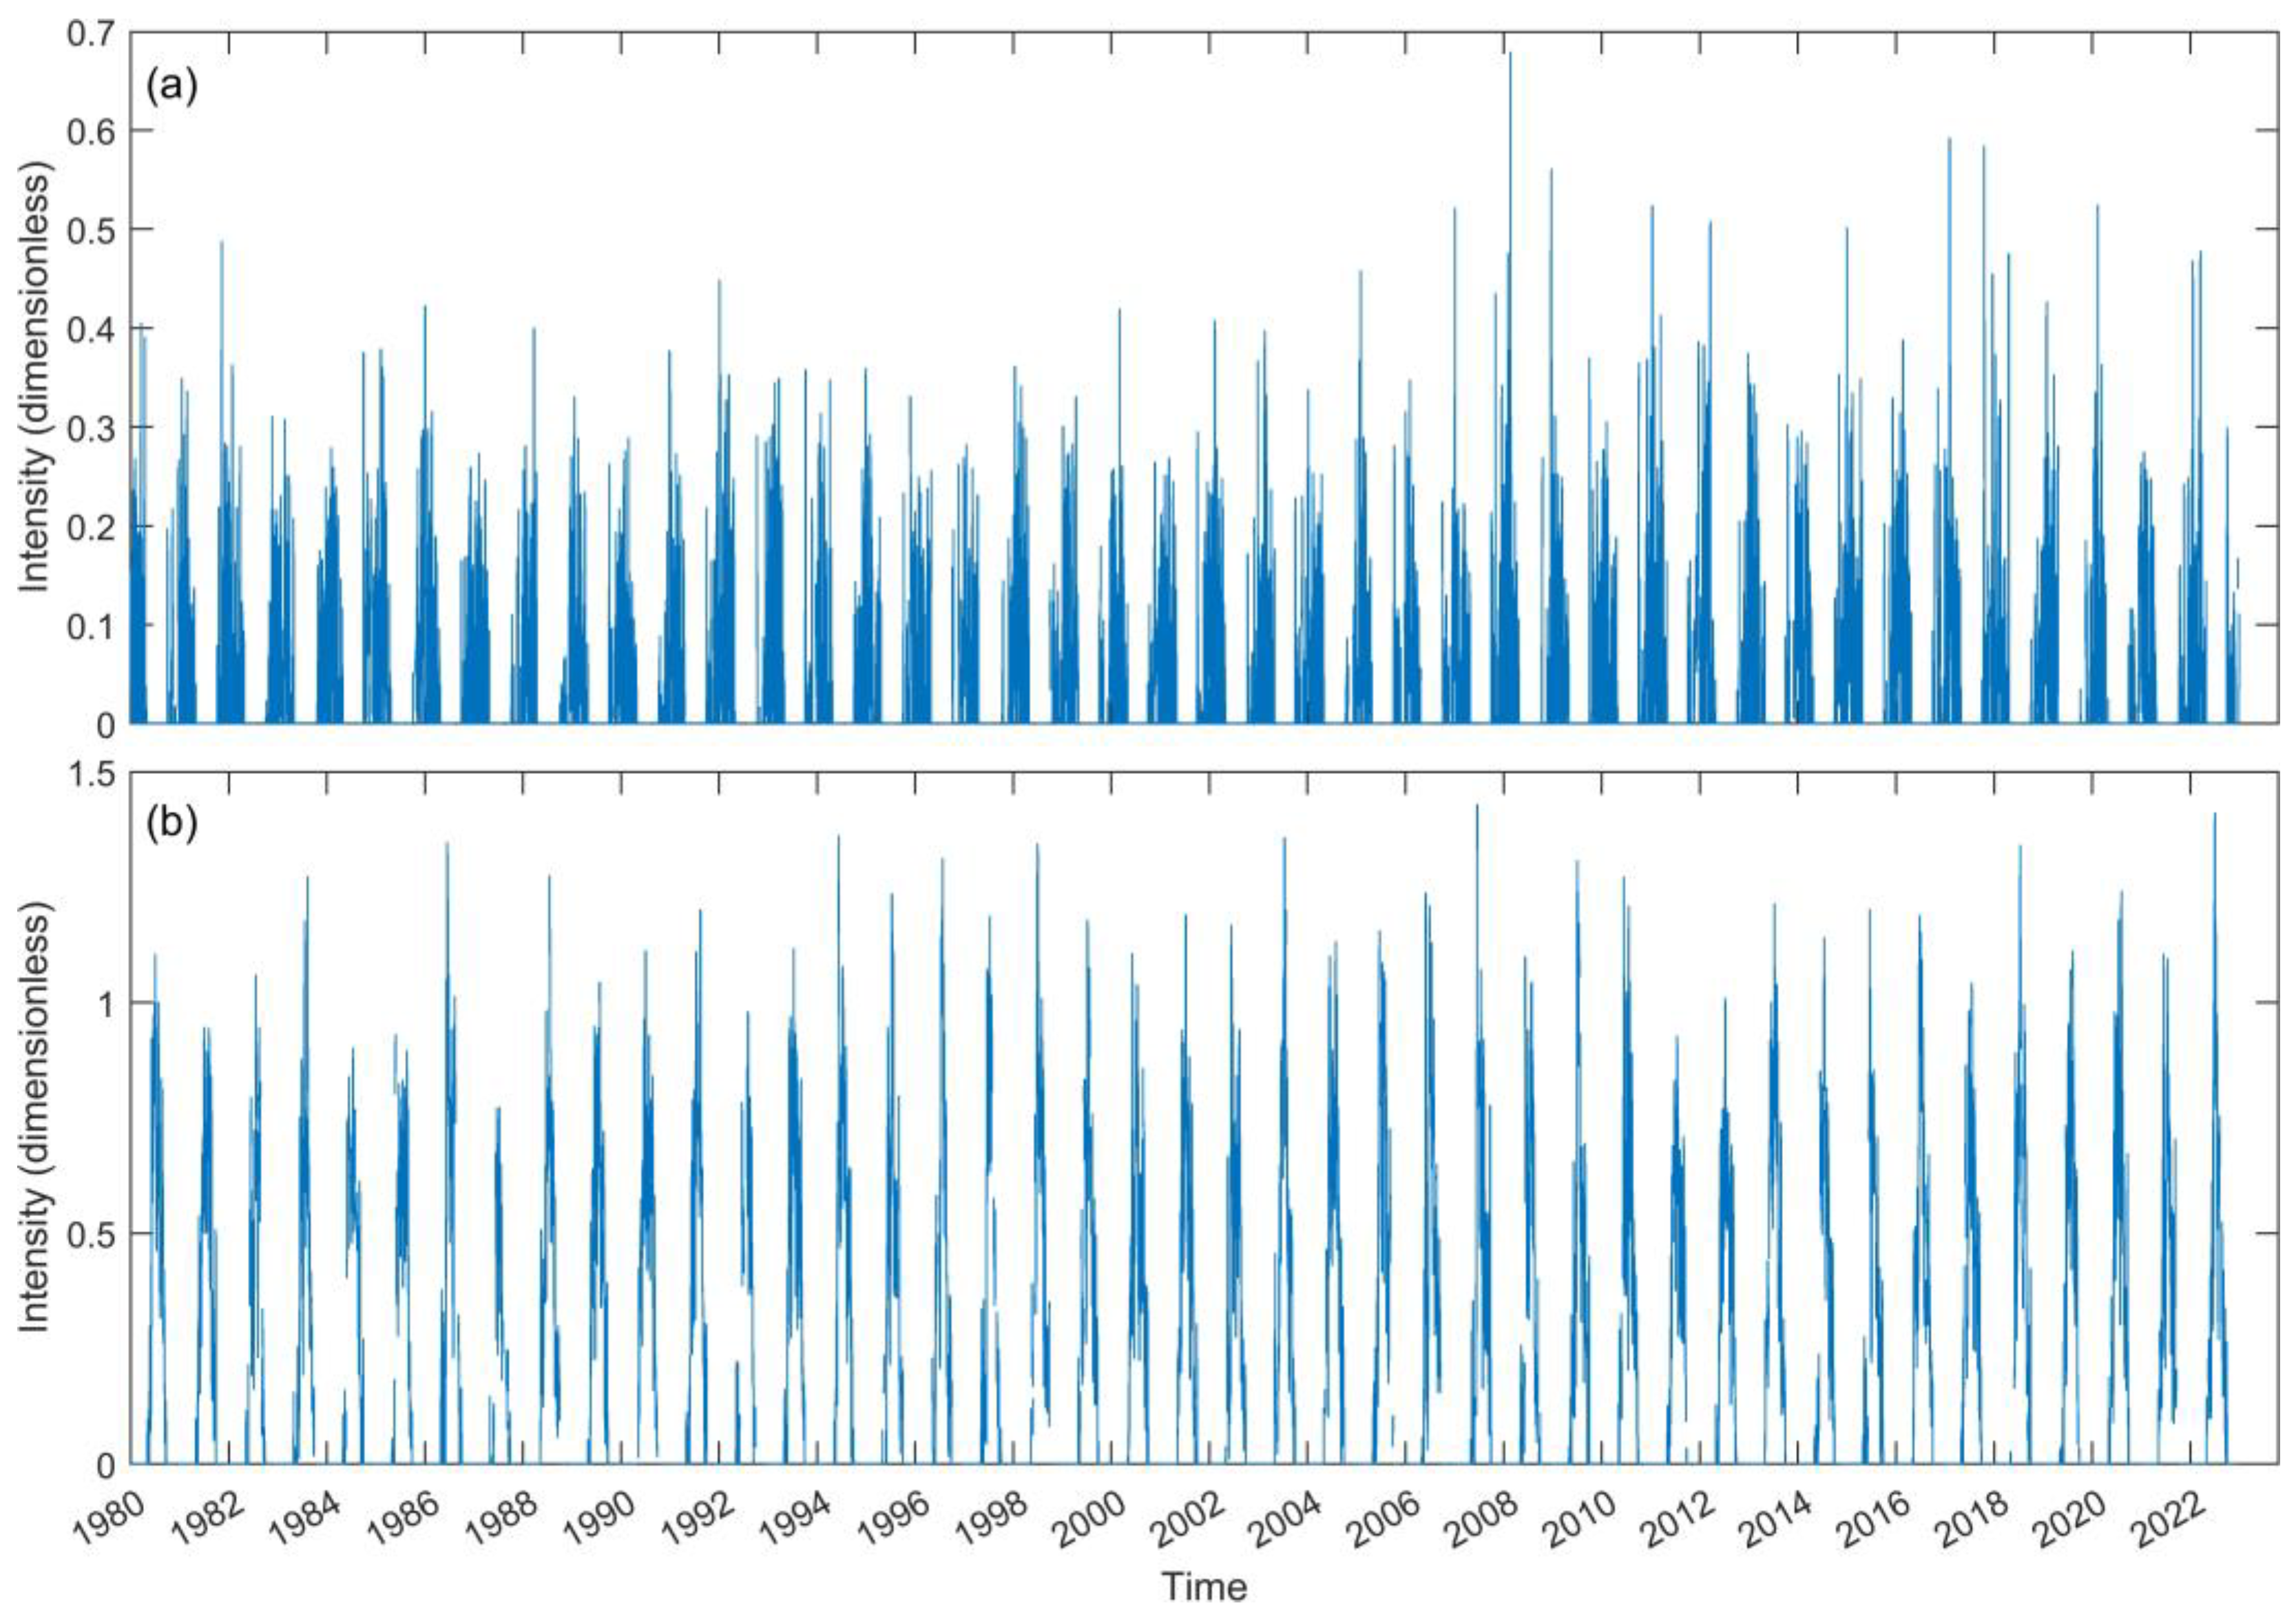
The monsoon is one of the dominant climate systems affecting the NIO, with distinct impacts from the winter and summer monsoons. Therefore, it is necessary to further divide the intensity time series during non-cyclone periods based on monsoon seasons. In NIO, the winter monsoon typically occurs from October to April, while the summer monsoon spans from May to September. Accordingly, the time series was separated by monsoon season, as shown in Figure 14. The intensity of SBLWEs during the winter monsoon remains below 0.7, with most values staying under 0.4 and occasional peaks rarely exceeding 0.5. In contrast, the intensity during the summer monsoon is significantly higher, with the maximum intensity exceeding 1 in most years.
Figure 14.
Daily maximum intensity during the winter (a) and the summer (b) monsoon.
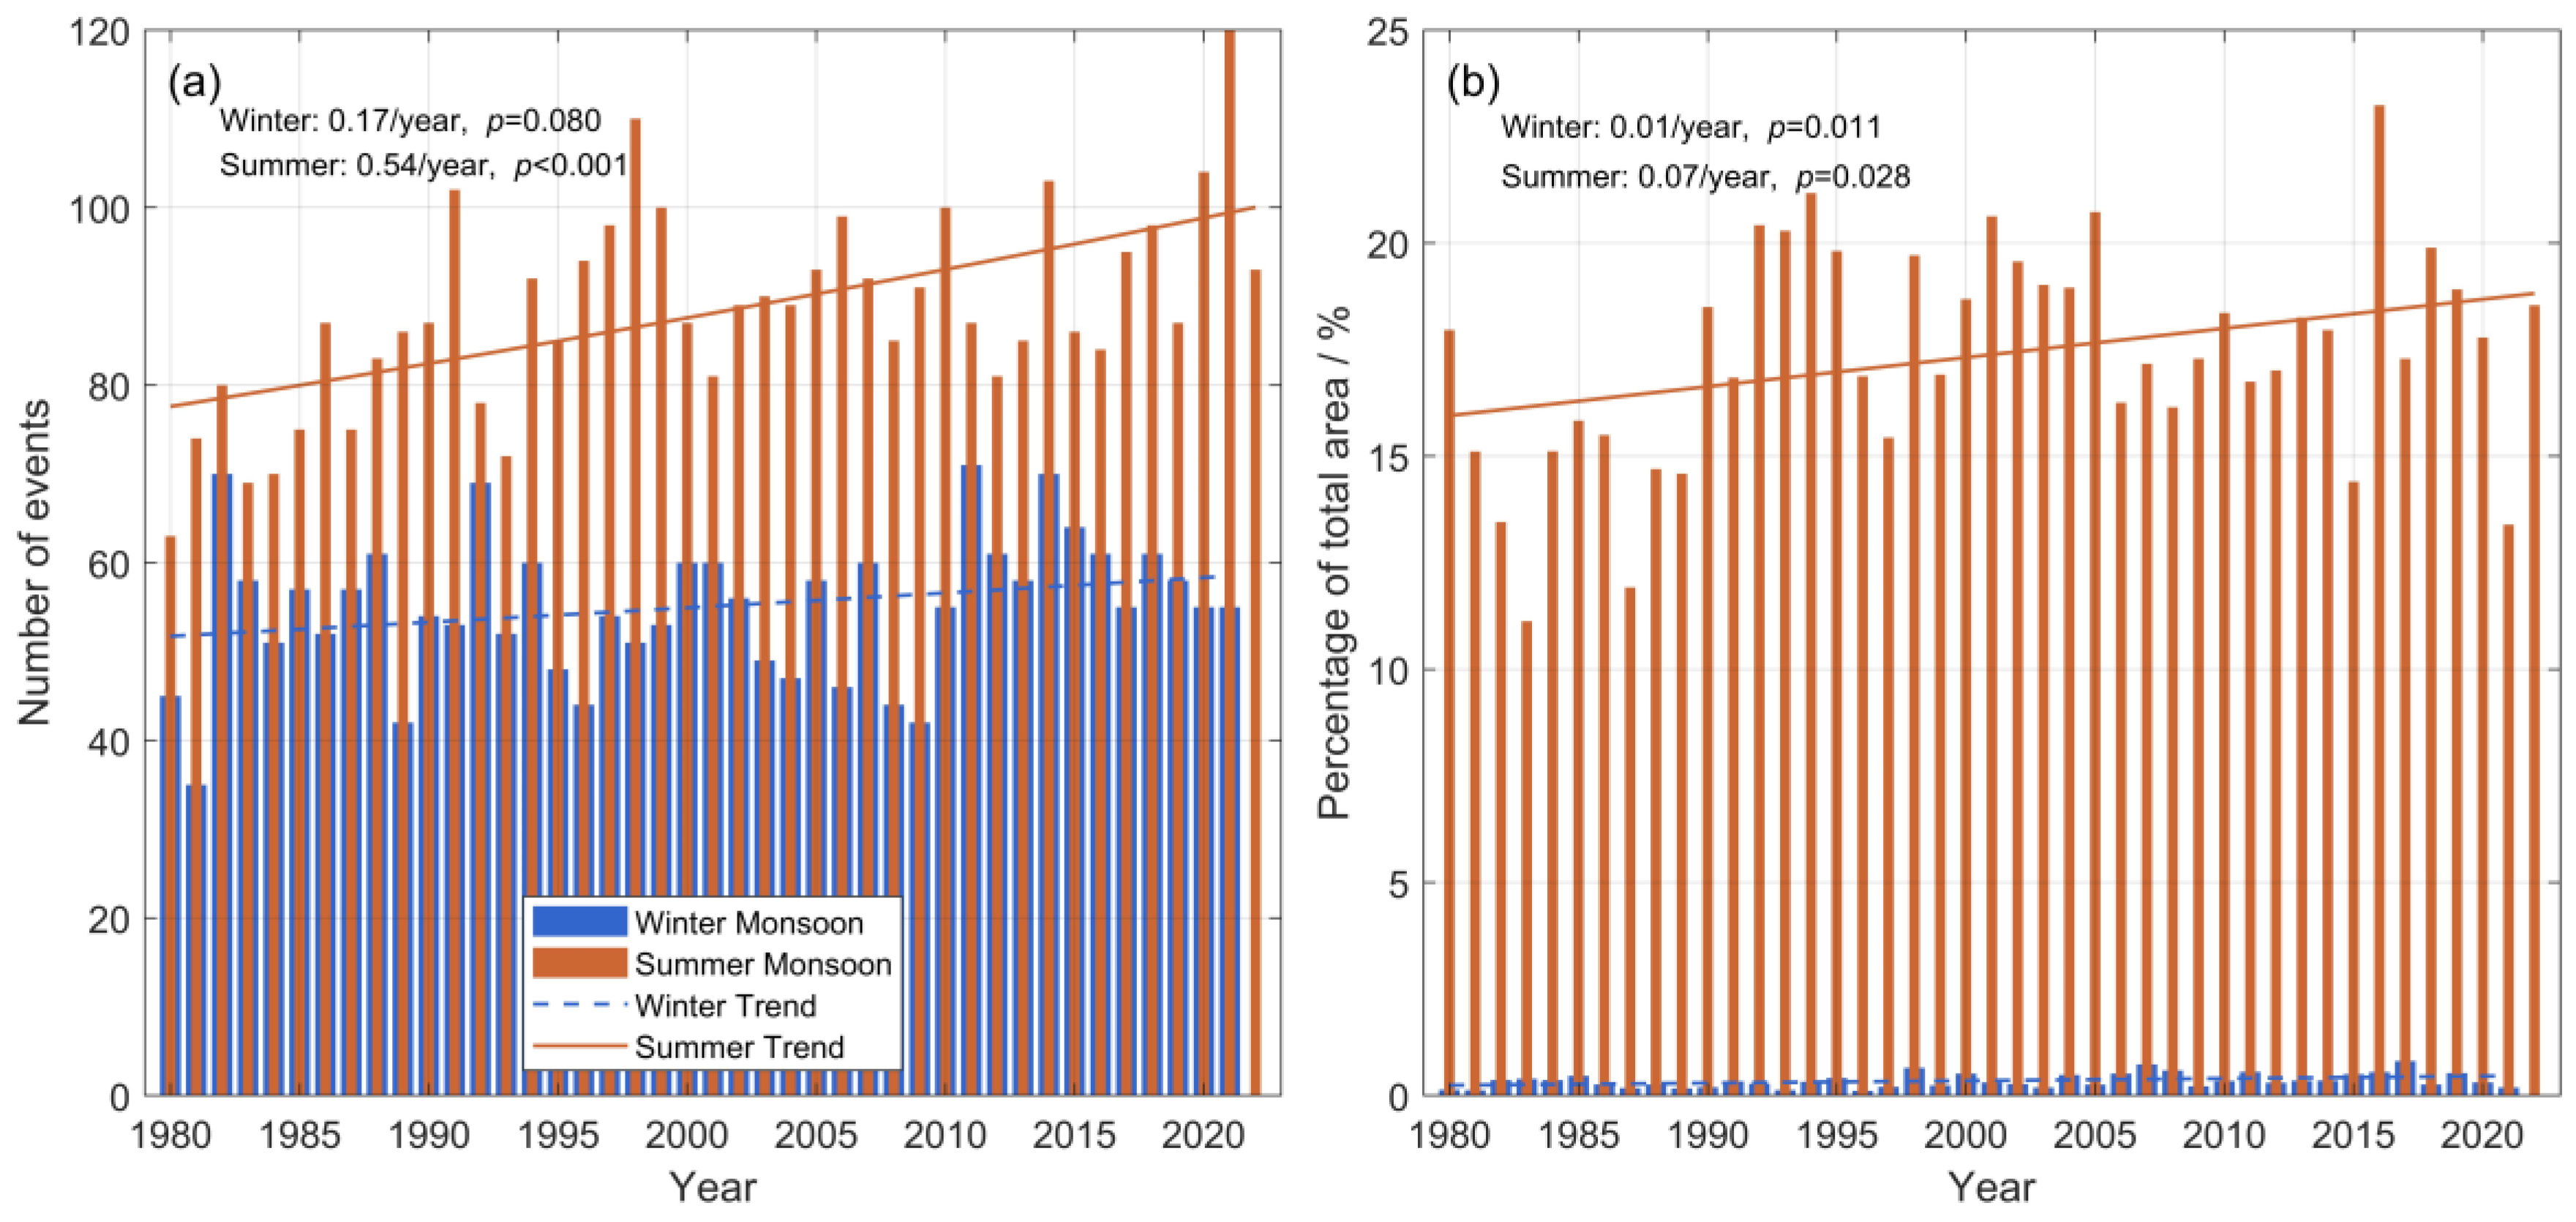
Besides the intensity, the frequency of SBLWEs also differs between the winter and summer monsoons, as shown in Figure 15a. Since the winter monsoon spans across calendar years, data for the final year is incomplete and thus excluded from the statistics. On an annual average, 55.2 events occur during the winter monsoon, while during the summer monsoon, it is approximately 60% higher, reaching 88.3 events per year. Poisson regression shows that winter monsoon events increase by 0.17 per year (0.30%/year), but this trend is not statistically significant (p = 0.080) and should be interpreted with caution. In contrast, summer monsoon events rise by 0.54 per year (0.61%/year), with a statistically significant trend (p < 0.001). Unlike the nearly linear winter trend, the summer trend shows a subtle upward curvature. This accelerating summer intensification serves as the primary driver for the overall increasing frequency of SBLWEs in the NIO.
Figure 15.
Annual number of SBLWEs (a) and proportion of the ocean area within the study region affected by SBLWEs (b) during the winter and summer monsoons.
To further assess the spatial extent of SBLWEs during the monsoon seasons, the daily average affected area was calculated for both summer and winter, as shown in Figure 15b. Although the maximum intensity and frequency of SBLWEs during the winter and summer monsoons are of the same order of magnitude, the affected area differs significantly. The average area affected during the summer monsoon accounts for 17.35% of the study region, far exceeding the 0.35% observed during the winter monsoon. Linear regression reveals an average annual increase of ~0.07% in the affected area during the summer monsoon (p = 0.028), while the winter monsoon shows a slower rise of ~0.01% per year (p = 0.011).
4.4. Potential Impacts of SBLWEs on Maritime Navigation and Operations
SBLWEs caused by tropical cyclones are typically short and occur irregularly. As such, ships can usually respond effectively by following updated weather forecasts. In contrast, SBLWEs induced by the monsoon last longer and occur during relatively fixed periods, making it possible to plan routes and operations based on their spatial and temporal distribution. This can help enhance safety and comfort during navigation and reduce the risks associated with offshore operations.
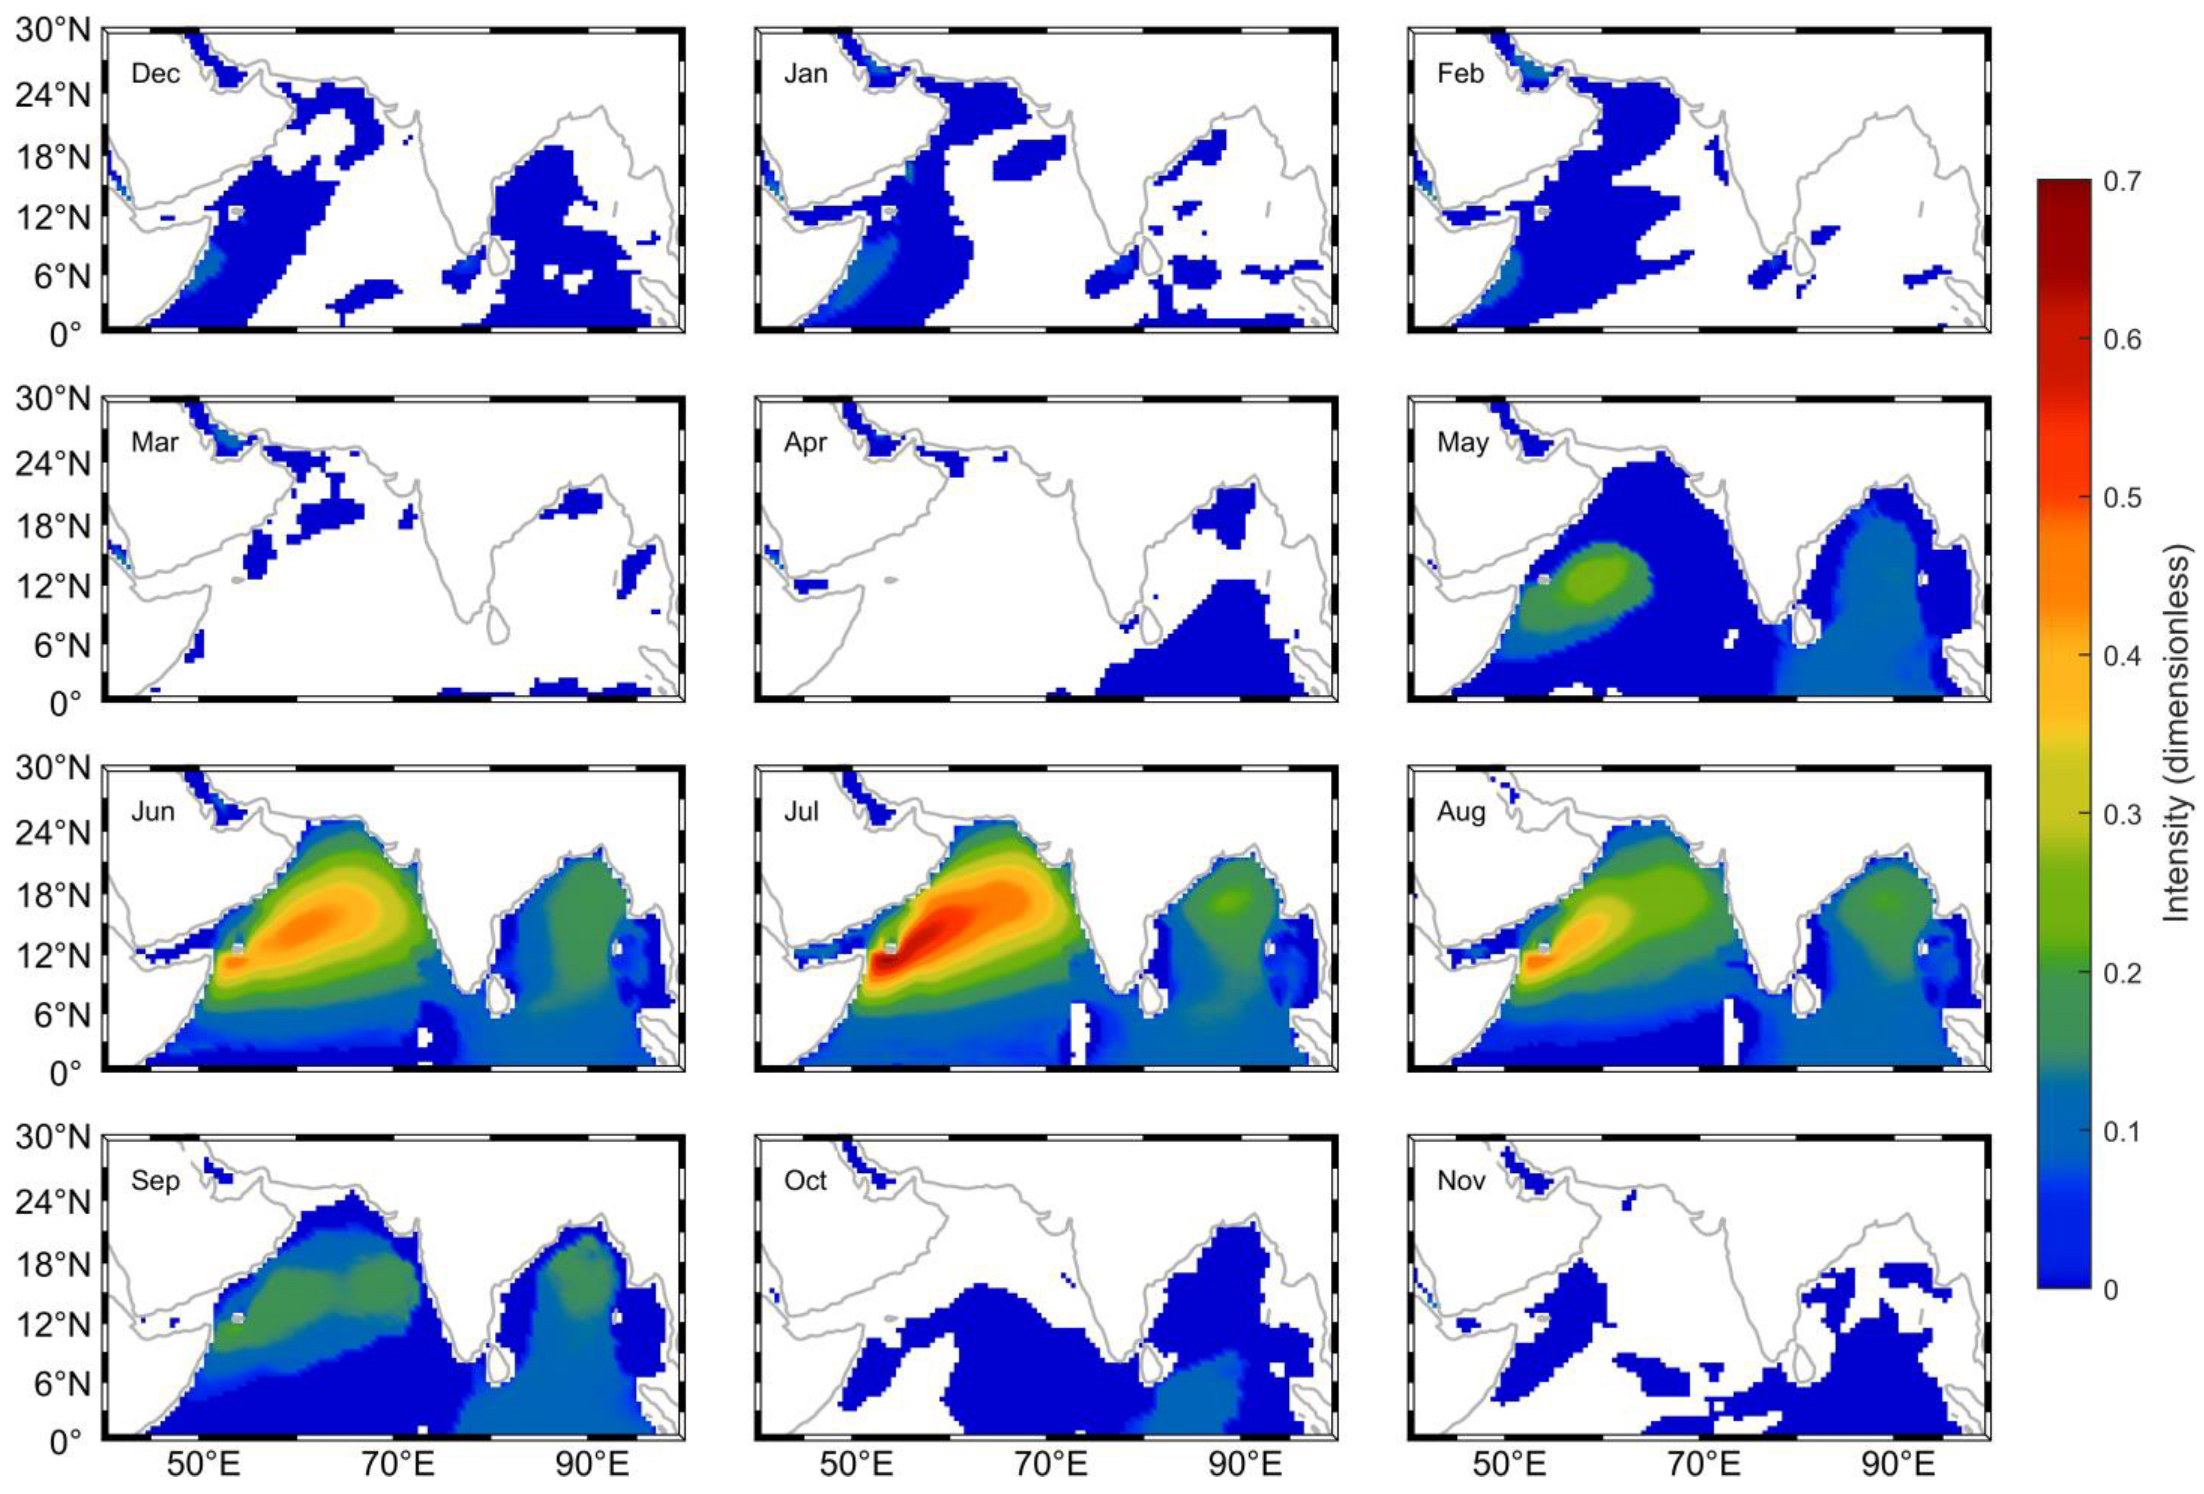
Based on the annual average intensity of SBLWEs (Figure 13), the central and western Arabian Sea appears to be the region with the highest intensity and should be reasonably avoided. However, since wind and wave conditions vary greatly by season, the annual average cannot serve as a reliable guide throughout the year. Therefore, monthly SBLWE intensity was calculated, as shown in Figure 16. To avoid the influence of short-term events, periods with tropical cyclone activity and regions with fewer than 50 occurrences were excluded from the statistics.
Figure 16.
Monthly SBLWE intensity.
The results show that the intensity during the summer monsoon is significantly higher than in other months. From May to October, the average maximum intensity exceeds 0.2, with the highest values—over 0.4—occurring from June to August, corresponding to the peak of the summer monsoon. From October to April, the overall intensity remains low. During April and from October to December, SBLWE regions primarily extend from the equator, possibly influenced by incoming swells. Along the western coast of the Arabian Sea, SBLWEs occur from October to February, with the highest intensities observed from December to February, reaching approximately 0.1. In the Red Sea, SBLWEs occur throughout the year, although their intensities remain low.
Overall, July emerges as the most hazardous period for maritime operations in the NIO, characterized by both the highest SBLWE intensity and the largest average affected area (approximately 38% of the basin, as shown in Figure 8b). While Figure 16 indicates that the hazard envelope extends across nearly the entire basin during the summer monsoon peak, our analysis identifies the central–western Arabian Sea (Somali Jet region, 8–20° N) and the northern Bay of Bengal as the primary high-risk hotspots. Conversely, relatively safer corridors persist along the eastern Arabian Sea and the equatorial regions, offering significant potential for route optimization to minimize exposure to these compound wind–wave extremes.
It is also worth noting that SBLWEs are not entirely detrimental—they offer significant potential for wind and wave energy development.
5. Conclusions
Based on ERA5 reanalysis data (1980–2022), this study characterizes the spatiotemporal patterns and physical drivers of SBLWEs in the NIO. The main conclusions are summarized as follows:
- (1)
- Spatial–Temporal Hotspots: High-intensity SBLWEs are primarily concentrated in the central–western Arabian Sea (up to ~40% probability) and the western Bay of Bengal, exhibiting a distinct seasonal cycle. These events peak from June to August during the summer monsoon, with July representing the most hazardous window for maritime operations, covering nearly 25% of the study domain.
- (2)
- Distinct Driving Mechanisms: SBLWE intensity is governed by two different weather systems. Tropical cyclones drive the most extreme, short-lived intensity peaks, particularly in the northern Bay of Bengal and Arabian Sea. In contrast, the monsoon system generates lower-intensity but more persistent and widespread hazards, with peak average intensities aligned with the Somali Jet region.
- (3)
- Multi-Scale Climate Response: Our analysis identifies a dual-scale response of SBLWEs to climate forcing. On a decadal scale, the long-term increase in event frequency is strongly correlated with rising SST and global warming (R = 0.486, p < 0.001). On an interannual scale, however, the affected area proportion is highly sensitive to climate variability; strong El Niño events significantly suppress the spatial extent of SBLWEs (e.g., 1983, 1987, and 2015). While ENSO acts as a major modulator, other atmospheric and oceanic factors also contribute, making it a significant but partial explanation for the observed interannual fluctuations.
- (4)
- Long-Term Trends and Practical Implications: Poisson regression confirms a statistically significant increasing trend in SBLWEs, with an average rise of approximately 0.7 events per year, primarily occurring during the summer monsoon. If this historical trend persists, a continued increase in SBLWE occurrence can be expected in the coming decades. In the context of ongoing ocean warming, the fitted Poisson trend exhibits a slight upward curvature in recent decades, suggesting a weak nonlinear tendency rather than a strictly linear increase. Although no explicit quantitative projections are performed, these results provide a first-order estimate that SBLWE-related risks are likely to intensify under the nonlinear warming of the global ocean, highlighting the need for continued monitoring and adaptive planning.
These results move beyond univariate statistics to provide a unified risk framework. By identifying the most dangerous temporal windows and “worst-case” historical peaks, this study offers actionable scientific guidance for maritime route optimization and the design of resilient offshore infrastructure in a changing climate.
Author Contributions
Z.Y.: writing—original draft and visualization. N.W.: writing—review and editing, investigation. Y.Z.: writing—review and editing, investigation. Y.L.: writing—review and editing, methodology. C.H.: data curation. L.H.: data curation. H.J.: writing—review and editing. C.D.: methodology, project administration, and funding acquisition. All authors have read and agreed to the published version of the manuscript.
Funding
Supported by the National Natural Science Foundation of China (Nos. 42250710152, 42192562) and the Southern Marine Science and Engineering Guangdong Laboratory (Zhuhai) (No. SML2020SP007).
Data Availability Statement
The datasets generated during or analyzed during the current study are available from the corresponding author on reasonable request.
Conflicts of Interest
The authors declare no conflicts of interest.
References
- Suresh, I.; Vialard, J.; Lengaigne, M.; Han, W.; McCreary, J.; Durand, F.; Muraleedharan, P.M. Origins of wind-driven intraseasonal sea level variations in the North Indian Ocean coastal waveguide. Geophys. Res. Lett. 2013, 40, 5740–5744. [Google Scholar] [CrossRef] [Scilit]
- Krishnan, A.; Bhaskaran, P.K.; Kumar, P. Extreme wind-wave climate projections for the Indian Ocean under changing climate scenarios. Clim. Dyn. 2022, 59, 649–669. [Google Scholar] [CrossRef] [Scilit]
- Kaur, S.; Kumar, P.; Weller, E.; Min, S.-K.; Jin, J. Multi-model ensemble projections of extreme ocean wave heights over the Indian ocean. Clim. Dyn. 2021, 56, 2163–2180. [Google Scholar] [CrossRef] [Scilit]
- Shanas, P.R.; SanilKumar, V. Trends in surface wind speed and significant wave height as revealed by ERA-Interim wind wave hindcast in the Central Bay of Bengal. Int. J. Clim. 2015, 35, 2654–2663. Available online: https://drs.nio.res.in/drs/handle/2264/4801 (accessed on 9 October 2024). [CrossRef] [Scilit]
- Samayam, S.; Laface, V.; Annamalaisamy, S.S.; Arena, F.; Vallam, S.; Gavrilovich, P.V. Assessment of reliability of extreme wave height prediction models. Nat. Hazards Earth Syst. Sci. 2017, 17, 409–421. [Google Scholar] [CrossRef] [Scilit]
- Sreelakshmi, S.; Bhaskaran, P.K. Regional wise characteristic study of significant wave height for the Indian Ocean. Clim. Dyn. 2020, 54, 3405–3423. [Google Scholar] [CrossRef] [Scilit]
- Kerkar, J.P.; Seelam, J.K. Trends in the surface wind-wave heights in the North Indian Ocean based on 50-year NCEP/NCAR reanalysis wind-wave data. Reg. Stud. Mar. Sci. 2024, 72, 103430. [Google Scholar] [CrossRef] [Scilit]
- Kumar, P.; Yadav, A.; Sardana, D.; Prasad, R. Extreme wave height response to climate modes and its association with tropical cyclones over the Indo-Pacific Ocean. Ocean Eng. 2024, 296, 116789. [Google Scholar] [CrossRef] [Scilit]
- Kumar, V.S.; Philip, C.S. Variations in long term wind speed during different decades in Arabian Sea and Bay of Bengal. J. Earth Syst. Sci. 2010, 119, 639–653. [Google Scholar] [CrossRef] [Scilit]
- Liu, J.; Yu, M.; Zhang, X.; Zhao, H. Characteristics of Wind Wave Field and Optimum Shipping Line Analysis in North Indian Ocean. Tropic. Oceanol. 1998, 17, 17–25. [Google Scholar]
- Muni Krishna, K. Intensifying tropical cyclones over the North Indian Ocean during summer monsoon—Global warming. Glob. Planet. Change 2009, 65, 12–16. [Google Scholar] [CrossRef] [Scilit]
- Young, I.R.; Ribal, A. Multiplatform evaluation of global trends in wind speed and wave height. Science 2019, 364, 548–552. [Google Scholar] [CrossRef] [Scilit] [PubMed]
- Bhaskaran, P.K. Wind-wave Climate Projections for the Indian Ocean from Satellite Observations. J. Mar. Sci. Res. Dev. 2014, 1. [Google Scholar] [CrossRef]
- Luo, Y.; Shi, H.; Wang, W. Response of extreme significant wave height to climate change in the South China Sea and northern Indian Ocean. Aquat. Ecosyst. Health Manag. 2021, 24, 103–110. [Google Scholar] [CrossRef] [Scilit]
- Shanas, P.R.; Sanil Kumar, V. Temporal variations in the wind and wave climate at a location in the eastern Arabian Sea based on ERA-Interim reanalysis data. Nat. Hazards Earth Syst. Sci. 2014, 14, 1371–1381. [Google Scholar] [CrossRef] [Scilit]
- Patra, A.; Bhaskaran, P.K. Temporal variability in wind–wave climate and its validation with ESSO-NIOT wave atlas for the head Bay of Bengal. Clim. Dyn. 2017, 49, 1271–1288. [Google Scholar] [CrossRef] [Scilit]
- Bhaskaran, P.K.; Neelamani, S.; Al-Salem, K.; Krishnan, A.; Albert, J.; Sreelakshmi, S. Extreme Wind-Wave Characteristics in the North Indian Ocean in a Changing Climate. In Extreme Natural Events: Sustainable Solutions for Developing Countries; Unnikrishnan, A.S., Tangang, F., Durrheim, R.J., Eds.; Springer Nature: Singapore, 2022; pp. 223–280. [Google Scholar] [CrossRef] [Scilit]
- Bertin, X.; Prouteau, E.; Letetrel, C. A significant increase in wave height in the north atlantic ocean over the 20th century. Glob. Planet. Change 2013, 106, 77–83. [Google Scholar] [CrossRef] [Scilit]
- Anoop, T.R.; Kumar, V.S.; Shanas, P.R.; Johnson, G. Surface Wave Climatology and Its Variability in the North Indian Ocean Based on ERA-Interim Reanalysis. J. Atmos. Ocean. Technol. 2015, 32, 1372–1385. [Google Scholar] [CrossRef] [Scilit]
- Chempalayil, S.P.; Kumar, V.S.; Johnson, G.; Dora, G.U.; Vinayaraj, P. Interannual and seasonal variations in nearshore wave characteristics off Honnavar, west coast of India. Curr. Sci. 2012, 103, 286–292. [Google Scholar]
- Chowdhury, P.; Behera, M.R.; Reeve, D.E. Wave climate projections along the Indian coast. Int. J. Climatol. 2019, 39, 4531–4542. [Google Scholar] [CrossRef] [Scilit]
- Naseef, T.M.; SanilKumar, V. Climatology and trends of the Indian Ocean surface waves based on 39-year long ERA5 reanalysis data. Int. J. Clim. 2020, 40, 979–1006. [Google Scholar] [CrossRef] [Scilit]
- Yang, S.; Duan, S.; Fan, L.; Zheng, C.; Li, X.; Li, H.; Xu, J.; Wang, Q.; Feng, M. 10-Year Wind and Wave Energy Assessment in the North Indian Ocean. Energies 2019, 12, 3835. [Google Scholar] [CrossRef] [Scilit]
- Sreelakshmi, S.; Bhaskaran, P.K. Wind-generated wave climate variability in the Indian Ocean using ERA-5 dataset. Ocean Eng. 2020, 209, 107486. [Google Scholar] [CrossRef] [Scilit]
- Sreelakshmi, S.; Bhaskaran, P.K. Spatio-Temporal Distribution and Variability of High Threshold Wind Speed and Significant Wave Height for the Indian Ocean. Pure Appl. Geophys. 2020, 177, 4559–4575. [Google Scholar] [CrossRef] [Scilit]
- Amrutha, M.M.; Kumar, V.S. Changes in Wave Energy in the Shelf Seas of India during the Last 40 Years Based on ERA5 Reanalysis Data. Energies 2020, 13, 115. [Google Scholar] [CrossRef] [Scilit]
- Knapp, K.R.; Kruk, M.C.; Levinson, D.H.; Diamond, H.J.; Neumann, C.J. The International Best Track Archive for Climate Stewardship (IBTrACS): Unifying Tropical Cyclone Data. Am. Meteorol. Soc. 2010, 91, 363–376. [Google Scholar] [CrossRef] [Scilit]
- Singleton, F. The Beaufort scale of winds—Its relevance, and its use by sailors. Weather 2008, 63, 37–41. [Google Scholar] [CrossRef] [Scilit]
- Wheeler, D.; Wilkinson, C. From Calm to Storm: The Origins of the Beaufort Wind Scale. Mar. Mirror 2004, 90, 187–201. [Google Scholar] [CrossRef] [Scilit]
- Ethamony, P.V.; Rashmi, R.; Samiksha, S.V.; Aboobacker, V.M. Recent Studies on Wind Seas and Swells in the Indian Ocean: A Review. Int. J. Ocean Clim. Syst. 2013, 4, 63–73. [Google Scholar] [CrossRef] [Scilit]
- Murakami, H.; Vecchi, G.A.; Underwood, S. Increasing frequency of extremely severe cyclonic storms over the arabian sea. Nat. Clim. Change 2017, 7, 885–889. [Google Scholar] [CrossRef] [Scilit]
Disclaimer/Publisher’s Note: The statements, opinions and data contained in all publications are solely those of the individual author(s) and contributor(s) and not of MDPI and/or the editor(s). MDPI and/or the editor(s) disclaim responsibility for any injury to people or property resulting from any ideas, methods, instructions or products referred to in the content. |
© 2026 by the authors. Licensee MDPI, Basel, Switzerland. This article is an open access article distributed under the terms and conditions of the Creative Commons Attribution (CC BY) license.