


Abstract
This study develops a systematic framework for assessing the temporal dynamics of tropical cyclone (TC) risk in the Guangdong–Hong Kong–Macao Greater Bay Area (GBA) from 2013 to 2023. A unified composite index was constructed by integrating hazard, vulnerability, and mitigation capacity, allowing for the quantification of the interannual evolution of TC risk. The analysis showed that maximum storm surge and extreme precipitation drove hazard variability, with distinct peaks during the super typhoons of 2017 and 2018. In the vulnerability dimension, GDP and population density together accounted for over 50% of the total weight, and the vulnerability index shows an upward trend, though its growth slowed in 2020. Mitigation capacity improved steadily, accelerating after 2020 and partly offsetting the risk pressure from growing vulnerability. The risk index broadly mirrored the hazard index, peaking in 2018. Notably, in the two TC-free years (2014 and 2019), the risk index was higher in 2019 than in 2014, reflecting an increased vulnerability-to-mitigation ratio over the intervening period. A coherence check against three disaster loss indicators (2018–2023) yielded a correlation of r = 0.8, indicating broad consistency in the interannual patterns of the risk index and observed losses. This study provides a temporally explicit baseline for understanding recent TC risk dynamics and offers methodological support for resilience planning in coastal megaregions facing climate-related hazards.
1. Introduction
The Guangdong–Hong Kong–Macao Greater Bay Area (GBA) comprises two Special Administrative Regions and nine prefecture-level cities situated around the Pearl River Estuary. As one of the most economically advanced regions worldwide, the GBA contributes approximately 10% of China’s gross domestic product (GDP). Despite its economic significance, the region is highly vulnerable to severe tropical cyclones (TCs), which rank among the most destructive natural hazards affecting the area. On average, the GBA encounters about four TCs annually. A notable example occurred in 2018, when Super Typhoon Mangkhut (TC ID 1822) made direct landfall in the GBA, producing extreme storm surge and wind-induced structural damage that posed substantial threats to public safety. Economic losses from this event were estimated at 24.57 billion yuan [1]. Given the recurrent impacts of TCs and their substantial socioeconomic consequences, quantifying and assessing TC-related risks in the GBA is essential for enhancing regional resilience and informing disaster mitigation strategies.
In recent years, research on TC risk assessment has shifted from the analysis of single disaster-causing factors to a comprehensive assessment of the complex chain relationships among multiple disaster-causing factors [2]. The core of this transformation lies in the recognition that TCs not only bring strong winds but also multiple secondary hazards such as heavy rain, storm surges [3,4,5,6,7,8,9,10]. The interaction among these factors will produce a synergistic amplification effect. Existing research methodologies can be broadly categorized into three types: probability modeling and numerical simulation based on physical mechanisms, indicator system methods based on multi-criteria decision-making and GIS, and statistical regression methods based on historical disaster data [11,12,13,14,15,16]. Several studies have emphasized the critical role of spatial heterogeneity in disaster risk assessment and prevention, demonstrating through empirical analyses that risk factors vary significantly across spatial scales [17,18]. To more accurately reveal risk patterns, identify high-risk targets, and enhance the effectiveness of assessment or prevention, refined spatial analysis is necessary [11,15,19,20]. Recent transect-based, multi-decadal analyses extend this argument to the temporal dimension, showing that vulnerability and recovery are not symmetric over time and that static single-rate metrics under-resolve the dynamics of coastal hazard exposure [21]. A parallel transect-based vulnerability framework that integrates erosion-accretion dynamics into a disaster-risk-reduction setting has also been developed [22], providing methodological support for the year-on-year risk decomposition that the present study undertakes for the GBA. Both findings reinforce the argument that interannual risk dynamics, not just spatial heterogeneity, deserve explicit empirical treatment.
Some studies indicate that a growing body of evidence shows that both the intensity and frequency of hazard factors, as well as the exposure and vulnerability of disaster-bearing bodies [23], exhibit significant temporal dynamics [24,25,26]. A study found that under a warming climate, the share of TC disaster losses in GDP will continue to rise for most countries between 2020 and 2100 [27]. Gori et al. [3] used synthetic TC and multi-hazard physical models to quantify the TC risk at the county scale in the United States under the combined effect of wind, rain, and storm surges. It was found that the contribution of climate change and social and economic growth to the expected annual losses in the future is of comparable magnitude, but the superposition of the two will lead to a non-linear increase in risk. Darko et al. [28] assessed the dynamic evolution and associated risks of typhoons over a 30-year period (1994–2023), focusing on coastal China’s resilience. However, their study did not incorporate multiple relevant factors into a unified comprehensive indicator. Castillo-Loeza et al. [29] estimated the annual probability of TC occurrence in Mexico from 1970 to 2023 and analyzed four key socioeconomic loss indicators—namely, fatalities, affected population, damaged housing units, and economic losses. They further developed a composite socioeconomic loss index. Nevertheless, this analysis did not account for critical aspects such as societal mitigation capacity. Cai et al. [30] classified the genesis regions of TCs and constructed a comprehensive risk assessment model incorporating hazard, exposure, vulnerability, and emergency recovery capacity. The study evaluated the impact of TCs on various provinces in China from both temporal and spatial dimensions, but the model did not account for the effects of storm surge hazards.
In summary, existing studies have predominantly focused on either spatial heterogeneity or long-term climatic projections, with very limited attention to the interannual dynamics of TC risk at regional scales. In addition, the role of evolving mitigation capacity in offsetting growing hazard potential over time remains empirically underexplored, particularly for rapidly developing coastal megaregions such as the GBA.
Based on the research gaps identified above, this study focuses on the interannual variability of TC risk in the GBA. Unlike previous research that has primarily examined static risk patterns, this work explicitly quantifies the temporal dynamics of risk from 2013 to 2023. We develop a composite risk index that integrates hazard characteristics, vulnerability, and regional mitigation capacity, and we assess its year-to-year evolution. This study offers a temporally explicit baseline for understanding recent TC risk dynamics and provides practical guidance for prioritizing resilience investments in one of China’s most economically vital and hazard-prone coastal regions. Section 2 introduces the methodology and datasets. Section 3 shows the proof of interannual changes in various parameters within the assessment system and the consistency check. Finally, discussion and conclusions are given in Section 4 and Section 5.
2. Materials and Methods
2.1. Definition and Statistics of TCs Affecting the GBA
For this study, a TC event affecting the GBA is defined as one that generates wind, rainfall, and storm surge hazards within the region. The TC records are summarized in Table 1. The study period 2013–2023 was selected based on the availability of consistent and comprehensive data for all 12 indicators across the GBA, as well as the completeness of TC records from IBTrACS and storm surge data from provincial bulletins. This period covers a full decade of recent TC activity, including several major events (e.g., Hato (TC ID 1713) and Mangkhut (TC ID 1822)), enabling meaningful interannual comparisons.
Table 1.
The TCs affecting the GBA during 2013–2023.
It is noteworthy that no storm surge disasters occurred in the Greater Bay Area (GBA) in 2014. In contrast, in 2019, although tropical storm Wipha (TC ID 1907) affected the region, the resulting storm surge caused no reported economic losses; consequently, this event was included in the present study.
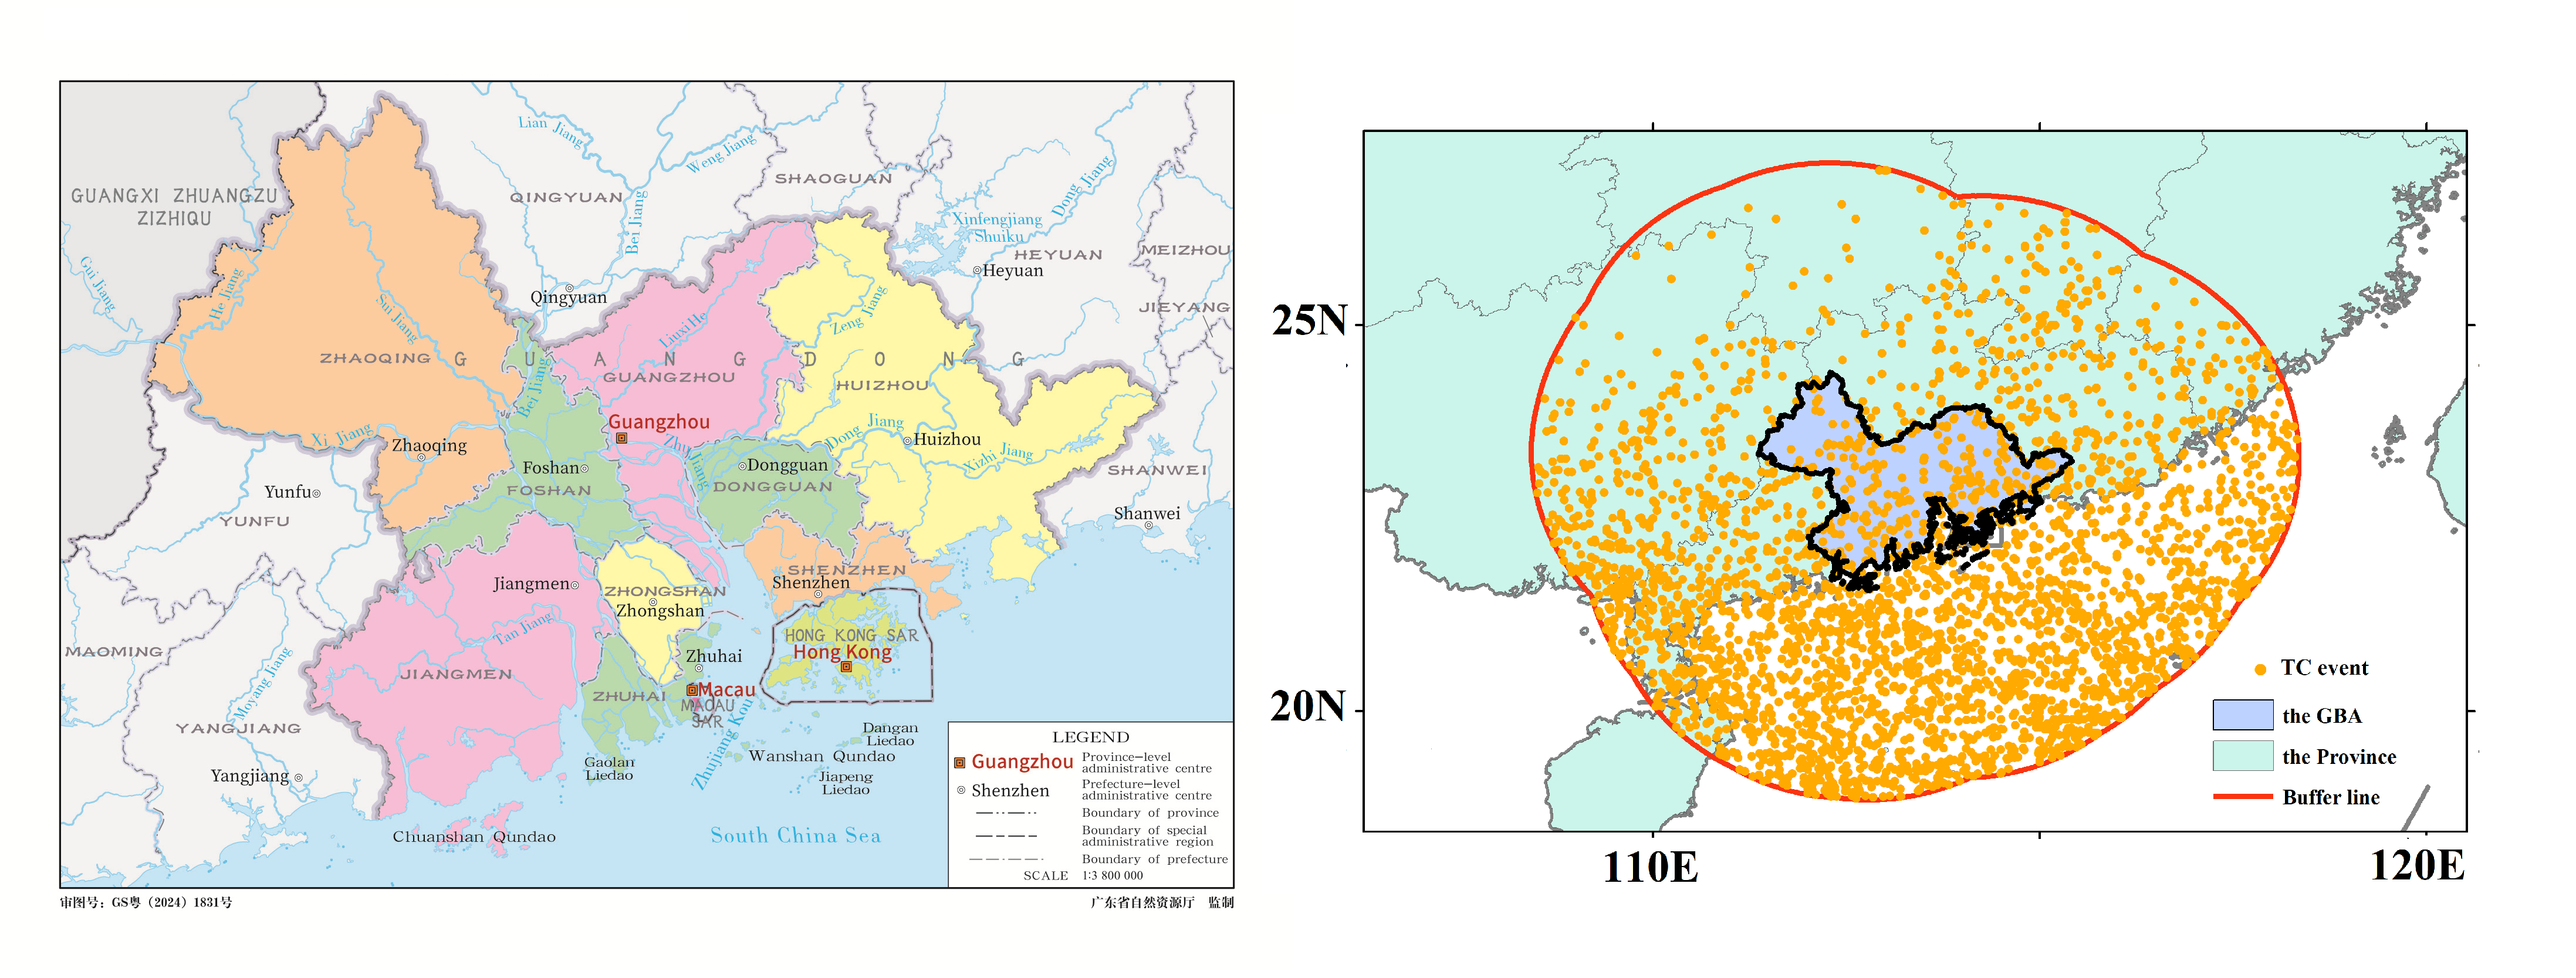
The region affected by a TC is usually within 300 km of the TC eye [31], and wind speeds within this region typically exceed 10.8 m/s, which can damage high-voltage power lines and cause substantial damage [32,33]. In this study, based on the regional boundary of the GBA, a buffer zone with a radius of 300 km is built. The TC events that occur within the buffer zone are selected as our research target (Figure 1).
Figure 1.
Location map of the GBA (left) and TC events in the buffer zone (right). Base map (left) from the Public Map Service System of Guangdong Province, Department of Natural Resources of Guangdong Province (Map Examination Number: GS Yue (2024) 1831). The examination number must not be deleted.
2.2. Index System Establishment
As there is no universally agreed criterion for selecting conditioning factors in TC risk assessment, we reviewed the literature and identified 12 relevant evaluation indicators spanning hazard, vulnerability, and mitigation capacity [34,35,36,37].
It should be noted that the risk index developed in this study is not a probabilistic risk measure in the formal sense (i.e., expected annual loss). Rather, it is a composite index that integrates hazard characteristics, exposure, and mitigation capacity to track relative changes in TC risk pressure over time. This operational definition is suitable for interannual monitoring and regional comparison, but should not be interpreted as a substitute for full probabilistic risk assessment.
2.2.1. Hazard
A hazard refers to an event or phenomenon, such as a TC, that may adversely affect human life, property, socioeconomic activities, or the environment [26,38]. The likelihood of TC occurrence depends on both TC characteristics and associated meteorological conditions. To capture the annual signature of TC hazard, five indices were selected: annual maximum intensity, annual average intensity, total duration within the buffer zone, maximum storm surge, and maximum total precipitation in the GBA. TC intensity metrics capture distinct aspects of hazard: maximum intensity represents the peak destructive potential of individual events, while average intensity reflects the overall energy release over a storm’s lifespan. The value for “maximum storm surge” is taken as the annual record of the largest water level increase induced by storms in the GBA. The maximum total precipitation refers to the annual record of the largest accumulated precipitation during a single TC event affecting the GBA.
2.2.2. Vulnerability
Vulnerability reflects how easily an element can be influenced by environmental changes, and indicates how severely a community and its environment might be harmed by a particular hazard [38,39]. In this study, population density, GDP, human land use exposure (HLUE), road network density (RND) are selected to represent vulnerability. Population density, GDP, and HLUE correspond to socioeconomic vulnerability. Since cultivated land, urban–rural industrial and mining residential land are highly susceptible to disasters, we selected the proportion of their respective areas relative to the total as the research indicator of HLUE. RND is included as a positive vulnerability indicator. While higher road density may facilitate evacuation and post-disaster response, the dense road network itself represents a large stock of exposed infrastructure assets that are directly vulnerable to TC-induced wind, flooding, and storm surge damage. In the GBA, empirical evidence from recent major TC events (e.g., Typhoon Mangkhut (TC ID 1822)) indicates that road closures due to flooding, debris, and structural damage were a primary source of economic loss and response delays.
2.2.3. Mitigation Capacity
Mitigation capacity denotes the ability to respond to extreme hazard events and to carry out pre-planned measures aimed at reducing disaster losses [35,40]. In this study, social assistance level, educational attainment, and mangrove area are selected as indicators of mitigation capacity for the GBA. Social assistance is measured by counting the number of hospitals and shelters. Educational attainment is represented by the average years of schooling. Mangroves mitigate storm surge and wave energy through the combined effects of canopy drag and root systems, promoting sediment accretion and stabilizing shorelines, thereby reducing water level rise and coastal erosion, and lessening flood risk and damage to coastal communities.
Disaster assessment often involves multi-source, heterogeneous indicators, which vary greatly in terms of units and magnitudes. Directly applying weighted summation to these indicators may lead to biased results dominated by those with larger numerical values. Therefore, all indicators used in this study were standardized using the min–max normalization scaled to the range [1,2] prior to the development of the assessment model [41,42]. The lower bound of the normalization range is set to 1 (rather than 0) to ensure that the mitigation capacity index is always ≥1, thereby avoiding division-by-zero or artificial inflation of risk values in Equation (2).
2.2.4. Weight Analysis
The Analytic Hierarchy Process-Entropy Weighting Method [17] is a hybrid approach that integrates the Analytic Hierarchy Process (AHP) and the Information Entropy (IoE) method to determine indicator weights in multi-criteria decision analysis or comprehensive assessments (e.g., disaster risk assessment, ecological security evaluation, sustainability indices).
The AHP method is utilized to capture subjective expert judgments. We invited five experts specializing in tropical cyclone disaster risk assessment to independently conduct pairwise comparisons of all indicators within each dimension (hazard, vulnerability, and mitigation capacity). Following the standard 1–9 scale proposed by Saaty, their judgments were used to construct comparison matrices. The consistency ratio (CR) for each expert’s matrix was calculated, and only matrices with a CR < 0.1 were deemed acceptable, ensuring logical consistency in their judgments. The final AHP weight for each indicator was obtained by averaging the weights derived from the five valid expert matrices. The IoE method is applied to derive objective weights based on the inherent variability of the data. This method posits that an indicator with greater dispersion across evaluation units or years contains more information and should therefore be assigned a higher weight [41]. The entropy weight for each indicator is calculated by quantifying its information entropy relative to the entire set of indicators within its dimension.
This combination seeks to balance subjective expert knowledge with objective data-driven information, thereby reducing the bias inherent in using either method alone. A common combination scheme is expressed as:
is from five experts. And is from IoE, it assigns weights to indicators based solely on the variability (dispersion) of their values across evaluation units; indicators that exhibit greater heterogeneity are assumed to convey more useful information and therefore receive higher weights.
To evaluate the uncertainty of the entropy weights arising from the small sample (n = 11), we performed bootstrap resampling with 1000 iterations [43] (see Section 4). For each iteration, we resampled the years with replacement and recalculated the weights. The resulting confidence intervals indicate that the top-ranked indicators are relatively stable, whereas the rankings of lower-weighted indicators are more uncertain.
2.2.5. Risk Assessment Model
Building on established research [18,34,44,45] and natural disaster risk theory, this study employs a widely recognized TC risk assessment framework. The integrated model incorporates three core elements: hazard-induced factors, the vulnerability of the exposed system (comprising both natural and socioeconomic dimensions), and mitigation or resilience capacity. The TC risk index was then calculated using the following equation:
Since all three component indices are normalized to the range [1,2], the theoretical range of the risk index is [0.5, 4].
2.2.6. Coherence Assessment
To provide a practical evaluation, the time-series of the TC risk index was compared with the historical disaster loss statistics derived from the Guangdong–Hong Kong–Macao Greater Bay Area Climate Bulletin. Given the constraints in data availability, this study utilized historical disaster loss records from 2018 to 2023. Specifically, three key indicators were selected to quantify TC-related impacts: direct economic loss, the affected population, and the aquaculture loss area.
To address the high dimensionality and multicollinearity among the initial set of n variables, we employed Principal Component Analysis (PCA) [46,47]. PCA is a widely used statistical technique for dimensionality reduction that transforms the original correlated variables into a new set of uncorrelated variables, termed principal components (PCs). This approach allows us to identify the dominant patterns of variation within the data and mitigate the effects of multicollinearity in subsequent analyses (e.g., regression or clustering).
2.3. Data
The TC-related data (including TC intensity, duration, track length) were acquired from the International Best Track Archive for Climate Stewardship (IBTrACS) [48], storm surge data were collected from Bulletin on Marine Disasters in Guangdong Province (2013–2023), precipitation data were sourced from the Yearbook of Tropical Cyclone (2013–2023) and Guangdong–Hong Kong–Macao Greater Bay Area Climate Bulletin (2018–2023). RND and social assistance level data were obtained from OpenStreetMap (OSM). the data of HLUE were obtained from National Land Use Dataset at 1 km resolution from the Chinese Academy of Sciences [49]. Mangrove area data were derived from Global Mangrove Watch (GMW). Population and GDP data were sourced from the Guangdong Provincial Bureau of Statistics, the Hong Kong Government Website, and the Macao Government Website.
3. Results
3.1. Interannual Variations in Hazard
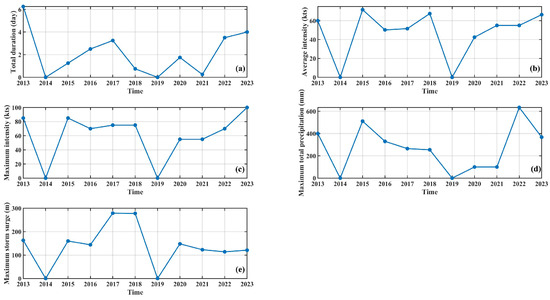
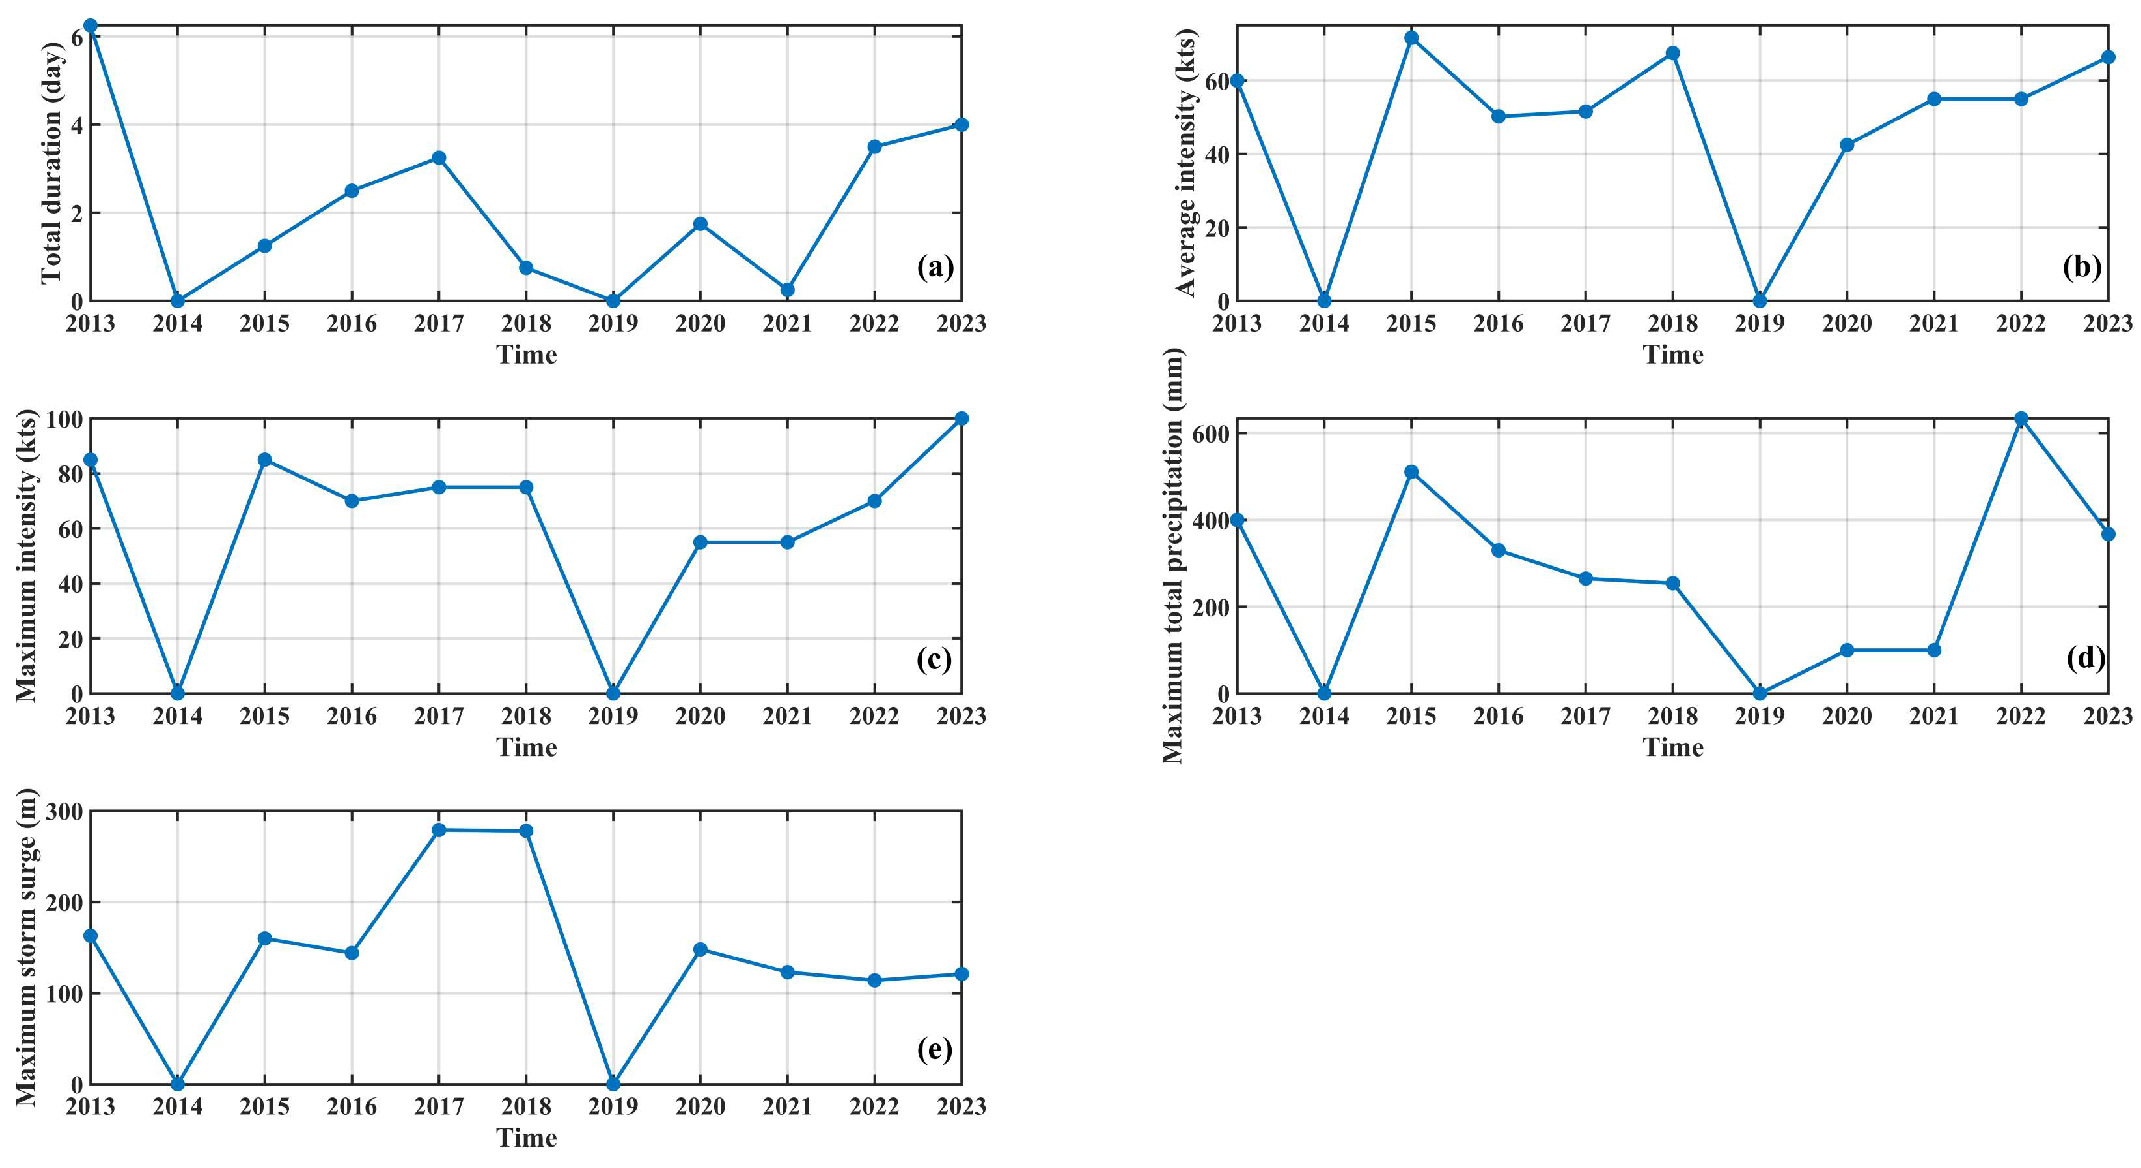
To investigate the interannual variations in hazard, five hazard components are chosen: the annual cumulative duration, the annually averaged intensity, the annually maximum intensity of TC events occurring in the buffer zone, and the maximum total precipitation induced by TC events in the GBA, as well as maximum storm surge in the GBA (Figure 2). TCs affected the GBA for about 3 days per year on average, with average (maximum) intensity in the buffer zone of approximately 60 (80) kts. However, the precipitation and storm surge exhibit substantial interannual variability.
Figure 2.
Time series of the hazard components for the TC risk: (a) total duration, (b) average intensity, (c) maximum intensity, (d) maximum total precipitation and (e) maximum storm surge.
The weight of each hazard indicator was calculated using the AHP-IoE weighting method (Table 2). Maximum storm surge (weight = 0.33) ranked first, serving as the core indicator of the hazard dimension. This result is supported by both subjective and objective factors: from the perspective of AHP subjective weighting, experts unanimously considered storm surge to be the most destructive hazard factor in coastal areas (0.32), with its threat to coastal infrastructure and human life far exceeding that of other individual hazard factors such as wind and rainfall [9,10]; from the perspective of IoE objective weighting, the pronounced interannual fluctuation of storm surge data (0.18) also endows this indicator with strong information discrimination capacity. Average intensity (0.26) and maximum intensity (0.20) rank second and third, respectively, together accounting for nearly half of the total weight. Both indicators received high expert attention in the AHP judgment (0.30 and 0.23), reflecting the fundamental role of tropical cyclone wind force in the hazard-generating mechanism. The precipitation brought by TCs can trigger disasters such as urban waterlogging and water accumulation in underground spaces. However, coastal cities usually have special designs for their drainage systems to cope with TC-related rainstorms, and the impact of rainstorms is mostly concentrated in local low-lying areas of urban districts. The extreme casualties caused by rainstorms alone are far lower than those caused by storm surges and gales. Therefore, the weight of precipitation ranks after that of storm surges and TC intensity.
Table 2.
The combined weights of indicators in the hazard dimension.
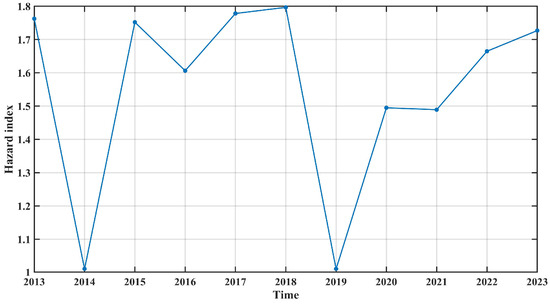
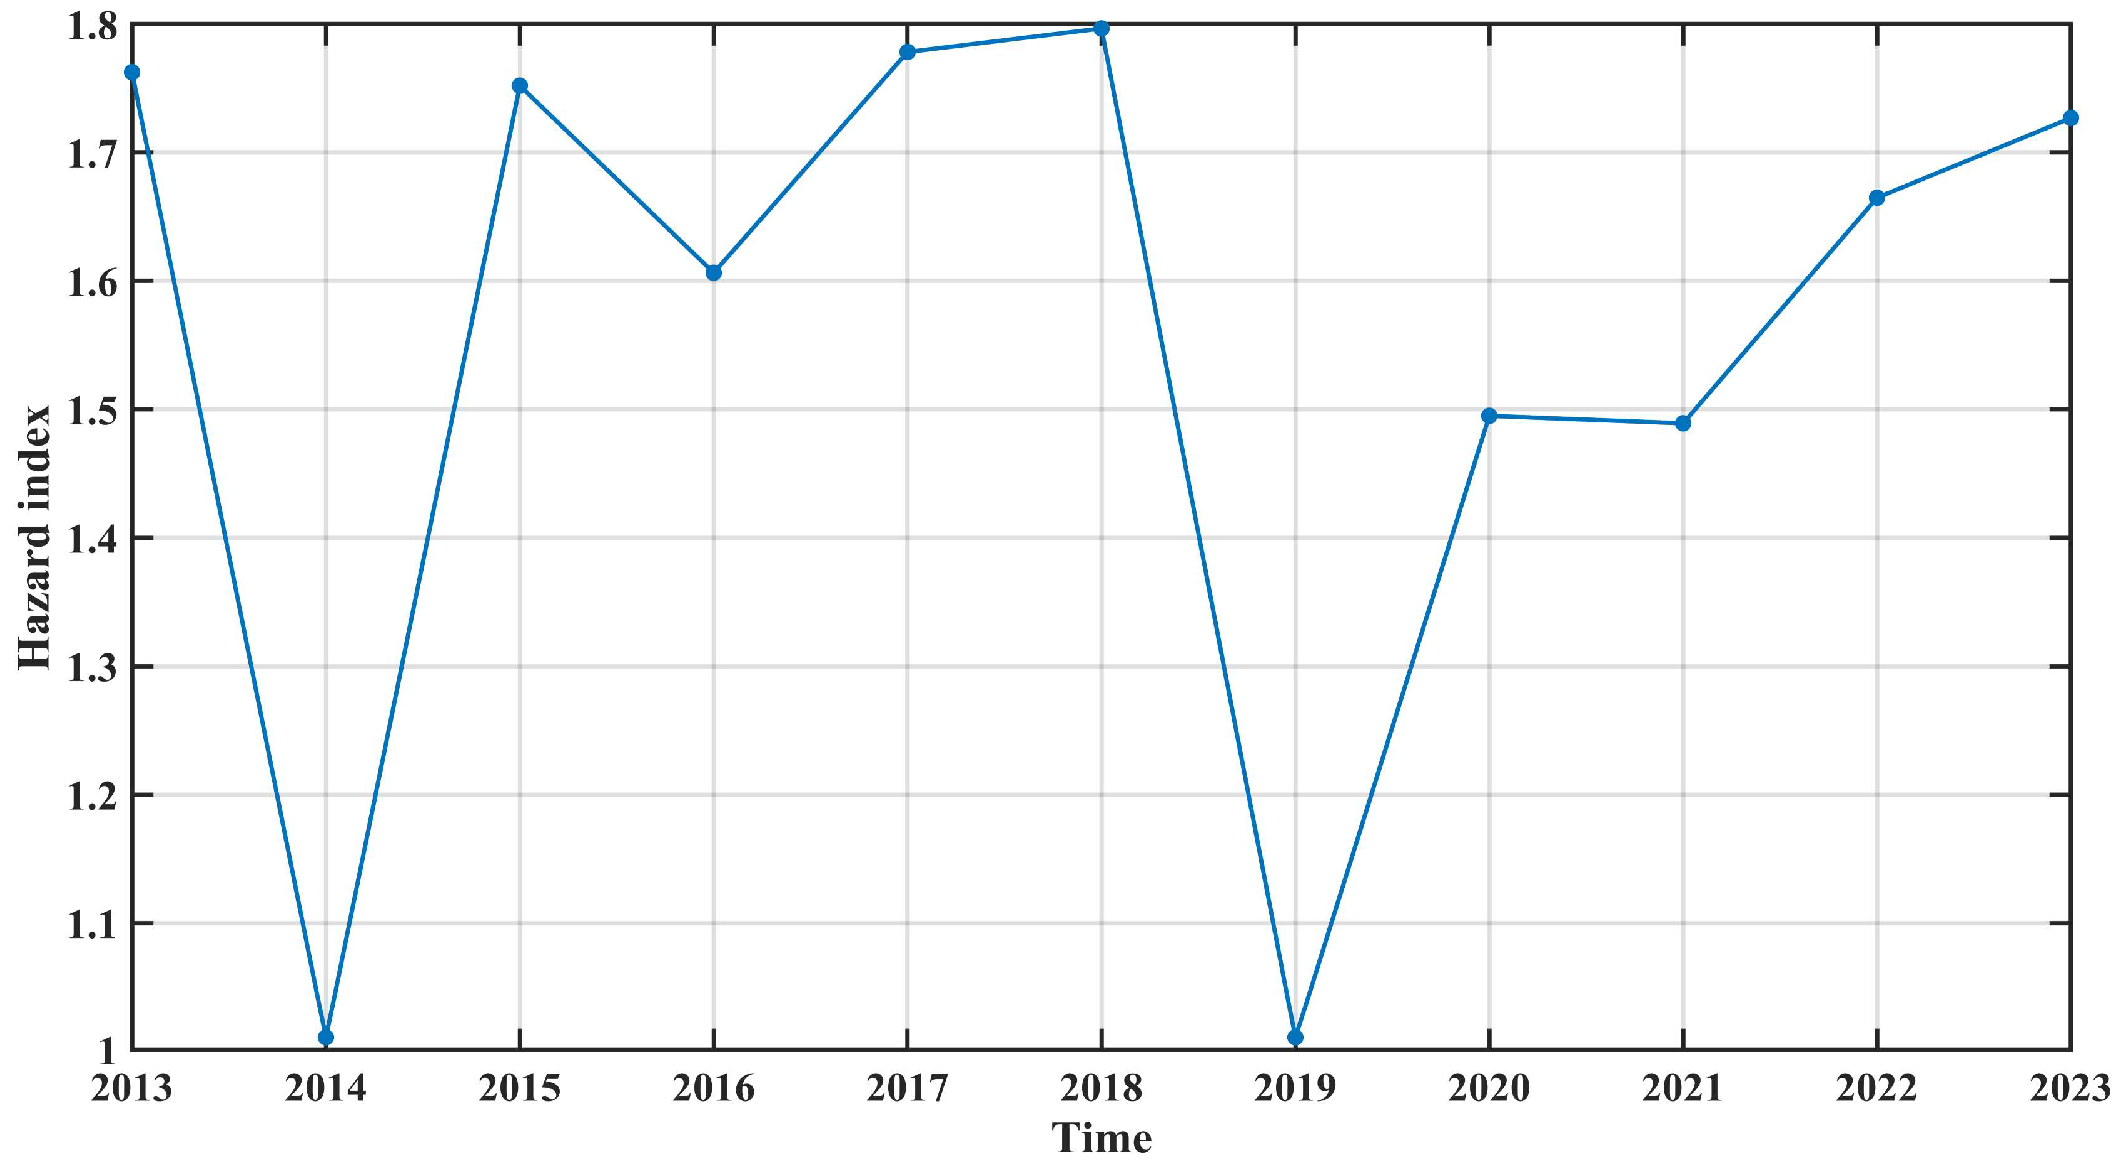
The standardized hazard index is shown in Figure 3. Because no TC events were recorded in the GBA during 2014 and 2019, the hazard index reached its minimum in both years. Meanwhile, the maximum value was recorded in 2018 and the second largest in 2017, attributed respectively to a higher storm surge and greater intensity. The secondary peak in 2017 and the maximum in 2018 correspond to Super Typhoons Hato (TC ID 1713) and Mangkhut (TC ID 1822), respectively, both of which caused severe impacts across the GBA. These cases confirm that individual high-impact events are the dominant drivers of TC hazard variability.
Figure 3.
Time series of the hazard index.
3.2. Interannual Variations in Vulnerability
In order to assess the vulnerability of the GBA, we chose four typical indicators as representative metrics to facilitate the study (Figure 4). GDP, population density, and RND exhibited relatively stable increasing trends throughout the study period. HLUE exhibits a modest upward trend over time, though less pronounced than the other three indicators, suggesting a gradual expansion of human-modified land areas.
Figure 4.
Time series of the vulnerability components for the TC risk: (a) GDP, (b) population density, (c) HLUE and RND (d).
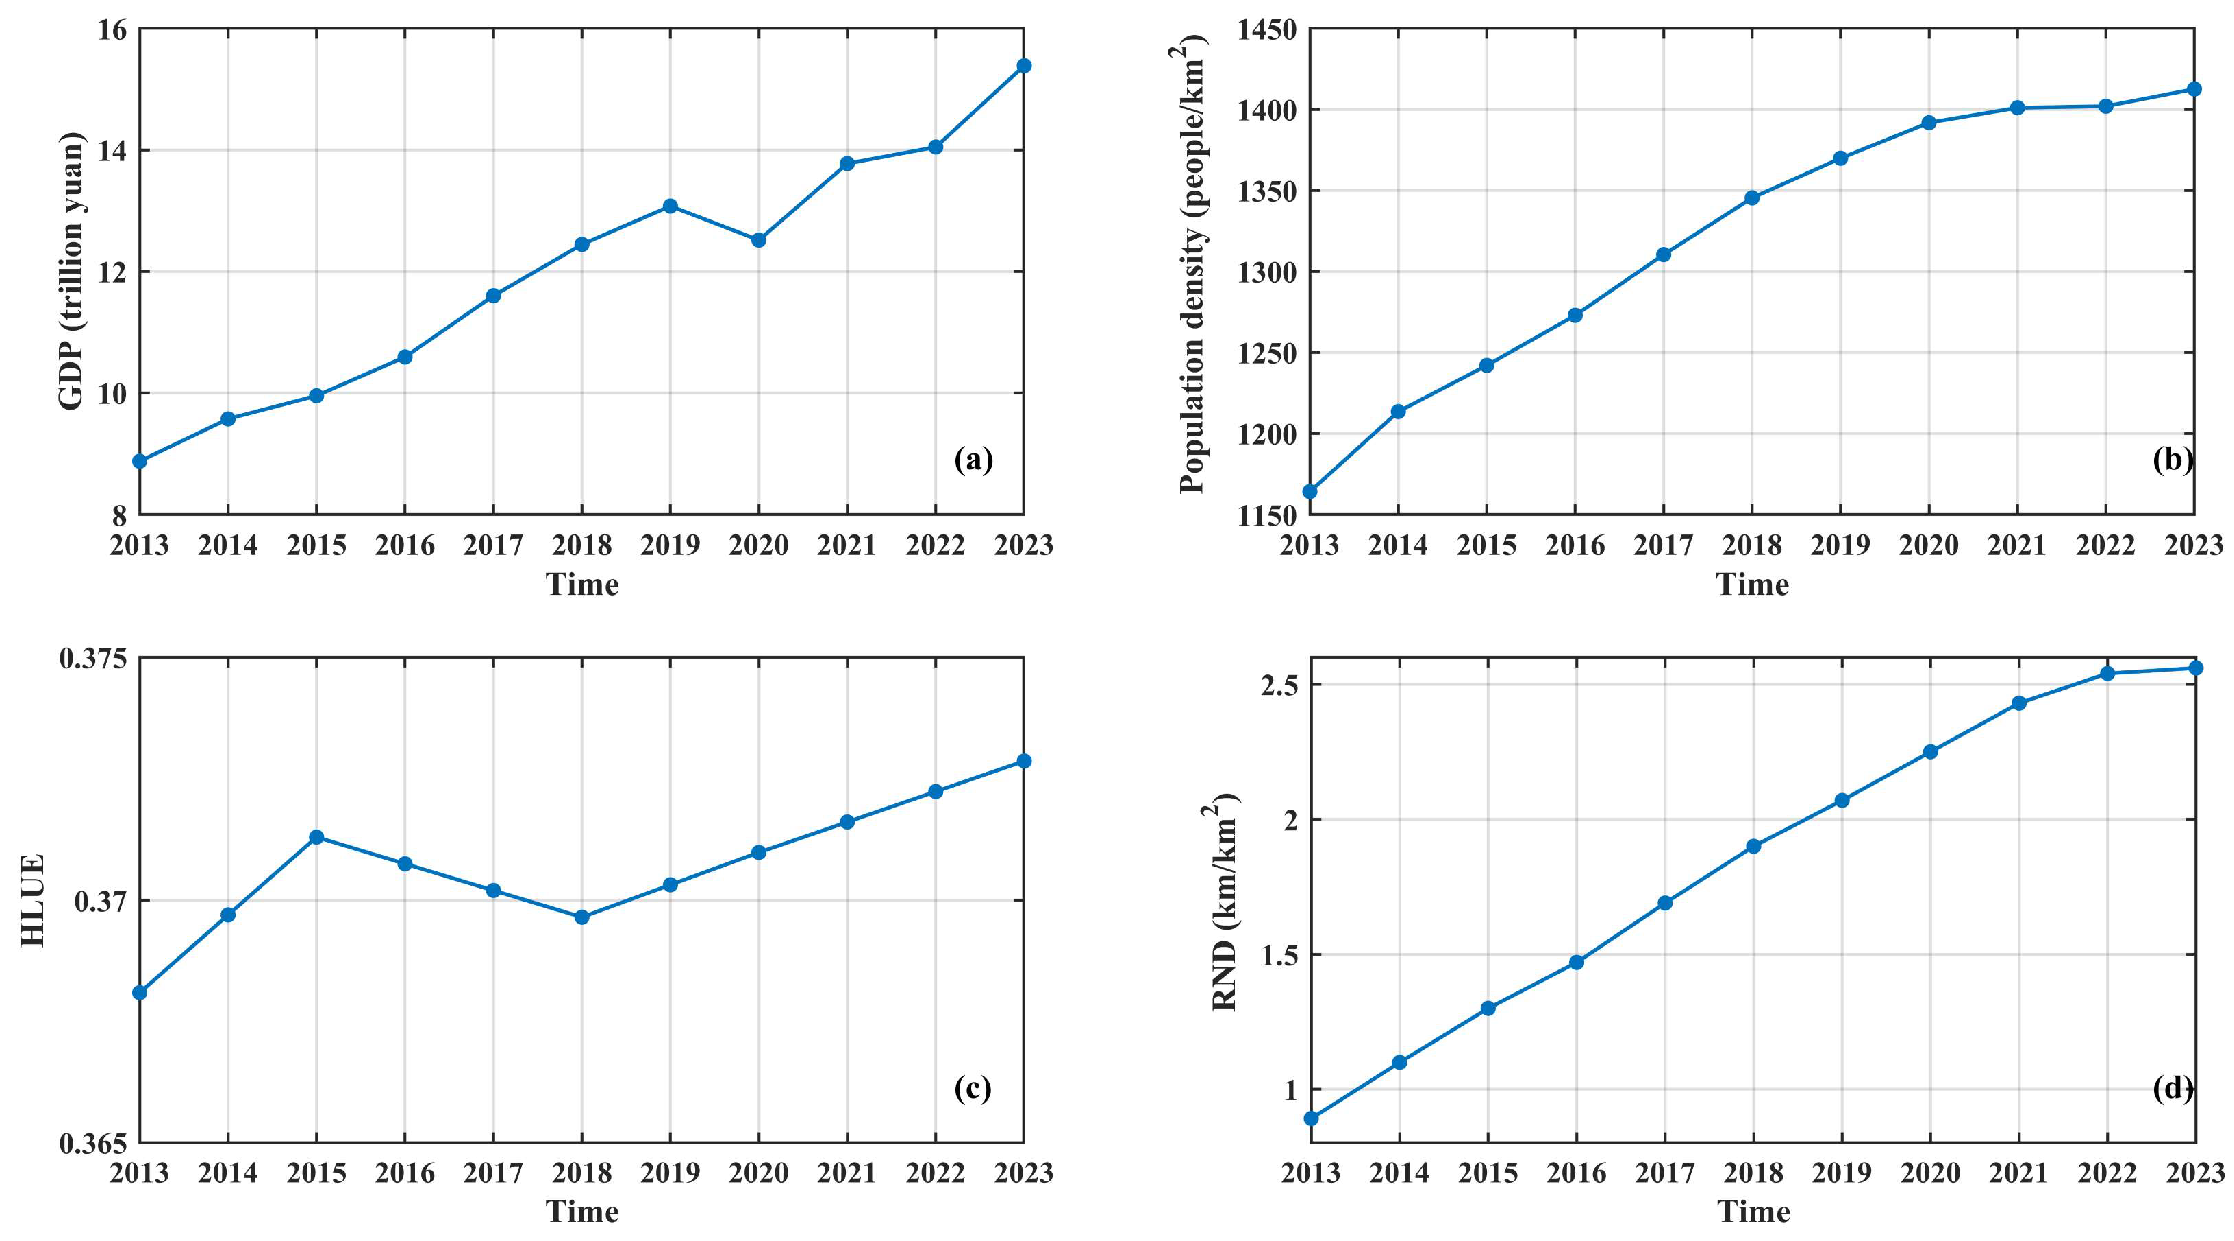
Table 3 presents the combined weights of the four vulnerability indicators, derived from the integration of AHP subjective weights and entropy-based objective weights. Among all indicators, GDP receives the highest combined weight (0.41), followed by Population density (0.26), while HLUE (0.14) and RND (0.19) receive relatively lower weights. This weighting hierarchy indicates that economic exposure and population concentration are the dominant drivers of vulnerability in the GBA, consistent with the region’s status as a highly urbanized and economically vital coastal megaregion. The relatively lower weights assigned to HLUE and RND suggest that land-use patterns and infrastructure density, while still relevant, play a secondary role in shaping the region’s overall vulnerability to tropical cyclones compared to socioeconomic factors.
Table 3.
The combined weights of indicators in the vulnerability dimension.
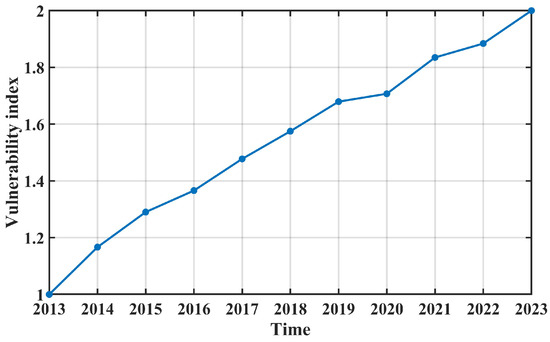
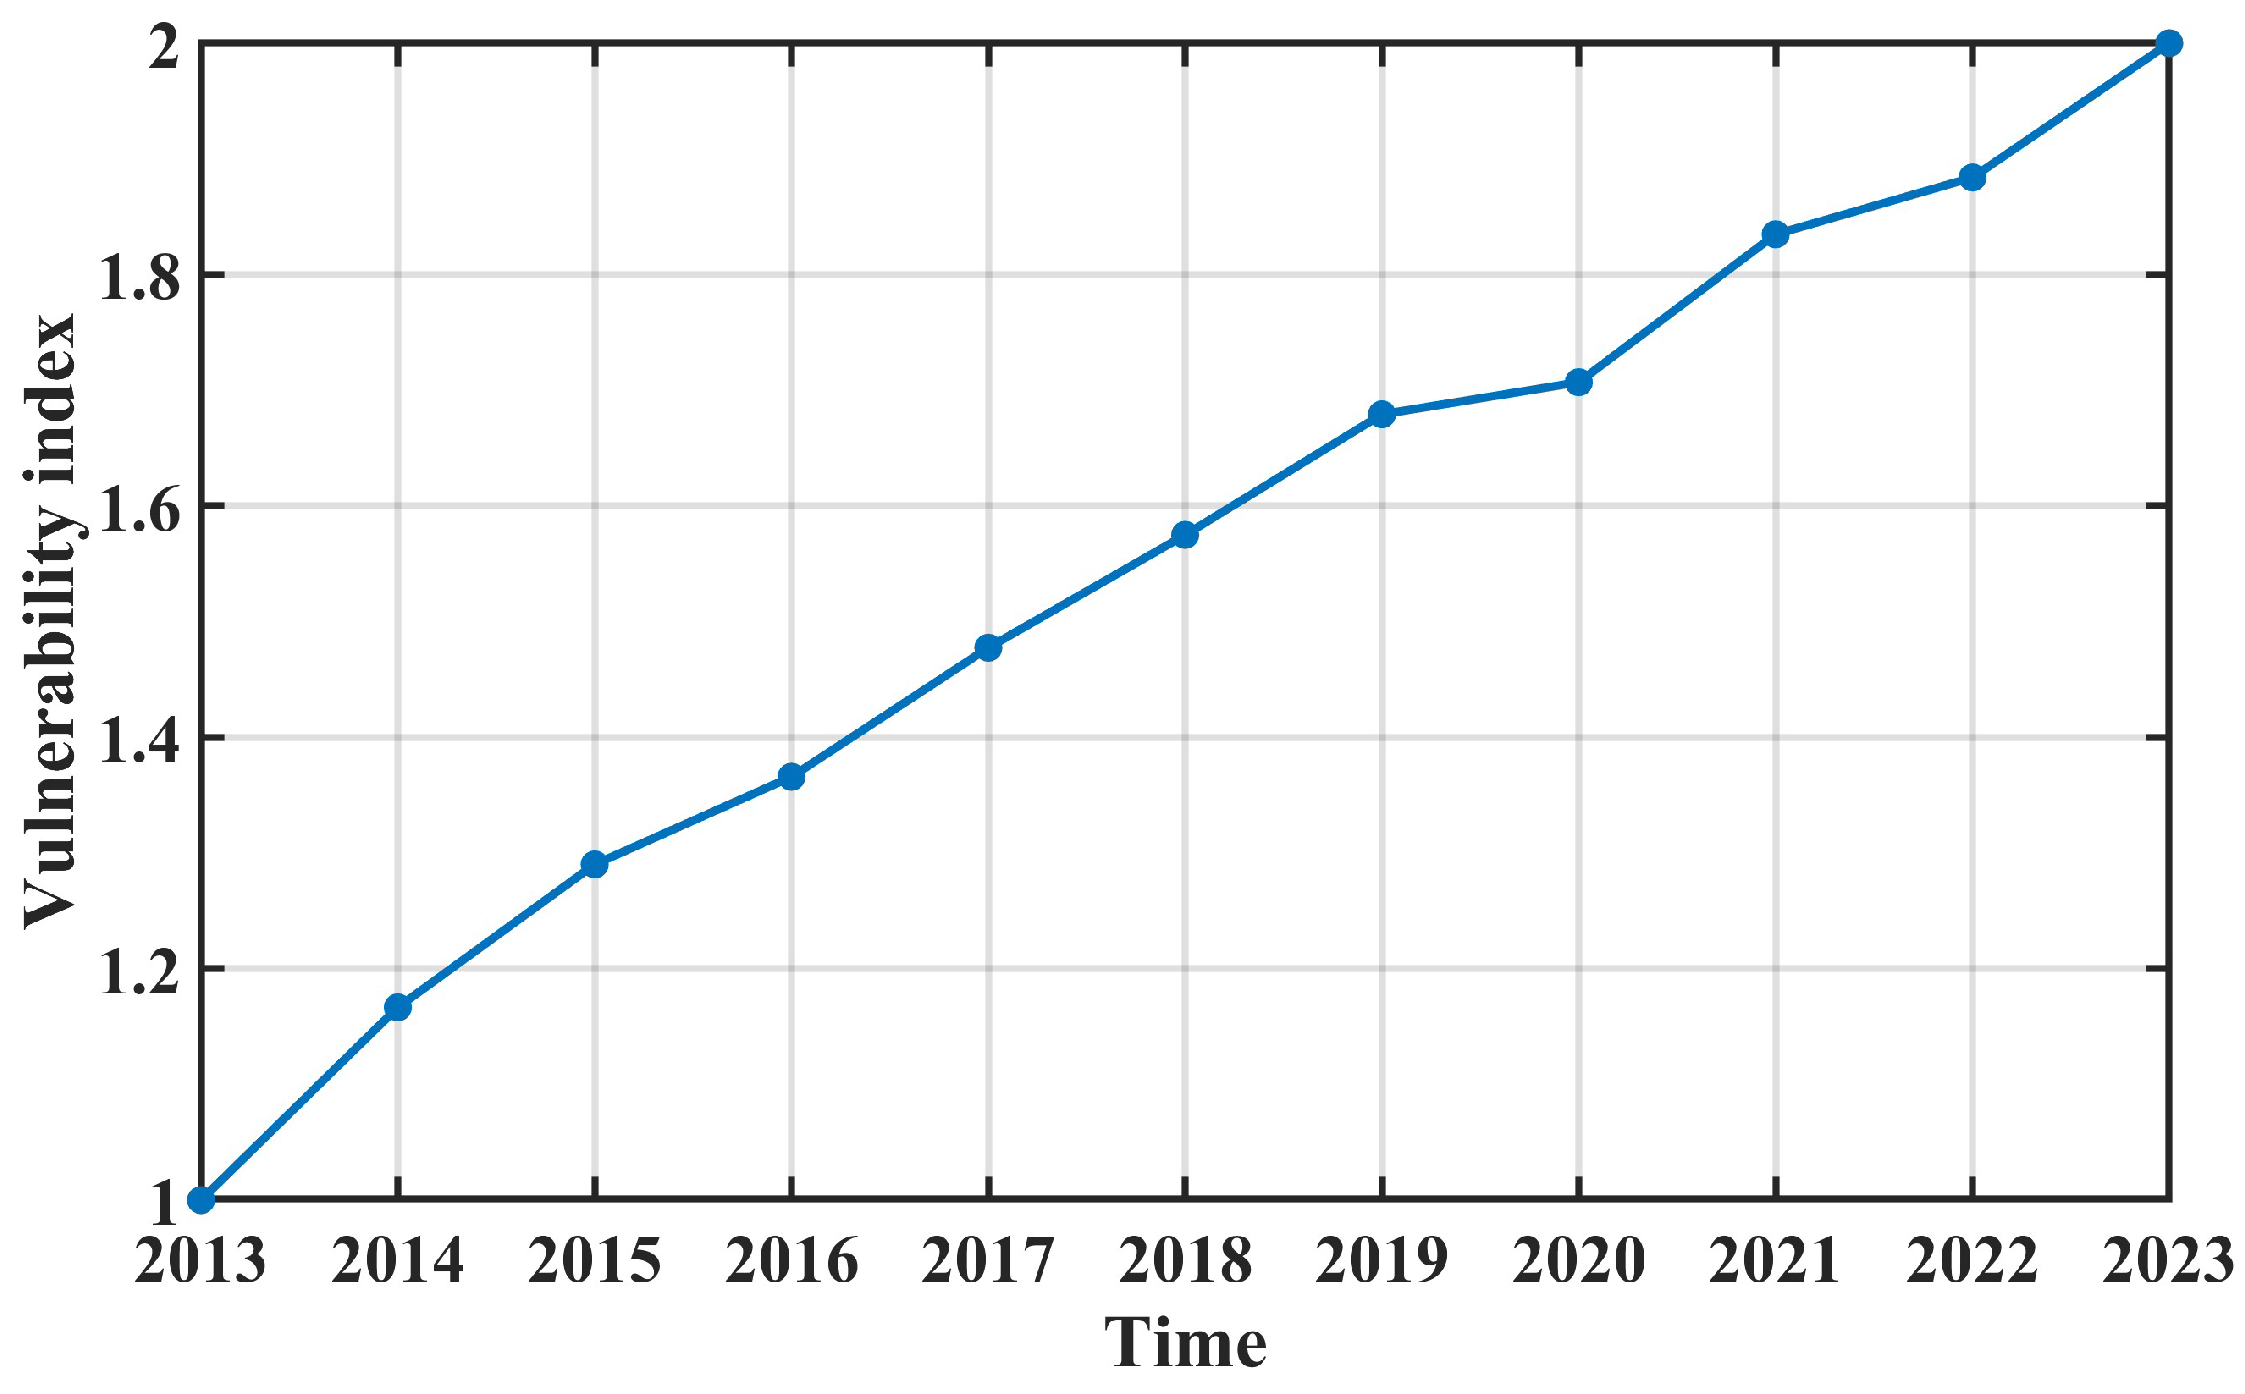
The standardized vulnerability index (Figure 5) shows an upward trend, though its growth slowed in 2020, mirroring the trend observed for GDP.
Figure 5.
Time series of the vulnerability index.
3.3. Interannual Variations in Mitigation Capacity
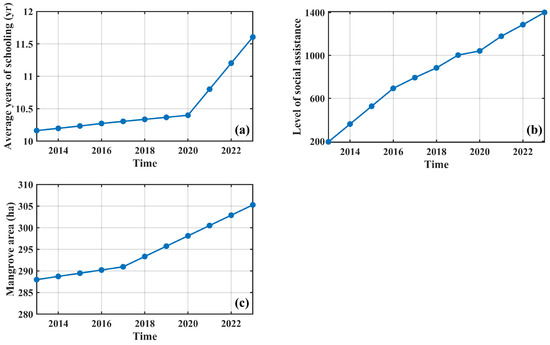
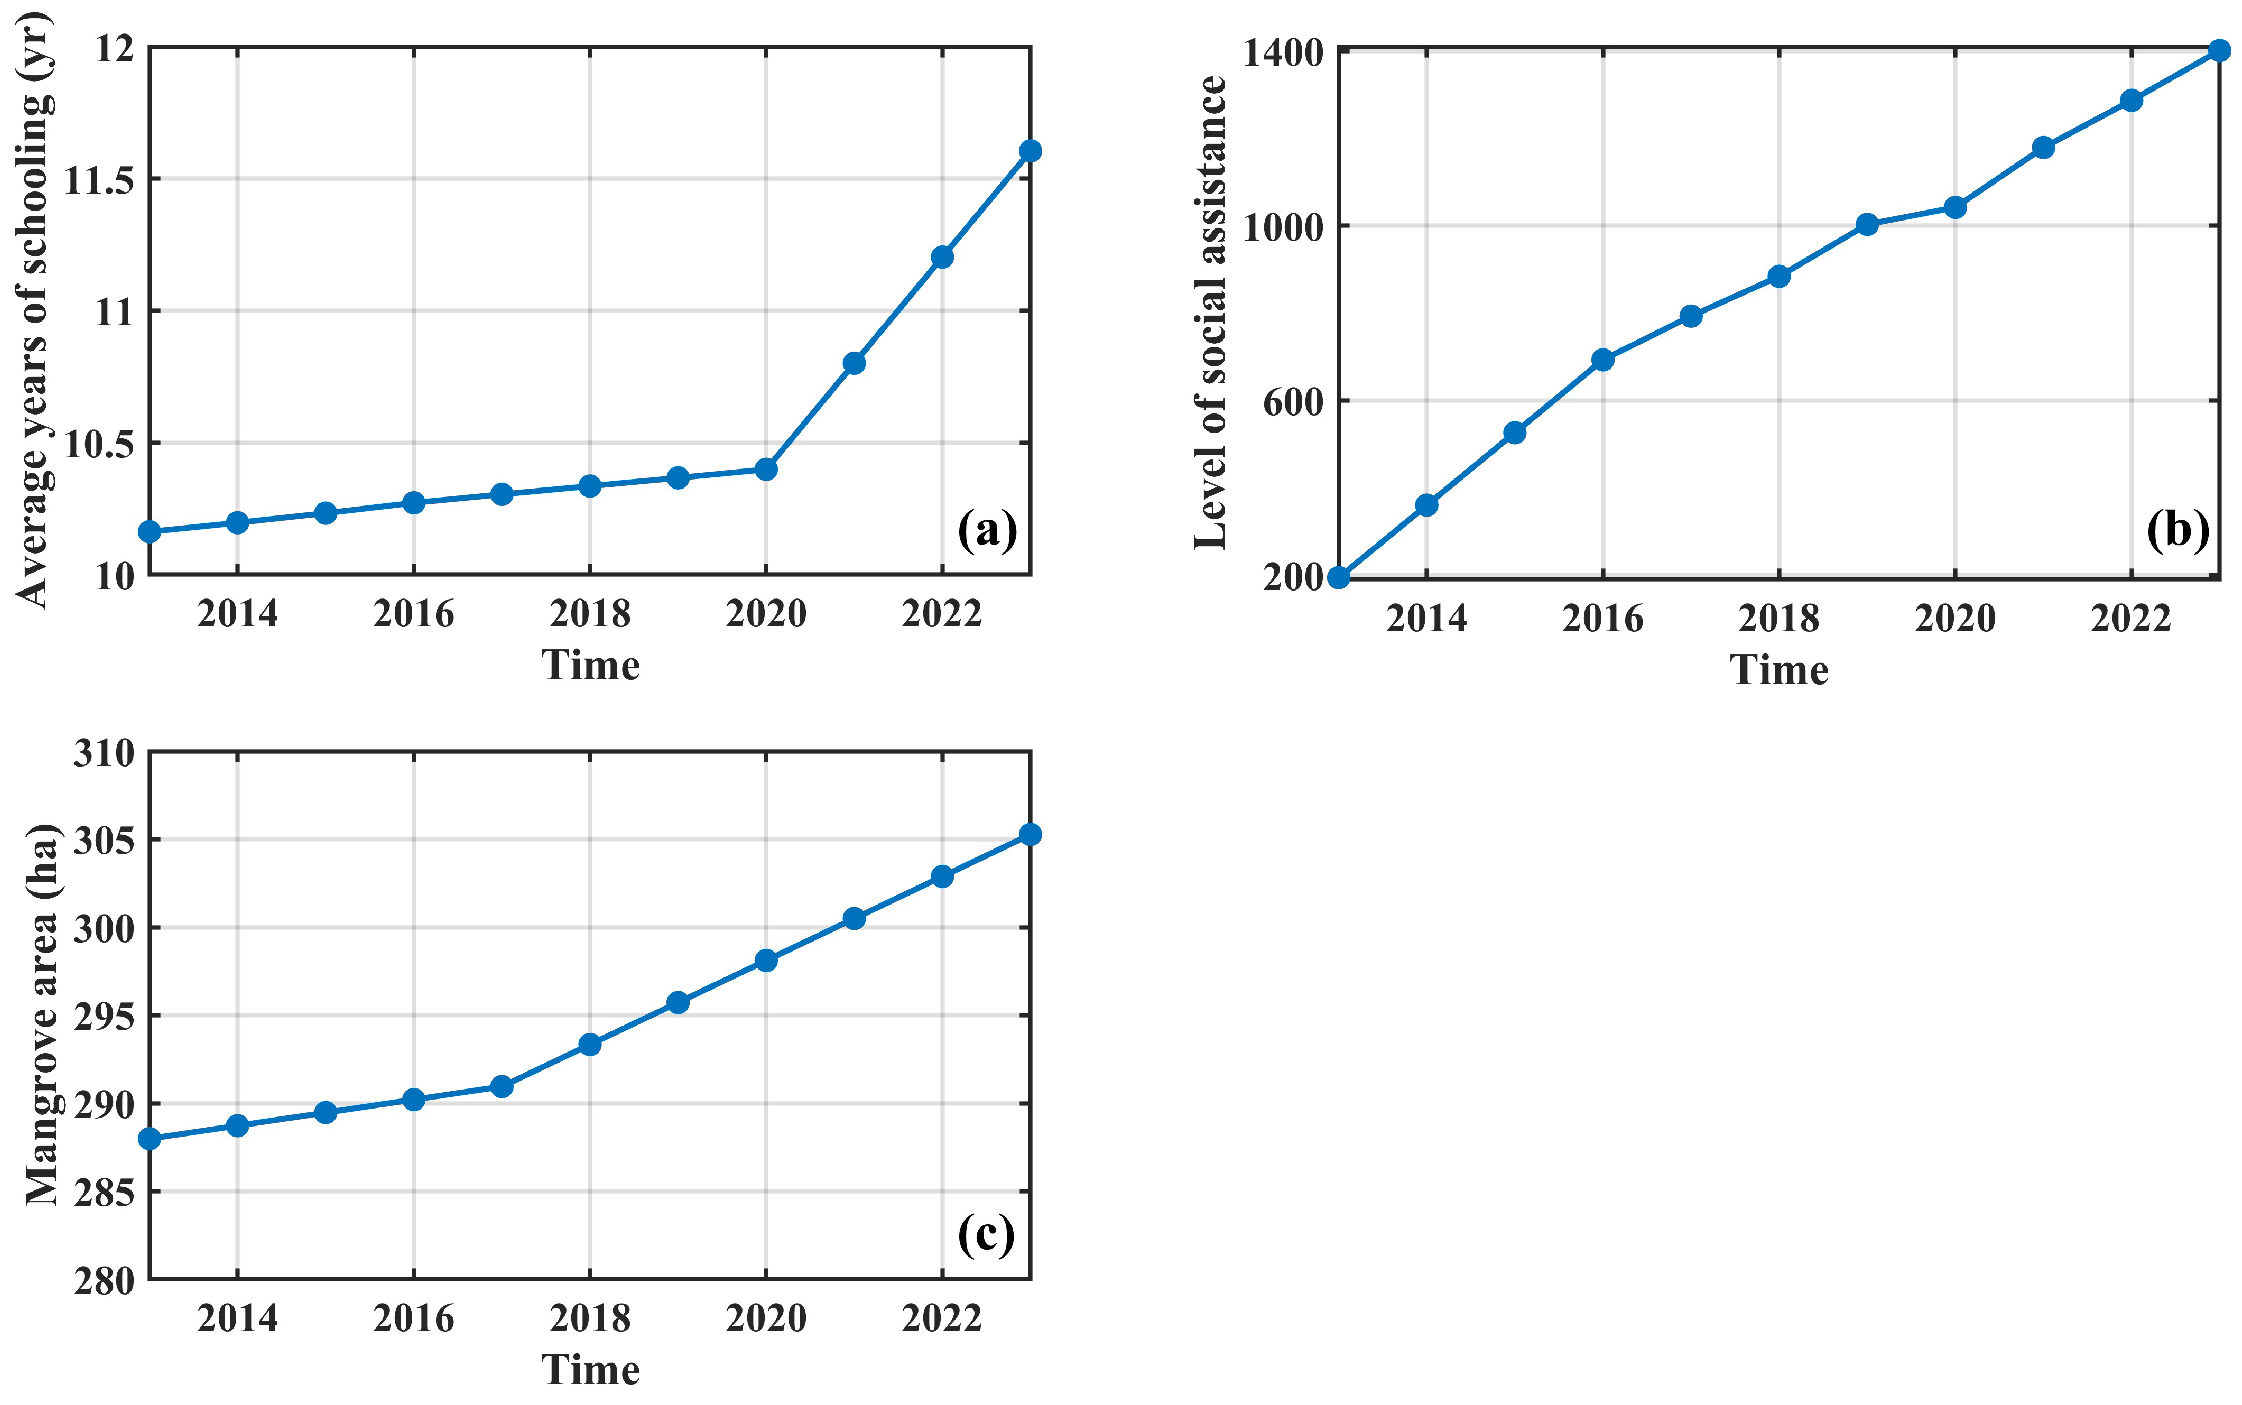
The annual variations in the three mitigation capacity indicators are shown in Figure 6. All three indices of adaptive capacity show an upward trend. Specifically, the mangrove area index grew at a faster rate after 2017 than before 2017, while the average education level index accelerated more after 2020 than before 2020. In contrast, the social assistance level index exhibited a relatively uniform growth rate.
Figure 6.
Time series of the mitigation capacity components for the TC risk: (a) average years of schooling, (b) level of social assistance and (c) mangrove area.
The combined weighting in the mitigation capacity dimension is shown in Table 4. The weighting of social assistance level is highest with the value of 0.5. This implies that the social assistance level is the most critical factor underlying mitigation capacity. Because the number and spatial accessibility of emergency relief facilities such as hospitals and shelters are the most direct and critical safeguarding factors for reducing casualties and property losses during TC disasters. The weights of mangrove area and educational attainment are similar and both are lower than that of the social assistance level, indicating that natural ecological barriers such as mangroves and the education level of residents play a supplementary role in disaster mitigation.
Table 4.
The combined weights of indicators in the mitigation capacity dimension.
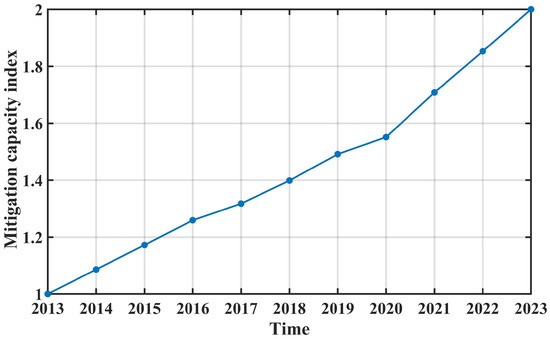
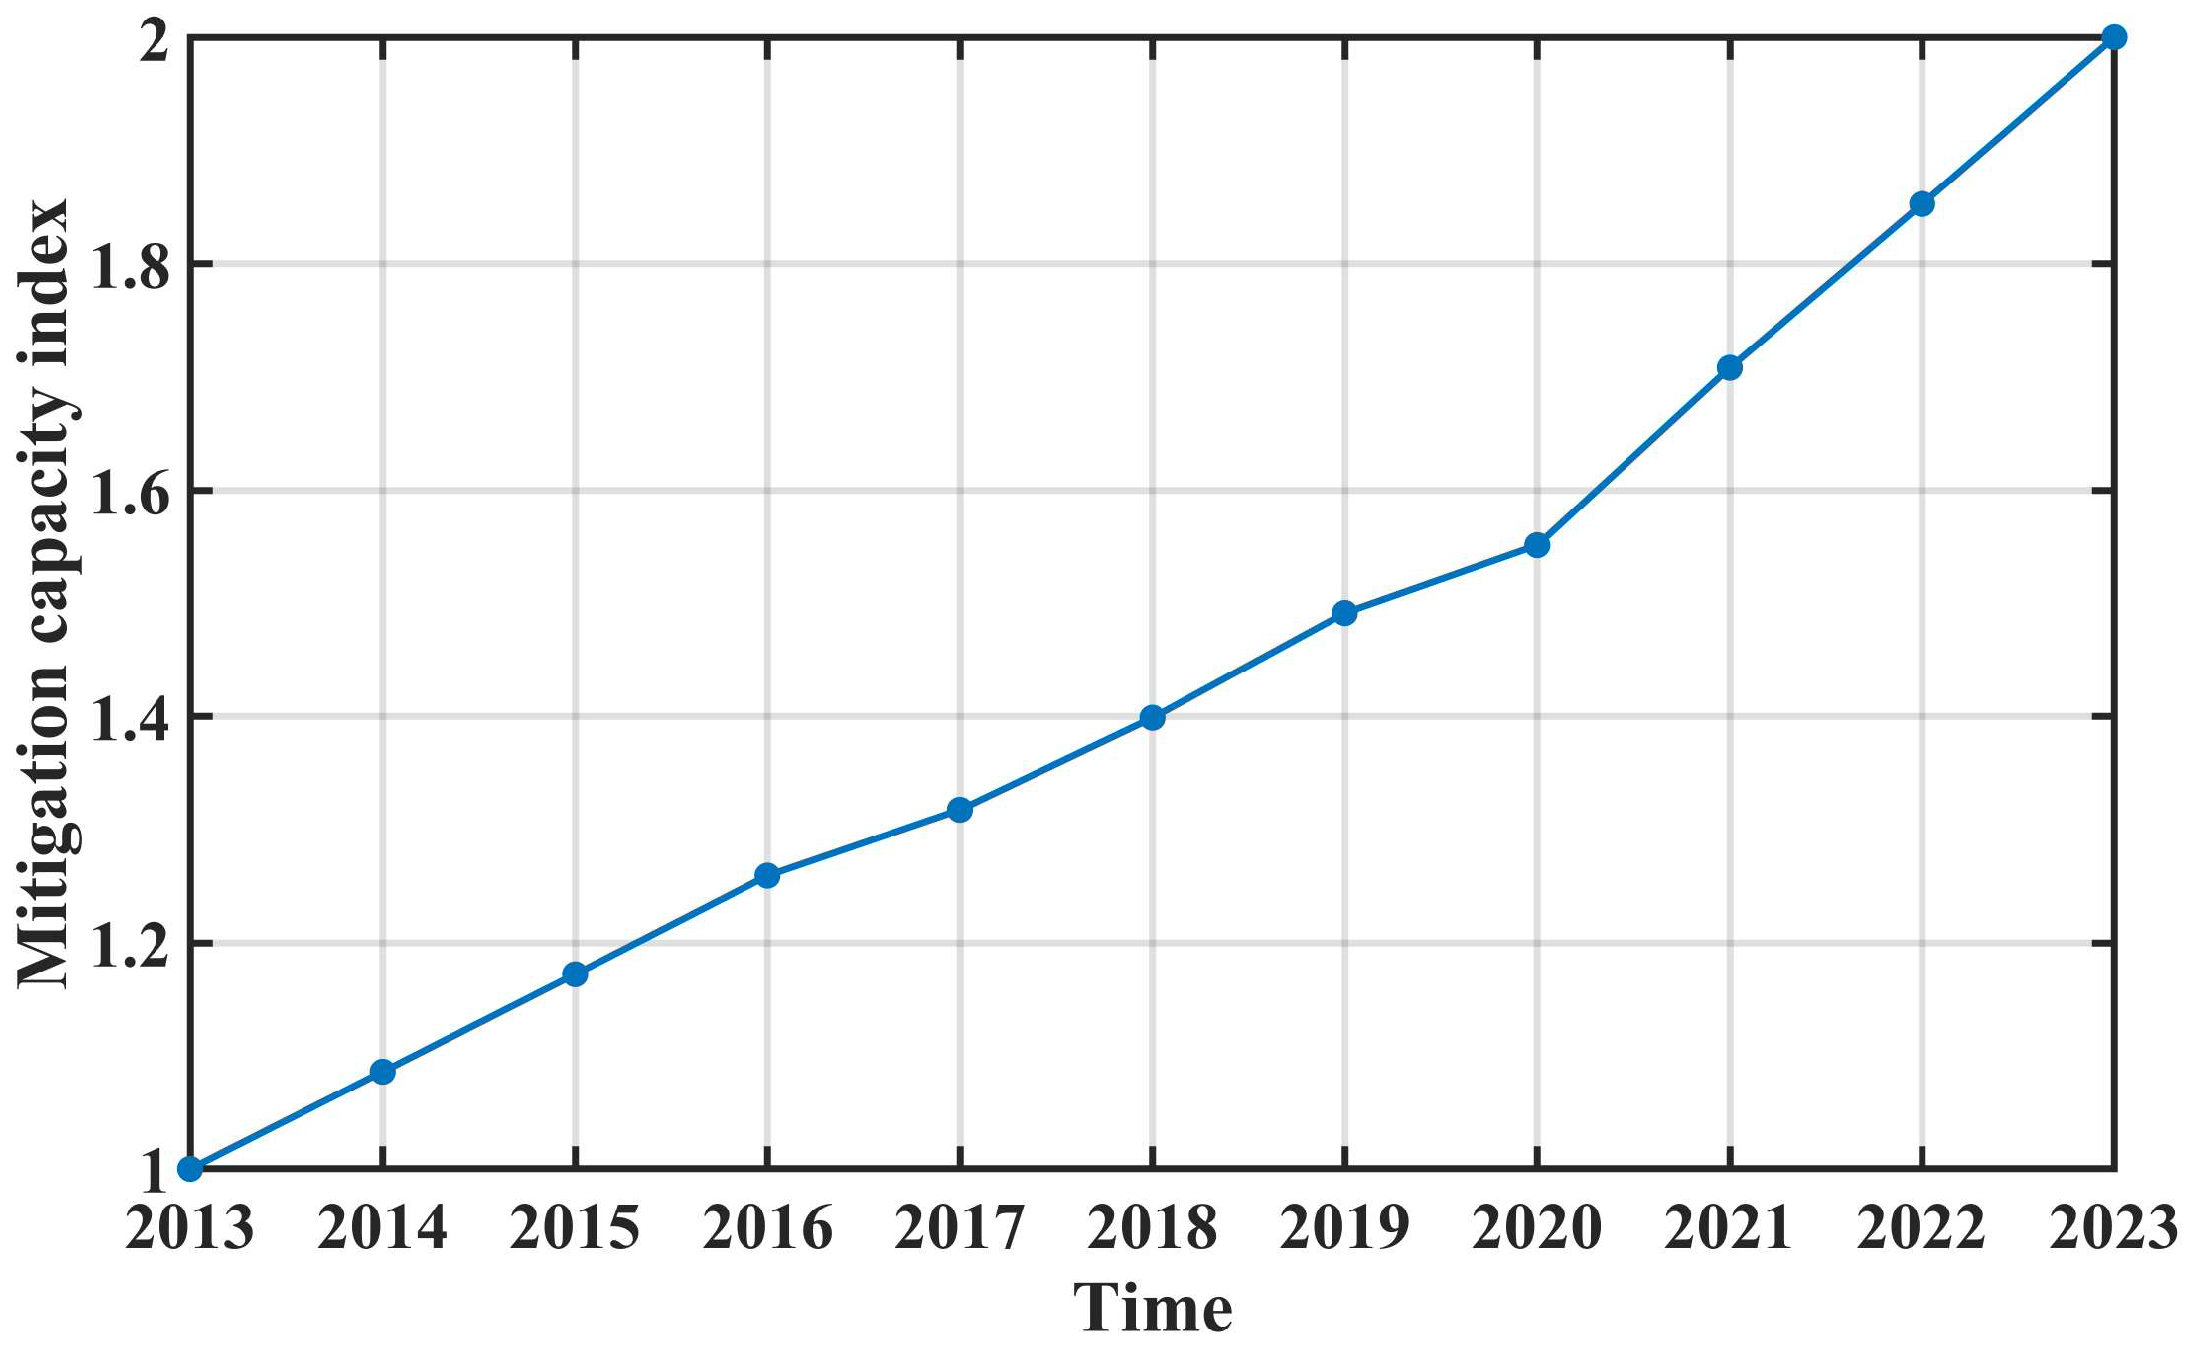
The standardized mitigation capacity index is shown in Figure 7. It also shows the upward trend. Like the variations in average education level index, it accelerated more after 2020 than before 2020.
Figure 7.
Time series of the mitigation capacity index.
3.4. Interannual Variations in Risk Index
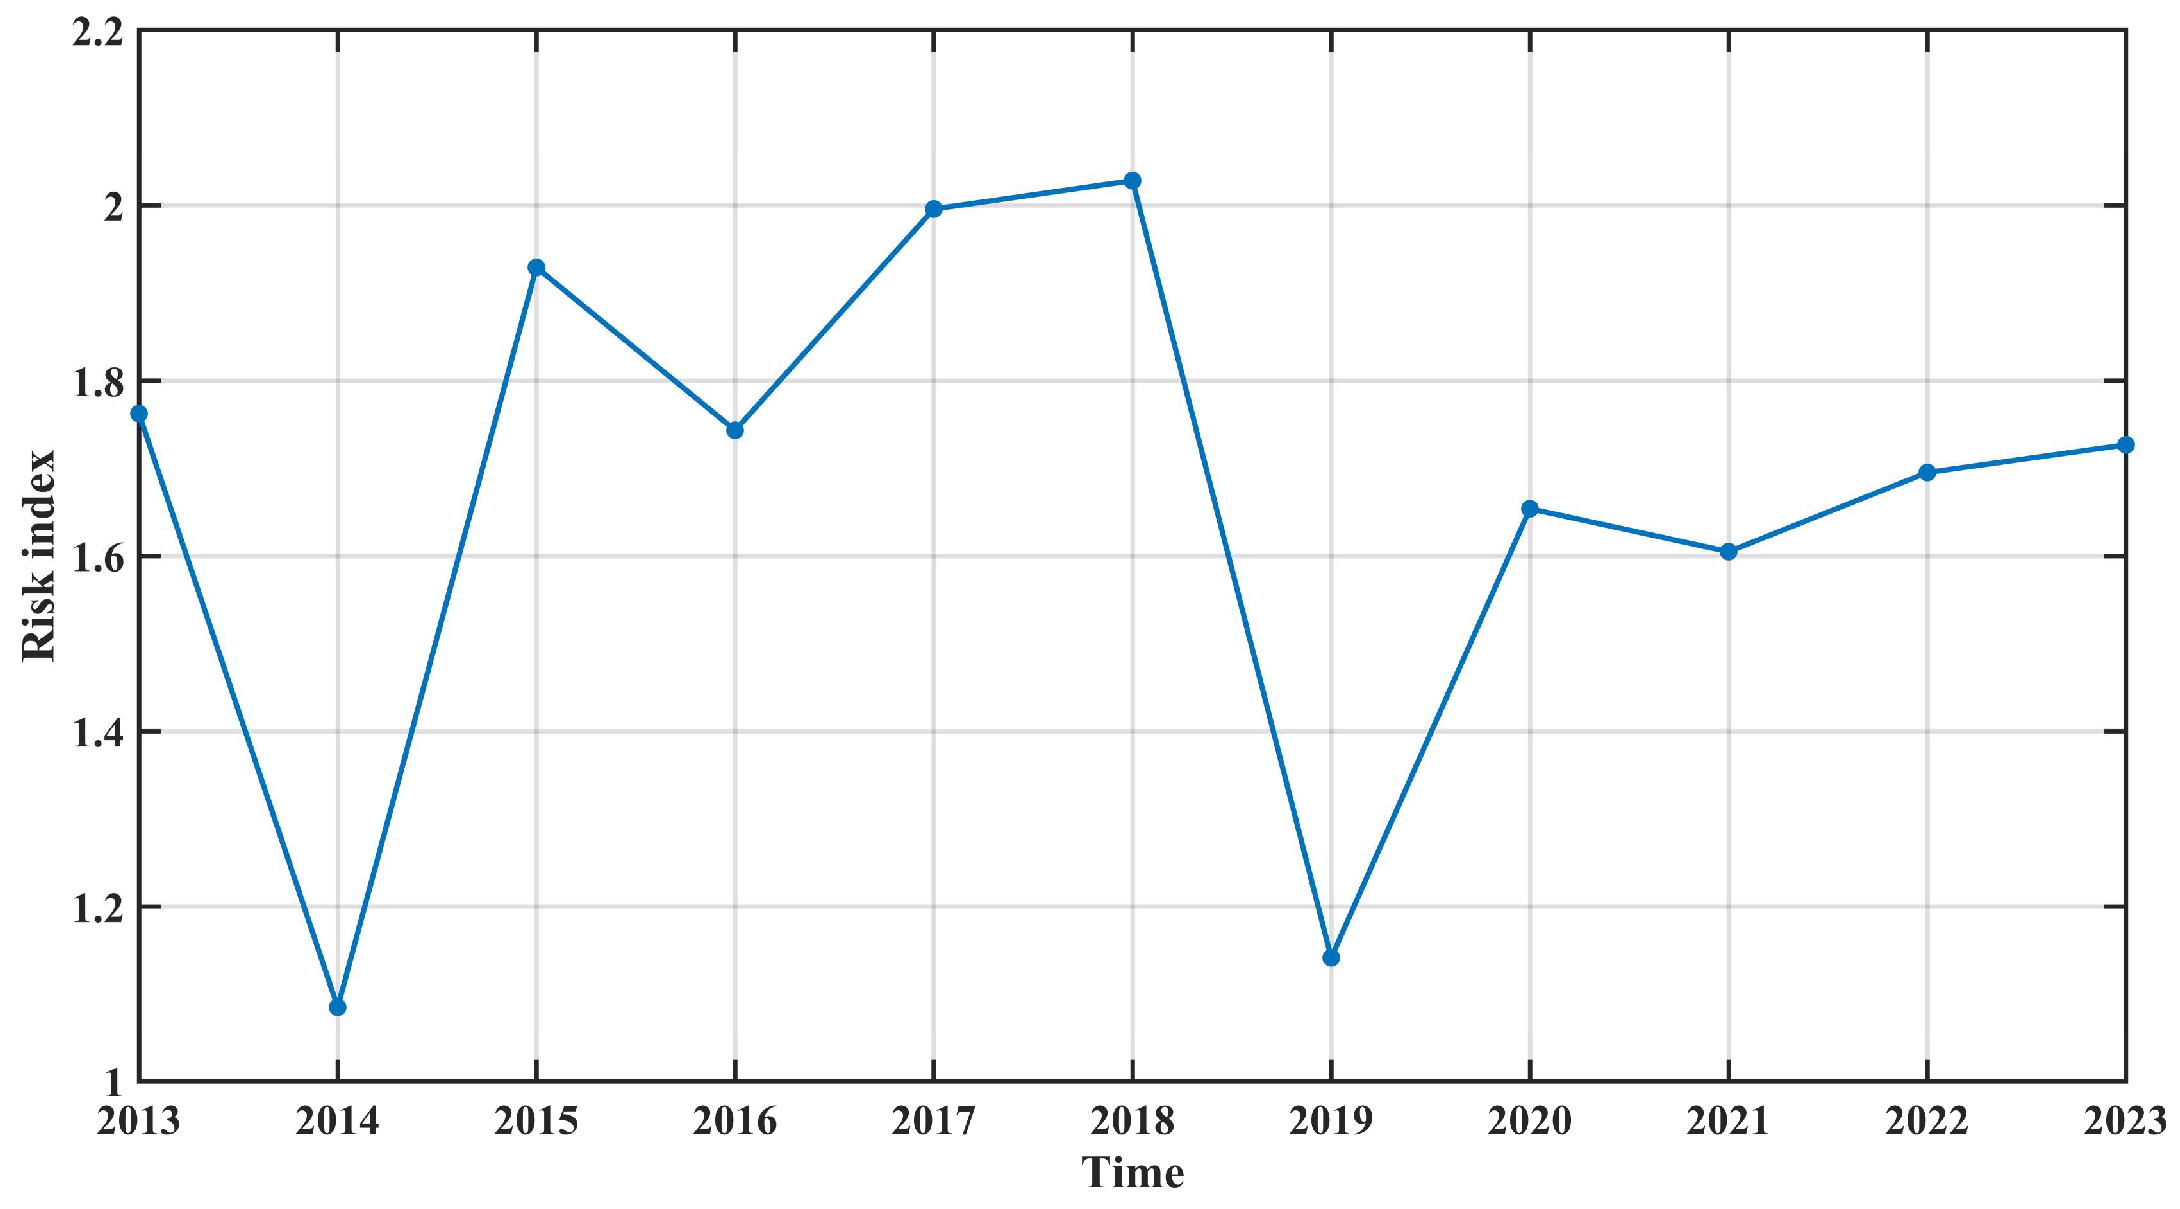
The standardized risk index is shown in Figure 8 and the extrema situation is shown in Table 5. Its variation is similar to that of the hazard index. The risk index attained its highest value in 2018. Although both 2014 and 2019 were TC-free, the risk index in 2019 was higher than in 2014. As shown in Table 5, the vulnerability-to-mitigation ratio was higher in 2019 than in 2014, reflecting a net increase in exposure relative to protective capacity over the intervening period. This finding underscores that non-hazard components—particularly the balance between socioeconomic growth and mitigation investment—play a critical role in shaping interannual risk trajectories, even in the absence of extreme events.
Table 5.
Component indices and risk index for selected years.
Figure 8.
Time series of the risk index.
3.5. Consistency Check
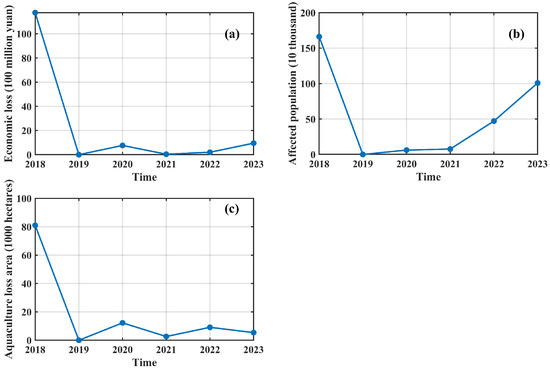
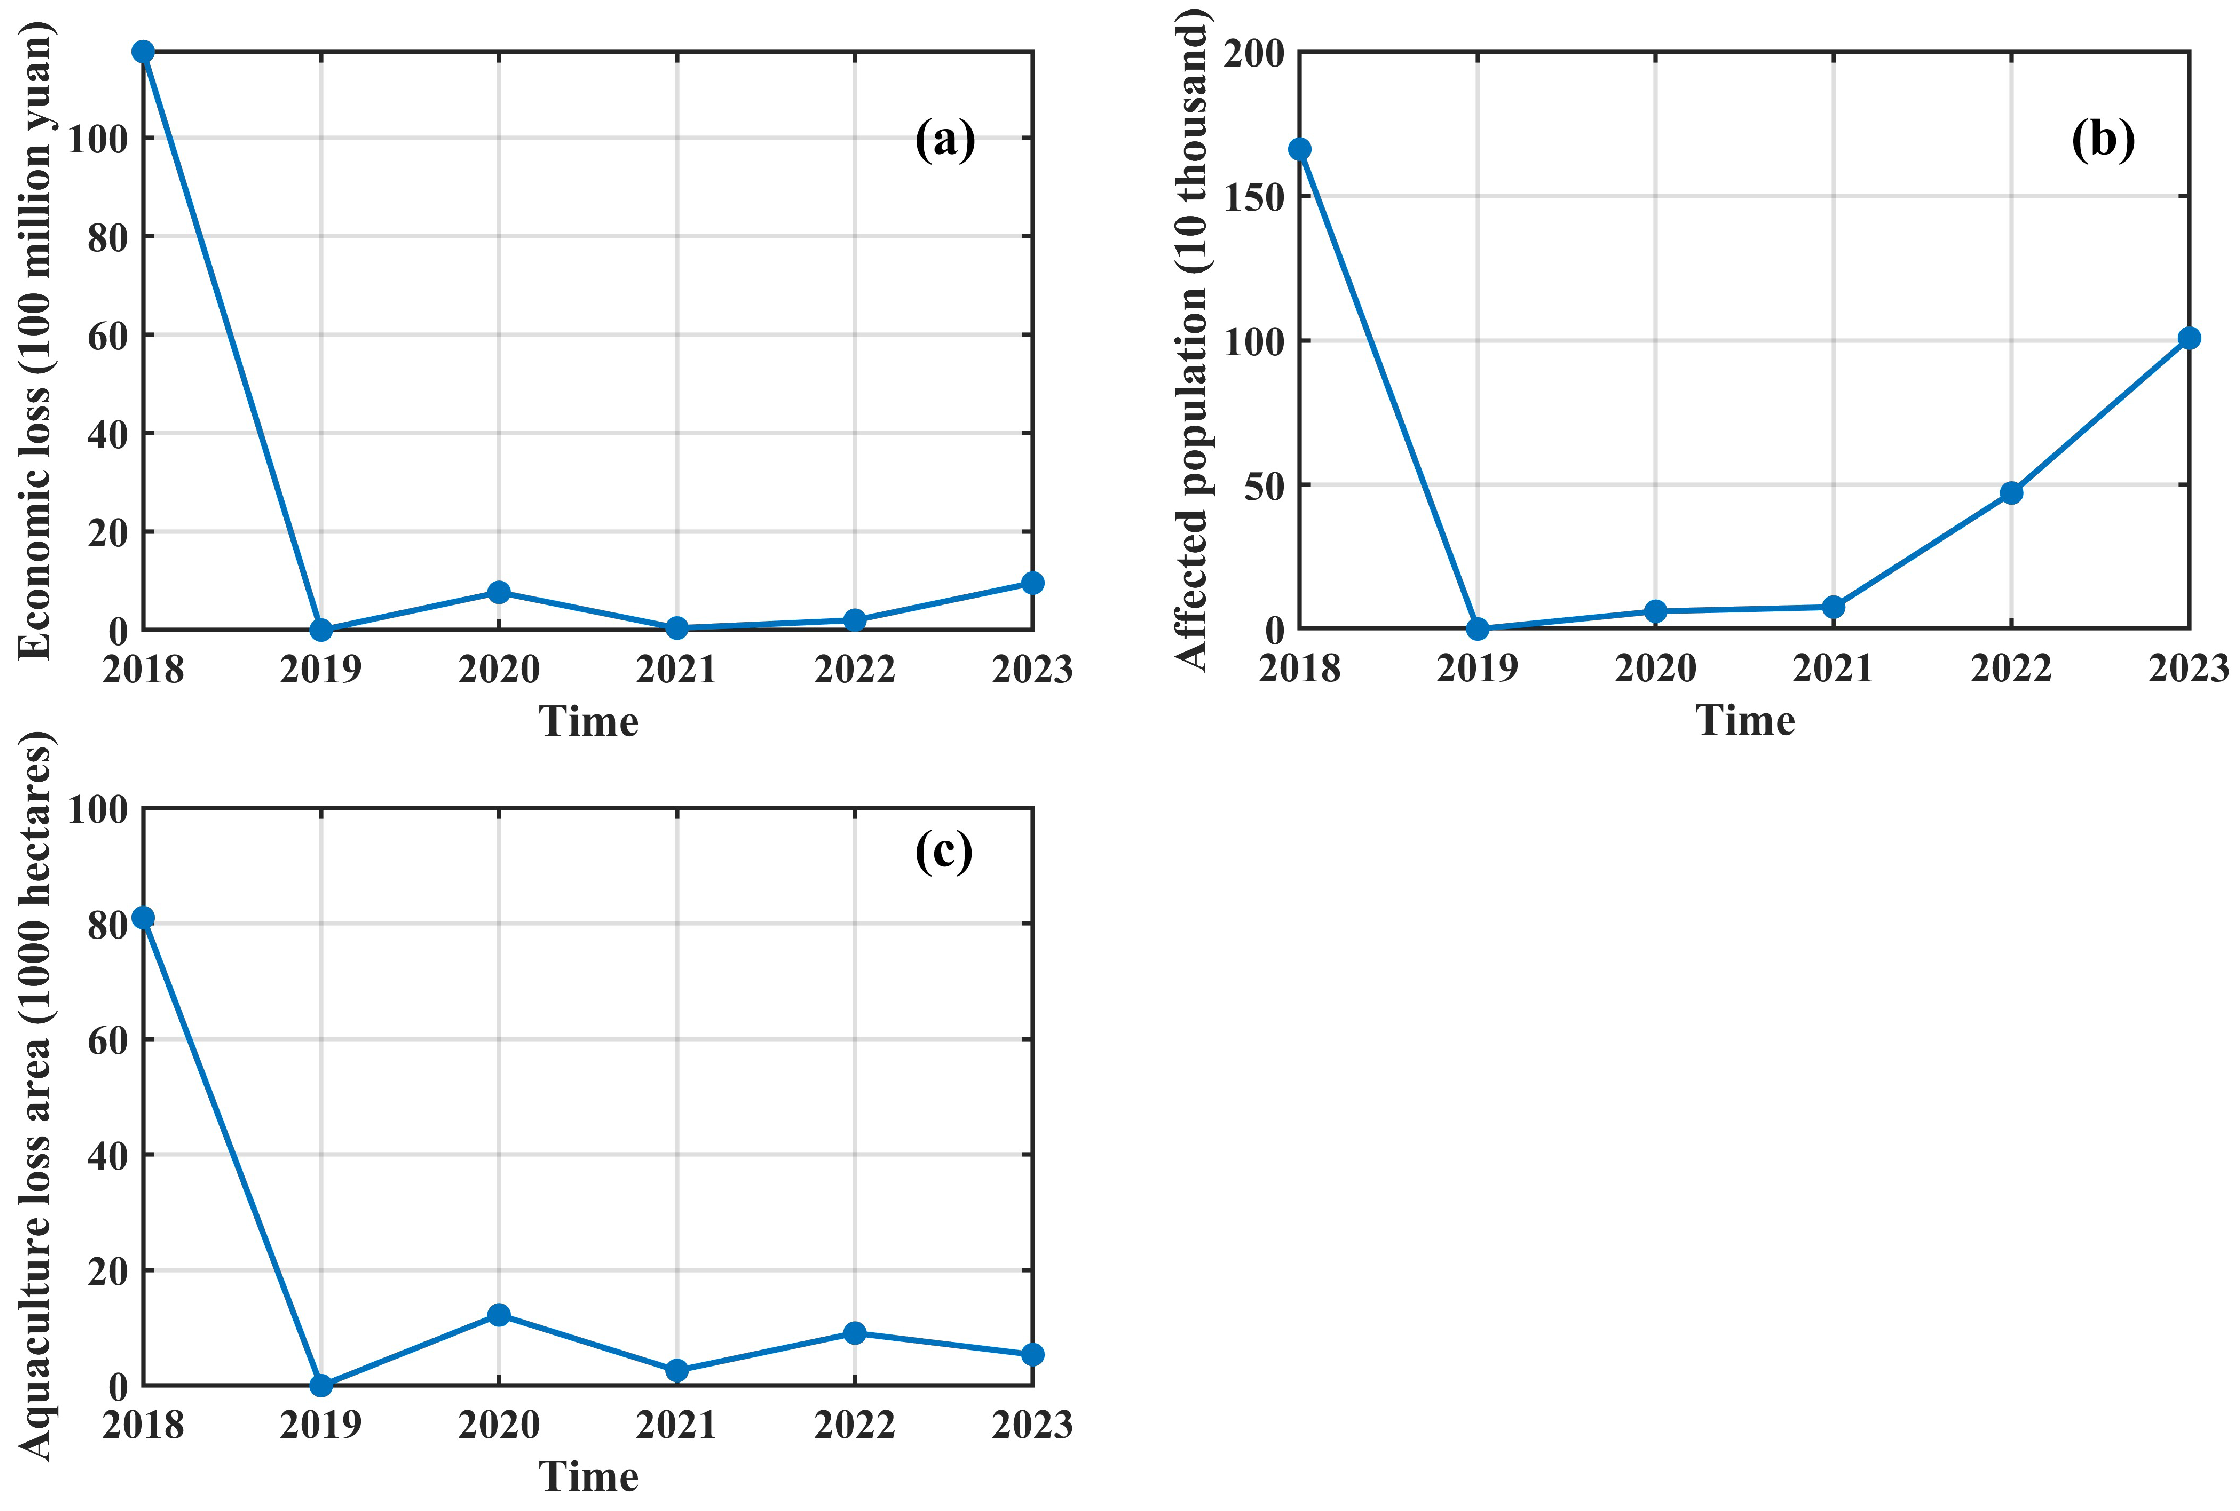
Three key indicators used to quantify TC-related impacts from 2018 to 2023 are shown in Figure 9. The three indices follow the same trend, all peaking in 2018, with their values far exceeding those of other years. Clearly, Mangkhut (TC ID 1822) inflicted extremely severe damage on the Greater Bay Area.
Figure 9.
Time series of three disaster loss indicators used in the coherence assessment: (a) economic loss, (b) affected population, and (c) aquaculture loss area.
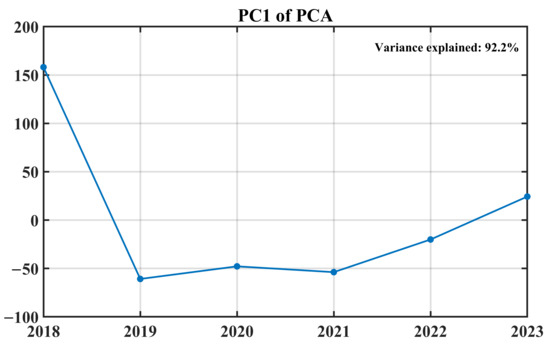
We employed PCA to extract the dominant pattern from the three loss indicators. The first principal component (PC1) explained 92.2% of the total variance, indicating that it adequately represents the combined information of the three validation indices (Figure 10). The scores are unitless composite values; positive scores indicate above-average combined losses relative to the 2018–2023 period, while negative scores indicate below-average losses.
Figure 10.
Time series of first principal component of PCA.
We then conducted a correlation analysis between PC1 and the risk index (Figure 8) over 2018–2023, yielding a correlation of r = 0.8. This suggests broad consistency between the risk index and observed loss patterns.
Several important caveats apply. First, this analysis is not an independent validation, as some input indicators to the risk index (e.g., GDP, population density) are drawn from statistical sources that may overlap with the loss data. Second, the analysis window is limited to six years (2018–2023), constrained by the availability of consistent disaster loss statistics for the GBA as an integrated unit. With only six annual observations, the correlation (r = 0.8) has a wide 95% confidence interval (approximately −0.08 to 0.97), indicating that the strength of the relationship is statistically fragile. We therefore interpret this result as a consistency check rather than a formal validation.
The coherence check against observed losses should not be overinterpreted as evidence of predictive capability. Low-loss years could reflect either low hazard materialization or effective disaster response—a distinction our composite index cannot resolve. Future work incorporating counterfactual scenarios or formal attribution methods would be needed to separate these effects.
4. Discussion
4.1. Bootstrap of Entropy Weights
Bootstrap resampling (1000 iterations) of the entropy weights (Table 6) indicates that while the top-ranked indicators in each dimension are relatively stable, the weights of lower-ranked indicators are subject to substantial sampling uncertainty due to the limited sample size (n = 11). Therefore, the exact weight values should be interpreted with caution, although the overall dominance of the key drivers (Average years of schooling, Total duration, GDP) appears robust.
Table 6.
Bootstrap results of entropy weights for all indicators.
4.2. Uncertainty in OSM-Derived Indicators
Road network density and social assistance level—both derived from OpenStreetMap (OSM)—may be subject to improved data completeness over time, as OSM coverage in China expanded substantially during 2013–2023. This temporal improvement may partly contribute to the observed increasing trends, independent of actual infrastructure growth. Therefore, the magnitude of the mitigation capacity increase—and the associated risk reduction—should be interpreted with caution, although the directional trend is consistent with known regional development policies. We emphasize that our risk index is designed for relative interannual comparison rather than absolute risk quantification. And future work with independently verified data would be valuable to confirm the exact rate of change.
4.3. Implications for TC Risk Management in the GBA
The temporal patterns identified in this study offer several practical insights for disaster risk reduction in the GBA. First, with hazard held constant across the two TC-free years (2014 and 2019), the higher risk in 2019 must be attributed solely to changes in vulnerability and mitigation capacity, demonstrating that non-hazard components independently shape annual risk. This suggests that disaster management strategies should not focus solely on hazard forecasting but should equally prioritize long-term investments in mitigation infrastructure and socioeconomic resilience.
Second, the steady increase in the vulnerability-to-mitigation ratio over the study period implies that economic growth in the GBA has, to some extent, outpaced the expansion of protective capacity. This is particularly relevant for rapidly developing peripheral cities within the GBA, where population and GDP growth may proceed faster than the construction of hospitals, shelters, and other mitigation facilities. Targeted resilience investments in these areas could help offset the rising risk pressure.
Third, the finding that the risk index in 2019 exceeded that in 2014—despite no TC events in either year—underscores the importance of regularly updating risk assessments as socioeconomic conditions evolve. Static risk maps based on a single year may become outdated quickly in a rapidly developing region like the GBA, and our framework offers a replicable approach for annual monitoring.
4.4. Comparison with Previous TC Risk Studies
The findings of this study are broadly consistent with previous composite-index-based TC risk assessments in coastal China [17,28,30], which have similarly identified socioeconomic exposure as a dominant driver of vulnerability. However, our study extends this literature by explicitly quantifying the temporal dynamics of risk at an annual resolution, whereas most previous studies have focused on either spatial heterogeneity at a single time point or long-term climate projections.
In addition, our results reinforce this finding by showing that even in TC-free years, the balance between vulnerability and mitigation capacity can shift substantially, affecting baseline risk levels. This highlights the value of tracking non-hazard components in annual risk monitoring—an approach that has received relatively limited attention in previous studies.
5. Conclusions
This study developed a systematic framework for assessing the temporal dynamics of TC risk in the GBA from 2013 to 2023 by integrating hazard, vulnerability, and mitigation capacity into a unified composite index and employing the AHP-IoE weighting method. The principal findings are as follows:
- While TC duration and average intensity exhibited relative stability, maximum storm surge and extreme precipitation displayed pronounced interannual fluctuations, emerging as the primary drivers of hazard index variability. The hazard index peaked in 2018, and recorded secondary maximum in 2017, corresponding to the two super typhoons respectively, confirming that individual high-impact events largely govern the pattern of TC hazard.
- GDP and population density together accounted for over 50% of the total weight in the vulnerability dimension, underscoring that the concentration of economic assets and population remains the dominant contributor to regional vulnerability. The index showed an upward trend, though its growth slowed in 2020.
- All three mitigation capacity indicators—social assistance level, educational attainment, and mangrove area—demonstrated consistent upward trajectories. Notably, the mitigation index accelerated after 2020, driven primarily by improvements in education and continued expansion of mangrove coverage.
- The risk index broadly mirrors the hazard index, peaking in 2018. Although both 2014 and 2019 were TC-free, the risk index in 2019 exceeded that in 2014, owing to a higher vulnerability-to-mitigation ratio. This suggests that the evolving balance between socioeconomic exposure and protective capacity plays a critical role in shaping annual risk, independent of hazard occurrence.
- To assess the coherence of our risk index with actual impacts, we compared it against three disaster loss indicators (economic loss, affected population, and aquaculture loss area) from 2018 to 2023 using PCA. The first principal component (PC1), explaining 92.2% of the total variance, showed a correlation of r = 0.8 with the risk index.
- Bootstrap resampling showed that the top-ranked indicators are robust, but lower-ranked weights are uncertain due to the small sample (n = 11). OSM-derived indicators may partly reflect improved data coverage rather than real growth. Therefore, while the overall trends are reliable, the magnitudes—especially of mitigation capacity and risk reduction—should be interpreted with caution.
In conclusion, this study provides a temporally explicit assessment of TC risk in one of the world’s most economically vital and hazard-prone coastal regions. These findings offer methodological support for regional disaster risk monitoring and a scientific basis for coastal megaregions to address TC-related risks under a changing climate.
Author Contributions
M.Z. (Manli Zheng): study design, data analysis, data interpretation, writing—original draft; M.Z. (Mingli Zhao): writing—review and editing; X.S.: review and editing. All authors have read and agreed to the published version of the manuscript.
Funding
This research was funded by the National Natural Science Foundation of China (42376129) and the National Key Research and Development Program of China (2022YFC3106203).
Data Availability Statement
Publicly available datasets were analyzed in this study. TC data are available from the IBTrACS repository (https://www.ncei.noaa.gov/data/international-best-track-archive-for-climatestewardship-ibtracs/v04r00/access/netcdf/ (accessed on 25 July 2023)). Storm surge data were obtained from the Bulletin on Marine Disasters in Guangdong Province (https://nr.gd.gov.cn/hdjlpt/detail?pid=2254511 (accessed on 24 April 2025)). Precipitation data were sourced from the Yearbook of Tropical Cyclone (https://tcdata.typhoon.org.cn/xgcbw_rdqxnj.html) and the Guangdong-Hong Kong-Macao Greater Bay Area Climate Bulletin (2018–2023) (http://gd.cma.gov.cn/). NDVI data are available from NASA MOD13A3 (https://ladsweb.modaps.eosdis.nasa.gov/missions-and-measurements/products/MOD13A3/). Road network and social assistance data were extracted from OpenStreetMap (https://download.geofabrik.de/). Human land use exposure (HLUE) data were obtained from the Chinese Academy of Sciences (https://www.webmap.cn/commres.do?method=mkglobeDetails&type=EasyAccess). Mangrove area data were derived from Global Mangrove Watch (https://www.globalmangrovewatch.org/). Socioeconomic data were sourced from the Guangdong Provincial Bureau of Statistics (https://stats.gd.gov.cn/), the Hong Kong Government (https://www.gov.hk/sc/residents/), and the Macao Government (https://www.gov.mo/zh-hant/).
Acknowledgments
We thank all the reviewers for reviewing the draft of this paper and helping improve the quality of the manuscript. The English text of this manuscript was polished using DeepSeek (https://www.deepseek.com/, accessed in 29 June 2026) for grammar correction and academic expression optimization. The literature search process was assisted by DeepSeek’s semantic analysis function to screen the initial list of relevant papers, and all finally included references were manually verified for relevance and authenticity by the authors. All AI-generated content has been reviewed and revised by the authors, who take full responsibility for the final content of this paper.
Conflicts of Interest
The authors declare no conflicts of interest.
References
- Zheng, M.; Mu, L.; Li, W.; Wang, F.; Li, Y. Regime Shifts in the Damage Caused by Tropical Cyclones in the Guangdong–Hong Kong–Macao Greater Bay Area of China. J. Mar. Sci. Eng. 2023, 11, 1889. [Google Scholar] [CrossRef] [Scilit]
- Tao, K.; Liao, X.; Su, P.; Xu, W. Progress in multi-hazard risk assessment for tropical cyclone. Water Resour. Hydropower Eng. 2024, 55, 1–9. [Google Scholar]
- Gori, A.; Lin, N.; Chavas, D.; Oppenheimer, M.; Xian, S. Sensitivity of tropical cyclone risk across the US to changes in storm climatology and socioeconomic growth. Environ. Res. Lett. 2025, 20, 064050. [Google Scholar] [CrossRef] [Scilit]
- Zhang, Y.; Zhang, T.; Shen, W.; Ou, Z.; Zhang, J. Economic loss assessment of typhoon-induced storm surge disasters in the South China Sea based on GSA-BP model. Front. Earth Sci. 2023, 11, 1258524. [Google Scholar] [CrossRef] [Scilit]
- Bakkensen, L.A.; Park, D.-S.R.; Sarkar, R.S.R. Climate costs of tropical cyclone losses also depend on rain. Environ. Res. Lett. 2018, 13, 074034. [Google Scholar] [CrossRef] [Scilit]
- Song, J.Y.; Alipour, A.; Moftakhari, H.R.; Moradkhani, H. Toward a more effective hurricane hazard communication. Environ. Res. Lett. 2020, 15, 064012. [Google Scholar] [CrossRef] [Scilit]
- Bloemendaal, N.; de Moel, H.; Mol, J.M.; Bosma, P.R.M.; Polen, A.N.; Collins, J.M. Adequately reflecting the severity of tropical cyclones using the new Tropical Cyclone Severity Scale. Environ. Res. Lett. 2021, 16, 014048. [Google Scholar] [CrossRef] [Scilit]
- Alipour, A.; Yarveysi, F.; Moftakhari, H.; Song, J.Y.; Moradkhani, H. A Multivariate Scaling System Is Essential to Characterize the Tropical Cyclones’ Risk. Earth’s Future 2022, 10, e2021EF002635. [Google Scholar] [CrossRef] [Scilit]
- Li, K.; Li, G.S. Risk assessment on storm surges in the coastal area of Guangdong Province. Nat. Hazards 2013, 68, 1129–1139. [Google Scholar] [CrossRef] [Scilit]
- Gao, Y.; Wang, H.; Liu, G.M.; Sun, X.Y.; Fei, X.Y.; Wang, P.T.; Lv, T.T.; Xue, Z.S.; He, Y.W. Risk assessment of tropical storm surges for coastal regions of China. J. Geophys. Res. Atmos. 2014, 119, 5364–5374. [Google Scholar] [CrossRef] [Scilit]
- Liang, Y.; Zhang, H.; Wang, C.; Zeng, D. A probabilistic framework to construct tropical cyclone loss models for building portfolios. Struct. Saf. 2026, 119, 102665. [Google Scholar] [CrossRef] [Scilit]
- Jian, W.; Stojanovski, P.; Lo, E.Y. Quantifying uncertainty in tropical cyclone risk under present and future climates: Implication for disaster risk management in the Philippines. Int. J. Disaster Risk Reduct. 2026, 132, 105968. [Google Scholar] [CrossRef] [Scilit]
- Banerjee, B.; Karmakar, P.; Singh, S.K.; Singh, D.; Patra, B.; Singh, T.P.; Swarnkar, S. Spatial risk assessment of tropical cyclone for disaster mitigation in a coastal district of India using geospatial technology. J. Atmos. Sol. Terr. Phys. 2025, 274, 106602. [Google Scholar] [CrossRef] [Scilit]
- Nguyen, J.; Kaspi, M.; Berman, K.; Do, C.; Watkins, A.B.; Kuleshov, Y. Enhancing Tropical Cyclone Risk Assessments: A Multi-Hazard Approach for Queensland, Australia and Viti Levu, Fiji. Hydrology 2024, 12, 2. [Google Scholar] [CrossRef] [Scilit]
- Pan, C.; Ni, X.; Shen, X.; Peng, Z. A Study on The Heterogeneity of Tropical Cyclone Vulnerability Functions in Different Provinces along The Coastal Areas in China. In Proceedings of the International ISCRAM Conference, Münster, Germany, 25–29 May 2024. [Google Scholar]
- Meng, C.; Xu, W.; Qiao, Y.; Liao, X.; Qin, L. Quantitative Risk Assessment of Population Affected by Tropical Cyclones Through Joint Consideration of Extreme Precipitation and Strong Wind—A Case Study of Hainan Province. Earth’s Future 2021, 9, e2021EF002365. [Google Scholar] [CrossRef] [Scilit]
- Zhou, M.; Kuang, Y.; Ruan, Z.; Xie, M. Geospatial modeling of the tropical cyclone risk in the Guangdong Province, China. Geomat. Nat. Hazards Risk 2021, 12, 2931–2955. [Google Scholar] [CrossRef] [Scilit]
- Alam, A.; Sammonds, P.; Ahmed, B. Cyclone risk assessment of the Cox’s Bazar district and Rohingya refugee camps in southeast Bangladesh. Sci. Total Environ. 2019, 704, 135360. [Google Scholar] [PubMed]
- Ignacio, J.A.F. Mapping and Assessing High-Resolution Typhoon Exposure and Vulnerability in the Philippines: A Scoping Review. J. Manag. Glob. Sustain. 2025, 12, 8. [Google Scholar] [CrossRef] [Scilit]
- Yang, X.; Yan, Y.; Zhou, X.; Zhu, L.; Ma, M.; Zhang, J.; Chen, Y.; Gao, L. Risk of Compound Typhoon Disaster Chains: Insights from Southeastern China. Int. J. Disaster Risk Sci. 2025, 16, 870–887. [Google Scholar] [CrossRef] [Scilit]
- Durap, A. Multi-decadal spatiotemporal shoreline vulnerability assessment (1987–2025): Integrating erosion-accretion dynamics for disaster risk reduction across 90 coastal transects. Nat. Hazards 2025, 121, 22981–23019. [Google Scholar] [CrossRef] [Scilit]
- Durap, A. Beachface steepness modulates erosion but not recovery: Multi-decadal spatiotemporal shoreline evidence across 390 transects. J. Sea Res. 2025, 208, 102644. [Google Scholar] [CrossRef] [Scilit]
- Dewan, A.M. Hazards, Risk, and Vulnerability. In Floods in a Megacity: Geospatial Techniques in Assessing Hazards, Risk and Vulnerability; Springer: Dordrecht, The Netherlands, 2013; pp. 35–74. [Google Scholar]
- Knutson, T.; Camargo, S.J.; Chan, J.C.; Emanuel, K.; Ho, C.-H.; Kossin, J.; Mohapatra, M.; Satoh, M.; Sugi, M.; Walsh, K. Tropical cyclones and climate change assessment: Part II: Projected response to anthropogenic warming. Bull. Am. Meteorol. Soc. 2020, 101, E303–E322. [Google Scholar] [CrossRef] [Scilit]
- Peduzzi, P.; Chatenoux, B.; Dao, H.; De Bono, A.; Herold, C.; Kossin, J.; Mouton, F.; Nordbeck, O. Global trends in tropical cyclone risk. Nat. Clim. Change 2012, 2, 289–294. [Google Scholar] [CrossRef] [Scilit]
- Banholzer, S.; Kossin, J.; Donner, S. The Impact of Climate Change on Natural Disasters; Springer: Dordrecht, The Netherlands, 2014. [Google Scholar]
- Fornino, M.; Kutlukaya, M.; Lepore, C.; Uruñuela López, J. A Multi-Country Study of Forward-Looking Economic Losses from Floods and Tropical Cyclones; International Monetary Fund: Washington, DC, USA, 2024. [Google Scholar] [CrossRef] [Scilit]
- Darko, G.; Bi, S.; Edomu, W.E.; Junior, I.J.; Brifah, M. Dynamics of typhoon characteristics over 3 decades: Risks and resilience in coastal China. Nat. Hazards 2025, 121, 21201–21233. [Google Scholar] [CrossRef] [Scilit]
- Castillo-Loeza, D.E.; Romero, D.; Quesada-Román, A. Tropical Cyclones in Mexico: A Comparative Analysis and a Composite Socioeconomic Damage Index. Econ. Disasters Clim. Change 2025, 9, 495–517. [Google Scholar] [CrossRef] [Scilit]
- Cai, L.; Li, Y.; Chen, M.; Zou, Z. Tropical cyclone risk assessment for China at the provincial level based on clustering analysis. Geomat. Nat. Hazards Risk 2020, 11, 869–886. [Google Scholar] [CrossRef] [Scilit]
- Liu, L.; Wang, Y.; Zhan, R.; Xu, J.; Duan, Y. Increasing Destructive Potential of Landfalling Tropical Cyclones over China. J. Clim. 2020, 33, 3731–3743. [Google Scholar] [CrossRef] [Scilit]
- Zheng, M.; Wang, C. Interdecadal changes of tropical cyclone intensity in the South China Sea. Clim. Dyn. 2023, 60, 409–425. [Google Scholar]
- Chen, L.; Ding, Y. Introduction to Typhoons in the Western Pacific; Science Press: Beijing, China, 1979. (In Chinese) [Google Scholar]
- Hoque, A.A.; Pradhan, B.; Ahmed, N.; Roy, S. Tropical cyclone risk assessment using geospatial techniques for the eastern coastal region of Bangladesh. Sci. Total Environ. 2019, 692, 10–22. [Google Scholar] [CrossRef] [Scilit] [PubMed]
- Nguyen, K.A.; Liou, Y.A.; Terry, J.P. Vulnerability of Vietnam to typhoons: A spatial assessment based on hazards, exposure and adaptive capacity. Sci. Total Environ. 2019, 682, 31–46. [Google Scholar] [CrossRef] [Scilit] [PubMed]
- Sajjad, M.; Chan, J.C.; Kanwal, S. Integrating spatial statistics tools for coastal risk management: A case-study of typhoon risk in mainland China—ScienceDirect. Ocean Coast. Manag. 2020, 184, 105018. [Google Scholar] [CrossRef] [Scilit]
- Zhang, X.; Nie, J.; Cheng, C.; Xu, C.; Zhou, L.; Shen, S.; Pei, Y. Natural and Socioeconomic Factors and Their Interactive Effects on House Collapse Caused by Typhoon Mangkhut. Int. J. Disaster Risk Sci. 2021, 12, 121–130. [Google Scholar]
- Nations, U. United Nations International Strategy for Disaster Reduction (UNISDR). United Nations International Strategy for Disaster Reduction; UNISDR: Geneva, Switzerland, 2010. [Google Scholar]
- Shaw, R.; Mallick, F.; Islam, A. Disaster Risk Reduction Approaches in Bangladesh; Springer: Tokyo, Japan, 2013. [Google Scholar]
- Liu, Y.; Lu, C.; Yang, X.; Wang, Z.; Liu, B. Fine-Scale Coastal Storm Surge Disaster Vulnerability and Risk Assessment Model: A Case Study of Laizhou Bay, China. Remote Sens. 2020, 12, 1301. [Google Scholar] [CrossRef] [Scilit]
- Duda, R.O.; Hart, P.E.; Stork, D.G. Pattern Classification; Wiley: New York, NY, USA, 2004. [Google Scholar]
- Hastie, T.; Tibshirani, R.; Friedman, J. The Elements of Statistical Learning; Springer: New York, NY, USA, 2009. [Google Scholar]
- Davison, A.C.; Hinkley, D.V. Bootstrap Methods and their Application; Cambridge University Press: Cambridge, UK, 1997. [Google Scholar] [CrossRef] [Scilit]
- Al-Amin, H.M.; Stuart, P.; Chris, R.; Iraphne, C. Assessing tropical cyclone risks using geospatial techniques. Appl. Geogr. 2018, 98, 22–33. [Google Scholar] [CrossRef] [Scilit]
- Mansour, S. Geospatial modelling of tropical cyclone risks to the southern Oman coasts. Int. J. Disaster Risk Reduct. 2019, 40, 101151. [Google Scholar] [CrossRef] [Scilit]
- Abdi, H.; Williams, L.J. Principal component analysis. Wiley Interdiscip. Rev. Comput. Stat. 2010, 2, 433–459. [Google Scholar] [CrossRef] [Scilit]
- Jackson, J.E. A User’s Guide to Principal Components; John Wiley & Sons: Hoboken, NJ, USA, 2005. [Google Scholar]
- Knapp, K.R.; Kruk, M.C.; Levinson, D.H.; Diamond, H.J.; Neumann, C.J. The international best track archive for climate stewardship (IBTrACS) unifying tropical cyclone data. Bull. Am. Meteorol. Soc. 2010, 91, 363–376. [Google Scholar]
- Li, Z.; He, W.; Cheng, M.; Hu, J.; Yang, G.; Zhang, H. SinoLC-1: The first 1-meter resolution national-scale land-cover map of China created with the deep learning framework and open-access data. Earth Syst. Sci. Data 2023, 15, 4749–4780. [Google Scholar]

Disclaimer/Publisher’s Note: The statements, opinions and data contained in all publications are solely those of the individual author(s) and contributor(s) and not of MDPI and/or the editor(s). MDPI and/or the editor(s) disclaim responsibility for any injury to people or property resulting from any ideas, methods, instructions or products referred to in the content. |
© 2026 by the authors. Licensee MDPI, Basel, Switzerland. This article is an open access article distributed under the terms and conditions of the Creative Commons Attribution (CC BY) license.