


Abstract
Cooperative encirclement using multiple unmanned underwater vehicles (UUVs) is a critical task in underwater base defense, yet existing approaches typically rely on static risk rules that cannot fuse multi-source information dynamically and decouple coordination-point allocation from live risk assessment, limiting adaptive response in evolving adversarial conditions. To address these limitations, this paper proposes a continuous risk-driven adaptive weighting strategy for coordination-point allocation, which dynamically adjusts evaluation metric weights as a smooth function of real-time Bayesian risk intensity, enabling seamless transitions between time-efficiency-oriented and synchronization-oriented encirclement modes without discrete switching. This strategy is embedded within a closed-loop decision framework that integrates a Bayesian network for dynamic risk quantification and an online corner-based deployment model to guarantee continuous execution feasibility from approach to final task completion. Simulations validate that the proposed framework ensures stable, adaptive encirclement as risk levels evolve dynamically throughout the mission. Compared to the greedy priority-based allocation and the time-balance allocation as conventional baselines, the proposed strategy reduces task completion time by up to 22.8% and 9.5%, respectively, demonstrating strong robustness in dynamic, uncertain environments.
1. Introduction
UUVs are untethered, self-propelled submersibles that operate without direct human intervention. They are broadly categorized into remotely operated vehicles, which are tethered and manually controlled, and autonomous underwater vehicles, which execute pre-programmed missions independently. In recent decades, UUVs have been increasingly deployed for a wide range of military and civilian applications, including mine countermeasures; anti-submarine warfare; intelligence, surveillance and reconnaissance; oceanographic surveys; and underwater infrastructure inspection. Among these tasks, the coordinated operation of multiple UUVs for defensive encirclement—preventing unauthorized or hostile targets from penetrating a protected maritime area—represents one of the most operationally demanding scenarios, as it requires real-time perception, adaptive decision-making, and precise cooperative control under uncertain underwater conditions.
In maritime monitoring, UUVs are important for underwater observation due to their stealth and endurance [1]. Coordinating multiple UUVs to contain an approaching target is a core task in protected-area monitoring [2,3]. Compared to aerial or ground-based systems, UUV cooperative encirclement relies more heavily on autonomous decision-making. The system must interpret dynamic risk, reassign stations on the fly, and keep each position operationally feasible amid noise and data gaps [4,5,6,7].
Static rule sets still drive most risk evaluation pipelines. They struggle when data streams are fast-moving and come from different sources [8]. Underwater acoustic links are patchy at best. Coordination must hold up even when messages never get through [9]. What we need is a system that interprets risk as it changes, adjusts the containment formation on the fly, and places each UUV at an executable operating point [10,11,12].
Work on multi-agent encirclement is divided into centralized and distributed approaches. Centralized methods pursue the global optimum. Chen et al. [13] combined distributed auctions with model predictive control—coordination improved, but number-crunching spiked. Ke and Chen [14] built a path planner for air–sea teams; it worked centrally but suffered under delays. Distributed approaches trade global awareness for toughness and scalability. Wang et al. [15] used hierarchical reinforcement learning, letting AUVs track targets with local information. Zhu et al. [16] took a bio-inspired route with neural fields for unknown terrain. Yu and Zhang [17] framed weak-communication decision-making as multi-agent RL. Game theory and deep RL have since been applied, casting tracking as differential games [18] or learning encirclement adaptively [19]. Task scheduler security and responsiveness have also drawn interest [20]. Despite these advances, most existing methods in this category assume that the target’s behavior or risk level is known a priori and does not change during the mission [21]. This assumption is difficult to justify in real underwater confrontations, where adversarial intent can shift rapidly based on the target’s evolving tactical assessment. Consequently, coordination strategies designed for a fixed posture cannot adapt in real time, and the feedback loop between situational awareness and operational decision-making is effectively broken [22,23].
Deciding where each UUV stations itself combines “who does what” with “how to get there.” Galati et al. [24] had robots bid on tasks while updating paths as the scene changed. Li et al. [25] integrated deep RL into model predictive control to juggle routes and roles simultaneously. Zhang et al. [26] extended the contract net protocol with hybrid elements for on-the-fly UAV rescheduling. Wang et al. [27] used a mean-field actor-critic setup to allocate resources in large swarms, cutting down inter-vehicle chatter. Multi-objective formulations are common—balancing finish time, battery drain, and load equity [28,29,30]—sometimes with spatiotemporal constraints [31]. Recent work has also explored cooperative evolutionary computation for dynamic multi-objective AUV path planning under time-varying missions [32]. But for UUV encirclement, the coordination points must support final task execution. There is no direct link to risk appraisal. Without that link, priorities cannot shift toward speed, toward synchronized arrival, or toward a deliberate creep as risk levels rise or fall [33]. A common thread across these allocation approaches is that they treat the assignment problem as a self-contained optimization, decoupled from the continuous risk assessment that characterizes dynamic adversarial scenarios. The allocation decision is made once or at discrete intervals, without the ability to smoothly modulate between different tactical objectives as the threat evolves in real time.
Reaching the exact deployment position is the last physical step, bridging station-keeping and payload deployment. Yan et al. [34] used an adaptive neuro-fuzzy system to guess target motion, then shaped the approach accordingly. Feasibility is judged by effective operation zones—geometric envelopes where range and angle limits both hold [35,36]. Occupation parameters are solved via geometry or numerical search [37,38]. More recently, parameterized deep Q-networks with hybrid action spaces have enabled mid-course path corrections under limited sensor observations in multi-target underwater navigation [39], and multi-agent PPO with uncertainty maps has been used to guide AUV swarms toward high-probability target areas under energy constraints [40]. However, there has been a recurring snag: the occupation planner does not communicate with the strategic allocator. It assumes the goal point is static. In reality, the target moves while the cooperative UUV closes in. Upon reaching the assigned spot, the action may not yet be executable. That forces replanning mid-stream. Han et al. [41] used a parameterized deep Q-network for mid-course corrections. What is missing is a way to use the strategic point as coarse guidance, then fine-tune the firing solution online. In summary, the path planning and position adjustment literature generally treats the deployment goal as a fixed target, neglecting the fact that the assigned station may become geometrically infeasible by the time the UUV arrives—due to continuous target motion and evolving relative geometries. This fragmentation between planning levels undermines the continuity of the entire encirclement pipeline.
Pulling this together from the reviewed literature, three gaps remain. First, risk assessment uses fixed rules. It cannot fuse multi-source intelligence or quantify its own uncertainty. Second, station allocation is severed from live risk readings; the encirclement posture cannot adapt its priorities as the threat evolves. Third, the deployment-position adjustment is fragmented from allocation, breaking execution feasibility from approach to final engagement.
This paper addresses these gaps via a closed-loop decision-making framework for multi-UUV cooperative encirclement. The main contributions are:
- (1)
- A Bayesian network-based risk assessment module that dynamically fuses multi-source indicators (target heading deviation, distance, available assets, threat ratio, velocity) into continuous probabilistic High/Medium/Low outputs under uncertainty.
- (2)
- A continuous risk-driven adaptive weighting strategy for coordination-point allocation, expressing nine evaluation metric weights as smooth functions of real-time Bayesian risk intensity to enable seamless transitions between time-efficiency and synchronization modes.
- (3)
- An online corner-based deployment model that integrates reachable-region analysis with payload feasibility to guarantee continuous execution from approach to final task completion.
- (4)
- Full integration of the above into a unified autonomous decision chain, validated through end-to-end simulations demonstrating improved adaptability and efficiency.
2. Problem Description and Analysis
The mission scenario involves cooperative UUVs with payload modules (subject to range constraints) cooperating to encircle a single target UUV approaching a protected area. An integrated decision-making framework is constructed, encompassing Bayesian risk assessment, risk-level-driven adaptive strategic point allocation, Occupied Attack feasibility assessment, and final position occupation and attack. The information flow among these modules is illustrated in Figure 1. Subsequently, the key challenges in achieving efficient encirclement decision-making within complex adversarial environments are analyzed.
Figure 1.
Mission scenario and overall workflow of autonomous decision-making for multi-UUV cooperative encirclement.
In this scenario, target UUVs attempt to approach protected areas. Cooperative UUVs must select the optimal timing and position to deploy the payload, strictly satisfying the payload’s effective range constraint.
The fundamental mission sequence is as follows:
- (1)
- Initialization: The target moves toward the protected area. The cooperative UUVs patrol or stand by near the area.
- (2)
- Situation Assessment and Position Adjustment: The relative position between each cooperative UUV and the target UUV is judged in real time. If the target is within a UUV’s Immediate Execution region, immediate deployment is executed. Otherwise, a position occupation maneuver is planned, guiding the cooperative UUV to a reachable point within its mission module’s effective range. The mission module is launched only after the Immediate Execution condition is satisfied at that point.
- (3)
- Risk Situation Assessment: Cooperative UUVs utilize real-time multi-source intelligence (e.g., target UUV heading, velocity, distance from the protected area, number of cooperative UUVs). A Bayesian network performs risk assessment, dynamically outputting risk levels: High (H), Medium (M), or Low (L).
- (4)
- Risk-Driven Decision-Making: The risk level directly determines the collective behavior patterns and optimization objectives for the encirclement strategy.
- (5)
- Adaptive Allocation of Strategic Points: Based on the risk level, the optimal allocation scheme for strategic points is selected from all possible distribution plans.
Based on this task description, the overall autonomous decision-making process for cooperative encirclement by cooperative UUVs is constructed, as illustrated in Figure 1.
3. Methodology
3.1. Risk Level Assessment in Multi-UUV Cooperative Response Considering Target Intentions
In multi-UUV collaborative response tasks, risk assessment quantifies situation severity by analyzing the target’s intent, kinematic capability, and operational environment, thereby providing the basis for subsequent containment and position-adjustment strategies. Bayesian networks are employed for their advantages in expressing uncertainty, fusing multi-source information, and enabling dynamic reasoning, making them well-suited to underwater environments characterized by incomplete information and significant noise interference.
Design of the Risk Assessment Framework
A Bayesian network-based framework is proposed for adversarial risk level assessment. Its core concept involves fusing multi-source risk factors to dynamically output high, medium, and low risk levels, driving adaptive adjustments to the coordination strategy. The framework possesses the following characteristics:
- (1)
- Multi-level fusion: A multi-dimensional risk factor system integrating the intent of the target UUV, its capability, and the cooperative UUV’s posture.
- (2)
- Uncertainty handling: Bayesian network adoption enables probabilistic inference under incomplete information and noise interference.
- (3)
- Decision-driven: Risk levels directly map to subsequent strategic point allocation schemes.
The choice of the Bayesian network as the inference engine for threat assessment is motivated by both the characteristics of the underwater adversarial environment and the operational requirements of the decision-making framework. Several alternative approaches exist for threat evaluation. Fuzzy logic systems can represent uncertain linguistic variables and are computationally efficient, but they lack a rigorous probabilistic foundation for updating beliefs as new evidence arrives, which is essential for tracking a dynamically evolving adversarial situation. Dempster–Shafer evidence theory offers the ability to represent both uncertainty and ignorance through belief functions, yet it suffers from high computational complexity in evidence combination and may produce counter-intuitive results when conflicting evidence is fused—a non-negligible risk in noisy underwater sensor environments. Neural network-based methods, while powerful in pattern recognition, require large-scale labeled training data that are difficult to obtain in real underwater combat scenarios, and their inherent black-box nature raises concerns about interpretability and trust in military decision-making.
In contrast, the Bayesian network is particularly well-suited for the threat assessment task in this work for four reasons. First, it provides a principled probabilistic framework for reasoning under uncertainty, which is essential given the incomplete and noisy sensor data typical of underwater environments. Second, it naturally supports the fusion of multi-source heterogeneous information—the five risk factors—through the conditional probability tables, enabling a systematic combination of different types of evidence. Third, it enables dynamic belief updating: as new observations of the risk factors arrive at each decision cycle, the posterior probabilities of the threat levels are recomputed, allowing the threat assessment to track the evolution of the tactical situation in real time. Fourth, it offers interpretability: the network structure and the CPTs can be examined, validated, and adjusted by domain experts, which is a critical requirement for practical deployment in defense applications where decision-makers must understand and trust the assessment results. These characteristics make the Bayesian network a more appropriate choice than fuzzy logic, Dempster–Shafer theory, or neural networks for the adversarial threat assessment problem considered in this paper.
Risk Factor Analysis and Modeling
Risk assessment accuracy fundamentally depends on systematic analysis and proper modeling of multi-source risk factors. Based on UUV confrontation characteristics, five key risk factors are extracted by integrating analysis of the target UUV’s intent and capability with an assessment of the cooperative UUV’s defensive state. These factors are quantitatively modeled and serve as input nodes for the Bayesian network.
- (1)
- Target heading deviation angle
The target heading deviation angle is defined as the angle between the target UUV’s heading and the line connecting it to the defensive area, as illustrated in Figure 2. Risk logic: A smaller indicates a more direct heading toward the cooperative UUV’s base, signifying a stronger risk intent.
Figure 2.
Target heading deviation and target distance.
- (2)
- Target distance
Target distance refers to the distance between the target and the protected area. In Figure 3, denotes the target distance. Risk logic: The closer the distance, the shorter the time required for the UUVs to achieve their objective, the narrower the cooperative UUV’s reaction window, and the higher the risk level.
Figure 3.
Effective payload action points.
- (3)
- Number of available cooperative UUVs
represents the number of cooperative UUVs capable of launching an attack (immediately or after position occupation) in the current situation. This metric embodies the concept of opportunity in risk assessment, requiring dual evaluation of the target UUV’s intent and its mission accomplishment opportunity given the cooperative UUV’s deployment. serves as a comprehensive indicator integrating factors including target UUV speed and bearing, cooperative UUV speed, and mission module lethal capability. Its value depends on constraints such as mission module status, energy limitations, and tactical feasibility of position occupation.
In Figure 3, and denote hit points planned by cooperative UUVs and , respectively, while has no effective hit points. The risk calculation logic is as follows: More available actions lead to a stronger response capability, which in turn reduces perceived risk.
- (4)
- The proportion of affected cooperative UUVs relative to the total number of cooperative UUVs
The proportion of threatened cooperative UUVs is defined as the ratio of cooperative UUVs within the target UUV’s working range to the total number of cooperative UUVs. When all available cooperative UUVs are within the target’s effective range, they may withdraw to ensure safety, potentially granting the target less constrained movement toward the protected area. Risk logic: A higher ratio indicates an elevated risk level, signifying greater susceptibility to suppression and fewer counterattack opportunities.
- (5)
- Target UUV speed
The speed of the target UUV is an important component of its maneuvering capability and directly influences its approach velocity, thereby affecting the level of operational risk. However, maneuverability is a multidimensional characteristic that may also depend on factors such as acceleration limits, turning radius, control authority, hydrodynamic constraints, and the target’s decision strategy. To maintain a tractable risk-assessment framework, and because speed is readily observable during real-time operations, this study adopts target speed as a simplified indicator of the target’s kinematic threat capability.
Risk logic: Higher speeds enhance the target UUV’s ability to approach the base or evade encirclement, thereby increasing the risk level.
To accommodate the discrete inputs of the Bayesian network, the aforementioned continuous or discrete risk factors are categorized into three levels: L (Low), M (Medium), and H (High). Specific thresholds are determined based on simulation data and mission scenario parameters, as detailed in Table 1.
Table 1.
Thresholds for classifying risk factor status.
Bayesian Network Construction and Inference
Based on the five risk elements identified in Section 3.2, a Bayesian network is constructed. The network adopts a hierarchically directed acyclic graph structure, where:
The root node (observation layer) corresponds to five risk factors: target heading deviation , target distance , number of defenses available for attack , proportion under risk , and the speed of the target UUV.
The leaf node (output layer) represents risk level TL, categorized into three tiers: L, M, and H.
The dependency relationships between the states of nodes in a Bayesian network are defined by the Conditional Probability Table (CPT) presented in Table 2. The Conditional Probability Tables (CPTs) in this work are constructed following the methodological framework established in the literature on UUV threat assessment [42], which employs three threat factors: target heading deviation, target distance, and the number of available defenders for Bayesian threat inference. Building upon this foundation, we extend the assessment framework to incorporate two additional factors that are critical for capturing the dynamic nature of underwater adversarial engagements: the proportion of threatened defenders and the target UUV’s speed. The former reflects the defensive side’s vulnerability to suppression, while the latter quantifies the target’s kinematic capability to approach the base or evade encirclement.
Table 2.
Cooperative-unit risk assessment Bayesian network CPT.
For the three factors inherited from the literature, the CPT entries are adopted directly from the parameter settings in [42]. For the two newly incorporated factors, the CPT entries are determined based on the risk logic defined in the preceding factor analysis. Specifically, for the proportion of threatened defenders, a higher ratio increases the likelihood of a High threat level, as it indicates that the defending assets are more susceptible to suppression with fewer counterattack opportunities. For the target UUV’s speed, higher speeds enhance the target’s ability to approach the base or evade encirclement and are therefore associated with increased probabilities of higher threat levels.
For each element, the state character 1 is assigned a low numerical value, 2 a medium value, and 3 a high value. During real-time countermeasures, the current observation values of threat factors are acquired by the system. These values are then converted into corresponding state evidence (L/M/H) and input into the Bayesian network. Subsequently, the inferred threat state characters are mapped back to numerical states. Finally, the posterior probability is calculated using a precise inference algorithm—the Junction Tree Algorithm.
In the Bayesian network, the dependency relationship between the threat level and the five observed risk factors are fully captured by the joint probability distribution. The joint decomposition factorizes this high-dimensional joint distribution into the product of the prior probability and the conditional likelihoods, which follows directly from the conditional independence assumption encoded in the Bayesian network structure—namely, that the observed factors are mutually independent given the threat level . This factorization enables the computation of the joint probability using the parameters stored in the Conditional Probability Tables, effectively transforming a complex joint probability evaluation problem into a product of local probabilities, thereby significantly reducing the computational complexity of inference.
Categorical variable , prior probability
According to the probabilistic reasoning framework of Bayesian networks proposed by Pearl [43], the joint probability distribution of all variables can be factorized according to the conditional independence assumptions encoded in the network structure. This formulation enables efficient probabilistic inference and uncertainty reasoning for multi-source threat assessment in dynamic UUV confrontation scenarios.
Joint decomposition:
Posterior probability (using a Naive Bayes classifier):
where the numerator is the product of the prior probability and the four conditional likelihoods. The denominator is the total probability normalization. This formula is essentially the application of Bayes’ theorem in the presence of multi-source evidence. Its physical interpretation can be understood as follows: after observing the evidence of the five risk factors, our belief about the target’s threat level is updated from the prior distribution to the posterior distribution . The prior probability in the numerator reflects the initial judgment about each threat level in the absence of any observational information; the five conditional likelihood terms quantify, for each given threat level, the probability of observing the corresponding factor state; the denominator sums over all threat levels to ensure that the output is a valid probability distribution. Through this inference process, the system fuses five independent factor-level threat evidences into a unified, quantitative overall threat situation assessment, providing a clear decision-making basis for subsequent strategy selection.
The output is the probability distribution of risk levels. The level corresponding to the maximum posterior probability is then selected as the final assessment result:
If identical or nearly identical probabilities arise (e.g., ), represents a given minimum value. In such instances, the conservative decision-making principle shall be followed, selecting the higher risk level to ensure system security.
In summary, the Bayesian network-based risk assessment module constructed in this section operates according to the following procedure. First, real-time observations of the five risk factors—target heading deviation, target distance, number of attack-capable UUVs, threat exposure ratio, and target speed—are acquired via sensors or data links. Second, these continuous or discrete observations are mapped to their corresponding state levels according to the pre-defined classification thresholds given in Table 1. Third, the five state levels are fed as evidence into the Bayesian network, and the posterior probability distribution of the overall threat level under the current situation is inferred using the CPTs, which embed expert knowledge and simulation data, through the joint decomposition and posterior probability computation formulated above. Finally, the level corresponding to the maximum posterior probability is selected as the final assessment output. This procedure is executed repeatedly at each decision cycle, ensuring that the threat assessment dynamically tracks the evolution of the adversarial situation and provides real-time, reliable inputs for the subsequent risk-driven adaptive strategic-point allocation.
To achieve closed-loop assessment, risk factors are reacquired whenever the sequence advances or the UUV status is updated. A new round of Bayesian inference is then triggered. This process ensures that risk levels are dynamically adjusted in accordance with changes in the adversarial situation.
3.2. Design of an Adaptive Allocation Method for Strategic Points
In single-target multi-UUV coordination tasks, overall coordination efficiency hinges on rational coordination-point allocation. Traditional single-metric approaches (minimum time or time balance) are ill-suited for dynamic environments with varying risk levels. To address this, a multi-criteria evaluation method with adaptive weighting is proposed, establishing a multidimensional system encompassing time, distance, maneuver burden, and safety. Indicator weights are dynamically adjusted according to risk levels, enabling more intelligent and robust allocation decisions.
The present study focuses on the single-target multi-UUV cooperative encirclement problem, which represents a typical base-defense scenario involving one intruding UUV and multiple cooperative defenders. Compared with multi-target cooperative engagement problems, the primary challenge here lies in risk-driven strategic-point allocation and coordinated containment rather than target assignment among multiple adversaries.
Generation of Single-Objective Strategic Point Sets
In the mission to encircle a single target UUV, as shown in Figure 4, coordination points should be distributed along the boundary of the effective-range sphere. This sphere is centered on the target UUV and has a radius equal to the maximum range of the cooperative UUV’s mission payload, forming an encircling posture. Assume that at time t the target UUV is located at coordinate , and the defending base is at coordinate . The cooperative UUV’s payload has a maximum range of and a payload velocity of . The determination of strategic points involves the following four steps.
Figure 4.
Schematic diagram of single-target UUV tactical point distribution.
(1) The variable is defined as the straight-line distance from the base to the Blue Team UUV.
(2) The first strategic point, , is determined.
A1 lies at the intersection of the line and the risk sphere, on the side closer to the base. The unit vector from towards is:
Then,
Due to
The coordinates of are then obtained as:
(3) The reference direction angle is calculated.
When , the reference direction angle is:
When , the reference direction angle is:
(4) The remaining strategic points, and , are determined. These strategic points are uniformly distributed on both sides of . The included angle between adjacent points and is defined as . Given that:
the coordinates of the strategic points are determined according to the dynamic generation method proposed in the literature [42]. When the base is positioned below or horizontally aligned with the target UUV, i.e., when , the following applies:
When the base is above the blue UUV, i.e., , the following applies:
The above geometric construction ensures that the three strategic points satisfy the following tactical requirements. The point lies on the line connecting the target UUV and the defender base, positioned on the base side of the sphere. It represents the most direct interception station for blocking the target’s motion toward the base, and is therefore assigned the highest priority. The points and are symmetrically distributed on both sides of , jointly forming an encircling posture around the target UUV. The angular separation between adjacent strategic points with respect to the target UUV is determined by the ratio of the target speed to the payload speed. This design ensures that mission modules launched simultaneously from any two adjacent stations can reach the target at the same time, enabling coordinated engagement. These three strategic points together constitute the basic reference framework for the subsequent UUV allocation and position-occupation maneuvers.
Evaluation Metric System for Strategic Point Allocation
To comprehensively evaluate the merits and drawbacks of different allocation schemes, a comprehensive evaluation system comprising indicators is constructed, as shown in Table 3.
Table 3.
Comprehensive evaluation system.
Here, denotes the time at which the th UUV reaches its corresponding strategic point; denotes the distance traveled by the th UUV to reach its corresponding strategic point; denotes the current total number of cooperative UUVs; and denotes the heading of the th UUV and the angle between the current UUV’s direction and the line connecting it to its corresponding strategic point.
Generation of the Allocation Schemes
The number of cooperative UUVs is set to , with the corresponding number of strategic points being , i.e., . Thus, there are allocation schemes in total. For the th scheme, the values of the aforementioned metrics are calculated to obtain the metric vector:
where denotes the value of the scheme for the th indicator.
Strategic Point Allocation Strategy Design Under Different Evaluation Mechanisms
Strategy One: Greedy Allocation Strategy Based on Priority of Strategic Points
Strategic points are first ranked according to their importance, with the order being A1 > A2 > A3. The assignment process then proceeds sequentially based on this hierarchy. Initially, the cooperative UUV closest to point A1 is located and is assigned to it. Following this, from the pool of remaining cooperative UUVs, the one nearest to point A2 is identified and assigned to A2. This process continues in the same manner for subsequent points.
Strategy Two: Single-Criterion Optimization Allocation Based on Time Balance
The allocation scheme to be selected is identified by a specific criterion. The smallest difference between the longest and shortest task durations is calculated for all possible combinations of strategic points and cooperative UUVs. The scheme exhibiting this minimum difference is chosen. This strategy exclusively considers the impact of the time equilibrium criterion.
Strategy One employs a rule-driven method based on strategic point priority. Its computational process is straightforward with low implementation costs, enabling rapid generation of viable allocation outcomes. However, its decision-making relies primarily on localized information, lacking systematic consideration of overall collaborative effects.
Strategy Two constructs a single-objective optimization model centered on time balance metrics. This approach improves the temporal consistency of multi-UUV arrival to some extent, but its singular optimization objective makes it challenging to balance multi-dimensional performance metrics under varying mission requirements.
Neither approach explicitly incorporates a multi-criteria integrated evaluation and weight adjustment mechanism. Consequently, their allocation strategies struggle to adapt to evolving risk scenarios, with limited flexibility and robustness in complex dynamic adversarial environments. Therefore, introducing a multi-criteria collaborative evaluation and weight adjustment mechanism is imperative to achieve more intelligent and resilient strategic point allocation. It should be noted that Strategy One and Strategy Two are not internally defined ad hoc baselines, but come from the literature [42].
Weights are dynamically adjusted based on the risk levels output in Section 3, followed by the design of the following three strategies:
The composite evaluation value is defined as the weighted sum of each indicator:
where denotes the weight of the i-th indicator, satisfying , and denotes the ranking value of the i-th indicator under the j-th alternative.
Strategy Three: The segment weighting allocation strategy based on risk level is as shown in Table 4 below.
Table 4.
Risk-level-based segment weighting allocation strategy.
Under high risk levels, Strategy Three primarily aims to enhance the UUV’s response speed in reaching the strategic point, optimizing solely for indicator J1. At low risk levels, the focus shifts to coordinated UUV arrival at the strategic point, concentrating solely on optimizing indicator J3. When risk levels are medium, equal weighting is assigned to all evaluation indicators to achieve a balanced trade-off across multiple objectives.
Compared to Strategy One and Strategy Two, Strategy Three employs a multi-indicator weighted evaluation system. This enables a comprehensive assessment of the performance of the strategic point allocation scheme, thereby enhancing the overall rationality of decision outcomes to a certain extent. However, the weighting of individual indicators remains either pre-set or subject to discrete adjustments. Consequently, this strategy struggles to adequately capture the continuous evolution of the risk landscape. When the operational environment undergoes change, its capacity for adaptive adjustment remains insufficient.
Strategy Four: Weight Adjustment Strategy for Rule Constraints
The risk coefficient is defined and
Weights are adjusted according to the following equation:
Strategy Four adds a weight adjustment layer that allows the metrics to recalibrate as the risk picture shifts. This keeps any single indicator from dominating the score when conditions become very high or very low. The metrics interact more evenly as a result. The method also avoids extreme weight settings, leaning instead on proportional constraints. Allocation outcomes become steadier and less brittle.
The adjustment rules themselves, though, are still built on segmented thresholds. When the risk evolves in a smooth, continuous way, the weights can jump. Those jumps rattle the continuity of the allocation and can destabilize the results.
One more limitation: both Strategy Three and Strategy Four lean heavily on time-efficiency and synchronization metrics. In some task settings, this narrow focus allows several different station assignments to earn nearly identical composite scores. The final pick then loses distinctiveness—and with it, a measure of certainty.
Strategy Five addresses this brittleness by tying the weights directly to a continuous risk signal.
Strategy Five: Continuous Risk-Driven Adaptive Weighting Strategy
In practical operations, risk conditions do not change in neat steps. They drift. Switching weights only when the risk crosses some hard boundary means the station assignments can jerk from one configuration to the next between timesteps. A smoother way is needed. We tie the metric weights directly to a continuous read of risk intensity. The mapping is fluid. As the risk picture evolves, the weights move with it no jumps, no sudden reshuffling.
The continuous risk intensity variable is constructed:
When the value is large, it indicates that a high-risk state predominates; when it is small, it indicates that a low-risk state predominates.
For a more intuitive understanding, the in Section 3.2, which corresponds to the weight , can be described as:
In the continuous risk weighting model, the weight of each evaluation indicator is expressed as a function of the continuous risk intensity .
- (1)
- Time-efficiency metrics: Time-efficiency metrics become more critical under high-risk conditions. Their weight increases monotonically with risk intensity, defined as:
- (2)
- Coordination and synchronization matter more when the risk is low. As risk intensity climbs, these weights drop. The relationship is a simple, monotonic decay:
- (3)
- Maneuverability and safety constraints apply across the board. Their weights stay fixed:
To ensure the normality of the comprehensive evaluation function, a normalization constraint is imposed on all weights:
where coefficients are constant parameters. They are pre-set according to task requirements and remain unchanged throughout the decision-making process. However, they must satisfy the following constraints, whereby the normalization equation for any arbitrary may be expressed as:
With , and , the above equation is rewritten as:
For the normalization constraints to hold, , , must satisfy the following equation:
The coefficients in the weighting functions are selected to satisfy the normalization constraints derived above, which require and . The sum represents the sensitivity of the weighting scheme to changes in risk intensity a larger value makes the weights more responsive to risk variations, while a smaller value yields smoother transitions. The value 0.36 is chosen as a moderate setting that ensures sufficient differentiation between time-efficiency and coordination-synchronization priorities at both ends of the risk spectrum, while avoiding abrupt weight jumps that could destabilize the allocation decisions. The constant coefficients through are then determined by the remaining weight budget distributed according to the relative importance of the maneuverability and safety metrics under all risk conditions. The specific values used in this work are: , , , , , , , , and , which collectively satisfy the normalization constraints and yield well-balanced decision-making across all risk conditions.
In summary, Strategy Five runs on a continuous risk signal. Weights adjust smoothly rather than in chunks. No single metric takes over. Time to point, arrival spread, and deployment feasibility all stay in the mix. The resulting allocations are steadier across shifting conditions. Later phases—positioning and final engagement—rest on a firmer footing.
To improve the reproducibility of the proposed method, we summarize the adaptive strategic point allocation procedure in Algorithm 1.
| Algorithm 1. Risk-Driven Coordination and Execution Framework |
| Input: Target state, cooperative UUV states, mission constraints, Bayesian network parameters. Output: Threat level, strategic-point allocation scheme, and mission execution result.
|
3.3. Optimization Design of Position Adjustment
In UUV cooperative encirclement missions, position optimization is the critical link bridging coordination-point allocation with final payload deployment. It determines whether the cooperative UUV can reach the designated attack position at the optimal time and via the optimal path. Based on the corner-based payload deployment methodology, the core process is as follows: real-time situational assessability is determined based on relative motion, categorizing situations into immediately executable, executable via position adjustment, and infeasible. For attackable via occupation scenarios, a position occupation maneuver parameter model is established to precisely compute the target occupation point, required heading, and maneuver time. Finally, the position occupation decision is integrated into a closed-loop system combining risk assessment (Part Three) with strategic point allocation (Part Four), forming a complete autonomous decision chain: assessment, allocation, position adjustment, and task execution.
Corner-Based Payload Deployment Model
A corner-based deployment approach is adopted. After launch, the mission module maintains its original heading for a short distance, then adjusts to a predetermined new heading. As shown in Figure 5, and denote the target and target positions at launch, with headings and , respectively. is the mission module’s heading. is the target bearing angle (angle between the cooperative UUV–target line and target’s heading, positive to starboard). is the UUV-target distance at launch. is the impact point, the impact angle, and the module’s travel range (must be less than maximum effective range). Notably, , meaning the target UUV and mission module headings are aligned.
Figure 5.
Corner-based payload deployment.
Analysis of Reachable Range and Feasible Deployment Range
- (1)
- Accessible Area Analysis and Discrimination
Since scenarios with velocity ≥ target velocity are analytically straightforward, primary attention is directed to the opposite condition where the attacker is slower, corresponding to a cooperative UUV deploying a payload toward the target.
As illustrated in Figure 6, relative motion is considered under the assumption that the target remains stationary. Initially, the target’s own velocity is disregarded, and relative motion is initiated by the target UUV at velocity. Subsequently, the attacker’s own velocity is considered. The circle shown in Figure 6 represents the attacker’s velocity vector circle, whose radius corresponds to the attacker’s maximum velocity. The center of this circle is located at the apex of the counter-directed velocity vector of the target. The attacker’s true relative velocity toward the target is given by the resultant velocity vector formed by combining the velocity vectors and . Graphical analysis reveals that the direction of this resultant vector lies within the acute-angled region bounded by and . Therefore, the area of occupiable position occupation point is defined as the acute-angled region bounded by and . Any point within this area can be reached by the attacking force. The region located outside these boundaries constitutes an unreachable zone. In the diagram, point is identified as a position occupation point. This is because its attainment requires a velocity of , which falls within the model’s parameters. Conversely, point is shown as an unreachable position point situated within the unreachable zone. Its attainment would necessitate a velocity of , a requirement that is not satisfied by the parameters of the attacking force model.
Figure 6.
UUV reachable area.
- (2)
- Feasibility Domain Analysis and Discrimination for Mission Module Firing
As illustrated in Figure 7, a rectangular coordinate system is established. The origin of this system is set at the target’s position at the moment of launch. The target’s cur-rent heading is designated as the X-axis. The segment is plotted, where point denotes the mission module’s intended impact point. The parameter is defined, representing the ratio of the target’s velocity to the mission module’s velocity (with < 1). The parameter denotes the mission module’s maximum effective range. Using point as the center and as the radius, a circle is constructed. It logically follows that launching the mission module from any point on or within this circle will ensure an impact at point . This circle therefore defines the payload module’s feasible deployment range. The equation describing this region can be expressed as follows:
Figure 7.
Payload deployment envelope.
Analytical solution method for the Occupied Attack point
Prior to mission module launch, the UUV’s position-adjustment maneuver parameters, including appropriate heading and duration, must be determined, as improper selection may lead to mission failure. Once the heading is obtained and the attacker reaches the designated launch point, the position occupation process is defined.
- (1)
- Immediate Execution condition assessment
If the attacker’s position satisfies Equation (33), requiring no repositioning, then the current position is r Immediate Execution, as illustrated in Figure 8.
Figure 8.
Impact point calculation for the Immediate Execution condition.
The current coordinates of the attacked party are set as follows:
- (2)
- Solution of the Position-Adjustment Model
If the UUV’s current position does not satisfy the equation above, a position occupation maneuver is required. The mission module is launched only after the attacker reaches the designated position occupation point, as illustrated in Figure 9.
Figure 9.
Occupied Execution determination.
The reachable task module involves the minimum velocity within the feasible domain:
where , , ,, and .
Distance from W Point to S Point:
Coordinates of point P:
The time t is calculated using the above equation:
The UUV’s initial position is set to , with a position occupation speed of . The coordinates of the UUV’s deployment point can be expressed as follows:
The task module impact point is denoted as:
It should be noted that certain parameters employed in the position-adjustment module, such as the velocity ratios and geometric thresholds used in the feasibility assessment of occupied attacks, are currently configured based on empirical tuning according to the specific mission scenario and vehicle characteristics. This empirical configuration is sufficient for the considered problem scale and serves as a practical baseline for validation. However, the automated optimization of these coefficients under varying operational conditions remains an open challenge and will be investigated in future work.
4. Results
The proposed risk-level-driven cooperative containment method is validated through an end-to-end simulation, demonstrating the complete autonomous decision-making chain of cooperative UUVs, from initial situational awareness to final task execution for a single target. The simulation encompasses Bayesian risk assessment, adaptive coordination-point allocation based on risk levels, maneuvering, execution-feasibility assessment, and payload deployment, confirming the feasibility and engineering potential of the closed-loop autonomous decision-making framework in dynamic, uncertain environments.
The simulation setup is as follows: Protected-area center at (0, 0); cooperative UUV1 at (−0.20, 0.10), heading −100°; UUV2 at (−0.15, 0.20), heading −120°; and UUV3 at (−0.25, 0.10), heading 0°. All cooperative UUVs maintain a speed of 3.5 m/s. The payload module has a deployment velocity of 2 m/s and a range of 100 m. The target UUV is at (0.5, 0.2), heading 260°, with a speed of 3.5 m/s.
As shown in Table 5, the three strategic points are denoted as A1, A2, and A3 respectively, while the three cooperative UUVs are designated as U1, U2, and U3. The specific definitions of indicators J1 to J9 are provided in Table 3. JA1, JA2, and JA3 represent the minimum time required for the UUV to reach strategic points A1, A2, and A3 respectively. Comprehensive evaluation values are calculated for five strategies. Allocation scheme 4 is obtained as optimal under Strategy 1. Allocation scheme 2 is obtained as optimal under Strategy 2. Allocation schemes 3 and 5 are obtained as optimal under Strategy 3. Allocation scheme 1 is obtained as optimal under Strategy 4. Allocation scheme 3 is obtained as optimal under Strategy 5.
Table 5.
Allocation schemes of the five strategies under Bayesian assessment rated as H.
As shown in Table 6, comprehensive evaluation values are calculated for five strategies. Allocation scheme 2 is optimal under Strategy 1. Allocation scheme 3 is optimal under Strategy 2. Allocation scheme 3 is optimal under Strategy 3. Allocation scheme 1 is optimal under Strategy 4.
Table 6.
Adaptive strategic points allocation scheme under Bayesian assessment rated as M.
Allocation scheme 1 is optimal under Strategy 5.
As shown in Table 7, comprehensive evaluation values are calculated for five strategies. Allocation scheme 6 is optimal under Strategy 1. Allocation scheme 4 is optimal under Strategy 2. Allocation scheme 4 is optimal under Strategy 3. Allocation scheme 4 is optimal under Strategy 4. Allocation scheme 2 is optimal under Strategy 5.
Table 7.
Adaptive strategic points allocation scheme under Bayesian assessment rated as L.
Figure 10 demonstrates the entire process of 4 typical strategies.
Figure 10.
Schematic diagram of the entire process motion simulation.
Strategy One: This strategy does not incorporate risk information. Strategy One assigns stations purely by priority: A1 first, then A2, then A3. The closest UUV gets the job. Once set, the assignments never change, even when the risk does. The movement pattern stays rigid, and the intercept drags on longer than it should.
Figure 10 presents the motion simulation results corresponding to four representative strategic point allocation schemes. Specifically, Figure 10a, Figure 10b, Figure 10c, and Figure 10d correspond to Strategy 1, Strategy 2, Strategy 3, and Strategy 5, respectively. Strategy 4 is not displayed because its allocation result and encirclement process are identical to those of Strategy 5 under the considered scenario.
The simulation results show that different strategic point allocation schemes lead to different encirclement behaviors and interception efficiencies. The corresponding target hit times are 0.135 h, 0.116 h, 0.136 h, and 0.105 h for Strategies 1, 2, 3, and 5, respectively.
5. Discussion
Validation of Bayesian Threat Assessment
To provide a detailed validation of the constructed CPTs, we conduct threat assessment simulations under nine typical adversarial scenarios, covering High, Medium, and Low threat conditions, with three different initial configurations per level. For each scenario, the observed states of the five risk factors—target heading deviation, target distance, number of attack-capable UUVs, threat exposure ratio, and target speed—are fed into the Bayesian network. The simulation results are presented in Figure 11, Figure 12 and Figure 13, which illustrate three representative cases for each threat level.
Figure 11.
Schematic diagram with situation assessment rated as H.
Figure 12.
Schematic diagram with situation assessment rated as M.
Figure 13.
Schematic diagram with situation assessment rated as L.
- (1)
- Situation Assessment result = H
For the high-threat-level scenario experiments, three independent scenarios are defined as follows:
Scenario 1: The Red team base remains at (0, 0) while UUV1, UUV2, and UUV3 are positioned at (0.1, 0.2), (0.2, 0.35), and (0.4, 0.2) respectively. Their courses are adjusted to 50°, −140°, and 87°, maintaining a speed of 2.5 m/s. The Blue UUV is positioned at (0.28, 0.28) with a heading of −100°, and its speed is adjusted to 3.3 m/s, maintaining the same threat zone coverage. The adjusted results are shown in Figure 11a.
Scenario 2: The Red team base remains at (0, 0), while UUV1, UUV2, and UUV3 are positioned at (0.1, 0.2), (0.2, 0.35), and (0.4, 0.2) respectively. Their courses are adjusted to 74°, −149°, and −27°, maintaining a speed of 2.5 m/s. The Blue UUV is positioned at (0.25, 0.3) with a heading of −98°, and its speed is adjusted to 3.3 m/s, maintaining the same threat zone coverage. The adjusted results are shown in Figure 11b.
Scenario 3: The Red team base remains at (0, 0). UUV1, UUV2, and UUV3 are deployed at (0.1, 0.15), (0.3, 0.25), and (0.4, 0.25) respectively, with headings set to 34°, −49°, and −87°, maintaining a speed of 2.5 m/s. The Blue UUV’s initial coordinates are (0.18, 0.22), heading −80°, with speed reduced to 3.0 m/s, and the threat zone radius remains 200 m. The corresponding evaluation results are shown in Figure 11c.
- (2)
- Situation Assessment result = M
For the medium-threat-level scenario experiments, three independent scenarios are defined as follows:
Scenario 1: The Red team base remains at (0, 0). UUV1, UUV2, and UUV3 are deployed at (0.0, 0.2), (0.18, 0.3), and (0.4, 0.1) respectively, with headings set to −100°, −120°, and 0°, maintaining a speed of 2.5 m/s. The Blue UUV’s initial coordinates are (0.3, 0.3), heading −110°, with a speed of 3.5 m/s, and the threat zone radius is set to 200 m. The corresponding evaluation results are shown in Figure 12a.
Scenario 2: The Red team base remains at (0, 0). UUV1, UUV2, and UUV3 are deployed at (0.1, 0.2), (0.2, 0.35), and (0.5, 0.2) respectively, with headings set to 70°, −160°, and 29°, maintaining a speed of 2.5 m/s. The Blue UUV’s initial coordinates are (0.35, 0.35), heading −90°, with speed reduced to 2.5 m/s, and the threat zone radius remains 200 m. The corresponding evaluation results are shown in Figure 12b.
Scenario 3: The Red team base remains at (0, 0). UUV1, UUV2, and UUV3 are deployed at (0.05, 0.1), (0.18, 0.2), and (0.2, 0.05) respectively, with headings set to −120°, −10°, and 40°, maintaining a speed of 2.5 m/s. The Blue UUV’s initial coordinates are (0.25, 0.25), heading −60°, with speed reduced to 1.4 m/s, and the threat zone radius remains 200 m. The corresponding evaluation results are shown in Figure 12c.
- (3)
- Situation Assessment result = L
For experiments involving low-threat scenarios, three independent scenarios are defined as follows:
Scenario 1: The Red team base remains at (0, 0). UUV1, UUV2, and UUV3 are deployed at (0.1, 0.2), (0.2, 0.35) and (0.4, 0.1) respectively, with headings set to 74°, −149° and −27°, maintaining a speed of 2.5 m/s. The Blue UUV’s initial coordinates are (0.4, 0.45), heading 10°, with speed set to 3 m/s, and the threat zone radius remains 200 m. The corresponding evaluation results are shown in Figure 13a.
Scenario 2: The Red team base remains at (0, 0). UUV1, UUV2, and UUV3 are deployed at (0.1, 0.25), (0.2, 0.1), and (0.45, 0.25) respectively, with headings set to −54°, −29°, and −67°, maintaining a speed of 2.5 m/s. The Blue UUV’s initial coordinates are (0.45, 0.6), heading 140°, with speed reduced to 1.5 m/s, and the threat zone radius remains 200 m. The corresponding evaluation results are shown in Figure 13b.
Scenario 3: The Red team base remains at (0, 0). UUV1, UUV2, and UUV3 are deployed at (0.1, 0.2), (0.2, 0.35), and (0.45, 0.2) respectively, with headings set to 174°, −9°, and 67°, maintaining a speed of 1 m/s. The Blue UUV’s initial coordinates are (0.3, 0.6), heading −20°, with speed also set to 1 m/s, and the threat zone radius remains 200 m. The corresponding evaluation results are shown in Figure 13c.
The inferred overall threat levels consistently match the expected tactical judgment across all nine cases. This face-validity check confirms that the CPTs, including the entries for the two newly incorporated factors, are logically consistent with the defined risk logic and produce reasonable assessments across a spectrum of engagement conditions.
Sensitivity Analysis of Adaptive Weighting Coefficients
To assess the robustness of the proposed continuous risk-driven weighting strategy (Strategy Five) with respect to parameter selection, we conduct a sensitivity analysis under a fixed medium-risk scenario. The simulation setup is as follows: Protected-area center at (0, 0). Cooperative UUV1 at (0.10, 0.35), heading −20°; UUV2 at (0.18, 0.35), heading 180°; UUV3 at (0.26, 0.35), heading 120°. All cooperative UUVs maintain a speed of 3.5 m/s. The payload module has a deployment velocity of 2 m/s and a range of 100 m. The target UUV is at (0.20, 0.50), heading 260°, speed 3.5 m/s. The Bayesian assessment for this scenario yields a medium threat level.
We vary the sensitivity parameter from 0.216 to 0.504 (i.e., −40% to +40% of its nominal value 0.36), adjusting the individual coefficients proportionally while maintaining the normalization constraints and . For each configuration, the composite evaluation values F for all six allocation schemes are computed. Table 8 presents the complete F-value matrix for all seven coefficient configurations, and Table 9 summarizes the optimal scheme and its corresponding F value for each configuration.
Table 8.
Complete F-value matrix for all coefficient configurations.
Table 9.
Summary of optimal scheme and F value under different sensitivity settings.
The results in Table 8 and Table 9 demonstrate that the optimal allocation scheme remains Scheme 2 across the entire tested range of from 0.216 to 0.504 (i.e., variation). The absolute value of F should only be compared within each row to determine the optimal scheme; comparing F values across different coefficient settings is not meaningful due to the changing weight distribution. The key result is the stability of the optimal scheme selection, which confirms the robustness of the proposed weighting strategy to moderate parameter perturbations.
Comparative Analysis of Strategic Point Allocation Strategies
Strategy Two ignores risk data entirely. It minimizes arrival-time spread J3 and locks the assignment. Coordination edges up compared to Strategy One, and the encirclement wraps up sooner. Still, it leans on a single static yardstick. It cannot read the risk or weigh other concerns. Completion time, while improved, is not as low as it could be.
Strategy Three brings in a multi-criteria setup. Nine metrics are weighted by risk level, and the allocation can switch. On paper, this paints a fuller picture of what matters. But the weights are preset in bands. At the extremes—high risk or low—one metric seizes the wheel. The system struggles to track the risk as it slides between zones. A shift from medium to low risk triggered two reassignments. In the second, UUVs already closing on their stations were yanked toward distant points because J3 suddenly dominated. Paths backtracked. The discrete jumps hurt continuity and efficiency. Completion time actually grew relative to Strategy One.
Strategy Four extends Strategy Three with rule-tied weight adjustments. The metrics can move more fluidly as the risk picture changes. Only one reassignment fired. The trajectories stayed clean, no doubling back. The cooperative UUVs completed target containment at 0.105 h. The approach shows that clamping down on extreme weight swings preserves decision flow.
Strategy Five turned in the same numbers here: same allocations, same tracks, same 0.105-h hit time. Against the baseline methods, task completion time dropped roughly 22.2% versus Strategy One, 9.5% versus Strategy Two, and 22.8% versus Strategy Three. Adaptive weighting clearly pushes the encirclement to close faster.
Rule-based schemes like Strategy Four can track continuous risk effects when conditions stay mild. But their fixed rule sets leave them flat-footed if the environment turns fast or noisy. Strategy Five’s continuous mapping sidesteps that. Weights shift in lockstep with the risk signal. The approach generalizes better across uncertain tactical scenes. Given how closely the two aligned in this test, Strategy Five reads as the smoother, more general extension of Strategy Four.
The encirclement completion time of five strategies is compared in Table 10. Strategy Four and Strategy Five achieve the fastest time (0.105 h). Compared to Strategy Five, Strategy One is 22.2% slower and Strategy Three is 22.8% slower. Strategy Two is 9.5% slower.
Table 10.
Comparison of encirclement performance across strategies.
The initial and final allocation schemes, the number of reassignments, and whether path backtracking occurred are listed in Table 11. Strategies One and Two have no reassignments. Strategy Three has two reassignments and exhibits backtracking. Strategies Four and Five have one reassignment each and no backtracking.
Table 11.
Comparison of reassignment events and initial allocation schemes across strategies.
Control loop rate and continuity under communication dropouts
In the current implementation, the control loop operates at a fixed time step of h (approximately 0.36 s), which is sufficiently small relative to the typical time scales of UUV maneuvering and mission engagement. The adaptive weighting strategy updates the allocation priorities at each decision cycle based on the latest Bayesian threat assessment, ensuring that the weight adjustments respond smoothly to changes in the inferred risk level rather than through abrupt discrete switches.
Regarding communication dropouts, while the present simulation framework assumes ideal acoustic communication for simplicity, the operational logic ensures continuity even under intermittent link losses. Specifically, each cooperative UUV is designed to continue executing its most recently assigned strategic point using its onboard navigation and control systems, without requiring real-time updates from other platforms. During the dropout period, the allocation weights and the assigned target point remain unchanged, ensuring that the encirclement formation does not stall or become erratic. When the communication link is restored, the global situational information is refreshed and the full closed-loop Bayesian assessment and weight-adjustment process resumes. This ideal-communication assumption is explicitly acknowledged as a limitation in the Section 6 and the development of communication-robust decision mechanisms is identified as an important direction for future research.
6. Conclusions
This work addresses multi-UUV cooperative encirclement of a single target. We built a closed-loop decision pipeline meant for fluid, uncertain settings. It targets three weak points: static risk appraisal, the gap between coordination-point assignment and the live situation picture, and position-adjustment planning that fails to guarantee executable task completion from start to finish.
First, a Bayesian network grades the risk. It weighs target heading, range, how many cooperative UUVs are available for action, the fraction within the target’s effective range, and the target’s speed. The output is a probabilistic reading—High, Medium, or Low—that feeds the next step. This probabilistic treatment reveals that adversarial risk is inherently multi-dimensional and cannot be reduced to a single deterministic threshold; rather, it must be quantified as a belief state that updates continuously as new evidence arrives.
Second, station allocation adapts to that risk level. A multi-criteria scheme tracks time-to-station, arrival spread, turning burden, and path safety. Weights shift as the risk posture changes. The assignment stays flexible. This demonstrates that the trade-off between speed and coordination is not a fixed choice but a continuum that should be modulated by the tactical environmental finding that challenges the common practice of using static objective functions in dynamic confrontation settings.
Third, we added an online solver for Position-Adjusted Execution, built on the Corner-Based Deployment model. It checks the attacker’s reachable region against the payload’s feasible deployment envelope. The method flags three cases—Immediate Execution, Position-Adjusted Execution Feasible, or Position-Adjusted Execution Infeasible—and computes the needed parameters fast enough to keep the engagement window open. Crucially, this online feasibility check ensures that the allocation decision and the physical execution are linked by a continuous geometric consistency condition, without which even the most optimal allocation would fail upon arrival.
Tying these pieces together yields a full autonomous encirclement framework. Simulations show it adjusts the encirclement formation as the risk rises and falls. Task completion time drops by up to 22.8% over conventional baselines. Success rate, response speed, and arrival consistency all improve. These results confirm that closing the feedback loop between risk awareness and action selection is the key enabler of adaptive performance—not merely adding more computational power, but structurally coupling perception and decision-making.
Despite these encouraging results, the proposed framework has several limitations. First, the current implementation assumes that the target UUV’s state (position, heading, and speed) is accurately known at each decision cycle. In practical underwater environments, sensor noise, multipath propagation, and acoustic communication disruptions may introduce estimation errors that are not explicitly modeled in the present Bayesian framework. Second, although the weighting coefficients in the continuous risk-driven strategy adapt to the inferred risk level, their baseline values remain pre-configured rather than being autonomously learned from operational data. Third, the target UUV’s maneuvering capability is represented only through its speed. Other factors, such as acceleration constraints, turning performance, hydrodynamic effects, and adaptive tactical behaviors, are not explicitly considered. Fourth, the framework is primarily developed and validated for a single-target encirclement scenario involving a limited number of cooperative UUVs. It does not directly scale to multi-target or multi-intruder environments, as multiple simultaneous threats would introduce coupled risk interactions and significantly increase the combinatorial complexity of coordination-point allocation.
Future work will focus on addressing these limitations from three aspects. First, state-estimation techniques such as extended Kalman filtering or particle filtering will be integrated into the Bayesian assessment module to improve robustness against noisy and incomplete observations. Second, online optimization and learning-based methods will be investigated to enable autonomous calibration of the adaptive weighting coefficients. Third, the framework will be extended to more complex scenarios involving multiple targets, larger cooperative UUV teams, and more sophisticated target maneuvers, with particular emphasis on scalable assignment algorithms, multi-target risk coupling, and behavior prediction in dynamic underwater confrontation environments.
Author Contributions
Conceptualization, J.F. and C.Q.; Methodology, J.F.; Software, J.F. and D.Z.; Funding Acquisition, J.F.; Writing—Original Draft Preparation, J.F.; Writing—Review & Editing, P.C. and J.D.; Visualization, J.F. and P.C. All authors have read and agreed to the published version of the manuscript.
Funding
This work was supported by the Jiangsu Province Young Science and Technology Talent Lifting Project (JSTJ-2024-540).
Data Availability Statement
Data are contained within the article.
Conflicts of Interest
The authors declare no conflicts of interest.
Nomenclature
| Symbol/Abbreviation | Description |
| UUV | Unmanned underwater vehicle |
| CPT | Conditional Probability Table |
| TL | Threat level |
| H | High risk |
| M | Medium risk |
| L | Low risk |
| Target heading deviation angle | |
| Target distance to protected area | |
| Number of attack-capable UUVs | |
| Proportion of threatened UUVs | |
| Target UUV speed | |
| Earliest arrival time | |
| Latest arrival time | |
| Time balance | |
| Total path length | |
| Minimum steering angle | |
| Maximum steering angle | |
| Steering angle balance | |
| Total steering angle | |
| Number of path crossings |
References
- Wibisono, A.; Piran, M.; Song, H.; Lee, B. A survey on unmanned underwater vehicles: Challenges, enabling technologies, and future research directions. Sensors 2023, 23, 7321. [Google Scholar] [CrossRef] [Scilit] [PubMed]
- Ni, J.; Yang, L.; Wu, L.; Fan, X. An improved spinal neural system-based approach for heterogeneous AUVs cooperative hunting. Int. J. Fuzzy Syst. 2018, 20, 672–686. [Google Scholar]
- Liang, H.; Fu, Y.; Kang, F.; Gao, J.; Qiang, N. A behavior-driven coordination control framework for target hunting by UUV intelligent swarm. IEEE Access 2020, 8, 4838–4859. [Google Scholar] [CrossRef] [Scilit]
- Li, Y.; Xie, S.; Yu, H.; Zhang, H.; Zhang, Z.; Luo, X. Spatial–temporal intention representation with multi-agent reinforcement learning for unmanned surface vehicles strategies learning in asset guarding task. Eng. Appl. Artif. Intell. 2025, 145, 110120. [Google Scholar] [CrossRef] [Scilit]
- Chen, Q.; Liu, B.; Yu, C.; Yang, M.; Guo, H. Task Allocation and Saturation Attack Approach for Unmanned Underwater Vehicles. Drones 2025, 9, 115. [Google Scholar] [CrossRef] [Scilit]
- Chen, C.; Liang, X.; Zhang, Z.; Liu, D.; Li, W. Cooperative strategy based on a two-layer game model for inferior USVs to intercept a superior USV. Ocean Eng. 2024, 293, 116600. [Google Scholar]
- Zhong, W.; Tan, Q.; Yan, S.; Meng, Y.; Ye, N. USVs cooperative hunting method based on advantage decomposition and sequential decision. Ocean Eng. 2025, 318, 120123. [Google Scholar] [CrossRef] [Scilit]
- Lin, C.; Han, G.; Zhang, T.; Shah, S.; Peng, Y. Smart underwater pollution detection based on graph-based multi-agent reinforcement learning towards AUV-based network ITS. IEEE Trans. Intell. Transp. Syst. 2022, 24, 7494–7505. [Google Scholar]
- Zhu, Y.; Chen, L.; Liu, S.; Yang, B.; Gao, S. Blockchain-Based Lightweight Key Management Scheme for Secure UAV Swarm Task Allocation. IEEE Trans. Netw. Serv. Manag. 2026, 23, 1201–1216. [Google Scholar]
- Hou, X.; Xing, T.; Wang, J.; Du, J.; Jiang, C.; Ren, Y.; Niyato, D. Age of Information-Aware Multi-Objective Optimization for Heterogeneous UAV-USV-UUV Networks in Underwater Target Hunting. IEEE Trans. Mob. Comput. 2025, 24, 11292–11304. [Google Scholar]
- Hou, Y.; Han, G.; Zhang, F.; Lin, C.; Peng, J.; Liu, L. Distributional soft actor-critic-based multi-AUV cooperative pursuit for maritime security protection. IEEE Trans. Intell. Transp. Syst. 2023, 25, 6049–6060. [Google Scholar]
- Pang, W.; Zhu, D.; Chen, M.; Wang, Z.; Wang, B. A cooperative heterogeneous formation control and motion planning design of 3U: UAV-USV-UUV systems. Ocean Eng. 2026, 347, 123867. [Google Scholar]
- Chen, M.; Zhu, D.; Pang, W.; Chen, Q. An effective strategy for distributed unmanned underwater vehicles to encircle and capture intelligent targets. IEEE Trans. Ind. Electron. 2024, 71, 12570–12580. [Google Scholar] [CrossRef] [Scilit]
- Ke, C.; Chen, H. Cooperative path planning for air–sea heterogeneous unmanned vehicles using search-and-tracking mission. Ocean Eng. 2022, 262, 112020. [Google Scholar]
- Wang, S.; Lin, C.; Han, G.; Zhu, S.; Li, Z.; Wang, Z.; Ma, Y. Multi-AUV cooperative underwater multi-target tracking based on dynamic-switching-enabled multi-agent reinforcement learning. IEEE Trans. Mob. Comput. 2024, 24, 4296–4311. [Google Scholar]
- Zhu, D.; Lv, R.; Cao, X.; Yang, S. Multi-AUV hunting algorithm based on bio-inspired neural network in unknown environments. Int. J. Adv. Robot. Syst. 2015, 12, 166. [Google Scholar] [CrossRef] [Scilit]
- Yu, H.; Zhang, S. Collaborative task decision-making of multi-UUV in dynamic environments based on deep reinforcement learning. Ships Offshore Struct. 2025, 20, 1272–1282. [Google Scholar]
- Wei, W.; Wang, J.; Du, J.; Fang, Z.; Ren, Y.; Chen, C. Differential game-based deep reinforcement learning in underwater target hunting task. IEEE Trans. Neural Netw. Learn. Syst. 2023, 36, 462–474. [Google Scholar] [CrossRef] [Scilit]
- Shi, W.; Song, S.; Wu, C.; Chen, C. Multi pseudo Q-learning-based deterministic policy gradient for tracking control of autonomous underwater vehicles. IEEE Trans. Neural Netw. Learn. Syst. 2018, 30, 3534–3546. [Google Scholar] [PubMed]
- Zhang, L.; Ying, Z.; Cai, J.; Li, W.; Zhao, Y. DAC-UAV: A Secure and Adaptive Task Scheduling Framework for UAVs Based on Dynamic Anonymous Credentials. Comput. Netw. 2025, 275, 111922. [Google Scholar] [CrossRef] [Scilit]
- Lu, J.; Yuan, Z.; Wang, N. Dynamic Self-Triggered Fuzzy Formation Control for UAV Swarm with Prescribed-Time Convergence. Drones 2025, 9, 715. [Google Scholar]
- Escobedo, R.; Muro, C.; Spector, L.; Coppinger, R. Group size, individual role differentiation and effectiveness of cooperation in a homogeneous group of hunters. J. R. Soc. Interface 2014, 11, 20140204. [Google Scholar] [CrossRef] [Scilit] [PubMed]
- Meng, X.; Sun, B.; Zhu, D. Harbour protection: Moving invasion target interception for multi-AUV based on prediction planning interception method. Ocean Eng. 2021, 219, 108268. [Google Scholar] [CrossRef] [Scilit]
- Galati, G.; Primatesta, S.; Rizzo, A. Auction-based task allocation and motion planning for multi-robot systems with human supervision. J. Intell. Robot. Syst. 2023, 109, 24. [Google Scholar]
- Li, Z.; Shi, N.; Zhao, L.; Zhang, M. Deep reinforcement learning path planning and task allocation for multi-robot collaboration. Alex. Eng. J. 2024, 109, 408–423. [Google Scholar] [CrossRef] [Scilit]
- Zhang, Z.; Liu, H.; Wu, G. A dynamic task scheduling method for multiple UAVs based on contract net protocol. Sensors 2022, 22, 4486. [Google Scholar] [CrossRef] [Scilit] [PubMed]
- Wang, H.; Li, H.; Wang, X.; Xia, S.; Liu, T.; Wang, R. Resource Allocation in UAV-D2D Networks: A Scalable Heterogeneous Multi-Agent Deep Reinforcement Learning Approach. Electronics 2024, 13, 4401. [Google Scholar] [CrossRef] [Scilit]
- Wang, Z.; Du, J.; Jiang, C.; Xia, Z.; Ren, Y.; Han, Z. Task scheduling for distributed AUV network target hunting and searching: An energy-efficient AoI-aware DMAPPO approach. IEEE Internet Things J. 2022, 10, 8271–8285. [Google Scholar]
- Dai, M.; Luo, Z.; Wu, Y.; Qian, L.; Lin, B.; Su, Z. Incentive oriented two-tier task offloading scheme in marine edge computing networks: A hybrid stackelberg-auction game approach. IEEE Trans. Wirel. Commun. 2023, 22, 8603–8619. [Google Scholar] [CrossRef] [Scilit]
- You, J.; Jia, J.; Pang, X.; Wen, J.; Shi, Y.; Zeng, J. A novel multi-robot task assignment scheme based on a multi-angle k-means clustering algorithm and a two-stage load-balancing strategy. Electronics 2023, 12, 3842. [Google Scholar]
- Zhuang, Y.; Huang, H.; Sharma, S.; Xu, D.; Zhang, Q. Cooperative path planning of multiple autonomous underwater vehicles operating in dynamic ocean environment. ISA Trans. 2019, 94, 174–186. [Google Scholar] [CrossRef] [Scilit] [PubMed]
- Wang, Y.; Liu, K.; Geng, L.; Zhang, S. Knowledge hierarchy-based dynamic multi-objective optimization method for AUV path planning in cooperative search missions. Ocean Eng. 2024, 312, 119267. [Google Scholar] [CrossRef] [Scilit]
- Pang, W.; Zhu, D.; Chu, Z.; Chen, Q. Distributed adaptive formation reconfiguration control for multiple AUVs based on affine transformation in three-dimensional ocean environments. IEEE Trans. Veh. Technol. 2023, 72, 7338–7350. [Google Scholar] [CrossRef] [Scilit]
- Yan, Z.; Li, J.; Wu, Y.; Yang, Z. A novel path planning for AUV based on objects’ motion parameters predication. IEEE Access 2018, 6, 69304–69320. [Google Scholar] [CrossRef] [Scilit]
- Jiang, B.; Du, J.; Jiang, C.; Han, Z.; Debbah, M. Underwater searching and multiround data collection via AUV swarms: An energy-efficient AoI-aware MAPPO approach. IEEE Internet Things J. 2023, 11, 12768–12782. [Google Scholar]
- Chen, J.; Wang, J.; Wei, Z.; Ren, Y.; Masouros, C.; Han, Z. Joint autonomous underwater vehicle trajectory and energy optimization for underwater covert communications. IEEE Trans. Commun. 2024, 72, 7327–7341. [Google Scholar] [CrossRef] [Scilit]
- Yin, C.; Shi, K.; Wang, H. The Equal-Time Waypoint Method: A Multi-AUV Path Planning Approach That Is Based on Velocity Variation. Drones 2025, 9, 336. [Google Scholar]
- Liu, X.; Fang, Y.; Zhan, Z.; Jiang, Y.; Zhang, J. A cooperative evolutionary computation algorithm for dynamic multiobjective multi-AUV path planning. IEEE Trans. Ind. Inform. 2023, 20, 669–680. [Google Scholar] [CrossRef] [Scilit]
- Huang, F.; Zhang, W.; Guo, D.; Wang, L.; Cui, Y. Enclosing Control Based on Deep Reinforcement Learning for Underactuated AUV Swarms. In Proceedings of the 2025 10th Asia-Pacific Conference on Intelligent Robot Systems (ACIRS); IEEE: Piscataway, NJ, USA, 2025; pp. 202–209. [Google Scholar]
- Hong, X.; Wang, Z.; Wang, Y.; Chao, X.; Yang, G. Multi-UAV Dynamic Target Search Based on Multi-Potential-Field Fusion Reward Shaping MAPPO. Drones 2025, 9, 770. [Google Scholar] [CrossRef] [Scilit]
- Han, G.; Feng, Z.; Wang, H.; Hou, Y.; Zhang, F. Underwater multi-target node path planning in hybrid action space: A deep reinforcement learning approach. IEEE Trans. Mob. Comput. 2024, 23, 13033–13047. [Google Scholar] [CrossRef] [Scilit]
- He, J. Research on UUVs Cooperative Countermeasures and Path Optimization Methods for Base Defense; Harbin Engineering University: Harbin, China, 2021. [Google Scholar]
- Andersen, K.S. Probabilistic reasoning in intelligent systems: Networks of plausible inference: Judea Pearl. Artif. Intell. 1991, 48, 117–124. [Google Scholar]
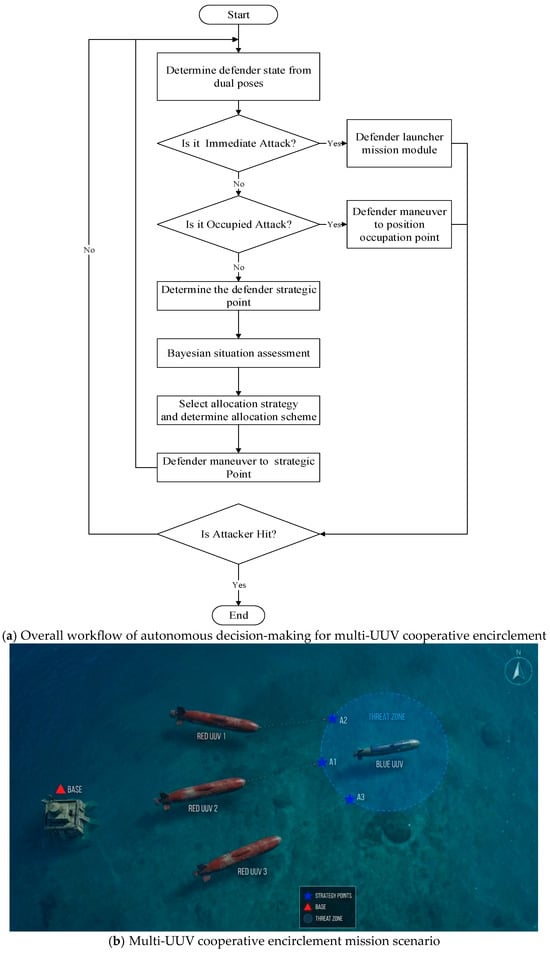
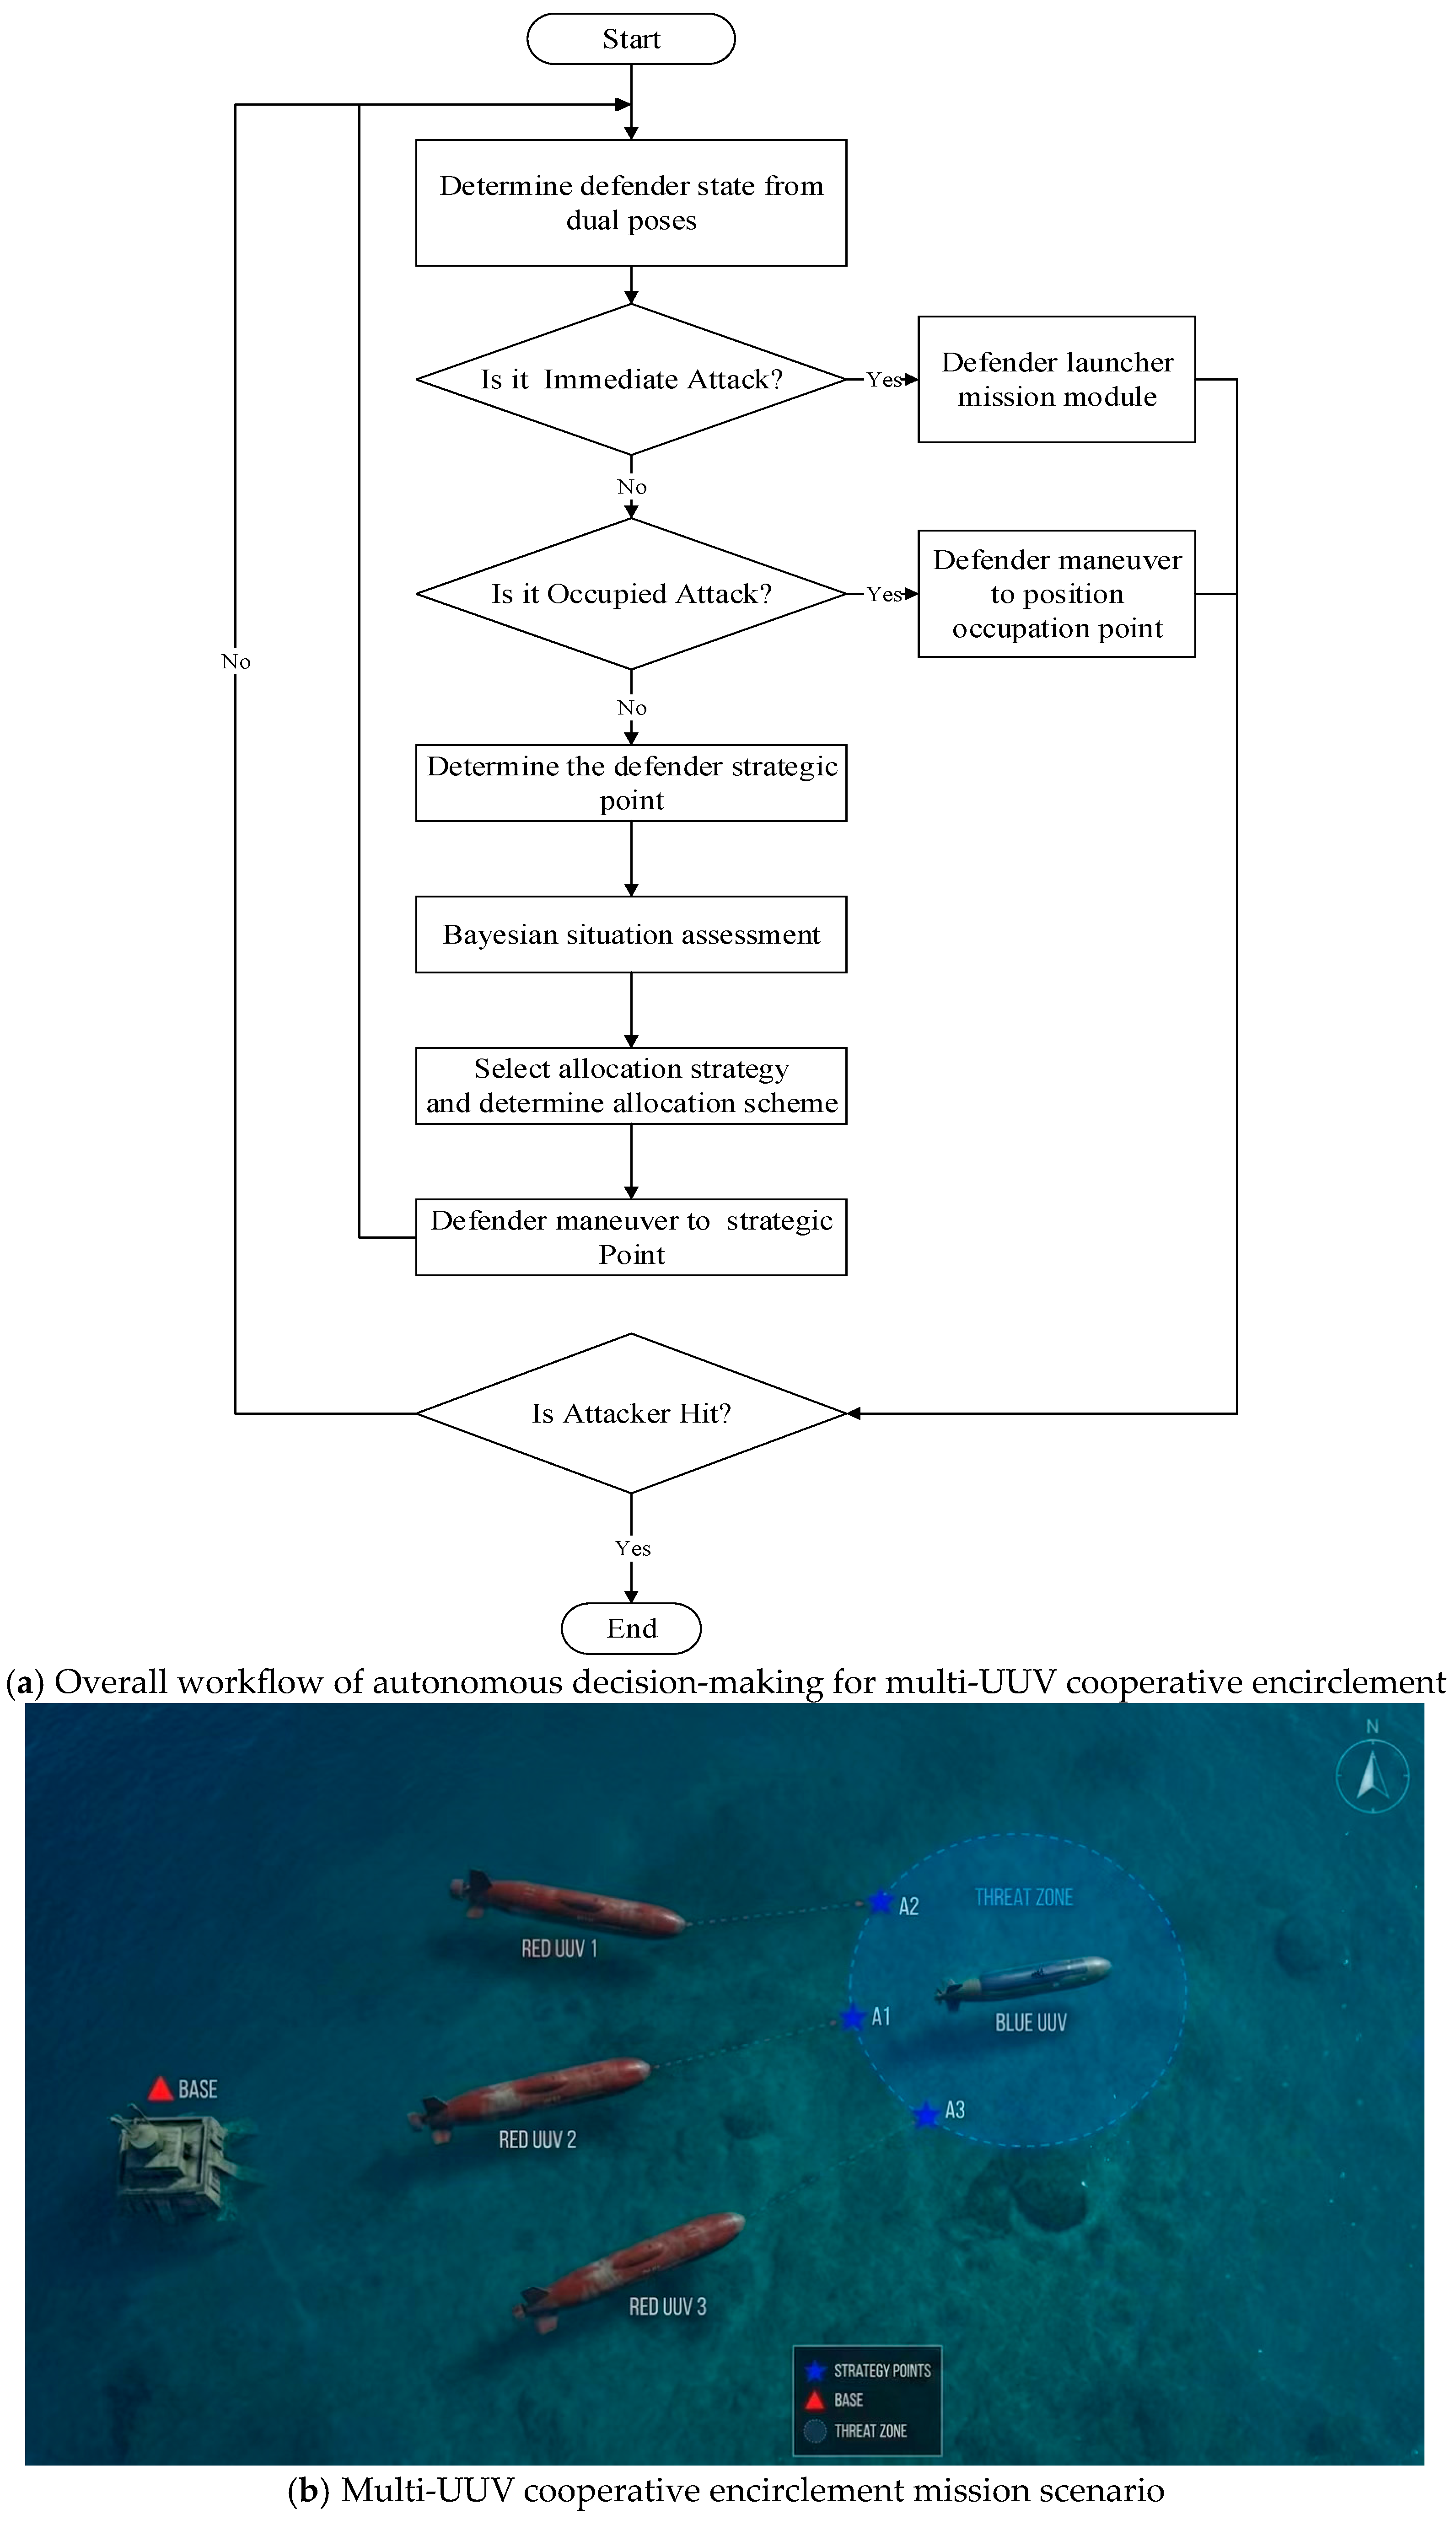
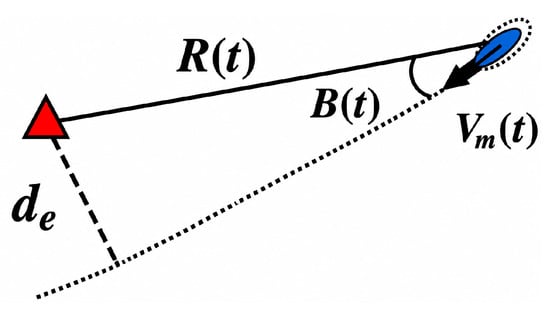
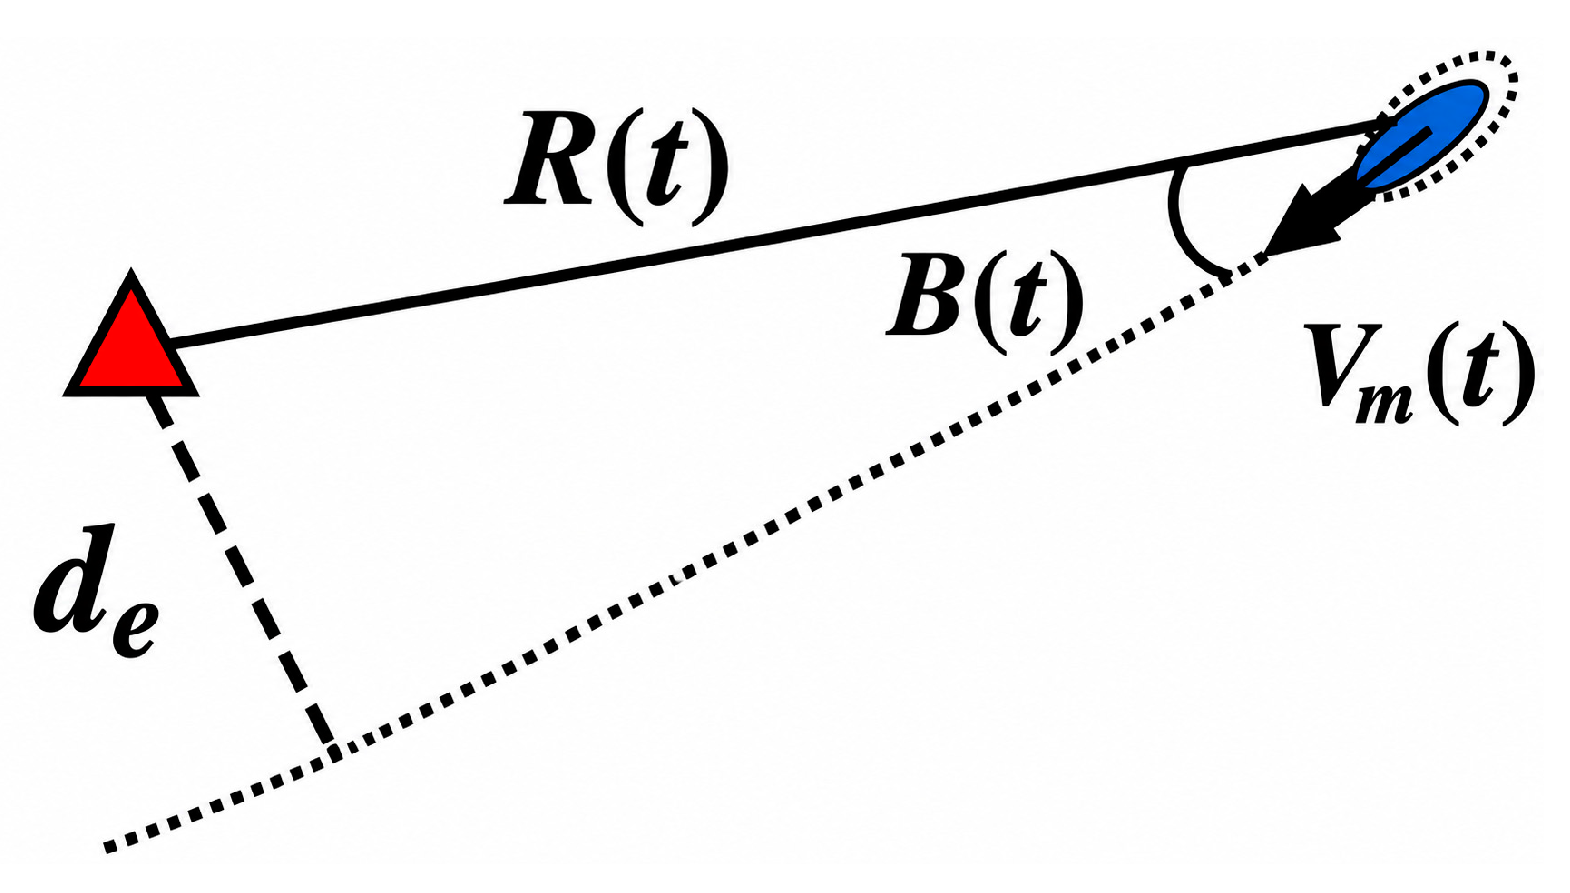
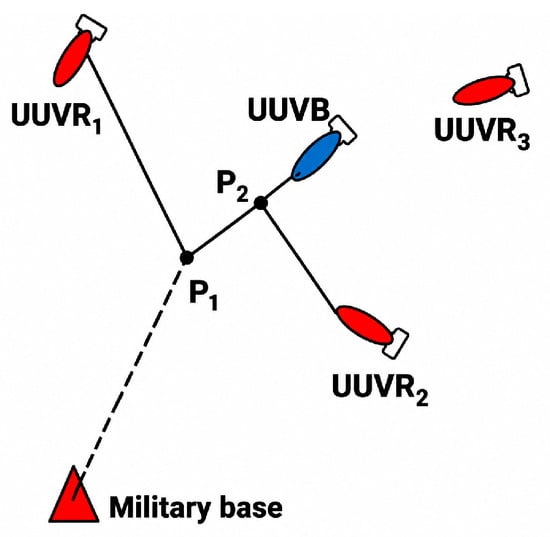
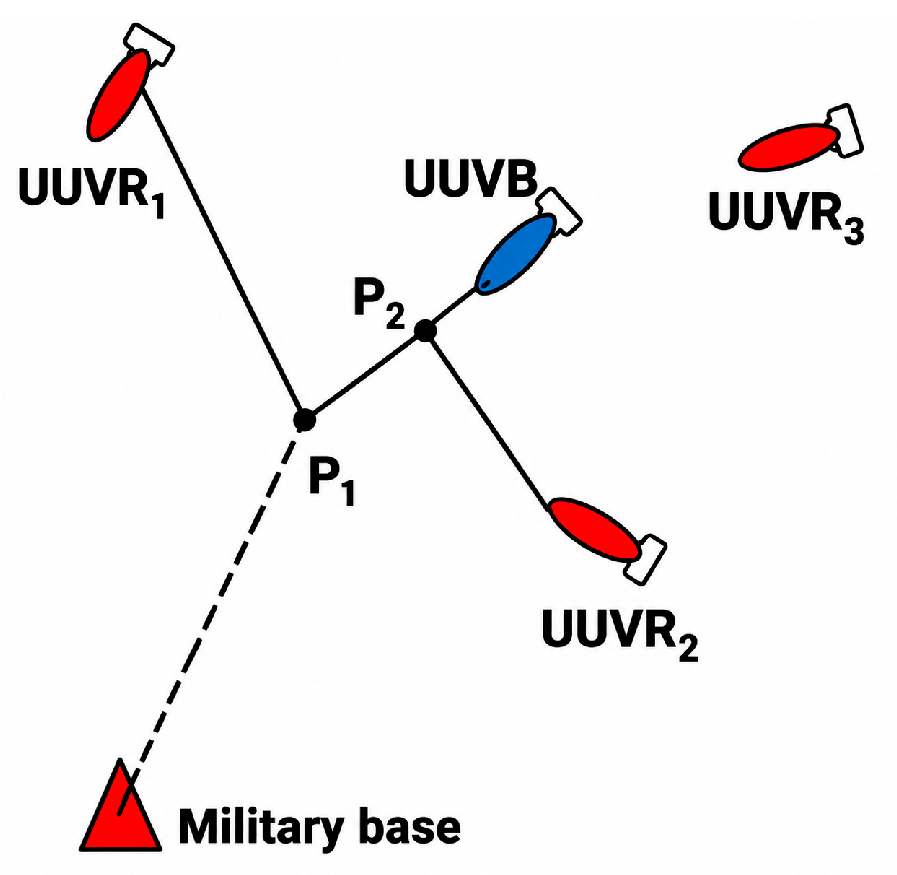
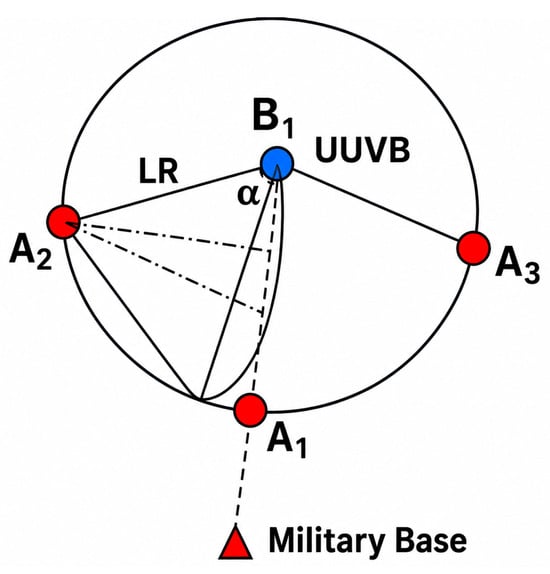
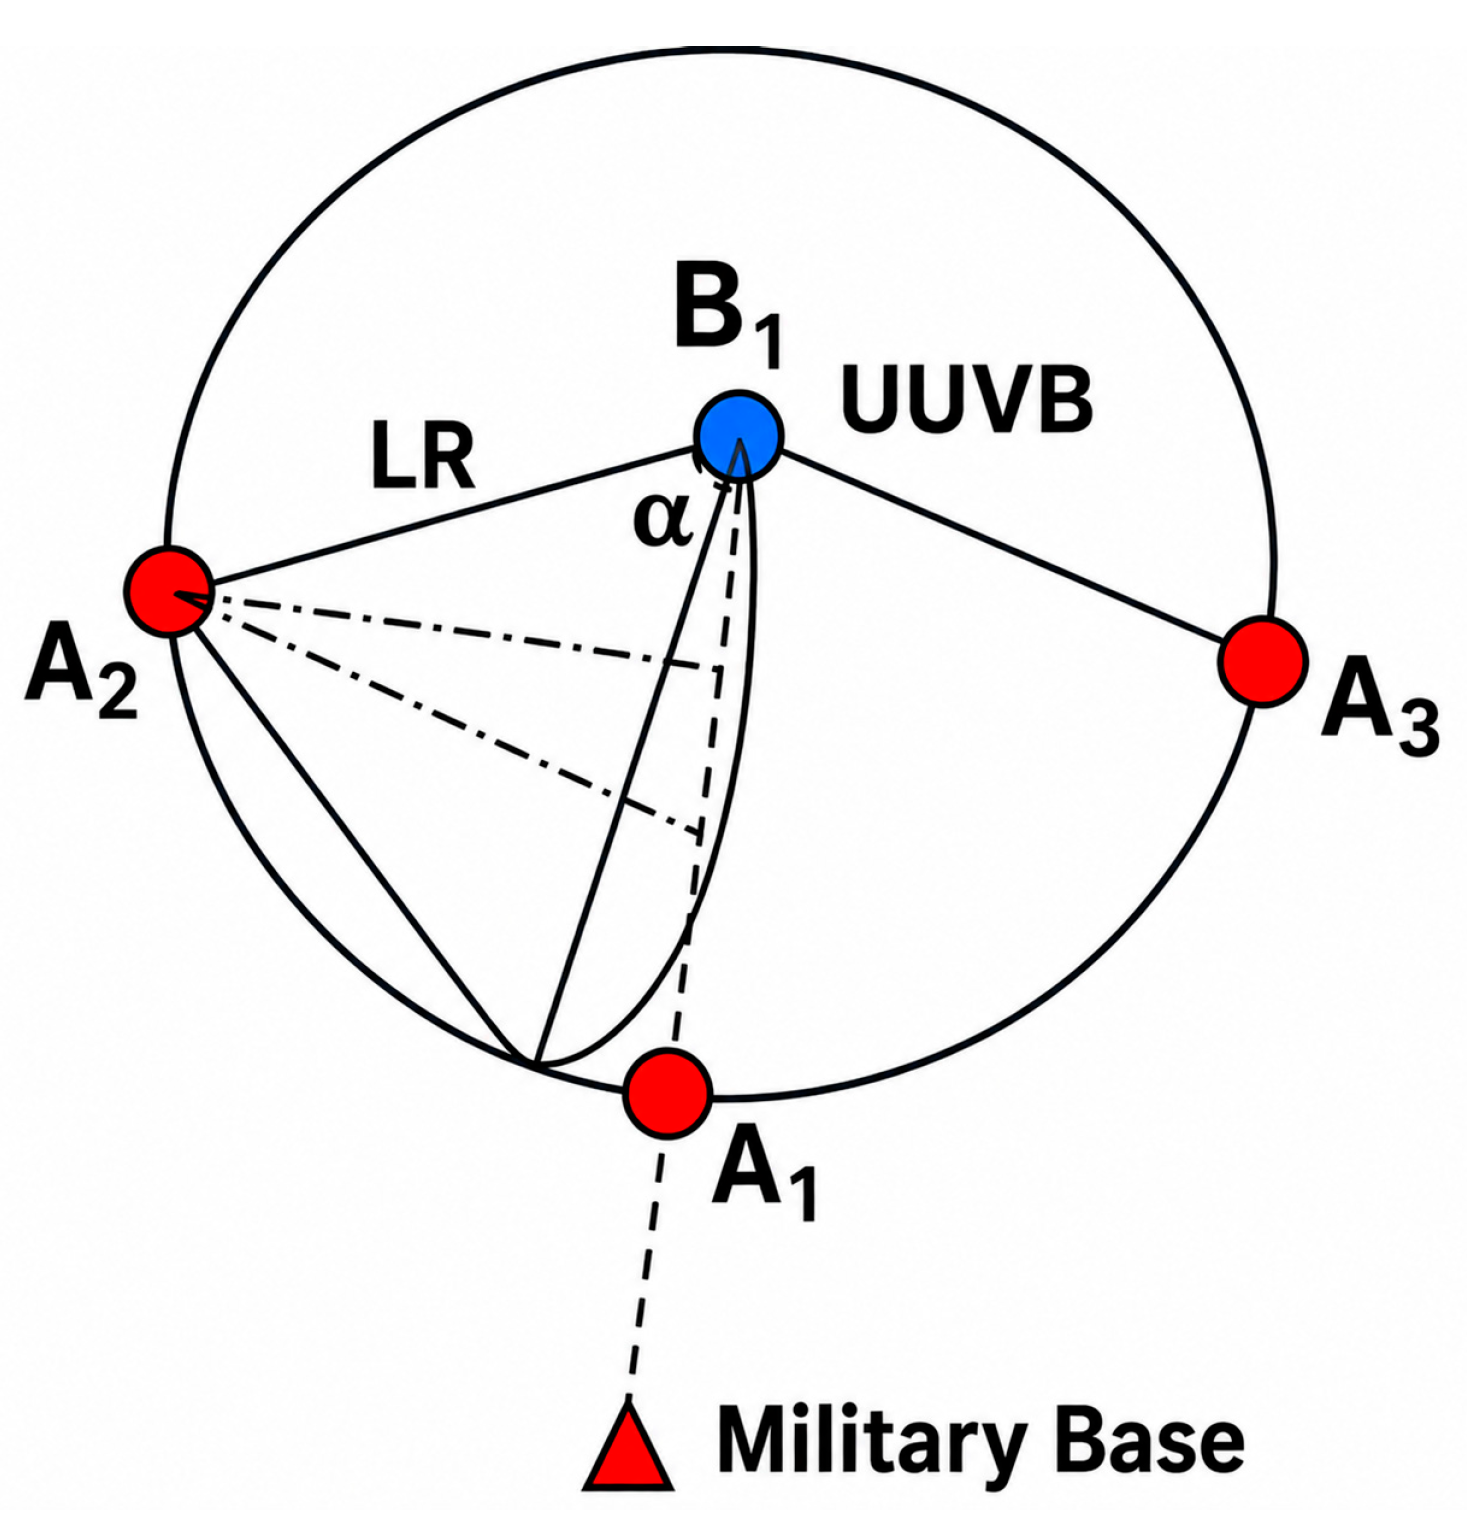
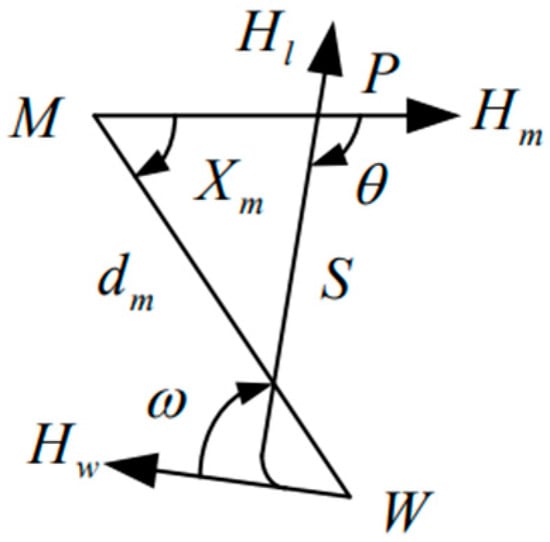
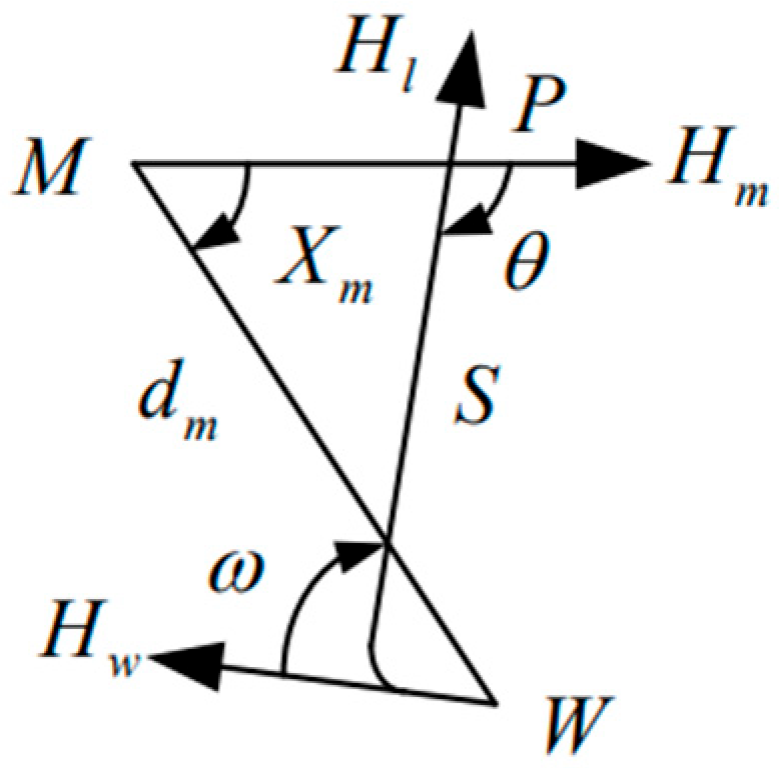
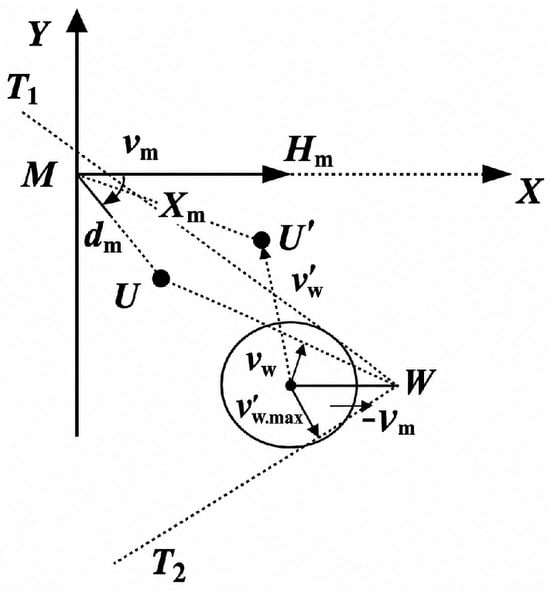
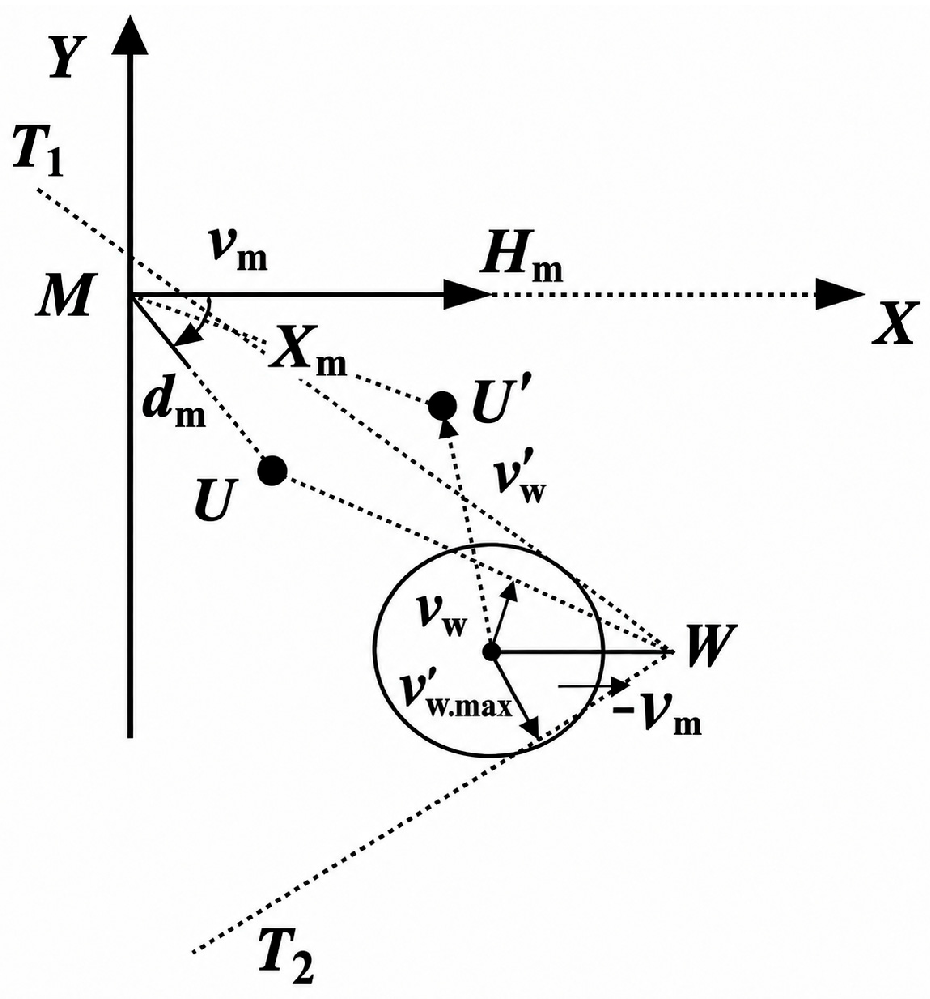
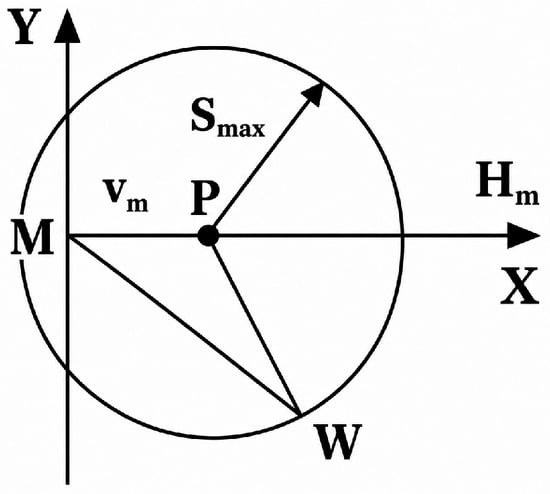
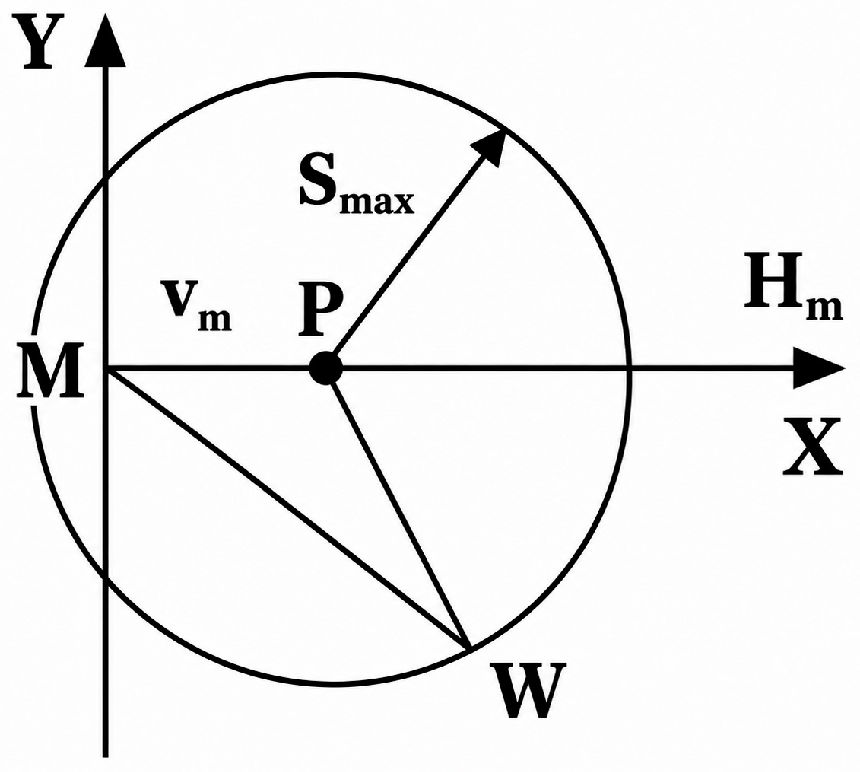
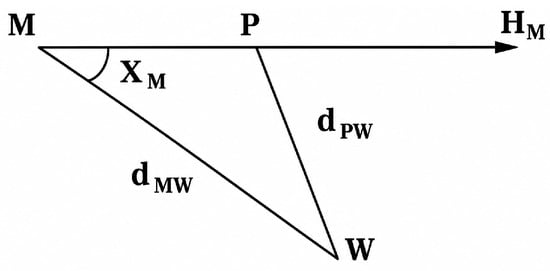
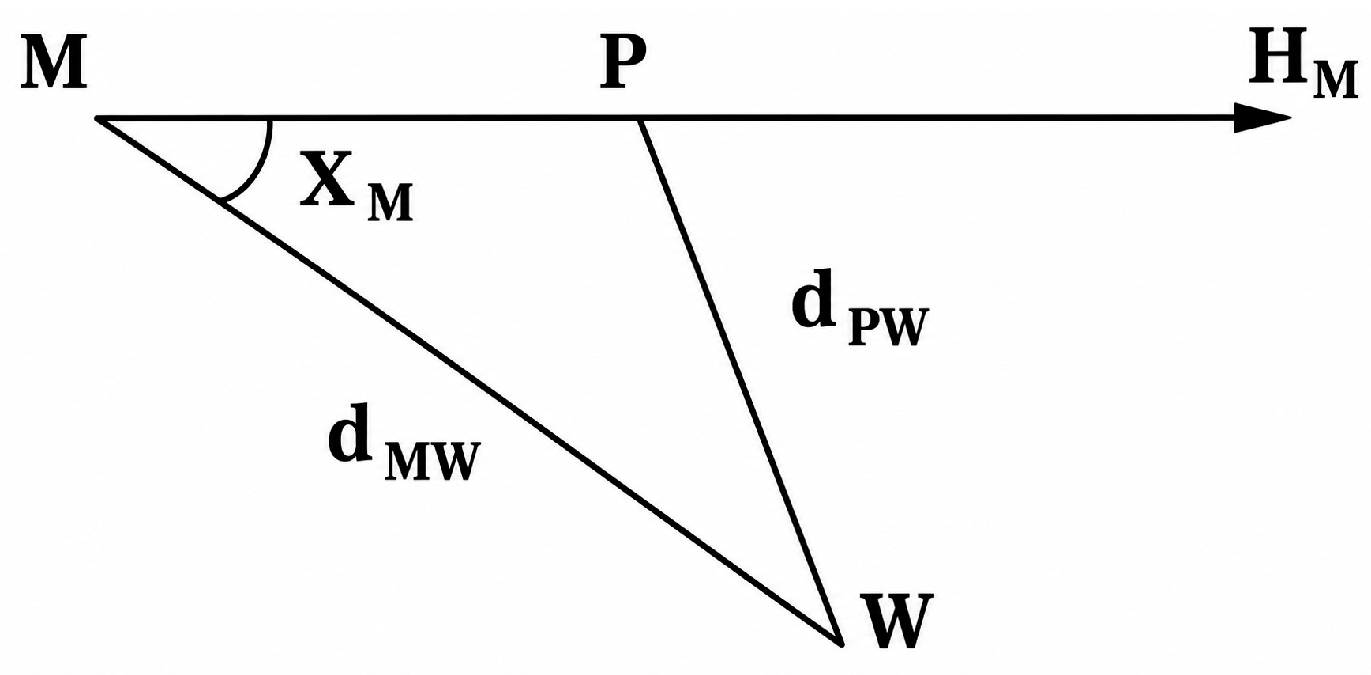
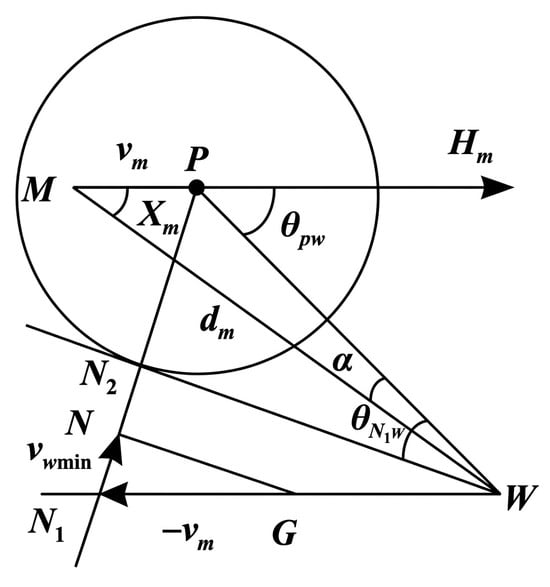
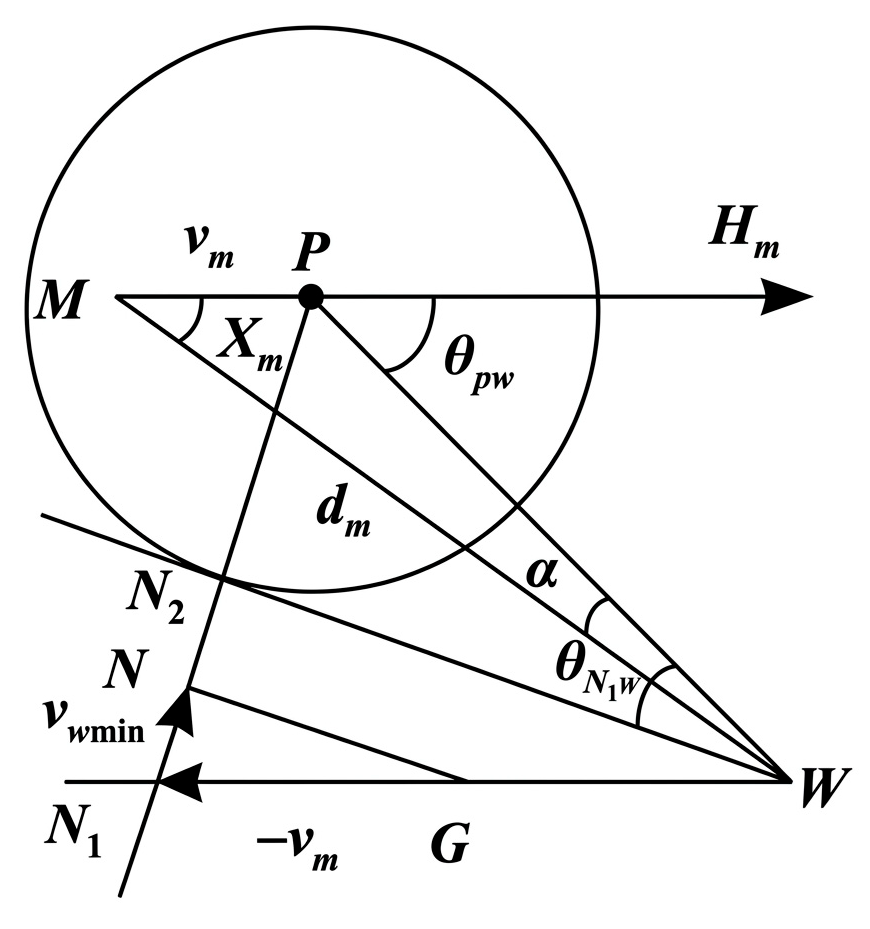
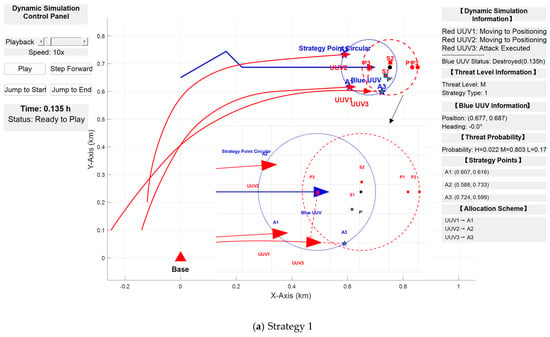
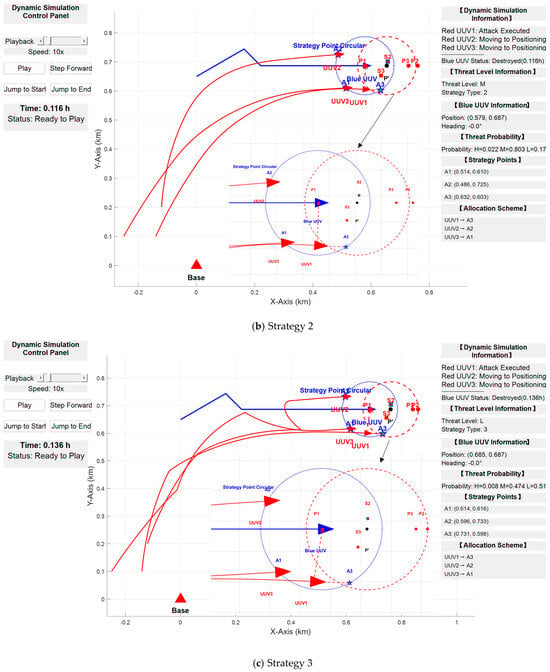
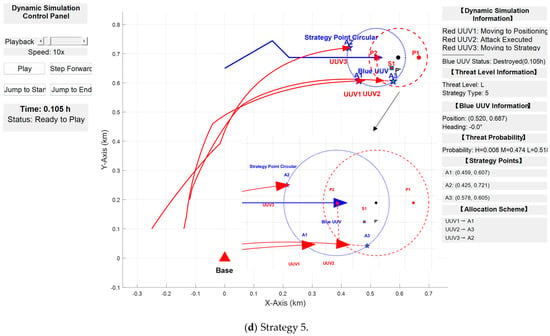
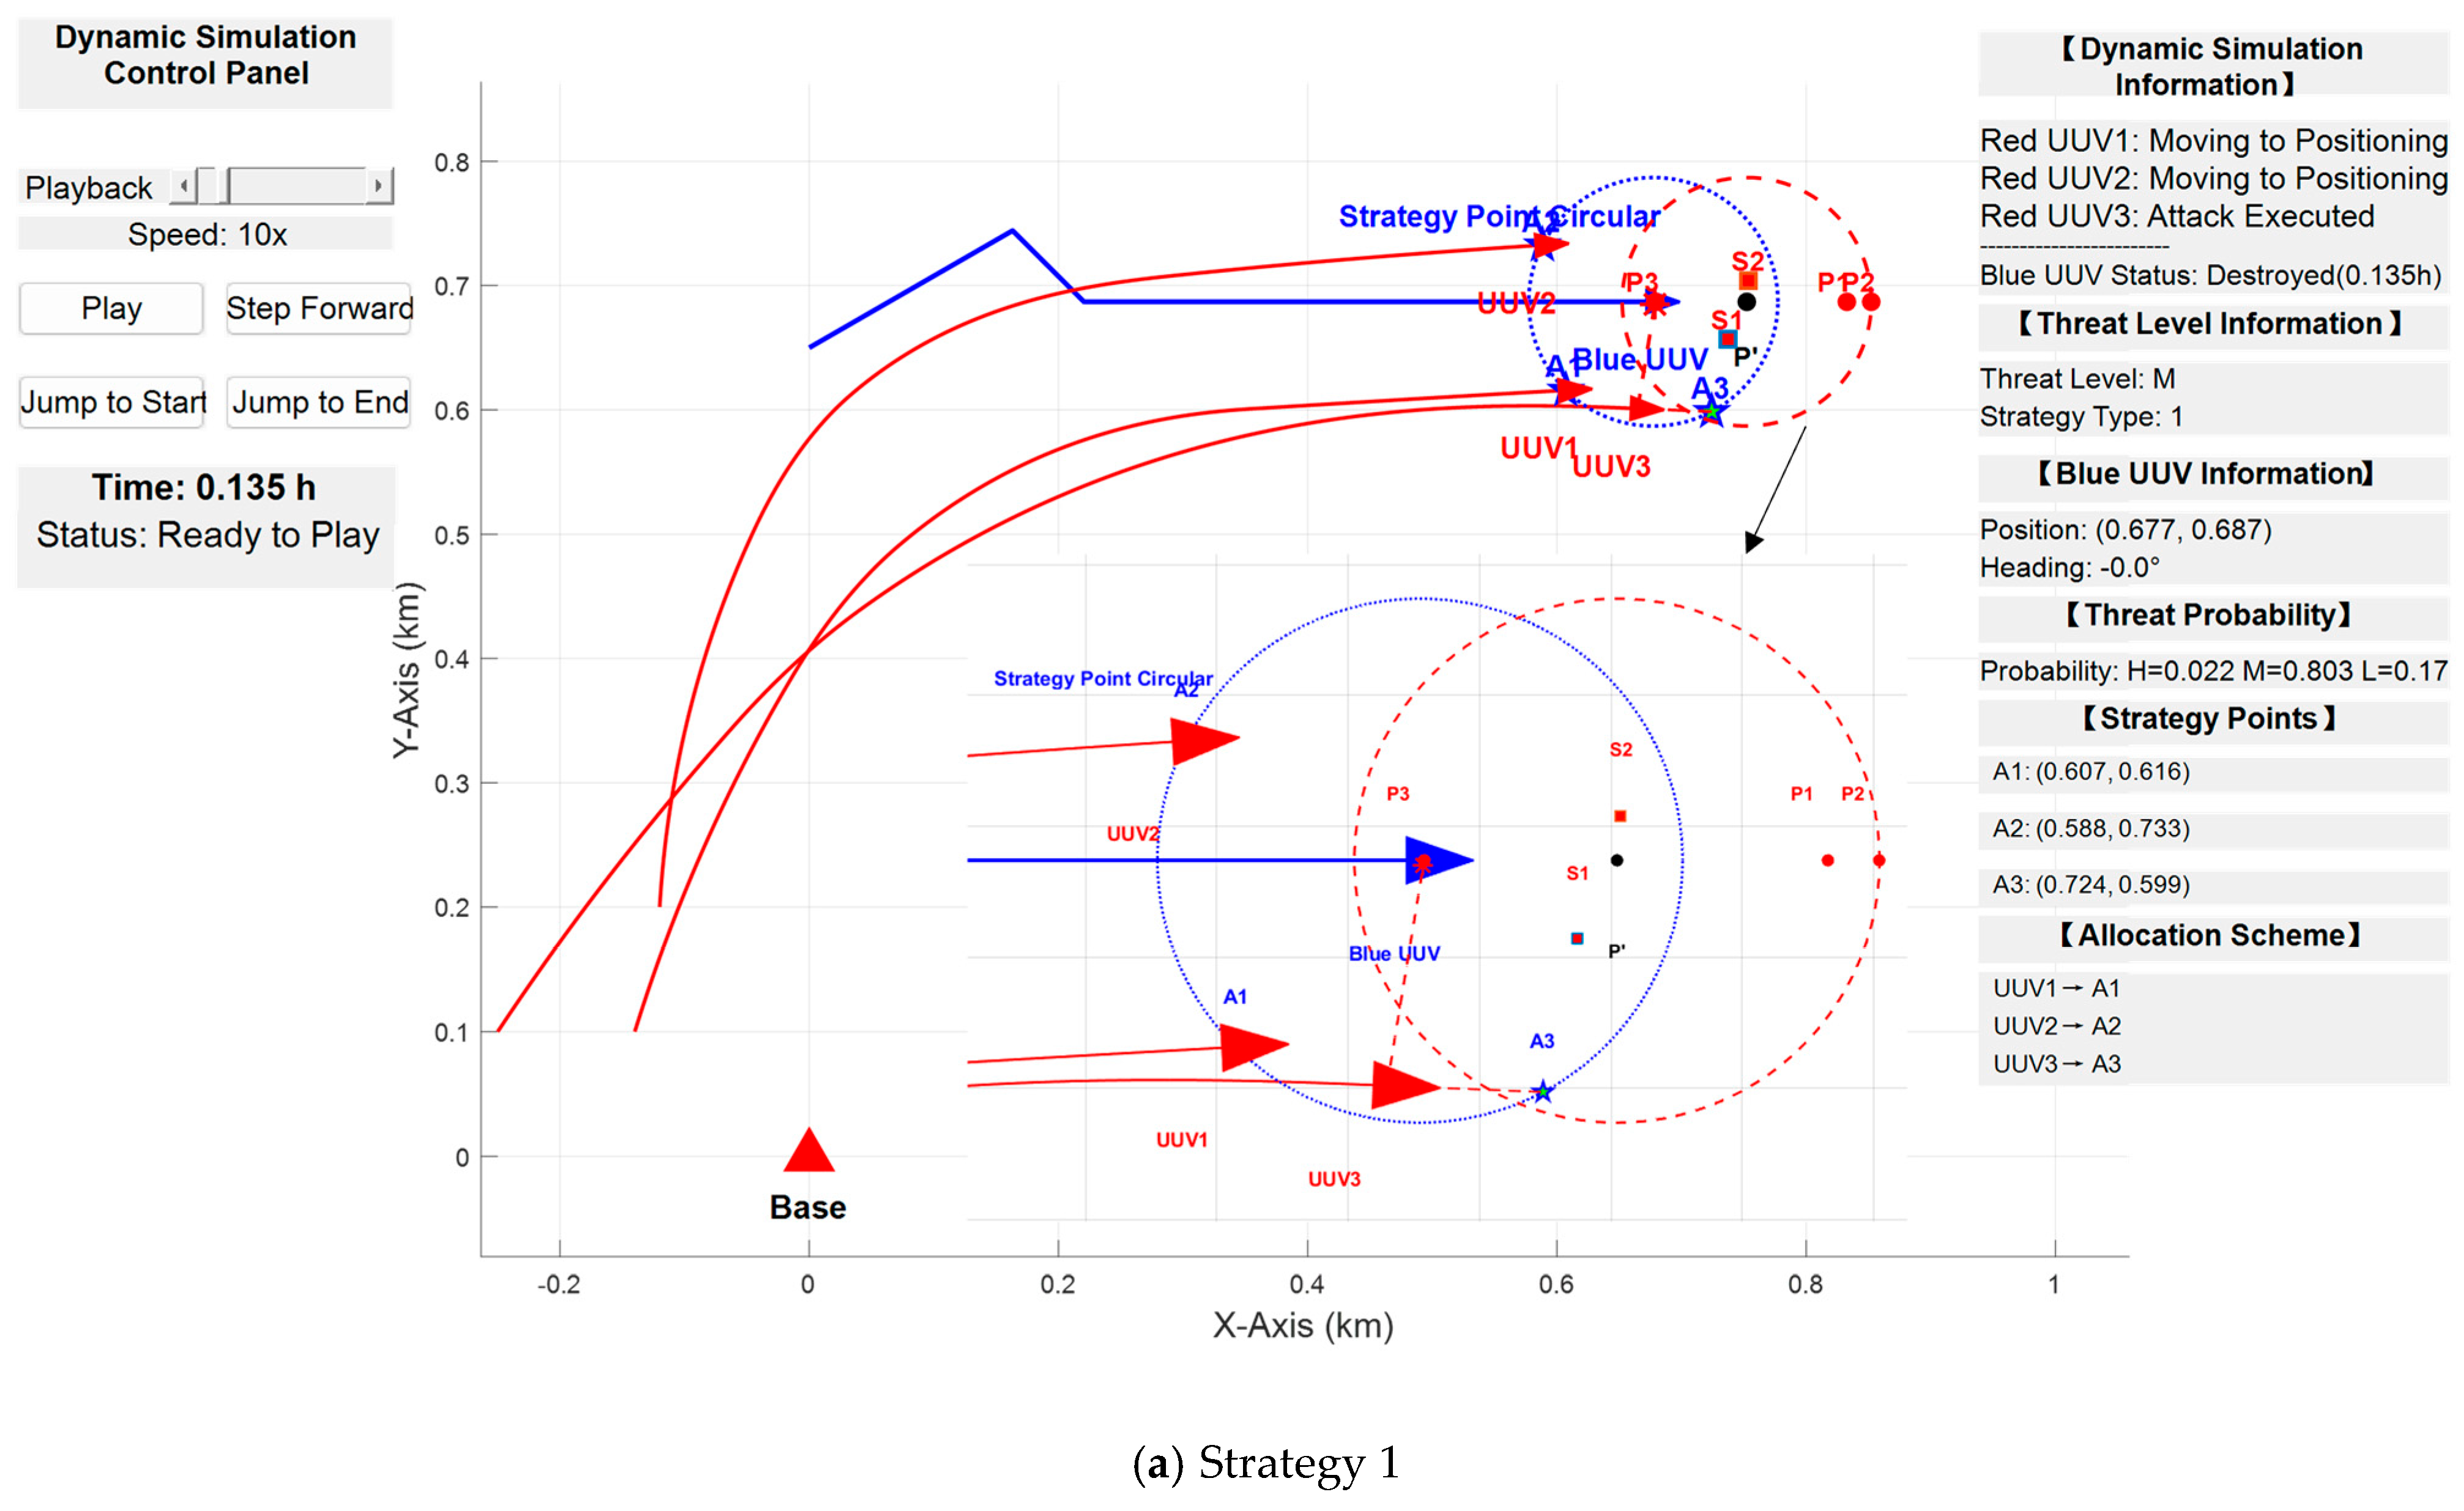
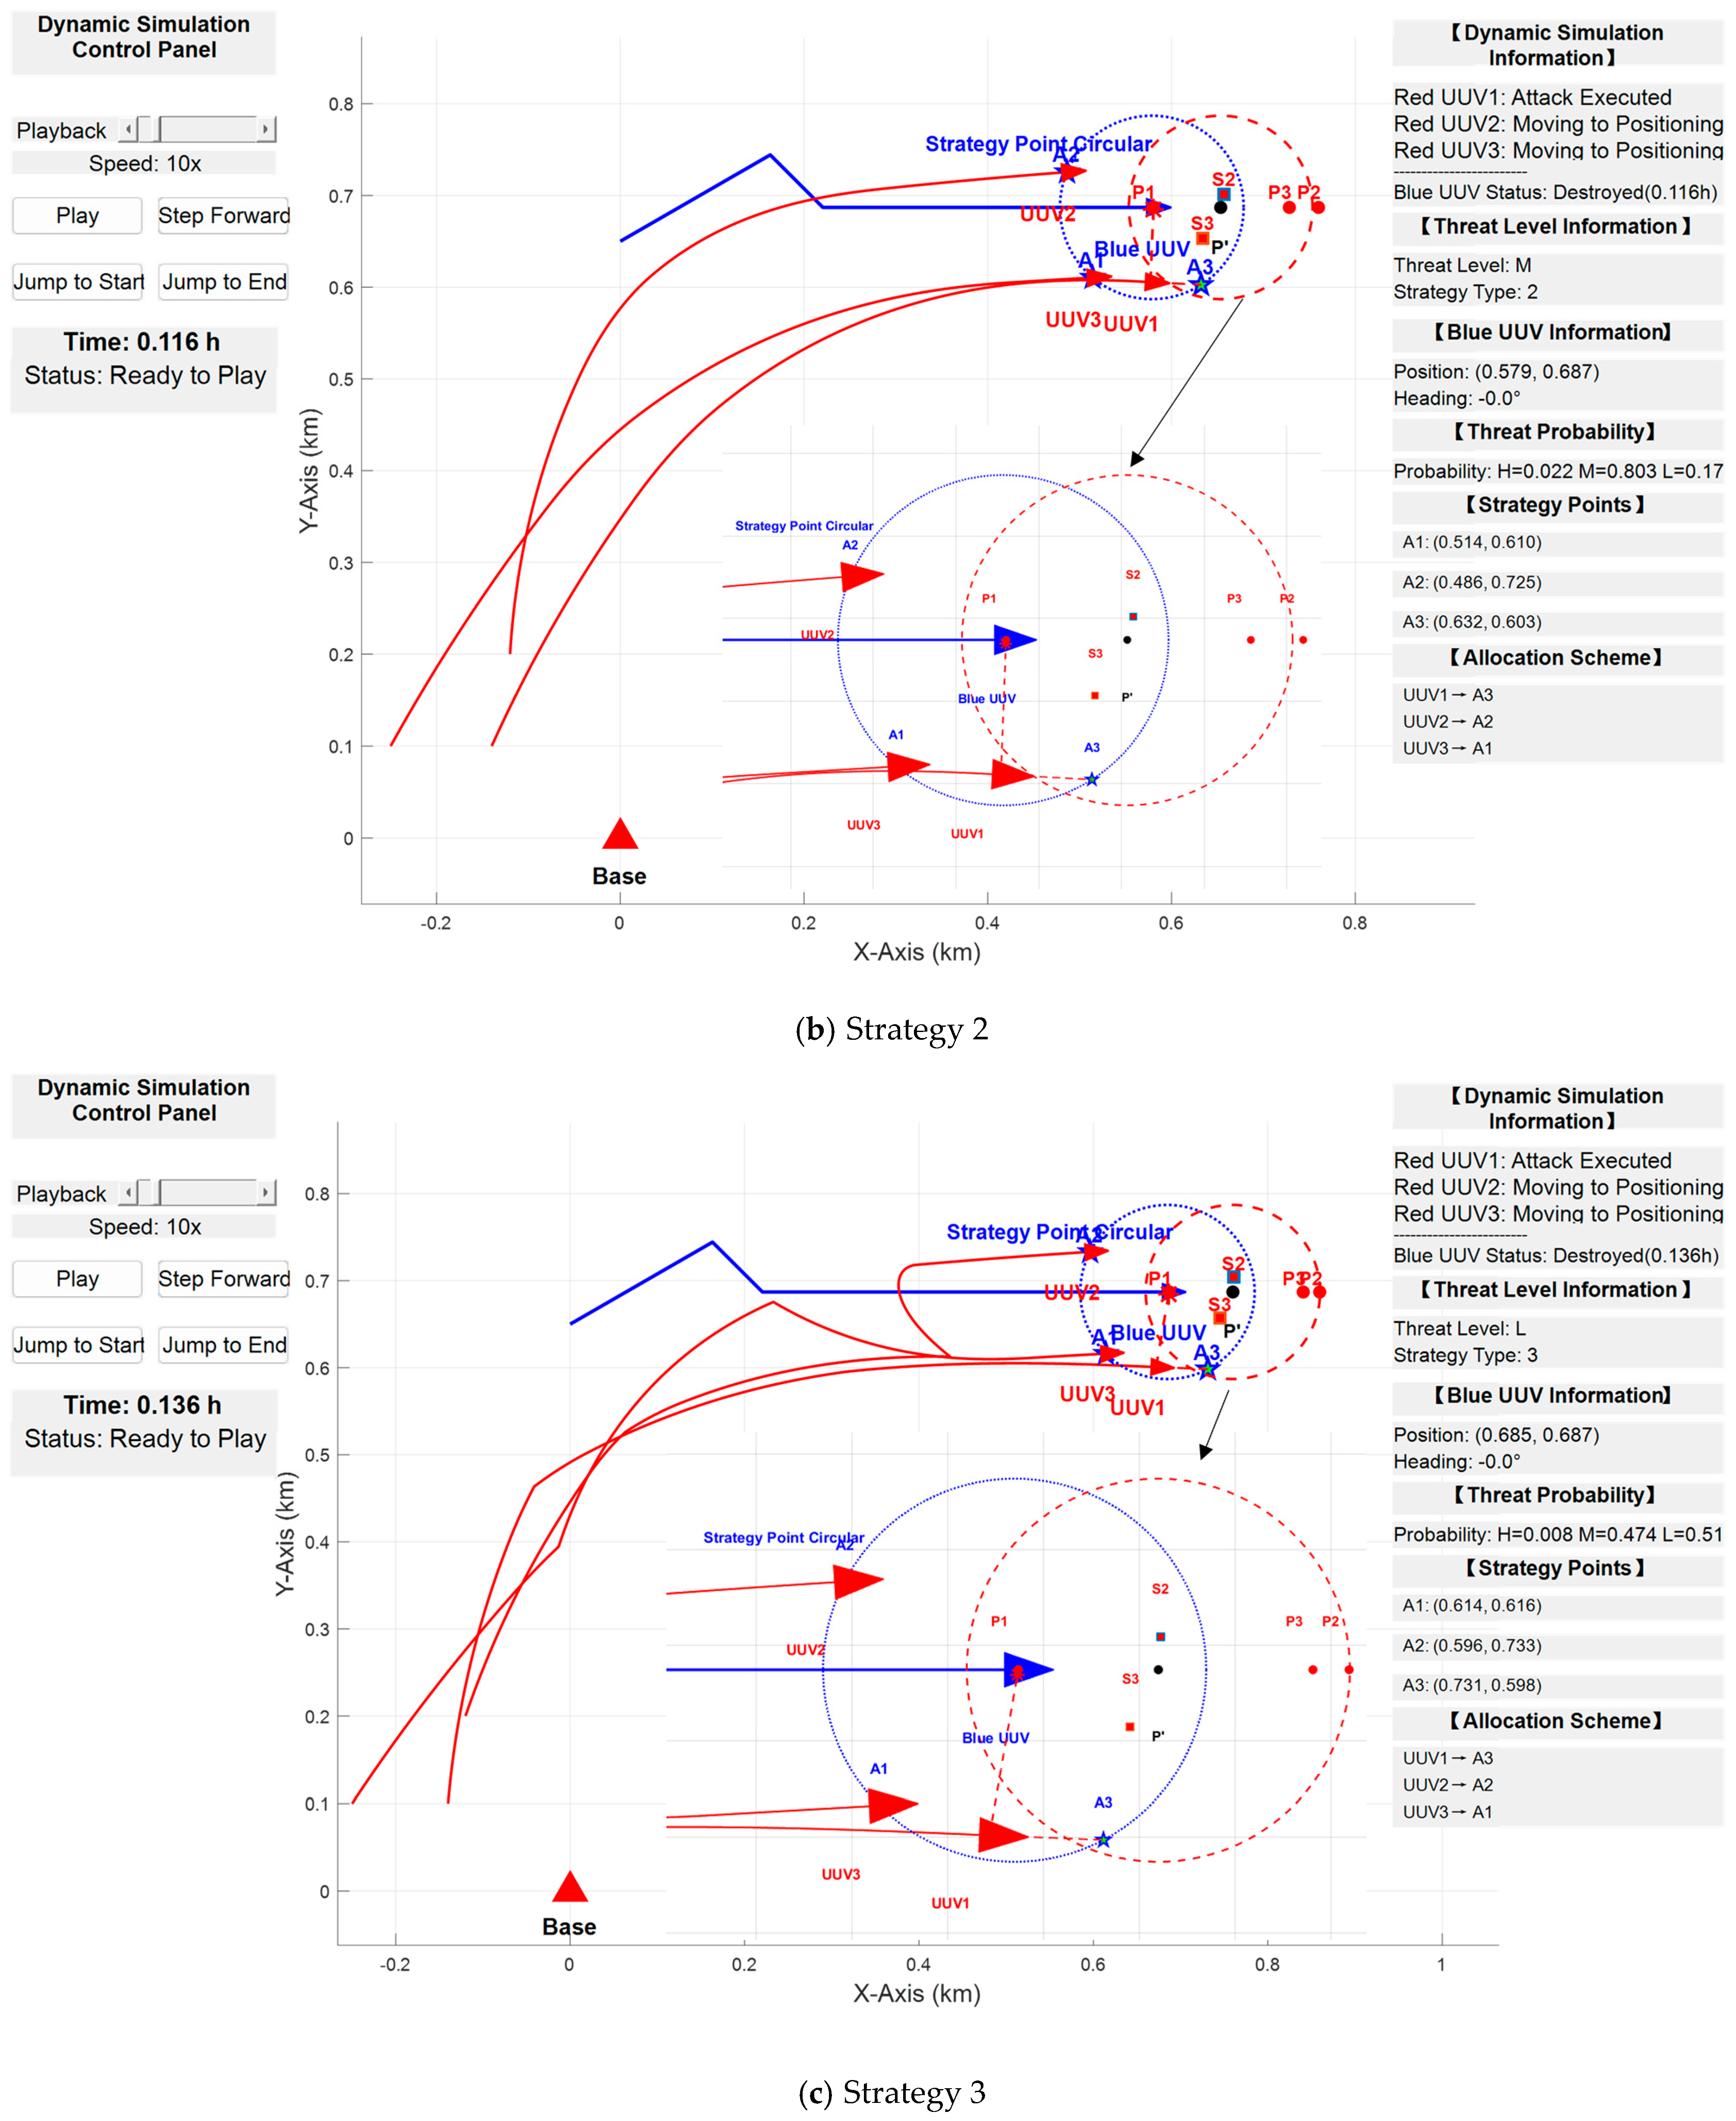
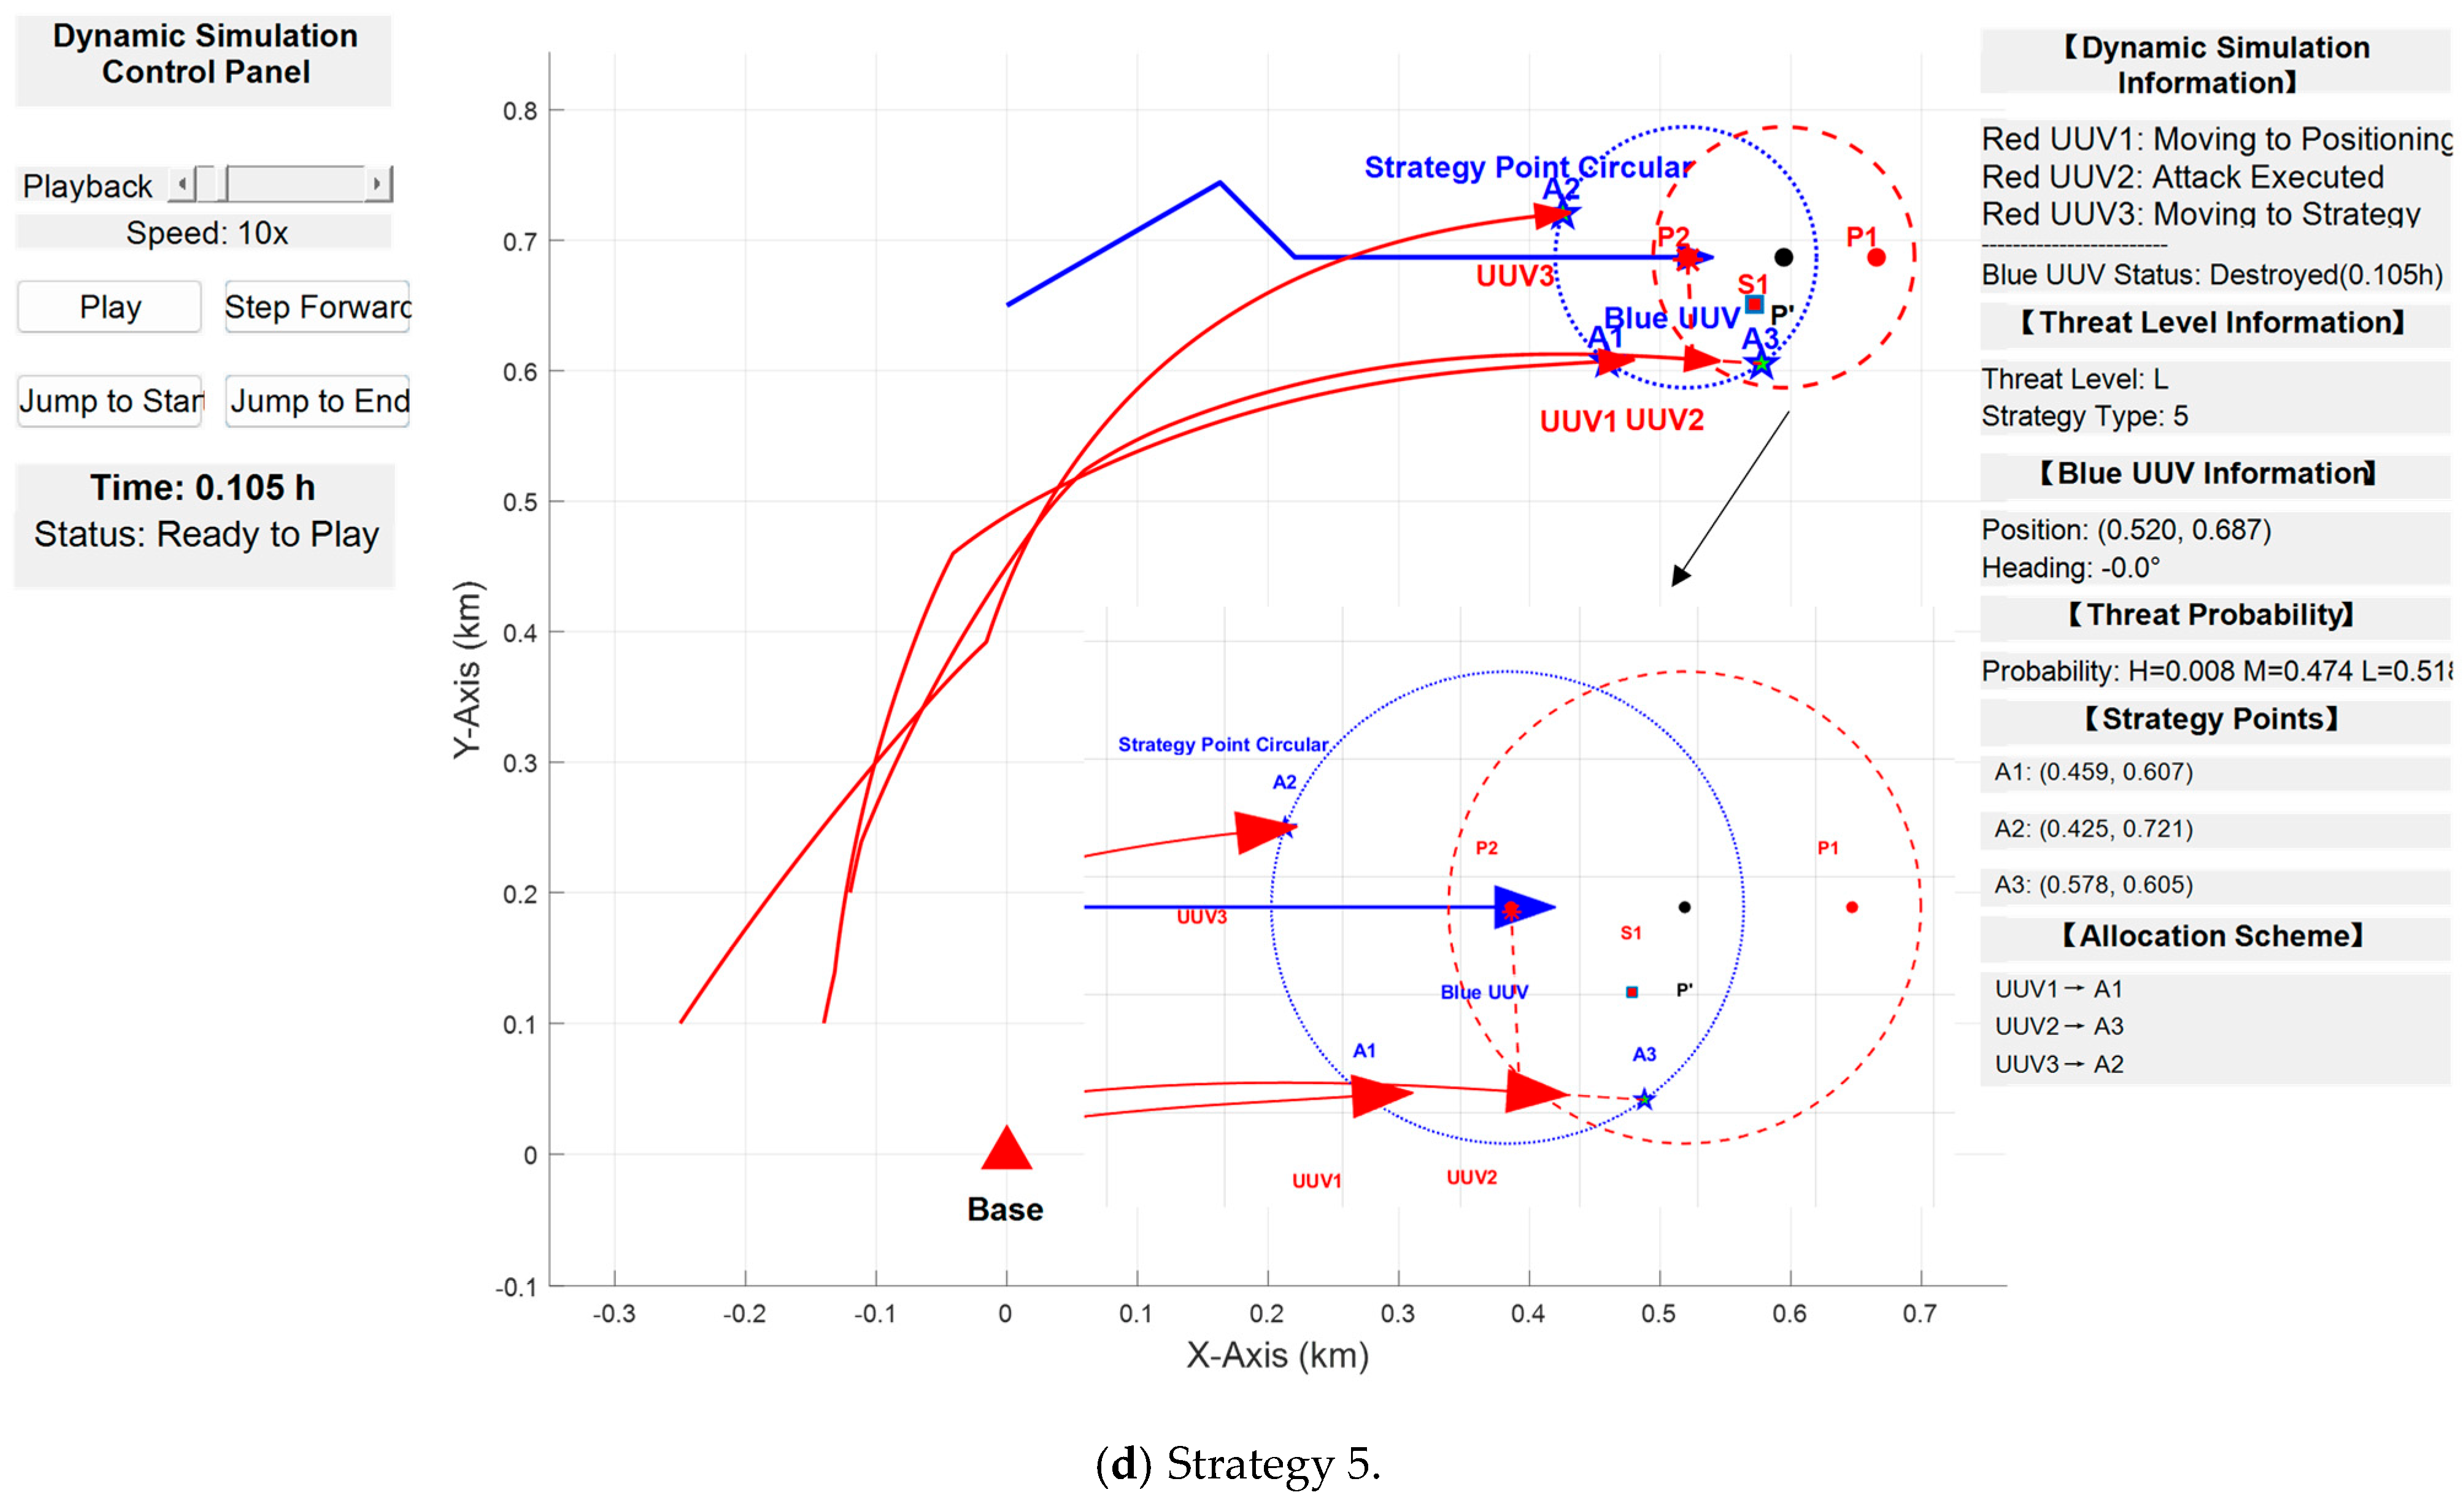
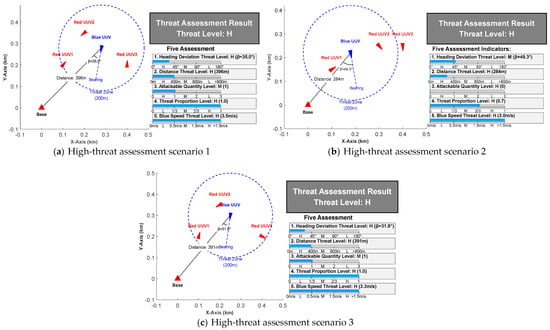
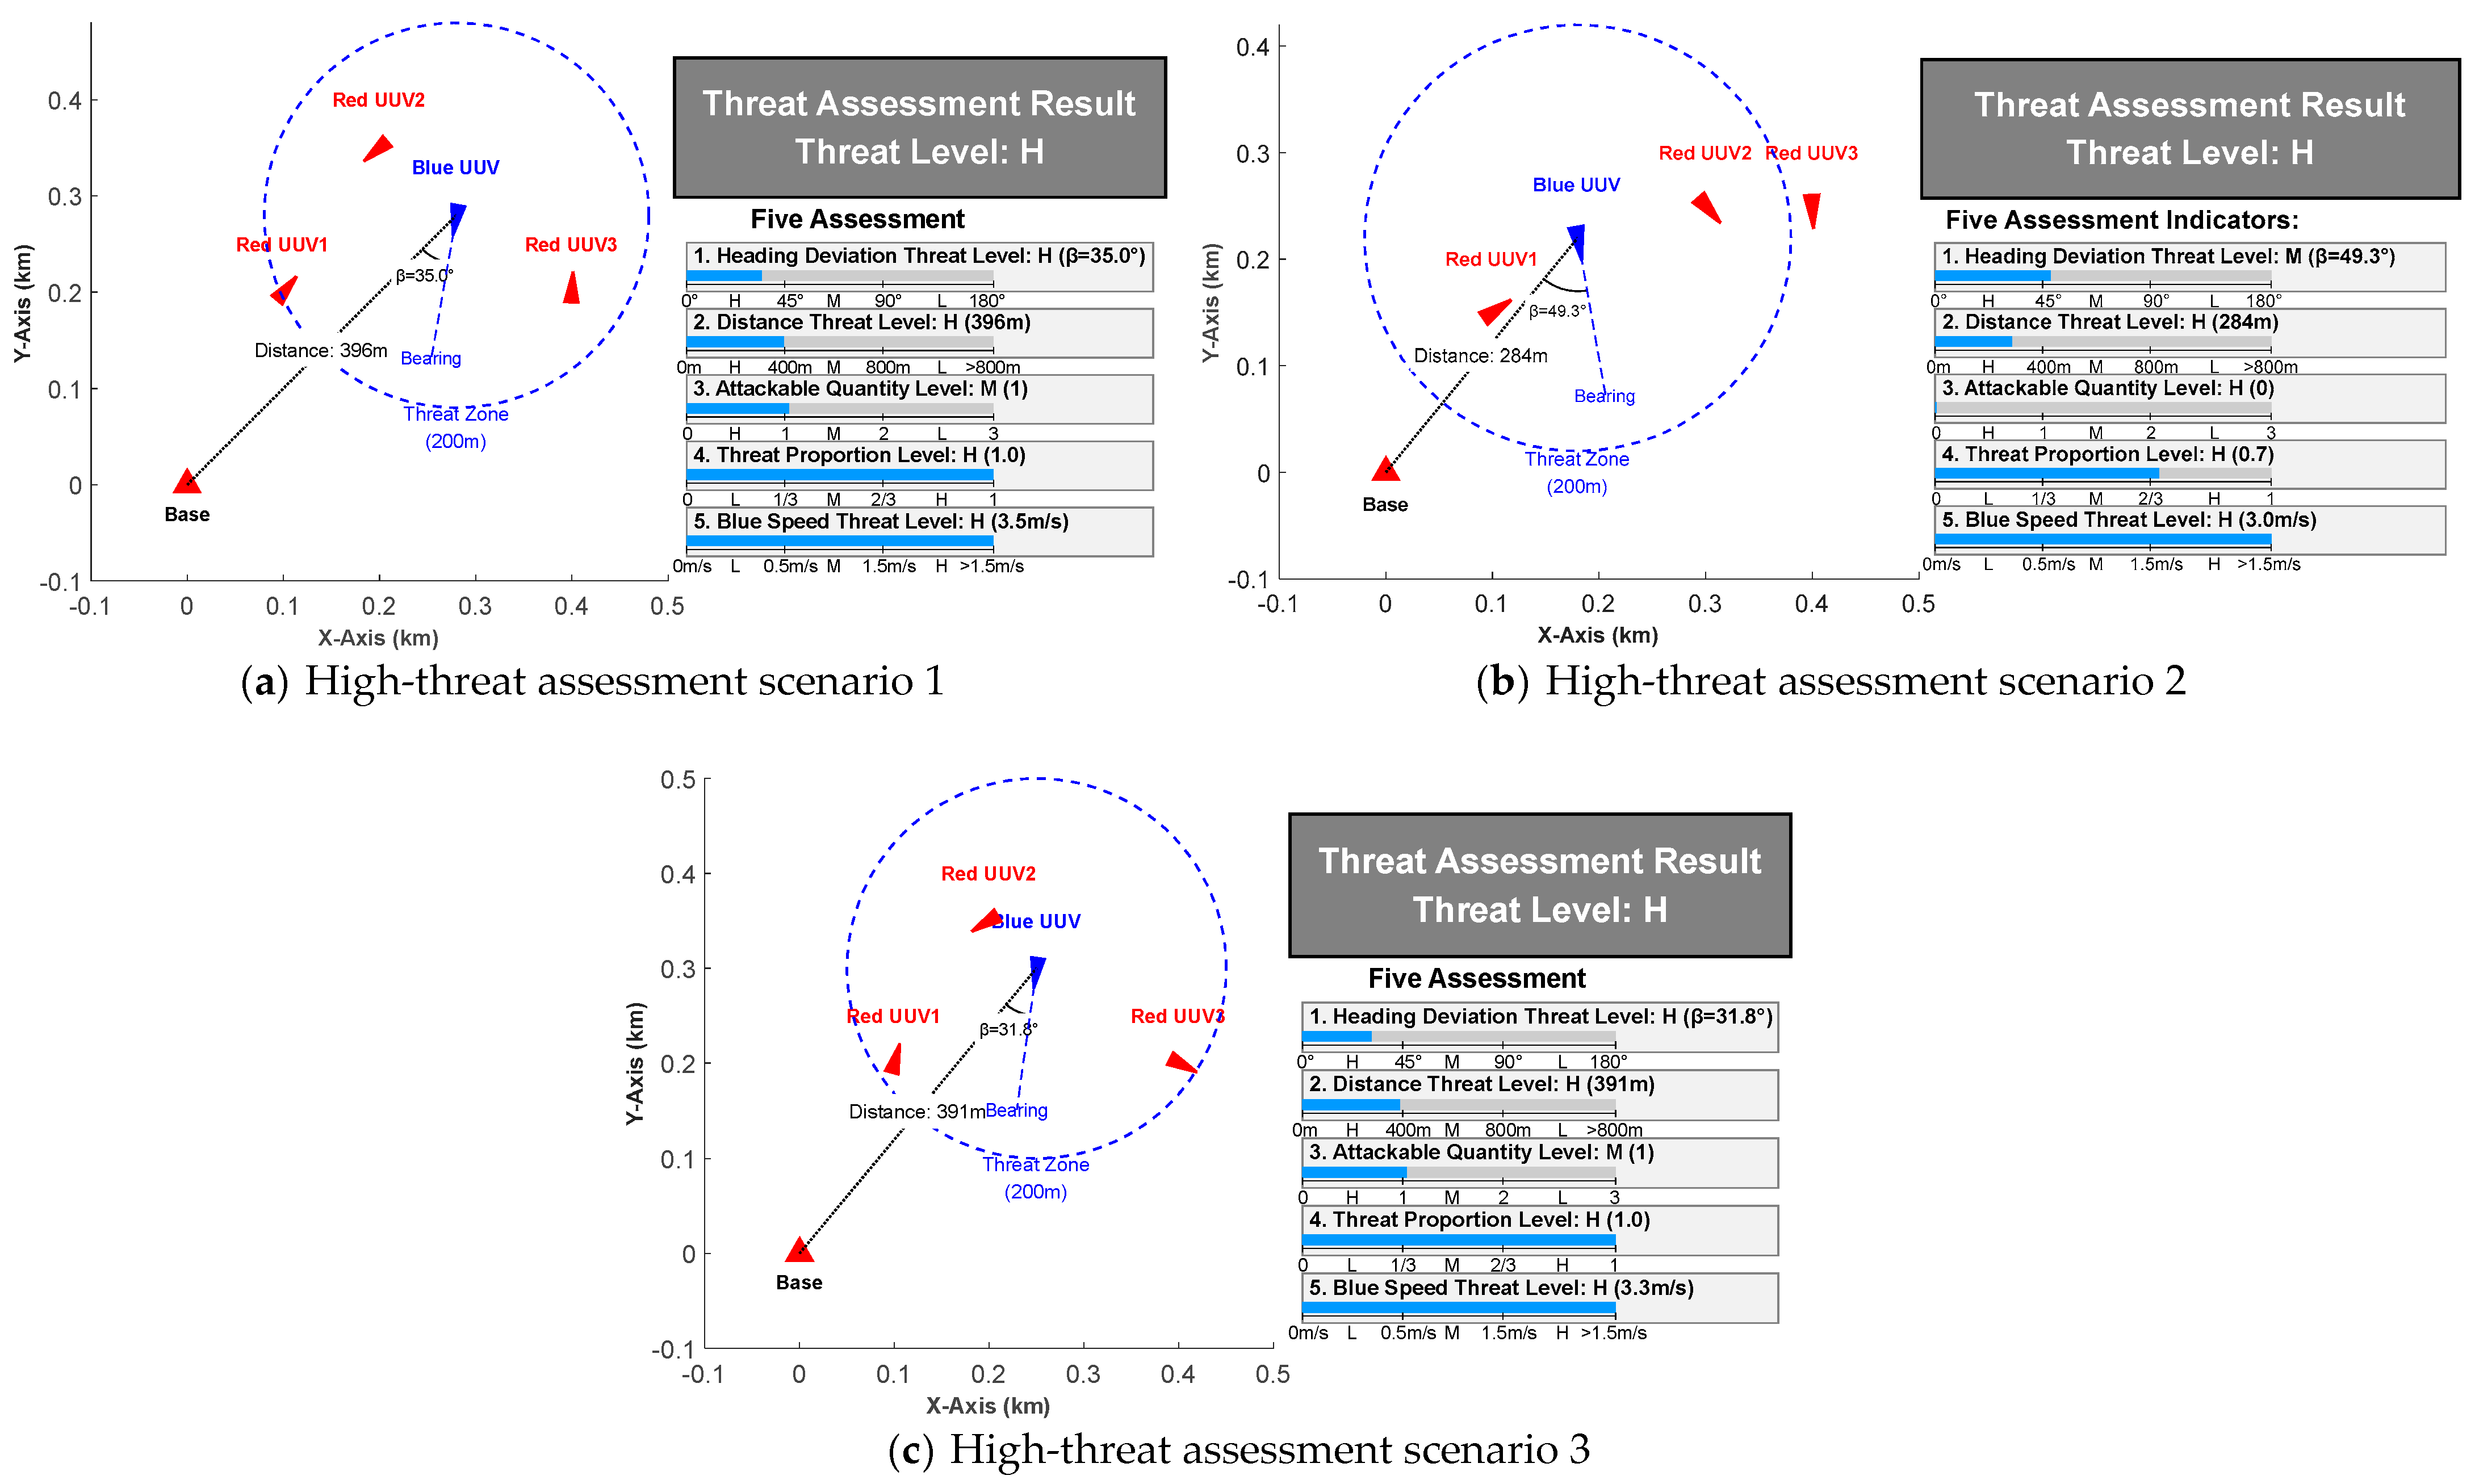
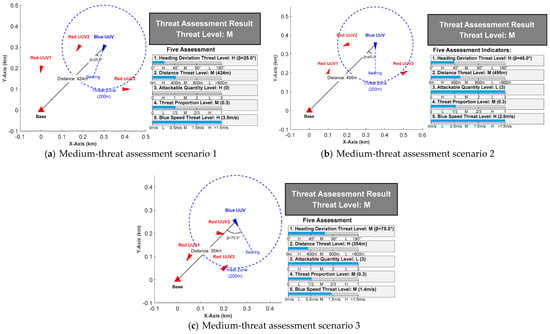
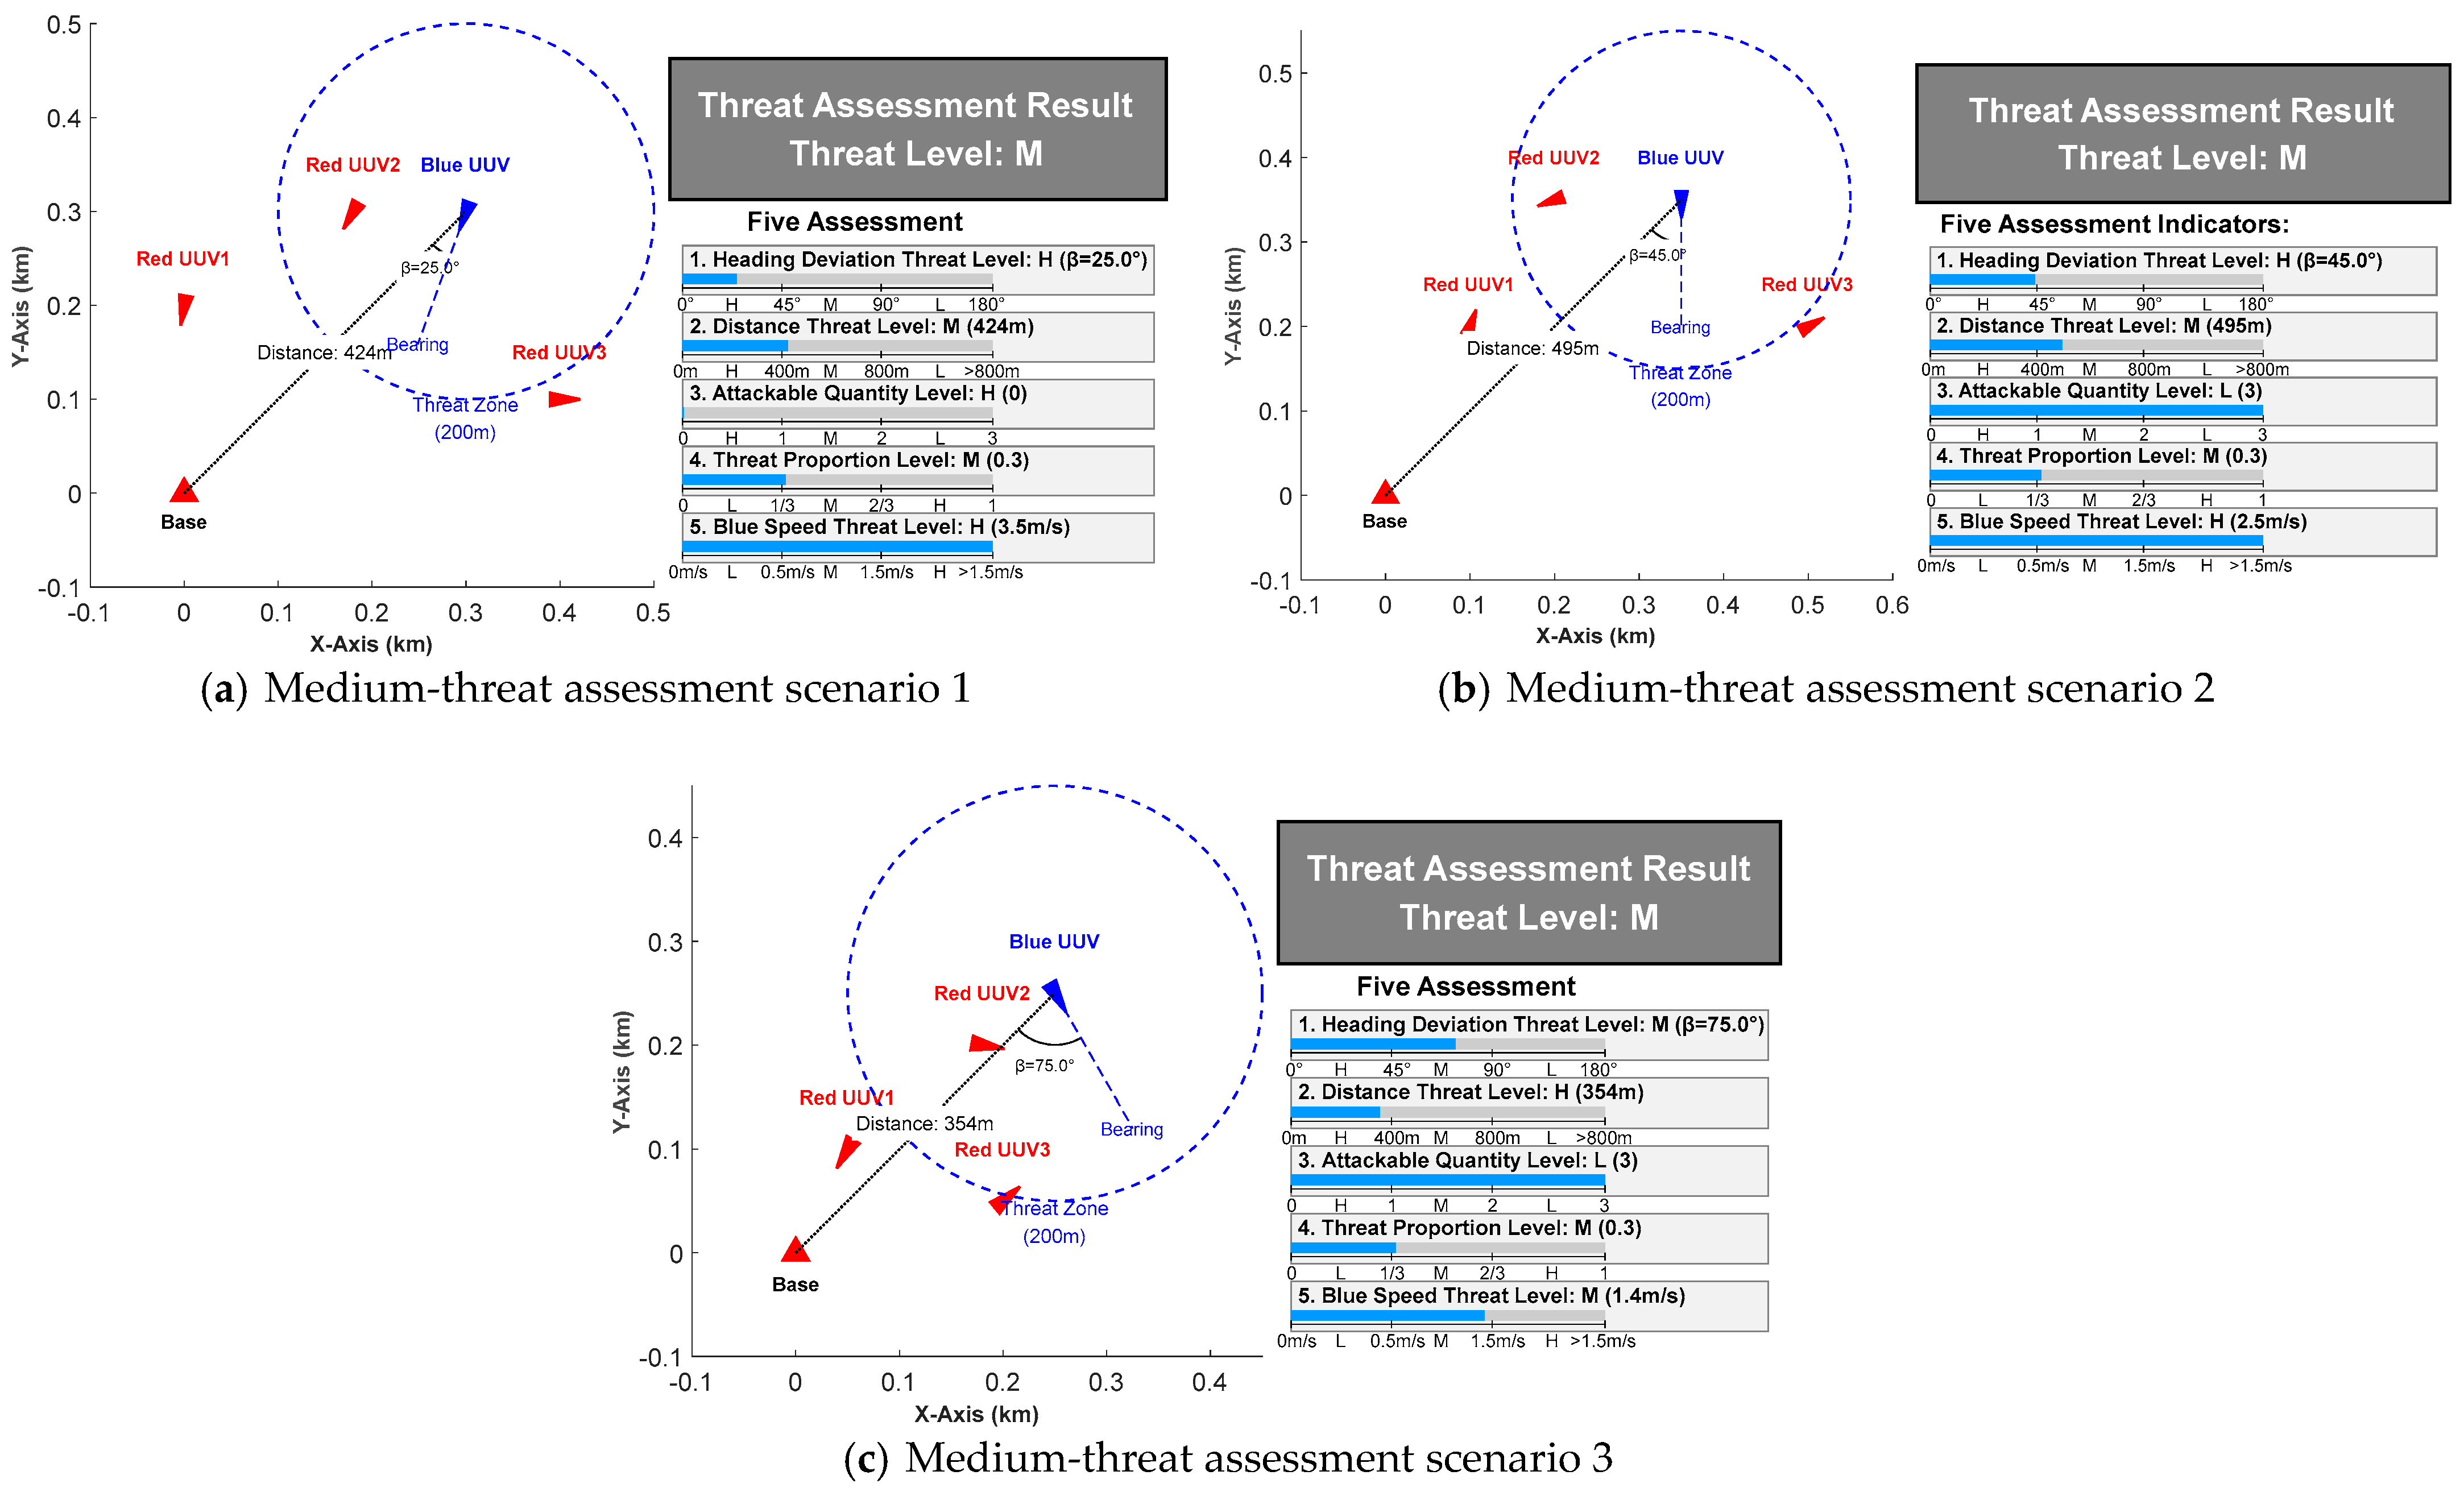
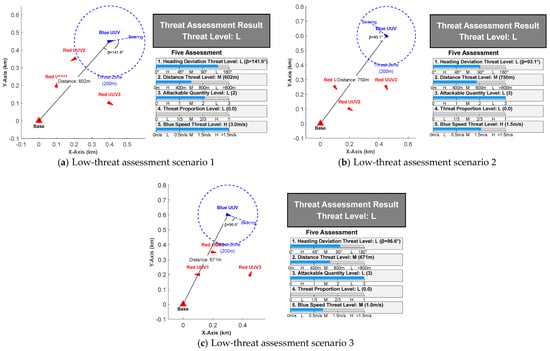
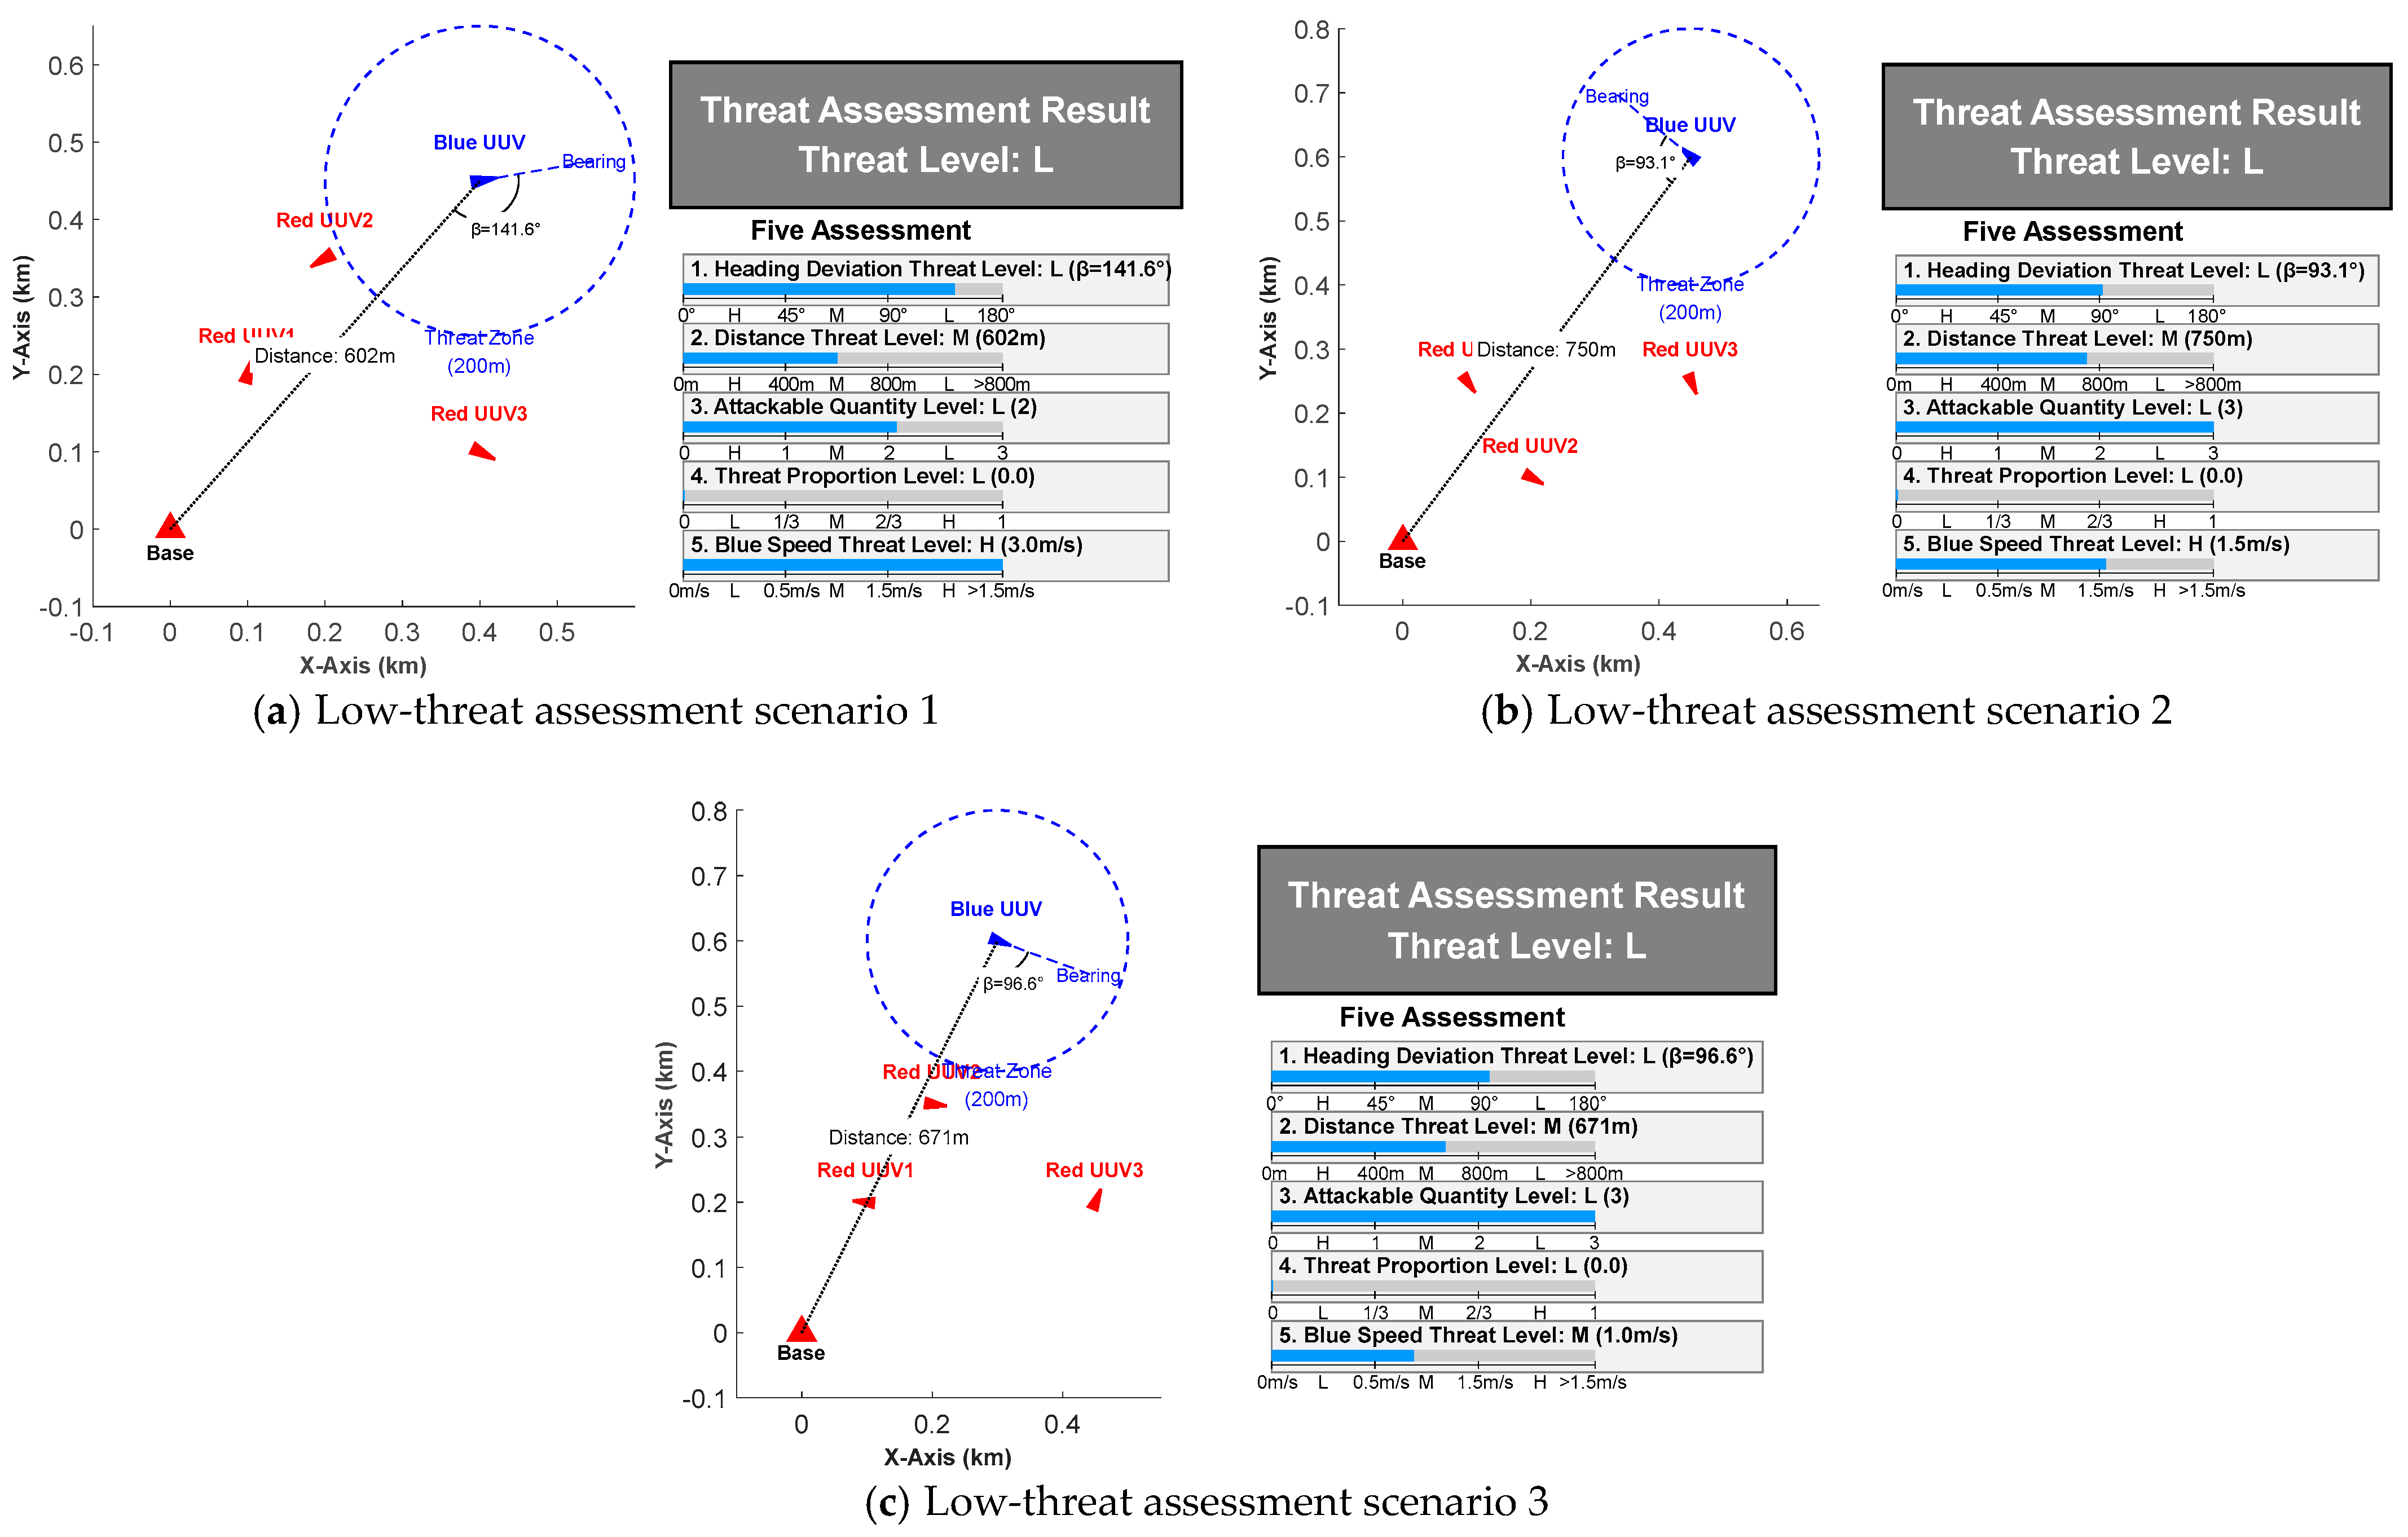

Disclaimer/Publisher’s Note: The statements, opinions and data contained in all publications are solely those of the individual author(s) and contributor(s) and not of MDPI and/or the editor(s). MDPI and/or the editor(s) disclaim responsibility for any injury to people or property resulting from any ideas, methods, instructions or products referred to in the content. |
© 2026 by the authors. Licensee MDPI, Basel, Switzerland. This article is an open access article distributed under the terms and conditions of the Creative Commons Attribution (CC BY) license.