


Abstract
The South Atlantic is a classic region of hotspot volcanism, with numerous intraplate magmatic structures, such as the Walvis Ridge, Rio Grande Rise, Fernando de Noronha Ridge, and Victoria-Trinda Ridge. These structures record mantle plume activity and plate tectonics since the breakup of the South America–Africa continent, but the spatiotemporal correlations of mantle end-members among different hotspot systems remain unclear. This paper uses the Unified Manifold Approximation and Projection Algorithm (UMAP) and Hierarchical Agglomeration Clustering Algorithm (HAC) to perform dimensionality reduction and cluster analysis on 288 basalt Sr-Nd-Pb isotope data from 12 major hotspot-derived seamount chains/rises in the South Atlantic, identifying three types of mantle end-members: EM-type, HIMU-type, and PREMA/FOZO-type. The results show that HIMU-type end-members are mainly distributed in St. Helena Island and its associated Guinea seamount chain; EMI-type end-members dominate the Walvis Ridge basement, Rio Grande Rise, and discovered seamount chain; and PREMA/FOZO-type end-members are mainly distributed in the Brazilian continental margin seamount chain. In terms of time series, EM-type magmatic activity began in the Early Cretaceous (~132 Ma), while HIMU-type hotspot activity appeared later (~82 Ma), and both were vertically superimposed on the Walvis Ridge basement. Based on the spatiotemporal distribution characteristics of mantle end-members in hotspots in the South Atlantic and Indian Oceans, this paper proposes a two-stage magmatism model for hotspots at the African margin: in the early stage, EM-type material, associated with continental delamination and ancient lithosphere recycling, preferentially melted, forming large-scale submarine plateaus or seamount chains; in the later stage, HIMU-type material, associated with the reactivation of subducted oceanic crust or Archean carbonated subcontinental lithospheric mantle (SCLM), melted and rose in weak areas of mature oceanic crust, forming smaller seamounts. This study provides a new perspective on the unified genetic mechanism of multiple hotspots in the South Atlantic and offers a reference for understanding the generation, evolution, and magmatic activity of hotspots during the breakup of Gondwana.
1. Introduction
Mid-ocean ridges and hotspot volcanic activity are the main causes of submarine topographic anomalies. The former gave rise to the main body of the oceanic crust, while the latter formed intraplate submarine plateaus/seamount chains [1,2,3,4]. Among them, hotspot volcanic activity has preserved information on the heterogeneity of the mantle source region and plate tectonics [5,6]. There are several hotspot volcanic activities in the South Atlantic, including St. Helena, Trindade, Tristan–Gough, Discovery, Meteor, and Shona [1,2]. These hotspots formed iconic submarine plateaus and seamount chains on both sides of the mid-ocean ridge, such as Walvis Ridge, Rio Grande Rise, and Discovery Seamounts, which record the evolution of deep mantle material and its magmatic activity history during the South America–Africa rifting process since the Early Cretaceous [3,4]. Previous studies have identified several deep mantle end-members in the Atlantic region: HIMU (high μ-value) represented by St. Helena Island [7,8,9], enriched mantle (mainly EMI) represented by Gough Island, Walvis Ridge, and Tristan Island [10,11,12,13,14,15,16,17,18], and a few FOZO/PREMA reports [19,20,21,22,23,24,25,26,27].
In recent years, extensive research has been conducted on the spatiotemporal distribution, geochemical characteristics, and evolutionary models of hotspot products in the South Atlantic [2,4,8]. Homrighausen et al., through a systematic study of Walvis Ridge, discovered EM-I basement volcanic activity, followed by late-stage magmatic activity with an age lag of approximately 30–40 Ma and significant HIMU characteristics superimposed on the basement. This “heterogeneous superposition” phenomenon challenges the traditional view of a single vertical mantle conduit in hotspots [2,4]. Comparing the petrogeochemical characteristics of the products of the Tristan-Gough and Discovery hotspots reveals that hotspots located close to each other exhibit spatial heterogeneity in geochemistry [16,17]. Based on the geochemical characteristics and spatiotemporal distribution of the Walvis Ridge, it is believed that EM-I hotspots are concentrated at the edge of the LLSVP in Africa, while HIMU hotspots originate from within the LLSVP [18]. However, systematic summaries of different hotspots in the South Atlantic are still lacking, and the temporal and spatial correlations among multiple hotspots remain unclear, limiting the overall understanding of the genesis and evolution of South Atlantic hotspots.
This study selected 12 basaltic geochemical datasets from submarine plateau/seamount chains, introduced the Unified Manifold Approximation and Projection Algorithm (UMAP) [28,29] to perform dimensionality reduction on 288 sets of basaltic Sr-Nd-Pb isotope data, and combined the Hierarchical Agglomeration Clustering Algorithm (HAC) to perform cluster analysis on the dimensionality reduction results [30]. Based on Local Outlier Factor Analysis (LOF) [31], the Mutual Information Value (MI) [32,33], SHAP Interpretability Analysis [34] and the Multi-Indicator Kriging (MIK) Spatial Interpolation Technique [35,36], the following research was carried out: (1) the mantle end-member types of South Atlantic hotspot products were identified, and the UMAP dimensionality reduction method was used to analyze their key isotopic control elements; (2) the spatial partition map of South Atlantic mantle end-members was reconstructed, and their relationship with deep mantle anomalies (such as LLSVP and DUPAL anomalies) was analyzed; and (3) the temporal evolution sequence of hotspots was plotted, and a unified spatiotemporal evolution model for South Atlantic hotspots was proposed.
2. Geological Background
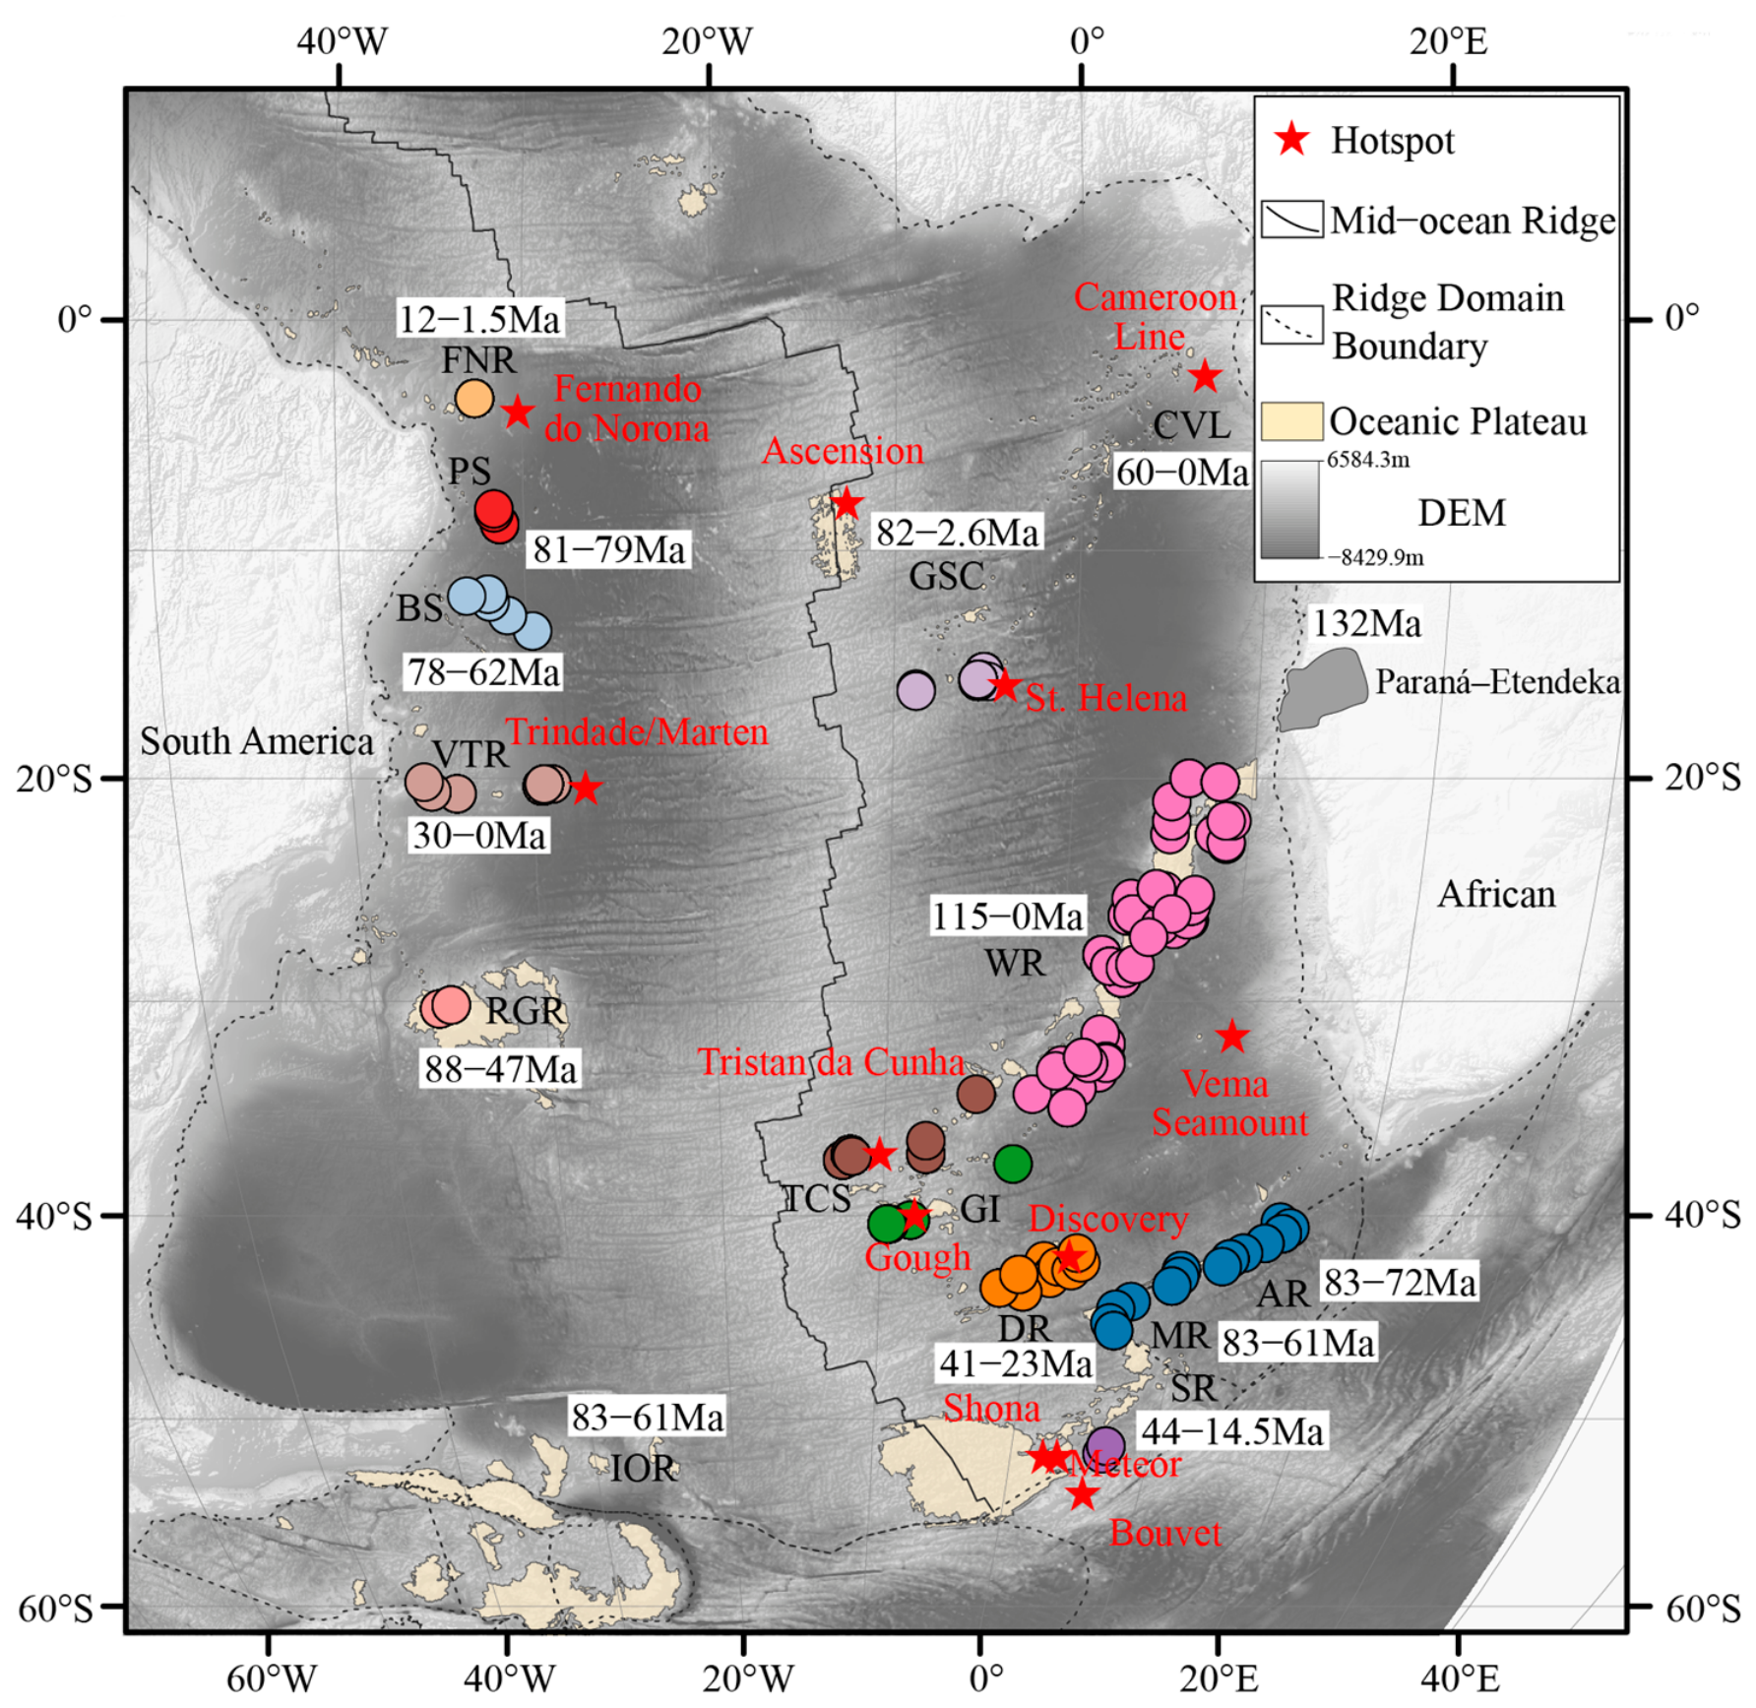
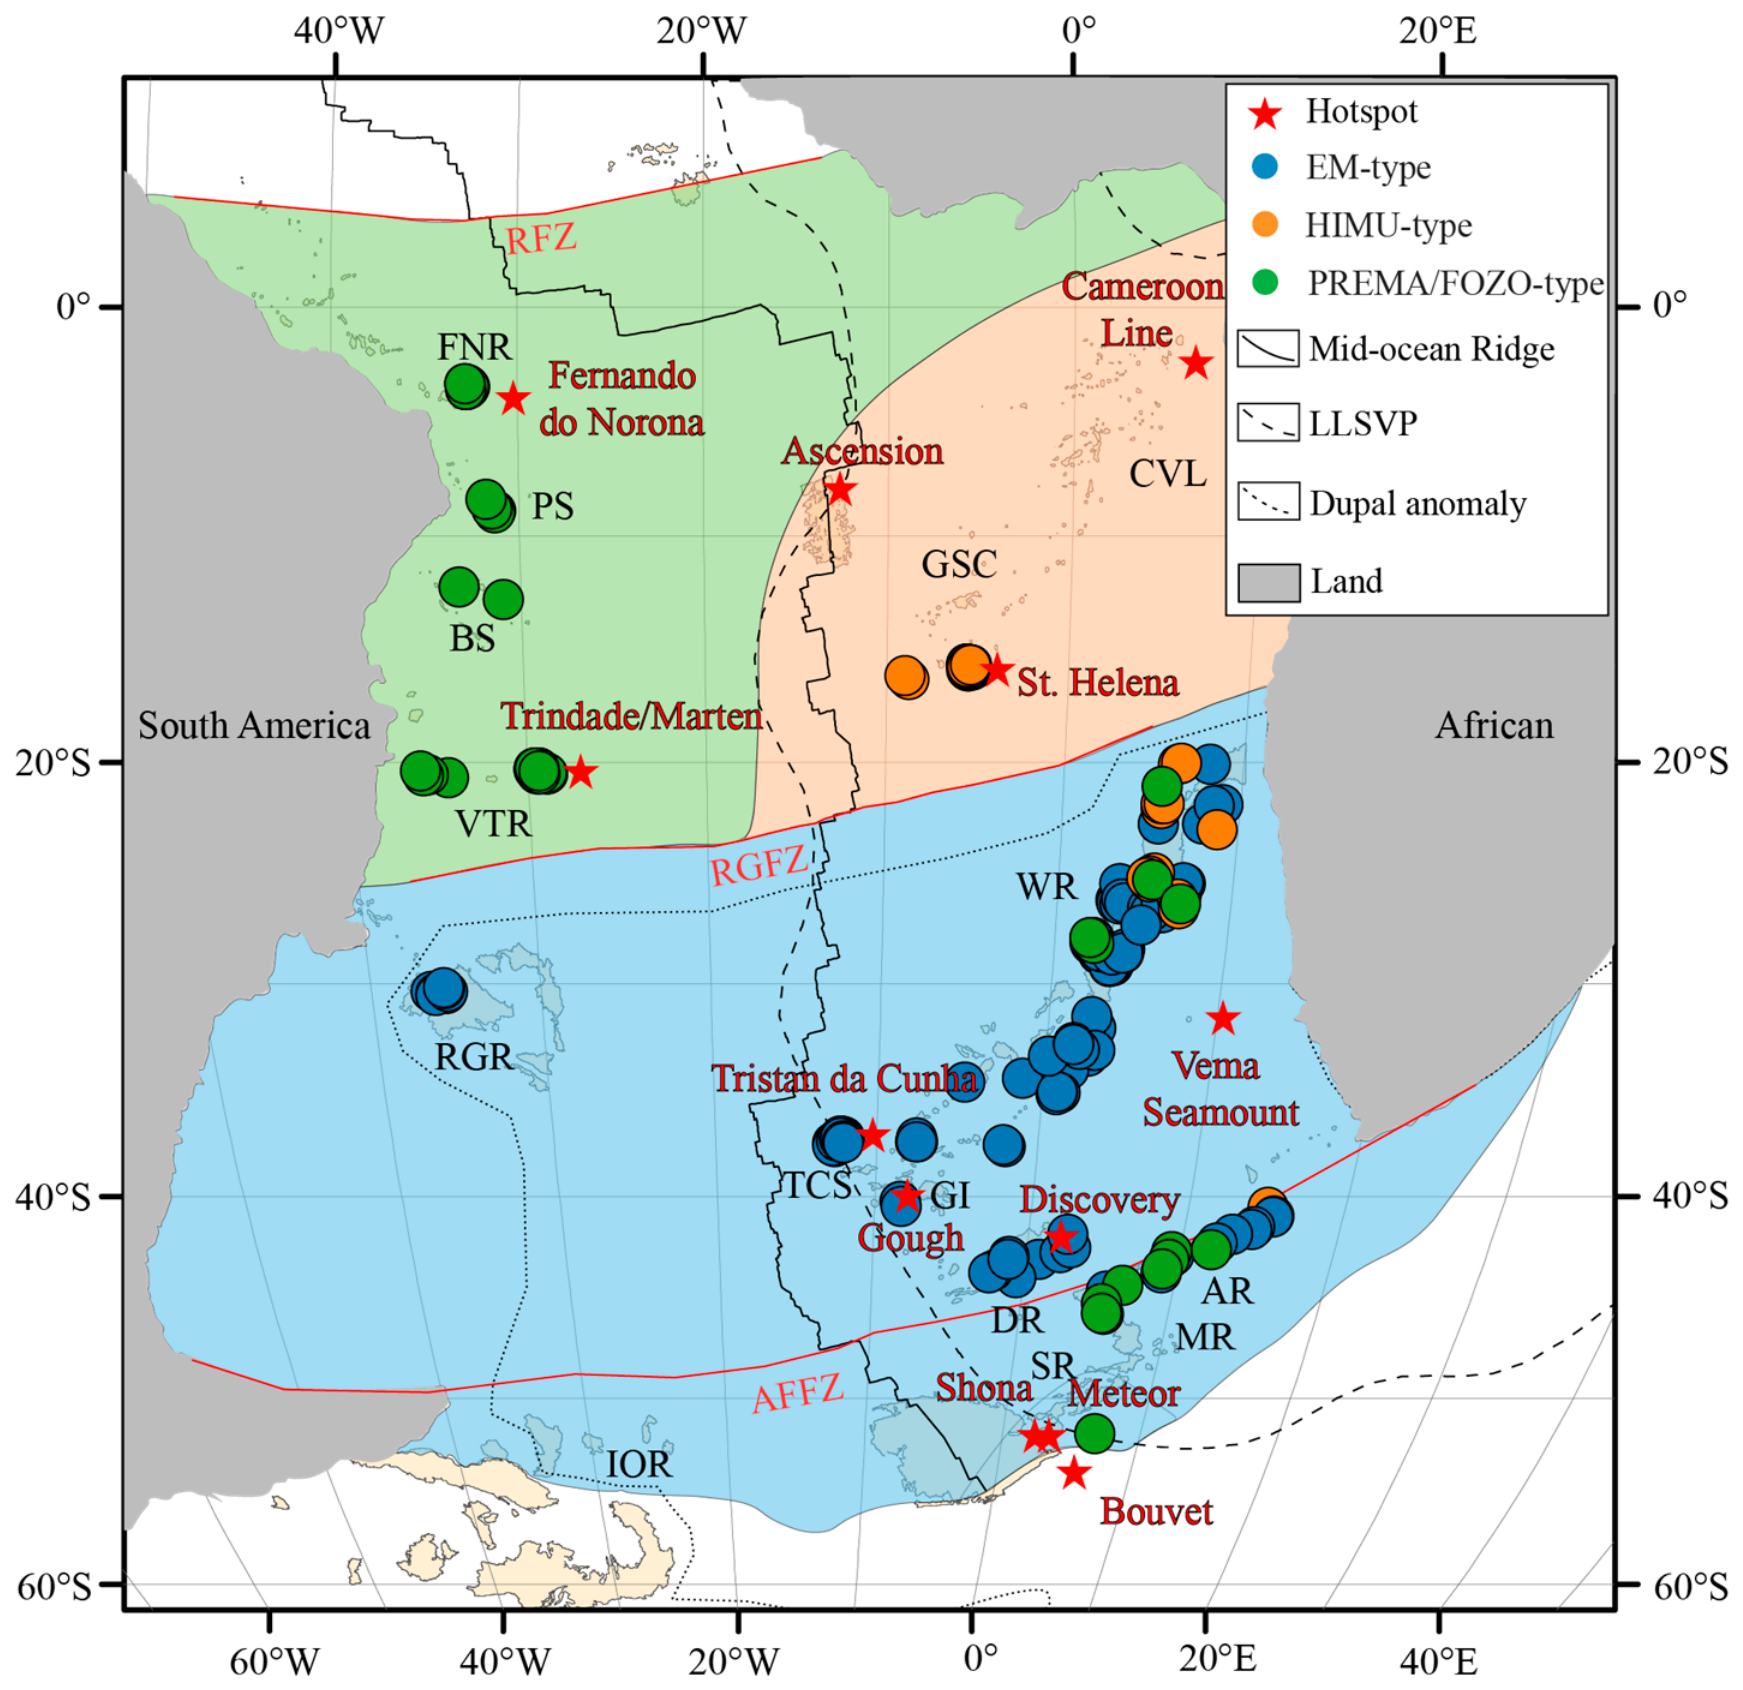
Hotspots are distributed on both flanks of the South Atlantic Mid-Ocean Ridge, with fewer on the western flank, mainly consisting of the Brazilian continental margin seamount chain, the Rio Grande Rise, and the Eras-Ocadas Rise. On the eastern flank, from north to south, are the Cameroon–Guinea seamount chain, the Walvis Ridge, and the southern seamount group, including the Discovery Seamount Chain, the Agulhas Ridge, the Meteor Rise, and the Shona Ridge (Figure 1). Because the dataset does not include Sr-Nd-Pb isotope records for the Ocadas Rise, the Cameroon Volcanic Line, and the Guinea seamount chain, these two regions will only be discussed for their geological background without further data analysis.
2.1. Brazilian Marginal Volcanic Chains
A series of seamount chains extending nearly east–west or northwest–southeast along the Brazilian continental margin has developed, including the Fernando de Noronha Ridge (FNR), Pernambuco Seamounts (PS), Bahia Seamounts (BS), and Vitória–Trindade Ridge (VTR). The FNR, located between the Fernando de Noronha hotspot and the South American continent, is a nearly east–west-trending seamount chain approximately 550 km long. Magmatic activity lasted for about 15–0 Ma, and its formation is believed to be related to plate-driven small-scale upper mantle convection, rather than classic mantle plumes [19,20,21]. The geochemical composition of the FNR exhibits multi-end-member mixing characteristics, evolving over time from EM-I to HIMU and depleted mantle (DMM) [22,23]. PS is located east of Recife, Brazil, and extends in a northwest–southeast direction, with a total length of about 350 km [5,20].
The source region of PS basalts is a mixture of depleted mantle (DM) and HIMU, containing a small amount of EM-I or EM-II components. Its activity period is about 81–79 Ma, and it may have been formed by extinct pairs of hotspots or small-scale upper mantle convection [20]. BS is located about 300 km south of PS and consists of three parallel seamount chains in a near-northwest–southeast direction, with a total length of about 600 km and a width of about 200–300 km. It has been active since 78 Ma [5]. Most of the volcanic rocks in the northern part of BS were formed by HIMU materials, with no obvious Dupal anomaly [24]. VTR is located about 700 km south of BS and has a total length of about 1200 km. It is believed to be related to the activity of the Trindade hotspot. Its volcanic rocks are mainly alkaline basalts formed by low-degree partial melting (≤3%) [25,26]. VTR seamount chains range in age from approximately 30 to 0 Ma, with mantle end-members predominantly of the EMI type, and are associated with metasomatism related to deep mantle plumes [25,26,27].
2.2. Guinea Region and St. Helena Hotspot Track
The Gulf of Guinea region contains two major tectonic lines. One is the Cameroon Volcanic Line (CVL), which is about 1600 km long and extends from the African continent to the St. Helena hotspot in a southwest direction. Magmatic activity has continued from about 42 Ma to the present, and there is no obvious age gradation pattern [5]. The Guinea Seamount Chain (GSC) is located in the southwest extension direction of the CVL and is 2000 km long. It is the trajectory of the St. Helena hotspot on the African Plate, and its age gradually becomes younger from the northeast (82 Ma) to the southwest (2.6 Ma) [5]. St. Helena Island at the southwestern end of the GSC is the most typical HIMU-type mantle end-member representative on Earth. The extreme radiogenic Pb isotope ratio (206Pb/204Pb > 20.5) indicates that the source region contains an ancient recirculating ocean [7,8,9].
2.3. Walvis Ridge and Rio Grande Rise
The Walvis Ridge (WR), stretching over 3000 km in length, extends southwestward from the southwestern continental margin of Africa to the South Atlantic Mid-Ocean Ridge. It represents the trajectory of the Tristan–Gough hotspot on the African Plate, with ages ranging from ~115 Ma to 0 Ma from northeast to southwest [12,13,14]. The WR terminates at Tristan Island and Gough Island, considered the current active center of the Tristan–Gough hotspot [6].
Its conjugate, the Rio Grande Rise (RGR), is approximately 1000 km long and located on the eastern margin of the South American Plate, with ages ranging from 88 to 47 Ma [6,15]. Both are characterized by typical EM-I mantle end-members and exhibit a strong Dupal anomaly. Notably, some late-stage seamount volcanic activity has been discovered on the older basement of the WR, showing certain HIMU characteristics, suggesting vertical superposition or later disturbances in the source region [1,4].
2.4. Southern South Atlantic Hotspot-Related Ridges and Rises
The southern South Atlantic, near the southern end of the South Atlantic Mid-Atlantic Ridge, features a series of hotspot-associated seamount chains and rises, including the Discovery Seamounts (DS), Agulhas Ridge (AR), Meteor Rise (MR), and Shona Ridge (SR). The DS, located north of the Falkland–Agulhas Fault Zone, can be subdivided into northern and southern branches, with ages of approximately 41–23 Ma, and is associated with the Discovery hotspot [17,18]. The northern DS exhibits Gough-type EM-I mantle end-member characteristics, while the southern DS displays the most extreme DUPAL anomaly in the South Atlantic, with an isotopic composition closer to the EM-II mantle end-member, showing higher 87Sr/86Sr and lower 143Nd/144Nd and 206Pb/204Pb [17,18].
The AR system extends along the Falkland–Agulhas fault zone. The MR system and the Erasus–Ocadas Rise (IOR) are a pair of conjugate rises, which separated around 62–59 Ma due to a mid-ocean ridge jump. All three are generally associated with Shona hotspot activity [37,38]. The SR system, located south of the MR system and dating from approximately 44 to 14.5 Ma, is also a product of the Shona hotspot [37,38]. The basement of the Shona hotspot system is dominated by Gough-type EMI mantle end-members, with localized late-stage HIMU volcanic activity [4,38].
Figure 1.
Map showing the topography and geomorphology of the South Atlantic and the distribution of Sr-Nd-Pb isotope sampling locations. Topographic data are from NOAA ETOPO [39,40], Mollweide projection, with the central meridian at 15° W. Circular sample points represent basalt from submarine plateaus/seamount chains; the color of the sample points represents different submarine plateaus/seamount chains (the boundary of the submarine plateau is the −3000 m isobath). The map indicates the age range of the data points/regional data: FNR—Fernando de Noronha Ridge, PS—Pernambuco Seamount Chain, BS—Bahia Seamount Chain, VTR—Victoria–Trinidad Ridge, RGR—Rio Grande Rise, IOR—Ocadas Rise, CVL—Cameroon Volcanic Chain, GSC—Guinea Seamount Chain, WR—Wolvis Ridge, TCS—Tristan da Cunha Islands, GI—Goff Island, DR—Discovery Rise, AR—Agulhas Ridge. MR—Meteor Rise, and SR—Shona Ridge; CVL, IOR, and GSC are shown as the geological background of the region.
3. Data and Methods
The data for this study originated from the global geochemical databases GEOROC and PetDB. Whole-rock and glass geochemical data of basalts from major hotspot-derived seamount chains, rises, and islands along the South Atlantic Mid-Atlantic Ridge were systematically collected. The integrated dataset contains 288 records (Table S1). After LOF outlier filtering, 272 samples were retained for subsequent clustering and spatial interpolation. Because the SOURCE field in the database may contain hotspot names and names of submarine plateaus/seamount chains, the sample location statistics were uniformly divided and summarized using the names of vector regions, rather than using SOURCE labels. The study area encompasses the Walvis Ridge, Rio Grande Rise, Fernando de Noronha Ridge, Pernambuco Seamount, Bahia Seamount, Victoria–Trinidad Ridge, Cameroon Volcanic Chain, Guinea Seamount Chain, Discovery Seamount Chain, Agulhas Ridge, Meteor Rise, and Shona Rise.
To identify the intrinsic differentiation structure of Sr–Nd–Pb isotopic composition in samples from the Atlantic seafloor plateau, intra-oceanic seamounts, and related volcanic rocks, and to characterize their spatially continuous variation, this paper, based on the multi-parameter optimized UMAP-HAC dimensionality reduction and clustering analysis framework, further introduces outlier identification (LOF), feature importance analysis (MI and SHAP), and spatial interpolation (MIK) steps to jointly analyze multi-source isotopic data [28,29,30,31,32,33,34,35,36]. The overall technical approach includes data preprocessing and standardization, manifold structure identification and dimensionality reduction, outlier identification and classification, feature importance analysis, sensitivity analysis, and spatial reconstruction and result interpretation based on multi-indicator kriging (MIK).
3.1. UMAP-HAC Dimensionality Reduction
We selected 87Sr/86Sr, 143Nd/144Nd, 206Pb/204Pb, 207Pb/204Pb, and 208Pb/204Pb as the core isotopic features. Because these variables differ in scale and numerical range, all raw data were standardized prior to analysis to avoid bias introduced by scale effects:
where is the original value of the -th variable for the -th sample, and are the mean and standard deviation of that variable, and is the standardized value. After standardization, all variables were placed on the same scale and could be used comparably in subsequent analyses. The standardized five-dimensional isotope matrix was then used for UMAP dimensionality reduction, HAC clustering, LOF outlier detection, and feature importance analysis.
To determine whether high-dimensional isotopic data possess a manifold structure suitable for low-dimensional representation, this paper first conducts a preliminary assessment of data complexity through intrinsic dimension estimation. The results show that the samples exhibit significantly low-dimensional organizational features in the high-dimensional feature space. Therefore, a nonlinear dimensionality reduction is further performed using Uniform Manifold Approximation and Projection (UMAP). UMAP projects the standardized 5-dimensional isotope matrix onto a two-dimensional space while preserving local neighborhood relationships and first-order topological structure [28,30].
The neighborhood parameter n_neighbors, the minimum distance parameter min_dist, and the number of clusters k are evaluated through a grid search. Then, the Ward minimum variance connectivity criterion (HAC) is applied to the two-dimensional UMAP embedding, which minimizes intra-cluster variance during clustering [29]. The number of clusters is not determined solely by visual inspection of the two-dimensional UMAP projection. Instead, we systematically evaluated the clustering results from k = 2 to k = 6 using the silhouette coefficient [41], Calinski–Harabasz index [42], Davies–Bouldin index [43], and an equally weighted composite score. The silhouette coefficient assesses intra-cluster cohesion and inter-cluster separation; the Calinski–Harabasz index assesses the ratio of inter-cluster dispersion to intra-cluster dispersion; and the Davies–Bouldin index assesses the average inter-cluster similarity. Larger silhouette coefficient and Calinski–Harabasz index values indicate better clustering, while smaller Davies–Bouldin index values indicate better separation.
For each clustering result, we normalized these three internal metrics and combined them into an equally weighted composite score:
where and are the min–max-normalized Silhouette and Calinski–Harabasz scores, respectively, and is the reversed min–max-normalized Davies–Bouldin score.
In addition to evaluating the clustering performance of UMAP-HAC, this paper also performed original space validation, that is, projecting the clustering labels obtained by UMAP-HAC back to the original 5-dimensional Sr-Nd-Pb isotope space and recalculating the silhouette coefficient, Calinski–Harabasz index, and Davies–Bouldin index. The UMAP-HAC projection showed the strongest separation at k = 2, indicating a significant isotope-2 classification trend in the dataset. However, under the optimal UMAP parameters (n_neighbors = 36; min_dist = 0.01), k = 3 achieved high clustering performance in the UMAP space and obtained the highest overall score for the original 5-dimensional validation among all test schemes (Table 1).
Table 1.
Comparison of clustering results under optimal fixed parameters (n_neighbors = 36; min_dist = 0.01).
3.2. LOF Outlier Detection
A small number of obvious anomalous records exist in the original samples. For example, the 206Pb/204Pb values of some samples are higher (>20.3), and the 87Sr/86Sr values are also significantly higher (>0.704). In addition, some samples show a composite anomalous feature of simultaneously higher 87Sr/86Sr and 143Nd/144Nd. In order to reduce the interference of anomalous samples on the cluster boundary and subsequent spatial interpolation results, this paper uses the Local Anomaly Factor (LOF) algorithm [28] to identify outliers. LOF compares the local density of a sample with the density of its nearest neighbor sample to identify samples located in a relatively sparse local neighborhood. In this workflow, LOF is applied to a normalized five-dimensional isotope matrix, where n_neighbors = 20 and contamination = 0.05. Samples marked as Is_Outlier = TRUE are excluded from the main UMAP-HAC clustering, spatial interpolation and geochemical interpretation. The Appendix provides a summary of provincial LOFs, and a complete list of outliers can be found in the Supplementary Materials (Table S2).
3.3. Sampling Imbalance Sensitivity Analysis
To assess whether the UMAP-HAC clustering results with k = 3 are affected by sample imbalance, two complementary sampling imbalance sensitivity analyses were conducted. First, a down-sampling test was performed on Walvis Ridge, as it is the most densely sampled submarine plateau/seamount chain in the retained dataset. In this test, 30%, 50%, and 70% of the Walvis Ridge samples were randomly retained, while samples from all other submarine plateaus/seamount chains remained unchanged. Each retention percentage was repeated 100 times.
Second, a balanced-cap test was conducted across the entire region to assess the impact of sample imbalance across the entire coordinate-defined submarine plateau and seamount chain. In this test, the number of samples per geological province was randomly limited to a maximum of 5, 10, 20, or 30 samples. Submarine plateaus/seamount chains with fewer samples than this upper limit remained unchanged. Each upper limit level was repeated 100 times. This balanced-cap test was used to assess whether the classification results with k = 3 remained stable when the data volume of all submarine plateaus/seamount chains with relatively large sample sizes was reduced.
For each repeated test, UMAP-HAC clustering was performed repeatedly with k = 3. The resulting labels were compared with the full-data baseline labels using the Adjusted Rand Index (ARI) and Adjusted Mutual Information (AMI):
where is the Rand Index, and E() is its expected value under random labeling. values close to 1 indicate strong agreement with the baseline clustering after correcting for chance.
AMI was used as a complementary information-theoretic measure:
where and are two clustering label assignments, is their mutual information, and are their entropies, and is the entropy normalization term. values close to 1 indicate strong similarity between the resampled clustering result and the full-data baseline solution.
The Walvis Ridge down-sampling test showed high stability (Table 2). When retaining 30%, 50%, and 70% of the samples, the average ARI values were 0.929, 0.948, and 0.960, respectively. The corresponding average AMI values were 0.919, 0.937, and 0.950. These results indicate that the structure of the k = 3 dimensionality-reduced clustering results is not entirely controlled by the Walvis Ridge samples.
Table 2.
Sensitivity analysis of the k = 3 UMAP-HAC solution under targeted Walvis Ridge down-sampling and whole-region balanced-cap resampling.
The full-region balance cap test further demonstrates that the clustering structure is not merely an artifact caused by regional sample imbalance (Table 2). When the number of samples per seamount/seamount chain was limited to 20 and 30, respectively, the clustering results remained highly consistent with the full data baseline, with average ARI values of 0.870 and 0.913, and average AMI values of 0.866 and 0.903, respectively. The cap = 10 test also showed relatively high stability, with average ARI and AMI values of 0.835 and 0.830, respectively. In contrast, the test stability with cap = 5 was lower, with an average ARI of 0.637 and an average AMI of 0.652, indicating that drastically reducing the number of samples removes too much regional and isotopic information and cannot reliably reproduce the clustering structure of the complete data.
3.4. Mutual Information and SHAP Feature-Importance Analysis
To interpret the isotopic controls on the clustering, two complementary feature importance methods were used: mutual information (MI) and SHAP. MI evaluates the statistical dependence between an individual feature and the cluster label [32,33]. For a continuous isotope feature and a discrete cluster label, MI can be expressed as
where is the joint probability distribution of and , and and are their marginal distributions. MI is a univariate measure; it evaluates how much information each isotope ratio contains about the cluster labels without explicitly accounting for feature interactions. Therefore, MI is useful for identifying isotope ratios that independently discriminate the clusters.
SHAP was used as a multivariate model interpretation method [34]. A tree-based classifier was trained to predict the UMAP-HAC cluster labels from the original isotope ratios, and SHAP values were calculated to quantify each isotope’s contribution to the model prediction. For feature j, the SHAP value is defined as
where is the full feature set, is a subset of features excluding feature , is the total number of features, is the model output using feature subset , and is the contribution of feature to the prediction. For multi-class classification problems, SHAP values are evaluated both as the total original impact value and as the contribution value for a specific class. The original SHAP values obtained in this study were not normalized and are consistent with the direct model output used in the final SHAP plot.
In addition to class-specific SHAP analysis, regression-based independent SHAP analysis was used to evaluate the impact of each isotope ratio on the UMAP-1 and UMAP-2 coordinates. This analysis correlates the original isotope space with the reduced-dimensional embedding space and helps determine which isotope ratios control the position of samples along the UMAP axis. The MI results show that 206Pb/204Pb is the most informative feature distinguishing UMAP-HAC cluster labels. In contrast, SHAP analysis shows that 87Sr/86Sr makes the largest total contribution to the model predictions (Table 3).
Table 3.
Mutual information and raw SHAP total-impact values for isotope features.
3.5. Exploratory MIK Spatial Probability Mapping
Multiple indicator kriging (MIK) is a standard geostatistical method for spatial interpolation of multi-class discrete variables. It is achieved by performing MIK interpolation on each class separately [35,36]. In this study, for each reduced-dimensional clustering class , an indicator variable is defined. If the clustering class of the -th sample point is , the value is 1; otherwise, it is 0:
where are the latitude and longitude coordinates of the -th sample point, and the spatial distance is calculated using the great circle distance (Haversine formula). Considering the geological characteristics of the influence of hotspot magmatism, which gradually decreases from the center outwards and has no obvious abrupt boundary, this study prioritizes using an exponential model to fit the indicator variogram of each end-member [35].
For each grid node, the three estimated class probabilities correspond to three clusters. The final displayed categories are assigned based on the highest estimated probability:
The MIK results are interpreted only as an exploratory spatial probability visualization of the clustered regions, and not as independent evidence of mantle structure, mantle tomography, or geodynamic flows. Therefore, the interpolated probability field is used for a regional interpretation of the UMAP-HAC dimensionality reduction clustering results, rather than for defining deterministic mantle end-member boundaries. Cross-validation and category probability output results are shown in the Supplementary Material (Figure S1).
4. Results
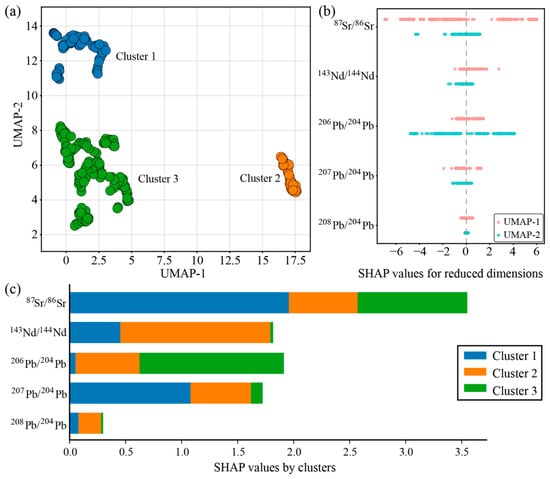
In the dimensionality reduction and clustering process of the South Atlantic hotspot data, 16 outlier records were identified. After removing these outliers, three stable classification categories were obtained. Category 2 differed significantly from categories 1 and 3 in its projection on the UMAP-1 axis; category 1 was clearly distinguishable from categories 2 and 3 in the UMAP-2 direction (Figure 2a). Overall, the three categories formed independent, non-overlapping dense clusters with no significant cross-over, indicating that UMAP dimensionality reduction effectively captured the geochemical differences between different OIB populations, and the clustering results showed good spatial separability.
Figure 2.
Dimensionality reduction clustering results and feature importance interpretation of Sr-Nd-Pb isotope data from South Atlantic Submarine Plateau/Seamount Chain Basalts. (a) UMAP-HAC clustering results using n_neighbors = 36, min_dist = 0.01, and k = 3. The number of data points in each cluster is as follows: Cluster 1, n = 160; Cluster 2, n = 48; and Cluster 3, n = 64. (b) Contribution of each isotopic feature to the dimensionality reduction. (c) Discriminative importance of each isotopic feature to the cluster category.
For UMAP-1, the main isotopic characteristic of its influence is 87Sr/86Sr, and its SHAP value has the widest distribution range, with a maximum value of 6, indicating that a high 87Sr/86Sr ratio corresponds to a high UMAP-1 value. This directly corresponds to the distribution pattern of Cluster 2 in the high-value region of UMAP-1. 143Nd/144Nd and 206Pb/204Pb also contribute to UMAP-1. For UMAP-2, the dominant isotopic influence is 206Pb/204Pb, with a SHAP value as low as −7.8. This indicates that a high 206Pb/204Pb ratio corresponds to a lower UMAP-2 value, directly explaining the differentiation between Cluster 1 in the high-UMAP-2 region (low Pb ratio) and Cluster 3 in the mid-to-low-value region (high Pb ratio). Furthermore, 143Nd/144Nd and 87Sr/86Sr also influence UMAP-2 (Figure 2b).
SHAP analysis of different cluster categories revealed that 87Sr/86Sr has the most significant impact on cluster labels, with a SHAP value far exceeding that of other isotopes, making it the core geochemical indicator for distinguishing the three sample types. 206Pb/204Pb and 143Nd/144Nd were the next most significant contributors, with 206Pb/204Pb making the strongest contribution to category 3, while 143Nd/144Nd dominated the contribution to category 2. Since 207Pb/204Pb and 208Pb/204Pb are highly positively correlated with 206Pb/204Pb, their influence on cluster labels is masked by 206Pb/204Pb (Figure 2c).
5. Discussion
5.1. Correspondence Between Dimensionality Reduction Clustering Results and Mantle End-Members
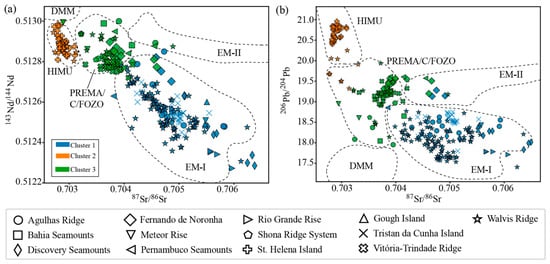
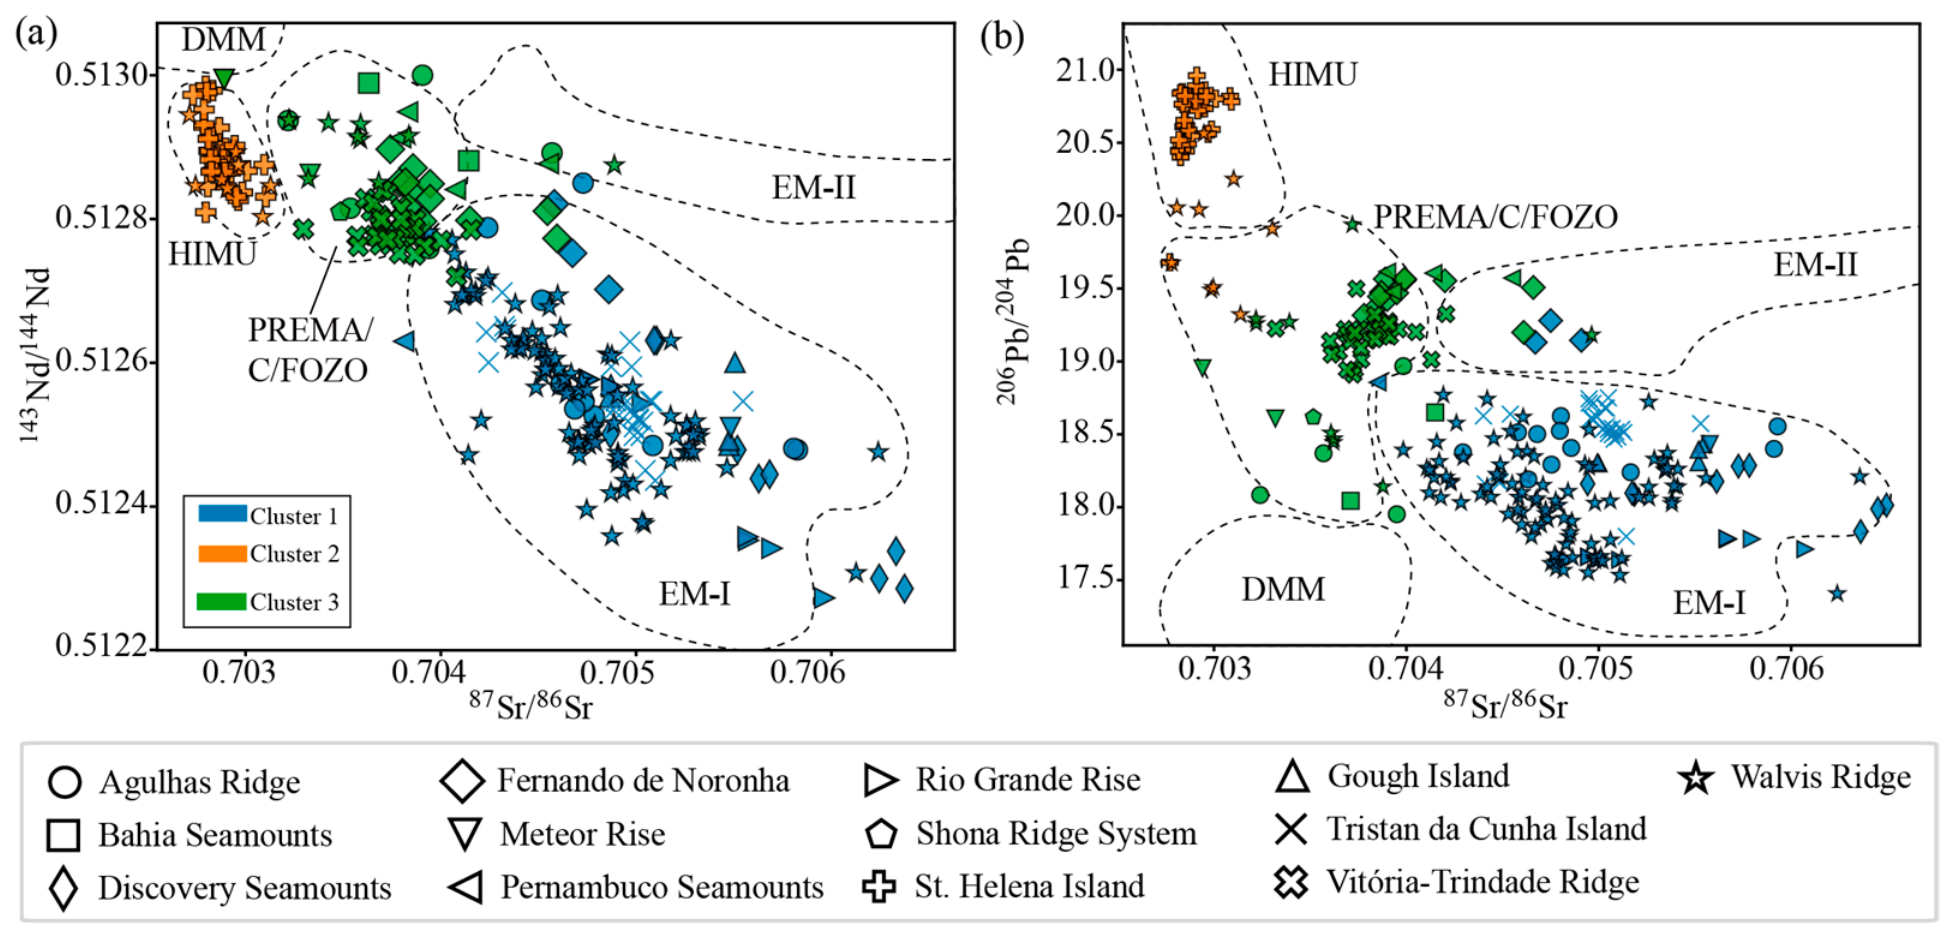
Three categories were identified through dimensionality reduction clustering of isotopic data from basalts in the South Atlantic submarine plateau/seamount chain. Category 1 is similar to conventional enriched mantle end-members (EM-I and EM-II), characterized by low 206Pb/204Pb (<19.0) and high 87Sr/86Sr (>0.7045), and is distributed in the Agulhas Ridge, Goff Island, Walvis Ridge, Rio Grande Rise, Meteor Rise, Discovery Seamount Chain, and Tristan da Cunha Island. Category 2 is similar to conventional HIMU mantle end-members, characterized by high 206Pb/204Pb (>19.5) and low 87Sr/86Sr (<0.704), and is distributed in St. Helena Island, Walvis Ridge, and Agulhas Ridge. Category 3 exhibits PREMA (C/FOZO) characteristics: moderate 206Pb/204Pb (18.8–19.5) and low 87Sr/86Sr (0.703–0.704), distributed in the Agulhas Ridge, Bahia Seamount Chain, Fernando de Noronha Ridge, Meteor Rise, Pernambuco Seamount Chain, Shona Ridge, Victoria–Trinidad Ridge, and Walvis Ridge (Figure 3).
Figure 3.
Two-dimensional isotopic distribution characteristics of South Atlantic hotspot products. The two-dimensional plots illustrate the correspondence between UMAP-HAC clusters and traditional mantle end-member reference fields defined or synthesized by Zindler and Hart [44], Stracke et al. [45], Weiss, et al. [46], Jackson and Dasgupta [47], and Worner et al. [48]. (a) 87Sr/86Sr—143Nd/144Nd isotopic plot; (b) 87Sr/86Sr—206Pb/204Pb isotopic plot. DMM is shown in the figure as a classic mantle end-member for reference; however, the data do not fall within this region.
5.2. Spatial Distribution Characteristics of Mantle End-Members in South Atlantic Hotspots
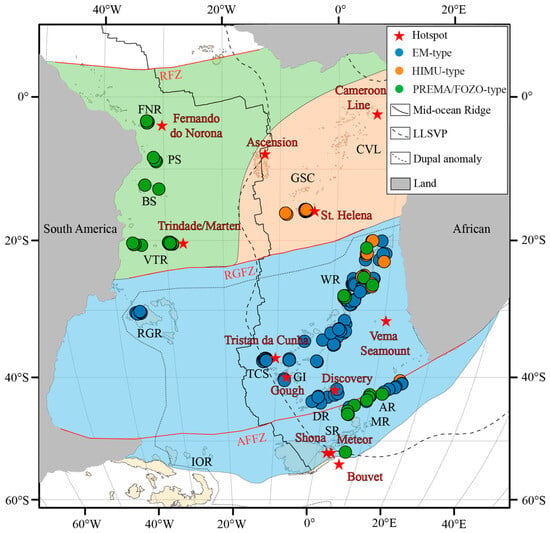
To characterize the continuous spatial evolution of discrete categories, this paper attempts to use the multi-indicator kriging method (MIK) to spatially interpolate and reconstruct the classification results and draw probability distribution maps [35,36]. Simultaneously, the boundaries of the partitions are adjusted with reference to important fault lines in the South Atlantic, resulting in spatial partitions of the mantle end-members in the South Atlantic region. Hotspot mantle end-member types are mainly divided into three regions: the HIMU-type is distributed in the Guinea seamount chain, St. Helena Island, and Walvis Ridge; the EM-type is distributed in the Walvis Ridge, Gough Island, Tristan da Cunha Island, Rio Grande Rise, Discovery Rise, Agulhas Ridge, Meteor Rise, and Shona Ridge; and the PREMA/FOZO-type is distributed in the Fernando de Noronha Ridge, Pernambuco seamount chain, Bahia seamount chain, Victoria–Trinidad Ridge, Meteor Rise, Walvis Ridge, and Agulhas Ridge (Figure 4).
Figure 4.
Exploratory MIK spatial probability map of UMAP-HAC cluster distributions in South Atlantic hotspot-related volcanic systems. Supporting probability and cross-validation diagnostics are provided in the Supplementary Materials (Figure S1). The abbreviations for submarine plateaus and seamount chains are the same as in Figure 1. Fracture zones: RFZ, Romanche Fracture Zone; RGFZ, Rio Grande Fracture Zone; AFFZ, Falkland–Agulhas Fracture Zone. The map shows the highest-probability cluster at each grid node and should be interpreted as a probability visualization rather than a deterministic mantle-source boundary.
The South Atlantic is divided by the Rio Grande Fracture Zone and the South Atlantic Mid-Ocean Ridge. Its hotspot mantle end-members generally exhibit a spatial distribution characterized by “north–south zonation” and “east–west partitioning.” The southern part of the Rio Grande Fracture Zone is dominated by the EM type, while the northern part is mainly composed of the HIMU- and PREMA/FOZO-type. Specifically, the eastern flank of the northern mid-ocean ridge is dominated by the HIMU type, while the western flank is dominated by the PREMA/FOZO-type. Combining the distribution of the DUPAL anomaly and LLSVP in the South Atlantic region, the mantle end-members of South Atlantic hotspot products generally exhibit a quadrant distribution characteristic. Furthermore, combining the LLSVP and DUPAL anomaly regions, it was found that EM-type data in the South Atlantic region are mainly distributed within the DUPAL anomaly region, while HIMU-type data are distributed above the LLSVP [18,49,50,51,52]. Since this study did not quantitatively calculate ∆7/4 and ∆8/4, nor did it perform geophysical modeling of the mantle structure, the relationships between isotope type distribution, DUPAL anomaly, and LLSVP are spatial correlations for comparison, rather than direct mantle dynamic constraints.
5.3. Time Series of Major Hotspot Products in the South Atlantic
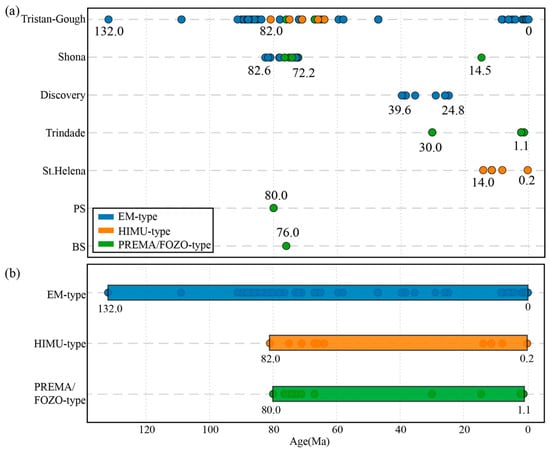
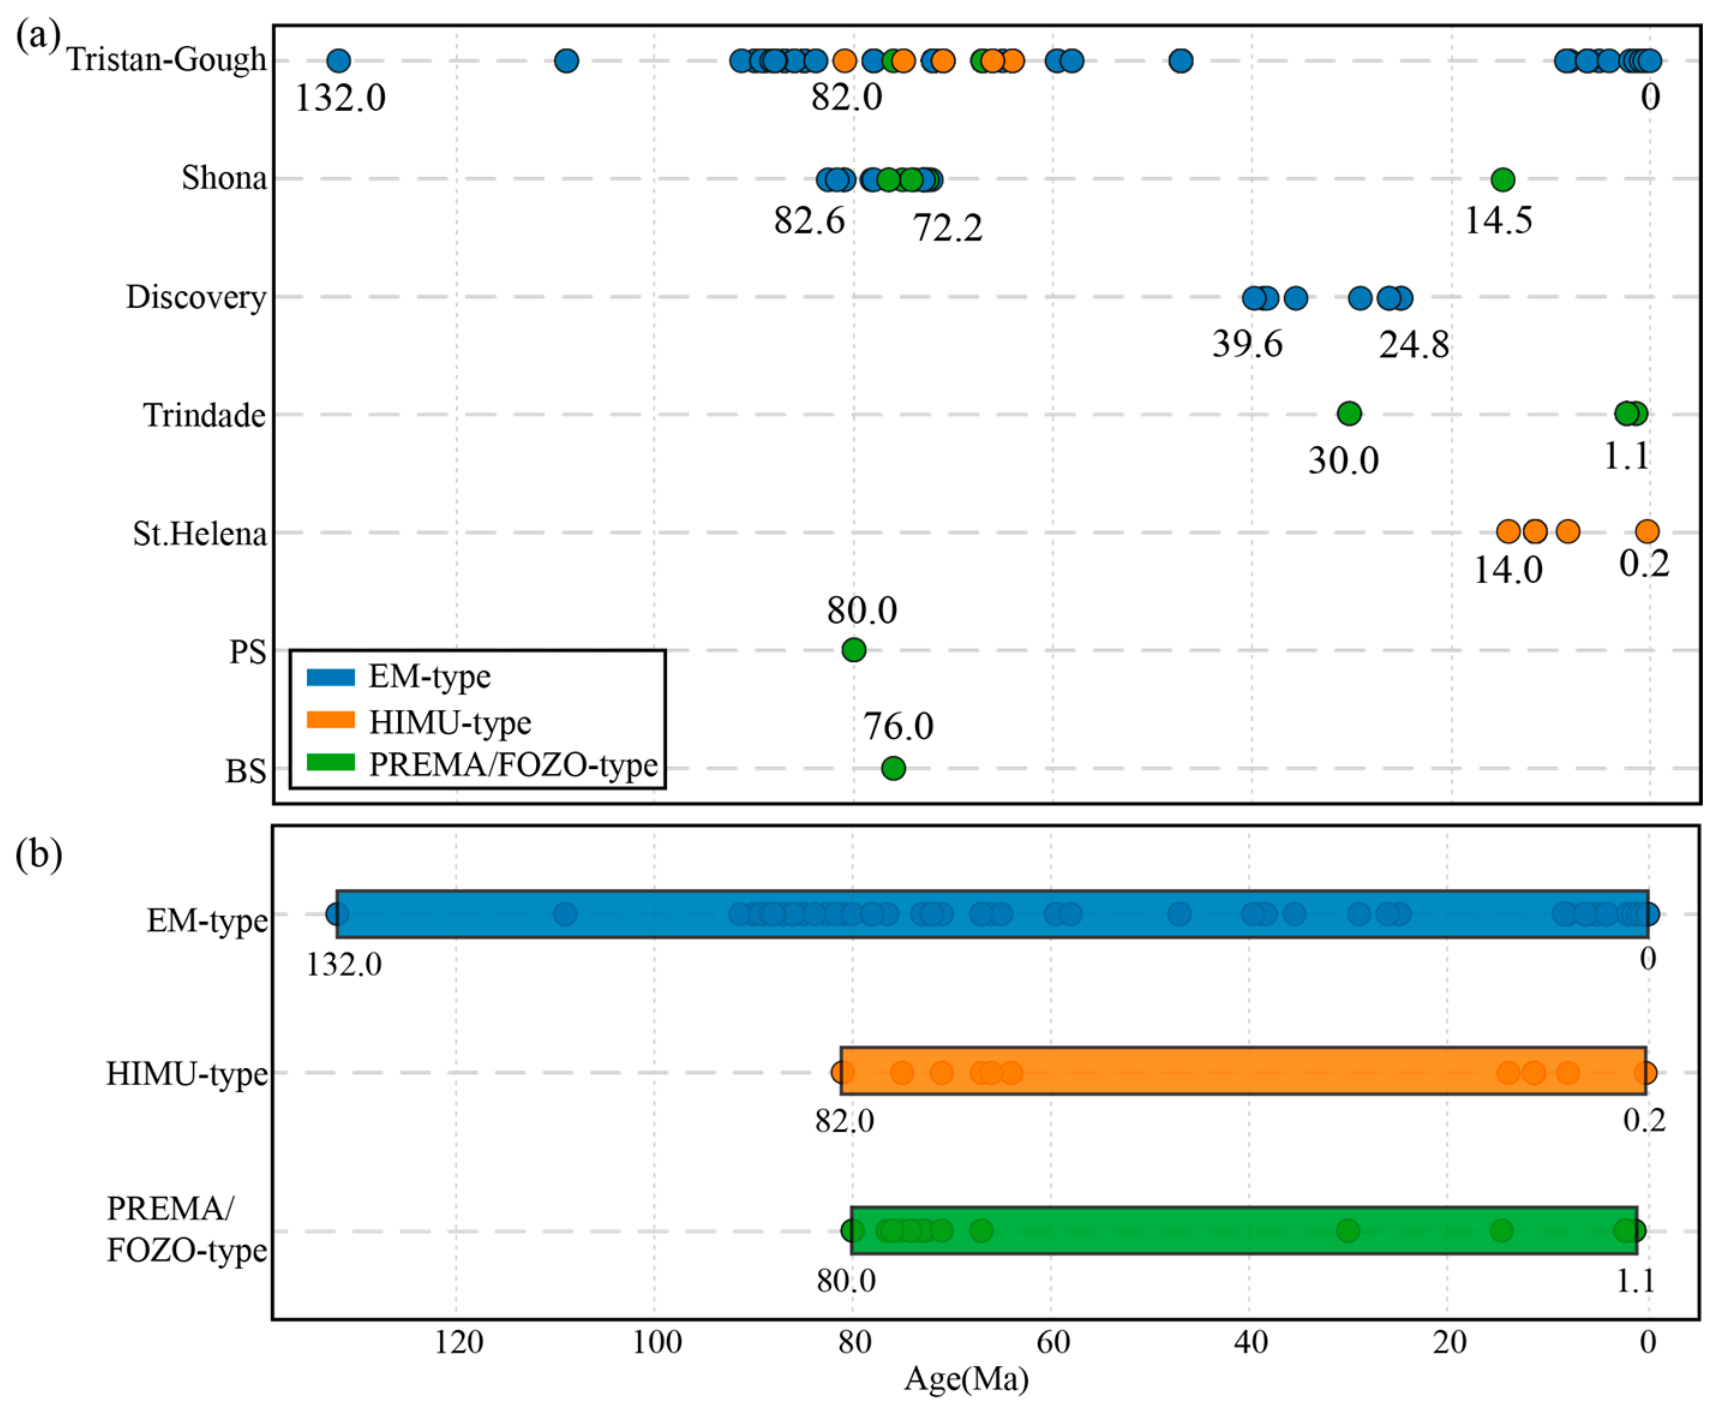
To gain a more comprehensive understanding of the evolution of hotspot mantle end-members in the South Atlantic region over time, this paper classifies all submarine plateau/seamount chains according to their associated hotspot systems, resulting in four major hotspot systems and one independent hotspot product: the Tristan–Gough hotspot system, the Discovery hotspot system, the Shona hotspot system, the Trindade hotspot system, and the St. Helena hotspot (Figure 5a).
Figure 5.
Temporal sequence of different mantle end-member-like components in South Atlantic hotspot-related volcanic systems. (a) Evolutionary sequence of mantle end-member-like components in different hotspot-related systems in the South Atlantic. (b) Time-series diagram of different mantle end-member-like components in the South Atlantic. The temporal trends are based on available samples with reported ages and should be interpreted cautiously in sparsely sampled regions.
Among them, the largest, the Tristan–Gough hotspot system, is a common origin of the Walvis Ridge and its southern flank, Gough Island and Tristan da Cunha Island, as well as the conjugate Rio Grande Rise on the western Atlantic side [1,2,3,4,12,13,14,15,16]. Its geochemical partitioning is characterized by Gough-type EM-I mantle end-members distributed along both sides of the trajectory and Tristan-type relatively depleted EM-I mantle end-members [2,12,16]. In contrast, the Shona hotspot system produced volcanic bodies tectonically separated by the Agulhas–Falkland fault zone, including the Shona Ridge, Agulhas Ridge, and Meteor Rise [37,38]; the basement of this system is predominantly Gough-type EM-type, but HIMU-type signals appeared during later volcanic activity [4,38].
In the eastern South Atlantic, the Discovery hotspot system formed the Discovery Seamount Chain, with its northern seamounts exhibiting Gough-type EM-I composition, while the more enriched EM-II composition appears in the southern seamounts [17,18]. The Vitória-Trindade Ridge, located on the South American Plate, is the surface manifestation of the Trindade hotspot system, with its source region characterized by a long-term homogeneous EM-I isotopic composition [25,26,27]. Furthermore, St. Helena Island, a classic HIMU mantle end-member, represents a product of the St. Helena hotspot system, with its extremely high 206Pb/204Pb ratio attributed to deep, ancient, recirculated oceanic crust [7,8,9]. Notably, the Bahia Seamounts and Pernambuco Seamounts in the Brazilian Basin are interpreted as possibly formed by extinct paired hotspot activities, their isotopic compositions characterized by the PREMA/FOZO-type, not directly attributed to any of the aforementioned specific hotspot trajectories [5,20,24].
The earliest hotspot record in the South Atlantic is the Paraná–Etendeka igneous province, formed around 132 Ma from the Tristan Goff hotspot [13,14]. Subsequently, EM-type magmatic activity continued to construct the Walvis Ridge (~115–0 Ma) and the Rio Grande Rise (~88–47 Ma) [6,15]. Around 82 Ma, HIMU-type magmatic activity associated with the St. Helena hotspot began at the northeastern end of the Guinea seamount chain and propagated southwestward to St. Helena Island and the present-day hotspot location [5]. Since ~44 Ma, the Discovery and Shona hotspots have formed a series of EM-type seamount chains in the southern South Atlantic [17,18,37,38]. From ~30 Ma, the Fernando de Noronha Ridge and the Victoria–Trinidad Ridge began to be active, with PREMA/FOZO-type volcanic activity continuing to this day [19,25,26,27]. In terms of the overall time series (Figure 5b), EM-type magmatic activity started early (132 Ma) and lasted the longest; HIMU-type activity started later (from 82 Ma) but continues to this day; and PREMA/FOZO-type is in the middle series (from 80 Ma).
5.4. Magmatic Models in African Marginal Hotspots
The mantle end-members of hotspots in the South Atlantic exhibit a spatial distribution characterized by both north-south zonation and east-west partitioning. The southern region is dominated by the EM-type, while the northern region is primarily composed of the HIMU- and PREMA/FOZO-type. Specifically, the eastern flank of the mid-ocean ridge is dominated by the HIMU-type, while the western flank is dominated by the PREMA/FOZO-type. Temporally, EM-type magmatic activity began earlier (approximately 132 Ma) and continues to the present; HIMU- and PREMA/FOZO-type magmatic activity began later (approximately 82–80 Ma), and HIMU-type magmatic activity can superimpose on the early EM-type basement [1,4,18]. South Atlantic HIMU-type magmatic activity is generally closer to the African continental margin, which aligns with the distribution characteristics of mantle end-members in Indian Ocean hotspots [18,50,51,52,53,54]. The mantle end-members of Indian Ocean hotspot products generally exhibit east–west partitioning, with the western region near Africa being the HIMU-type partition, the eastern region being the EM-type partition, and the PREMA/FOZO-type partition located in the central region. Similarly, temporally, HIMU-type hotspot products are generally younger than EM-type hotspots.
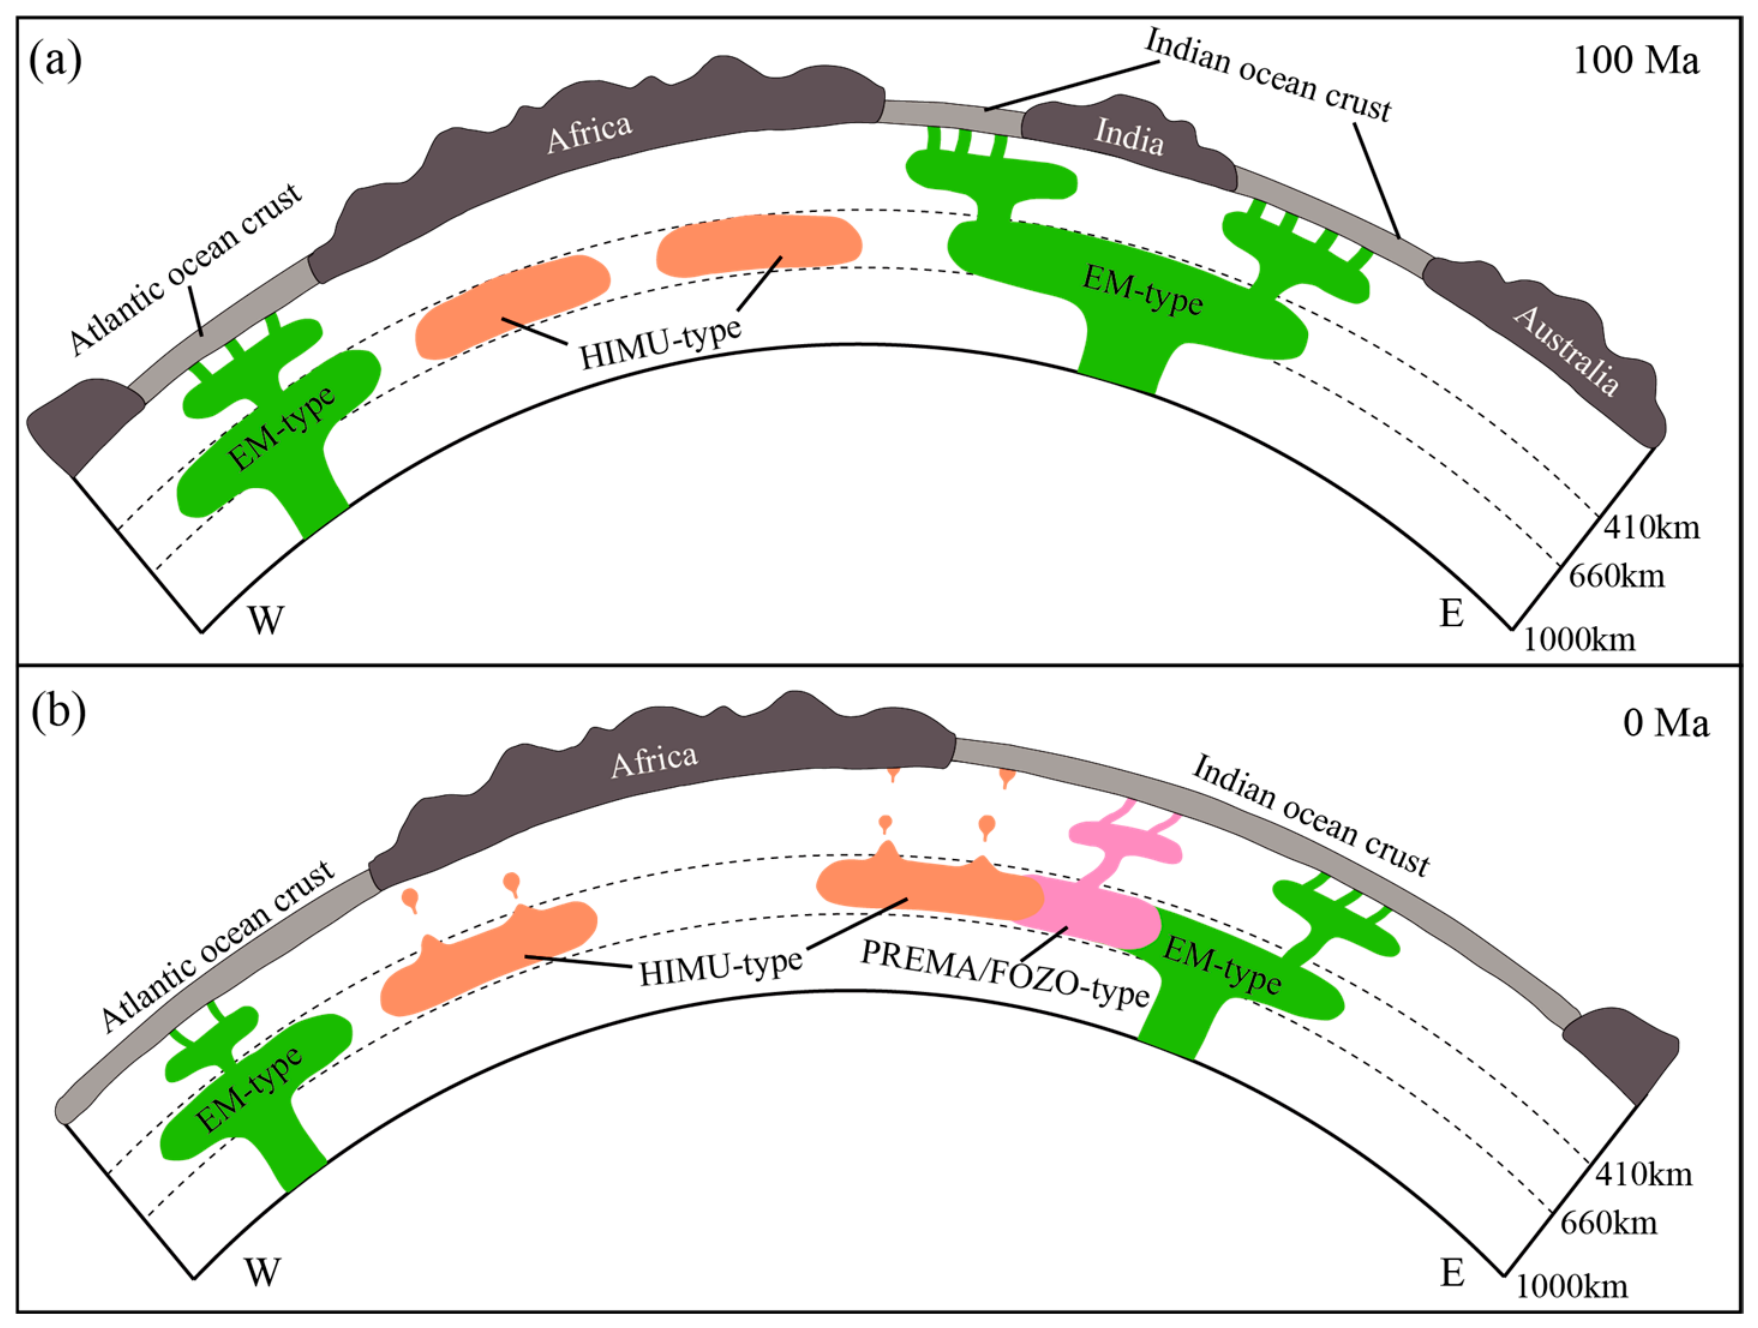
Based on this, this paper proposes a two-stage magmatism model of multiple hotspots along the African margin (Figure 6): The first stage, ~135–132 Ma, involved the delamination of the ancient lower continental crust or lithosphere during the breakup of Gondwana, which altered or formed EM-type hotspot materials, resulting in the Paraná–Etendeka igneous province, the Mozambique submarine plateau, and the Naturaliste submarine plateau, among others. Subsequent continuous activity led to the formation of EM-type products such as the Walvis Ridge, the Rio Grande Rise, the Kerguelen submarine plateau, the Broken Ridge, and the 90° E Ridge.
Figure 6.
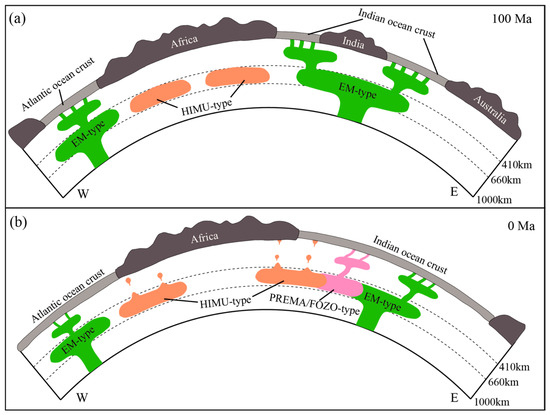
Schematic synthesis of the temporal expression of EM-type, HIMU-type, and PREMA/FOZO-type components in hotspot-related volcanic systems along and near the African margin. (a) By approximately 100 Ma, EM-type hotspot-related magmatism was already widely expressed in major volcanic ridges, plateaus, and large igneous provinces associated with the early evolution of the South Atlantic. (b) At 0 Ma, EM-type, HIMU-type, and PREMA/FOZO-type components are all represented in South Atlantic and adjacent hotspot-related volcanic systems. HIMU-type signatures are represented by St. Helena and locally superimposed late-stage volcanism on older EM-type edifices. The diagram is conceptual, not to scale, and does not imply that the depth, geometry, or continuity of mantle reservoirs is independently constrained by the present clustering analysis. The mantle structure is drawn with reference to Homrighausen et al. [12] and Dongmo Wamba et al. [36].
The second stage, in its later stages, saw the formation of a series of HIMU-type hotspot products in the weak zones of the mature oceanic crust along the African margin, such as the Guinea seamount chain and St. Helena Island, the late Walvis seamounts, the Comoros Islands, and the West Croze submarine plateau. Research by Homrighausen et al. indicates that global HIMU end-members may have formed in the Archean (>2.45 Ga), related to the exfoliation of the subcontinental lithospheric mantle (SCLM) during carbonatization metasomatism, rather than a simple cycle of young oceanic crust [8,55,56,57]. Kawabata and Blusztajn et al., using Sr–Nd–Pb and Tl isotope constraints, also support the inclusion of ancient recycled oceanic crust in the HIMU-type source region of St. Helena, with a formation time of 1–2 Ga [17,37]. Therefore, these HIMU-type anomalous materials may be related to the recycling of ancient carbonated SCLM or ancient oceanic crust. These materials are preserved in the deep mantle for a long time, and the magmatic activity signals are covered by early EM-type until the later EM-type magmatic activity weakens, and HIMU-type hotspots are characterized by small-scale, sporadic seamount occurrences.
6. Conclusions
Dimensionality reduction, clustering and spatiotemporal analysis of Sr-Nd-Pb isotopic data of South Atlantic hotspot-derived seamount chains/rise basalts identified three types of mantle end-members: EM-type, HIMU-type, and PREMA/FOZO-type. These end-members exhibit a spatial pattern of “north–south zonation” and “east–west partitioning”: the south is dominated by the EM-type, while the north is dominated by the HIMU- and PREMA/FOZO-type. The eastern flank of the mid-ocean ridge is concentrated with the HIMU-type, while the western flank is dominated by the PREMA/FOZO-type. The EM-type is primarily located in the Dupal anomaly region and at the edge of the African LLSVP, while the HIMU-type is concentrated above and within the LLSVP, and the PREMA/FOZO-type is far from the influence of the LLSVP. Temporally, the EM-type magmatic activity began earliest (approximately 132 Ma) and continues to the present, while the HIMU-type appeared later (approximately 82 Ma) and can form vertical superpositions on the EM-type basement. Based on the tectonic evolution of the South Atlantic and Indian Oceans, this paper proposes a two-stage magmatism model with multiple hotspots along the African margin: early magmatism, associated with the breakup of Gondwana, primarily resulted in the formation of large-scale EM-type submarine plateaus and seamount chains (such as the Walvis Ridge, Rio Grande Rise, and Kerguelen Plateau). This lower crustal delamination mainly occurred beneath the continental margins of Africa and South America. Later magmatism, associated with Archean carbonated subcontinental lithospheric mantle (SCLM) or the reactivation of ancient recycled oceanic crust, involved HIMU-type material that melted and rose at weak points in the mature oceanic crust, forming scattered small-scale seamounts (such as the Guinean seamount chain, St. Helena Island, Late Walvis seamounts, and the Comoros Islands). Archean HIMU-type source material mainly remains within the LLSVP region of Africa.
Supplementary Materials
The following supporting information can be downloaded at https://www.mdpi.com/article/10.3390/jmse14131217/s1. Table S1: Retained sample numbers for coordinate-defined South Atlantic hotspot-related provinces after LOF outlier screening; Table S2: LOF outlier summary; Table S3: Sampling imbalance sensitivity results; Table S4: UMAP-HAC clustering results for the dataset after outlier removal. Figure S1: MIK interpolation result and maximum probability distribution map.
Author Contributions
Conceptualization, H.L. and X.Y.; methodology, H.L. and X.Y.; software, H.L.; validation, H.L.; formal analysis, H.L.; investigation, H.L.; resources, X.Y.; data curation, H.L.; writing—original draft preparation, H.L.; writing—review and editing, H.L., X.Y., H.H. (Hu He), Y.Y., X.X., and H.H. (Hang Hu); visualization, H.L., H.H. (Hu He). and Y.Y.; supervision, X.Y.; project administration, X.Y.; funding acquisition, X.Y. All authors have read and agreed to the published version of the manuscript.
Funding
This research was funded by the National Key Research and Development Program of China, grant number 2021YFF0501301. This research was funded by the National Natural Science Foundation of China, grant numbers 42172231 and 41872242.
Data Availability Statement
The original contributions presented in this study are included in this article. Further inquiries can be directed to the corresponding authors.
Conflicts of Interest
The authors declare no conflicts of interest.
References
- Homrighausen, S.; Hoernle, K.; Hauff, F.; Wartho, J.-A.; Bogaard, P.v.D.; Garbe-Schönberg, D. New age and geochemical data from the Walvis Ridge: The temporal and spatial diversity of South Atlantic intraplate volcanism and its possible origin. Geochim. Cosmochim. Acta 2019, 245, 16–34. [Google Scholar] [CrossRef] [Scilit]
- Hoernle, K.; Rohde, J.; Hauff, F.; Garbe-Schönberg, D.; Homrighausen, S.; Werner, R.; Morgan, J.P. How and when plume zonation appeared during the 132 Myr evolution of the Tristan Hotspot. Nat. Commun. 2015, 6, 7799. [Google Scholar] [CrossRef] [Scilit] [PubMed]
- O’connor, J.M.; Jokat, W. Tracking the Tristan-Gough mantle plume using discrete chains of intraplate volcanic centers buried in the Walvis Ridge. Geology 2015, 43, 715–718. [Google Scholar] [CrossRef] [Scilit]
- Homrighausen, S.; Hoernle, K.; Geldmacher, J.; Wartho, J.-A.; Hauff, F.; Portnyagin, M.; Werner, R.; van den Bogaard, P.; Garbe-Schönberg, D. Unexpected HIMU-type late-stage volcanism on the Walvis Ridge. Earth Planet. Sci. Lett. 2018, 492, 251–263. [Google Scholar] [CrossRef] [Scilit]
- O’Connor, J.M.; le Roex, A.P. South Atlantic hot spot-plume systems: 1. Distribution of volcanism in time and space. Earth Planet. Sci. Lett. 1992, 113, 343–364. [Google Scholar] [CrossRef] [Scilit]
- O’Connor, J.M.; Duncan, R.A. Evolution of the Walvis Ridge-Rio Grande Rise hot spot system: Implications for African and South American plate motions over plumes. J. Geophys. Res. Solid Earth 1990, 95, 17475–17502. [Google Scholar] [CrossRef] [Scilit]
- Chaffey, D.J.; Cliff, R.A.; Wilson, B.M. Characterization of the St Helena magma source. Geol. Soc. Lond. Spec. Publ. 1989, 42, 257–276. [Google Scholar] [CrossRef] [Scilit]
- Kawabata, H.; Hanyu, T.; Chang, Q.; Kimura, J.-I.; Nichols, A.R.L.; Tatsumi, Y. The petrology and geochemistry of St. Helena alkali basalts: Evaluation of the oceanic crust-recycling model for HIMU OIB. J. Pet. 2011, 52, 791–838. [Google Scholar] [CrossRef] [Scilit]
- Blusztajn, J.; Nielsen, S.G.; Marschall, H.R.; Shu, Y.; Ostrander, C.M.; Hanyu, T. Thallium isotope systematics in volcanic rocks from St. Helena—Constraints on the origin of the HIMU reservoir. Chem. Geol. 2018, 476, 292–301. [Google Scholar] [CrossRef] [Scilit]
- Boyet, M.; Doucelance, R.; Israel, C.; Bonnand, P.; Auclair, D.; Suchorski, K.; Bosq, C. New constraints on the origin of the EM-1 component revealed by the measurement of the La-Ce isotope systematics in Gough Island lavas. Geochem. Geophys. Geosyst. 2019, 20, 2484–2498. [Google Scholar] [CrossRef] [Scilit]
- Gibson, S.A.; Thompson, R.N.; Day, J.A.; Humphris, S.E.; Dickin, A.P. Melt-generation processes associated with the Tristan mantle plume: Constraints on the origin of EM-1. Earth Planet. Sci. Lett. 2005, 237, 744–767. [Google Scholar] [CrossRef] [Scilit]
- Rohde, J.; Hoernle, K.; Hauff, F.; Werner, R.; O’Connor, J.; Class, C.; Garbe-Schönberg, D.; Jokat, W. 70 Ma chemical zonation of the Tristan-Gough hotspot track. Geology 2013, 41, 335–338. [Google Scholar] [CrossRef] [Scilit]
- Renne, P.R.; Glen, J.M.; Milner, S.C.; Duncan, A.R. Age of Etendeka flood volcanism and associated intrusions in southwestern Africa. Geology 1996, 24, 659–662. [Google Scholar] [CrossRef] [Scilit]
- Sager, W.; Hoernle, K.; Höfig, T.W.; Avery, A.J.; Bhutani, R.; Buchs, D.M.; Carvallo, C.A.; Class, C.; Dai, Y.; Dalla Valle, G.; et al. Walvis Ridge Hotspot: Drilling Walvis Ridge, Southeast Atlantic Ocean, to test models of ridge-hotspot interaction, isotopic zonation, and the hotspot reference frame. Int. Ocean. Discov. Program Prelim. Rep. 2022, 391. [Google Scholar] [CrossRef] [Scilit]
- Hoyer, P.A.; Haase, K.M.; Regelous, M.; O’cOnnor, J.M.; Homrighausen, S.; Geissler, W.H.; Jokat, W. Mantle plume and rift-related volcanism during the evolution of the Rio Grande Rise. Commun. Earth Environ. 2022, 3, 18. [Google Scholar] [CrossRef] [Scilit]
- Homrighausen, S.; Hoernle, K.; Hauff, F.; Hoyer, P.A.; Haase, K.M.; Geissler, W.H.; Geldmacher, J. Evidence for compositionally distinct upper mantle plumelets since the early history of the Tristan-Gough hotspot. Nat. Commun. 2023, 14, 3908. [Google Scholar] [CrossRef] [Scilit] [PubMed]
- Schwindrofska, A.; Hoernle, K.; Hauff, F.; Bogaard, P.v.D.; Werner, R.; Garbe-Schönberg, D. Origin of enriched components in the South Atlantic: Evidence from 40 Ma geochemical zonation of the Discovery Seamounts. Earth Planet. Sci. Lett. 2016, 441, 167–177. [Google Scholar] [CrossRef] [Scilit]
- Homrighausen, S.; Hoernle, K.; Zhou, H.; Geldmacher, J.; Wartho, J.-A.; Hauff, F.; Werner, R.; Jung, S.; Morgan, J.P. Paired EMI-HIMU hotspots in the South Atlantic—Starting plume heads trigger compositionally distinct secondary plumes? Sci. Adv. 2020, 6, eaba0282. [Google Scholar] [CrossRef] [Scilit] [PubMed]
- Perlingeiro, G.; Vasconcelos, P.M.; Knesel, K.M.; Thiede, D.S.; Cordani, U.G. 40Ar/39Ar geochronology of the Fernando de Noronha Archipelago and implications for the origin of alkaline volcanism in the NE Brazil. J. Volcanol. Geotherm. Res. 2013, 249, 140–154. [Google Scholar] [CrossRef] [Scilit]
- Peyve, A.A.; Skolotnev, S.G. Systematic variations in the composition of volcanic rocks in tectono-magmatic seamount chaines in the Brazil Basin. Geochem. Int. 2014, 52, 111–130. [Google Scholar] [CrossRef] [Scilit]
- Knesel, K.M.; Souza, Z.S.; Vasconcelos, P.M.; Cohen, B.E.; Silveira, F.V. Young volcanism in the Borborema Province, NE Brazil, shows no evidence for a trace of the Fernando de Noronha plume on the continent. Earth Planet. Sci. Lett. 2011, 302, 38–50. [Google Scholar] [CrossRef] [Scilit]
- Gerlach, D.C.; Stormer, J.C., Jr.; Mueller, P.A. Isotopic geochemistry of Fernando de Noronha. Earth Planet. Sci. Lett. 1987, 85, 129–144. [Google Scholar] [CrossRef] [Scilit]
- Weaver, B.L. Geochemistry of highly-undersaturated ocean island basalt suites from the South Atlantic Ocean: Fernando de Noronha and Trindade islands. Contrib. Miner. Pet. 1990, 105, 502–515. [Google Scholar] [CrossRef] [Scilit]
- Cherkis, N.; Chayes, D.; Costa, L. The bathymetry and distribution of the Bahia Seamounts, Brazil Basin. Mar. Geol. 1992, 103, 335–347. [Google Scholar] [CrossRef] [Scilit]
- Maia, T.M.; dos Santos, A.C.; Rocha-Júnior, E.R.; de Morisson Valeriano, C.; Mendes, J.C.; Jeck, I.K.; dos Santos, W.H.; de Oliveira, A.L.; Mohriak, W.U. First petrologic data for Vitória Seamount, Vitória-Trindade Ridge, South Atlantic: A contribution to the Trindade mantle plume evolution. J. S. Am. Earth Sci. 2021, 109, 103304. [Google Scholar] [CrossRef] [Scilit]
- Geraldes, M.C.; Motoki, A.; Costa, A.; Mota, C.E.; Mohriak, W.U. Geochronology (Ar/Ar and K–Ar) of the South Atlantic post-break-up magmatism. Geol. Soc. Lond. Spec. Publ. 2013, 369, 41–74. [Google Scholar] [CrossRef] [Scilit]
- Siebel, W.; Becchio, R.; Volker, F.; Hansen, M.A.; Viramonte, J.; Trumbull, R.B.; Haase, G.; Zimmer, M. Trindade and Martín Vaz Islands, South Atlantic: Isotopic (Sr, Nd, Pb) and trace element constraints on plume related magmatism. J. S. Am. Earth Sci. 2000, 13, 79–103. [Google Scholar] [CrossRef] [Scilit]
- Healy, J.; McInnes, L. Uniform manifold approximation and projection. Nat. Rev. Methods Prim. 2024, 4, 82. [Google Scholar] [CrossRef] [Scilit]
- McInnes, L.; Healy, J.; Melville, J. Umap: Uniform manifold approximation and projection for dimension reduction. arXiv 2018, arXiv:1802.03426. [Google Scholar]
- Ward, J.H., Jr. Hierarchical grouping to optimize an objective function. J. Am. Stat. Assoc. 1963, 58, 236–244. [Google Scholar] [CrossRef]
- Breunig, M.M.; Kriegel, H.P.; Ng, R.T.; Sander, J. LOF: Identifying density-based local outliers. In Proceedings of the 2000 ACM SIGMOD International Conference on Management of Data; ACM: New York, NY, USA, 2000; pp. 93–104. [Google Scholar]
- Cover, T.M. Elements of Information Theory; John Wiley & Sons: Hoboken, NJ, USA, 1999. [Google Scholar]
- Kraskov, A.; Stögbauer, H.; Grassberger, P. Estimating mutual information. Phys. Rev. E Stat. Nonlinear Soft Matter Phys. 2004, 69, 066138. [Google Scholar] [CrossRef] [Scilit]
- Lundberg, S.M.; Lee, S.I. A unified approach to interpreting model predictions. Adv. Neural Inf. Process. Syst. 2017, 30. [Google Scholar] [CrossRef] [Scilit]
- Journel, A.G. Nonparametric estimation of spatial distributions. Math. Geol. 1983, 15, 445–468. [Google Scholar] [CrossRef] [Scilit]
- Coburn, T.C.; Goovaerts, P. Geostatistics for Natural Resources Evaluation; Oxford University Press: Oxford, UK, 1997. [Google Scholar]
- Hoernle, K.; Schwindrofska, A.; Werner, R.; Bogaard, P.v.D.; Hauff, F.; Uenzelmann-Neben, G.; Garbe-Schönberg, D. Tectonic dissection and displacement of parts of Shona hotspot volcano 3500 km along the Agulhas-Falkland Fracture Zone. Geology 2016, 44, 263–266. [Google Scholar] [CrossRef] [Scilit]
- le Roex, A.; Class, C.; O’connor, J.; Jokat, W. Shona and discovery aseismic ridge systems, South Atlantic: Trace element evidence for enriched mantle sources. J. Pet. 2010, 51, 2089–2120. [Google Scholar] [CrossRef] [Scilit]
- Amante, C.; Eakins, B.W. ETOPO1 Arc-Minute Global Relief Model: Procedures, Data Sources and Analysis; National Geophysical Data Center, Marine Geology and Geophysics Division: Boulder, CO, USA, 2009. [Google Scholar]
- ETOPO. 15 Arc-Second Global Relief Model; NOAA National Centers for Environmental Information: Asheville, NC, USA, 2022; p. 10. [Google Scholar]
- Rousseeuw, P.J. Silhouettes: A graphical aid to the interpretation and validation of cluster analysis. J. Comput. Appl. Math. 1987, 20, 53–65. [Google Scholar] [CrossRef] [Scilit]
- Caliński, T.; Harabasz, J. A dendrite method for cluster analysis. Commun. Stat.-Theory Methods 1974, 3, 1–27. [Google Scholar] [CrossRef] [Scilit]
- Davies, D.L.; Bouldin, D.W. A cluster separation measure. IEEE Trans. Pattern Anal. Mach. Intell. 1979, 2, 224–227. [Google Scholar] [CrossRef] [Scilit]
- Zindler, A.; Hart, S. Chemical geodynamics. Annu. Rev. Earth Planet. Sci. 1986, 14, 493–571. [Google Scholar] [CrossRef]
- Stracke, A.; Hofmann, A.W.; Hart, S.R. FOZO, HIMU, and the rest of the mantle zoo. Geochem. Geophys. Geosyst. 2005, 6, Q05007. [Google Scholar] [CrossRef] [Scilit]
- Weiss, Y.; Class, C.; Goldstein, S.L.; Hanyu, T. Key new pieces of the HIMU puzzle from olivines and diamond inclusions. Nature 2016, 537, 666–670. [Google Scholar] [CrossRef] [Scilit] [PubMed]
- Jackson, M.G.; Dasgupta, R. Compositions of HIMU, EM1, and EM2 from global trends between radiogenic isotopes and major elements in ocean island basalts. Earth Planet. Sci. Lett. 2008, 276, 175–186. [Google Scholar] [CrossRef] [Scilit]
- Wörner, G.; Zindler, A.; Staudigel, H.; Schmincke, H.-U. Sr, Nd, and Pb isotope geochemistry of Tertiary and Quaternary alkaline volcanics from West Germany. Earth Planet. Sci. Lett. 1986, 79, 107–119. [Google Scholar] [CrossRef] [Scilit]
- Hart, S.R. A large-scale isotope anomaly in the Southern Hemisphere mantle. Nature 1984, 309, 753–757. [Google Scholar] [CrossRef] [Scilit]
- Burke, K.; Steinberger, B.; Torsvik, T.H.; Smethurst, M.A. Plume generation zones at the margins of large low shear velocity provinces on the core–mantle boundary. Earth Planet. Sci. Lett. 2008, 265, 49–60. [Google Scholar] [CrossRef] [Scilit]
- Torsvik, T.H.; Burke, K.; Steinberger, B.; Webb, S.J.; Ashwal, L.D. Diamonds sampled by plumes from the core–mantle boundary. Nature 2010, 466, 352–355. [Google Scholar] [CrossRef] [Scilit] [PubMed]
- French, S.W.; Romanowicz, B. Broad plumes rooted at the base of the Earth’s mantle beneath major hotspots. Nature 2015, 525, 95–99. [Google Scholar] [CrossRef] [Scilit] [PubMed]
- Homrighausen, S.; Hoernle, K.; Hauff, F.; Geldmacher, J.; Wartho, J.-A.; Bogaard, P.v.D.; Garbe-Schönberg, D. Global distribution of the HIMU end member: Formation through Archean plume-lid tectonics. Earth-Sci. Rev. 2018, 182, 85–101. [Google Scholar] [CrossRef] [Scilit]
- Dongmo Wamba, M.; Montagner, J.P.; Romanowicz, B. Imaging deep-mantle plumbing beneath La Réunion and Comores hot spots: Vertical plume conduits and horizontal ponding zones. Sci. Adv. 2023, 9, eade3723. [Google Scholar] [CrossRef] [Scilit] [PubMed]
- Pattnaik, J.; Ghosh, S.; Dongre, A. Plume activity and carbonated silicate melt metasomatism in Dharwar cratonic lithosphere: Evidence from peridotite xenoliths in Wajrakarur kimberlites. Lithos 2020, 376–377, 105726. [Google Scholar] [CrossRef] [Scilit]
- Pattnaik, J.; Demouchy, S.; Ghosh, S. Low hydrogen concentrations in Dharwar cratonic lithosphere inferred from peridotites, Wajrakarur kimberlites field: Implications for mantle viscosity and carbonated silicate melt metasomatism. Precambrian Res. 2021, 352, 105982. [Google Scholar] [CrossRef] [Scilit]
- Pattnaik, J.; Aulbach, S.; Viljoen, F.; Ueckermann, H.; Mxinwa, T. The diamond-poor nature of corundum-bearing eclogite and Karoo-type overprint of deep eclogite sources beneath the Kimberley region (Kaapvaal craton). J. Pet. 2025, 66, egaf011. [Google Scholar] [CrossRef] [Scilit]

Disclaimer/Publisher’s Note: The statements, opinions and data contained in all publications are solely those of the individual author(s) and contributor(s) and not of MDPI and/or the editor(s). MDPI and/or the editor(s) disclaim responsibility for any injury to people or property resulting from any ideas, methods, instructions or products referred to in the content. |
© 2026 by the authors. Licensee MDPI, Basel, Switzerland. This article is an open access article distributed under the terms and conditions of the Creative Commons Attribution (CC BY) license.