Abstract
In this study, three-dimensional P- and S-wave velocity structures and P- and S-wave velocity ratio variations in the crust and upper mantle beneath the Marmara Region and the Sea of Marmara were modeled using the Poisson tomography method in the field of Seismology. Within this scope, P- and S-wave arrival times from a total of 23,672 earthquakes that occurred in the region between 2011 and 2023 were evaluated, and an inversion procedure based on body-wave arrival times was applied. The obtained results indicate that the northern branch of the North Anatolian Fault Zone is the most active segment among its three main branches. In addition, a low-velocity zone characterized by seismic gap features extending from the southern parts of Marmara toward Istanbul was identified. Within these seismic gap zones, P- and S-wave velocities decrease sharply across regions exhibiting strong velocity gradients. It was determined that this low-velocity structure cuts across the North Anatolian Fault, which branches into three segments within the Sea of Marmara, and continues at depths of approximately 15–25 km. Earthquakes were observed to concentrate particularly in areas with high-velocity ratio variations and within transition zones from low to high values. Due to the complex tectonic and stratigraphic structure of the Marmara Region, these low-velocity seismic gap zones within the crust may be associated with segments capable of generating large earthquakes in the future. Therefore, a detailed investigation of the crustal structure of the region provides important insights for understanding regional earthquake hazards.
1. Introduction
The Marmara Sea is one of the most seismically hazardous regions in the world because it is controlled by the northern branch of the North Anatolian Fault, an active right-lateral strike-slip fault system capable of generating earthquakes greater than Mw 7.0. Historical destructive earthquakes such as the 1509 Istanbul earthquake, the 1766 Marmara earthquakes, the 1912 Şarköy–Mürefte earthquake, and the 1999 İzmit and Düzce earthquakes demonstrate the westward migration of seismic activity toward the Marmara Sea. In addition, probabilistic seismic hazard assessment studies indicate that seismic hazard levels increase significantly when time-dependent earthquake occurrence models are taken into consideration. In this study, the seismic hazard potential and crustal structure of the Marmara Sea were investigated using the Poisson tomography method developed by [1]. In this study, Three-dimensional P- and S-wave tomographic images were obtained in order to determine the seismic velocity structure beneath the Marmara Sea. The results reveal the presence of a low-velocity seismic zone extending from the Southern Marmara Sea toward Istanbul. The identified low-velocity layer intersects the segmented branches of the North Anatolian Fault beneath the Marmara Sea and continues toward the Istanbul region, indicating the existence of structurally weakened crustal zones.
Geological stratigraphy and tomographic results reveal the existence of extensive limestone formations and heterogeneous crustal structures within the Marmara Sea region. These complex tectonic and lithological conditions may contribute to stress accumulation and the generation of future destructive earthquakes. In addition, secondary hazards such as basin amplification, liquefaction, submarine landslides, and tsunami generation increase the seismic risk of the region. Therefore, revealing the three-dimensional active tectonic structure of the Marmara Sea is of great importance for understanding earthquake generation mechanisms and improving seismic hazard assessments for densely populated areas such as Istanbul.
The use of seismic tomography has become widespread in recent years. It is a local or regionally applicable method to reveal the three-dimensional velocity structure of the crust and upper mantle. Three-dimensional seismic tomography is applied successfully, especially in areas with high earthquake activity and volcanic activity. Young or active volcanoes and geothermal regions with high horizontal heterogeneity in the crust and upper mantle are suitable for seismic tomographic methods using teleseismic and local earthquake data.
Ref. [2] calculated 3-D tomography with inversion of multiple arrival time data of the P and S-waves of the crust under the Marmara Region. In order to more reliably interpret the anomalies obtained from P and S-wave velocity models, they have introduced Poisson’s ratio structures. A similar study was conducted by [3] to obtain a 1-D crustal P-wave velocity model in Western Anatolia. The velocity model found is defined as a significantly lower crustal velocity than the average continental crust. Furthermore, significant lateral changes in the velocity structure contain large standard deviation values for the 1-D model. Ref. [4] discussed different shell models on the mantle. They found that high-velocity anomalies in the north of the Anatolian plate increased volumetrically from 130 km depth and from the Arab Plate at 250 km depth.
Ref. [5] examined the crust structure using the P and S-wave arrival times of 6549 earthquakes recorded in Central Anatolia. As a result, it has been suggested that there are strong lateral heterogeneities in the crust and that the main low-velocity anomalies in the upper mantle below the Central Anatolia occur especially in the existing Volcanoes and active fault segments, and higher-than-average Poisson ratios are common in these environments. Tomographic results are generally consistent with the main tectonic features of the region. Studies conducted in recent years have emphasized that the western segment of the North Anatolian Fault Zone (NAFZ) constitutes a major natural hazard due to its intense seismic activity and potential to generate destructive earthquakes.
Ref. [6] highlighted the importance of the GONAF (Geophysical Observatory at the North Anatolian Fault) project, which was established as Türkiye’s first borehole seismometer network. The system was designed to monitor and analyze microseismic activity and to observe the physical processes occurring before, during, and after the anticipated large Marmara earthquake.
Ref. [7] investigated the three-dimensional P-wave velocity structure beneath the Sea of Marmara using travel-time tomography. Their checkerboard tests demonstrated the reliability of the obtained models. The study suggested that increased gravity anomalies beneath the Tekirdağ and Princes’ Islands segments of the northern branch of the NAFZ might be related to mantle intrusion. In contrast, our results indicate reduced seismic velocities beneath the same segments.
Ref. [8] produced three-dimensional seismic tomographic images of the main fault zone beneath the Sea of Marmara using ocean-bottom seismometers (OBS) and land-based seismic stations. Narrow shear zones characterized by low P-wave velocities and high Vp/Vs ratios were identified along the Marmara Fault. Particularly beneath the sedimentary basins, low-velocity structures extending from depths of approximately 8 km to deeper crustal levels were detected. These structures were interpreted as possible locked and creeping fault segments.
Ref. [9] investigated the slip deficit of the NAFZ within the Sea of Marmara using paleoseismological, geodetic, and seismological data. Their results indicated significant stress accumulation along the Central Marmara segment and suggested that the fault exhibits locked behavior. The authors proposed that the region has the potential to generate earthquakes of Mw 7.4–7.5 magnitude.
Ref. [10] analyzed the three-dimensional P-wave velocity structure of the Marmara Region using Poisson ratio tomography. In this study, P-wave arrival times from 121,574 earthquakes recorded between 2007 and 2019 were evaluated. The results revealed prominent low-velocity anomalies in the central parts of the Sea of Marmara, especially concentrated along the NAFZ segments. The average Moho depth of the region was estimated to be approximately 28 km.
Ref. [11] investigated the three-dimensional P- and S-wave attenuation structure of the Marmara Region using earthquake data recorded between 2012 and 2020. High attenuation values were observed along the Tekirdağ segment, whereas lower attenuation values were detected in the transition zone where the 2019 Silivri earthquake occurred. The study suggested that segments with high attenuation may generate more intense seismic activity in the future and emphasized the importance of attenuation variations for monitoring earthquake behavior within the Sea of Marmara.
Finally, ref. [12] constructed a three-dimensional shear-wave (S-wave) velocity model of the Marmara Region using ambient noise tomography. Their findings revealed that the Marmara basin is characterized by pronounced low-velocity structures, particularly beneath sedimentary basins. These low S-wave velocity zones were interpreted as indicators of active tectonic deformation and crustal heterogeneity capable of influencing earthquake behavior in the region.
In this study, the crustal structure and seismotectonic characteristics of the Marmara Region have been determined. Marmara Region is one of the most seismologically active areas in the World. North Anatolian Fault Zone passes and splits three blocks in the Marmara Region. Approximately, this fault creates earthquakes of magnitudes seven and more than seven every twenty-five years. Marmara Region has three main tectonic structures shown in Figure 1. These are İstanbul Zone, Sakarya Zone and Strandja Zone [13].
One of these tectonic structures, which is named the İstanbul Zone, is an important part of our study region. The İstanbul Zone mainly consists of Paleozoic sedimentary sequences ranging from Ordovician to Carboniferous age, whereas the Sakarya Zone is characterized by metamorphic and magmatic units formed during the Triassic–Cretaceous period; in addition, the Strandja Zone is represented by Late Permian–Jurassic units, indicating a complex and multi-stage tectono-stratigraphic evolution across the region. The Istanbul continental tectonic unit spreads in an east–west direction. Its length is over 100 km and width over 500 km. It is bordered by the Istranca Zone to the west, the North Anatolian Fault Zone to the south and the Sakarya Zone to the south. Among the massifs of Istanbul and Sakarya, there is a Pontide squeeze on the North Anatolian fault line. Strandja massif is composed of sandstone, quartzite, shales and granites, which were deformed and metamorphosed during the Late Permian and Late Jurassic. Deformation and metamorphism occurred in the Late-Triassic and Late Jurassic–Early Cretaceous units in the Sakarya Zone [14].
Sea of Marmara covers an important area of the region. In the Marmara basin, alluvial deposits from the Quaternary period extend through the Cenozoic sedimentary rocks. These deposits consist of sandstone, clay and limestone, and their thickness extends up to 6 km [13].

Figure 1.
(A) Tectonic structures of Turkey. Modified and redrawn by the authors after [15], different colors represent the tectonic units, which are identified in the legend beneath the figure. The figure also illustrates the thrust boundaries between tectonic units and the major strike-slip fault systems in the area. (B) Study area borders with region faults modified and redrawn by the authors after [16]. The black dots indicate the epicentral distribution of earthquakes with magnitudes greater than 2.5 recorded in the Marmara Region between 1900 and 2023, together with the segmented structure and numbering of the branches of the North Anatolian Fault Zone (NAFZ). The northern branch of the NAFZ consists of the following segments: (1) Karamürsel–Gölcük–Darıca Segment, (2) Princes’ Islands Segment, (3) Avcılar Segment, (4) Kumburgaz Segment, (5) Tekirdağ Segment, and (6) Ganos Segment. The central branch of the NAFZ consists of: (1) İznik–Mekece Segment, (2) Gemlik Segment, (3) Zeytinbağı Segment, (4) Bandırma Segment, (5) Edincik Segment, (6) Sinekçi Segment, and (7) Biga–Çan Segment. The southern branch of the NAFZ is composed of: (1) İnegöl–Bursa Segment, (2) Ulubat Segment, (3) Manyas Segment, (4) Yenice–Gönen Segment, and (5) Evciler Segment.

The seismicity of the Marmara Region is closely related to its complex geological and tectonic framework. Lithological and rheological contrasts between the sedimentary units of the İstanbul Zone and the metamorphic–magmatic rocks of the Sakarya and Strandja zones create significant mechanical heterogeneities within the crust [13]. Tomographic results indicate that earthquakes are predominantly concentrated within transition zones between low- and high-velocity anomalies. In particular, the low-velocity zones observed beneath the thick sedimentary basins of the Sea of Marmara and along the active segments of the North Anatolian Fault Zone are associated with intense fracturing, fluid circulation, and mechanically weakened crustal structures. Therefore, structural contrasts among geological units and the presence of low-velocity anomalies play a significant role in controlling stress accumulation, earthquake distribution, and the seismic potential of the Marmara Region.
According to United States Geological Survey records, a total of 512 earthquakes with magnitudes greater than four occurred within the study area between 1900 and 2025. A large proportion of these earthquakes took place around the Sea of Marmara, the Edremit Gulf, the Saros Gulf, Şarköy–Tekirdağ, Biga–Bandırma, and the Istanbul region. Of these events, 55 earthquakes were recorded between 1900 and 1950, whereas the majority, consisting of 457 earthquakes, occurred between 1950 and 2025. Focal mechanism solutions indicate that the northern branch of the North Anatolian Fault Zone mainly consists of strike-slip faults. In the central branch, both transform faults and normal faults are observed together, while the southern branch is characterized predominantly by oblique-slip transform faults, as shown in Figure 2.
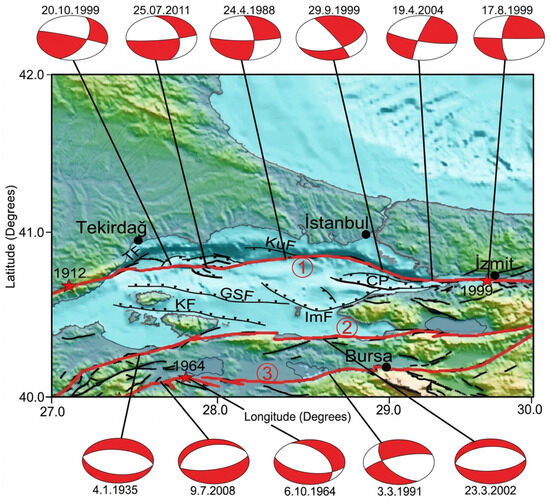
Figure 2.
Tectonic features of the Marmara Region. Modified and redrawn by the authors after [17,18,19] and focal mechanism solutions of earthquakes that occurred during the instrumental period in and around the region. The northern, central, and southern branches forming the general tectonic framework of the region are shown by numbers 1, 2, and 3, respectively, and indicated with red lines. Here, TF represents the Tekirdağ Fault, KuF the Kumburgaz Fault, KF the Kapıdağ Fault, GSF the Southern Boundary Fault, ImF the İmralı Fault, and ÇF the Çınarcık Fault. Red stars indicate earthquakes with magnitudes greater than 7 that occurred during the instrumental period, while red-and-white beach-ball symbols represent earthquakes with focal mechanism solutions. Black dots represent the locations of the cities labeled in the figure.
2. Materials and Methods
2.1. Local Earthquake Tomography
Local earthquake tomography (LET) uses seismic events occurring within the three-dimensional volume of interest [20]. In this method, both the seismic sources and receivers are located inside the model space. Therefore, earthquake locations and arrival times, namely the travel times of seismic waves reaching the receivers, must be calculated accurately. The propagation paths of the earthquake waves also need to be determined. The inversion procedure is similar to that used in iterative approaches converging toward the initial model. The travel time T of a body wave generated by an earthquake i and recorded at a seismic station j is, in its simplest form, defined by a ray-path integral as follows is represented by the following equation.
Here, , denotes the origin time of the earthquake. In local earthquake tomography studies, the only known parameters are the receiver locations and the observed arrival times. When the observed P- and S-wave arrival times are used in Equation (1), the calculated arrival times are obtained. The initial model for the seismic velocity structure, together with the hypocentral parameters defined as the source coordinates and origin time, is calculated using Equation (2). The mismatch between the observed and calculated arrival times is referred to as the residual and expressed as
is represented by the following relation. Here, u denotes the slowness (the reciprocal of velocity),
and ds represents an element of the ray path. The arrival times ,
is represented by the following relation [20].
The local earthquake tomography (LET) method was first applied by [21]. In this tomography technique, three-dimensional grid nodes are used to obtain the existing velocity structures. LET provides a wide range of approaches for calculating seismic velocity structures and represents one of the most effective methods for imaging crustal velocity variations. Considerable flexibility exists in LET applications for representing the velocity structure of the Earth’s crust. During the application of LET, the propagation path of seismic waves shown in Figure 3 between a source–receiver pair is practically determined.
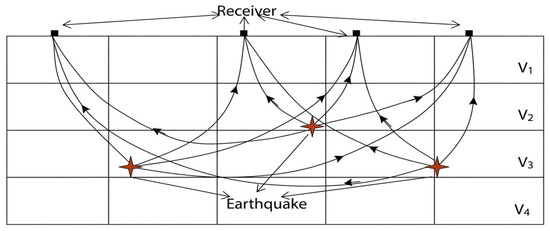
Figure 3.
Geometry of local earthquake tomography (LET) modified and redrawn by the authors after [21]. Red stars indicate earthquake epicenters, while arrows represent the propagation paths of seismic waves between the earthquake sources and seismic stations.
Receiver stations are used to record the amplitudes of the rays arriving from the source. If the ray intensity at the source is assumed to be and the ray intensity at the receiver is represented by the relation used to determine the parameter is given as follows, and is expressed by the following equation
Here, represents the infinitesimal element taken along the non-linear path of the ray over which the integral is evaluated. When both sides of the equation are divided by the value , the natural logarithm is taken, and the necessary rearrangements are performed, the following expression is obtained;
In this equation,
If we write Equation (5) and substitute it into the relation, the following expression is obtained;
Here, can be determined when the ray intensities at the source and the receiver are known; therefore, the left-hand side of the equation can be calculated. In order to compute the right-hand side of the equation, an inversion procedure must be performed [22].
Tomographic methods analyze the arrival times of body waves, namely P and S-waves. During this analysis, tomographic techniques determine the parameters of the constructed model. In tomographic methods, parameterization is applied to the model in order to define the crust and mantle structure. In parameter determination, the geometry of the structure is first established. Tomographic inversion was performed using the LSQR (Least Squares QR, a conjugate gradient-based least-squares algorithm) method, which is widely applied to solve large-scale linear systems such as those derived from P- and S-wave arrival time data in seismic tomography studies. The Vp and Vs velocity models were obtained using a 10 km grid spacing through an iterative inversion procedure. The inversion was carried out using the LSQR algorithm with a damping factor of 10, which was selected based on several trial inversions to achieve an optimal balance between minimizing data misfit and preventing excessive model roughness. The resulting average errors were approximately 0.7% for Vp and 0.9% for Vs. These error levels were reached after four iterations, as further iterations did not lead to any significant improvement in either residual reduction or the overall velocity structure.
After the model parameters are determined, three-dimensional velocity variations at each point between velocity discontinuities and at surrounding points are calculated, and various velocity discontinuity models are adopted within the model space. These models represent the approximate velocity values within the Earth’s crust [1,23].
The method involves constructing a two-dimensional grid network in order to determine the variation in velocity distribution with depth. Velocity changes within the depth distribution of this grid network are then identified. When the velocity variations at the grid nodes are known, the velocity value at any point within the grid network is estimated by proportional interpolation based on the distances to the four surrounding nodes of that point. Subsequently, the actual velocities are calculated using this proportional interpolation function [24].
2.2. Data
The study area covers the Marmara Sea located between 39.50 and 42.00° N latitudes and 26.00–30.50° E longitudes. The catalog and bulletin data recorded by seismic stations operated by the Turkish Republic Boğaziçi University Kandilli Observatory and Earthquake Research Institute Regional Earthquake-Tsunami Monitoring Center were used. This network comprises 44 broadband seismometers and 18 short-period seismic stations. The seismic network provides continuous real-time recordings of P- and S-wave arrivals, enabling precise earthquake location and source parameter estimation. The dataset used in this study consists of 123,908 P-wave and 112,352 S-wave arrival times obtained from 23,672 earthquakes that occurred between 2011 and 2023, with magnitudes ranging from 1.5 to 6.2, as shown in Figure 4. Some earthquakes were not included in the inversion due to insufficient station coverage, specifically when they were recorded by eight or fewer seismic stations. The dataset used in the inversion analyses includes earthquake date, origin time, latitude, longitude, depth, magnitude (Md), RMS, residual values, and P- and S-wave arrival times.
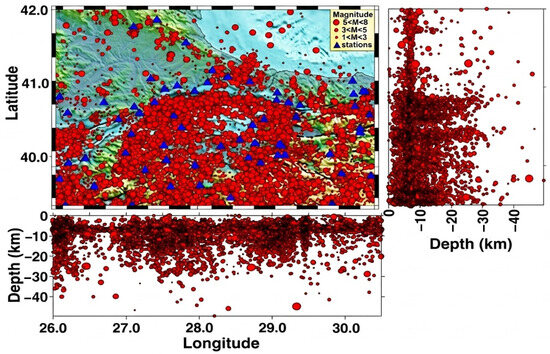
Figure 4.
The epicenter and depth distributions of the earthquakes used in the study.
3. Results
3.1. Checkerboard Resolution Tests
In seismic tomography studies, checkerboard resolution tests provide important information about where the model resolution is sufficient or weak, as well as the reliability and significance of the interpretations. These tests are widely used to evaluate the accuracy and adequacy of tomographic solutions. Resolution assessment methods are generally classified into traditional and advanced approaches. Traditional approaches include model resolution matrices, diagonal elements of the resolution matrix, weighted derivative sums, checkerboard tests, and spike sensitivity tests, whereas advanced methods involve ray density distribution, spread functions of the resolution matrix, and full-resolution matrix analyses.
Among synthetic tests used in tomography, the checkerboard resolution test (CRT) is the most common method for evaluating model resolution. In this study, CRT, originally developed by [25], was applied as both a resolution and an accuracy test. In this method, positive and negative velocity perturbations are assigned within a three-dimensional model of the study area. Synthetic travel times are then calculated, and inversion is performed using these synthetic data to generate resolution maps and identify well-resolved and poorly resolved regions. The model is also referred to as the “chessboard model” in previous studies. Alternating low- and high-velocity anomalies constitute the checkerboard pattern. After calculating the synthetic travel times, a velocity model is reconstructed through inversion using a different initial model, allowing the recovery and comparison of the checkerboard pattern to evaluate the resolution capability of the tomographic model.
For the checkerboard resolution tests performed for the Sea of Marmara and its surrounding region, the one-dimensional velocity model developed by [26] was used as the initial velocity model shown in Table 1. This model reveals the crustal P- and S-wave velocity structures of the Marmara Sea and is characterized by relatively low crustal velocities in some layers compared to average continental values. Results are shown in Figure 5. Since the reliability of tomographic inversion results is strongly dependent on the accuracy of the initial velocity model, the one-dimensional [26] velocity model, which is considered to best represent the seismic velocity structure of the Marmara Region, was adopted in this study. Nevertheless, further investigations comparing the resolution performance of different initial velocity models are still needed. In seismic tomography studies, it is essential to determine whether the obtained velocity anomalies reflect actual geological structures or are artifacts resulting from data distribution and ray-path geometry. Therefore, the resolution tests conducted in this study were designed not to evaluate the accuracy of the tomography algorithm itself, but rather to assess the ability of the dataset and the selected velocity model to resolve subsurface structures. The results indicate that the one-dimensional [26] velocity model provides superior resolution performance compared to the alternative models tested. This improved performance is likely attributable to its better representation of the regional geological and tectonic framework of the Marmara Region.

Table 1.
P-wave crustal velocity model as a function of depth for the Marmara Region proposed by [26]. In this study, the Vp/Vs ratio was taken as 1.76.
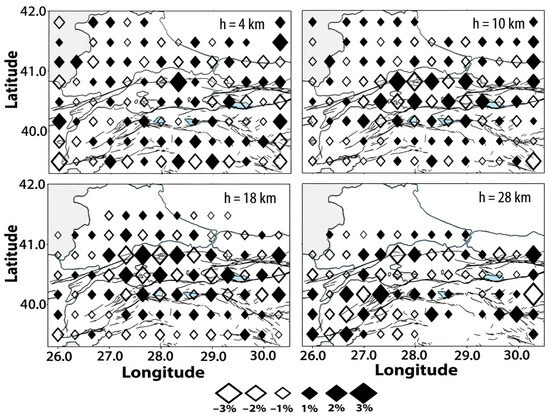
Figure 5.
Checkerboard test resolution results determined at depths of 4, 10, 18, and 28 km using the velocity values proposed by [26]. The percentage variation scale is shown below.
One of the key aspects distinguishing this study from previous investigations is the use of the one-dimensional [26] velocity model as the initial reference model in the tomographic inversion process. Unlike commonly employed regional velocity models, this model provides a more representative characterization of the seismic velocity structure of the Marmara Region. Consequently, its implementation contributes to improved model resolution and enables a more reliable imaging of subsurface structures. The resolution tests indicate that, within the 0–4 km depth interval, the resolution varies due to the influence of complex near-surface geological conditions. Between depths of 4 and 28 km, which encompass the principal crustal structure of the study area, the model exhibits excellent resolution capability. Although the number of available seismic rays decreases below 28 km depth, the inversion results continue to demonstrate satisfactory performance despite the reduced data coverage shown in Figure 5. The superior performance achieved in this study highlights the critical importance of selecting an appropriate initial velocity model in seismic tomography applications. Therefore, the adoption of the [26] velocity model represents one of the major methodological contributions of this work, enhancing both the robustness and reliability of the tomographic results obtained for the Marmara Region.
3.2. Seismic Ray Density
In the tomographic method used in this study, it is necessary to achieve a sufficient number of seismic rays in order to obtain reliable results. The presence of a well-developed seismic network within the study area provides a large amount of data. Therefore, the ray density distribution was examined to determine whether the number of P- and S-wave rays passing through each grid node was sufficient to resolve the velocity structures. In this study, the ray density was found to be adequate.
In determining the ray paths, the number of ray paths was calculated at four depth levels: 5, 10, 15, and 25 km, shown in Figure 6. The parts of the Sea of Marmara containing the North Anatolian Fault Zone exhibit high ray densities at the grid nodes. The remaining areas have relatively lower ray densities. This difference is mainly related to the clustering of earthquakes within the region.
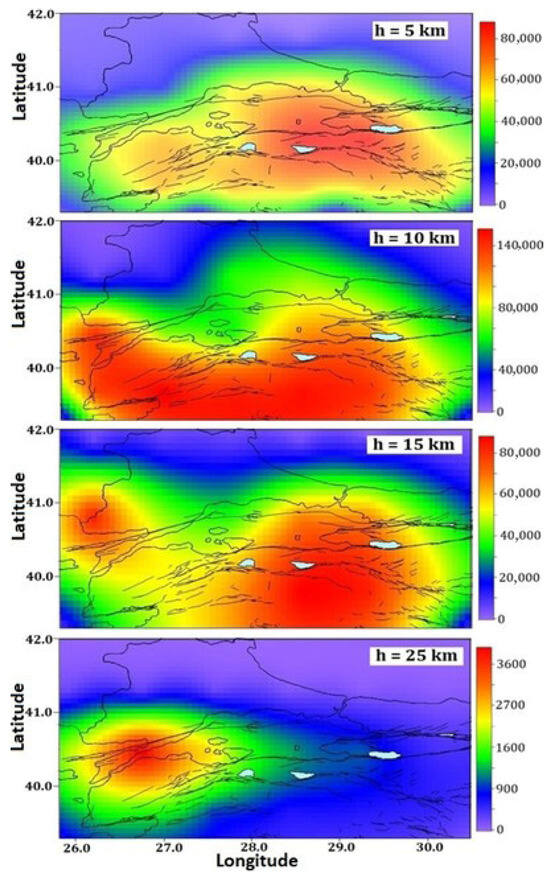
Figure 6.
Seismic ray density distribution generated by earthquakes in the Marmara Region and its variation with depth. The ray density scale is shown on the right side.
3.3. Seismic Tomography
The Poisson tomography method developed by [27] and revised in 2010 was used to determine the P- and S-wave velocity structures and Poisson ratio variations in the Marmara Region.
This method provides high-resolution results in identifying the Conrad and Moho discontinuities, determining the crustal structure of subduction zones, fault regions, and continental–oceanic crustal structures. In addition, the hypocenter location error is less than 2.0 km. In the study area, the crust and upper mantle structure were investigated down to a depth of 35 km. Due to the focal depths of the earthquakes contained in the available dataset, investigation was possible to this depth level. Based on the percentage variations in P- and S-wave velocities, it was observed that the crust extends to an approximate depth of 29 km, below which the high-velocity structures begin. Using the three-dimensional seismic tomography method, areal distributions of percentage velocity variations for P and S-waves were determined at depth levels of 0, 1, 3, 5, 7, 10, 13, 17, 21, 25, 30, and 35 km, shown in Figure 7 and Figure 8.
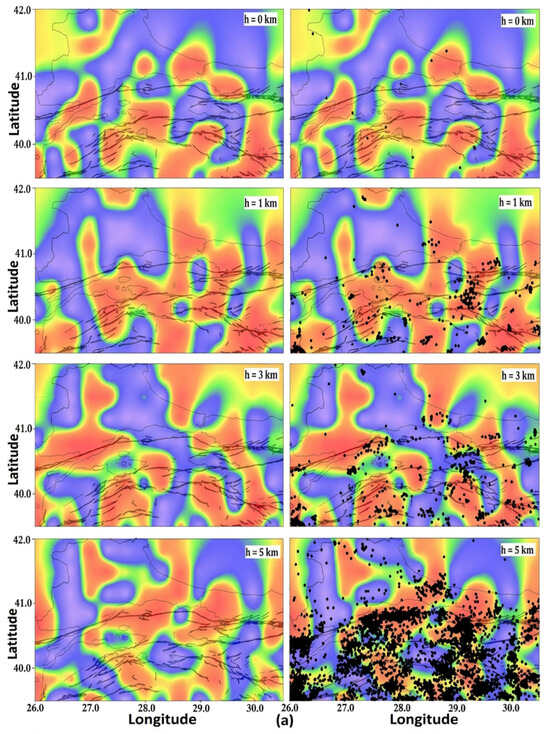
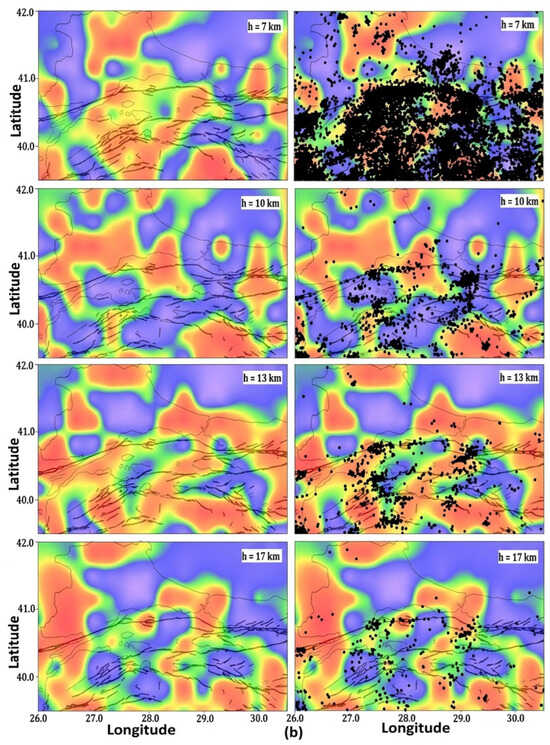
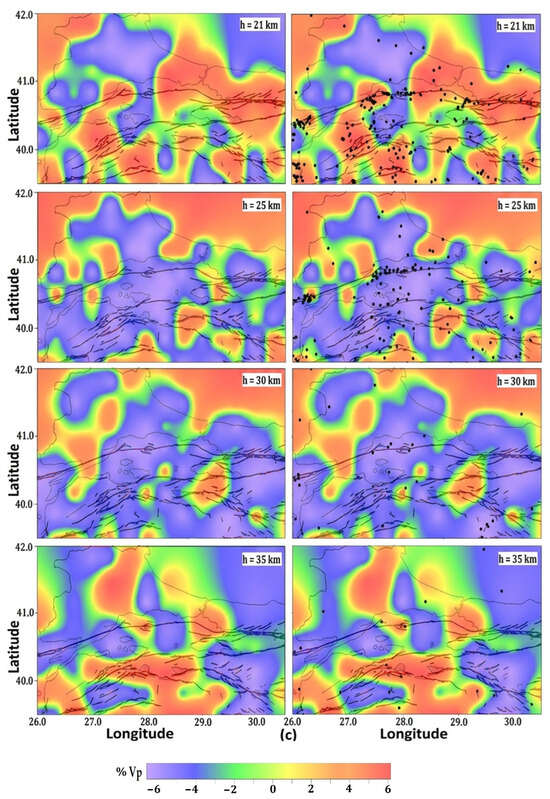
Figure 7.
(a) Depths of 0, 1, 3, 5 km, (b) 7, 10, 13, 17 km, (c) 21, 25, 30, and 35 km, percentage variations in P-wave velocities obtained in the Marmara Region according to the initial velocity model of [26]. Black dots represent earthquake epicenters projected onto the cross-sections on the right side of the figure. The percentage variations in P-wave velocities are shown in the color scale below.
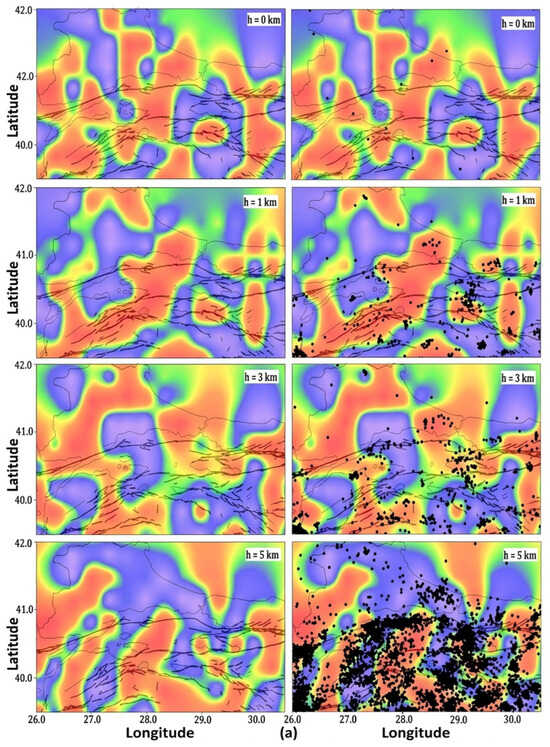
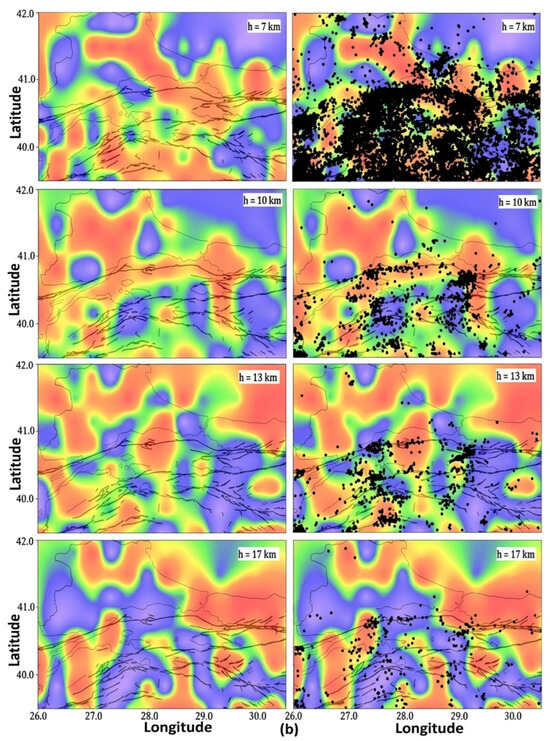
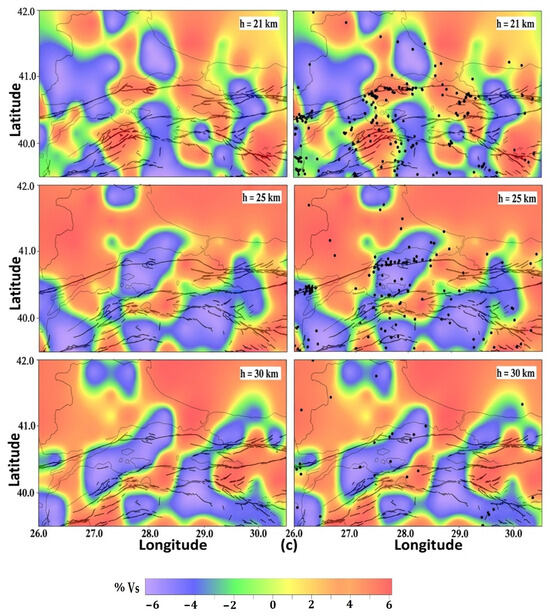
Figure 8.
(a) Depths of 0, 1, 3, 5 km, (b) 7, 10, 13, 17 km, (c) 21, 25 and 30 km, percentage variations in S-wave velocities obtained in the Marmara Region according to the initial velocity model of [26]. Black dots represent earthquake epicenters projected onto the cross-sections on the right side of the figure. The percentage variations in P-wave velocities are shown in the color scale below.
Velocity values and Poisson ratio variations exhibit significant heterogeneity near the surface. However, with increasing depth, lateral variations decrease and seismic velocities increase. It was observed that the velocity variations are generally consistent with the tectonic framework of the study area. In addition, earthquakes are mainly concentrated between depths of 5 and 10 km.
A low-velocity zone beginning at depths of approximately 17 km was identified along the northern and central branches of the North Anatolian Fault Zone, extending from the Tekirdağ Segment through the Kumburgaz Segment to the boundary of the Avcılar Segment. Seismic activity is particularly concentrated along the Sea of Marmara, where the North Anatolian Fault Zone and its branches extend. P-wave velocity variations are presented in Figure 7, while S-wave velocity variations are shown in Figure 8.
According to the tomography results, the P-wave cross-sections show that P-wave velocities increase after a depth of approximately 25 km. In addition, beginning at a depth of approximately 6 km, noticeable increases in seismic velocities were observed at depths of 7, 10, 13, and 17 km, suggesting the presence of compressional zones in these regions.
Earthquake epicenter and hypocenter distributions were correlated with the percentage variations and actual values of P- and S-wave velocities. It is noteworthy that earthquakes are predominantly concentrated in areas characterized by relatively positive velocity anomalies. This indicates that earthquake occurrence is associated with regions where seismic velocities increase. Accordingly, the transition zones from low-velocity anomaly regions to high-velocity anomaly regions may represent areas with higher earthquake potential.
3.4. Earthquake Focal Depths
The relationship between earthquake focal depths and P-wave and S-wave velocities is shown in Figure 9. Earthquakes occurring near the surface are distributed over wide areas characterized by low seismic velocities. However, with increasing depth, earthquakes tend to occur in regions with relatively higher velocities. It was determined that, below a depth of 28 km, earthquakes occur in areas where P-wave velocities range between 7.0 and 8.3 km/s. For S-wave velocities, this range varies between 3.9 and 4.5 km/s. P-wave velocities increase down to approximately 20 km depth, then decrease below this level, and rise again after 25 km depth, as observed in the graph. These results indicate the presence of a low-velocity zone between depths of approximately 15 and 25 km.
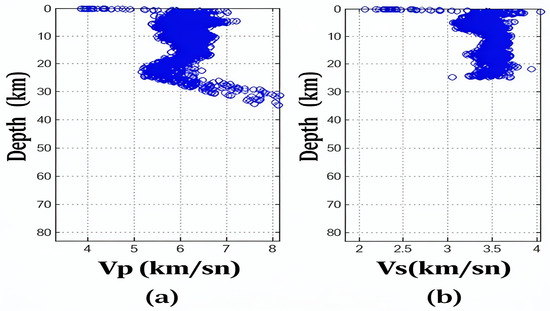
Figure 9.
(a) P-wave velocity and depth variations, (b) S-wave velocity and depth variations.
3.5. Longitude and Latitude Cross-Sections of the Sea of Marmara
In order to investigate the crustal and velocity structures of the region in greater detail and to identify areas with high earthquake generation potential, vertical cross-sections were obtained from the percentage variations in P- and S-wave velocities by cutting the region both longitudinally and latitudinally, as shown in Figure 10, Figure 11, Figure 12 and Figure 13.
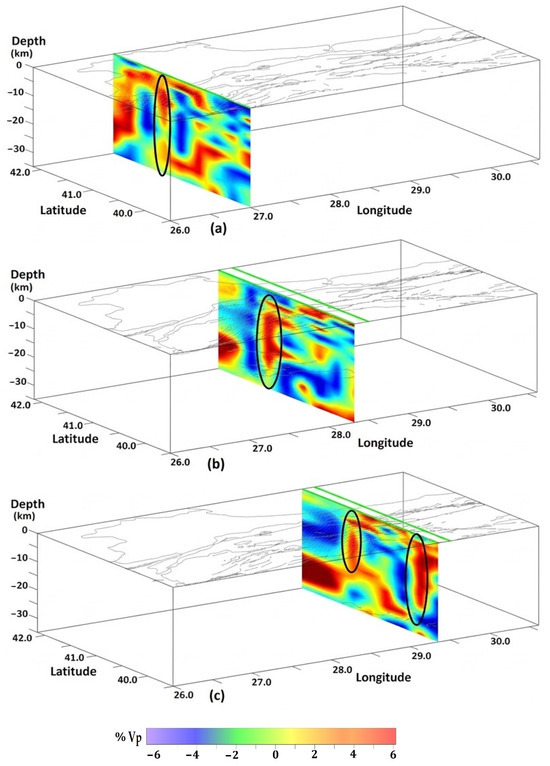
Figure 10.
North–south (longitude-oriented) cross-sections of percentage P-wave velocity (%Vp) variations for profiles (a–c). Green lines denote the locations of the tomographic cross-sections. For clarity and to avoid overcrowding of the figure, only the cross-sections exhibiting the highest resolution and the most reliable imaging of velocity variations are shown. Black circles indicate the transition zones from low-velocity percentages to high-velocity percentage anomalies. The variation scale is given at the bottom.
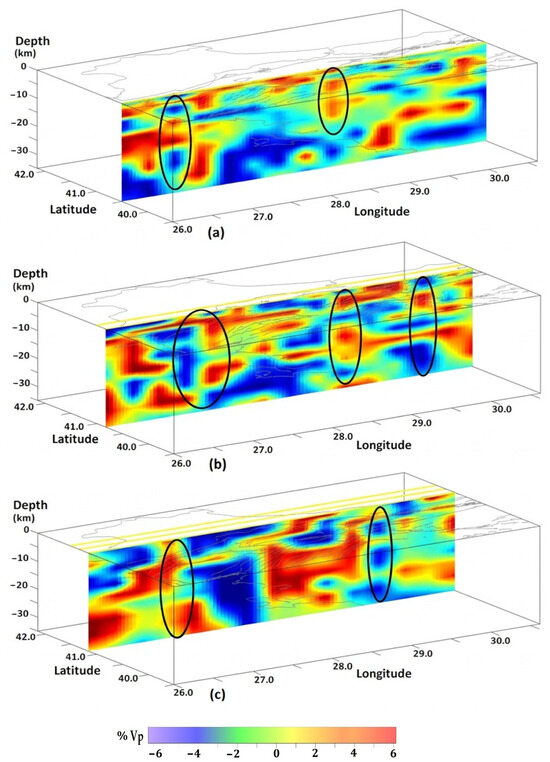
Figure 11.
East–west (latitude-oriented) cross-sections of percentage P-wave velocity (%Vp) variations for profiles (a–c). Yellow lines denote the locations of the tomographic cross-sections. For clarity and to avoid overcrowding of the figure, only the cross-sections exhibiting the highest resolution and the most reliable imaging of velocity variations are shown. Black circles indicate the transition zones from low-velocity percentages to high-velocity percentage anomalies. The variation scale is given at the bottom.
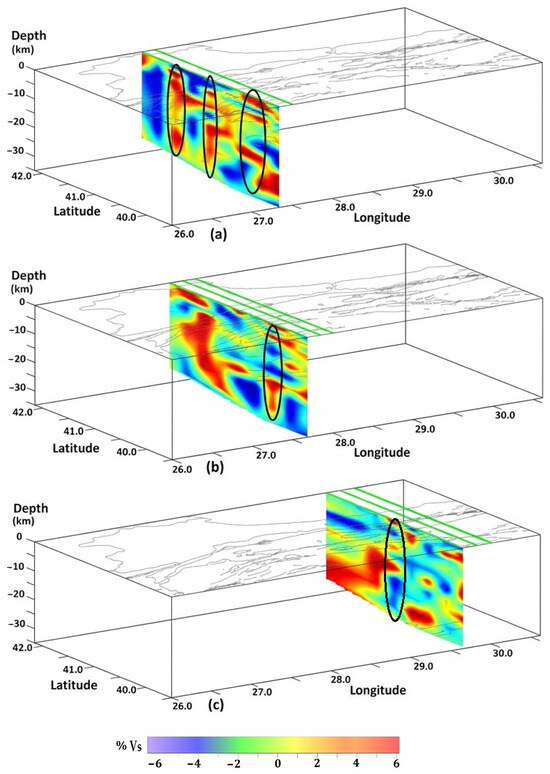
Figure 12.
North–south (longitude-oriented) cross-sections of percentage S-wave velocity (%Vs) variations for profiles (a–c). Green lines denote the locations of the tomographic cross-sections. For clarity and to avoid overcrowding of the figure, only the cross-sections exhibiting the highest resolution and the most reliable imaging of velocity variations are shown. Black circles indicate the transition zones from low-velocity percentages to high-velocity percentage anomalies. The variation scale is given at the bottom.
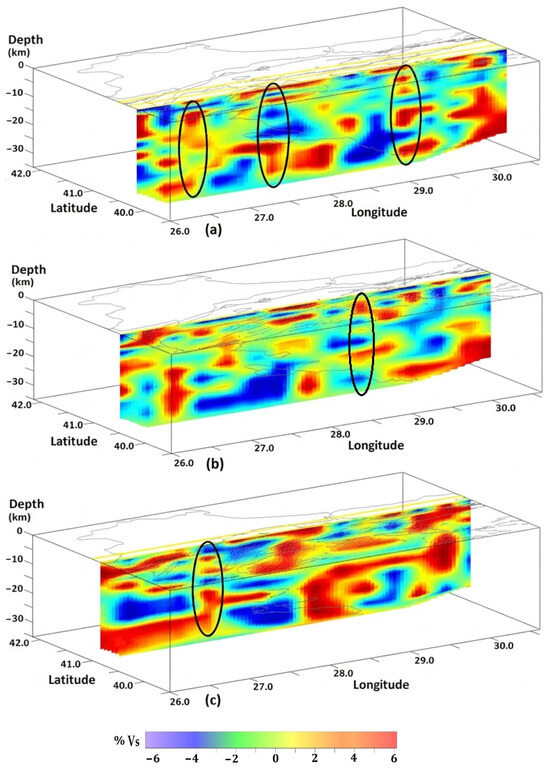
Figure 13.
East–west (latitude-oriented) cross-sections of percentage S-wave velocity (%Vs) variations for profiles (a–c). Yellow lines denote the locations of the tomographic cross-sections. For clarity and to avoid overcrowding of the figure, only the cross-sections exhibiting the highest resolution and the most reliable imaging of velocity variations are shown. Black circles indicate the transition zones from low-velocity percentages to high-velocity percentage anomalies. The variation scale is given at the bottom.
4. Conclusions
In this study, the crustal and upper mantle structure of the Sea of Marmara was investigated using the three-dimensional seismic tomography method, and areas with earthquake generation potential were identified by calculating the seismic velocity structures and velocity ratio variations in the region, while the relationship between seismic velocities in regions with intense tectonic activity was examined.
In the study, the Poisson ratio tomography method based on the inversion of P- and S-wave arrival times was used. According to the obtained results, P-wave velocities vary between 4 and 8 km/s, while S-wave velocities vary between 2 and 4 km/s. The obtained results are in complete agreement with the initial velocity model of [26]. It was observed that velocity values decrease in areas with high tectonic activity, whereas the percentage variations in P- and S-wave velocities increase.
In near-surface regions, velocity values show significant variations over short distances due to the heterogeneous structure. It was determined that P- and S-wave velocities increase with depth and reach maximum levels, especially within the depth range of 8–16 km. Earthquakes were found to cluster particularly in regions characterized by high percentage velocity variations and in transition zones from low- to high-velocity intervals, and the integration of earthquake hypocenter distributions with Vp and Vs anomalies further indicated that these transition zones may correspond to areas of enhanced stress concentration. In addition, it was revealed that the northern branch of the North Anatolian Fault Zone is the most active segment and that low-velocity zones exist between depths of 15–25 km. The observed low-velocity anomalies are primarily interpreted as being associated with a highly fractured crustal structure and the presence of high-pressure fluids, while seismic gaps are also considered to correspond to these low-velocity domains, suggesting a close relationship between seismic quiescence and mechanically weakened zones within the crust; these findings are also consistent with the results reported by [2,11,27]. Extensive fracturing within the crust facilitates fluid migration, accumulation, and storage, whereas elevated pore-fluid pressures result in a significant reduction in both P- and S-wave velocities due to decreased effective normal stress and reduced rock rigidity. The low-velocity anomalies identified beneath the Tekirdağ and Kumburgaz segments are generally consistent with the observations reported [2,8,12], suggesting that these segments are characterized by structurally weakened crustal conditions. Seismic velocities were observed to increase significantly from depths of approximately 27 km. This increase is most likely interpreted as being related to the transition from zones characterized by partial melt or fluid presence within the crust, after which higher seismic velocities are observed. These results were found to be consistent with previous geophysical studies conducted in the region.
5. Discussions
The advantages of the method include a more comprehensive characterization of crustal heterogeneity through the simultaneous inversion of P- and S-wave arrival times, high-resolution imaging of the upper crust beneath the Marmara Region enabled by the use of local earthquakes, and the efficient handling of large and sparse matrices associated with seismic tomography datasets by the LSQR inversion technique. In contrast, the disadvantages of the method include the dependence of the resulting models on ray coverage and the spatial distribution of earthquakes, a decrease in resolution below approximately 30 km depth due to the limited number of crossing rays, and the sensitivity of the model results to the choice of the initial velocity model and damping parameters.
The originality of this study, unlike [10], is that this study integrates both P- and S-wave tomography, enabling a more comprehensive characterization of crustal properties and fluid-related anomalies. This joint approach not only provides a detailed image of velocity variations but also enables a more reliable characterization of key crustal properties, including elastic behavior, fluid distribution, fault zone characteristics, and other structural features that are critical for seismic hazard assessment. P-waves (Vp) are mainly sensitive to variations in compressibility and density, whereas S-waves (Vs) are more responsive to shear strength and the mechanical properties of rocks. Therefore, using only Vp or only Vs tomography may lead to an incomplete representation of the subsurface structure. In contrast, the combined interpretation of both datasets allows for a more realistic and robust imaging of the Earth’s interior. Since S-waves cannot propagate through fluid-saturated media, low-Vs anomalies may indicate the presence of fluids, increased porosity, or mechanically weak zones within the crust. Furthermore, the consistent occurrence of similar anomalies in both Vp and Vs models supports the reliability of the results, indicating that these features are not random artifacts but geologically meaningful structures. Unlike previous tomographic studies conducted in the Marmara Region, the present study employed the one-dimensional velocity model proposed by [26] as the initial reference model, which resulted in improved recovery of synthetic anomalies and enhanced model reliability. The obtained results provide important information for identifying potential source areas of future earthquakes in the Marmara Region.
This study provides one of the most comprehensive Vp–Vs tomographic datasets currently available for the Marmara Region, integrates earthquake distributions with tomographic anomalies to improve the understanding of earthquake generation mechanisms along the North Anatolian Fault Zone, and offers velocity models that may serve as reference frameworks for future seismic hazard assessments and earthquake simulation studies, while also enhancing our understanding of the relationship between crustal heterogeneity and seismic activity in one of the most earthquake-prone regions of Türkiye.
The study results contribute to the identification of potential source areas for future earthquakes in the Marmara Region. It is further emphasized that, in addition to three-dimensional crustal and upper mantle structures, the distributions of P-wave velocity, S-wave velocity, and Poisson’s ratio should be regularly monitored to allow a more accurate assessment of seismic hazard in the region. Moreover, to better understand the active tectonics and earthquake generation mechanisms, it is concluded that three-dimensional crustal and upper mantle velocity structures should be systematically updated and that long-term monitoring studies should be continuously maintained.
Author Contributions
İ.H.D. analyzed the problem, conceived the methodology and wrote the first draft of the paper. Ş.Ş. conceived the experiment to verify the data. İ.H.D. contributed to data collection and the literature review. Ş.Ş. analyzed data and processes. İ.H.D. and Ş.Ş. both contributed to the analysis of the research, the conception of the experiment, and the revisions of the paper. All authors have read and agreed to the published version of the manuscript.
Funding
This research received no external funding.
Data Availability Statement
The original contributions presented in this study are included in the article. Further inquiries can be directed to the corresponding author.
Conflicts of Interest
The authors declare no conflicts of interest.
Abbreviations
The following abbreviations are used in this manuscript:
| P-wave | Primary Body Wave |
| S-wave | Secondary Body Wave |
| 1-D | One-Dimensional |
| 3-D | Three-Dimensional |
| NAFZ | North Anatolian Fault Zone |
| GONAF | Geophysical Observatory at the North Anatolian Fault |
| OBS | Ocean-Bottom Seismometers |
| Vp | Velocity of Primary Body Wave |
| Vs | Velocity of Secondary Body Wave |
| Mw | Moment Magnitude |
| Md | Duration Magnitude |
| Moho | Mohorovičić Discontinuity |
| Conrad | Conrad Discontinuity |
| USGS | United States Geological Survey |
| LET | Local Earthquake Tomography |
| LSQR | Least Squares QR |
| RMS | Root Mean Square |
| CRT | Checkerboard Resolution Test |
References
- Zhao, D.; Horiuchi, S.; Hasegawa, A. 3-D seismic velocity structure of the crust and uppermost mantle in the northeastern Japan arc. Tectonophysics 1990, 181, 135–149. [Google Scholar] [CrossRef]
- Barış, Ş.; Nakajima, J.; Hasegawa, A.; Honkura, Y.; Ito, A.; Üçer, S.B. Three-dimensional structure of Vp, Vs, and Vp/Vs in the upper crust of the Marmara Region, NW Turkey. Earth Plan. Space 2005, 57, 1019–1038. [Google Scholar]
- Akyol, N.; Zhu LMitchell, B.J.; Sözbilir, H.; Kekovalı, K. Crustal structure and local seismicity in western Anatolia. Geophys. J. Int. 2006, 166, 1259–1269. [Google Scholar] [CrossRef]
- Lei, J.; Zhao, D. Teleseismic P-wave tomography and the upper mantle structure of the central Tien Shan orogenic belt. Phys. Earth Planet. Inter. 2007, 162, 165–185. [Google Scholar] [CrossRef]
- Salah, M.K.; Şahin, Ş.; Soyuer, D. Crustal Velocity and Poisson’s Ratio Structures beneath Northwest Anatolia Imaged by Seismic Tomography. Eur. Int. J. Sci. Technol. 2014, 3, 133–157. [Google Scholar] [CrossRef]
- Bohnhoff, M.; Dresen, G.H.; Çeken, U.; Kadarıoğlu, F.T.; Kartal, R.F.; Kılıç, T.; Nurlu, M.; Yanik, K.; Acarel, D.; Bulut, F.; et al. Ganos Fault Zone Network: Imaging North Anatolian Fault Zone in the Western Marmara Region, Turkey, Based on a Dense Local Seismic Network. Sci. Dril. 2017, 22, 19–28. [Google Scholar] [CrossRef]
- Gholamrezaie, E.; Scheck-Wenderoth, M.; Bott, J.; Heidbach, O.; Strecker, M.R. 3-D crustal density model of the Sea of Marmara. Solid Earth 2019, 10, 815–831. [Google Scholar] [CrossRef]
- Taranlıoğlu, A.; Karabulut, H.; Özalaybey, S.; Aktar, M. Three-dimensional seismic tomography of the Main Marmara Fault using OBS and land seismic data. Geophys. J. Int. 2020, 223, 1234–1252. [Google Scholar]
- Meghraoui, M.; Yıldırım, C.; Zabcı, C.; Akyüz, S.; Ergintav, S. The 20th anniversary of the Eastern Marmara Earthquakes: Active tectonics of continental strike-slip faults. Mediterr. Geosci. Rev. 2021, 3, 1. [Google Scholar] [CrossRef]
- Demirsıkan, İ.H.; Şahin, Ş.; Öksüm, E. Marmara Bölgesi’nin üç boyutlu P dalga hız yapısının Poisson oranı tomografisi yöntemi ile incelenmesi. Mühendislik Bilim. Tasar. Derg. 2022, 10, 915–928. [Google Scholar]
- Şahin, Ş. Marmara’da P ve S dalga soğurulma yapısının üç boyutlu olarak belirlenmesi. Pamukkale Univ. J. Eng. Sci. 2022, 28, 451–463. [Google Scholar]
- Karabulut, H. The Marmara Sea basin as a regional depression constrained from ambient noise correlation tomography. Geophys. J. Int. 2024, 237, 1208–1221. [Google Scholar] [CrossRef]
- Ketin, İ. Tectonics units of Anatolia. Bull. Miner. Res. Explor. Inst. Turk. 1966, 66, 23–34. [Google Scholar]
- Okay, A.İ.; Demirbağ, E.; Kurt, H.; Okay, N.; Kuşçu, İ. An active, deep marine strike-slip basin along the North Anatolian Fault in Turkey. Tectonics 1999, 18, 129–148. [Google Scholar] [CrossRef]
- Okay, A.I.; Tüysüz, O. Tethyan sutures of northern Turkey. Geol. Soc. Lond. Spec. Publ. 1999, 156, 475–515. [Google Scholar] [CrossRef]
- Maden Tetkik ve Arama (MTA). Yenilemiş Diri Fay Haritaları. Available online: https://yerbilimleri.mta.gov.tr/anasayfa.aspx (accessed on 17 June 2026).
- Armijo, R.; Meyer, B.; Navarro, S.; King, G.; Barka, A. Asymmetric slip partitioning in the Sea of Marmara pull-apart: A clue to propagation processes of the North Anatolian fault. Terra Nova 2002, 14, 80–86. [Google Scholar] [CrossRef]
- Armijo, R.; Pondard, N.; Meyer, B.; Uçarkus, G.; de Lépinay, B.M.; Malavieille, J.; Dominguez, S.; Gustcher, M.A.; Schmidt, S.; Beck, C.; et al. Submarine fault scarps in the Sea of Marmara pull-apart (North Anatolian Fault). Geochem. Geophys. Geosyst. 2005, 6, Q06009. [Google Scholar] [CrossRef]
- Carton, H.; Singh, S.C.; Hirn, A.; Bazin, S.; De Voogd, B.; Vigner, A.; Ricolleau, A.; Cetin, S.; Oçakoglu, N.; Karakoç, F.; et al. Seismic imaging of the three-dimensional architecture of the Çınarcık basin along the North Anatolian fault. J. Geophys. Res. 2007, 112, B06101. [Google Scholar] [CrossRef]
- Thurber, C.H. SIMUL3. In Documentation of Earthquake Algorithms; Engdahl, E.R., Ed.; Report SE-35; Worth Data Center A for solid Earth Geophysics: Boulder, CO, USA, 1984; pp. 15–17. [Google Scholar]
- Thurber, C. Local earthquake tomography: Velocities and Vp/Vs-theory. In Seismic Tomography, Theory and Practice; Iyer, H., Hirahara, K., Eds.; CRC Press: Boca Raton, FL, USA, 1993; pp. 563–583. [Google Scholar]
- Lee, W.H.K.; Pereyra, V. Mathematical Introduction to Seismic Tomography. In Seismic Tomography: Theory and Practice; Iyer, H.M., Hirahara, K., Eds.; Chapman & Hall: London, UK, 1993; pp. 9–22. [Google Scholar]
- Horiuchi, S.; Ishii, H.; Takagi, A. Two-dimensional depth structure of the crust beneath the Tohoku District, the northeastern Japan arc, I, Method and Conrad discontinuity. J. Phys. Earth 1982, 30, 47–69. [Google Scholar] [CrossRef]
- Thurber, C.H.; Aki, K. Three-dimensional seismic imaging. Annu. Rev. Earth Planet. Sci. 1987, 15, 115–139. [Google Scholar] [CrossRef]
- Humphreys, E.; Clayton, R.W. Adaptation of back projection tomography to seismic travel time problems. J. Geophys. Res. 1988, 93, 1073–1085. [Google Scholar] [CrossRef]
- Denli, A. 3-D Velocity Structure of Eastern Marmara Region from Local Earthquake Tomography. Master’s Thesis, B.S. Geophysical Engineering, İstanbul University, İstanbul, Turkey, 2004. [Google Scholar]
- Zhao, D.; Hasegawa, A.; Horiuchi, S. Tomographic imaging of P- and S-wave velocity structure beneath northeastern Japan. J. Geophys. Res. 1992, 97, 19909–19928. [Google Scholar]


Disclaimer/Publisher’s Note: The statements, opinions and data contained in all publications are solely those of the individual author(s) and contributor(s) and not of MDPI and/or the editor(s). MDPI and/or the editor(s) disclaim responsibility for any injury to people or property resulting from any ideas, methods, instructions or products referred to in the content. |
© 2026 by the authors. Licensee MDPI, Basel, Switzerland. This article is an open access article distributed under the terms and conditions of the Creative Commons Attribution (CC BY) license.