


Abstract
In modern naval operations, the strategic value of naval mines has been increasingly emphasized, highlighting the need for intelligent and efficient deployment strategies. This study proposes integrated framework that combines mine burial rate estimation with reinforcement learning-based optimization to generate mine-laying routes that maximize burial effectiveness. An initial burial rate estimation simulator was developed using environmental factors such as sediment bulk density and shear strength estimated from sediment type and mean grain size to predict the burial rates of bottom-contact mines. The simulator was integrated into reinforcement learning frameworks—Deep Q-Network (DQN), and proximal policy optimization (PPO). The reinforcement learning methods were trained to autonomously explore the environment and generate routes that strategically utilize high burial regions while satisfying navigational constraints. Experimental results demonstrate that the reinforcement learning methods consistently generated routes with higher average burial rates while requiring significantly shorter computation time compared with the A* algorithm. These findings suggest that reinforcement learning, when coupled with environmental modeling, provides a practical and scalable strategy for improving the effectiveness, concealment, and autonomy of naval mine-laying operations.
1. Introduction
Naval mines possess significant tactical and operational influence. They can destroy or sink vessels, as well as delay or disrupt the operations of entire fleets. Despite their relatively low cost, mines remain a quintessential asymmetric weapon with high strategic impact, having played decisive roles in maritime blockades and force attrition during numerous past conflicts. In the 2022 Russia–Ukraine war, both sides strategically employed mines to damage enemy fleets and restrict access to critical sea areas, demonstrating that mines retain strong tactical value in modern warfare [1,2,3]. Major powers such as China, Russia, Iran, and North Korea maintain large mine stockpiles and actively integrate them into anti-access/area denial (A2/AD) strategies.
With the renewed emphasis on the tactical role of mines in modern warfare, research on countermeasures has also advanced. In recent years, mine countermeasure (MCM) missions have increasingly relied on unmanned underwater vehicles (UUVs). Navies are deploying autonomous systems to complement or replace conventional mine detection operations, thereby reducing the risks to human personnel. Pan et al. proposed a multi-objective mission planning algorithm that enables multiple UUVs to cooperatively detect naval mines, achieving improved detection efficiency and operational stability in large-scale deployments by balancing search time and energy consumption [4]. Similarly, Cimino et al. suggested an automated MCM framework using low-cost autonomous underwater swarms, demonstrating its potential through field experiments [5]. Research has also progressed in sonar-, optical-, and magnetic sensor-based mine detection technologies. Hożyń conducted a review of sonar-based mine detection and classification techniques, highlighting the ability of side-scan and synthetic aperture sonar to generate precise imagery of mine-like objects and showing that combining highlight/shadow enhancement with automatic target recognition greatly accelerates detection [6]. Seidel et al. equipped UUVs with magnetic sensors, confirming their potential for effective mine detection operations [7]. Fu et al. proposed a polarization laser-based underwater optical detection system that enhances mine detection performance even in turbid waters [8]. In addition, deep learning has been applied to sensor-based mine detection and classification. Munteanu et al. developed a framework using YOLOv5, EfficientDet, and single shot detector (SSD) for mine detection in sonar imagery, demonstrating high accuracy with both real and augmented datasets [9]. Sun et al. introduced a dual-path vision transformer (ViT) model, which also achieved promising results for naval mine detection [10].
Parallel to MCM research, efforts have been made to make mines harder to detect. A recent example is the MALAMAN smart mine developed by Koç Savunma, designed with low-signature technology to minimize reflection signals and evade detection [11]. Moreover, seabed morphology itself can be leveraged to hinder detection; O’Boyle emphasized that buried or partially buried mines are difficult to detect even with advanced sonar systems [12].
For effective mine deployment, the estimation of mine burial rates is critical, as it allows planners to identify regions where mines are more likely to be effectively buried. Research has explored methods of predicting burial based on seabed morphology and sediment properties. Chu et al. developed the IMPACT35 model, which estimates initial burial rates of bottom-contact mines using hydrodynamic modeling and recursive simulation of underwater descent trajectories [13,14,15].
In parallel, intelligent ship route planning algorithms have been actively studied to optimize navigation under various operational objectives, including minimizing fuel consumption. Chen et al. proposed a hybrid algorithm combining fast marching square (FMS) with velocity obstacles (VO) for collision risk prediction, generating safe and efficient paths while accounting for ship speed constraints and obstacle proximity [16]. Zhao and Zhao developed a multi-objective evolutionary algorithm based on the non-dominated sorting genetic algorithm (NSGA), achieving fuel savings of approximately 7% compared with conventional routes by balancing fuel consumption and voyage time [17]. Lee and Kim applied a Deep Q-Network (DQN) to generate routes in coastal waters that avoid non-navigable areas and comply with traffic separation schemes (TSS) [18]. Shen et al. combined DQN with differential evolution (DE) optimization and integrated Convention on the International Regulation for Preventing Collisions at Sea (COLREG) based navigation rules into reinforcement learning, enabling globally optimized routes that ensure collision avoidance [19].
These prior studies require either repeated execution of the planning algorithm or retraining when applied to new scenarios or environments. Moreover, their optimization objectives are primarily limited to merchant ship navigation, such as ensuring navigational safety, reducing fuel consumption, or shortening voyage distance. However, route optimization methods explicitly designed for efficient naval mine-laying—particularly those that consider mine burial effectiveness as a primary objective—have not been sufficiently investigated.
As the strategic importance of naval mines continues to grow and MCM technologies and tactics advance, optimizing mine-laying routes to enhance mine concealment has become essential for effective mine deployment.
Thus, this study aims to estimate the initial burial rate of mines within the target region and integrate this information into a reinforcement learning framework with a multi-channel spatial state representation, enabling the development of an optimized mine-laying route planning method that can be robustly applied across multiple operational scenarios. By maximizing mine concealment, the proposed approach seeks to improve the operational effectiveness of naval mines. Improved concealment reduces the likelihood of detection by modern MCM systems, thereby increasing the persistence and tactical relevance of deployed minefields. Furthermore, highly concealed mines are likely to slow enemy clearance operations and impose greater operational burdens on adversaries, ultimately reinforcing the strategic deterrence and area denial capabilities of naval forces.
The remainder of this paper is organized as follows. Section 2 describes the overall research methodology, including the environmental modeling and the reinforcement learning framework. Section 3 presents the experimental results used to validate the proposed mine-laying route planning method. Section 4 discusses the main contributions of this study as well as its limitations. Finally, Section 5 summarizes the findings and outlines directions for future work.
2. Materials and Methods
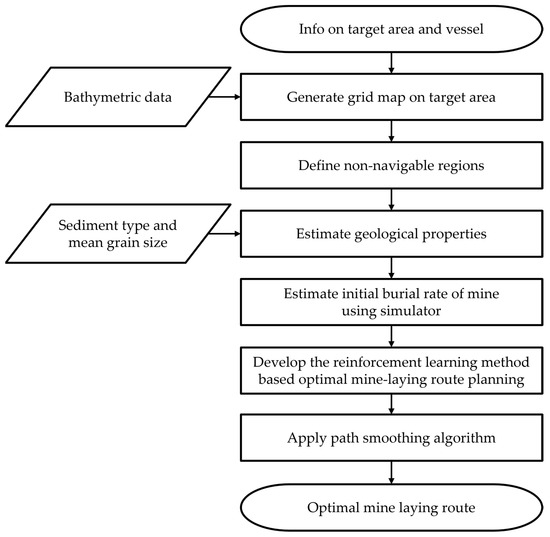
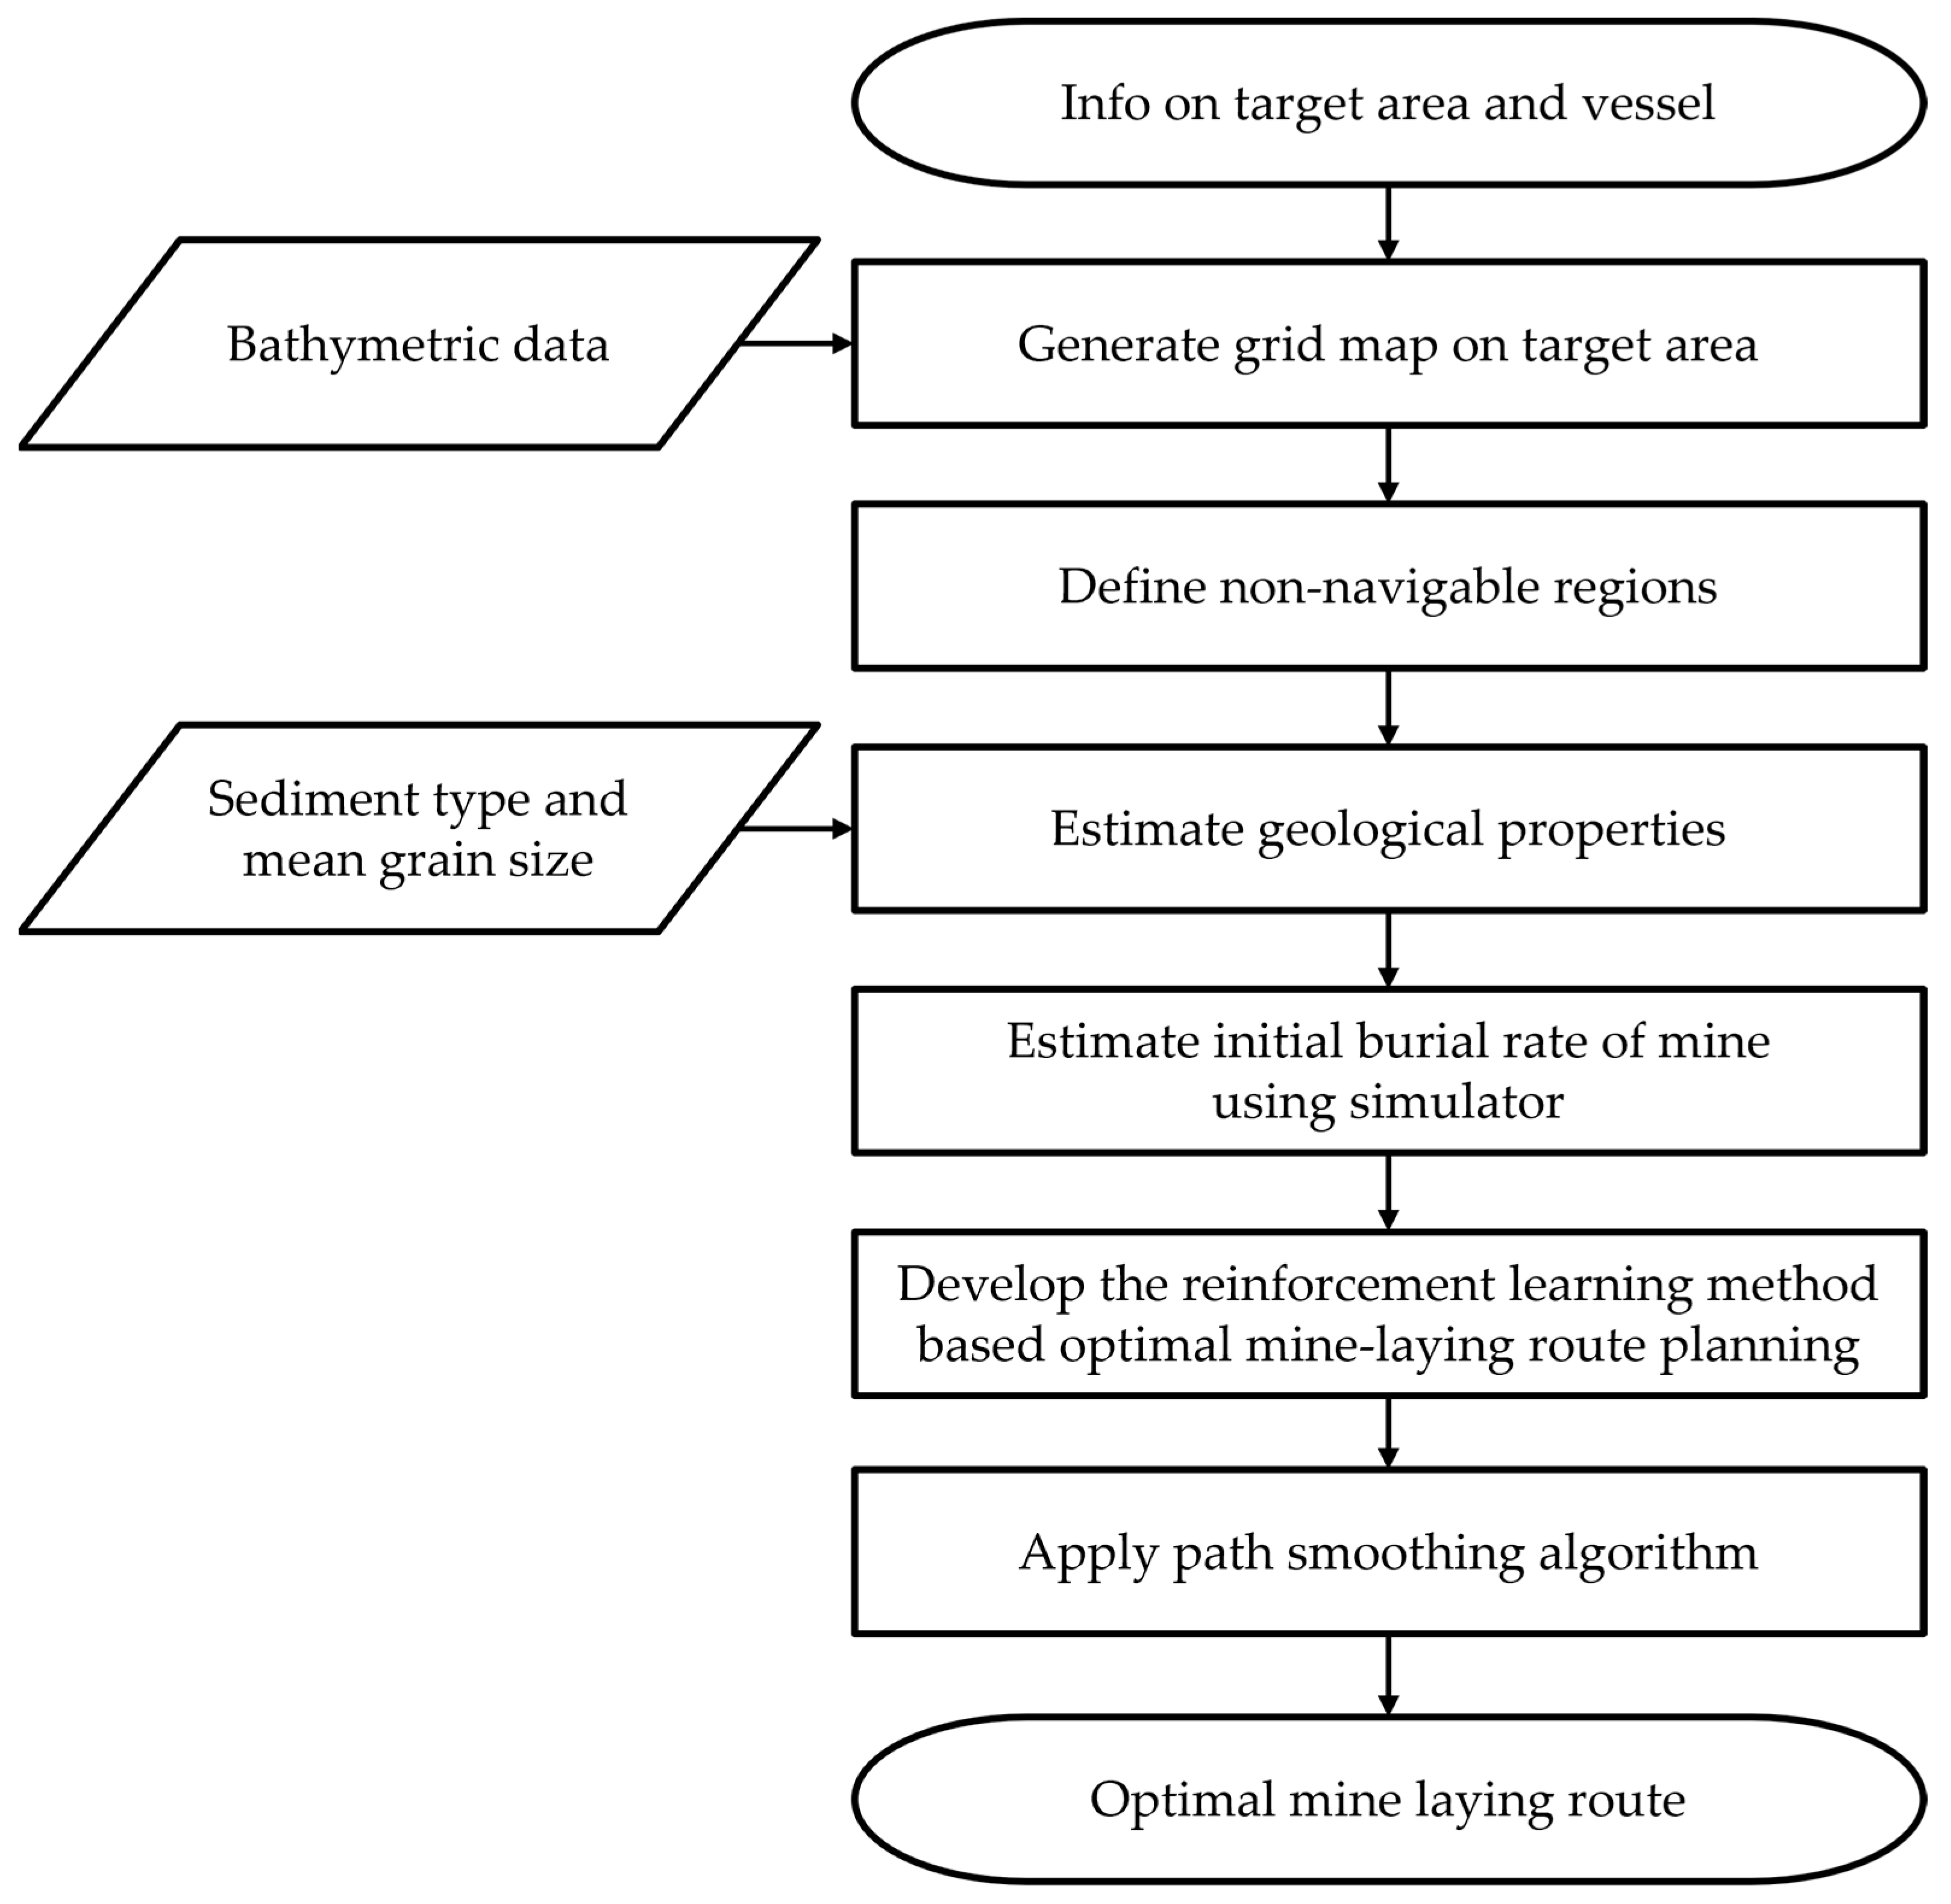
The overall workflow of this study is illustrated in Figure 1. First, the target study area and target vessel were selected, and a grid-based map of the region was constructed. Bathymetric data obtained from the General Bathymetric Chart of the Oceans (GEBCO, British Oceanographic Data Centre, Liverpool, UK) were utilized to represent the seafloor topography of the target area. In addition, seabed geological types and mean grain size distribution data were acquired from the Geo Big Data Open Platform (Korea Institute of Geoscience and Mineral Resources, Daejeon, Republic of Korea), enabling the realistic reconstruction of the seabed sediment characteristics. Based on these datasets, representative values of sediment bulk density and shear strength were assigned to each geological region. Subsequently, the water depth, sediment bulk density, and shear strength were used as input parameters for the developed initial burial rate estimation simulator, which computes the predicted burial rates of bottom-contact mines. Finally, the generated burial rate map was integrated into a reinforcement learning environment, where reinforcement learning algorithms and smoothing algorithms were applied to generate optimized mine-laying routes.
Figure 1.
The overall flowchart in this study.
2.1. Environment Modeling
2.1.1. Target Area Gridding and Bathymetric Data Processing
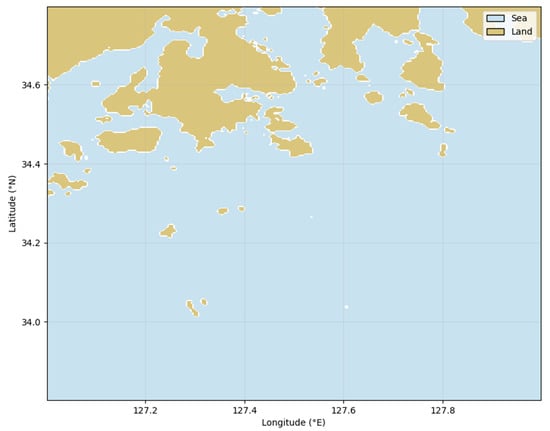
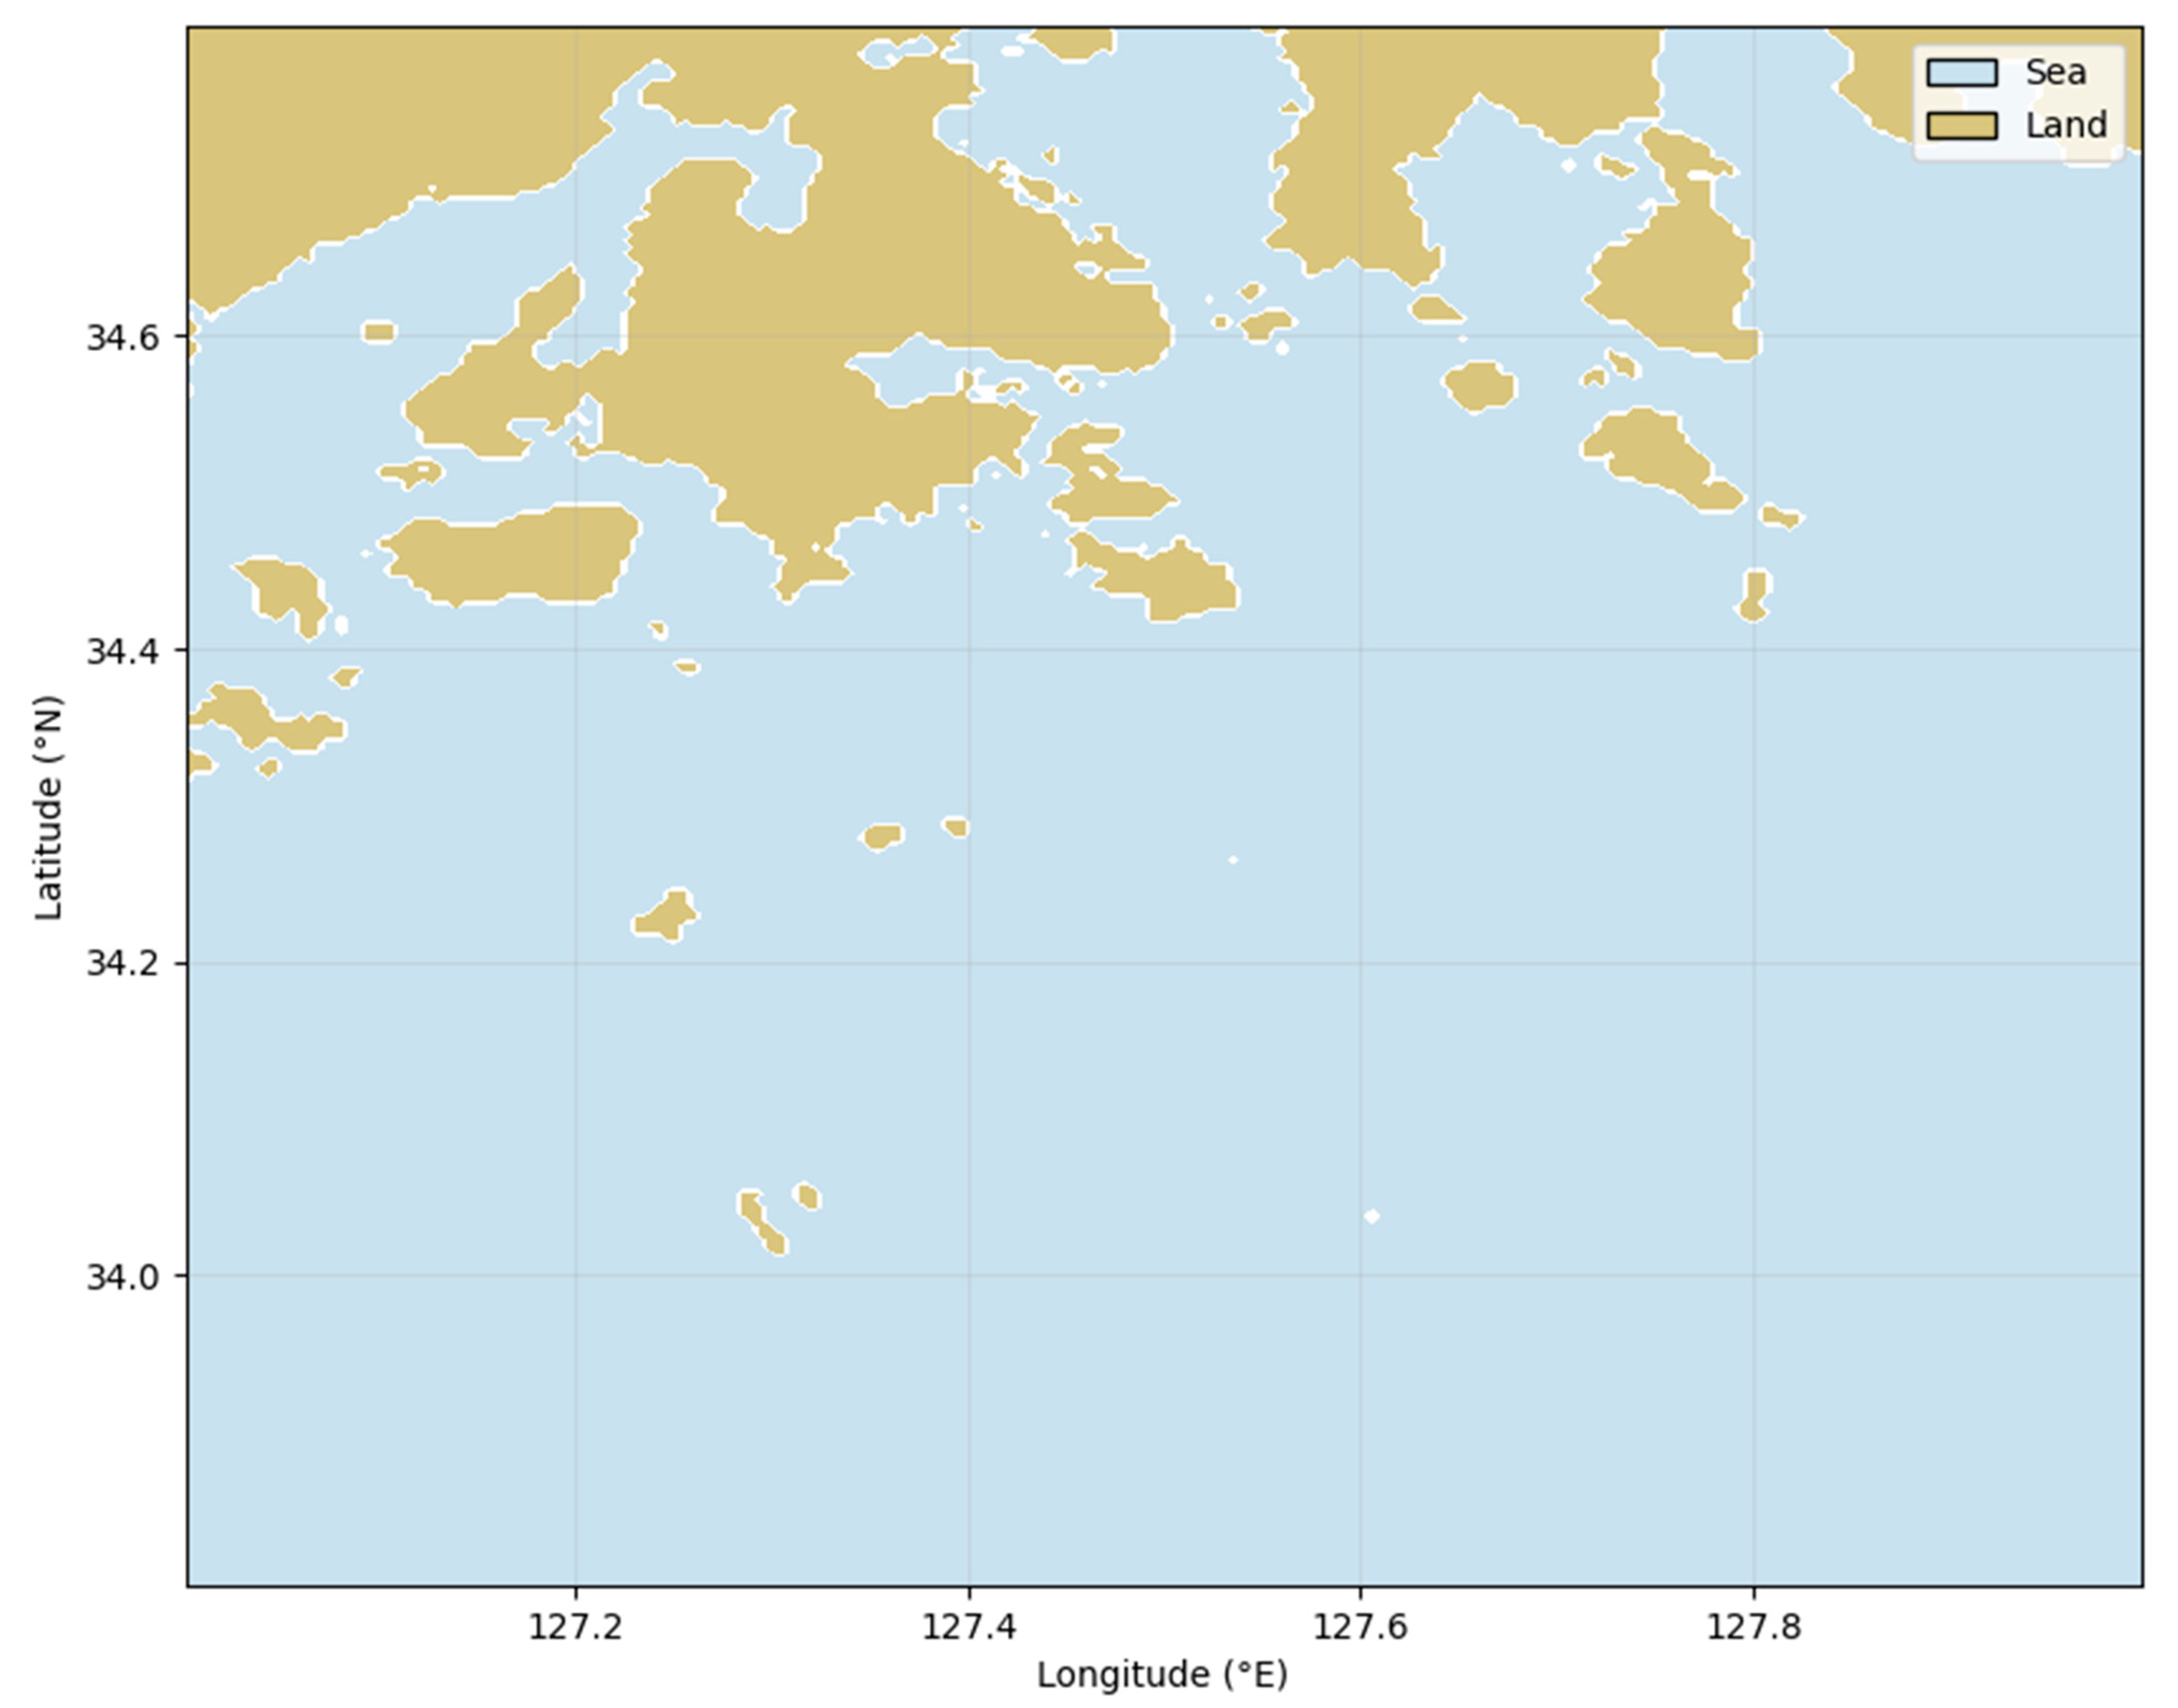
The target study area was set to the southern coastal waters of the Republic of Korea. This region was selected because the southern coast of Korea serves as a major maritime transportation corridor, where numerous shipping routes are concentrated, and it features a complex coastline interspersed with islands and narrow straits, giving it high strategic and military significance. Moreover, these environmental characteristics make the area well-suited for constructing reinforcement learning environments for route exploration and collision avoidance. In addition, the diverse seabed geological properties of this region provide suitable conditions for validating the proposed mine-laying route optimization method based on mine burial rate estimation. The target area of this study is illustrated in Figure 2.
Figure 2.
The target area of this study.
A grid was generated for the target study area to discretize the marine environment. The grid cell size was determined based on the length over all (LOA) of the mine-laying vessel. In this study, the grid cell size was set to 150 m × 150 m, corresponding to the LOA of a typical Korean naval mine-laying ship. Bathymetric data obtained from the General Bathymetric Chart of the Oceans (GEBCO) were then processed using a two-dimensional spline interpolation method to match the defined grid resolution, thereby constructing the bathymetric layer of the study area. The specifications of the target vessel are listed in Table 1.
Table 1.
Specification of target vessel.
In addition, non-navigable areas within the grid map were defined by considering the vessel’s under keel clearance (UKC), which represents the minimum vertical distance between the ship’s keel and the seabed, ensuring safe navigation. The UKC and the non-navigable depth were calculated using the following equations:
where Draftmax is the vessel’s maximum draft, and is a coefficient typically greater than 0.3 for coastal waters. In this study, based on the draft of the target vessel and a coefficient , the non-navigable area was defined as regions with a water depth of 5.98 m or less [18].
2.1.2. Seabed Sediment Mapping and Sediment Property Estimation
The Geo Big Data Open Platform provides various geological datasets of the Republic of Korea, including detailed seabed geological information. In this study, two types of seabed data were utilized: sediment type and mean grain size. The sediment type represents a grain size-based seabed classification following the Folk classification scheme. The mean grain size corresponds to the sediment grain size classification based on the Wentworth grain size scale. Using these datasets, sediment physical properties were estimated through a series of geotechnical conversions.
First, the mean grain size was converted into the Krumbein phi scale [20]:
where denotes the mean grain diameter (mm), and is the Krumbein phi value.
Representative porosity for each sediment type was assigned based on data from Geotechdata [21]. Because porosity tends to increase with decreasing grain size as shown in Ogolo et al., a correction term was applied [22]:
where is the corrected porosity, is the porosity sensitivity coefficient, and is the reference phi value.
Sediment bulk density was computed from the corrected porosity [20]:
where is the sediment bulk density, is the quartz grain density, and is the seawater density.
The submerged unit weight was then computed as in [23]:
where is the submerged unit weight and is gravitational acceleration.
At a reference depth below the seabed, the effective vertical stress was calculated as in [23]:
where denotes the effective vertical stress and is the reference depth below the seabed.
For frictional sediments such as sand and gravels, shear strength was estimated to use a representative friction angle from Geotechdata [24]. Because friction angle decreases with increasing porosity [25], the following correction was applied:
where is the corrected friction angle, and is the porosity–friction sensitivity coefficient.
The shear strength of frictional soils was then obtained using Terzaghi’s classical shear strength equation [23]:
where is the shear strength, is the friction angle.
For cohesive sediments such as silts and clays, the Stress History and Normalized Soil Engineering Properties (SHANSEP) model was used [26]:
where denotes the undrained shear strength and is the normalized undrained shear strength ratio for normally consolidated soil.
The validity of the estimated seabed parameters was examined by comparison with values reported in the geotechnical and marine sediment literature, as well as with available in situ measurements. Previous studies indicate that shear strength of marine sediments spans a wide range, approximately 0–200 kPa, depending on sediment type and consolidation conditions, while bulk density is typically reported within the range of approximately 1.4–2.2 g/cm3 [27]. In addition, limited field measurements conducted at selected locations in the east sea, west sea, and south sea of the Republic of Korea indicate shear strength values on the order of approximately 5–8 kPa and bulk density values in the range of approximately 1.4–2.1 g/cm3. For the target area considered in this study, the estimated sediment properties yielded shear strength values of approximately 1–7 kPa and bulk density values of approximately 1.2–1.9 g/cm3. These results confirm that the seabed property estimation adopted in this study reflects typical marine sediment characteristics and does not rely on unrealistic parameter values, as the estimated values fall within the ranges reported in both existing literature and available in -situ measurements.
Through these procedures, the mean grain size and sediment type data were systematically converted into porosity, sediment bulk density, and shear strength. The resulting sediment property maps were subsequently used as key geotechnical inputs for the initial mine burial rate estimation simulator.
2.1.3. Initial Burial Rate Estimation Simulator
The initial burial rate of a bottom-contact mine is determined by its underwater descent trajectory and subsequent penetration behavior upon seabed impact. This burial process is influenced by multiple interacting factors, including hydrodynamic flow, seawater density, mine shape and mass, and the geotechnical properties of seabed sediments. Chu et al. developed the IMPACT35 model to numerically simulate these physical processes based on hydrodynamic and dynamic modeling [13,14,15]. The IMPACT35 model calculates the underwater velocity and attitude variation of a mine using the equations of motion and hydrodynamic drag coefficients, and it estimates the penetration depth upon seabed impact from the mine’s kinetic energy to determine the initial burial rate.
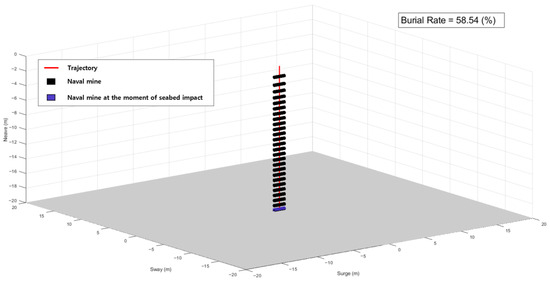
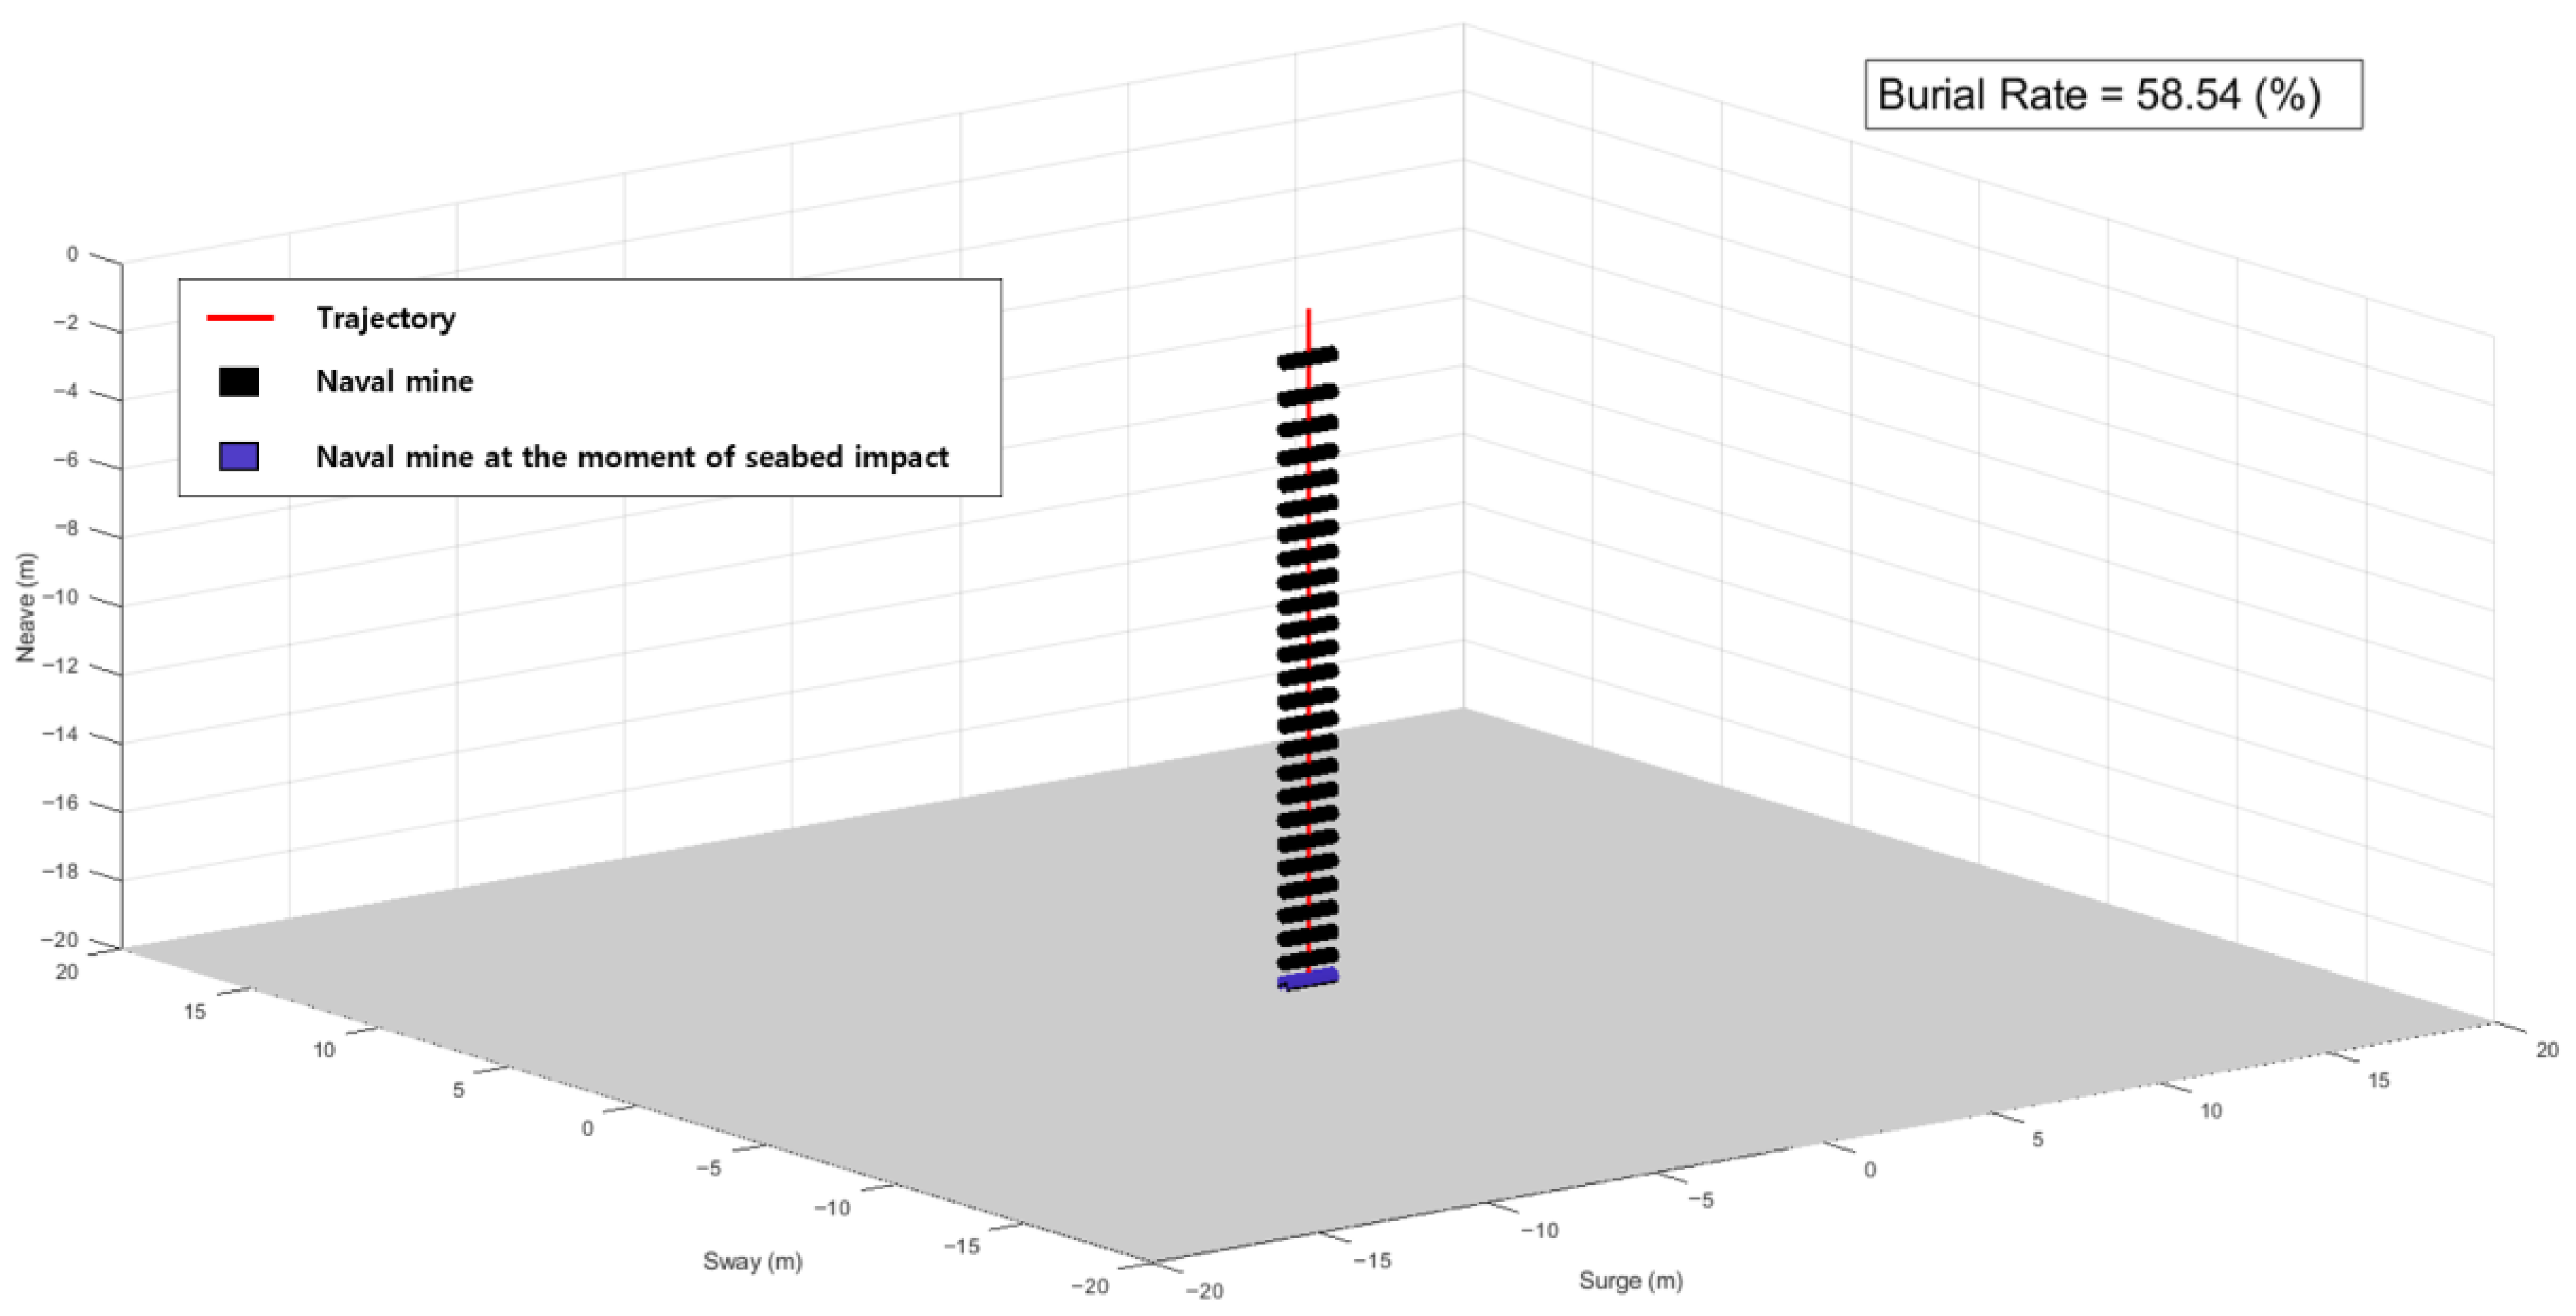
In this study, we developed an initial mine burial rate estimation simulator based on the core algorithms of the IMPACT35 model. The simulator analyzes the three-dimensional motion of mine and was applied based on comparison with experimental techniques that simulate mine behavior in air, seawater, and seabed penetration. The simulator uses three categories of input parameters: (1) mine-specific parameters, including mine mass, length, diameter, distance between the center of buoyancy and the center of mass (); (2) environmental parameters, such as water depth, sediment bulk density, and shear strength; and (3) release conditions, including drop height, impact angle. The specifications of mine in this study were obtained by applying a tenfold linear scaling to the specifications presented in the IMPACT35 model literature and are listed in Table 2. Using these inputs, the simulator predicts the underwater descent trajectory of the mine, computes the penetration depth upon seabed impact, and subsequently estimates the initial burial rate. The computed burial rates are stored as a spatial distribution that reflects local environmental conditions and are later utilized in the reward function design of the reinforcement learning-based route optimization algorithm. An example output of the developed simulator is shown in Figure 3.
Table 2.
Specification of mines in this study.
Figure 3.
Initial mine burial rate estimation simulator.
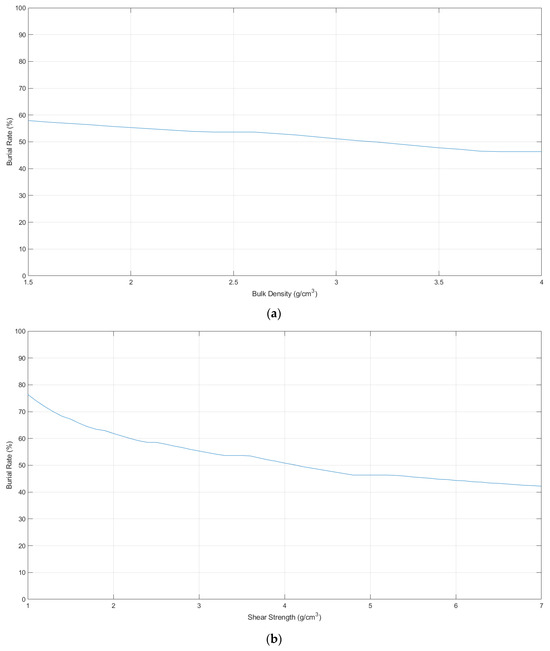
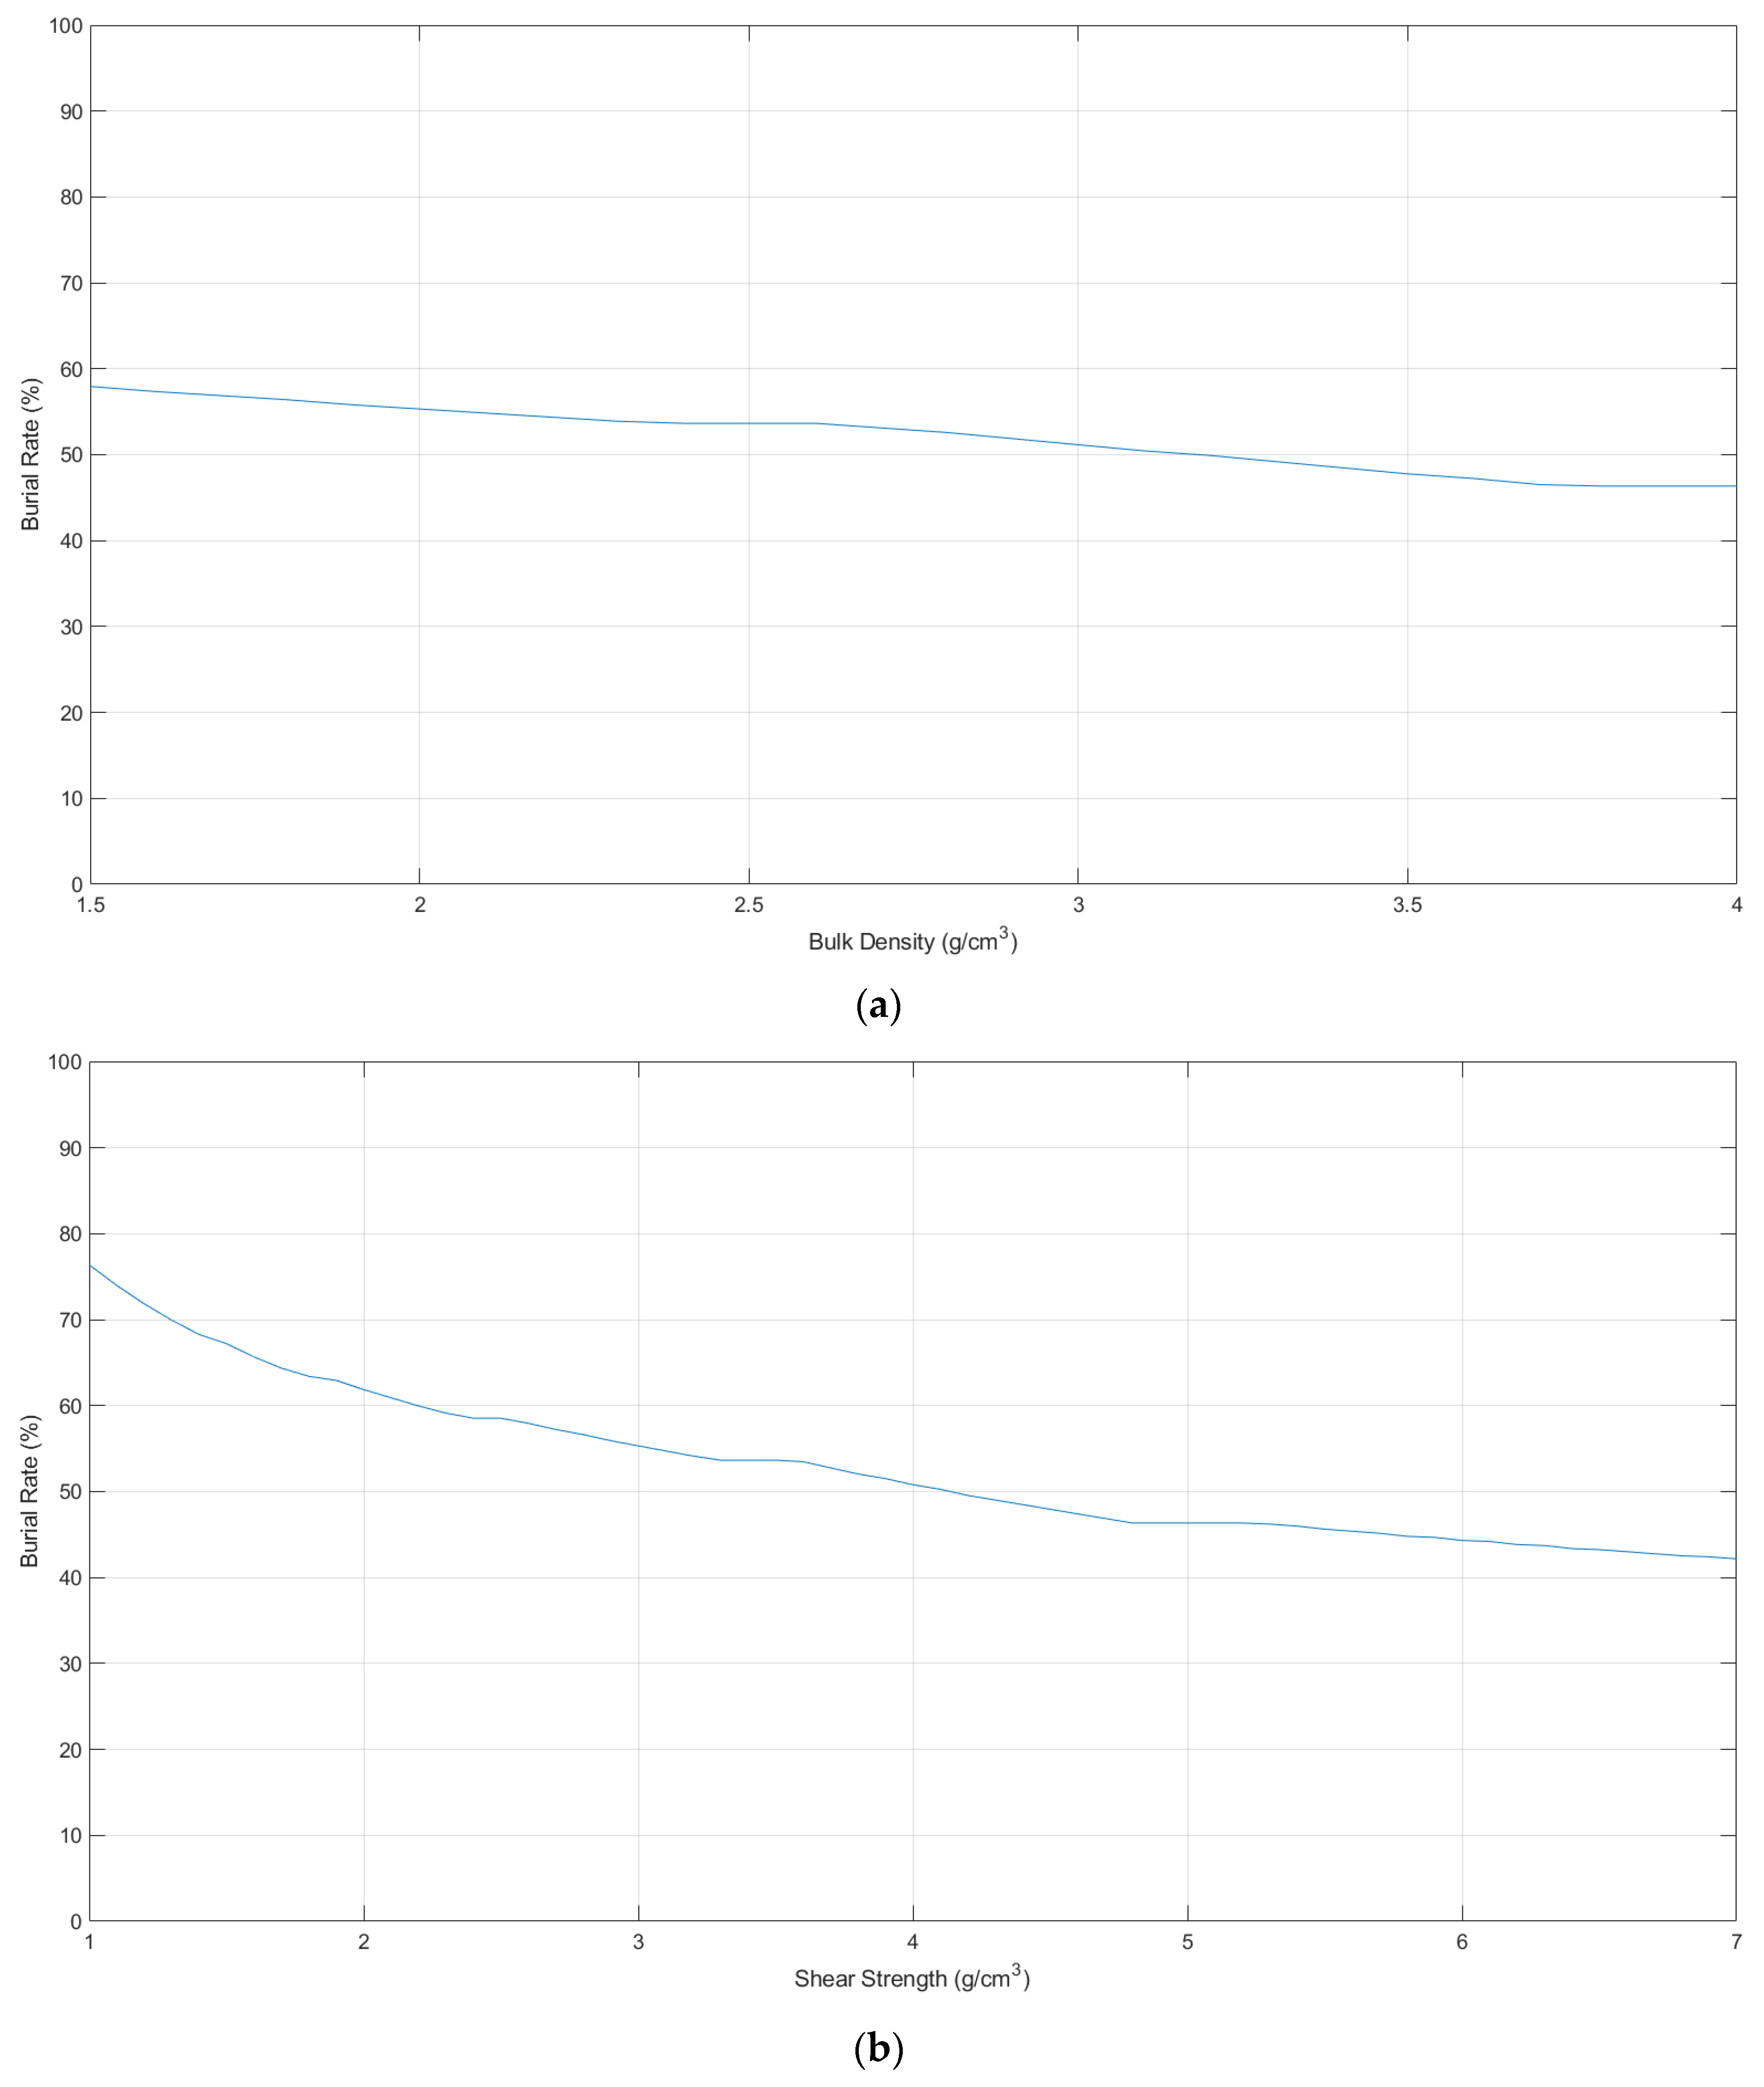
In addition, a sensitivity analysis of the developed simulator was conducted to examine the effect of uncertainty in seabed property estimation on burial rate estimation. The sensitivity analysis results are presented in Figure 4. Figure 4a illustrates the variation of the burial rate with respect to bulk density, while Figure 4b shows the burial rate variation as a function of shear strength. In this analysis, bulk density was varied from 1.5 to 4.0 g/cm3, and shear strength was varied from 1.0 to 7.0 kPa to examine their effects on burial rate prediction. As bulk density increases, the burial rate exhibits a relatively gradual decrease with a limited overall variation. In contrast, the burial rate decreases more noticeably with increasing shear strength, with a stronger sensitivity observed in the low shear strength regime. These results indicate that burial behavior is primarily governed by shear strength, whereas bulk density plays a secondary role. Moreover, despite uncertainty in seabed property estimation, the burial rate response remains continuous and predictable over the examined ranges. This demonstrates that the developed simulator responds to uncertainty in seabed properties in a physically consistent manner, supporting the robustness of the burial rate estimation under parameter uncertainty.
Figure 4.
Sensitivity analysis results of the initial mine burial rate estimation simulator. (a) variation of burial rate with respect to sediment bulk density; (b) variation of burial rate with respect to sediment shear strength.
2.2. Reinforcement Learning-Based Mine-Laying Route Optimization Method
2.2.1. Deep Q-Network
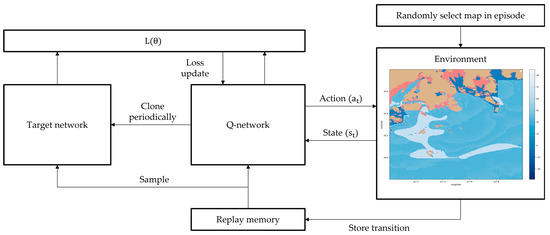
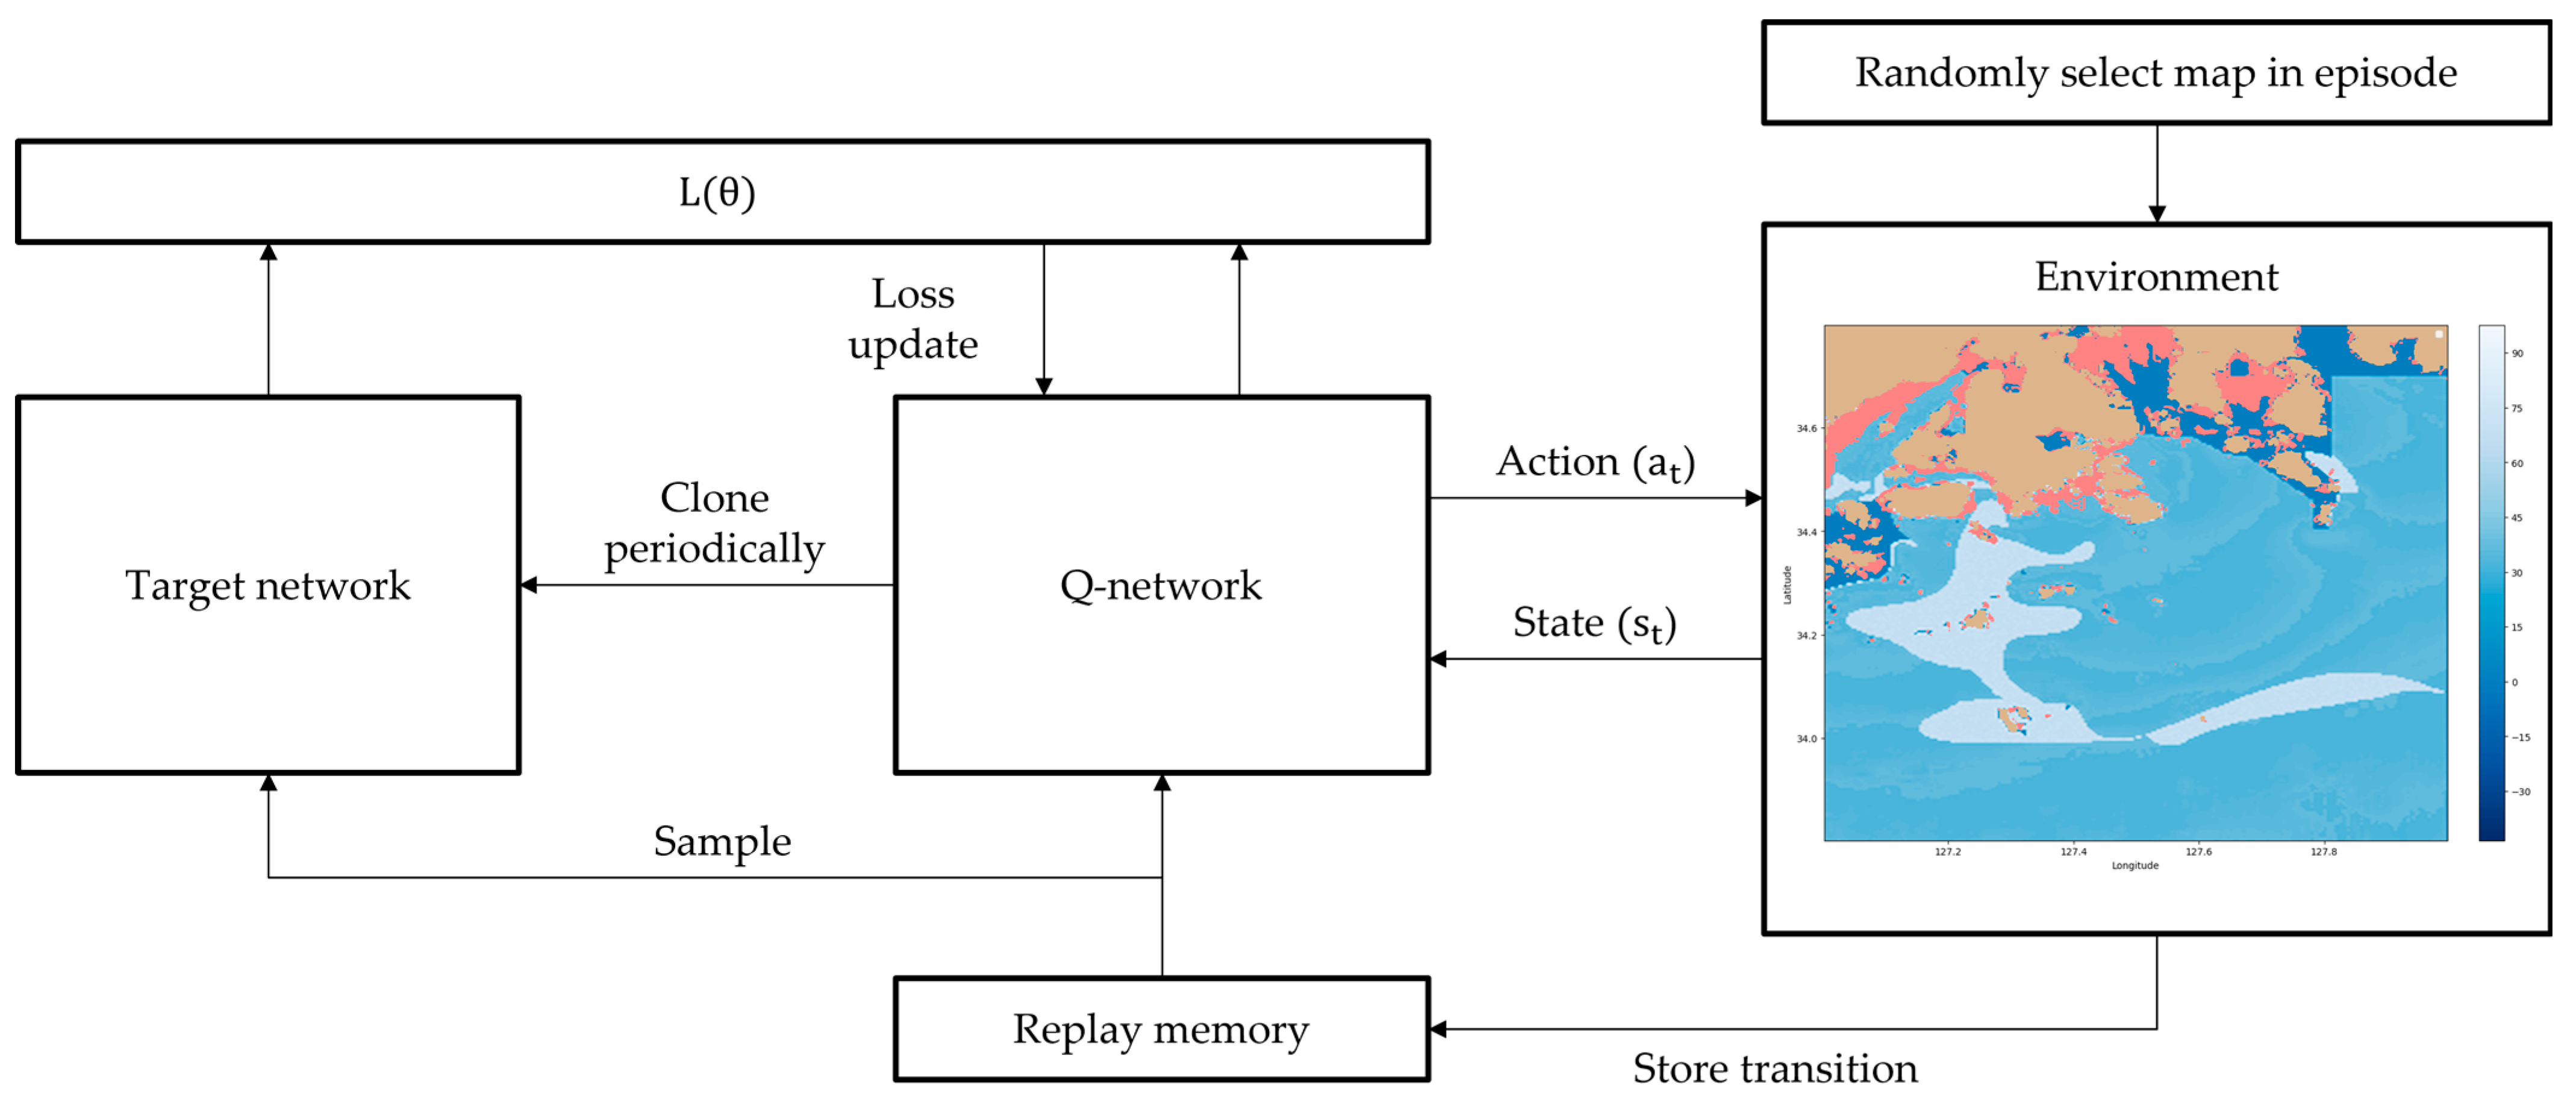
The Deep Q-Network (DQN) algorithm is a reinforcement learning technique that extends the conventional Q-learning approach by incorporating a deep neural network to enable the agent to learn optimal action policies in high-dimensional state spaces. Traditional Q-learning stores Q-values for each state–action pair in a discrete table, which becomes computationally inefficient or infeasible in continuous or complex environments. To address this limitation, DQN approximates the Q-function using a neural network that takes the current state as input and outputs Q-values for all possible actions. During training, the agent interacts with the environment and stores its experiences—comprising the state, action, reward, and next state—in a memory buffer. The network parameters are then updated by minimizing a loss function computed from a mini-batch randomly sampled from this memory. To enhance training stability, DQN introduces two key mechanisms: experience replay and the target network. The former reduces correlation among consecutive samples and improves data efficiency, while the latter stabilizes learning by using a fixed set of network weights to compute target Q-values at regular intervals. Through this structure, DQN can effectively approximate optimal policies even in high-dimensional or continuous state spaces and has been widely applied in various domains, including image-based and dynamic environments [28].
In this study, the DQN algorithm was applied to the optimal mine-laying route planning problem for surface vessels. The agent’s state is represented as a multi-channel grid map. Specifically, the state is defined as a four-channel tensor with dimensions , where and denote the down sampled spatial resolution of the environment map. The four channels correspond to: (1) obstacle and non-navigable regions, (2) burial rate-based reward map for unvisited cells, (3) the current position of the vessel, and (4) the goal location. The action space initially includes eight possible movement directions (up, down, left, right, and four diagonals). However, allowing unrestricted movement across the entire search space significantly increases training time and may lead the agent to local optima. Therefore, in this study, the available action set was constrained based on the relative position between the vessel and the target destination, enabling more efficient exploration and convergence.
At each state , the agent selects an action corresponding to the maximum Q-value predicted by the neural network. During the early stages of training, an ε-greedy exploration strategy was adopted to promote sufficient exploration of the environment. The initial exploration rate was set to , which gradually decayed to as training progressed. Consequently, in the later stages of learning, the agent explored new actions with a 10% probability and exploited the action with the highest estimated Q-value, , with a 90% probability to optimize its route.
The reward function was designed to maintain learning stability while balancing navigation safety, burial rate maximization, and path length minimization. For navigable regions, the reward depends on the local burial rate. In regions with high burial potential (i.e., burial rate ≥ 50%), a positive reward defined as was assigned to encourage the agent to generate paths that traverse areas with high burial rates. The scaling factor of 0.1 was introduced to prevent excessively large reward values, which could otherwise lead the agent to accumulate rewards by unnecessarily increasing the number of steps. In contrast, in navigable regions with low burial potential, the reward was defined as yielding negative reward values. This formulation penalizes movement through low burial regions and encourages shorter paths. Since negative rewards from low burial regions are encountered most frequently during training, the additional scaling by a factor of 1/100 was applied to improve learning stability; without this scaling, negative rewards would accumulate too rapidly, leading the agent to generate paths that prematurely terminate episodes rather than exploring feasible navigation routes. When the agent moves into non-navigable regions or land areas, a strong negative reward is assigned to suppress such unsafe actions, and the episode is immediately terminated. To maintain learning stability, the magnitude of this penalty must be consistent with the scale of rewards assigned in navigable regions. Excessively large penalties could cause abrupt drops in cumulative rewards and destabilize the learning process. Accordingly, the penalty was set to . Upon reaching the destination, a terminal reward of was granted to explicitly encourage goal attainment, and the episode was terminated. This reward was also selected to maintain stability with the overall reward scale described above; if the terminal reward were set too small, the agent might fail to prioritize reaching the destination, whereas an excessively large terminal reward could cause the agent to disregard other optimization objectives, such as burial rate maximization or path efficiency. No reward was assigned in regions where burial rate data was unavailable. If the agent failed to reach the destination within the predefined maximum number of steps, or moved outside the map boundaries, the episode was terminated. The numerical constants and scaling factors used in the reward function were determined through comparative testing, in which multiple combinations of scaling factors and constant values were evaluated in terms of learning stability and resulting path morphology. This reward structure encourages the agent to generate collision-free routes while simultaneously accounting for both the maximization of burial rate along the path and the minimization of route length.
The DQN architecture used in this study was implemented as a convolutional neural network (CNN) to effectively process the spatial information contained in the grid-based state representation. The network consists of three convolutional layers followed by two fully connected layers. The input to the network is the four-channel grid state . The convolutional layers extract spatial features using kernel size with padding 1, allowing the feature map resolution to remain identical to the input resolution. The final convolutional output is flattened and passed through a fully connected layer with 256 hidden units. The output layer produces the Q-values for all possible actions , where represents the trainable parameters of the network. The parameters are optimized by minimizing the Q-learning loss function, defined as:
where the target Q-value is given by:
where denotes the target network, which is updated at fixed intervals C to stabilize the learning process by preventing oscillations caused by rapidly changing Q-values.
During training, the agent interacts with the environment and stores its experiences in an experience replay buffer. Mini batches are randomly sampled from this buffer to update the network parameters, which reduces temporal correlations between consecutive samples and improves sample efficiency. The learning rate controls the convergence speed of the neural network, while the discount factor determines the weight assigned to future rewards. The training process continues until the loss function converges or the agent consistently generates a stable route that successfully reaches the target destination. The pseudo code of Deep Q-Network for mine-laying route optimization is as follows Algorithm 1 and DQN structure in this study is shown in Figure 5.
| Algorithm 1 Deep Q-network for Mine-Laying Route Optimization |
| Initialize replay memory to capacity N For episode = 1, M do Randomly sample map For t = 1, T do in replay memory from replay memory End End |
Figure 5.
DQN structure in this study.
2.2.2. Proximal Policy Optimization
The proximal policy optimization (PPO) algorithm is one of the representative policy gradient methods in reinforcement learning. It directly optimizes the policy function to maximize the expected cumulative reward. Although conventional policy gradient and trust region policy optimization (TRPO) algorithms achieve strong performance, they require complex constraints or computationally demanding updates, making them difficult to implement. PPO resolves these issues by introducing a clipping mechanism that limits the magnitude of policy updates, thereby enhancing both stability and efficiency [29].
The PPO objective function is formulated as:
where is the probability ratio between the new and old policies, is the threshold that limits the allowable change in the policy update ratio, and denotes the advantage function representing how much better an action performs compared to the baseline policy. The clipping term prevents excessively large policy updates, improving the stability of the learning process. Through this formulation, PPO achieves stable policy convergence and can efficiently learn optimal policies even in continuous and complex state spaces. In this study, the state space, action space, and reward function of the PPO algorithm were configured identically to those used in the DQN framework.
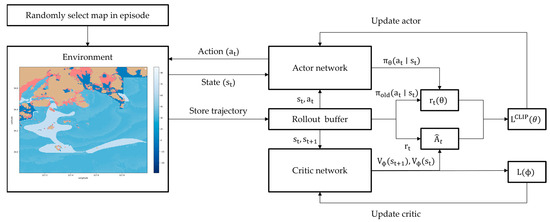
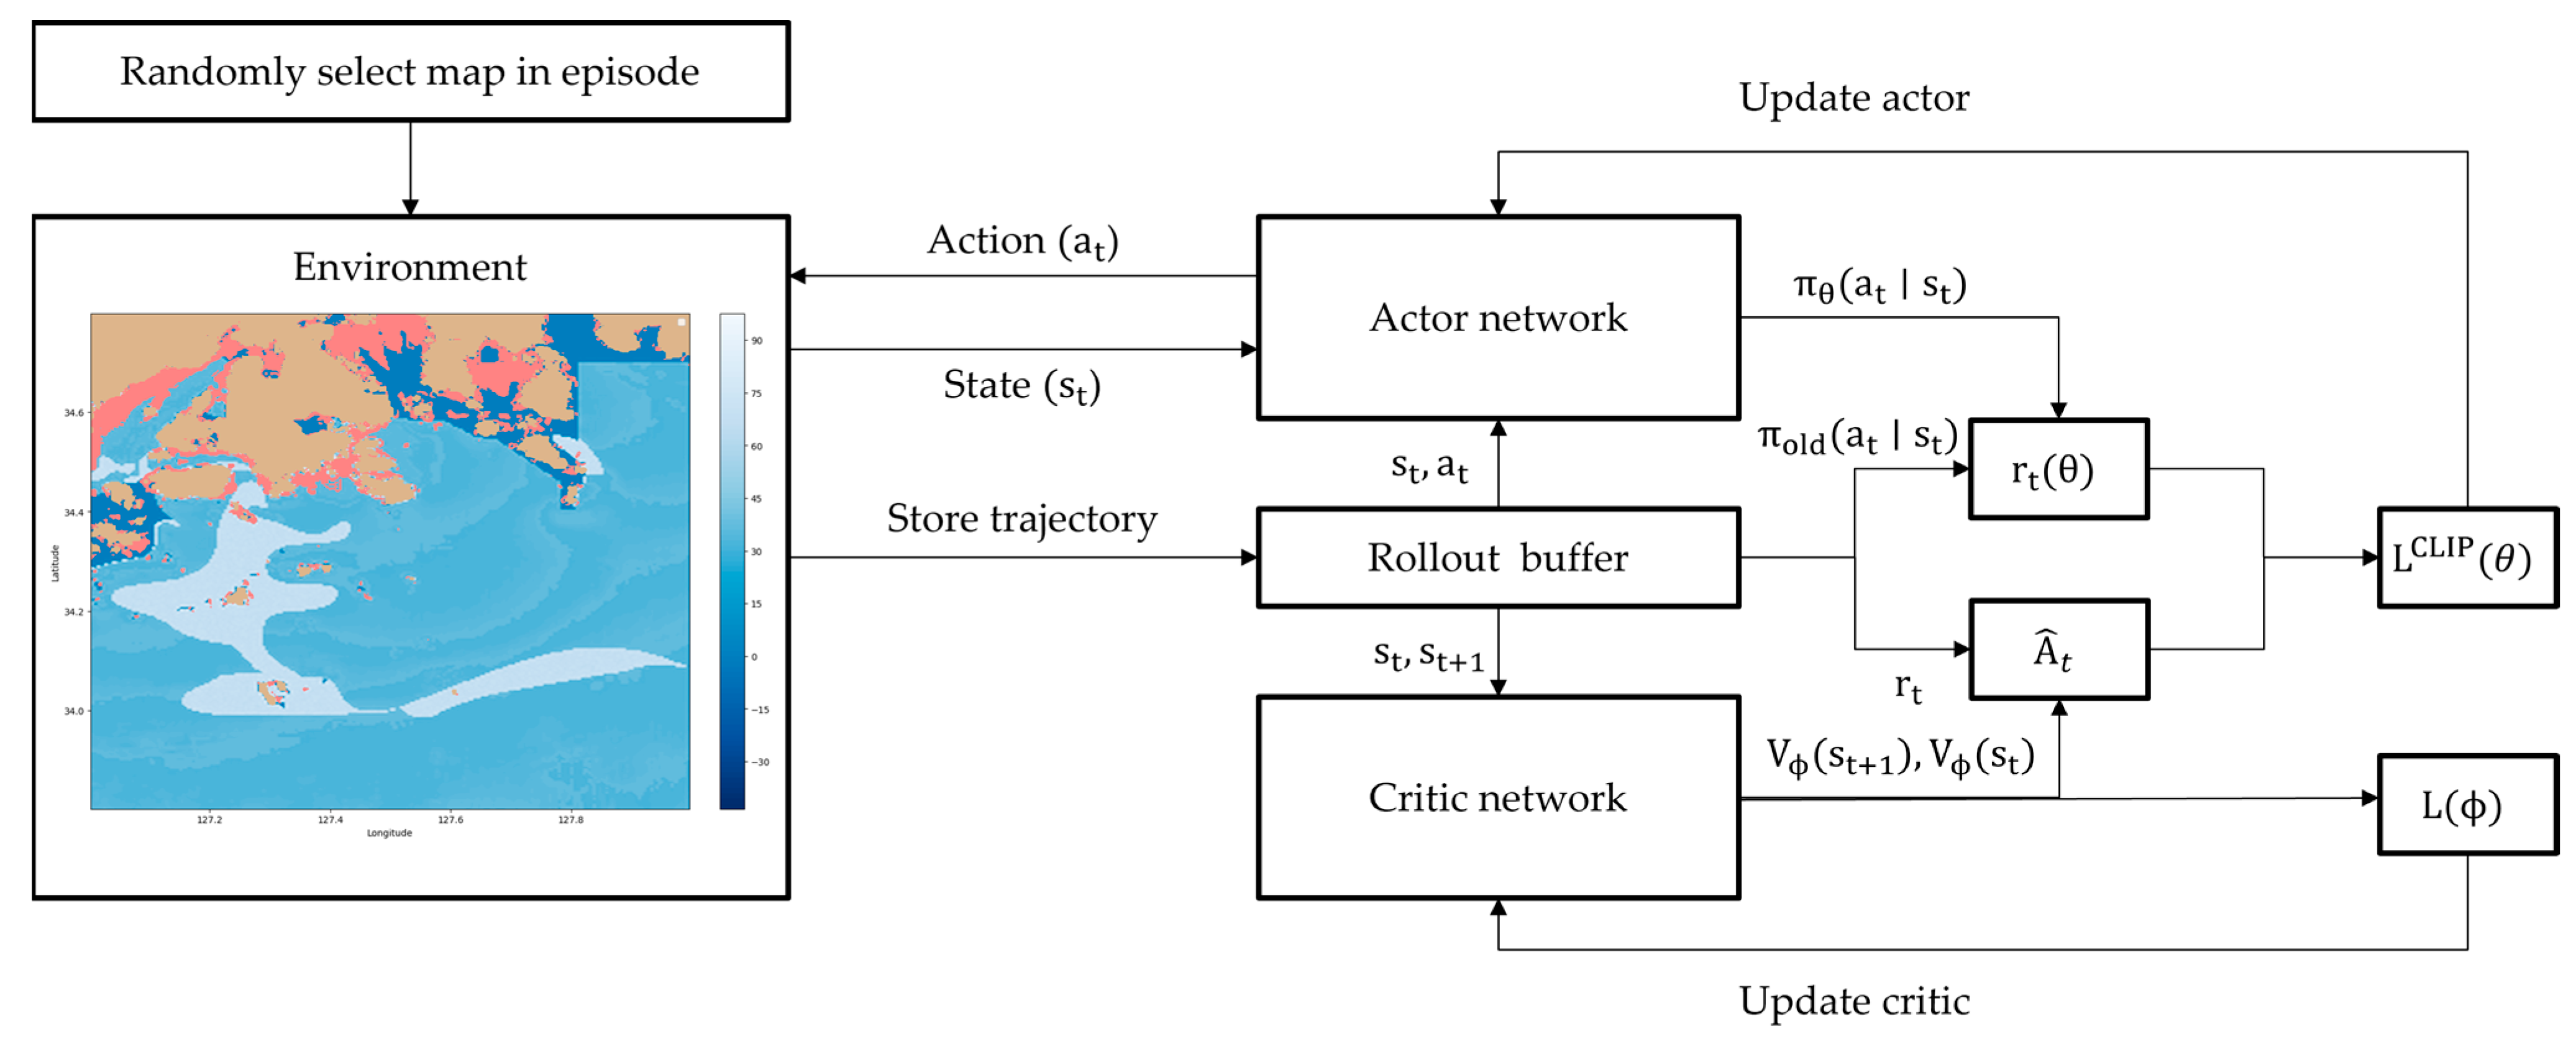
The PPO algorithm implemented in this study follows an actor–critic architecture, in which a shared convolutional neural network backbone is used to extract spatial features from the grid-based state representation, and two separate output heads are used for the policy and value functions. The shared CNN receives the current state and processes it through three convolutional layers and a fully connected layer to produce a 256-dimensional feature vector. Based on this shared feature representation, the Actor head outputs the action logits, which are converted into the policy distribution , while the Critic head outputs the scalar state value . During training, the agent collects trajectories by interacting with the environment. For each step, the temporal difference residual is computed as:
Then the advantage function is computed as using generalized advantage estimation (GAE-):
And the policy parameters are updated by maximizing the clipped objective function . The Critic network is trained using a mean squared error (MSE) loss to minimize the prediction error of . In addition, generalized advantage estimation is employed to reduce variance in advantage estimation and improve sample efficiency. Through this training procedure, PPO can stably learn effective navigation policies. The pseudo code of proximal policy optimization for mine-laying route optimization is as follows Algorithm 2 and PPO structure in this study is shown in Figure 6.
| Algorithm 2 Proximal Policy Optimization for Mine-Laying Route Optimization |
For episode = 1, M do Initialize rollout buffer Randomly sample map For t = 1, T do in rollout buffer End For t = T, 1 do End for all t in rollout buffer For epoch = 1, K do in rollout buffer Compute clipped surrogate objective: End End |
Figure 6.
PPO structure in this study.
3. Results
In this study, the estimation of sediment bulk density, shear strength, and the initial burial rate of bottom-contact mines was conducted using MATLAB 2024b, while the reinforcement learning models (DQN and PPO) were implemented and trained in a Python 3.12.8 environment. The experiments were designed with three distinct cases to evaluate how the spatial location of high burial rate regions influences the performance and path selection behavior of route planning algorithms. The three cases were defined as follows: (1) a high burial rate region located directly at the vessel’s starting position, (2) a high burial rate region positioned relatively close to the starting point, and (3) a high burial rate region located farther away from the starting point. For each case, optimal mine-laying routes were generated using both DQN and PPO, and the resulting paths and performance metrics were compared to those obtained using the traditional A* algorithm.
3.1. Experimental Setup
3.1.1. Experimental Environment
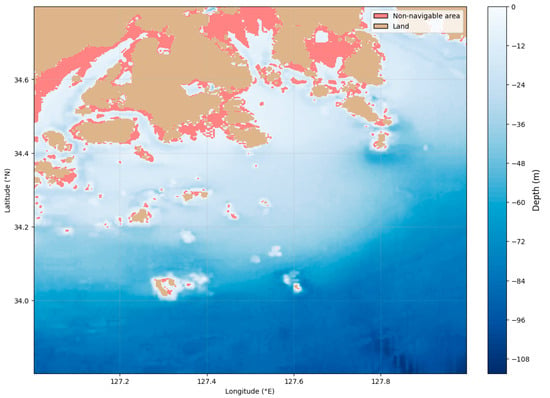
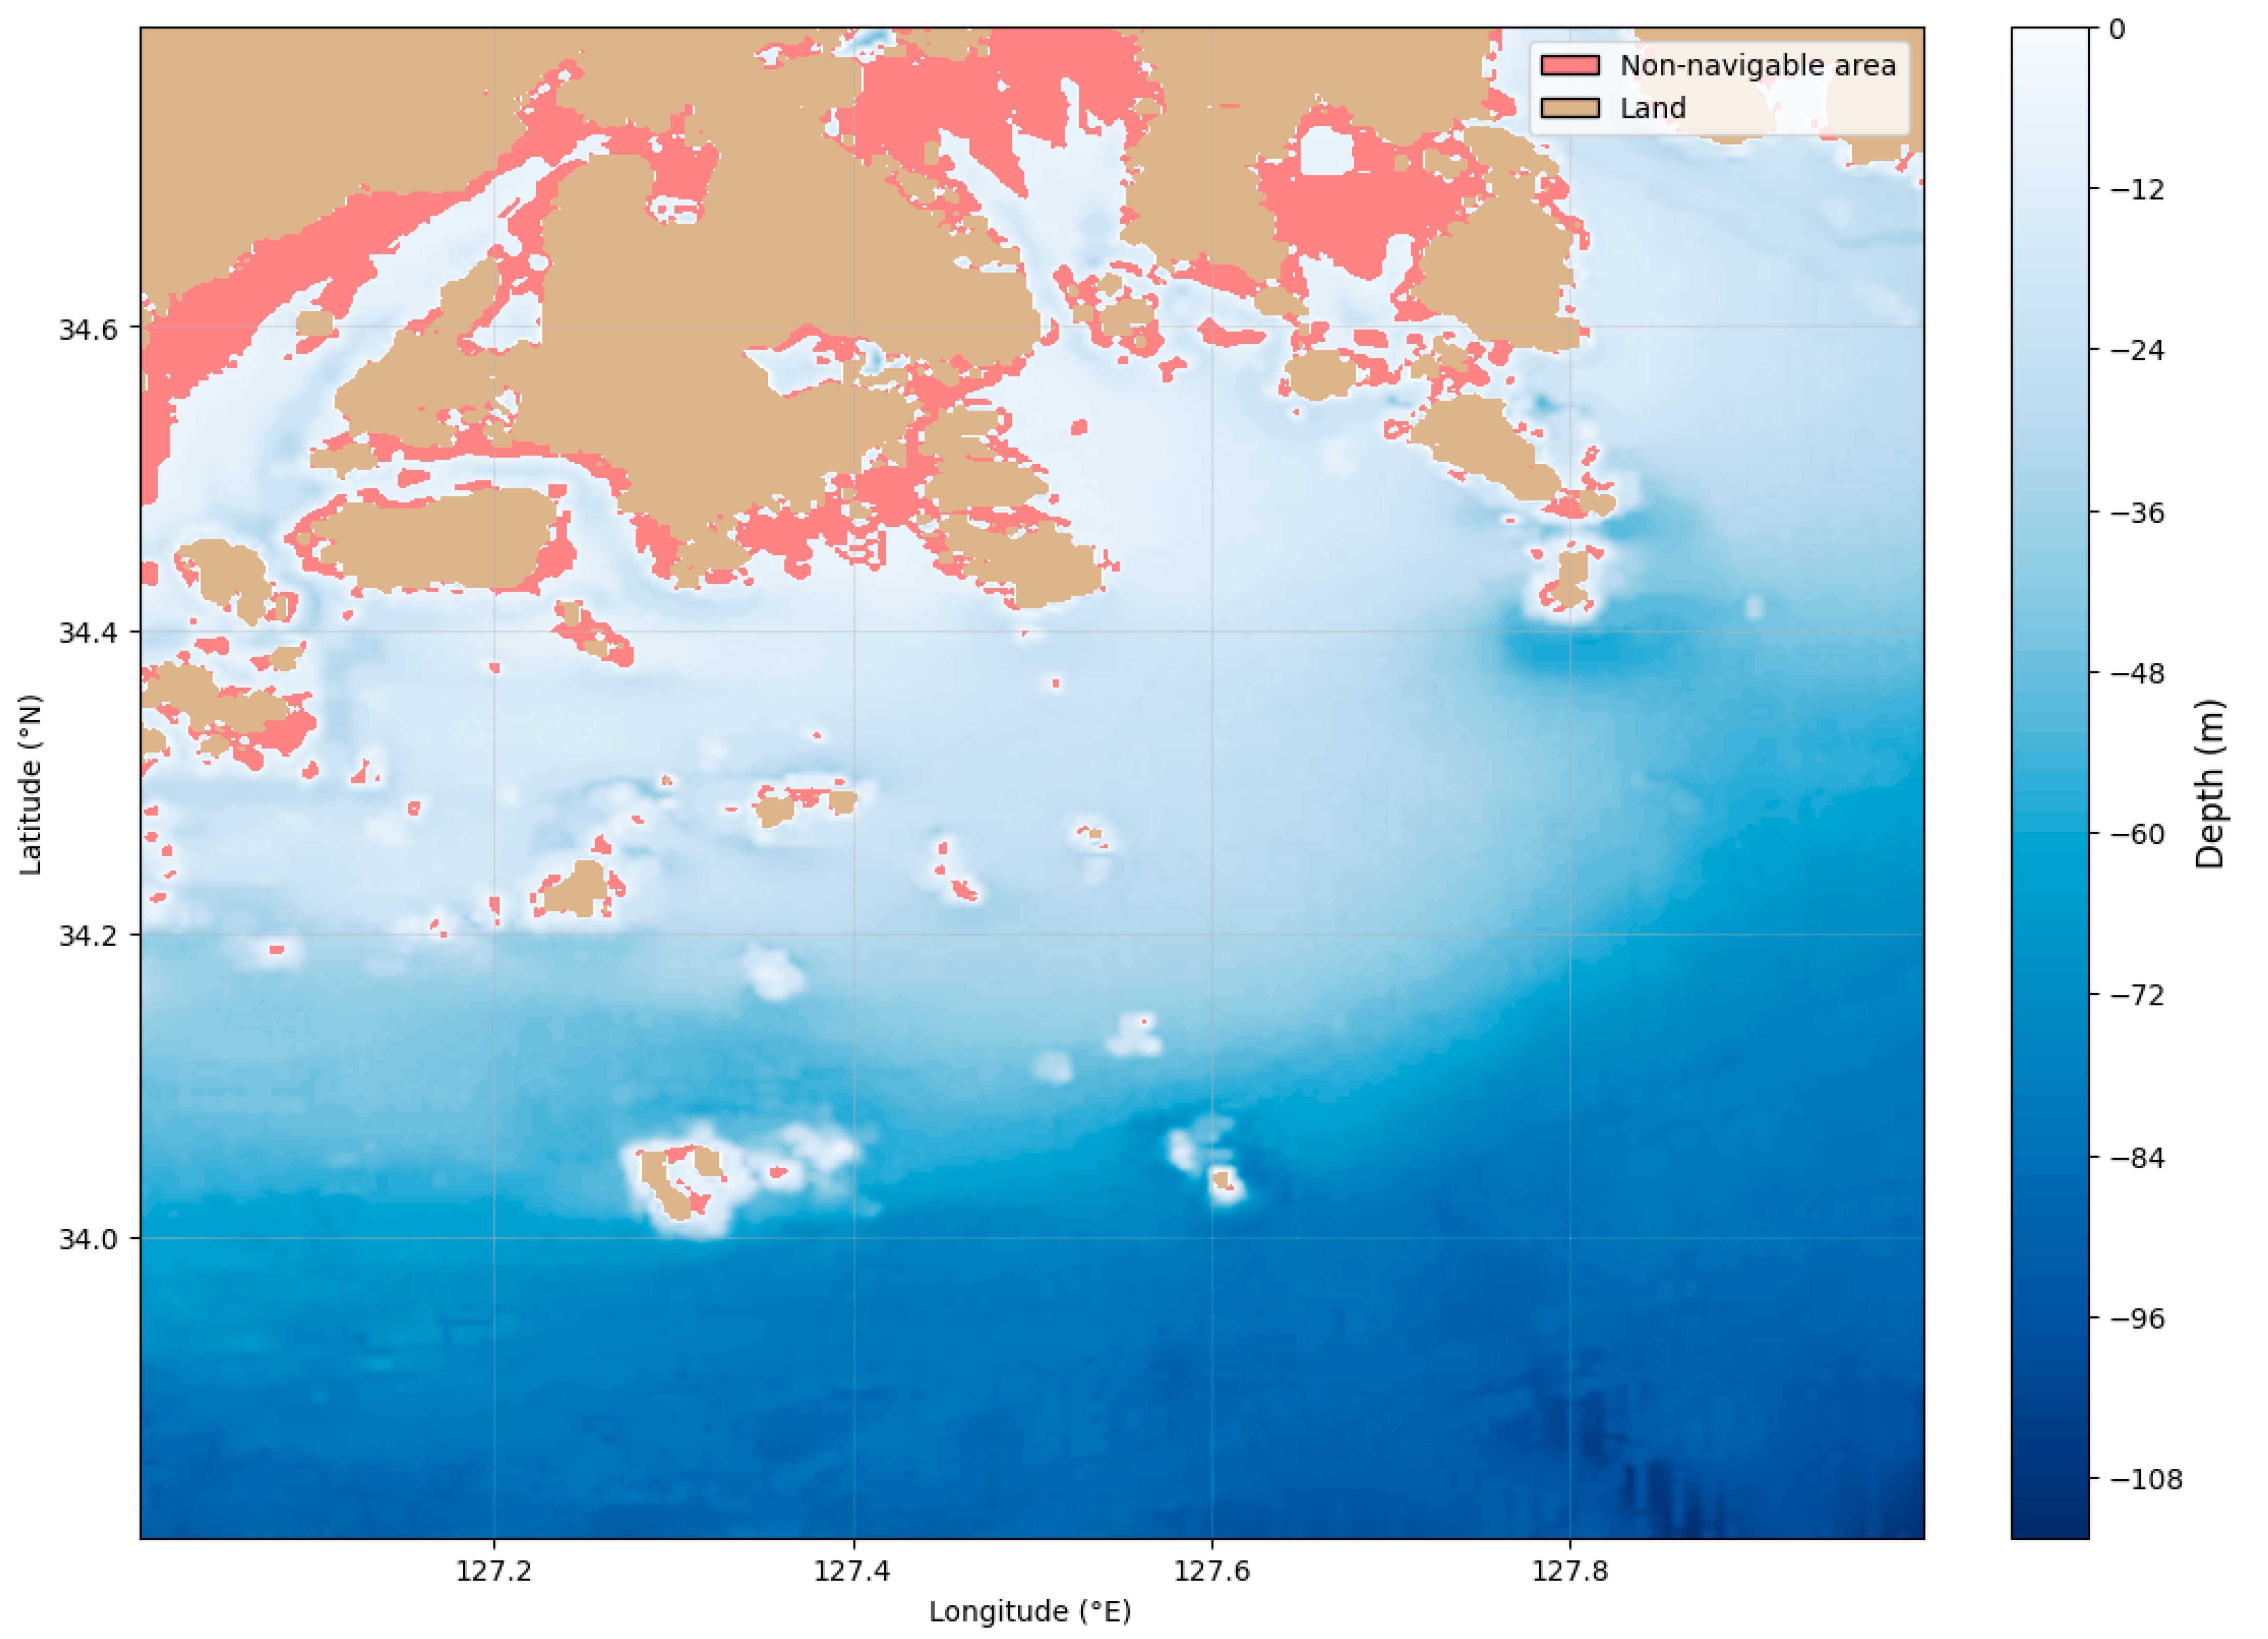
The study area is in the southern coastal waters of the Republic of Korea, where diverse sedimentary characteristics and multiple port facilities are distributed. The geographical extent of the region ranges from 33.8° to 34.8° in latitude and from 127.0° to 128.0° in longitude. Bathymetric data derived from GEBCO were used to construct the seafloor topography of the study area. A grid map with a resolution of 150 m × 150 m per cell was generated based on the LOA of the target ship, resulting in a 740 × 611 grid map representing the entire region. Based on the under keel clearance requirement of the target vessel, areas with water depths shallower than 5.98 m were classified as land or non-navigable regions, and this navigational constraint was incorporated into the experimental environment. The spatial distribution of water depth and non-navigable region is illustrated in Figure 7.
Figure 7.
The spatial distribution of water depth and non-navigable areas.
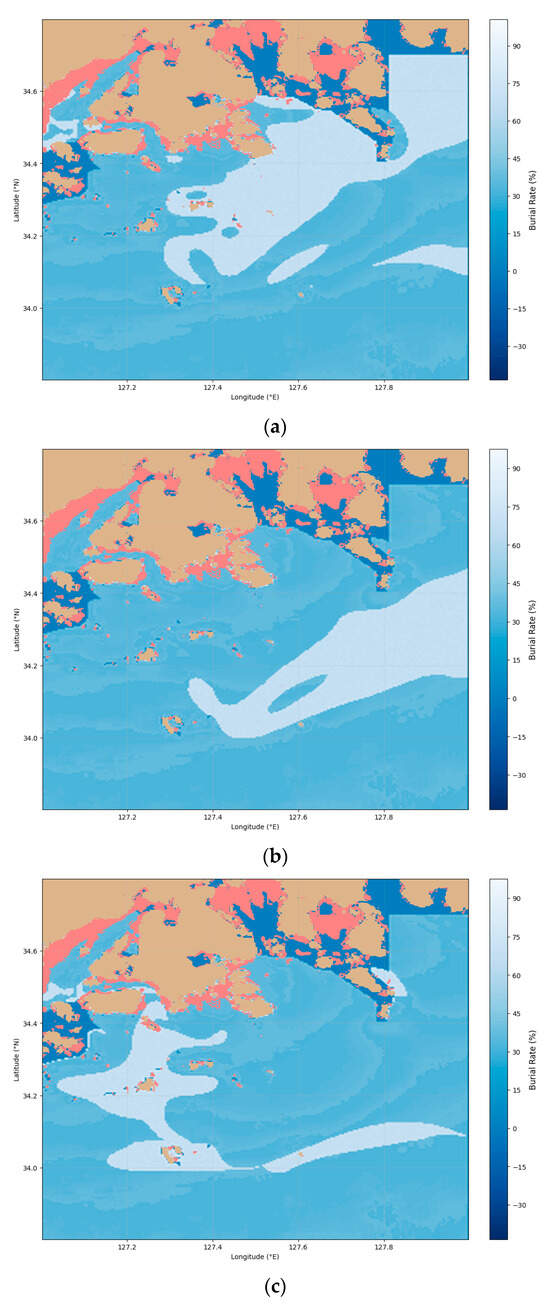
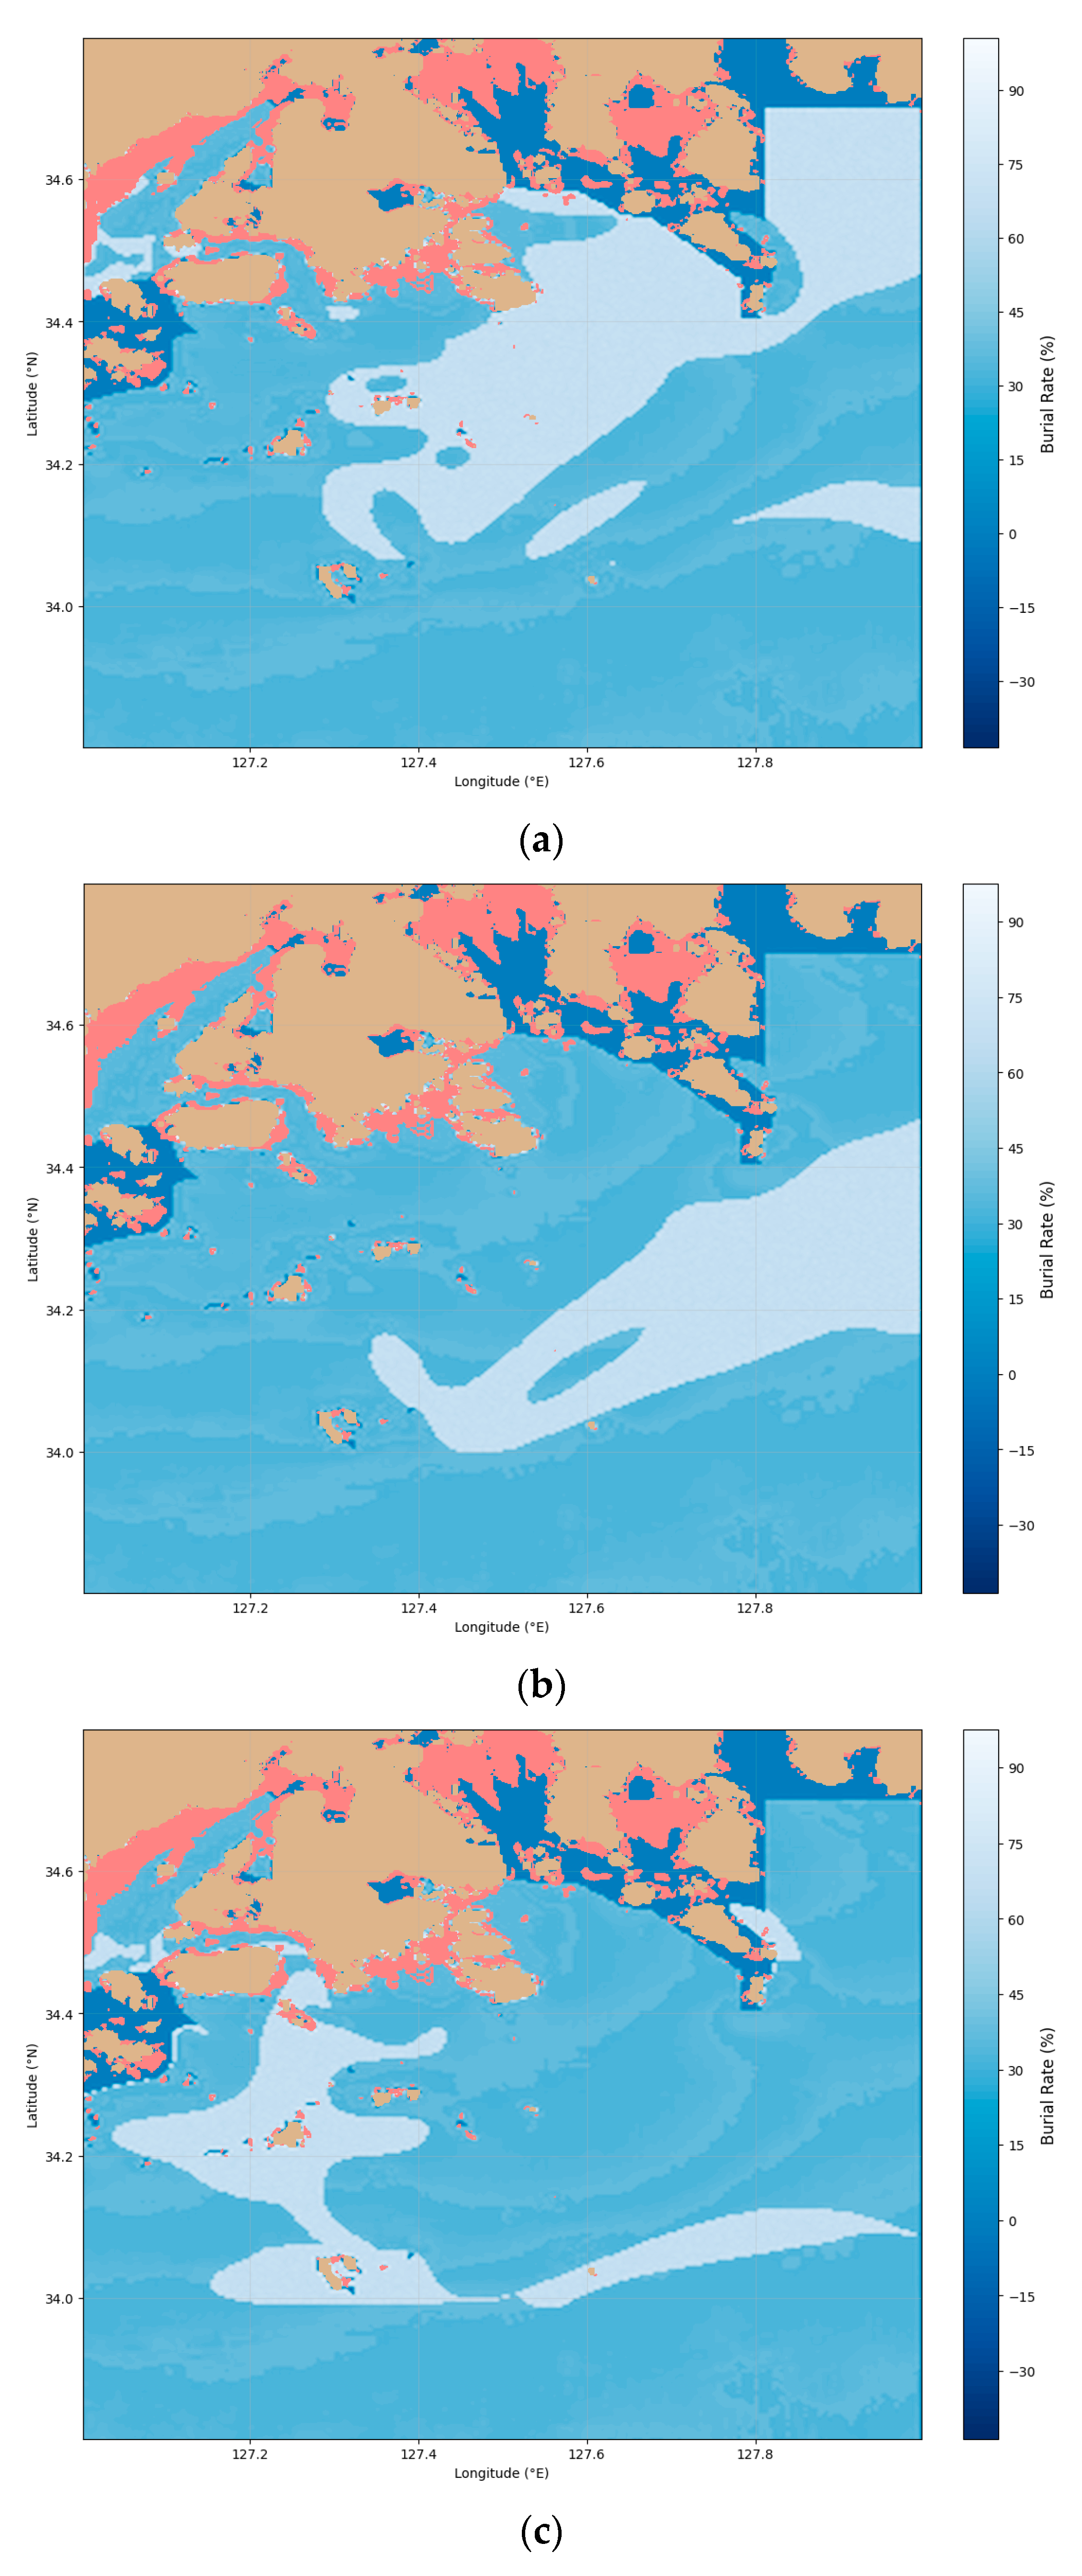
Using sediment type and mean grain size data, the sediment bulk density and shear strength of seabed sediments were estimated, and these parameters were applied to the mine burial estimation simulator to compute the initial burial rate across the study area. A value with a negative burial rate means that there is no data in the corresponding area.
To examine how the spatial position of high burial rate regions influences route generation, three experimental cases were designed. Case 1 corresponds to a high burial rate region located directly at the vessel’s starting position, as shown in Figure 8a. Case 2 represents a scenario in which the high burial rate region is positioned relatively close to the starting point, as depicted in Figure 8b. Case 3 considers a high burial rate region located farther from the starting position, as illustrated in Figure 8c. For each case, the selected high burial rate region was assigned a burial rate value in the range of 65%~70%, while the remaining regions were assigned lower burial rate values ranging from 0.20 to 0.40 to construct the experimental environment.
Figure 8.
Experimental case map with burial rate distribution (a) Case 1; (b) Case 2 (c) Case 3.
3.1.2. Modified A* Algorithm for Experimental Validation
To validate the performance of the proposed reinforcement learning-based approach, the A* algorithm was appropriately modified to address the multi-objective route planning problem considered in this study, which simultaneously accounts for collision avoidance under terrain constraints, maximization of mine burial rate along the route, and minimization of route length.
In the modified A* algorithm, non-navigable regions were explicitly excluded from the search process by prohibiting node expansion in areas that violate navigational constraints, thereby ensuring collision avoidance induced by terrain limitations. As a result, the generated paths satisfy the same navigational feasibility conditions imposed on the reinforcement learning environment.
While the A* algorithm generates routes by minimizing a cumulative cost, the proposed reinforcement learning methods generate routes by maximizing cumulative reward. To enable a fair and consistent comparison between these fundamentally different optimization paradigms, the cost function of the A* algorithm was redesigned to reflect the same objectives embedded in the reinforcement learning reward structure. Specifically, the cost assigned to each grid cell was defined as:
This cost function was designed to impose penalties by increasing the cost in regions with low burial rate, while encouraging route selection through regions with high burial rate by reducing the cost. This formulation reflects the same principle as the reward design in the reinforcement learning framework. Through this design, the objectives of maximizing burial rate along the route and minimizing the overall path length are simultaneously considered.
Through this design, a fair comparison between the proposed reinforcement learning-based methods and the traditional A* algorithm was achieved, and the performance of the proposed methods was objectively validated.
3.1.3. Reinforcement Learning Parameter
In this study, the hyperparameters for DQN and PPO were selected to ensure stable convergence and an appropriate balance between exploration and exploitation in the route planning process. As summarized in Table 3, the DQN model receives a state input of size (4, 74, 60), obtained by down sampling the original 740 × 611 grid map to one-tenth resolution. This representation enables the CNN-based Q-network to retain essential spatial features—such as obstacles, burial rate distribution, and navigational constraints—while significantly reducing computational cost. The discount factor was set to
to emphasize long-term rewards, which is crucial in a navigation problem where traversing high burial rate regions and reaching a distant target are central objectives. An ε-greedy strategy was adopted for exploration, where ε decays exponentially from 1.0 to 0.05. This scheduling allows sufficient exploration in early training and a gradual shift toward exploitation as learning stabilizes. The decay rate (0.002) was selected to avoid premature convergence to local optima. A replay buffer with a capacity of 20,000 was employed to decorrelate samples through random mini-batch updates and improve the stability of Q-learning. The learning rate (0.001) and batch size (64) were chosen to ensure smooth and reliable gradient updates in the CNN-based architecture.
Table 3.
Learning parameter of DQN.
The hyperparameters for PPO were configured as summarized in Table 4. The state input size was kept identical to that of DQN. PPO performs multiple optimization cycles using a single batch of on-policy rollout data; therefore, the number of epochs per update (4) was adopted to increase sample efficiency while preventing over-updating of the policy. The discount factor was again set to to maintain consistency across models. The clipping parameter () was selected to restrict excessively large policy updates, ensuring stable convergence. The GAE parameter () was used to achieve a desirable bias–variance trade-off in advantage estimation, and the entropy coefficient (0.1) was introduced to promote exploration and prevent the policy from becoming prematurely deterministic. The learning rate (0.0001) was set lower than that of DQN to avoid policy collapse, as PPO directly updates the probabilistic policy distribution through its actor network.
Table 4.
Learning parameter of PPO.
These hyperparameter configurations reflect the algorithmic nature of DQN and PPO and were selected to enable stable and efficient learning of optimal mine-laying routes within a large-scale grid-based coastal environment.
3.2. Experimental Results
3.2.1. Learning Performance of DQN and PPO
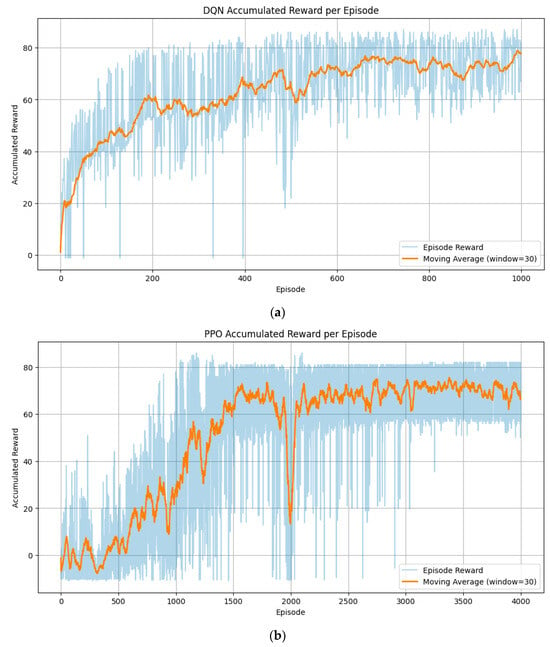
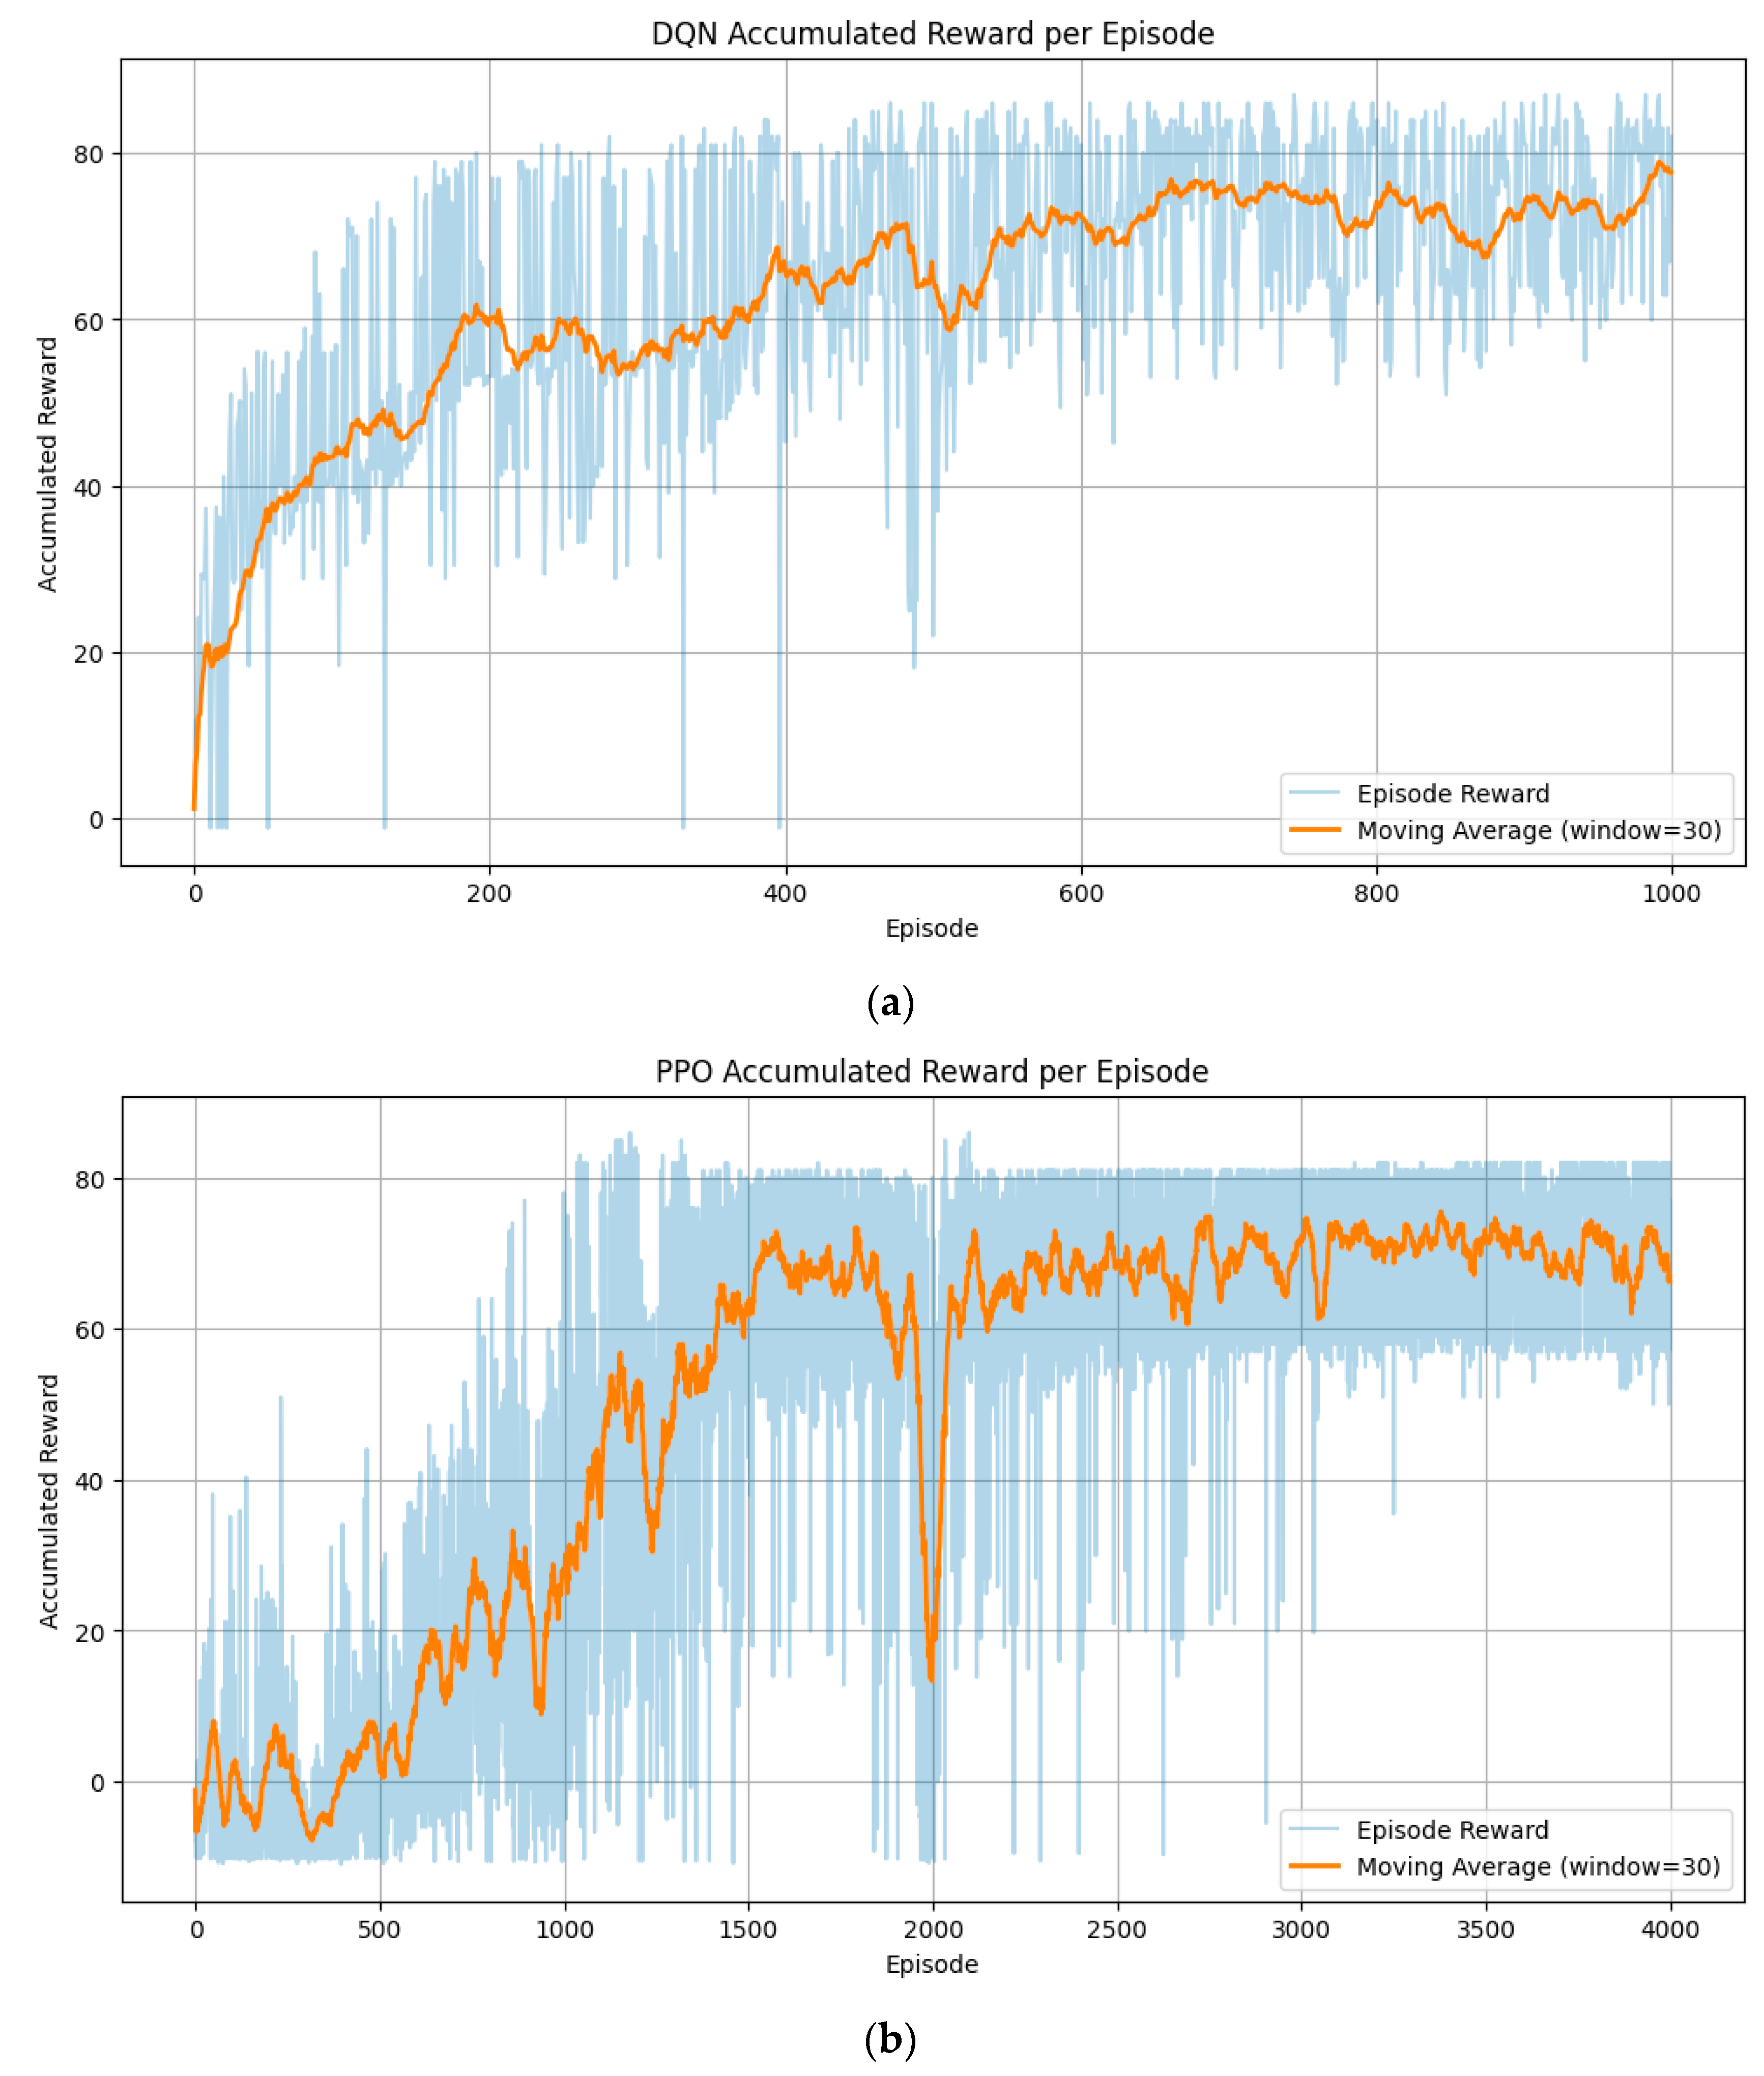
Figure 9a,b show the episode-wise accumulated rewards and the 30-episode moving averages for the DQN and PPO algorithms, respectively.
Figure 9.
Accumulated rewards obtained during training for the two reinforcement learning algorithms. (a) DQN algorithm; (b) PPO algorithm.
For DQN, the accumulated rewards exhibit large fluctuations during the initial episodes but steadily increase as training progresses. After approximately 200–600 episodes, the moving average trend rises sharply, and the policy converges to a stable reward range. This rapid convergence is attributed to the off-policy nature of DQN, in which past experiences stored in the replay buffer are repeatedly reused, resulting in high sample efficiency and fast value function stabilization.
In contrast, the PPO training curve also begins with substantial variability but shows a gradual and consistent increase in the moving average reward over time. The reward progression becomes smoother in the mid-to-late training stages, and eventually converges within a stable range. Since PPO is an on-policy method, only data collected from the current policy are used during each update, requiring more episodes to accumulate sufficient learning signals. However, each training step involves primarily forward computations, making the per-step computational cost relatively low.
Both algorithms display oscillations in their reward curves. This behavior is directly related to the experimental setup: in each training episode, one of the three test cases was randomly selected, and each case has a noticeably different reward scale. Consequently, transitions between high-reward and low-reward cases appear throughout training, producing noticeable fluctuations in the accumulated reward trajectories.
The measured training time for each algorithm was 43 min 37 s for DQN and 16 min 3 s for PPO, as summarized in Table 5.
Table 5.
The measured training time for each algorithm.
Overall, both algorithms exhibited increasing accumulated rewards over the training process and ultimately converged to stable performance levels. DQN demonstrated faster convergence in terms of episodes, whereas PPO achieved shorter total training time despite requiring more iterations.
3.2.2. Path Comparison
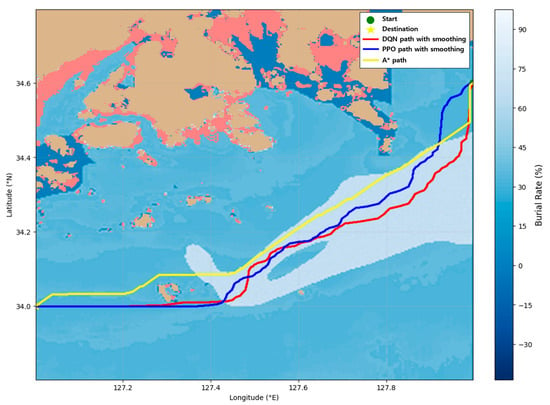
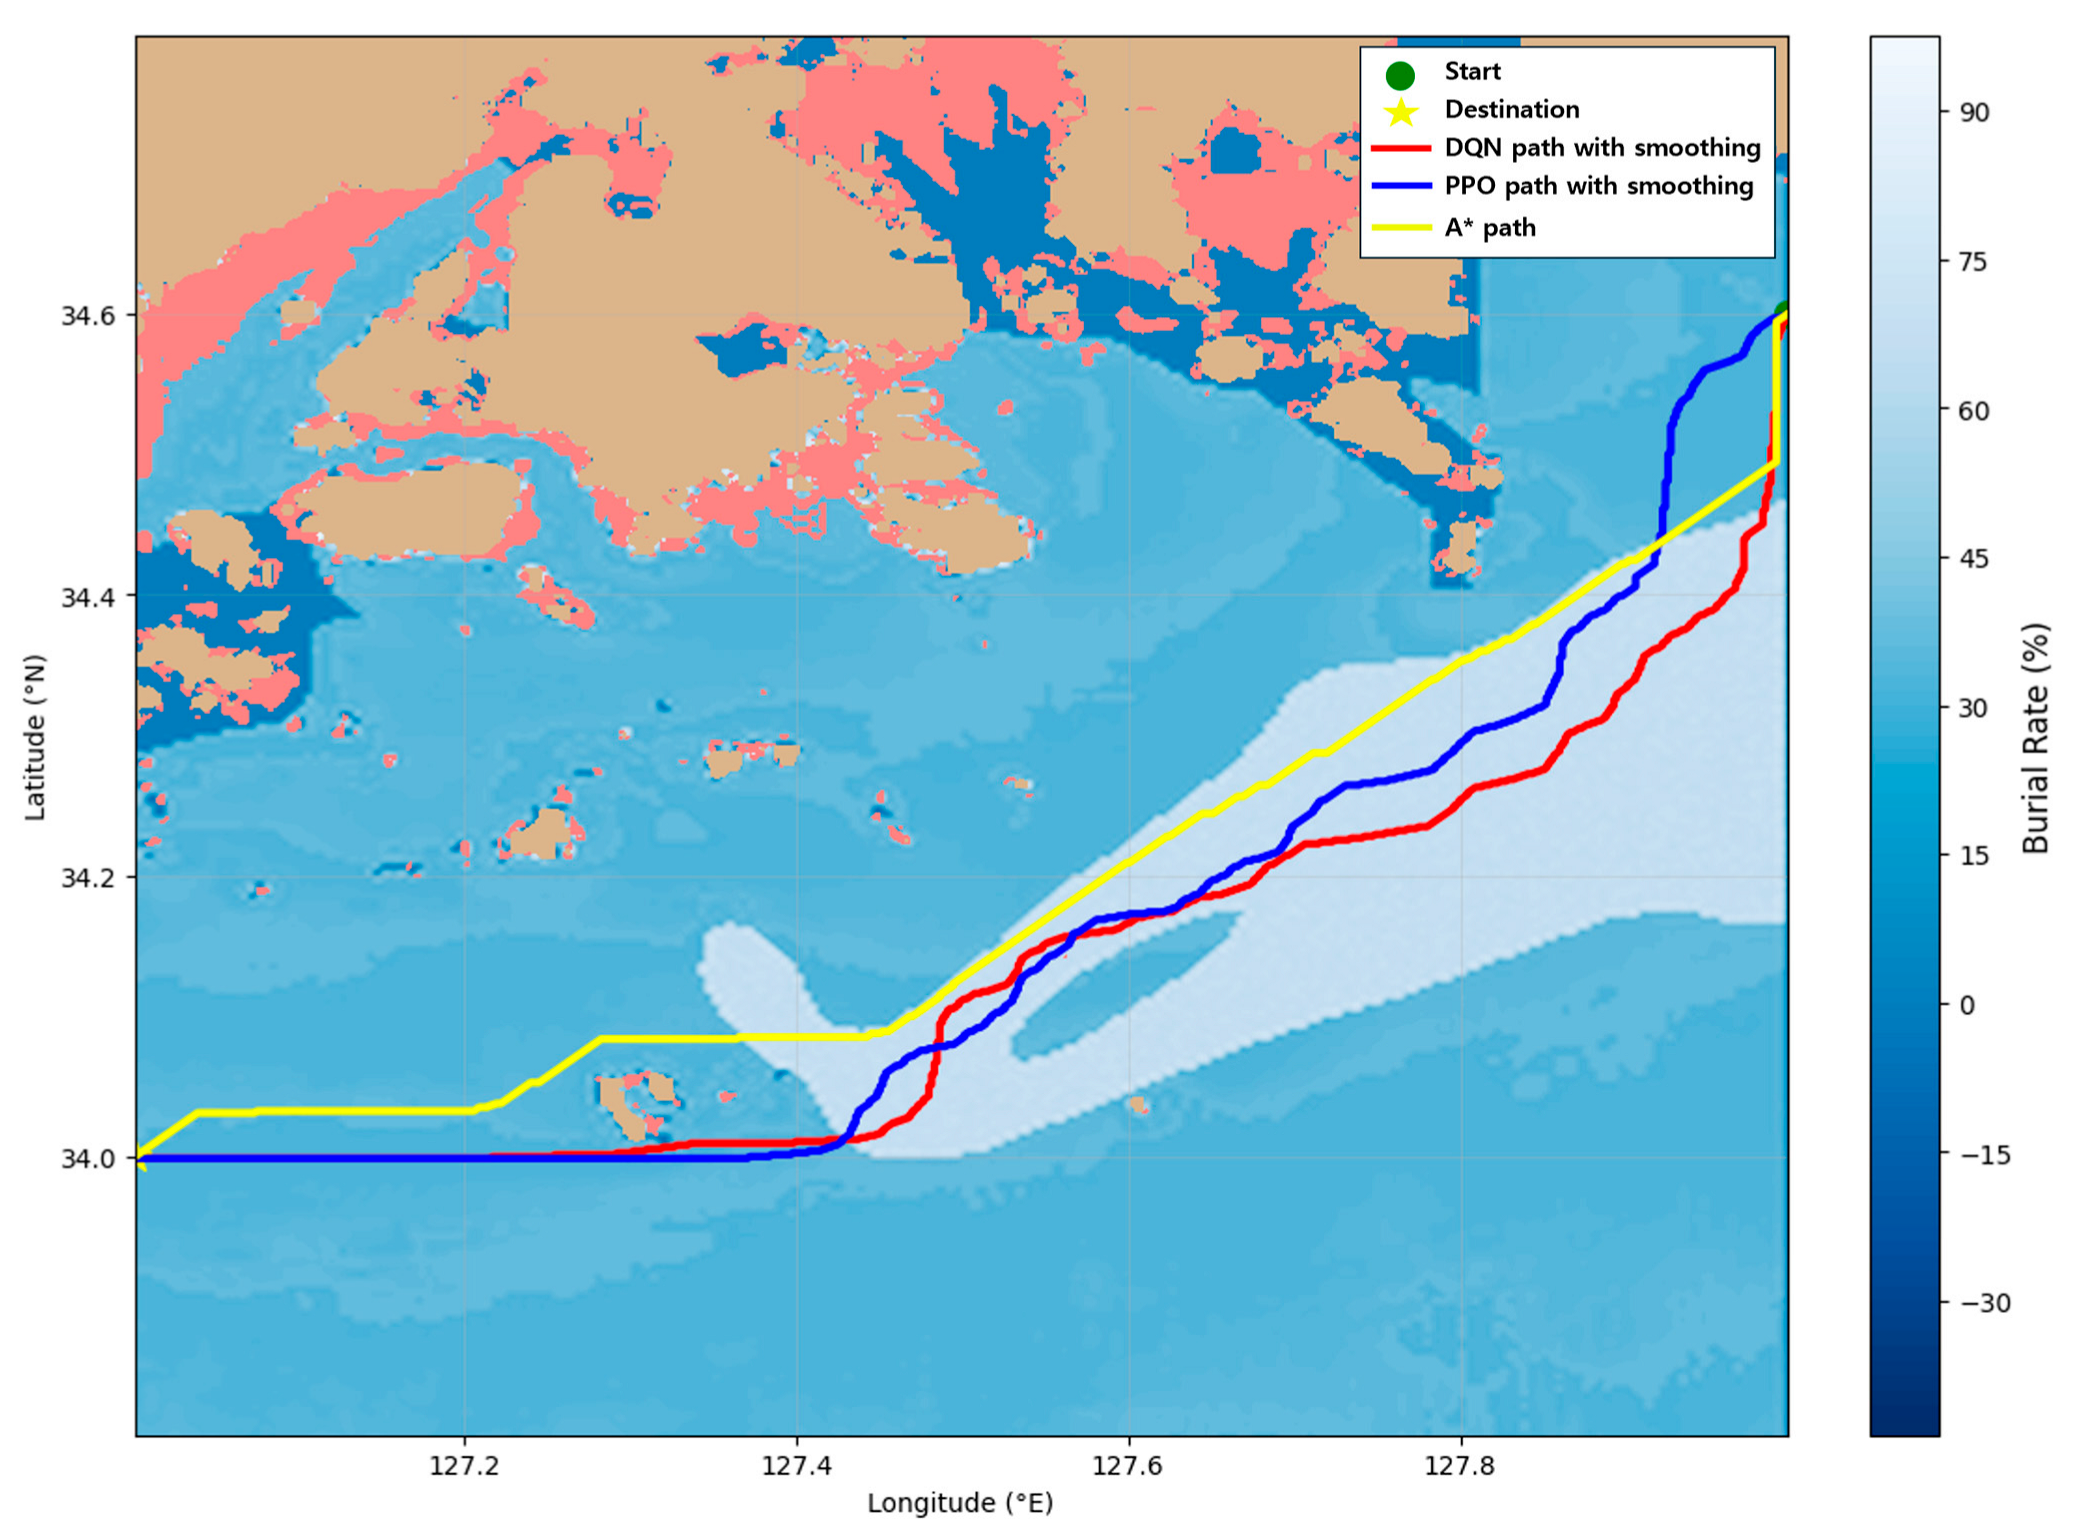
Figure 10, Figure 11 and Figure 12 illustrate the paths generated by the A*, DQN, and PPO algorithms across the three experimental cases, while the average burial rate and travel distance for each path are summarized in Table 6. The characteristics of the generated paths differ depending on the spatial distribution and relative location of high burial rate regions, and the way each algorithm utilizes these regions also varies according to the environmental conditions of each case.
Figure 10.
Path generated by three methods in Case 1.
Figure 11.
Path generated by three methods in Case 2.
Figure 12.
Path generated by three methods in Case 3.
Table 6.
Performance of each method.
In Case 1, high burial rate regions are widely distributed around the starting point and along the straight-line corridor toward the goal. The A* algorithm, which incorporates burial rate information, tends to partially traverse nearby high burial rate regions. However, due to the characteristics of the A* algorithm, A* generates a relatively short trajectory that only partially utilizes these regions within a limited detour range. In contrast, the DQN and PPO algorithms are trained with a reward structure that encourages the active utilization of high burial rate regions. As a result, both algorithms produce more expanded trajectories that include a larger portion of these areas compared to A*. Consequently, their average burial rates exceed that of A*, while the extended travel distance reflects the algorithms’ strategic selection to maximize burial rate gain.
In Case 2, a high burial rate region is located relatively close to the starting point. A* partially passes through this region when it lies near the shortest path but does not significantly modify its trajectory beyond that degree. Thus, although A* does traverse the nearby high burial rate area, it does not exploit it strategically in the same manner as the reinforcement learning algorithms. The DQN and PPO algorithms, like their behavior in Case 1, adjust their paths outward to utilize the high burial rate region more effectively. Both algorithms travel into the high burial rate area before curving toward the goal, producing paths that achieve higher average burial rates than A*. While this results in longer travel distances, it reflects the reinforcement learning objective of maximizing cumulative burial rate reward rather than minimizing distance.
In Case 3, only a small high burial rate patch exists near the starting point, while the major high burial rate region is located much farther away. A* partially utilizes the small nearby region but does not significantly detour to reach the distant high burial rate area. Because the burial rate gain is outweighed by the increased travel distance in its cost evaluation, A* generates a short, nearly straight path toward the goal. As a result, A* yields the lowest average burial rate among the three algorithms, as shown in Table 6. Meanwhile, DQN and PPO identify the distant high burial rate region during exploration and adjust their trajectories toward it due to the reward structure emphasizing burial rate maximization. Consequently, both algorithms generate the largest detours in Case 3, but this also results in increased burial rate performance. Although the travel distances are longer, the burial rate outcome is superior to that of A*.
Overall, both the reinforcement learning-based methods and the A* algorithm generated collision-free and navigationally safe routes. However, with respect to the objectives of maximizing burial rate along the route while minimizing path length, clear differences were observed. The reinforcement learning-based approaches generated appropriate detours that significantly improved the average burial rate without excessively increasing the route length. Specifically, compared with the A* algorithm, DQN achieved improvements in average burial rate ranging from 0.55%p to 8.69%p, while PPO yielded improvements of 2.00%p to 7.46%, depending on the spatial configuration of the burial rate distribution. In contrast, the A* algorithm tended to produce the shortest paths with relatively low average burial rates. This limitation was particularly evident in Case 3, where the A* algorithm failed to resolve the trade-off between burial rate maximization and path length minimization, resulting in routes that were unsuitable for mine-laying operations. These results indicate that the proposed reinforcement learning-based route optimization framework provides superior performance and is more appropriate than the A* algorithm for mine-laying applications.
3.2.3. Execution Times Comparison
Table 7 presents the execution times of the three algorithms. A comparison of the path-generation times shows that the reinforcement learning-based methods (DQN and PPO) achieved significantly faster performance than the traditional search-based A* algorithm. The path-generation time of the DQN model was 0.19 s, and that of the PPO model was 0.21 s, which is approximately 4–5 times faster than the 0.91 s required by the A* algorithm. It should be noted that the reported times for DQN and PPO include both the upscaling process and the path-smoothing procedure.
Table 7.
Execution times of the three algorithms.
This performance difference arises from the structural characteristics of each algorithm. After training is completed, DQN and PPO require only a single neural network forward pass during the path-generation stage, resulting in very low computational complexity and fast execution. In other words, no additional search is performed during path generation; actions are produced directly from the learned policy or Q-function.
In contrast, the A* algorithm must perform a search process over the state space every time a path is generated. Given the large grid size and the high number of navigable states in the maritime environment considered in this study, the computational cost of this search becomes substantial even when heuristics are used. Consequently, A* requires approximately 0.91 s to produce a path, making it considerably slower than the reinforcement learning approaches.
In summary, from the perspective of path-generation speed, reinforcement learning methods (DQN and PPO) demonstrate computational efficiency suitable for real-time navigation and are particularly advantageous in scenarios requiring multiple simulations or repeated path planning.
4. Discussion
This study presented an integrated framework that combines seabed sediment property estimation, mine burial rate modeling, and reinforcement learning-based route optimization to generate effective mine-laying paths. Existing research on mine-laying route planning is extremely limited, and studies that link seabed geotechnical properties, burial rate estimation, and path planning are virtually nonexistent. In this context, the proposed methodology provides meaningful insight into the automation of mine-laying decision-making and establishes a practical foundation for advancing autonomous naval mine-laying systems, particularly by enabling the generation of mine-laying routes that guarantee the concealment effectiveness of buried mines.
The contributions of this study can be summarized as follows.
- Development of an IMPACT35-based initial mine burial rate estimation simulator and integration into a reinforcement learning-based route planning framework.
- A multi-channel state representation with CNN-based DQN and PPO enabling unified learning across multiple mine-laying scenarios.
- Superior mine-laying route optimization performance over the A* algorithm in terms of burial rate maximization and route-generation efficiency.
First, bulk density and shear strength were estimated using sediment type and mean grain size, and a burial rate distribution was generated using an IMPACT35-based initial mine burial rate estimation simulator. This simulator is a physics-based hydrodynamic and impact dynamics modeling framework developed to estimate the burial behavior of bottom-contact mines, and its reliability has been supported through prior studies. By embedding this burial rate information into the reinforcement learning reward design, the agent was able to learn routes that maximize mine burial effectiveness.
Second, a multi-channel state representation—incorporating bathymetry, navigable regions, burial rate distribution, obstacles, and goal information—was constructed, and CNN-based DQN and PPO architectures were employed to approximate policies suitable for realistic marine environments. Through these constructions, we designed a reinforcement learning framework that enables simultaneous learning for multiple scenarios through one learning.
Third, through comparative experiments across three spatially distinct cases, the study demonstrated that the reinforcement learning models generated mine-laying routes that are more suitable than those produced by the A* algorithm, as they simultaneously account for collision avoidance, burial rate maximization, and route length minimization, regardless of the spatial configuration of high burial regions.
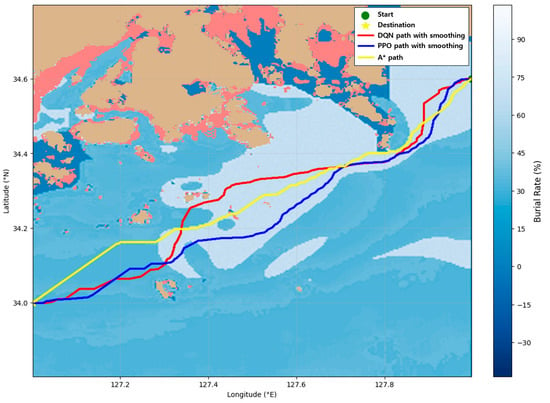
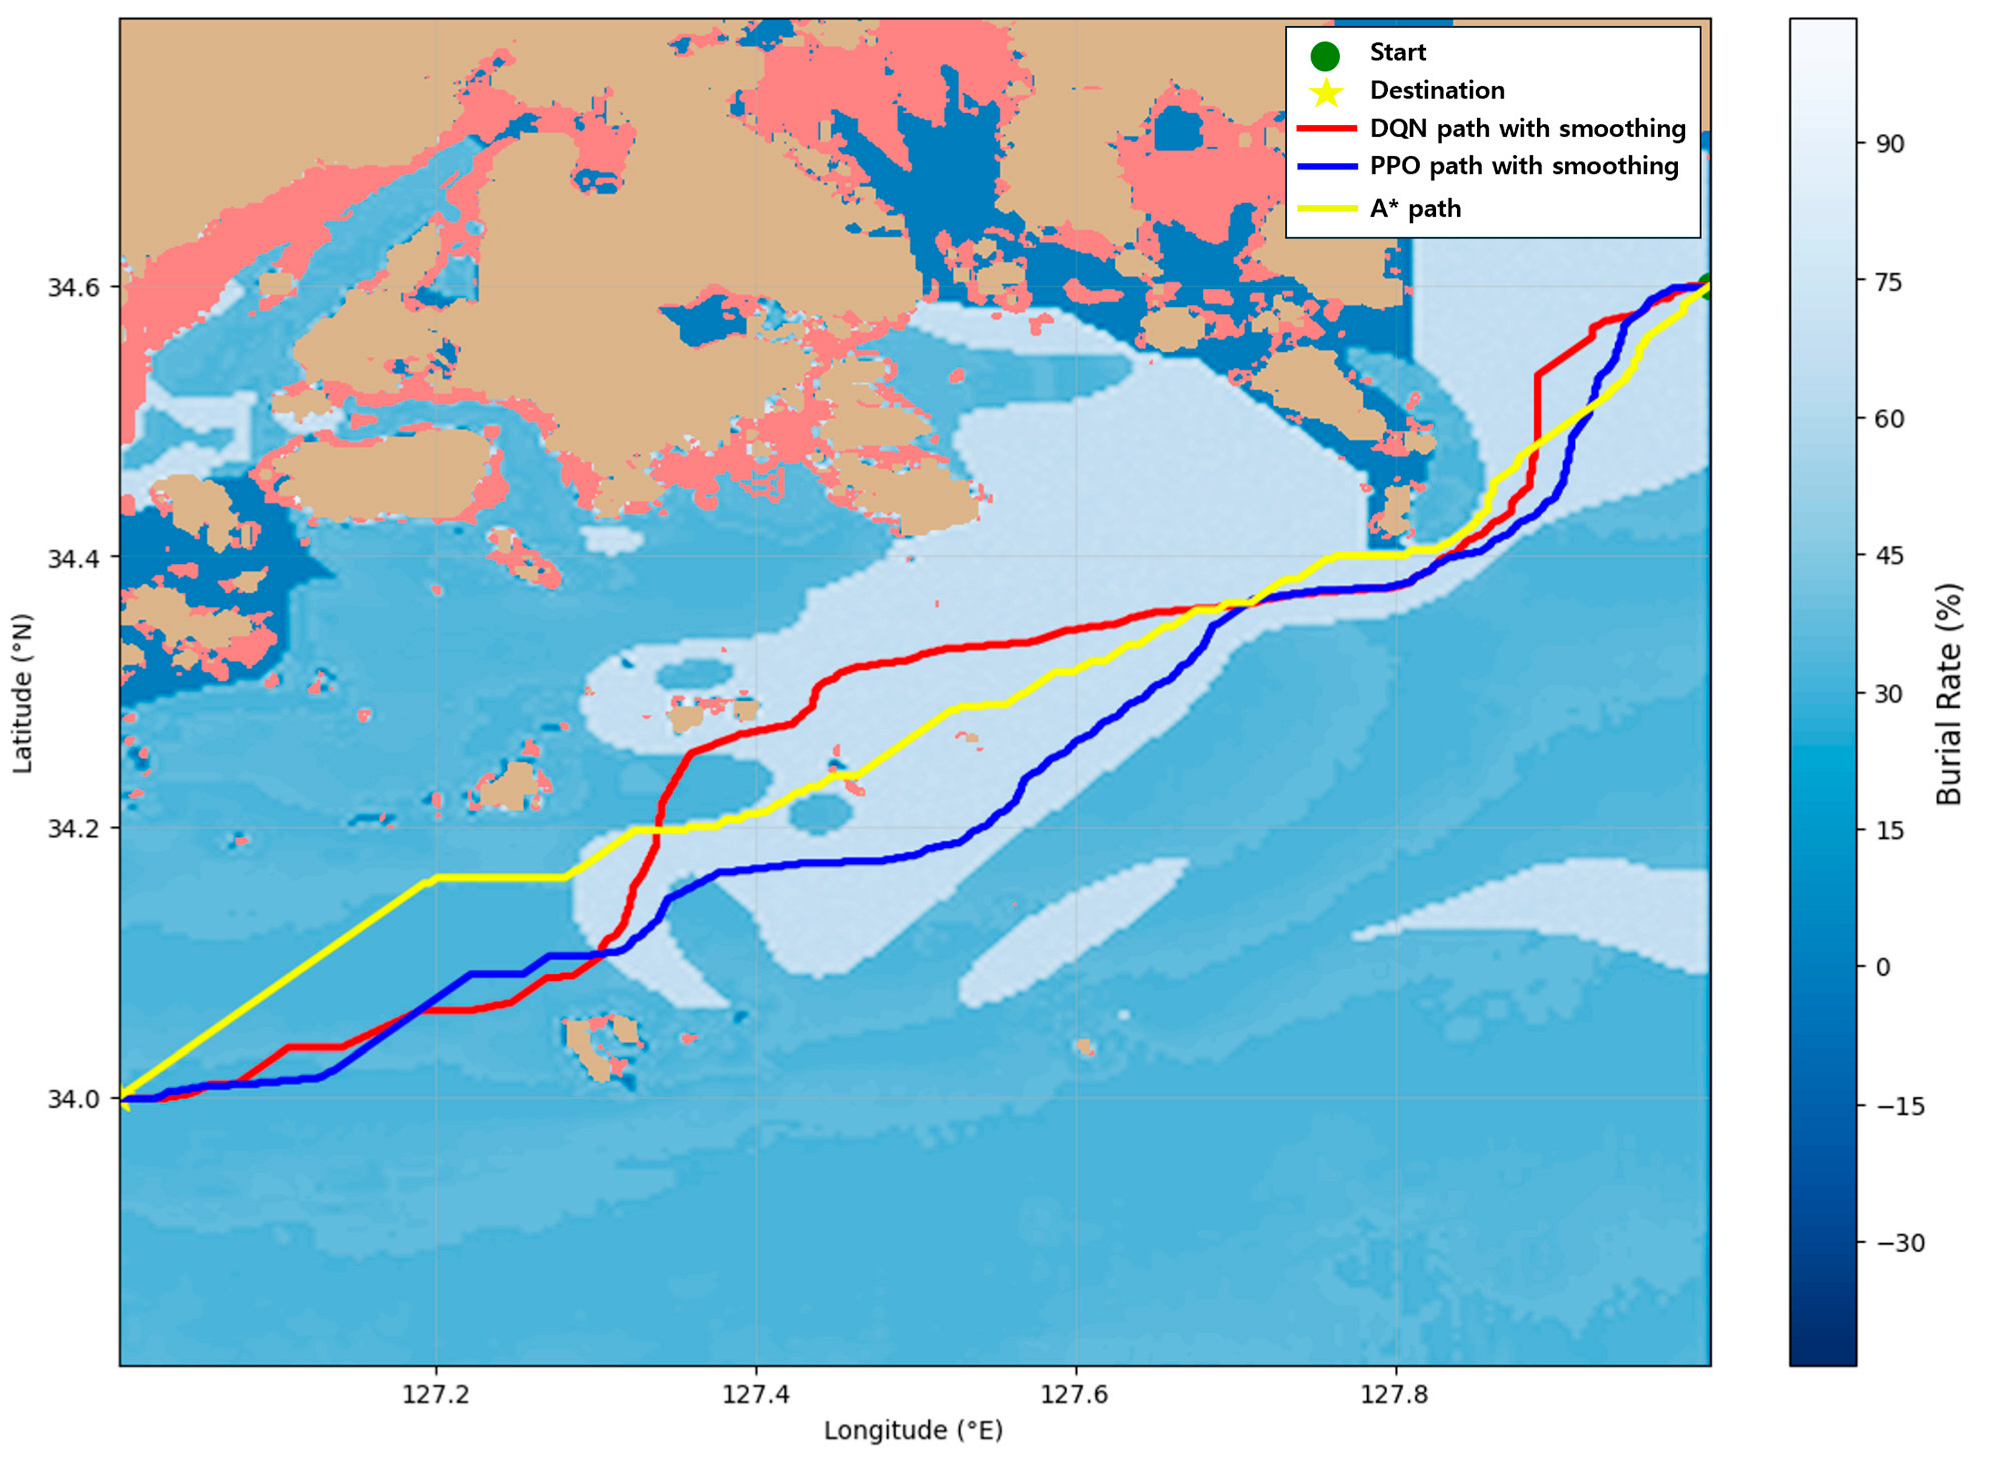
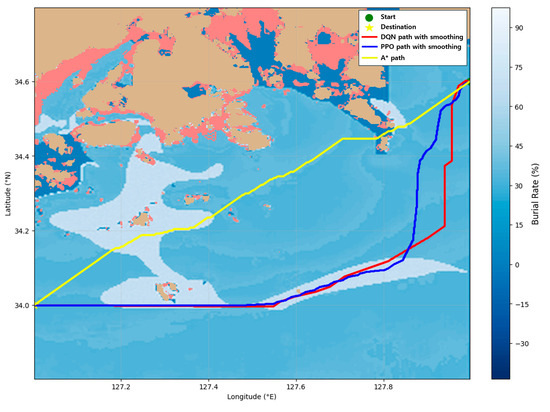
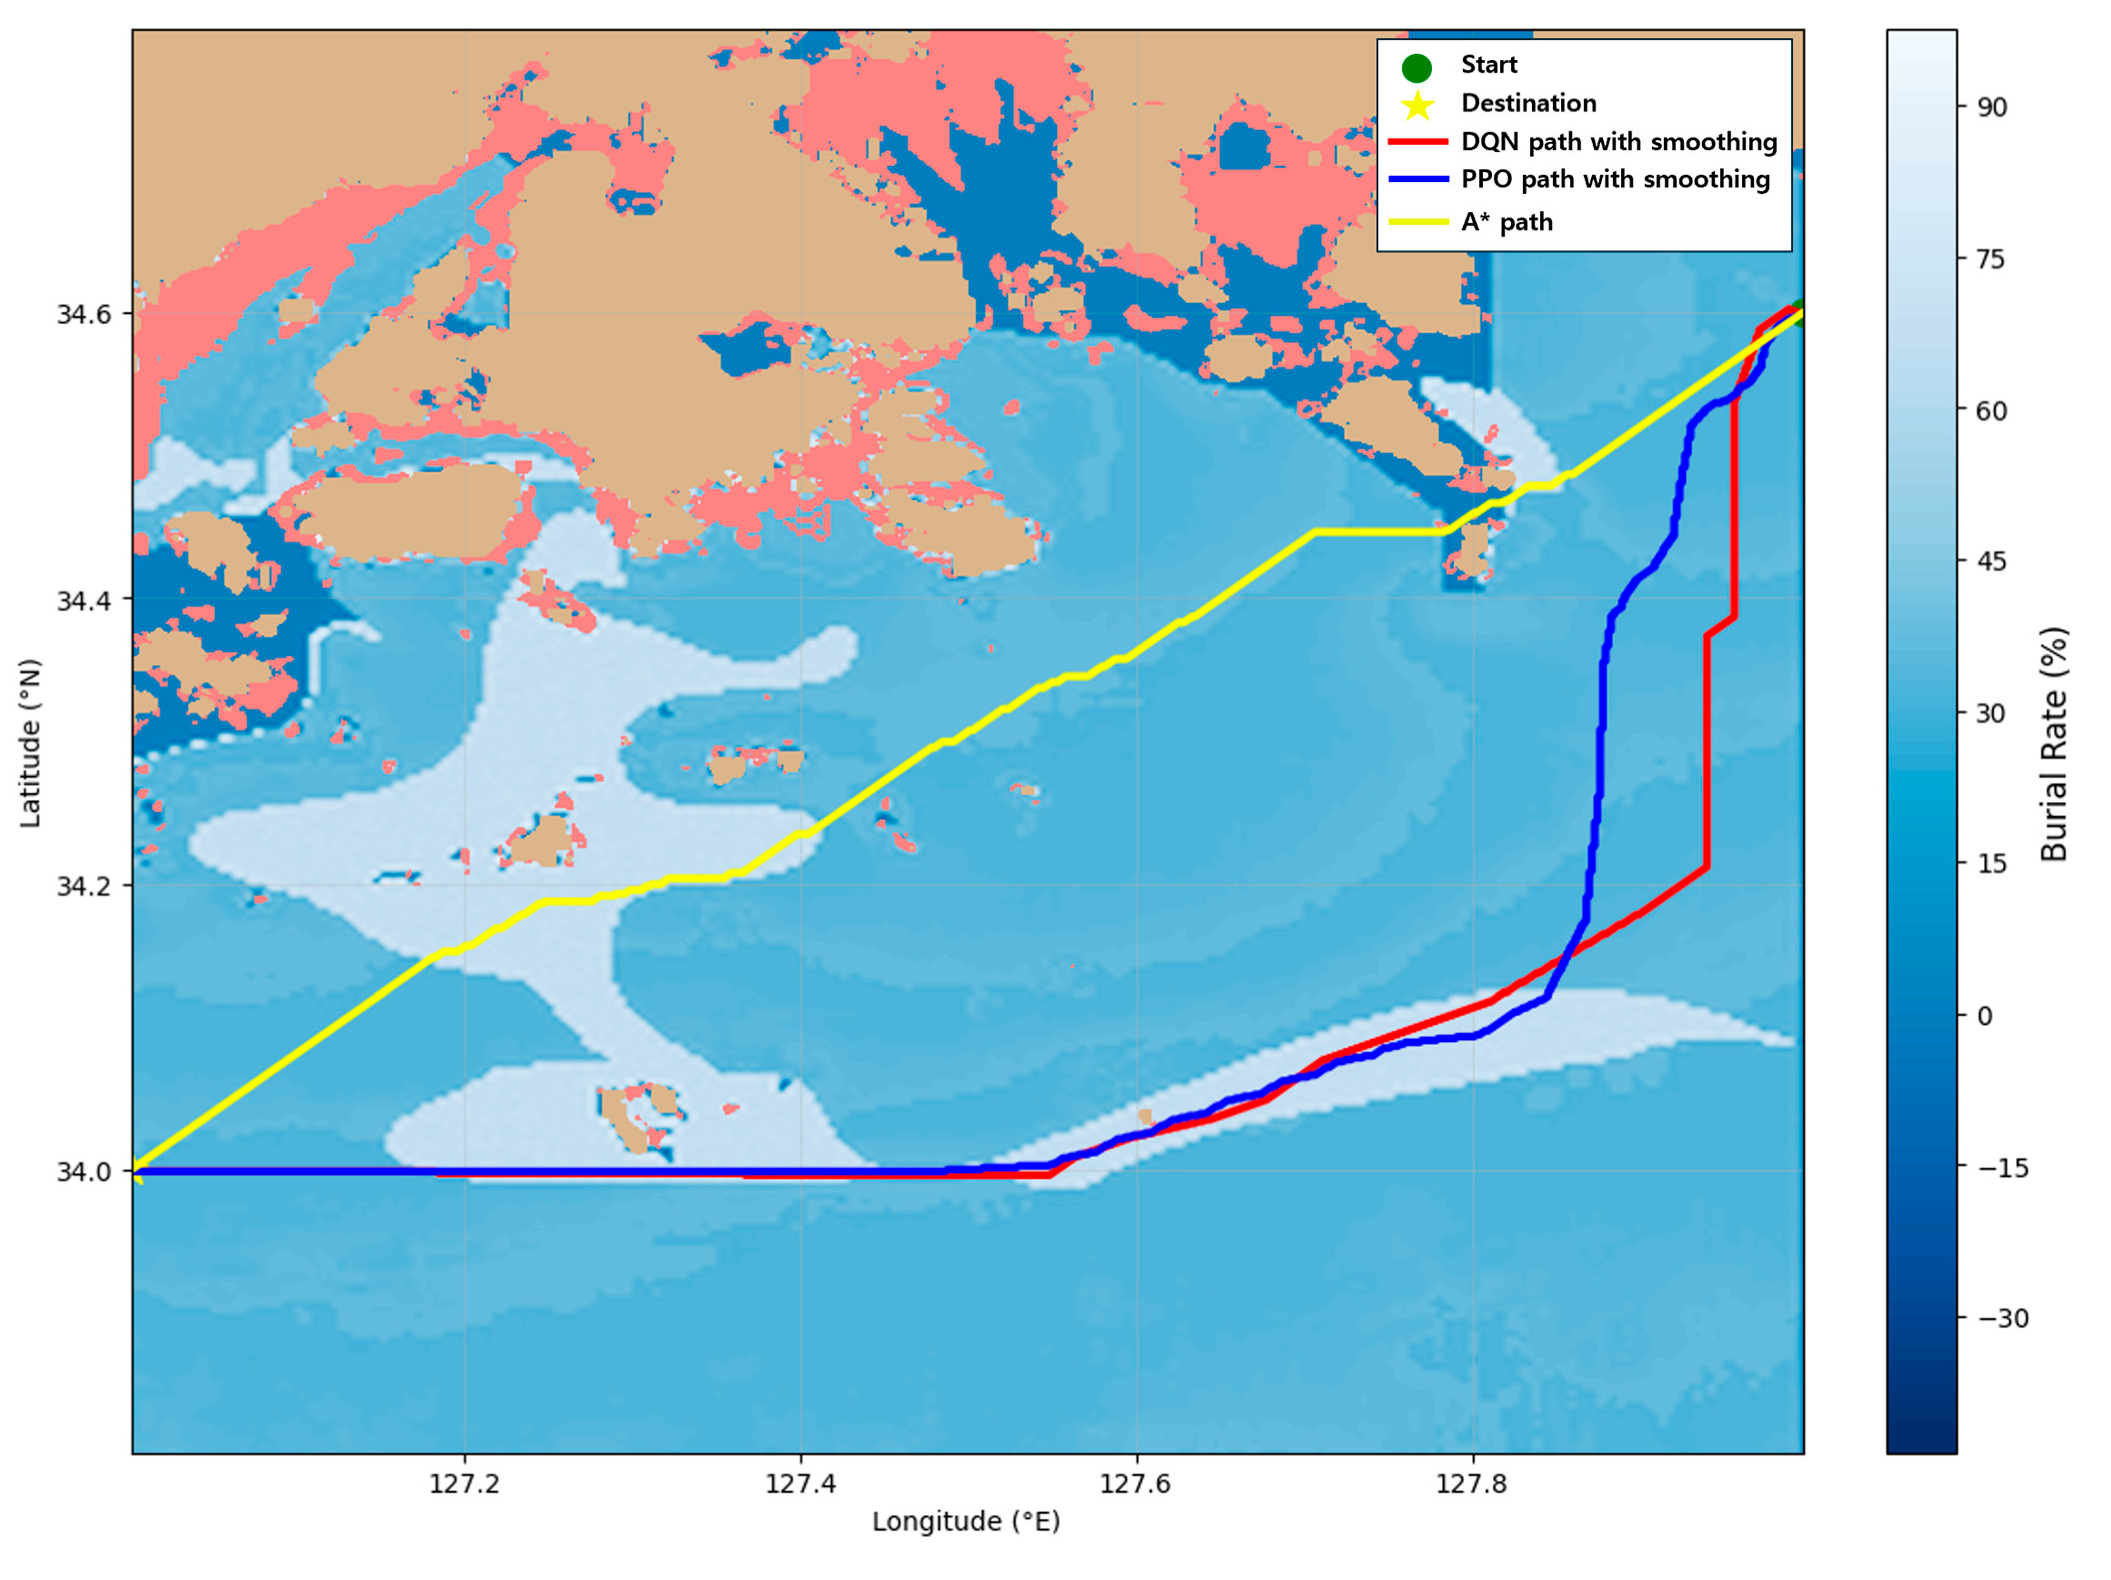
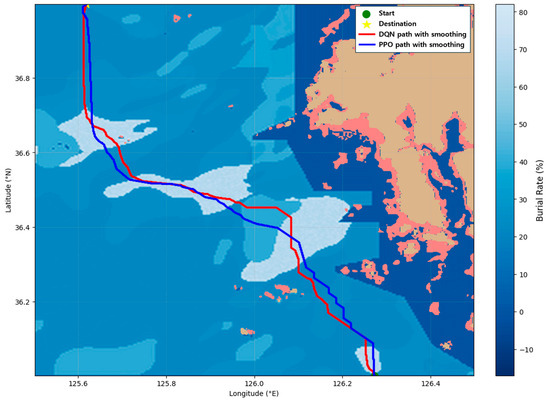
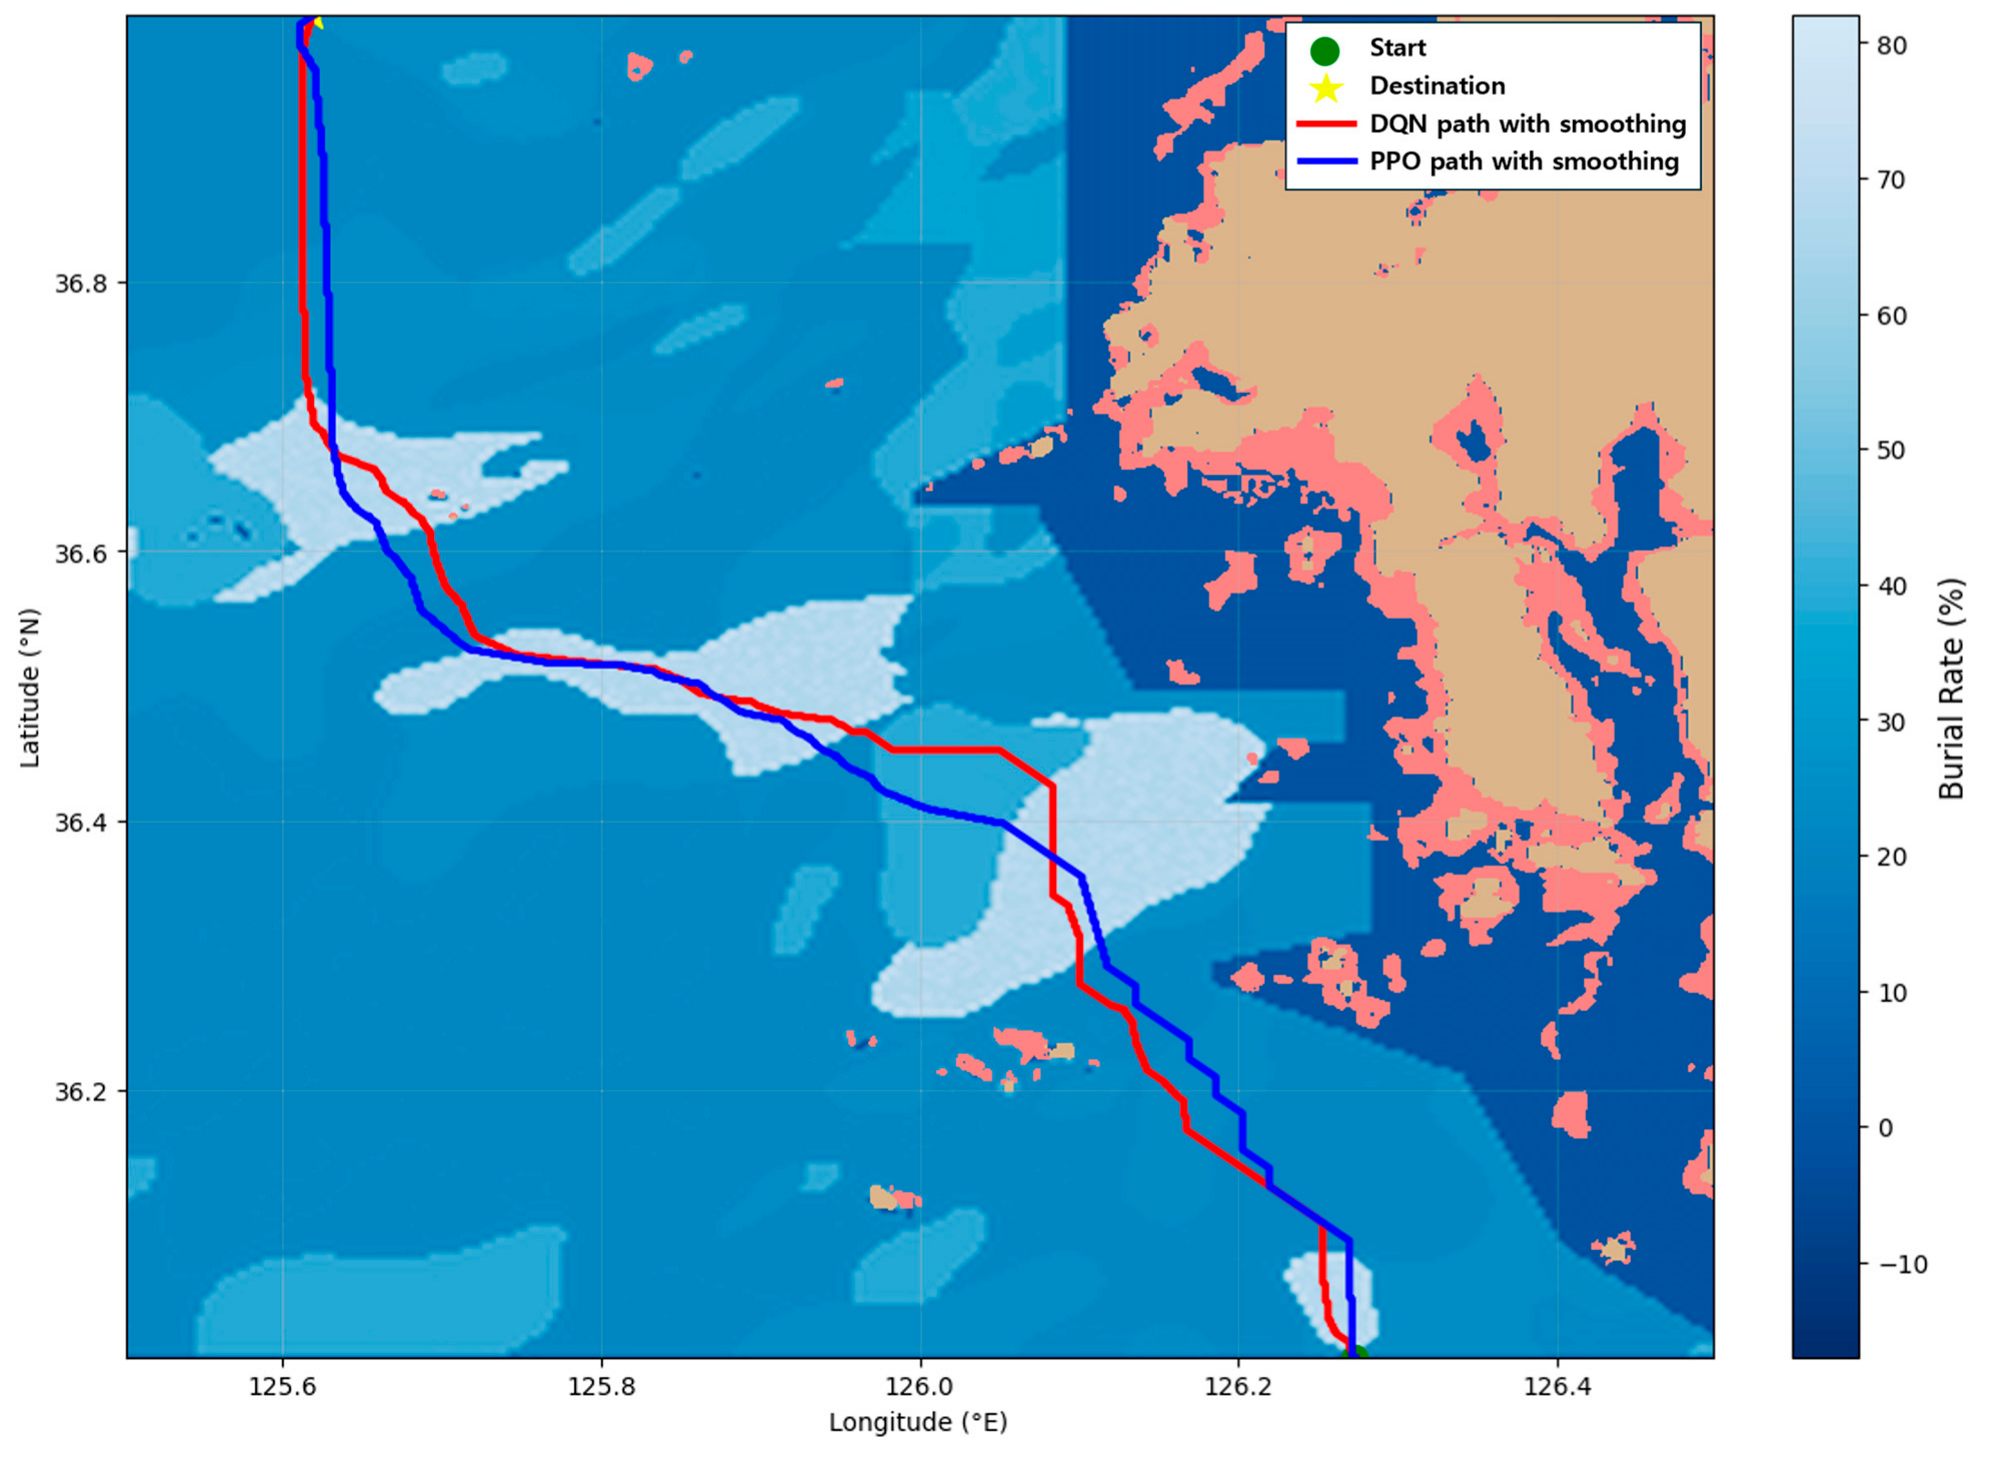
These results indicate that the proposed framework has potential generalizability and can be extended to other coastal regions. To further verify this generalizability, an additional experiment was conducted in a separate coastal area located in the western waters of the Republic of Korea. As illustrated in Figure 13, both methods successfully generated optimal mine-laying routes. This supplemental result reinforces that the proposed reinforcement learning-based approach is robust across geographically diverse coastal environments.
Figure 13.
Path generated by DQN and PPO in additional experiment.
Despite these contributions, several limitations remain. First, due to the limited availability of high-resolution seabed sediment data, the estimated bulk density and shear strength could not fully represent true geotechnical conditions, and direct validation against real-world measurements was not possible. Future work should incorporate actual geotechnical data or more detailed sediment databases to improve estimation accuracy. Second, although burial rate was the primary optimization objective in this study, real mine-laying missions require simultaneous consideration of additional factors such as fuel consumption, mission duration, operational priorities, and environmental conditions. Therefore, future research should expand the problem definition to account for these practical mission constraints. Finally, as the spatial domain or environmental complexity increases, the size of the state space grows significantly, leading to higher computational demands during training. Although down sampling was used to mitigate this issue, further improvements in state representation and model efficiency will be necessary for scaling the method to broader operational regions.
In summary, this study demonstrated the feasibility of integrating seabed geotechnical modeling with reinforcement learning for automated mine-laying route planning. While limitations remain, the proposed framework offers strong computational efficiency, adaptability to varying environmental conditions, and practical relevance to naval autonomy research. With additional refinement and expansion, it has the potential to evolve into a foundational technology for future autonomous mine-laying systems.
5. Conclusions
This study presented an integrated route planning framework for naval mine-laying that combines initial mine burial rate estimation with reinforcement learning-based optimization. Sediment bulk density and shear strength were estimated from sediment type and grain size information, and an IMPACT35-based simulator was developed to generate spatially varying initial burial rate distributions. These burial rate maps were incorporated into CNN-based DQN and PPO models to produce mine-laying routes that exploit regions with high burial potential. Across three experimental cases, the reinforcement learning methods consistently produced mine-laying routes that were more suitable for the multi-objective mine-laying route optimization and faster route-generation times than the A* algorithm, with a single trained policy being applicable across multiple spatial scenarios without scenario-specific retraining, demonstrating their effectiveness for generating concealed and tactically meaningful mine-laying paths.
Future research will expand the framework to reflect more realistic mission requirements, including factors such as fuel consumption, mission duration, operational risk, and tactical constraints. In addition, more detailed geotechnical datasets or in situ measurements will be incorporated to improve burial rate estimation accuracy. Finally, integrating real-time or forecasted METOC (meteorological and oceanographic) data will enable the development of a dynamic mine-laying system capable of adapting to changing ocean conditions.
Author Contributions
Conceptualization, S.H.K. and Y.S.P.; methodology, S.H.K.; validation, S.H.K.; formal analysis, S.H.K.; investigation, S.H.K.; resources, S.W.K.; data curation, S.H.K.; writing—original draft, S.H.K.; writing—review and editing, S.H.K. and S.W.K.; visualization, S.H.K.; supervision, S.W.K.; project administration, S.W.K.; funding acquisition, S.W.K. All authors have read and agreed to the published version of the manuscript.
Funding
This research was supported by the Ministry of Science and ICT (MSIT), Republic of Korea, through the ICT Challenge and Advanced Network of HRD (ICAN) program (IITP-2025-RS-2022-00156345), under the supervision of the Institute for Information and Communications Technology, Planning and Evaluation (IITP) (25%). Also, it has been funded by the Industrial Strategic Technology Development Program-Development of a remote controlled marine fire-fighting system using autonomous ship technology (KEIT-20025014) for the Ministry of Trade, Industry & Energy (MOTIE, Korea) (5%). Additionally, this research was supported by the “Regional Innovation System & Education (RISE)” through the Seoul RISE Center, funded by the Ministry of Education (MOE) and the Seoul Metropolitan Government (2025-RISE-01-019-04) (45%). Finally, this research has received partial support from the Korea Institute of Marine Science & Technology Promotion (KIMST), funded by the Ministry of Oceans and Fisheries (RS-2023-00256127) (25%).
Data Availability Statement
The original contributions presented in this study are included in the article. Further inquiries can be directed to the corresponding author.
Conflicts of Interest
The authors declare no conflicts of interest.
References
- The U.S. Navy’s Underfunded Mine Warfare Arsenal Is a Problem. Available online: https://nationalsecurityjournal.org/the-u-s-navys-underfunded-mine-warfare-arsenal-is-a-problem/ (accessed on 21 November 2025).
- Invisible Blockades and Strategic Coercion. Available online: https://warontherocks.com/2022/11/invisible-blockades-and-strategic-coercion/ (accessed on 21 November 2025).
- In the Navy: The Role of Advanced Sea Mines in Future Conflicts. Available online: https://www.marinelink.com/news/navythe-role-advanced-sea-mines-future-503977 (accessed on 21 November 2025).
- Pan, W.; Wang, Y.; Lv, B.; Wang, L.; Li, L. Research on Multi-UUV Mission Planning for Mine Countermeasures Based on Preferred Multi-Objective Optimization. Ain Shams Eng. J. 2024, 15, 103006. [Google Scholar] [CrossRef] [Scilit]
- Cimino, V.; Campagnaro, F.; Zorzi, M. A Mine Countermeasure System with Low-Cost AUV Swarms. In Proceedings of the 17th International Conference on Underwater Networks & Systems (WUWNet ’23), Shenzhen, China, 24–26 November 2024; pp. 1–5. [Google Scholar] [CrossRef] [Scilit]
- Hożyń, S. A Review of Underwater Mine Detection and Classification in Sonar Imagery. Electronics 2021, 10, 2943. [Google Scholar] [CrossRef] [Scilit]
- Seidel, M.; Frey, T.; Greinert, J. Underwater UXO Detection Using Magnetometry on Hovering AUVs. J. Field Robot. 2023, 40, 848–861. [Google Scholar] [CrossRef] [Scilit]
- Fu, Q.; Dong, C.; Wang, K.; He, Q.; Gu, X.; Liu, J.; Zhu, Y.; Duan, J. Underwater Target Laser Polarization Suppression Scattering Detection Technology and Verification. PLoS ONE 2024, 19, e0305929. [Google Scholar] [CrossRef] [Scilit]
- Munteanu, D.; Moina, D.; Zamfir, C.G.; Petrea, Ș.M.; Cristea, D.S.; Munteanu, N. Sea Mine Detection Framework Using YOLO, SSD and EfficientDet Deep Learning Models. Sensors 2022, 22, 9536. [Google Scholar] [CrossRef] [Scilit]
- Sun, Y.; Zheng, H.; Zhang, G.; Ren, J.; Xu, H.; Xu, C.; Sun, Y.; Zheng, H.; Zhang, G.; Ren, J.; et al. DP-ViT: A Dual-Path Vision Transformer for Real-Time Sonar Target Detection. Remote Sens. 2022, 14, 5807. [Google Scholar] [CrossRef] [Scilit]
- DSA 2024: Türkiye Presents Malaman Smart Naval Mine. Available online: https://www.armyrecognition.com/news/navy-news/2024/dsa-2024-tuerkiye-presents-malaman-smart-naval-mine (accessed on 21 November 2025).
- O’Boyle, R.J. Sea Mine Burial Prediction for Naval Mine Countermeasures Mission Planning. Master’s Thesis, University of Delaware, Newark, DE, USA, 2019. [Google Scholar]
- Chu, P.C.; Allen, C.; Fleischer, P. Non-Cylindrical Mine Drop Experiment. In Proceedings of the International Symposium on Technology and the Mine Problem, Monterey, CA, USA, 2–4 May 2006. [Google Scholar]
- Chu, P.C.; Fan, C. Prediction of Falling Cylinder Through Air-Water-Sediment Columns. J. Appl. Mech. 2005, 73, 300–314. [Google Scholar] [CrossRef] [Scilit]
- Chu, P.C.; Fan, C.; Evans, A.D.; Gilles, A. Triple Coordinate Transforms for Prediction of Falling Cylinder Through the Water Column. J. Appl. Mech. 2004, 71, 292–298. [Google Scholar] [CrossRef] [Scilit]
- Chen, P.; Huang, Y.; Papadimitriou, E.; Mou, J.; van Gelder, P. Global Path Planning for Autonomous Ship: A Hybrid Approach of Fast Marching Square and Velocity Obstacles Methods. Ocean Eng. 2020, 214, 107793. [Google Scholar] [CrossRef] [Scilit]
- Zhao, S.; Zhao, S.; Zhao, S.; Zhao, S. Ship Global Traveling Path Optimization via a Novel Non-Dominated Sorting Genetic Algorithm. J. Mar. Sci. Eng. 2024, 12, 485. [Google Scholar] [CrossRef] [Scilit]
- Lee, H.-T.; Kim, M.-K. Optimal Path Planning for a Ship in Coastal Waters with Deep Q Network. Ocean Eng. 2024, 307, 118193. [Google Scholar] [CrossRef] [Scilit]
- Shen, Y.; Liao, Z.; Chen, D.; Shen, Y.; Liao, Z.; Chen, D. Differential Evolution Deep Reinforcement Learning Algorithm for Dynamic Multiship Collision Avoidance with COLREGs Compliance. J. Mar. Sci. Eng. 2025, 13, 596. [Google Scholar] [CrossRef] [Scilit]
- Bosboom, J.; Stive, M.J.F. Coastal Dynamics; TU Delft OPEN Publishing: Delft, The Netherlands, 2023; pp. 257–274. [Google Scholar]
- Void Ratio. Available online: https://geotechdata.info/parameter/void-ratio (accessed on 21 November 2025).
- Ogolo, N.A.; Akinboro, O.G.; Inam, J.E.; Akpokere, F.E.; Onyekonwu, M.O. Effect of Grain Size on Porosity Revisited; 2015; p. SPE-178296-MS. Available online: https://onepetro.org/SPENAIC/proceedings-abstract/15NAIC/15NAIC/SPE-178296-MS/184442 (accessed on 21 November 2025).
- Terzaghi, K. Theoretical Soil Mechanics; Wiley: New York, NY, USA, 1943; Chapter 2; pp. 19, 24–25. [Google Scholar]
- Angle of Friction. Available online: https://geotechdata.info/parameter/angle-of-friction (accessed on 21 November 2025).
- Cha, M.; Cho, G.-C. Shear Strength Estimation of Sandy Soils Using Shear Wave Velocity. Geotech. Test. J. 2007, 30, 484–495. [Google Scholar] [CrossRef] [Scilit]
- Stark, T.D.; Choi, H.; Lee, C. Case Study of Undrained Strength Stability Analysis for Dredged Material Placement Areas. J. Waterw. Port Coast. Ocean Eng. 2009, 135, 91–99. [Google Scholar] [CrossRef] [Scilit]
- Hussein, A.A.A.; Zhao, L.; Al-Masgari, A.A.-S.A.; Handoyo, H. Shear Strength Characteristics of Marine Sediments: The Influences of Lithofacies and Sedimentological Environment. Mar. Geophys. Res. 2024, 45, 14. [Google Scholar] [CrossRef] [Scilit]
- Mnih, V.; Kavukcuoglu, K.; Silver, D.; Graves, A.; Antonoglou, I.; Wierstra, D.; Riedmiller, M. Playing Atari with Deep Reinforcement Learning. arXiv 2013, arXiv:1312.5602. [Google Scholar] [CrossRef] [Scilit]
- Schulman, J.; Wolski, F.; Dhariwal, P.; Radford, A.; Klimov, O. Proximal Policy Optimization Algorithms. arXiv 2017, arXiv:1707.06347. [Google Scholar] [CrossRef] [Scilit]

Disclaimer/Publisher’s Note: The statements, opinions and data contained in all publications are solely those of the individual author(s) and contributor(s) and not of MDPI and/or the editor(s). MDPI and/or the editor(s) disclaim responsibility for any injury to people or property resulting from any ideas, methods, instructions or products referred to in the content. |
© 2025 by the authors. Licensee MDPI, Basel, Switzerland. This article is an open access article distributed under the terms and conditions of the Creative Commons Attribution (CC BY) license.