


Abstract
Addressing the current situation where in situ observations in the Arctic primarily target physical and a few biogeochemical parameters, leaving a gap in systematic direct observation of biological populations beneath sea ice, this study developed a polar ice-based ecological observation buoy system. Building upon conventional meteorological and oceanographic hydrographic sensors, this system innovatively integrates an underwater imaging module and key technologies such as machine learning-based automatic fish target recognition and reliable dual-channel satellite data transmission in polar environments. Its successful deployment during the 2025 15th Chinese National Arctic Research Expedition verified the system’s stability. During the initial one-month operation period (designed for a monitoring cycle of not less than one year), the data return rates for conventional and image data reached 100% and 96.8%, respectively, achieving quasi-real-time continuous observation of physical and ecological parameters at the air–sea interface in the Arctic Ocean, and it is capable of acquiring not only physical parameters but also visual observations of under-ice fauna. The system successfully acquired and transmitted images containing suspected biological targets and reference objects, providing the first in situ, image-based biological observation dataset for the central Arctic Ocean. This work establishes a new methodological capability for direct ecological monitoring, offering essential equipment support for quantifying biological presence, studying population dynamics, and informing evidence-based polar ecosystem governance.
1. Introduction
Against the backdrop of global change, significant alterations have occurred in the polar ecological environment, with notable ecosystem shifts in some regions. Ecological governance has become a new trend in international polar management. The International Arctic Buoy Programme (IABP), formally initiated in 1991 and led by circumpolar nations like the United States and Canada, established an ice buoy observation network in the Arctic Ocean. This network primarily aims to collect physical parameters such as temperature, salinity, and pressure from the atmosphere, sea ice, and upper ocean, serving the study of sea ice thermodynamics, dynamics, and climate change [1,2,3,4,5]. Since China’s first Arctic scientific expedition in 1999, a total of 15 expeditions have been completed by 2025. Relying on various buoy systems, China has accumulated rich data in meteorological, sea ice, and upper ocean physical observations [5,6,7,8], with its observational parameter system being synergistic with the IABP network.
However, whether in IABP or China’s existing Arctic buoy observations, the sensor combinations primarily focus on environmental physical parameters and basic biogeochemical indicators (e.g., chlorophyll, dissolved oxygen). Direct observation of sub-ice biological population distribution, behavior, and dynamics—crucial for understanding the rapidly changing Arctic ecosystem—especially long-term, in situ, and visual monitoring capabilities, remains a gap in existing buoy observation systems [9]. Systematic observation of sub-ice biological populations is still in its infancy. Existing ecological monitoring methods largely rely on techniques such as environmental DNA (eDNA) [10,11], Autonomous Underwater Vehicles (AUVs) [12], and underwater gliders [13] for indirect biodiversity assessment. However, eDNA cannot provide direct visual information such as morphology and behavior and suffers from spatiotemporal ambiguity; AUVs and similar platforms struggle with long-term continuous monitoring at fixed points; furthermore, existing observations primarily depend on polar research vessels with limited spatiotemporal coverage [14]. Coupled with technical bottlenecks such as energy supply, sensor stability, and remote data transmission, despite some data accumulation, a long-term, unattended, systematic automated observation system has yet to be established [15,16,17,18,19]. Therefore, developing long-term automated ecological observation equipment suitable for Arctic waters and capable of integrating visual monitoring functions is key to deepening scientific understanding of the Arctic and supporting ecological protection, and is the core motivation of this research.
Based on this, this study developed a polar ice-based ecological observation buoy system. Innovating beyond conventional meteorological and hydrological observations by integrating an underwater imaging module, the system aims to achieve direct visual monitoring of shallow, active organisms (such as fish) beneath the ice in the central Arctic Ocean, obtaining ecological information like their occurrence patterns and abundance changes, while simultaneously correlating environmental parameters. Specifically, the system design covers the water column from 0 to 200 m beneath the ice, encompassing key biogeochemical active layers such as the euphotic zone and nutrient clines, while also considering the engineering reliability of the mooring system. The system’s core objectives include the following: (1) multi-layer synchronous observation, entailing continuous vertical profile measurements of the atmospheric boundary layer and the water column within 200 m under the ice; (2) multi-parameter acquisition, involving synchronous collection of various environmental elements, including physical (temperature, salinity, depth, meteorology), chemical (dissolved oxygen), bio-optical (chlorophyll), and biological visual data; and (3) quasi-real-time data return, wherein observation data collected at fixed intervals are transmitted back via satellite link within minutes to support near-real-time analysis. This system will provide essential field data and equipment support for developing polar biological population density inversion algorithms and conducting operational monitoring of key populations, contributing to polar marine protection and international governance.
2. System Overview
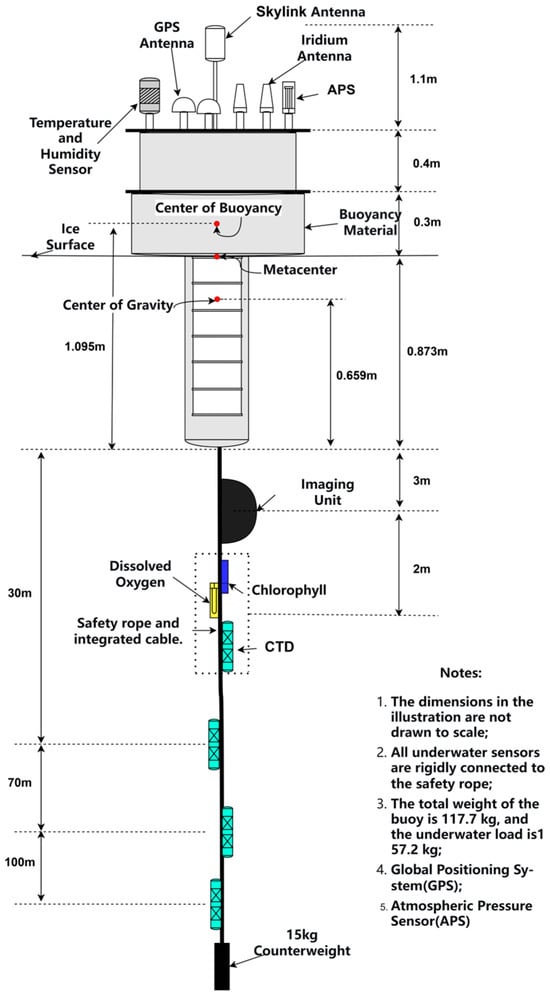
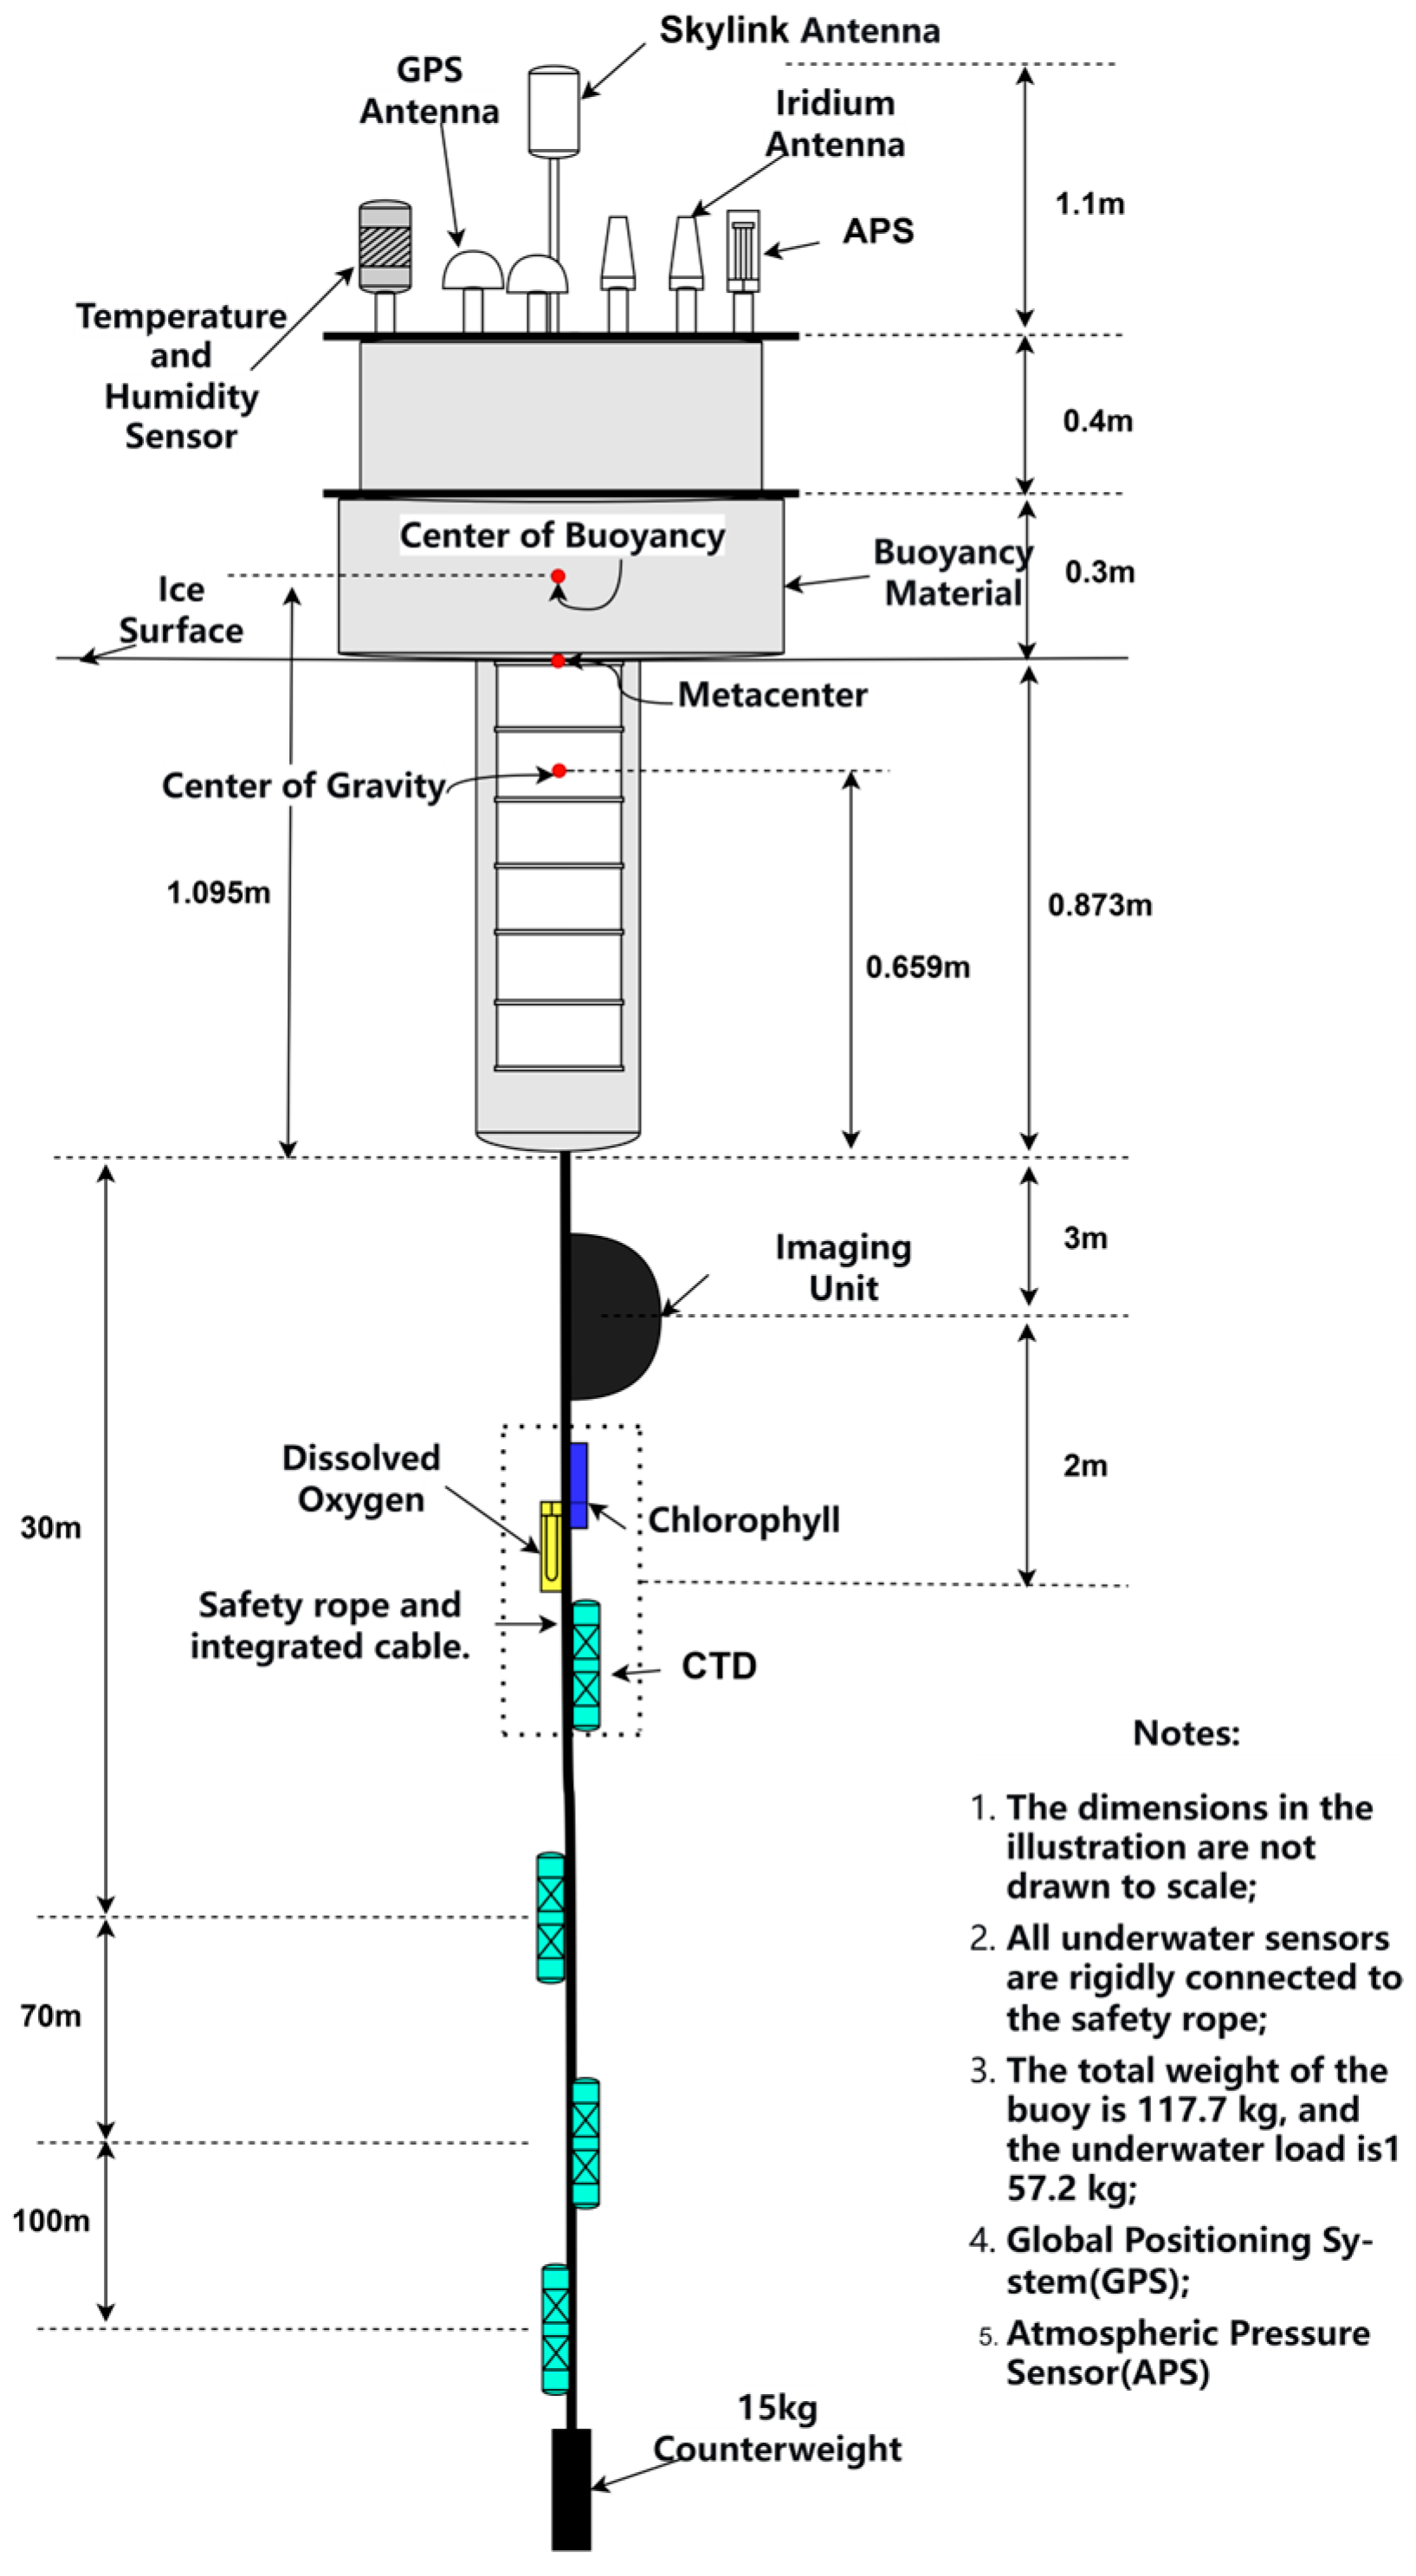
The ice-based ecological observation buoy mainly comprises the buoy body, a meteorological observation module, a chlorophyll module, a dissolved oxygen module, a CTD (Conductivity, Temperature, Depth) module, and an imaging module, as shown in Figure 1. Beyond basic meteorological and hydrological sensors, the core innovation lies in the addition of an underwater imaging module to enable direct observation of biological entities; chlorophyll and dissolved oxygen sensors were also selected to monitor key biogeochemical processes. Considering the energy constraints of year-round operation, the system consciously omitted sensors for nitrate, photosynthetically active radiation (PAR), pH, etc., prioritizing the sustained stability of core functions. Compared to existing Arctic buoys focusing mainly on physical observations, the fundamental advantage of this system lies in achieving in situ synchronous acquisition of hydro-meteorological and underwater visual information. Through edge intelligence processing, it significantly enhances ecological information capture capability under comparable power consumption, providing a new technological pathway for long-term, unattended sub-ice ecological monitoring.
Figure 1.
Overall structure diagram of the ice-based ecological observation buoy.
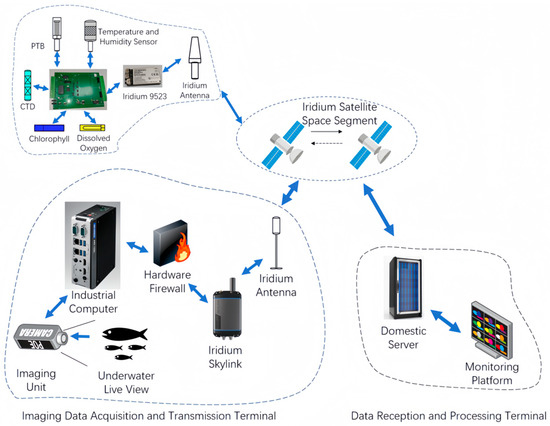
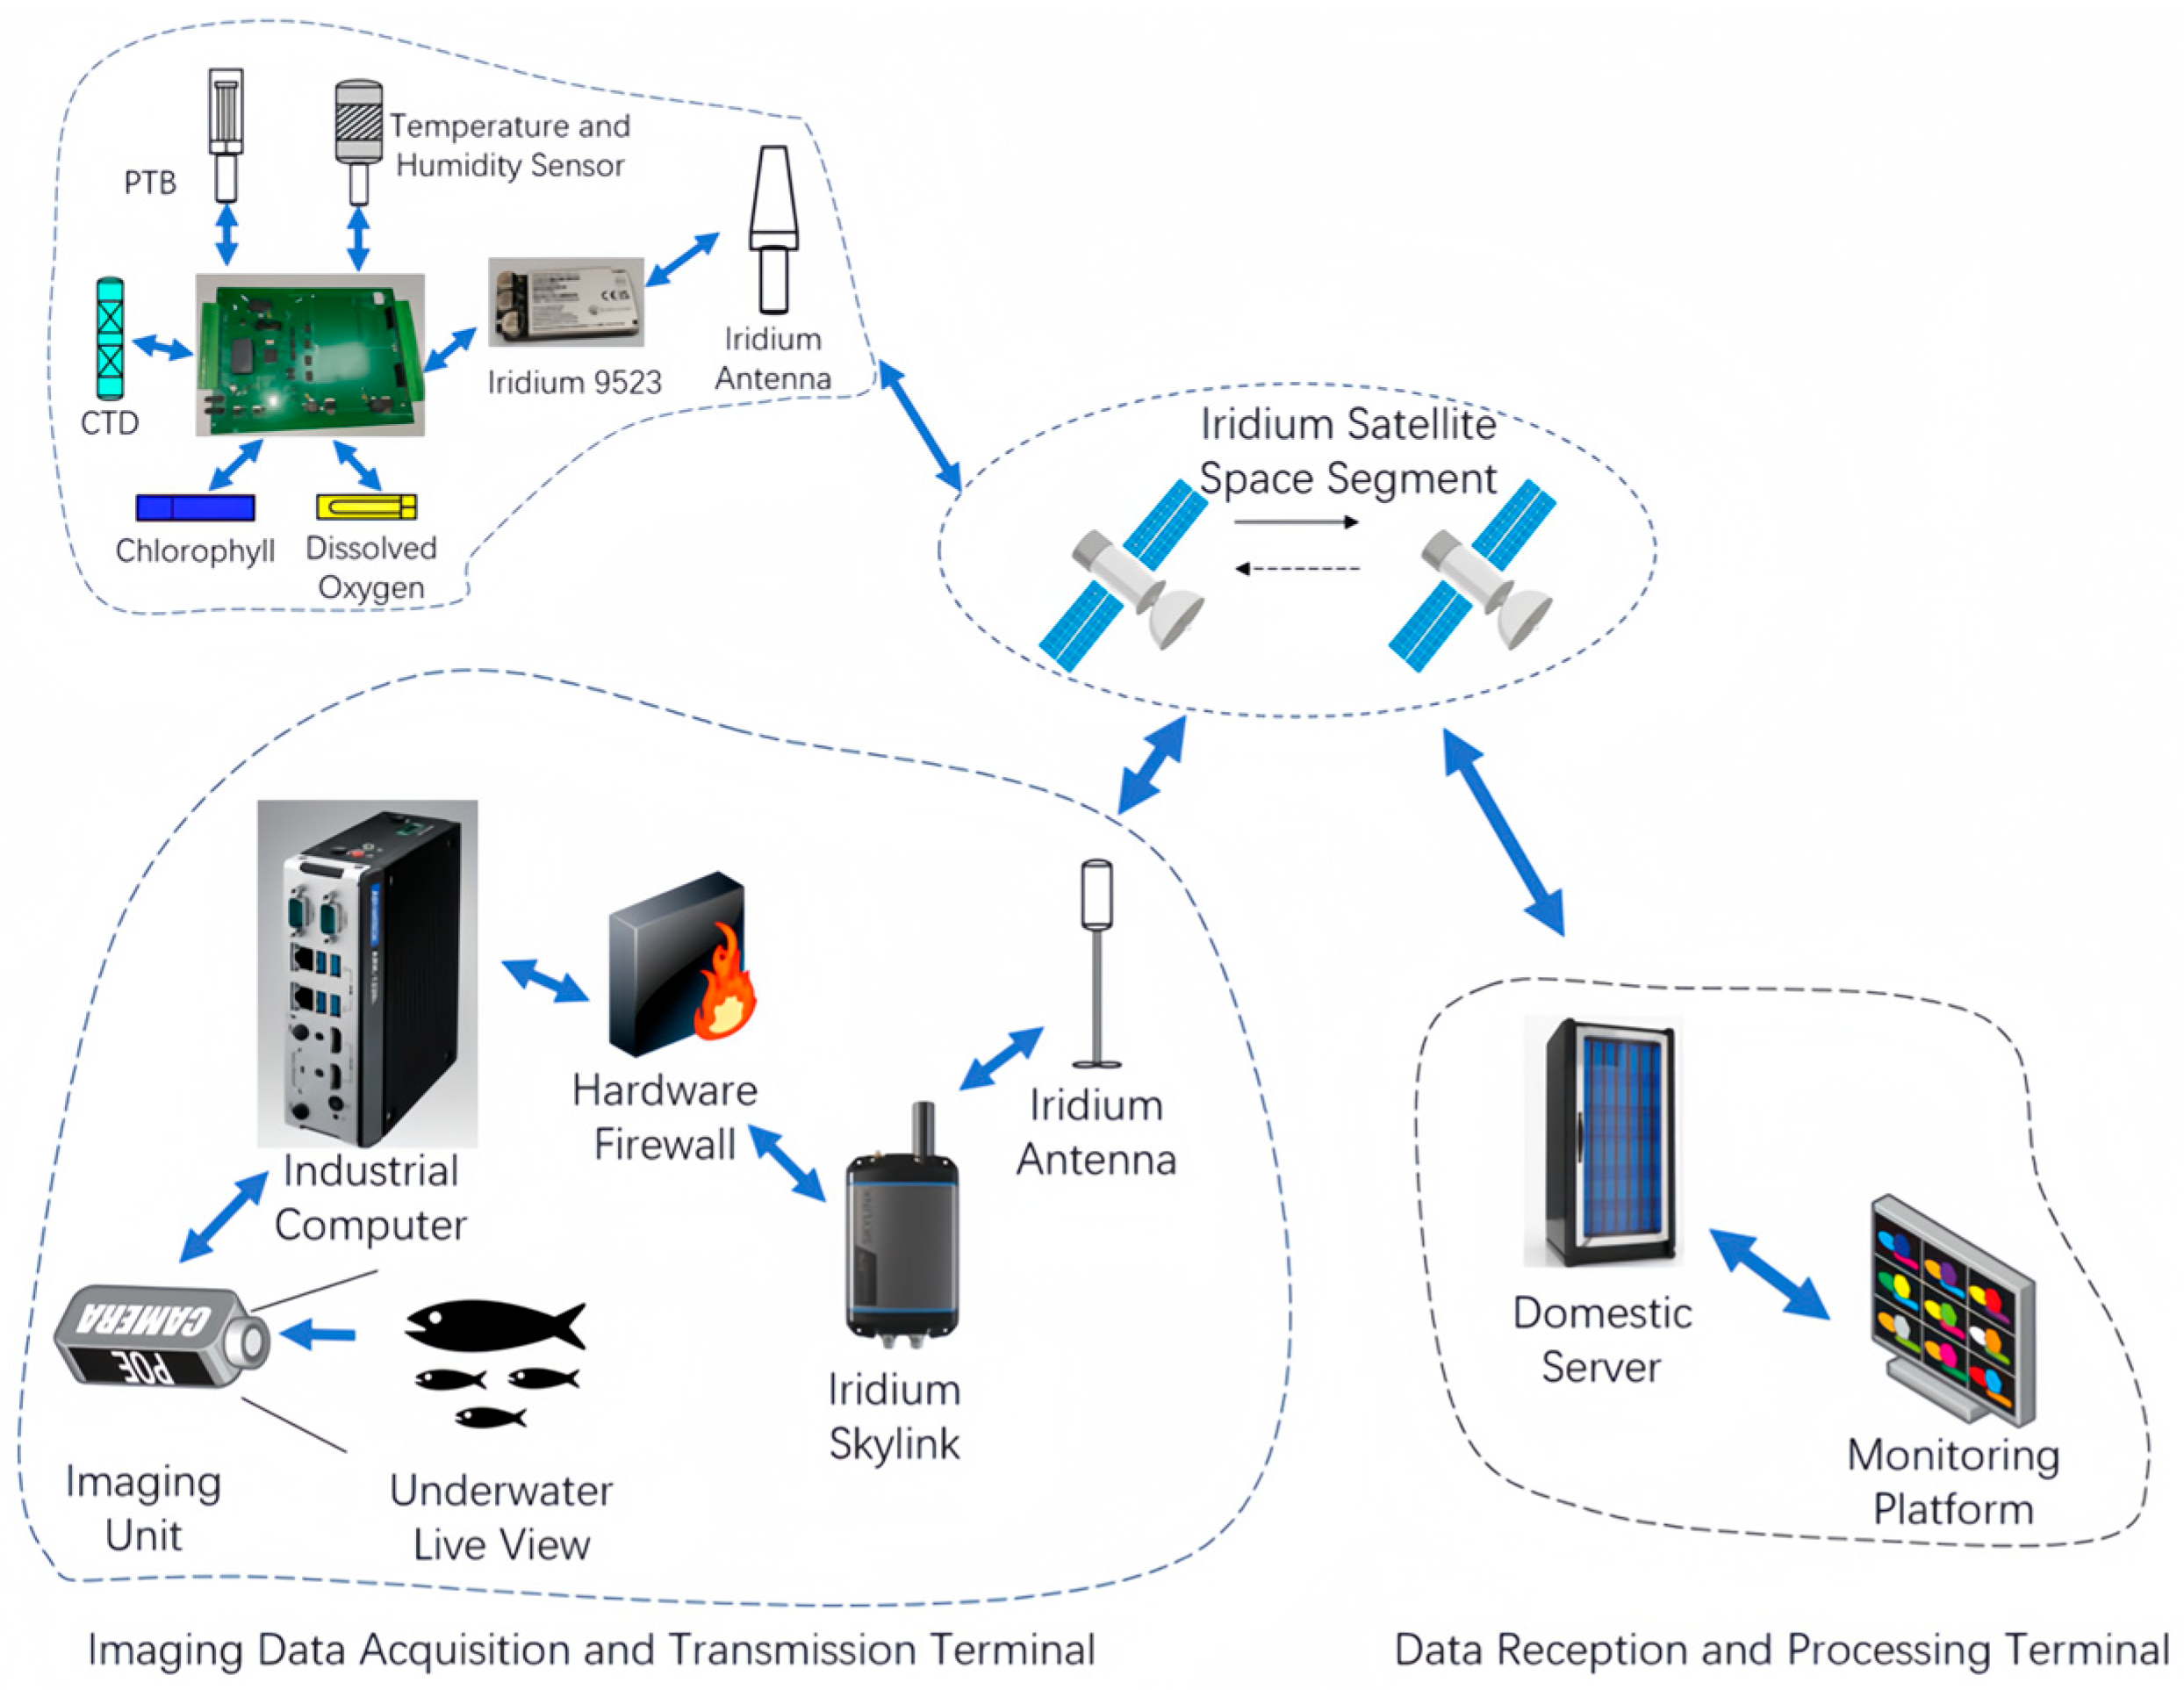
To address bottlenecks such as high satellite communication costs and unstable links in high latitudes, the system employs a dual-channel hierarchical transmission strategy. Conventional sensor data undergoes preliminary integration, validity verification, and silent zero-value substitution processing on the main control unit before being transmitted via dual-redundant Iridium 9523 links, ensuring a high return rate. For image data, the imaging control unit first performs machine learning-based biological target detection and extraction on the video stream. Only static image frames containing potential biological targets, along with the first frame of each video, are converted to .txt format, and then transmitted via the high-bandwidth Iridium Skylink, substantially saving communication bandwidth and costs.
3. Control System Design
3.1. Hardware Design
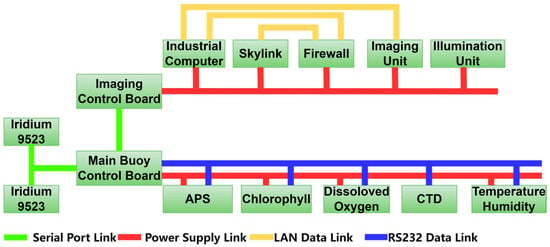
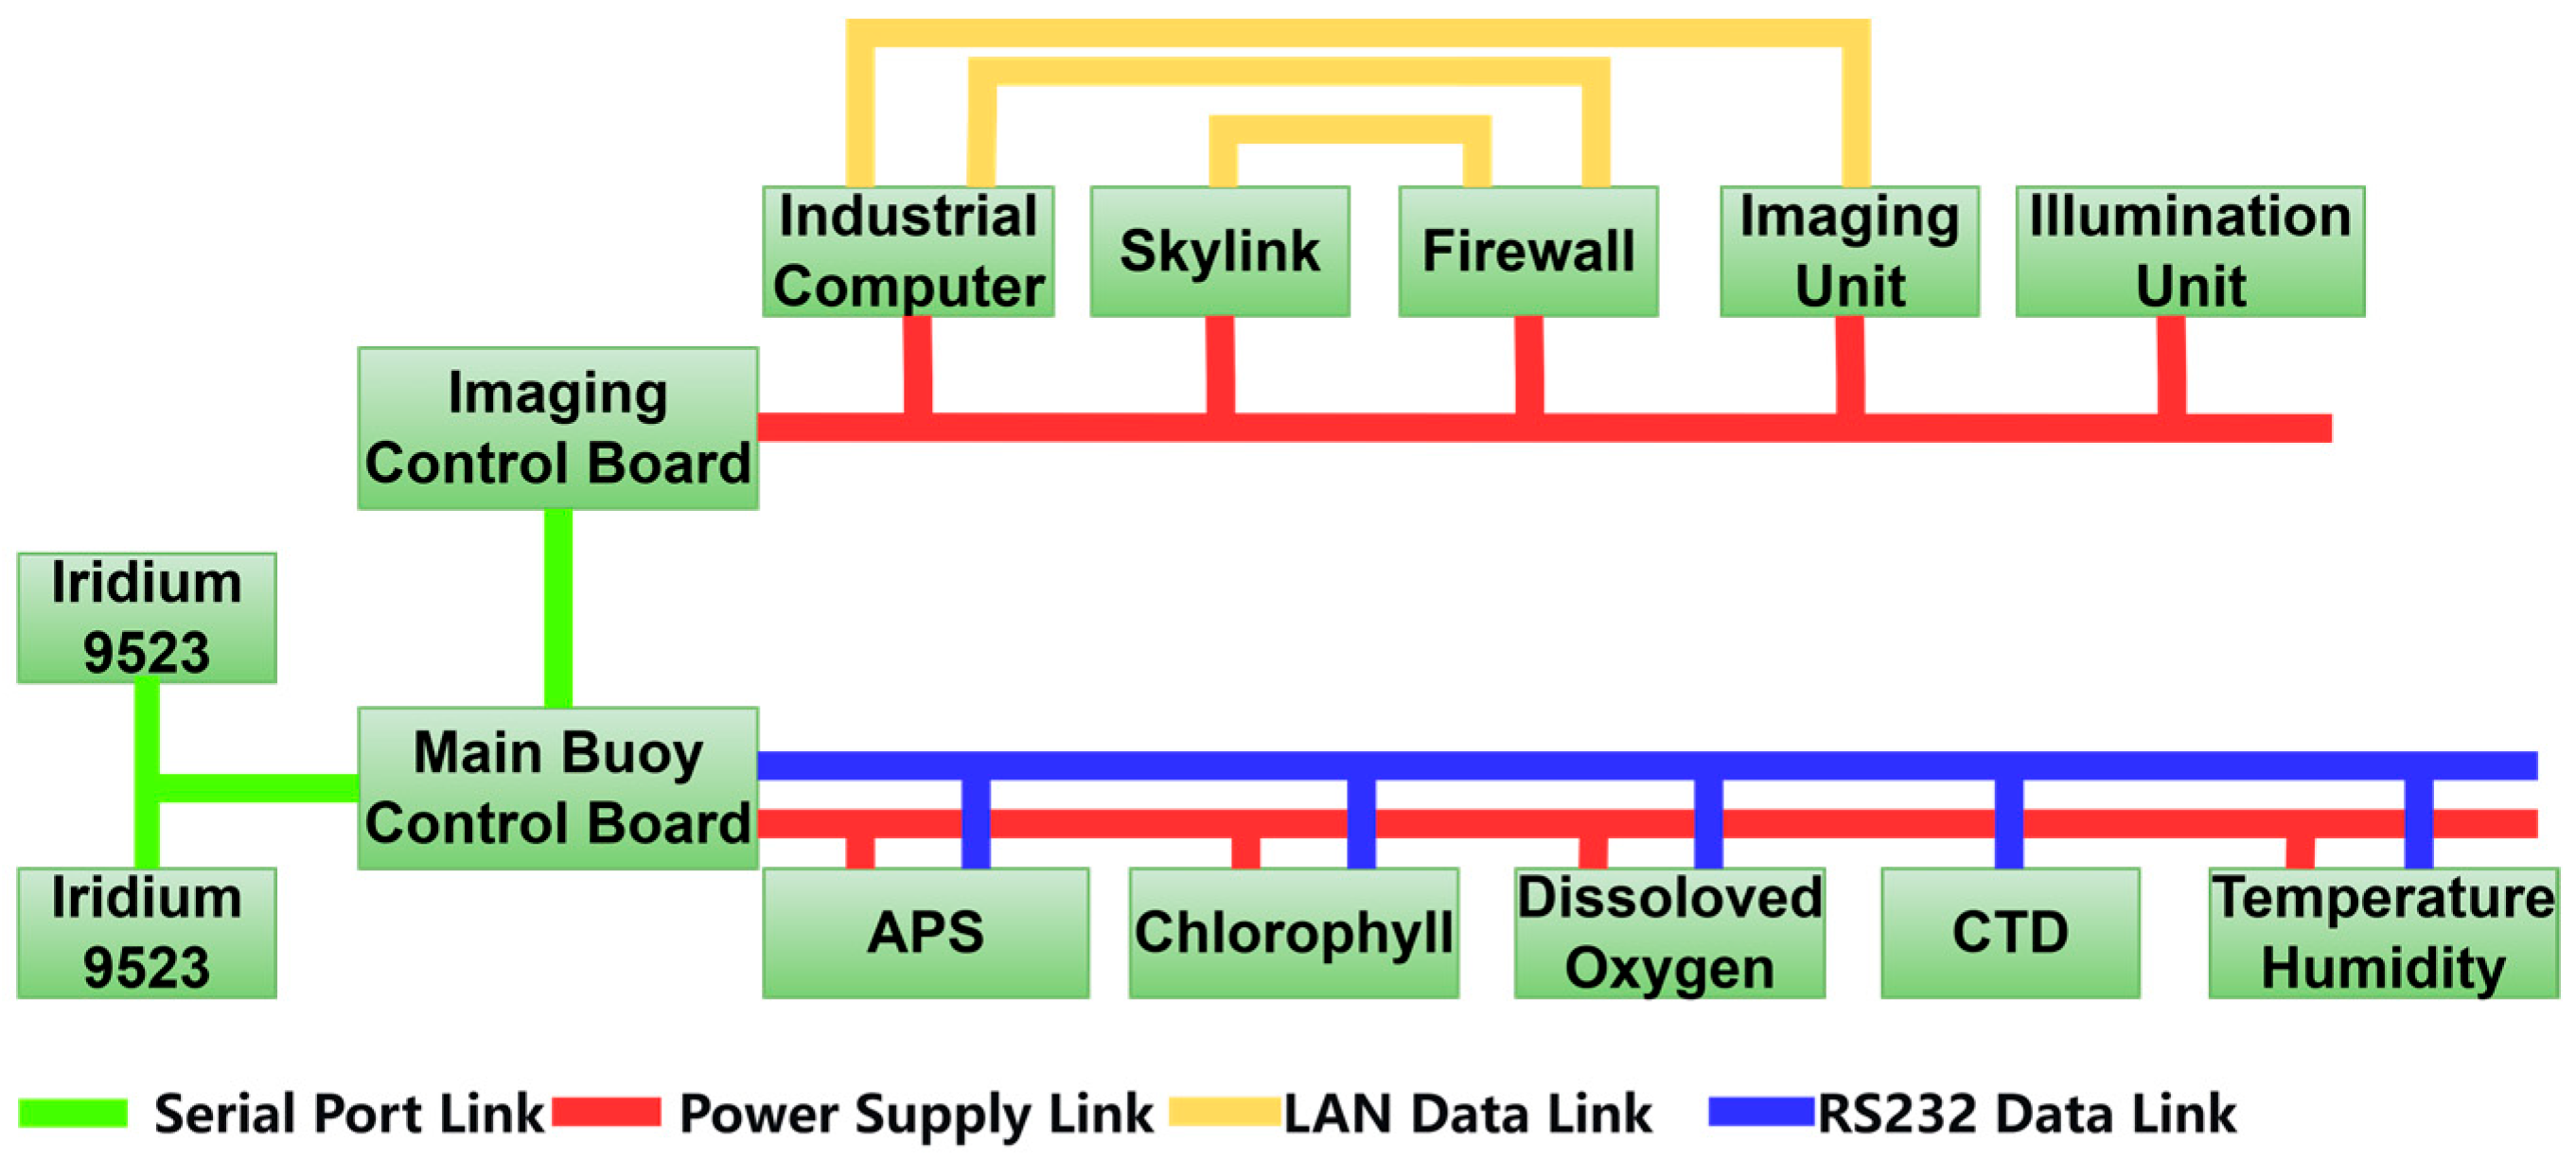
The control system is the core of the entire ice-based ecological observation buoy, responsible for coordinating the operation of all peripheral modules. Its reliability is crucial for the entire system. The connection diagram of the control system for the ice-based ecological observation buoy is shown in Figure 2. The system employs the MSP430F5438A microcontroller from Texas Instruments (TI), Dallas, TX, USA, as the main control chip. This chip integrates various functional circuits and a microprocessor core, featuring a simple circuit structure, ultra-low power consumption, low cost, and stable operation within a wide temperature range of −40 °C to +85 °C. It has strong anti-interference capability and can significantly extend battery life.
Figure 2.
Connection diagram of the buoy control system.
To reduce transmission interference potentially caused by high data volumes and multiple communication interfaces, the system adopts a dual-control board architecture: the main buoy control board is responsible for controlling the power on/off and data acquisition of conventional sensors at set frequencies. The system master communicates with each sensor via independent RS232 interfaces. This interface choice is based on a comprehensive assessment of system data flow and polar reliability: conventional sensor data volume is small with low sampling frequency; the bandwidth of RS232 fully meets the requirements. Moreover, its simple protocol and strong anti-interference capability make it suitable for long-term operation in low-temperature environments. To eliminate potential data congestion caused by time-shared access of multiple sensors, the system sets a 512-byte receive buffer for each serial port, combined with a time-division polling mechanism. This ensures data is temporarily stored and processed orderly after reception, preventing data loss and guaranteeing communication integrity and determinism. Simultaneously, based on the imaging system’s sampling requirements, the main control board sends commands via a serial port to wake up the dedicated imaging control board in real-time.
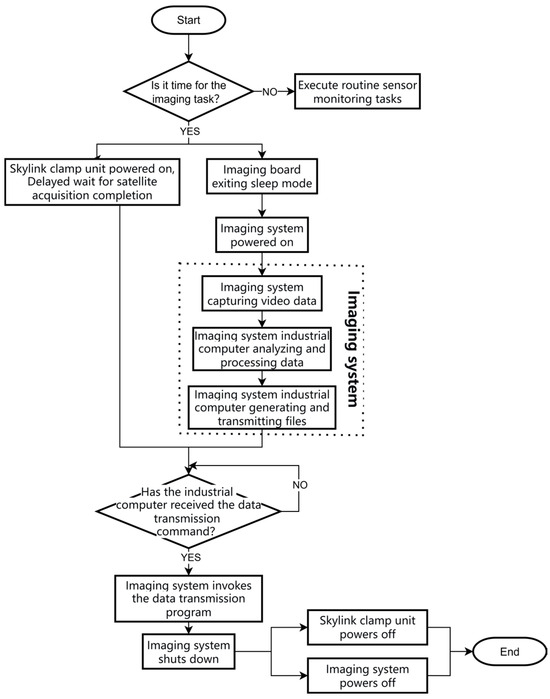
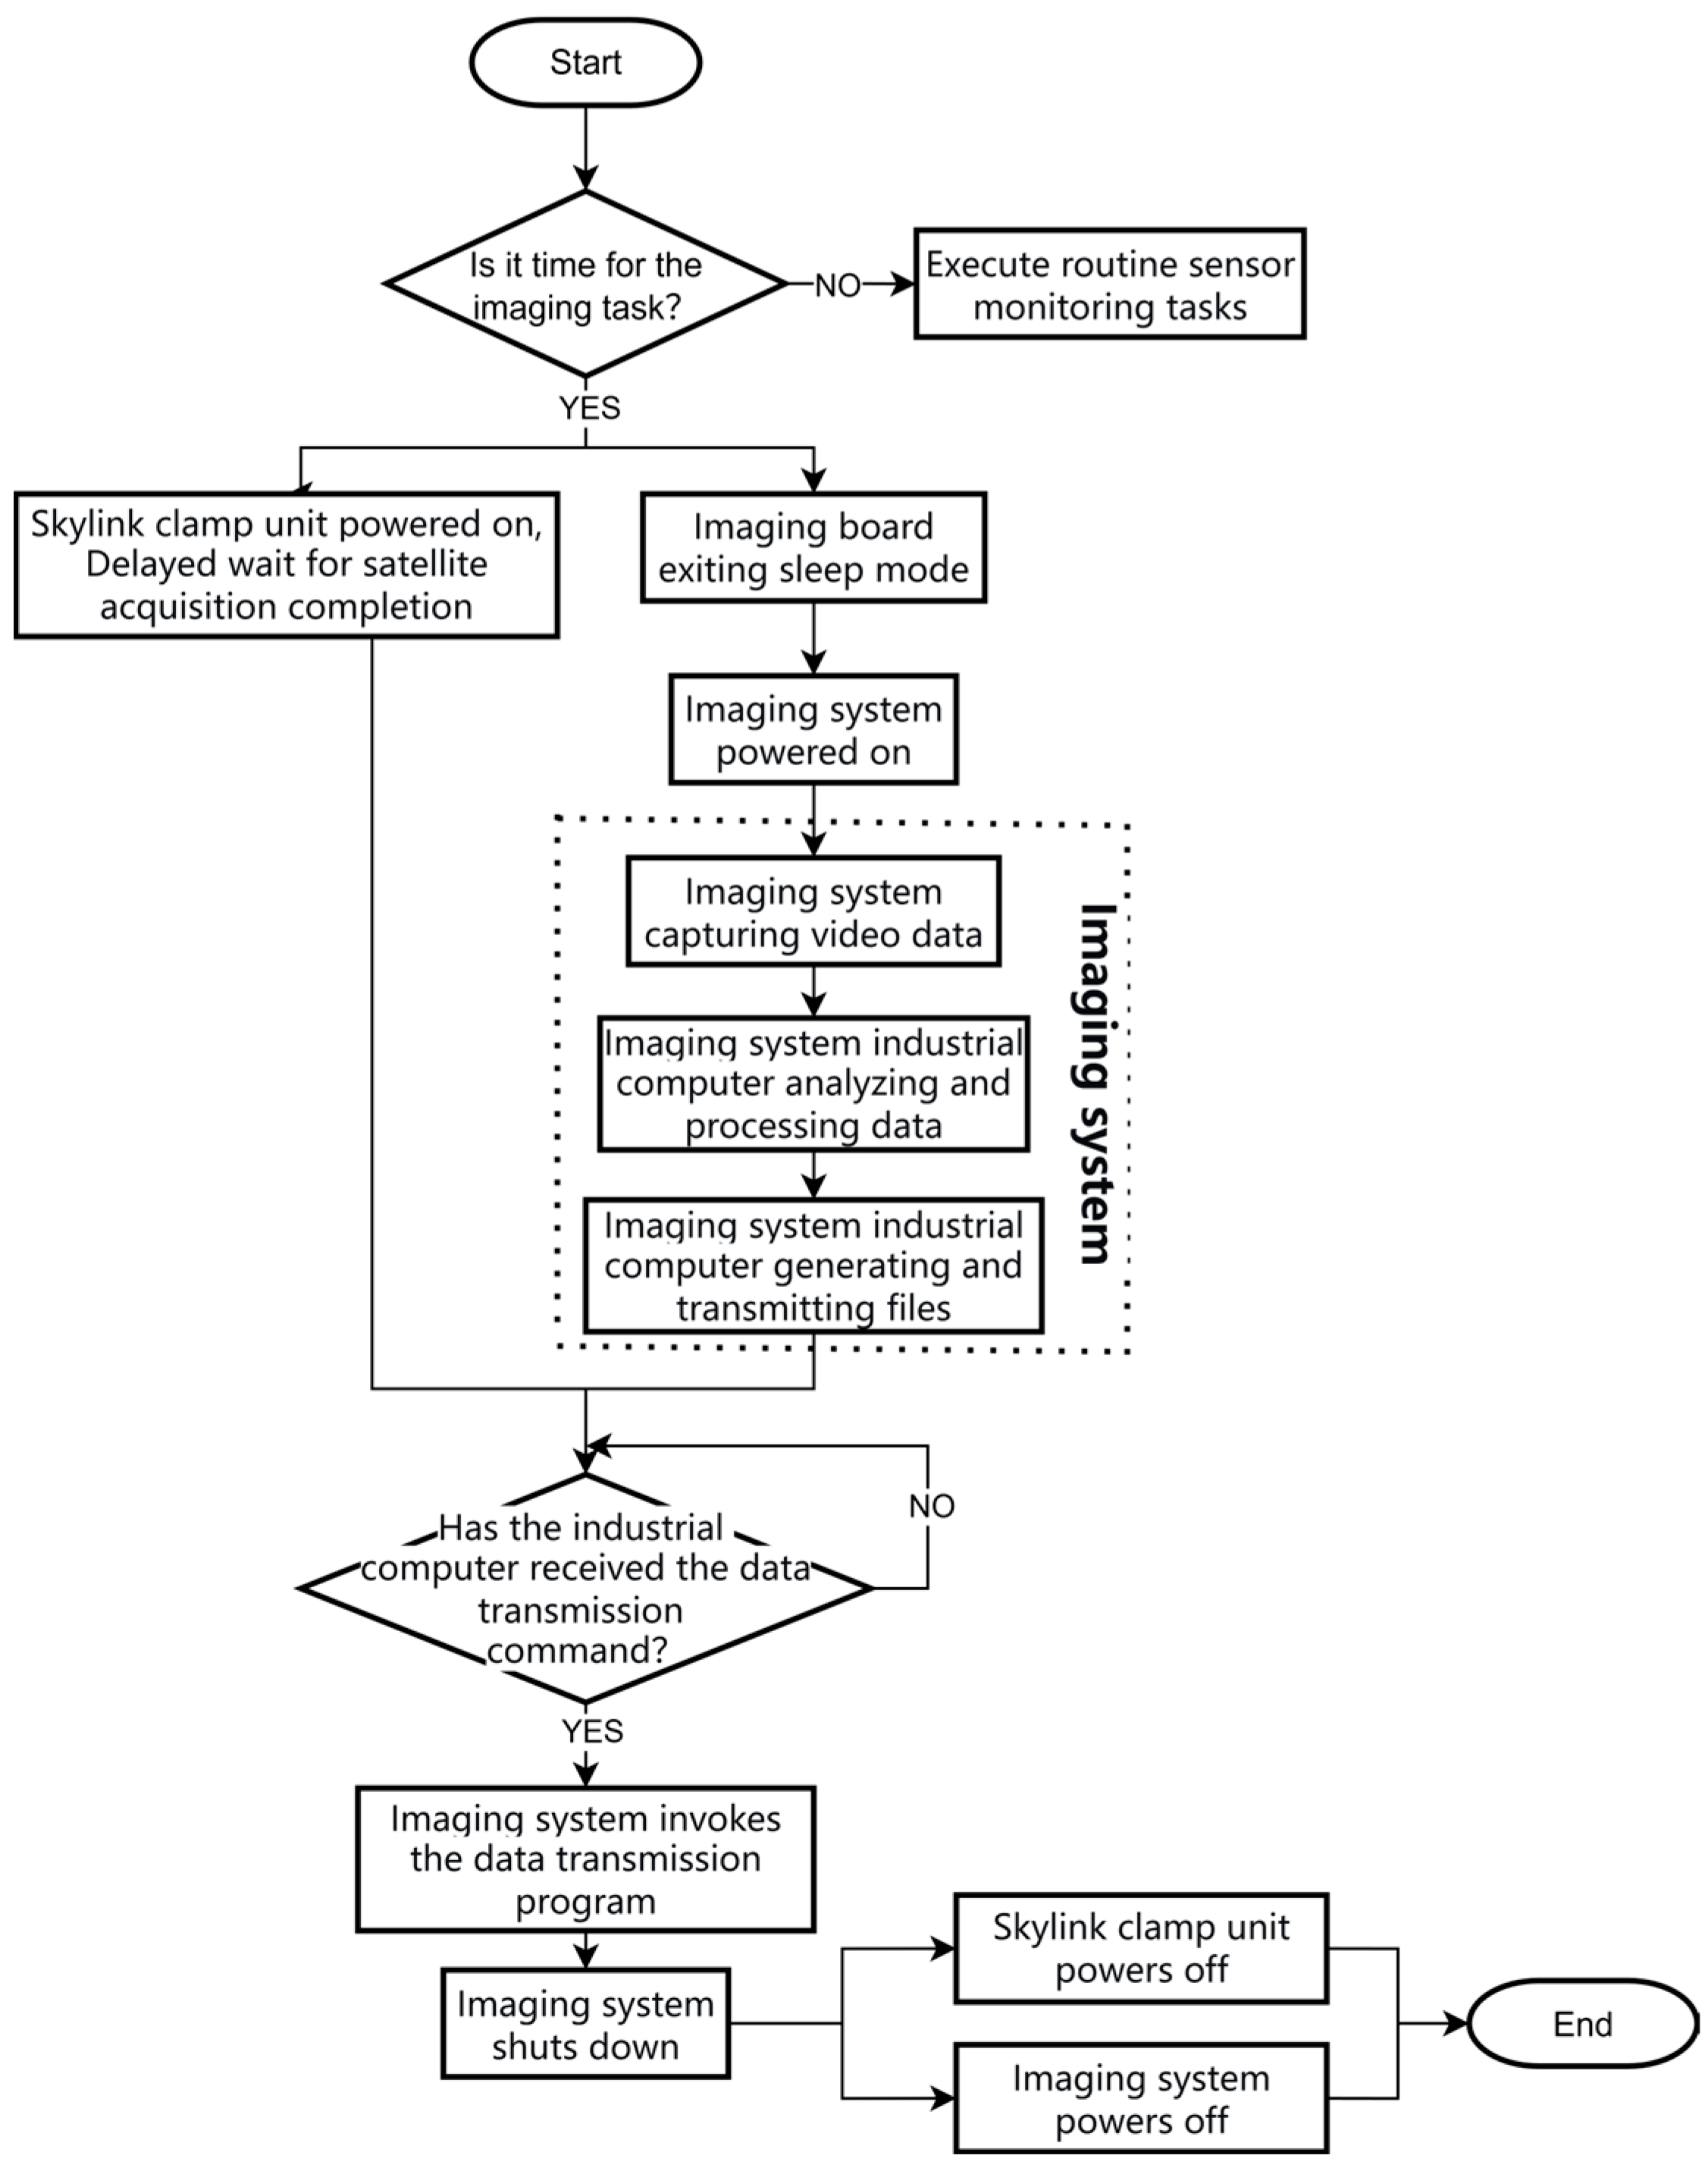
The workflow of the imaging system is shown in Figure 3. When the main buoy determines that the imaging sampling time has arrived, it wakes up the imaging control board via the serial port and simultaneously powers on both the Skylink and the imaging system. After power-up, Skylink automatically searches for satellites, with a system latency of about 1 min to ensure a stable connection. The imaging system initiates video acquisition, and the industrial computer processes the video data. Once the files to be sent are generated, the industrial computer calls the transmission program to send the data back to the domestic data platform via Skylink. After transmission is completed, the imaging system shuts down automatically, and the imaging control board cuts power to both the imaging system and Skylink, completing the entire optical image data transmission process.
Figure 3.
Imaging system control flowchart.
3.2. Control System Software Design
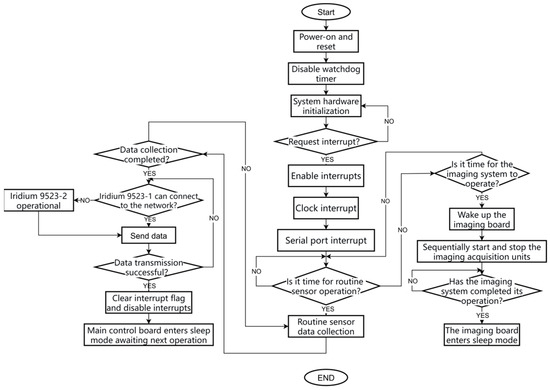
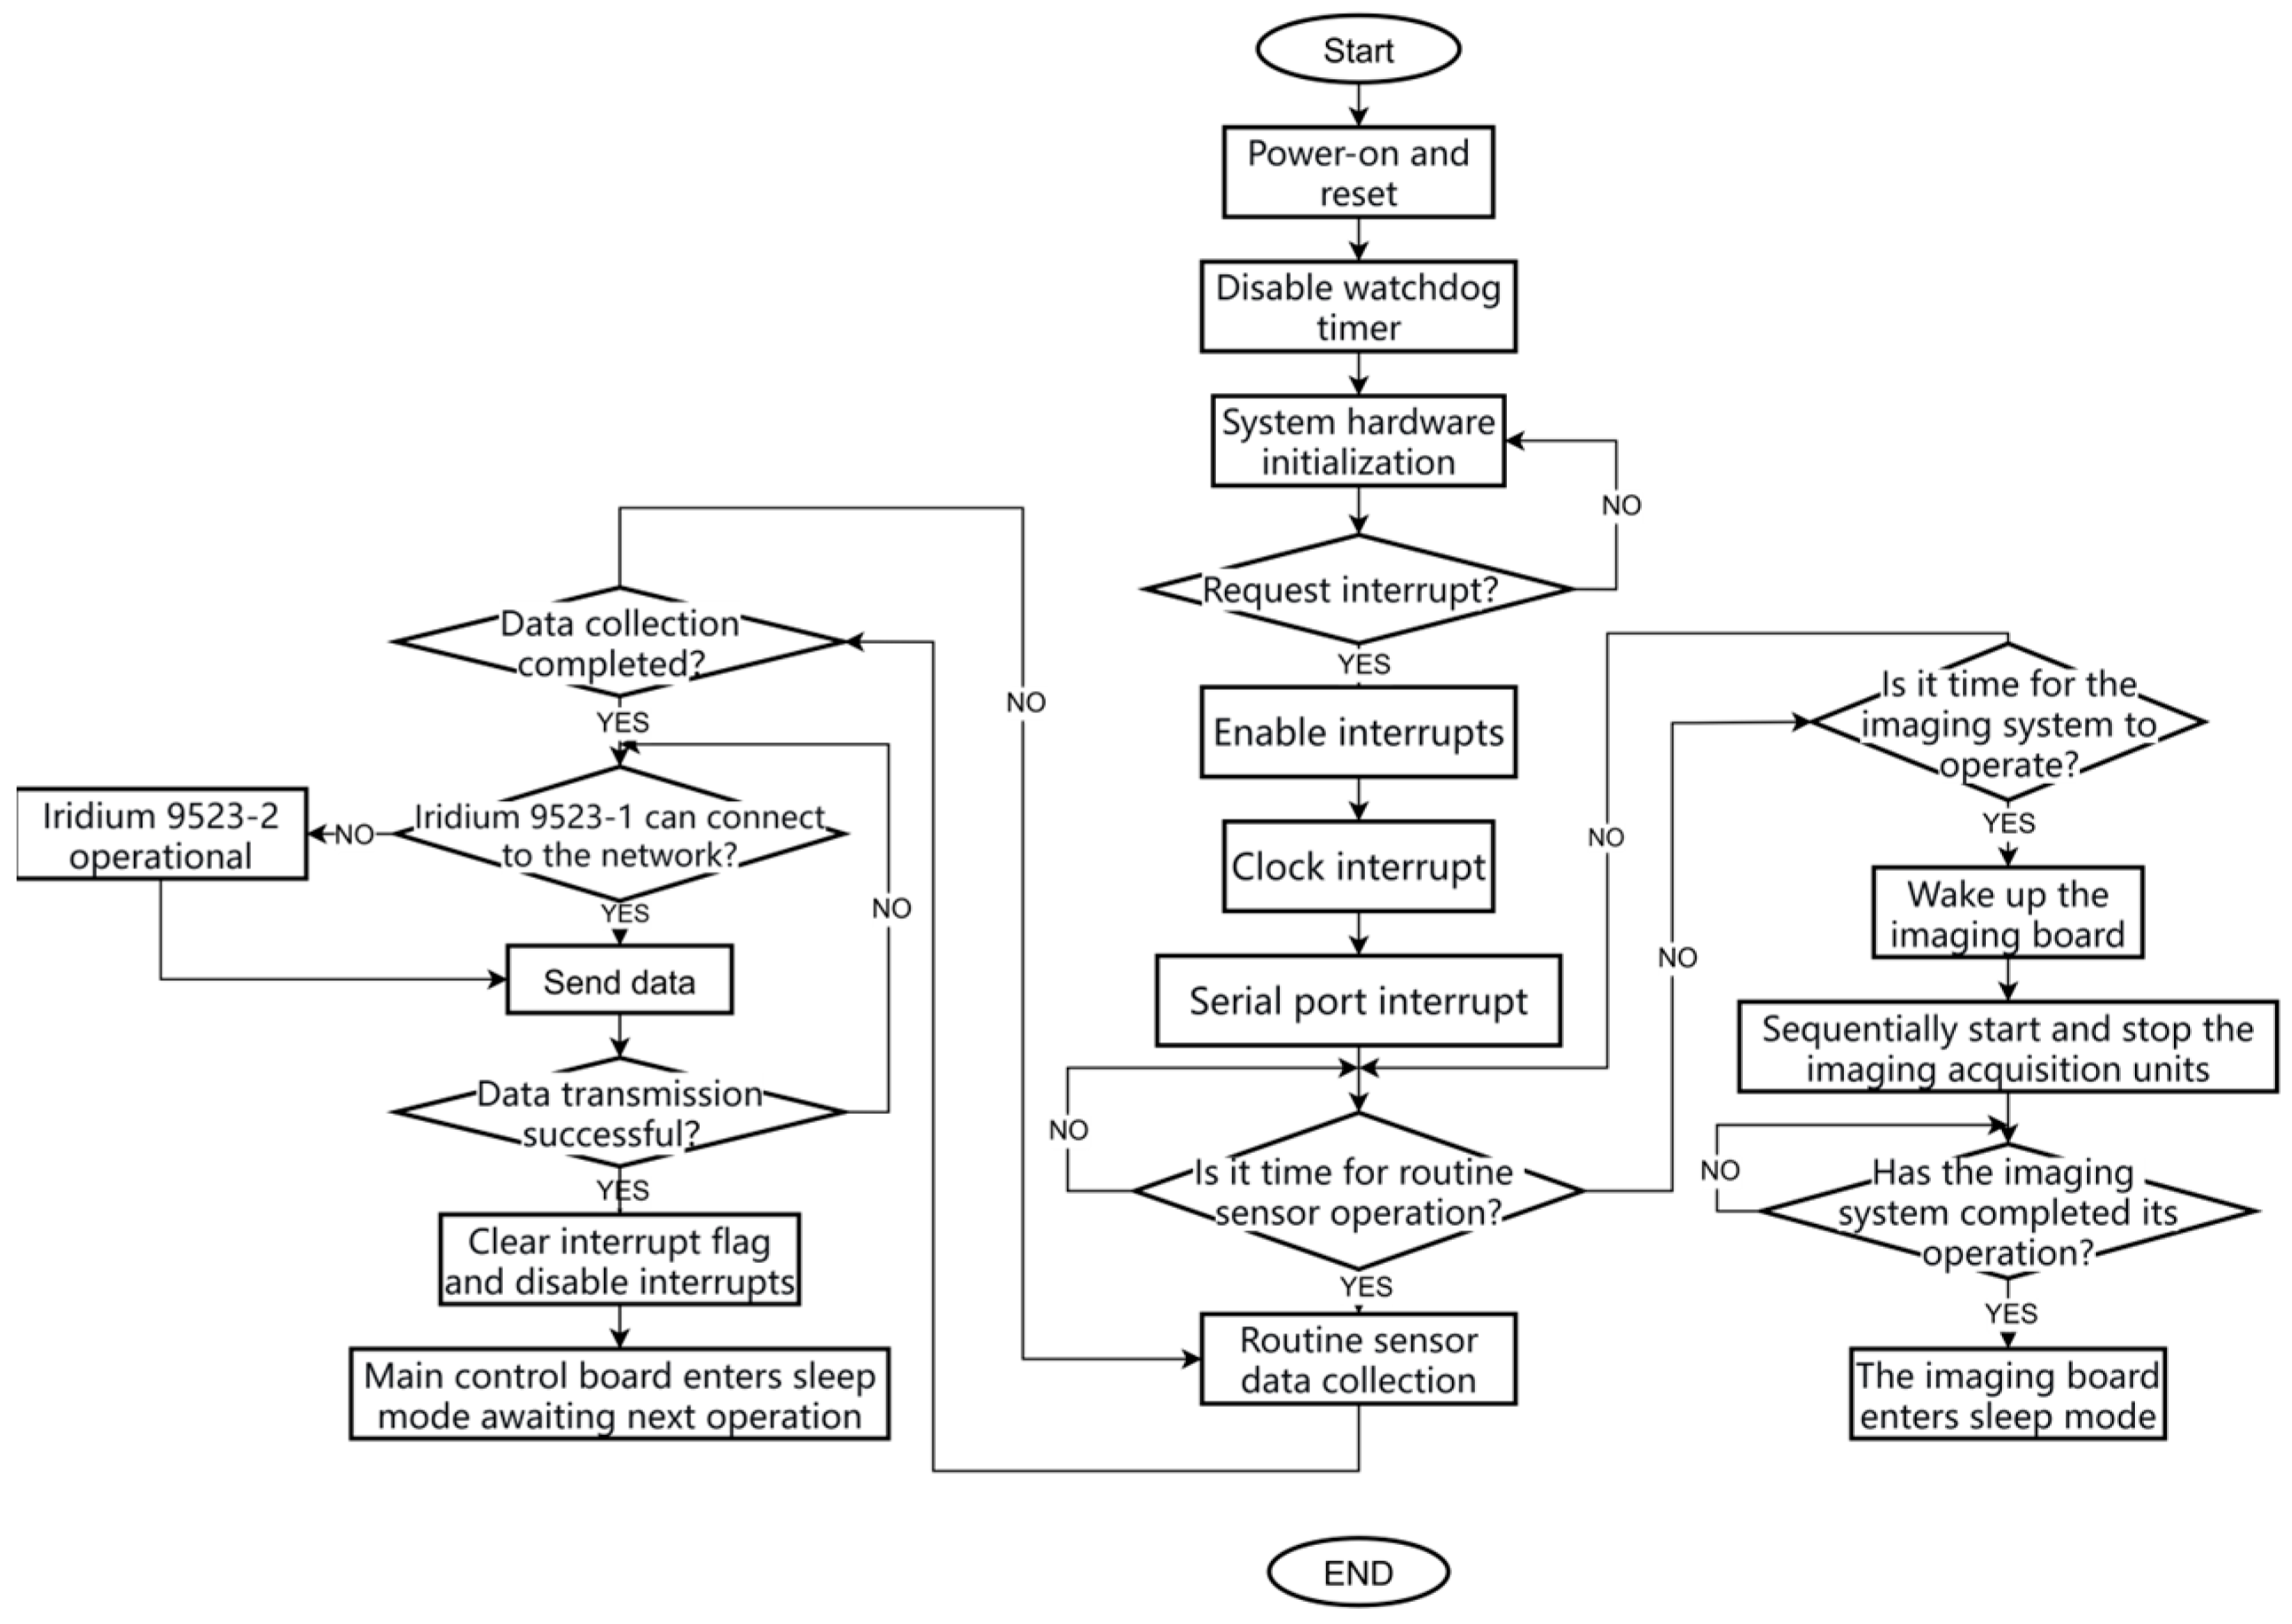
The software design flowchart for the control system of the polar ice-based ecological observation buoy is shown in Figure 4. To prioritize observation continuity and avoid unintended resets triggered by power fluctuations and signal interference due to extreme temperature fluctuations and mechanical stress in polar regions, the system disables the watchdog timer after initialization. It then completes hardware initialization and enables system interrupts. System interrupts primarily include a clock interrupt (for periodically waking the main controller) and serial port interrupts (for sensor data acquisition and imaging board wake-up). After completing data acquisition through multiple serial port interrupt service subroutines, the main control system sends the data back to China via dual Iridium modules. Upon confirming successful data transmission, the controller clears the interrupt flags, disables interrupts, and then enters a sleep state, awaiting the next acquisition task. When the preset imaging system acquisition time is reached, the main control system sends a command via the serial port to wake up the imaging board. The imaging board sequentially starts each imaging unit to execute acquisition and transmission tasks. After data transmission is completed, it automatically enters sleep mode, waiting for the next wake-up call.
Figure 4.
Control system software flowchart.
3.3. Overall Design of Buoy Data Transmission System
To meet the communication reliability requirements in the high-latitude polar regions, the communication system in the polar ice-based ecological observation buoy is configured with two Iridium 9523 modules and one Iridium Skylink module. The Iridium 9523 has a theoretical maximum transmission rate of 2.4 kbps with an end-to-end signal delay of approximately 1.5–2 s, used for transmitting 284-byte conventional sensor data. For the 1–2 MB large-capacity data from the optical imaging equipment, the Iridium Skylink module is employed, with a theoretical maximum transmission rate of up to 22 kbps. The data transmission process for the polar ice-based ecological observation buoy is shown in Figure 5.
Figure 5.
Data transmission flowchart.
Conventional sensor data is collected and processed by the main buoy control board, temporarily stored in its internal RAM transmission buffer, and transmitted via the dual Iridium 9523 modules. The transmission process is as follows: First, power on the Iridium module 9523-1 and send AT commands to it. If a connectable Iridium network is detected, the system data is sent back to China. If the connection fails after 5 consecutive attempts, 9523-1 is turned off, and the system switches to 9523-2 to repeat the connection process. If both fail to connect, the system will retry after several hours. If a module is detected as damaged (e.g., no response to AT commands or abnormal current), the system records the fault information and transmits it back to China via the other module. If both modules fail, the system clears the buffer data and waits for the next acquisition task.
The image data captured by the underwater camera unit must be transmitted back via a satellite terminal. The image acquisition unit is located at the bottom of the buoy body and works in coordination with the processing unit inside the buoy body. After startup, the acquired video data is transmitted via LAN to the industrial computer for processing. The results are saved locally, and images are converted to .txt format. Finally, the large-capacity image data, after being filtered by a hardware firewall, is transmitted back to the domestic platform via the Skylink satellite link. This firewall is specifically designed to restrict the flow of non-image data to save communication costs.
4. Imaging System Design
4.1. Imaging Data Processing System
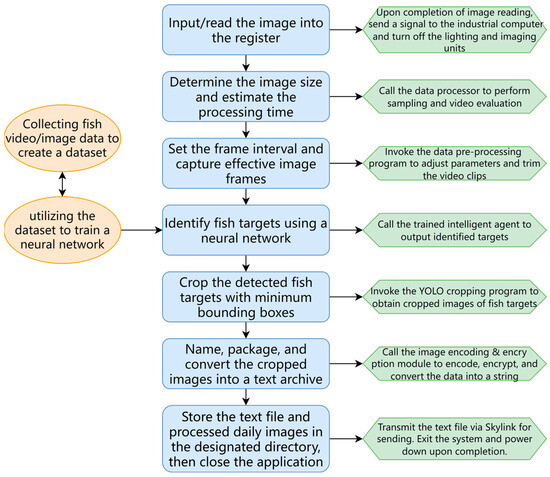
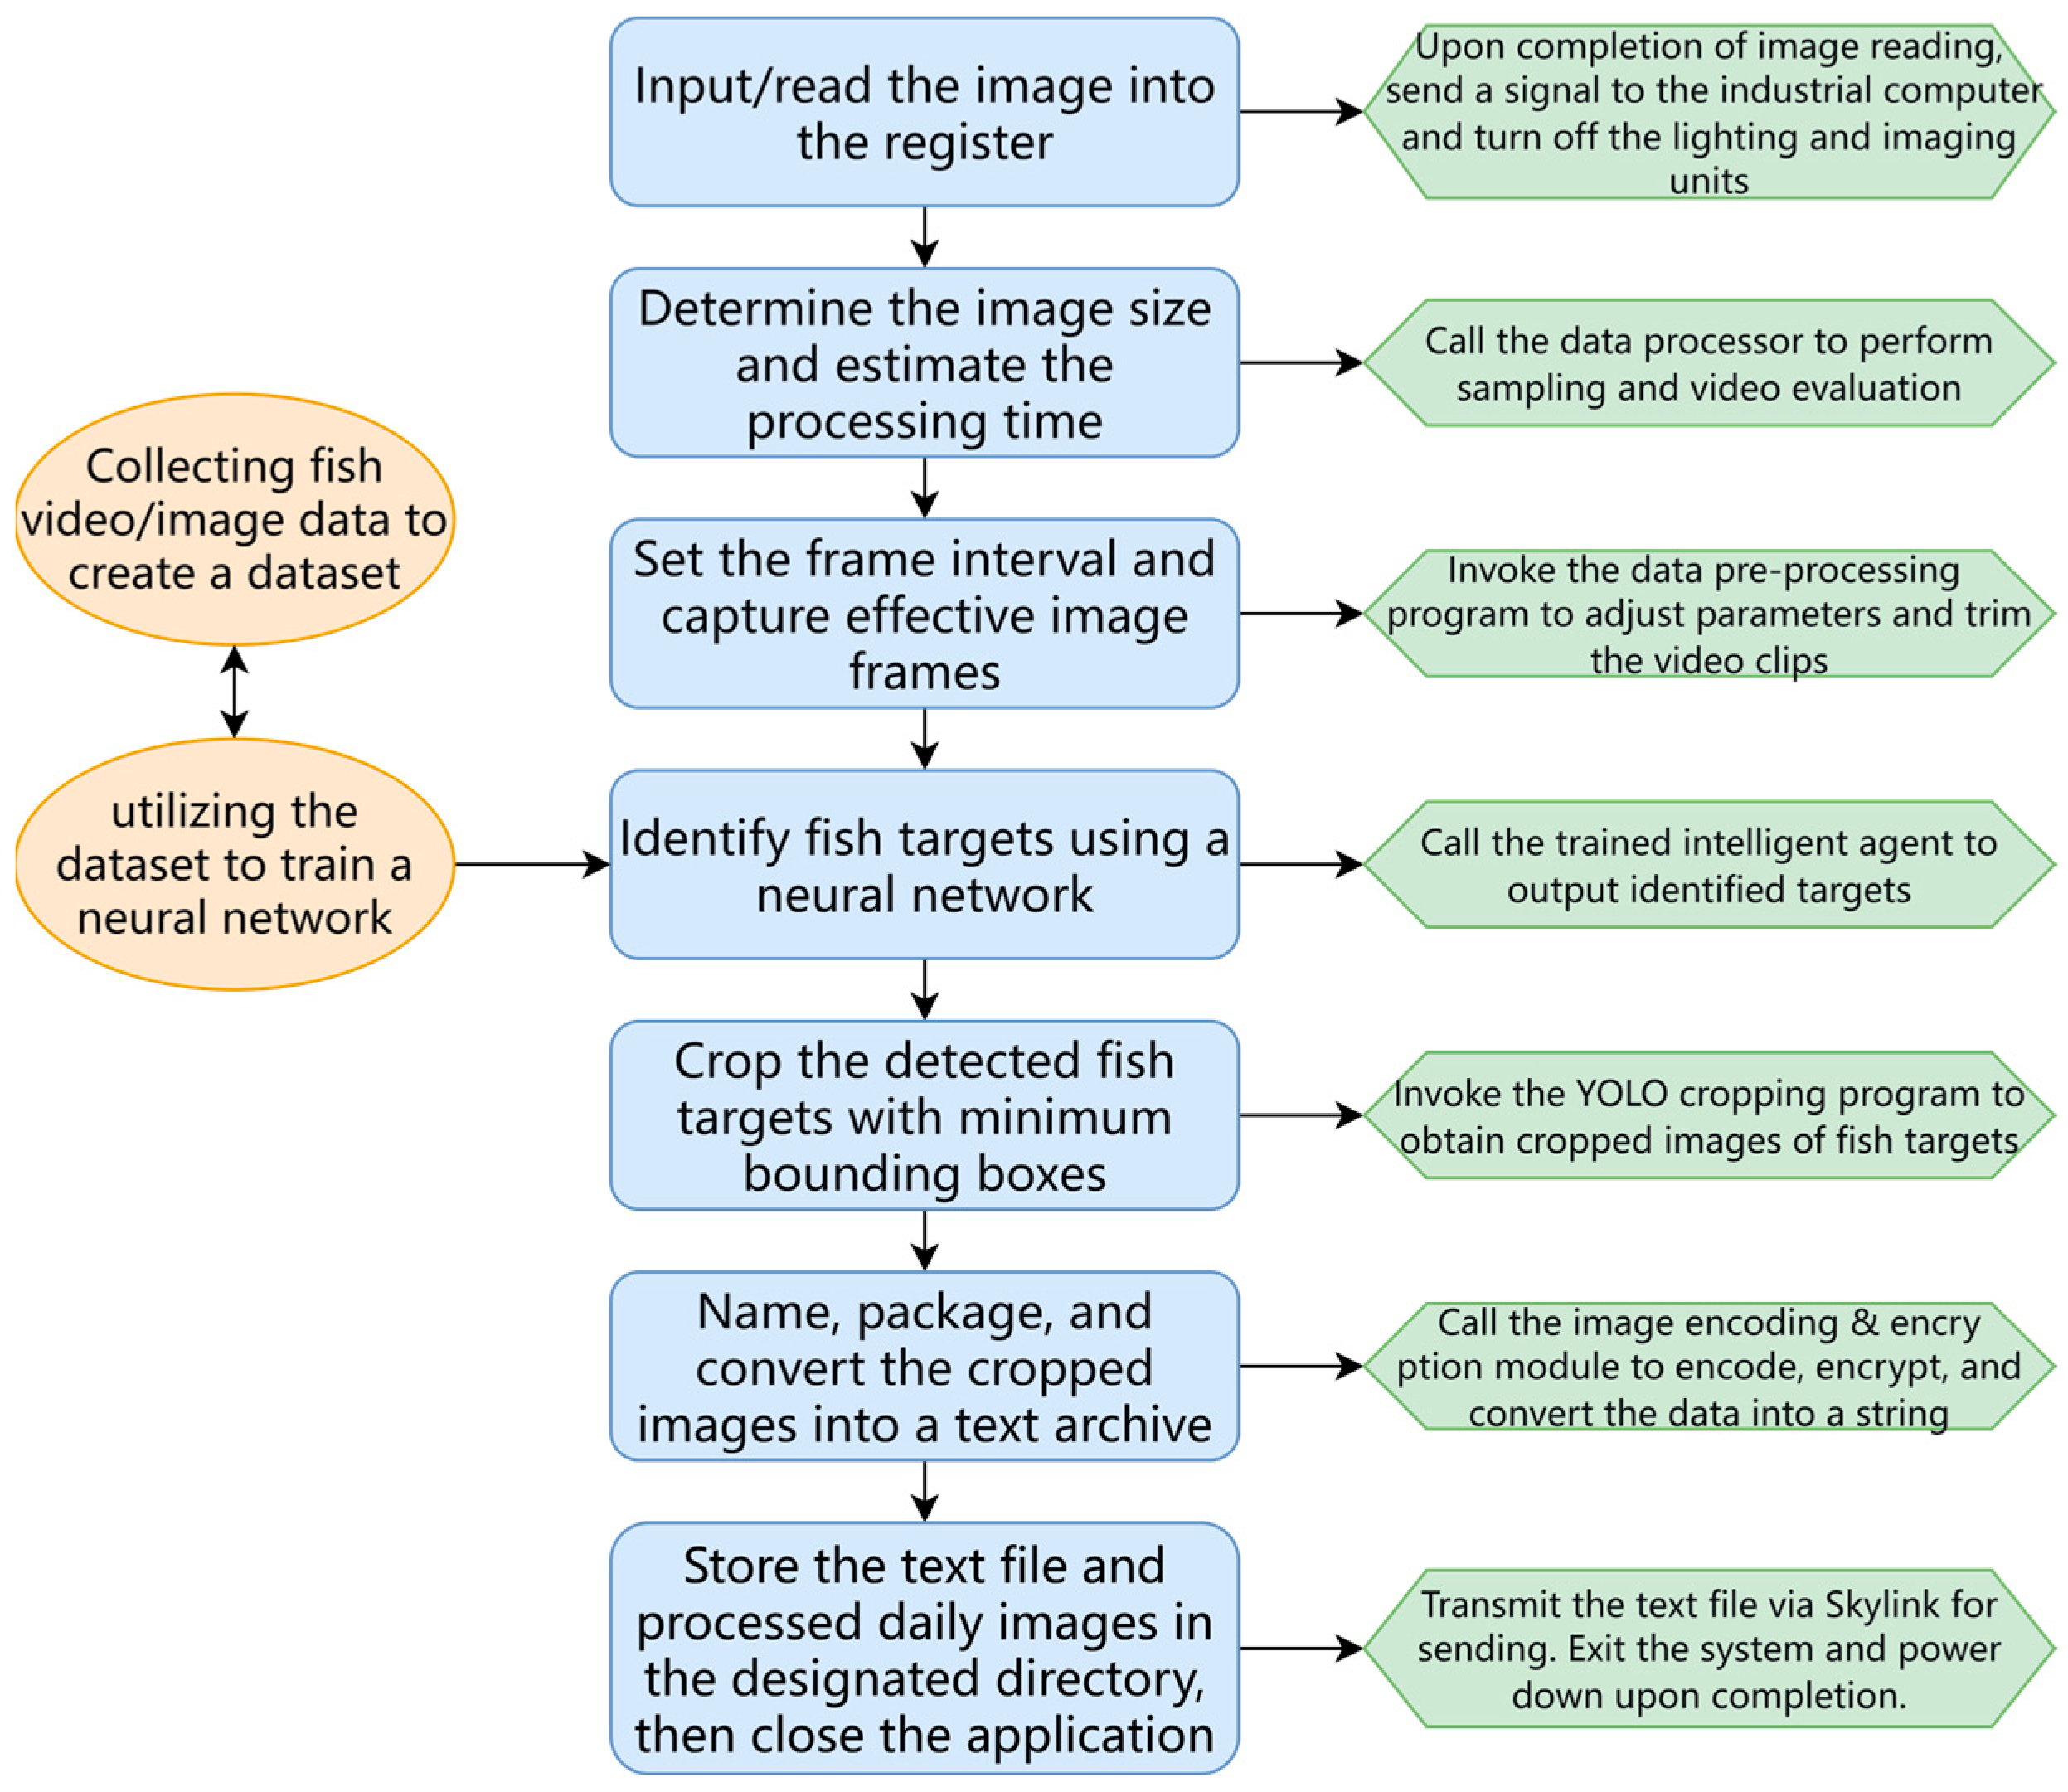
As shown in Figure 6, the system reads image data from the imaging unit through operational software integrated on the industrial computer and employs machine learning algorithms to detect and automatically extract fish images (or suspected targets).
Figure 6.
Image processing unit software workflow.
Data Acquisition and Processing Technology Verification
To meet the project requirements for fish image identification and transmission, the research team tested the image recognition performance of several algorithms and ultimately selected a YOLOv5 (an efficient convolutional neural network framework) for fish image recognition. Featuring a single-stage detection architecture and a highly optimized network structure, this algorithm significantly reduces computational complexity and power consumption while maintaining high accuracy, perfectly meeting the stringent requirements of polar equipment for long-term, low-power operation. Its lightweight model facilitates deployment on embedded platforms for real-time processing and, through targeted training, can effectively adapt to complex sub-ice imaging environments. This selection represents the engineering trade-off under multiple constraints, including detection performance, real-time capability, power consumption control, and environmental adaptability.
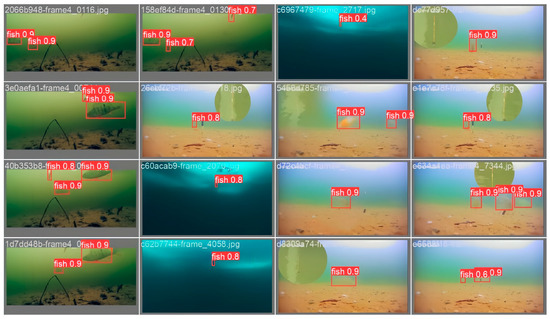
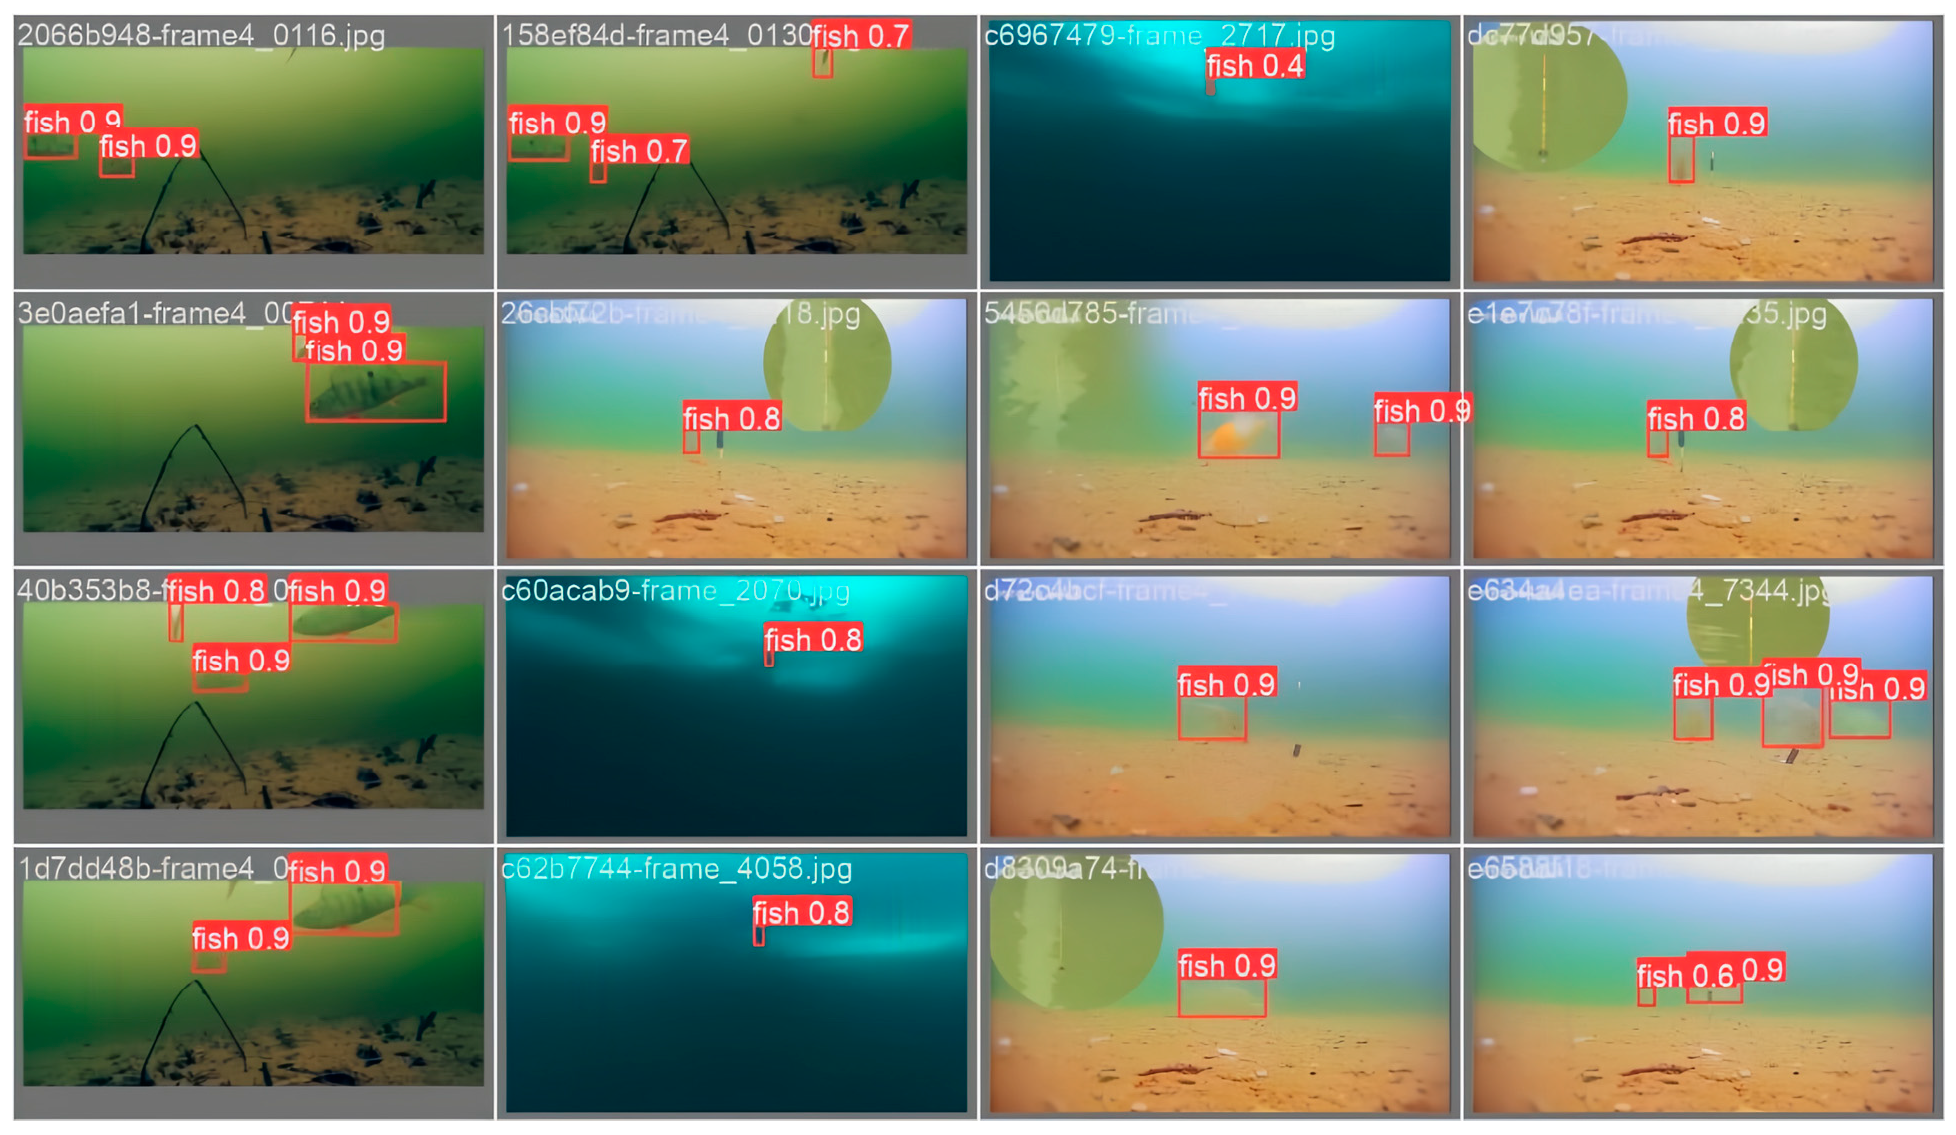
During the initial training phase, the model initially screens a batch of candidate targets. However, relying solely on features such as target motion and posture makes it difficult to accurately distinguish fish from non-target objects (such as clumpy marine snow). Therefore, the system introduces a verification image database to further discriminate the types of moving targets. This database contains 8000 fish photos from various environments, angles, and postures, enriching the dataset’s diversity. Among these, 2000 images simulate scenarios likely encountered in real monitoring, such as blurred fish images and complex backgrounds. The image processing unit extracts a series of verification images from the model verification batch and adds target detection labels to them. During processing, the model marks identified target fish with red boxes and uses labels to distinguish different types. These annotated images are used to evaluate the model’s performance on the verification set. Figure 7 shows the verification images and their corresponding neural network prediction results, where each red box represents the detected fish location, and the predicted confidence level is annotated beside the box. The confidence score adopted in this study is output by the object detection model, and its calculation can be expressed as follows:
Confidence = P × IoU
Figure 7.
Setting fish morphology verification threshold using neural network.
Note: P is the probability predicted by the model that a target object (fish) exists within the bounding box, obtained from the Softmax output of the classification branch, ranging [0, 1]; IoU (Intersection over Union) is the overlap degree between the predicted box and the ground truth annotation box, reflecting localization accuracy, ranging [0, 1].
In the later stages of the project, if complex scenarios such as dense targets within the field of view are encountered, the highest quality fish images for transmission can be selected by setting different confidence thresholds.
4.2. Imaging Data Transmission Module Design
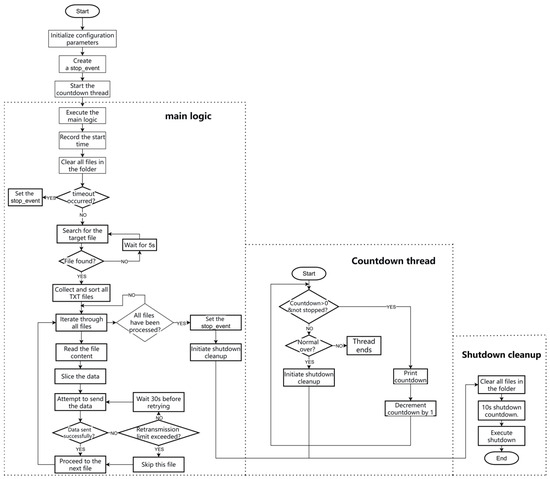
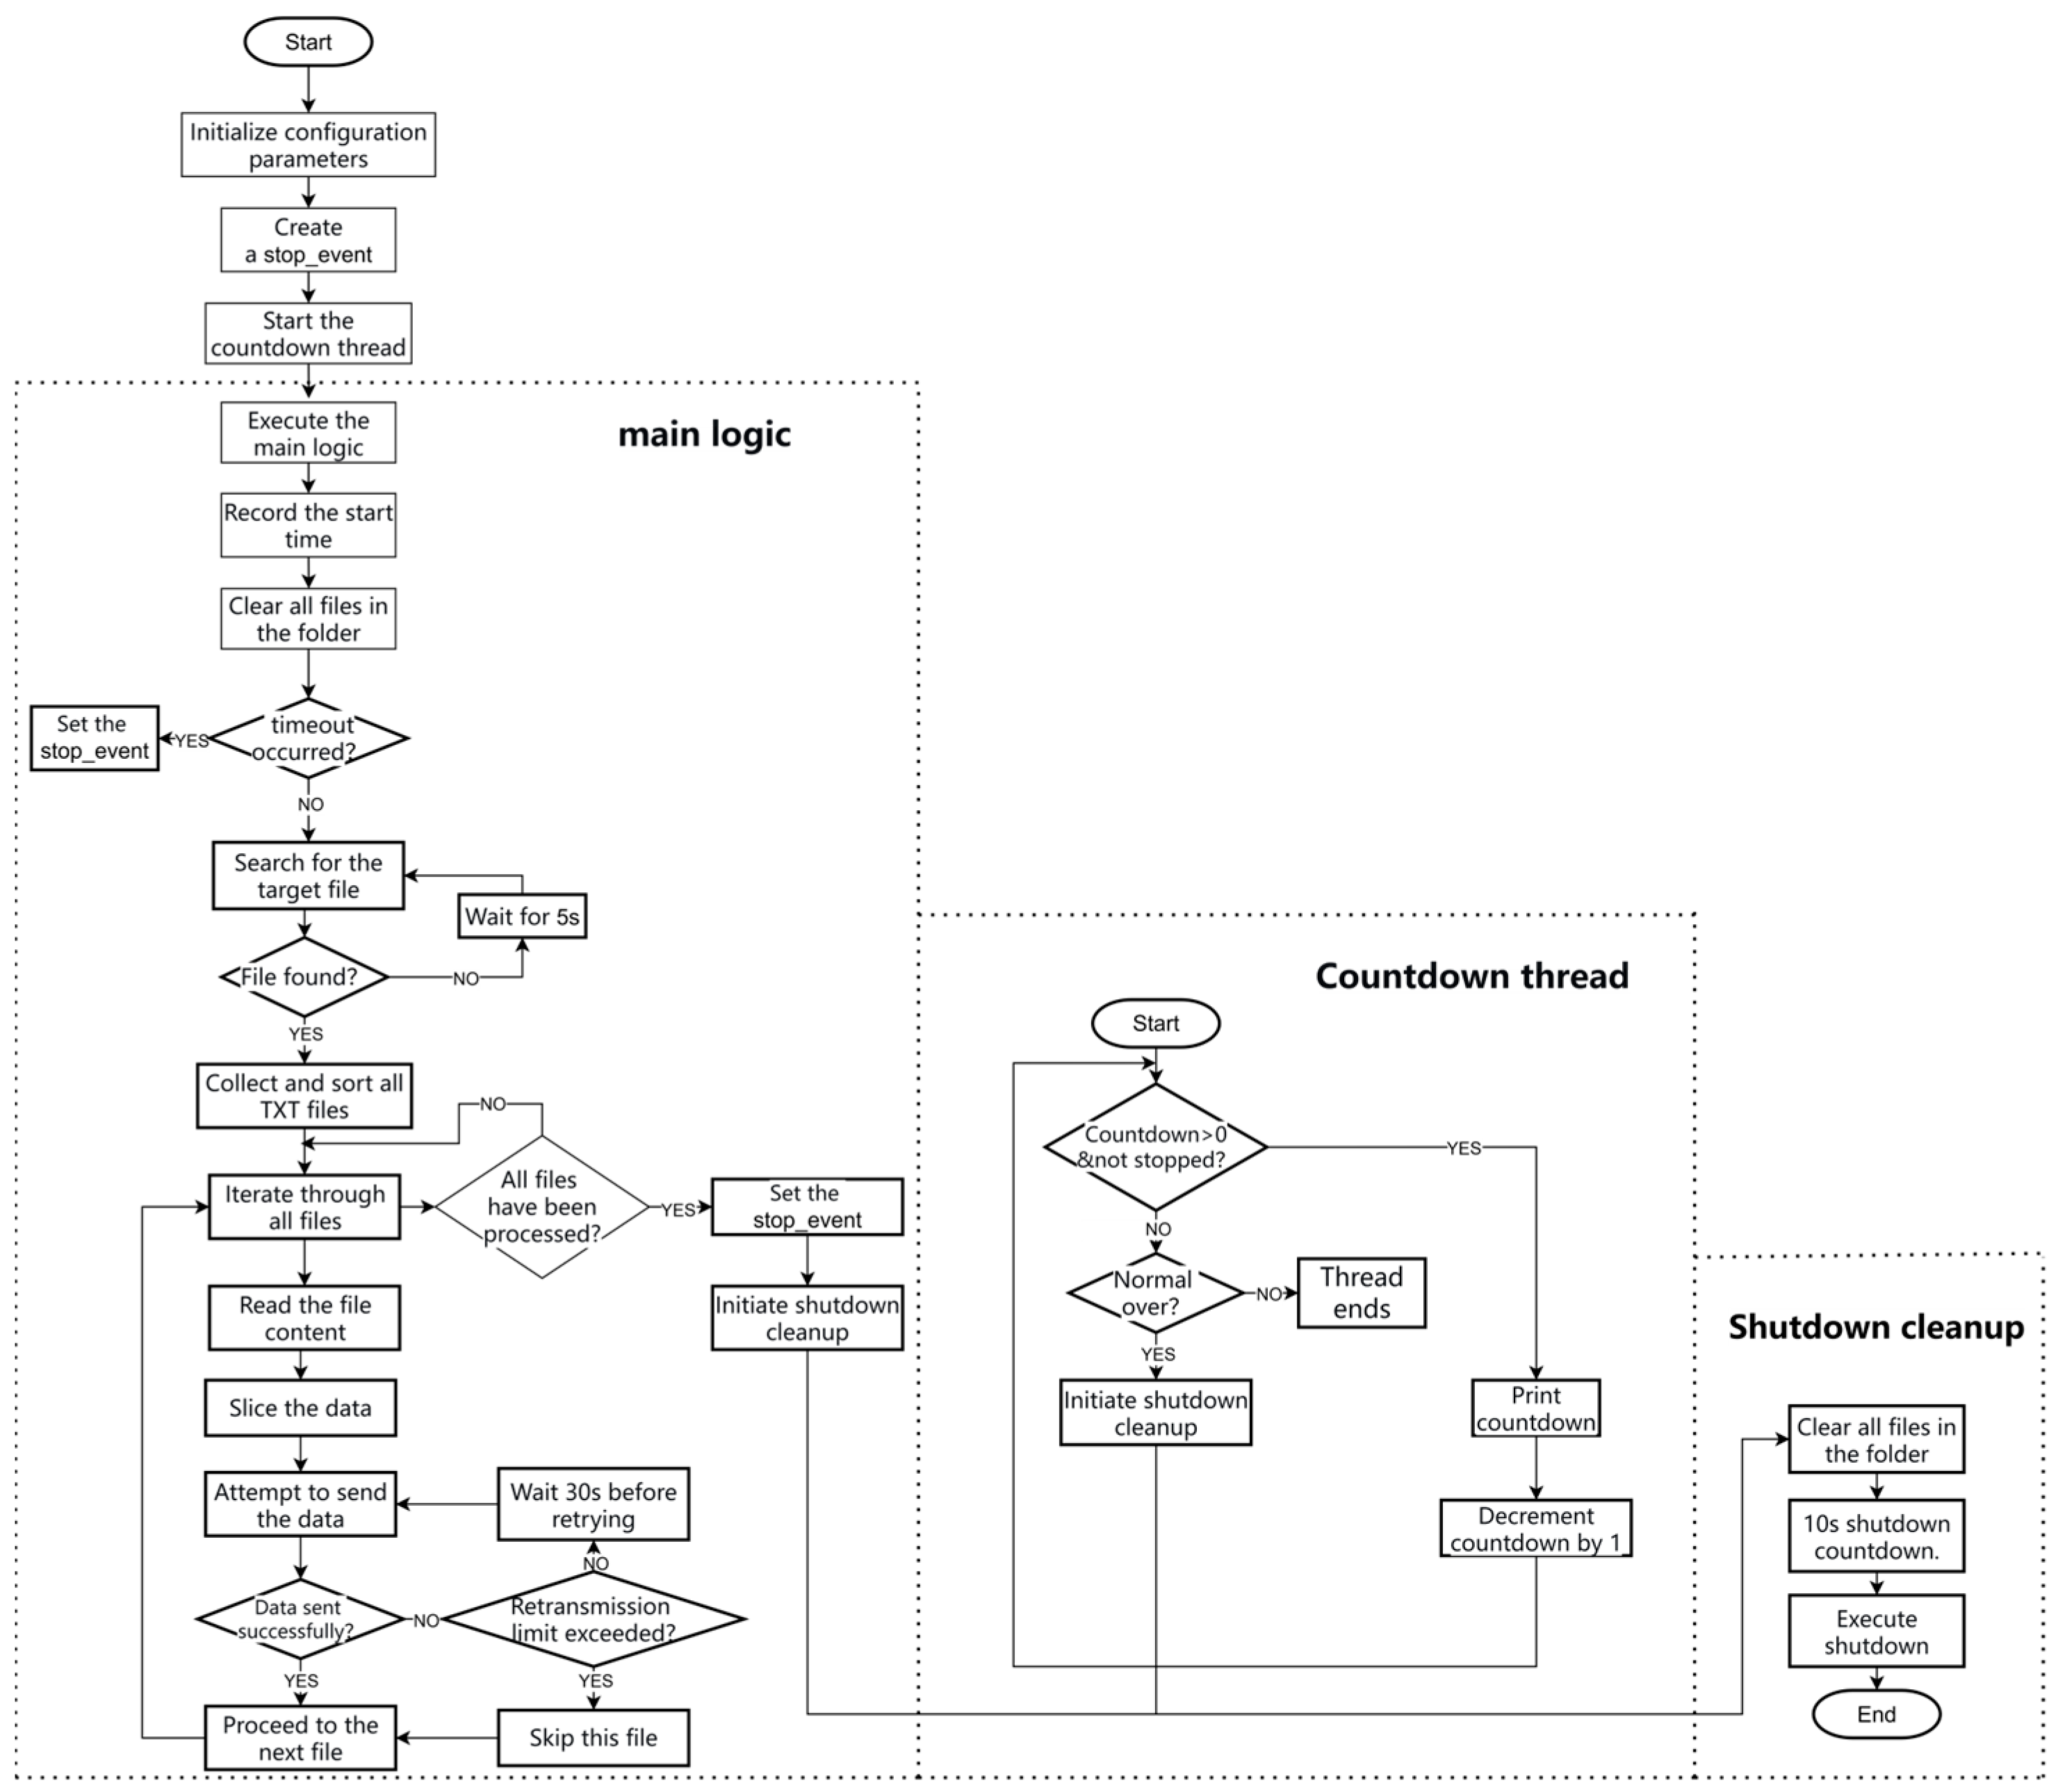
To achieve automated transmission of experimental data and equipment energy saving, this study designed and deployed a file transmission module based on Python (version: 3.9.10) Socket communication on the industrial computer. The system architecture is shown in Figure 8. The main functions of this module include the following: (1) It can automatically monitor the target directory for the appearance of target files. (2) Upon detection of target files, it sequentially reads all .txt files in the directory and then transmits them to the domestic server in fragments via TCP Socket. (3) After completion of transmission, it performs local data cleanup and initiates shutdown operation to achieve unattended automated operation.
Figure 8.
Flowchart of the imaging data transmission module.
The program mainly consists of the following functional modules:
File Search Module: Recursively traverses folders and subfolders to detect the presence of target files, used as a trigger condition to start data transmission.
Data Slicing Module: Splits files into fixed-size fragments (1024 bytes) to avoid network instability caused by excessively large single transmissions, thereby enhancing transmission reliability.
Socket Communication Module: Responsible for establishing TCP connections and sending data. If connection fails or exceptions occur during transmission, the program will automatically retry each file slice up to 3 times in sequence, with a 30 s delay between attempts, enhancing robustness in unstable network environments. Simultaneously, the system utilizes TCP protocol’s built-in checksum and retransmission mechanisms to ensure byte stream accuracy, complemented by the aforementioned acknowledgment retransmission strategy and lossless slicing to ensure data integrity.
Countdown and Shutdown Module: Upon program execution, a parallel countdown thread is started. When the countdown ends or file transmission is completed, file cleanup is performed, and system shutdown occurs. This ensures that the industrial computer performs a soft shutdown after a timeout, avoiding hardware wear caused by a forced hard shutdown. This also prevents additional energy consumption from interrupting prolonged unsuccessful transfers under poor network conditions, thereby ensuring the system can complete tasks over the long term in an unattended environment.
File Cleanup Module: Recursively deletes all files in the specified directory upon startup and before shutdown to avoid data residue, ensuring the uniqueness and security of the data transmission process.
This module implements a fully automated process from file detection, fragmented transmission, to automatic shutdown. Combined with fragmented transmission and multiple retry mechanisms, it effectively copes with unstable network environments, ensuring data transmission success. Automatic cleanup of local files after transmission avoids duplicate sending and saves communication resources, while automatic shutdown controls equipment energy consumption. This design is suitable for automated data transmission scenarios in experimental environments, possessing good practicality and extensibility.
4.3. Imaging Data Reception Module Design
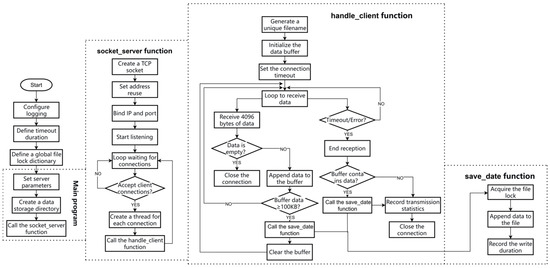
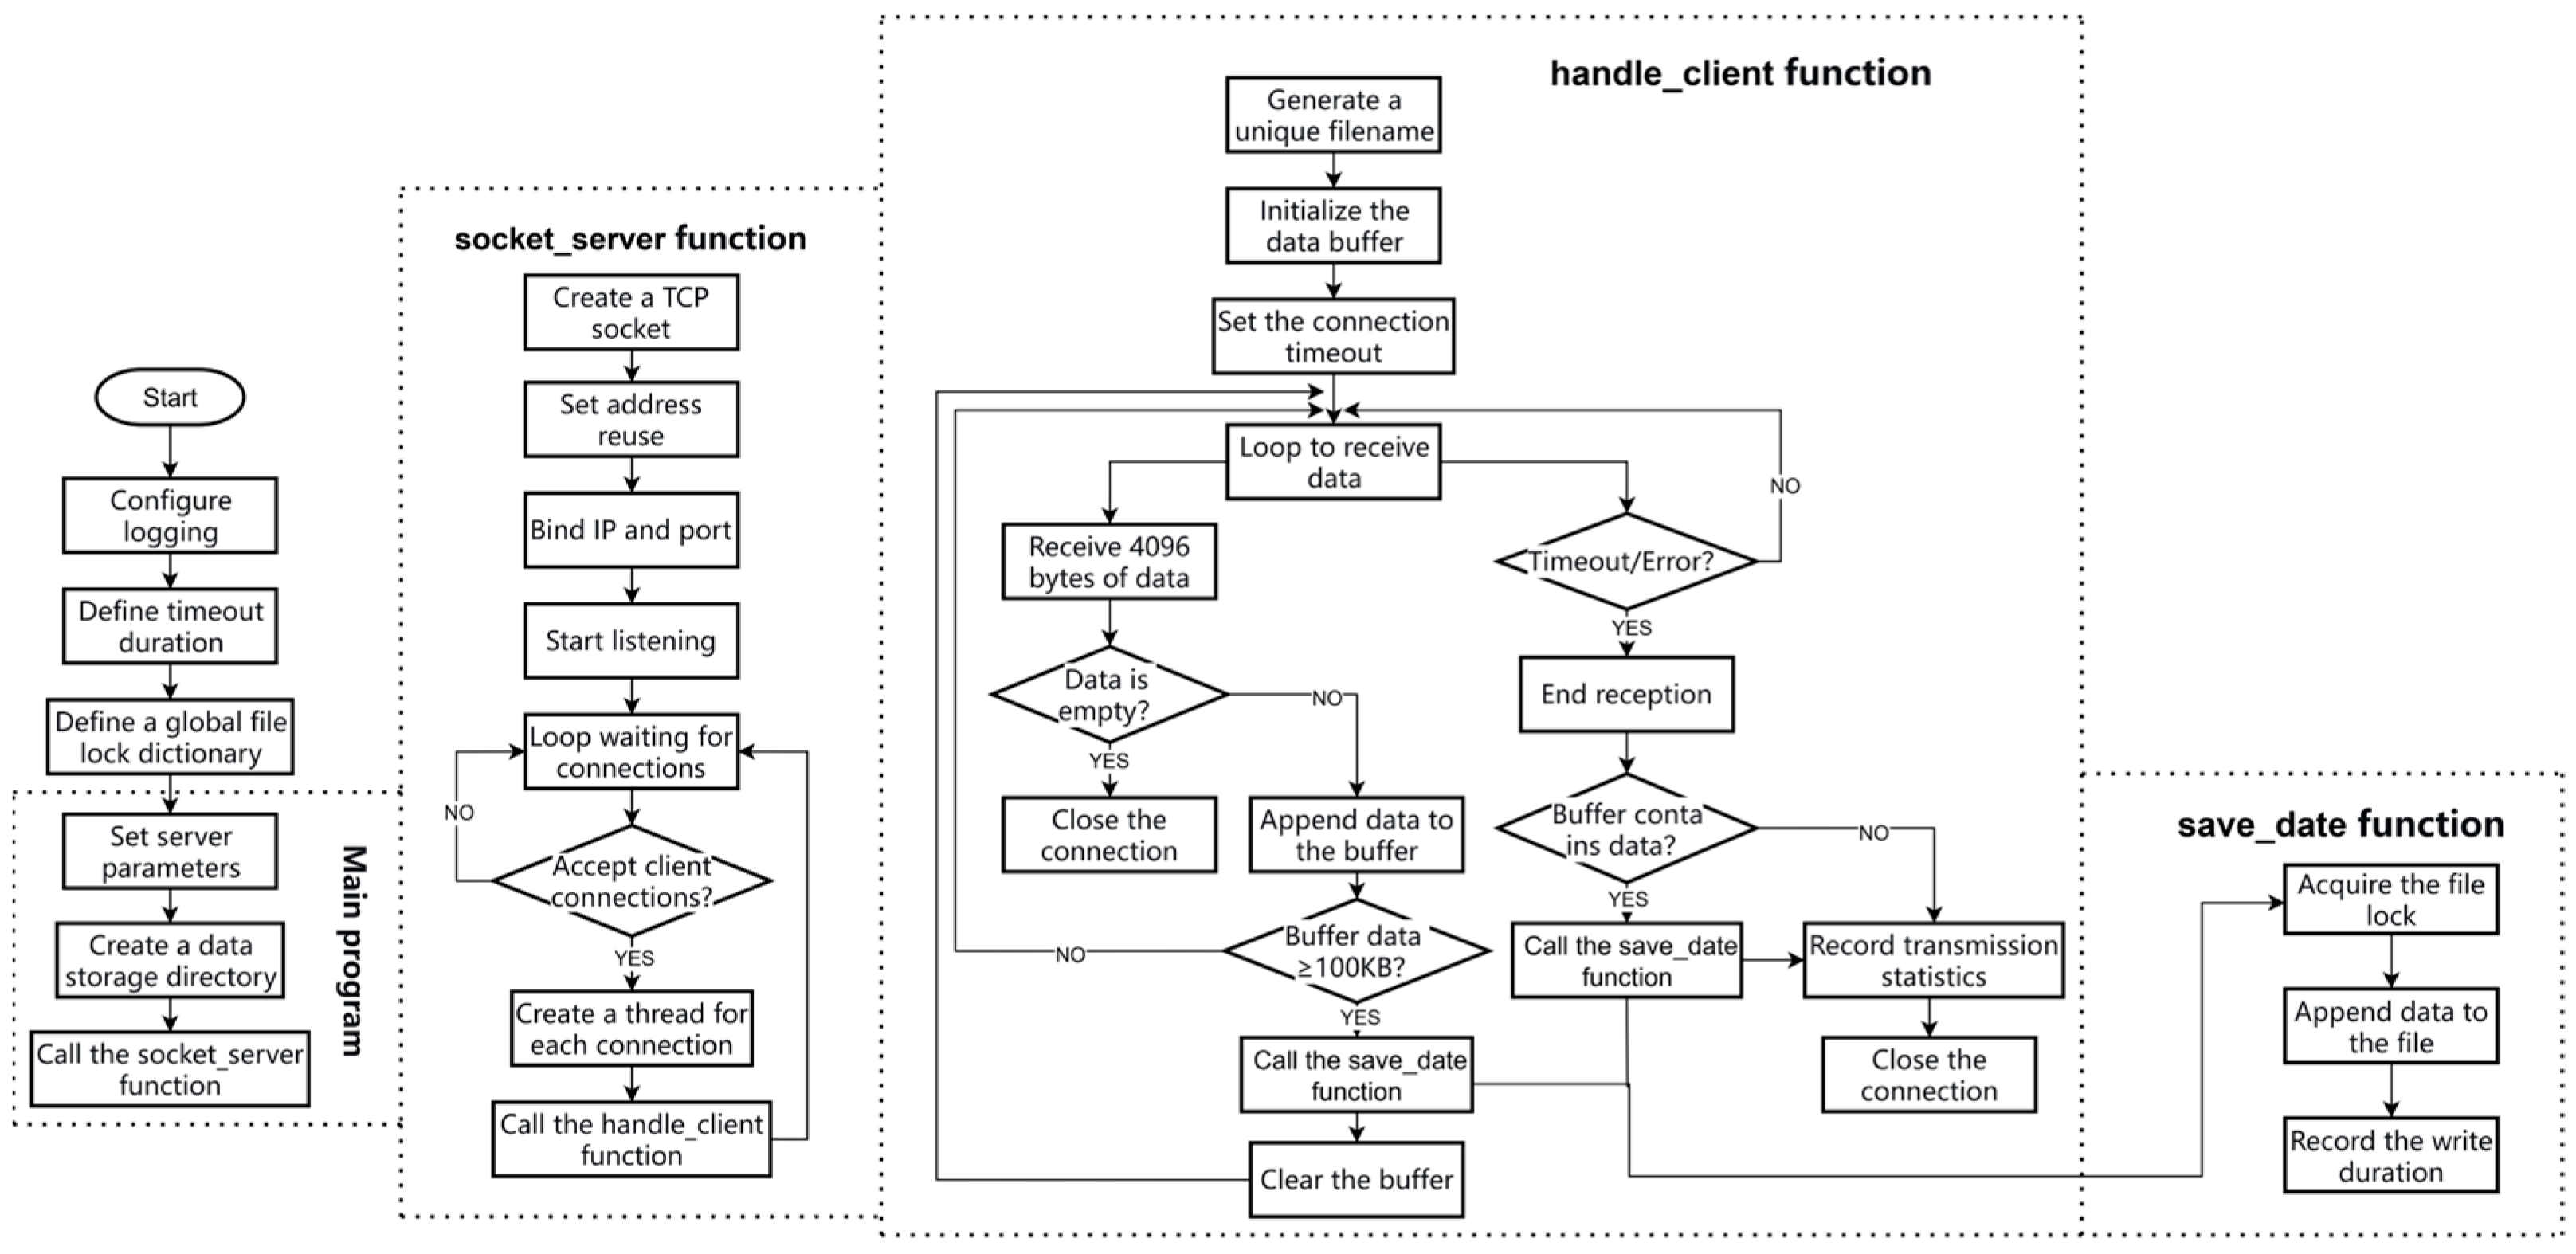
To achieve stable reception and persistent storage of data sent from the upper computer, this study designed and deployed a multi-threaded TCP server program written in Python and deployed on an Alibaba Cloud ECS instance. The system architecture is shown in Figure 9, mainly including modules for server-side socket establishment, client connection management, data reception and buffering, file storage mechanism, and logging monitoring.
Figure 9.
Flowchart of the imaging system data reception module.
The server uses the socket module to create a TCP socket and sets the SO_REUSEADDR parameter to support port reuse. The main thread listens for client connections using the accept() method. Upon detecting a new connection request, it creates an independent thread to handle it, thereby achieving concurrent access for multiple clients and avoiding transmission channel congestion. Additionally, to address high concurrency risks, based on the actual file transmission capability of the imaging system, the maximum concurrent processing thread count is set to 40.
In the data reception phase, the system defines a timeout period (TIMEOUT) to prevent infinite blocking caused by network anomalies. While receiving data, the thread accumulates data fragments into a memory buffer. When the buffered data exceeds 100 KB, it is immediately written to disk to reduce memory usage and improve I/O efficiency. Files are written in binary append mode, and a thread lock (Lock) based file writing mechanism is designed to ensure that the same file is not written by multiple threads simultaneously, thus preventing data corruption.
Furthermore, the system generates unique filenames by concatenating timestamps and thread IDs, ensuring that data from each connection is stored in an independent file to avoid file conflicts. During program execution, the domestic server utilizes the logging module to record data transmission status, including connection establishment and closure, number of packets received, write time consumption, and exception/error information. This mechanism not only facilitates operational status monitoring but also provides a basis for subsequent system performance evaluation and problem troubleshooting. This program implements high-concurrency, reliable, and traceable TCP data reception and storage functions, capable of providing stable data support for subsequent experimental data analysis and processing.
5. Observation System Application and Result Analysis
5.1. Field Application
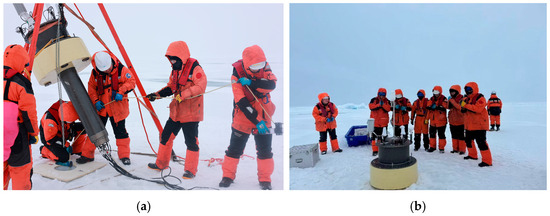
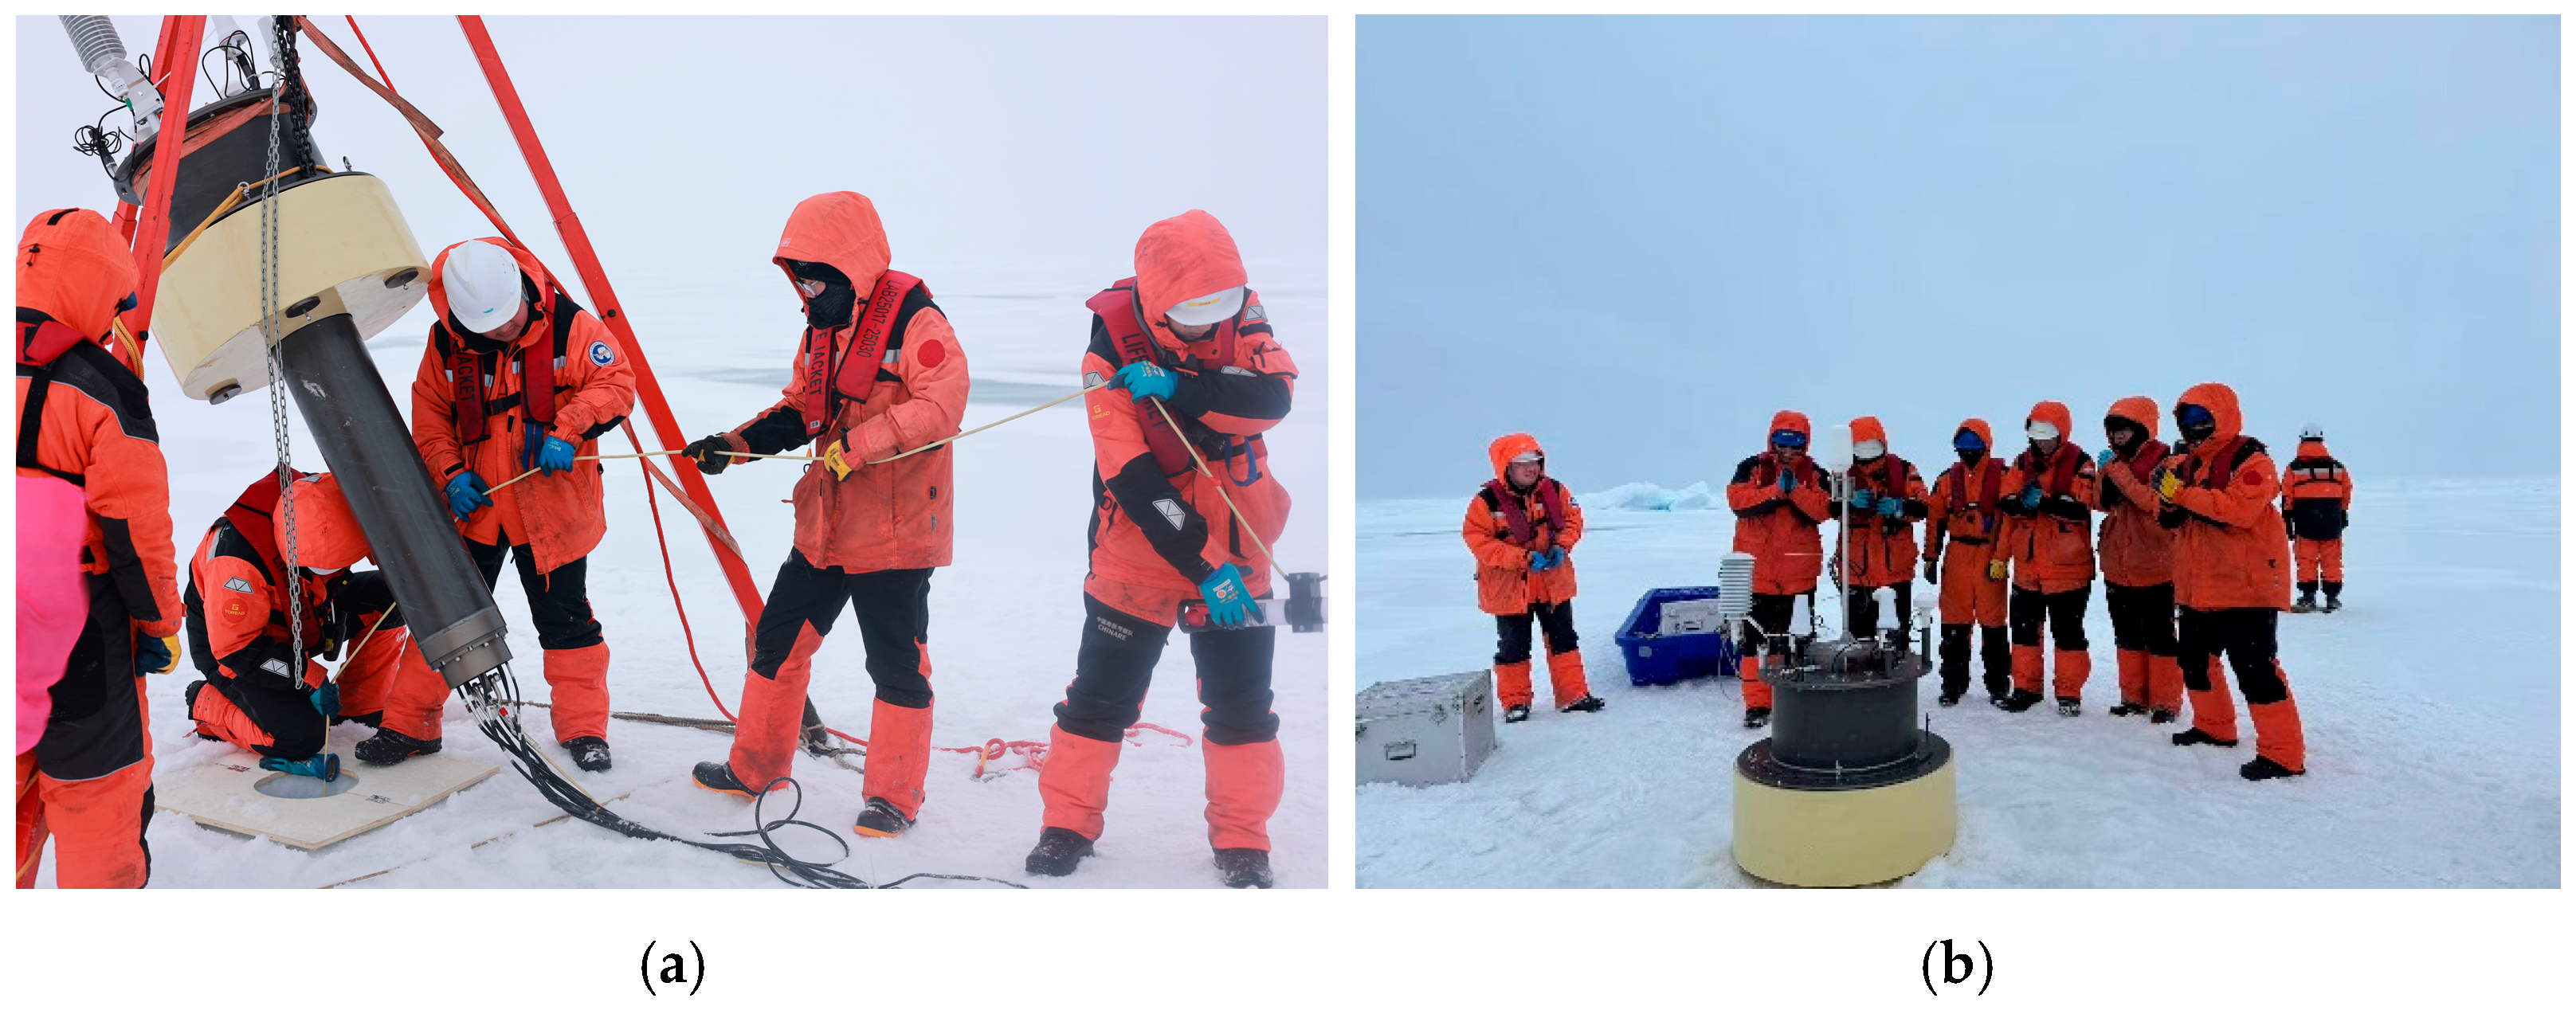
The polar ice-based ecological observation buoy was deployed in July 2025, relying on China’s 15th Arctic Scientific Expedition, to acquire field observation data, as shown in Figure 10. The initial deployment location was 86.9586° N, 151.6633° W. The sea ice thickness at the deployment site was approximately 1.8 m. To ensure system stability and reliability during prolonged ice-drift conditions, a series of protective and securing measures were implemented. A wooden anti-melt plate was mounted at the buoy base to enlarge its contact area with the ice surface, thereby distributing the system’s weight and thermal load and mitigating local melting. Underwater sensors were rigidly fixed at designated depths along a Kevlar safety rope using dedicated clamps, with a 15 kg weight attached to the rope terminus to effectively suppress current-induced oscillations and maintain stable positioning along the under-ice vertical profile. The buoy adopted a low-profile, anti-crush structural configuration with its metacenter positioned above the center of gravity, enhancing static stability and reducing vulnerability to ice pressure and refreezing. The entire system was deployed vertically through a 30 cm ice hole, and all modules operated normally thereafter, demonstrating its long-term reliability in the actual Arctic environment.
Figure 10.
Ice-based ecological observation buoy deployed during China’s 15th Arctic Expedition. (a) Deployment process; (b) deployment results.
5.2. Observation Data Analysis
Since deployment, the ice-based ecological observation buoy has collected data from conventional meteorology and CTD sensors at a sampling frequency of once per hour, and the imaging observation system at a frequency of once per day. Data were transmitted back to the domestic monitoring platform via the Iridium 9523 and Iridium Skylink modules, respectively. This paper briefly analyzes data from a one-month period from 25 August 2025 to 25 September 2025. As shown in Table 1, from deployment through one month of continuous operation, the data transmission rate for conventional sensors reached 100%, and the data transmission rate for the imaging system greatly exceeded the design requirement of 33.3%. System operation met expectations.
Table 1.
Data Transmission Status.
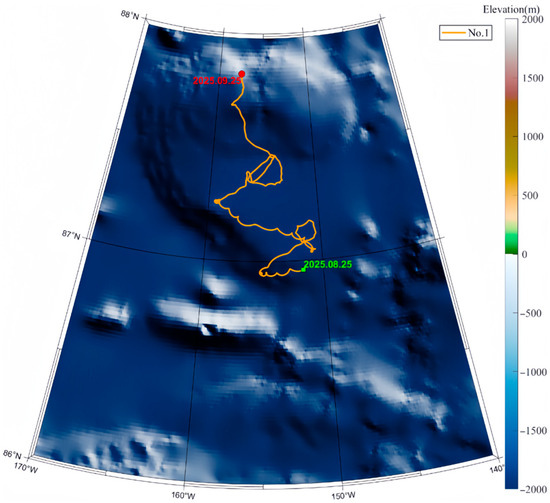
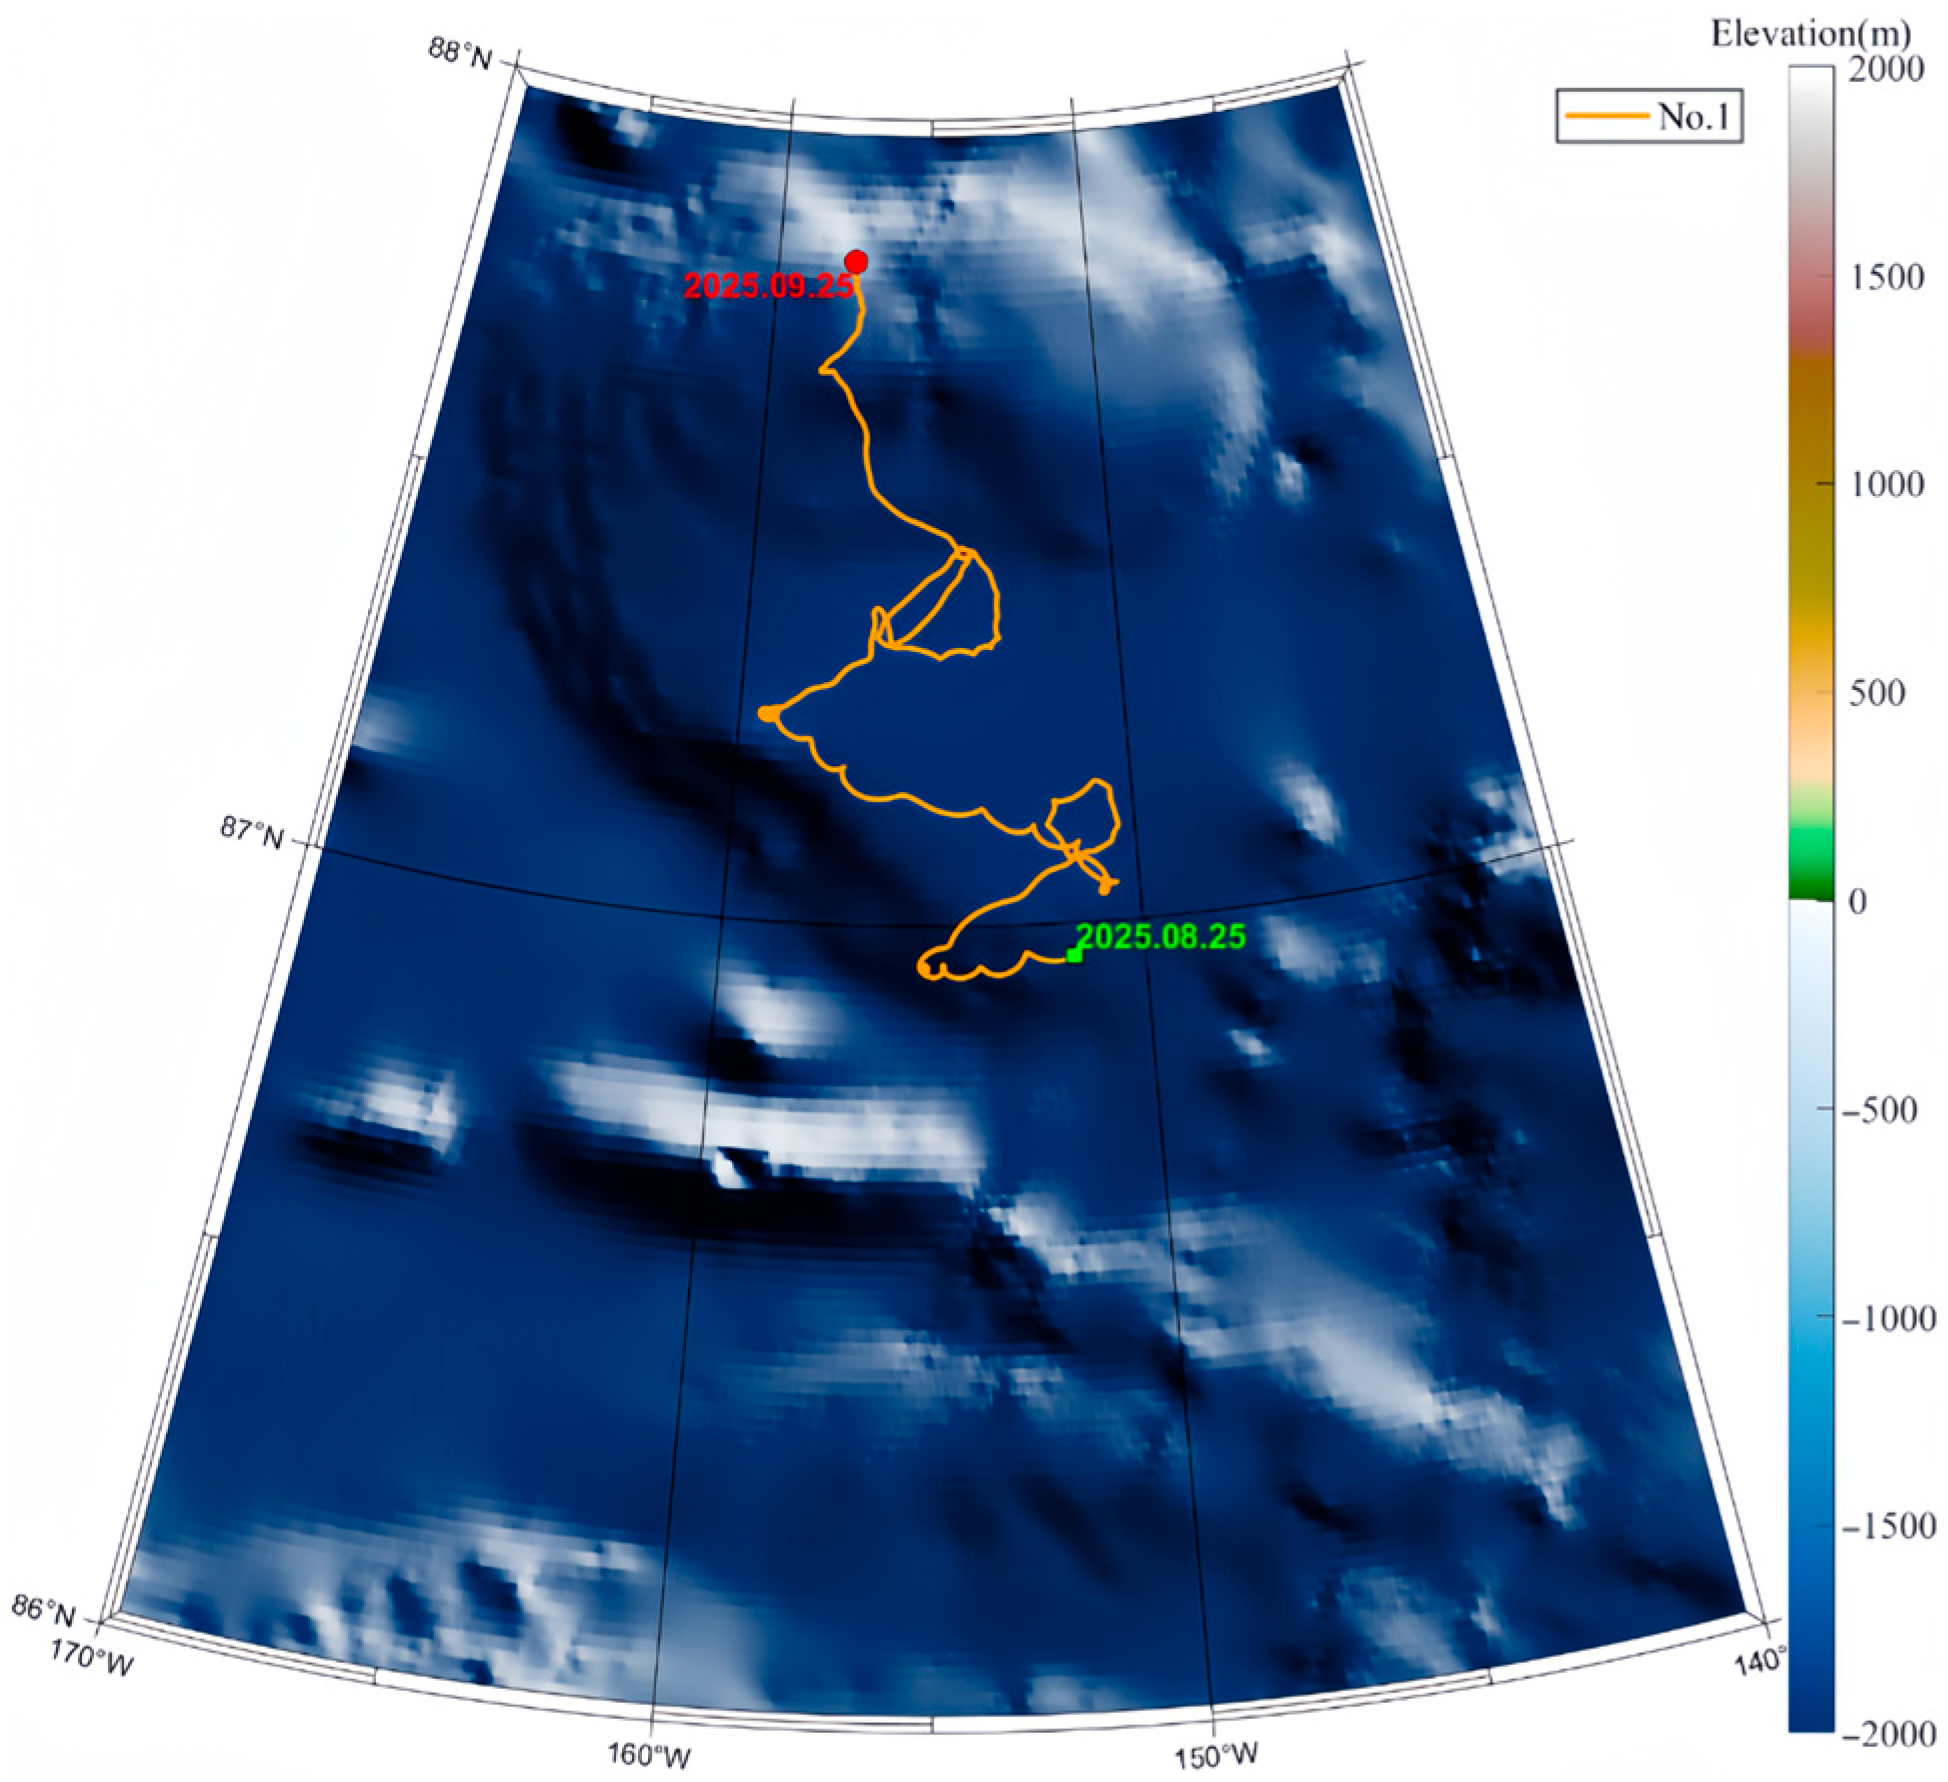
After the ice-based ecological observation buoy was deployed on the Arctic sea ice, the system moved continuously with the drifting ice. Figure 11 shows the drift trajectory of the system over the first month. It can be seen from Figure 11 that the deployed sea ice primarily moved northeastward during the period from 25 August 2025 to 25 September 2025, mainly controlled by the Transpolar Drift Stream in the central Arctic Ocean.
Figure 11.
Drift trajectory of the ice-based ecological observation buoy.
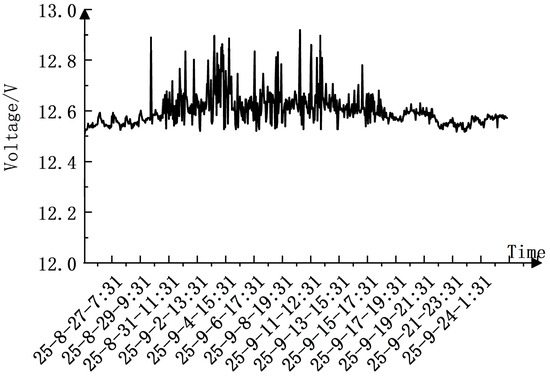
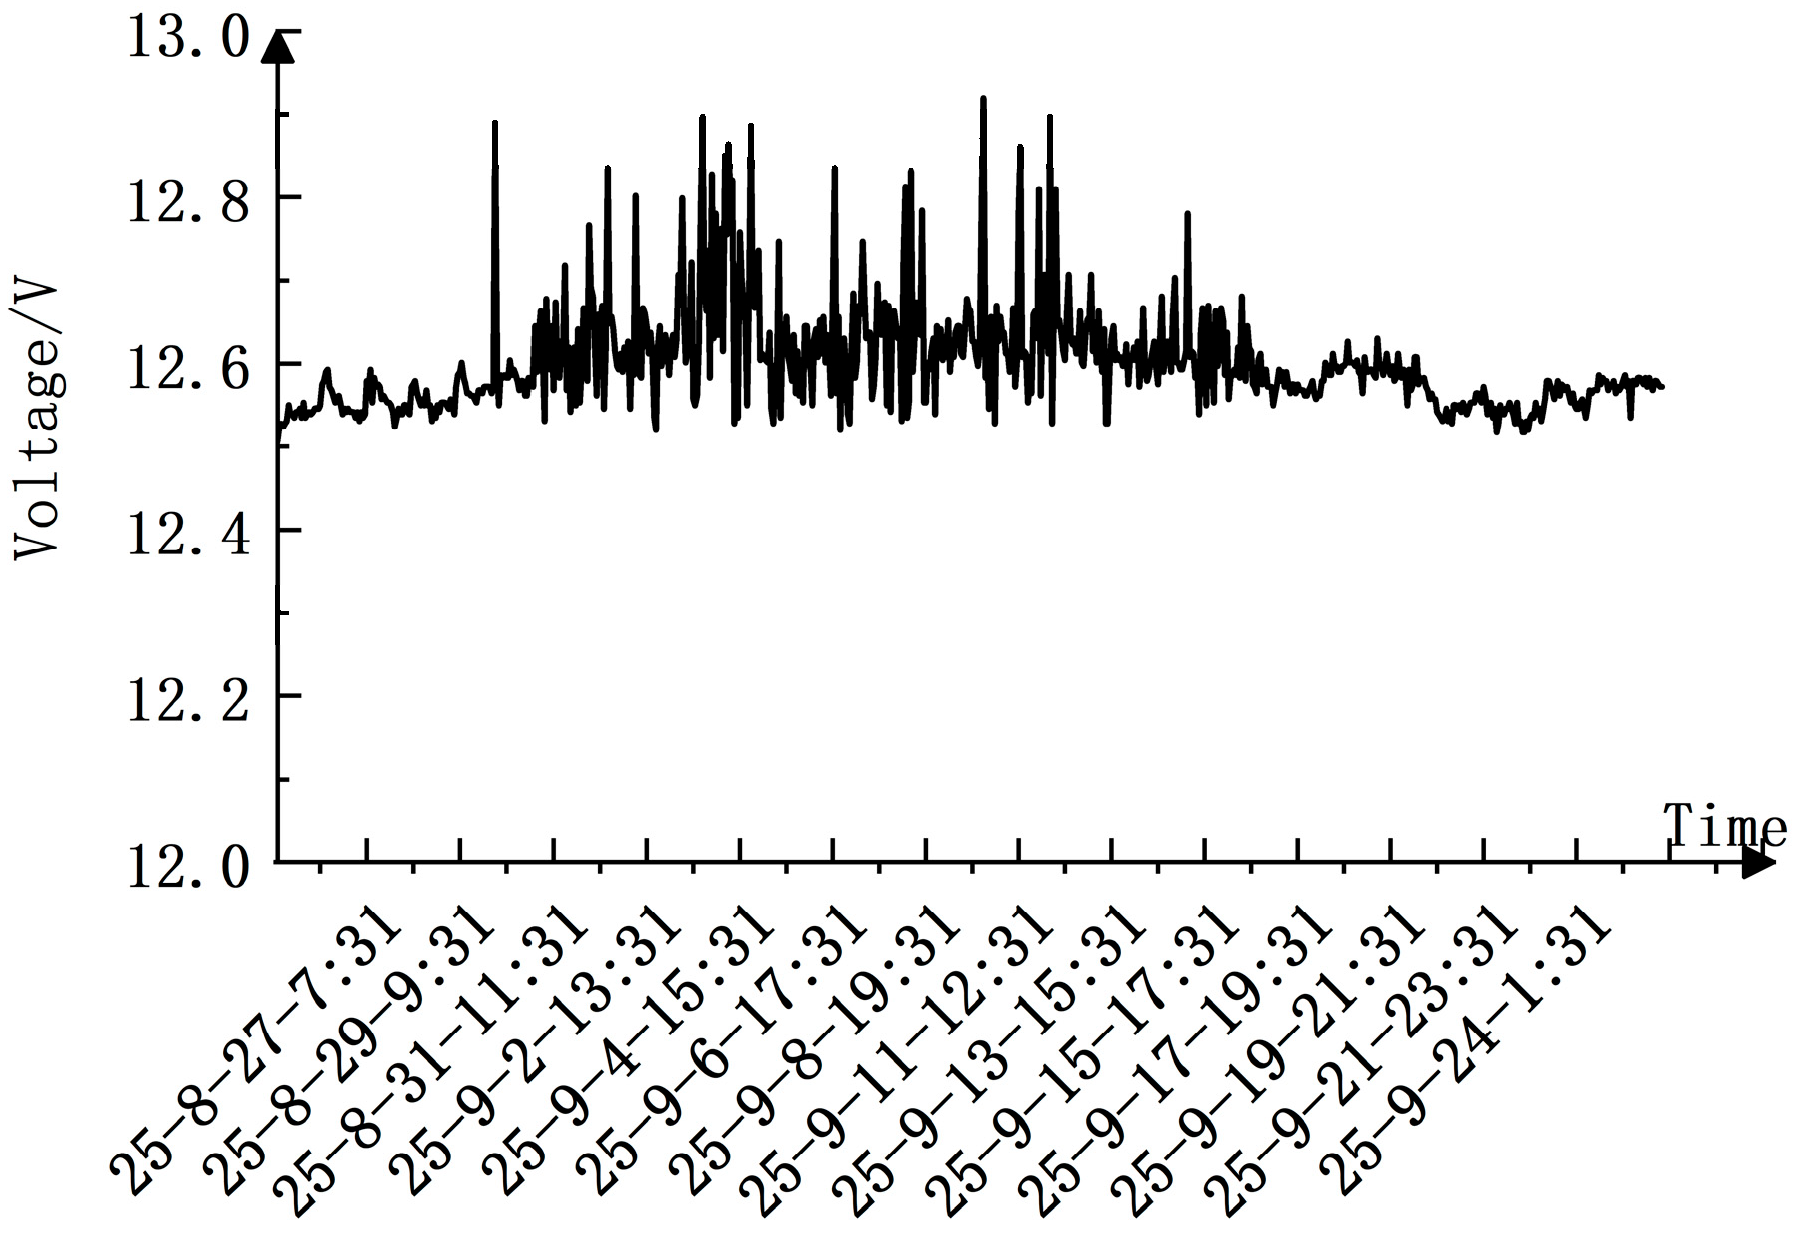
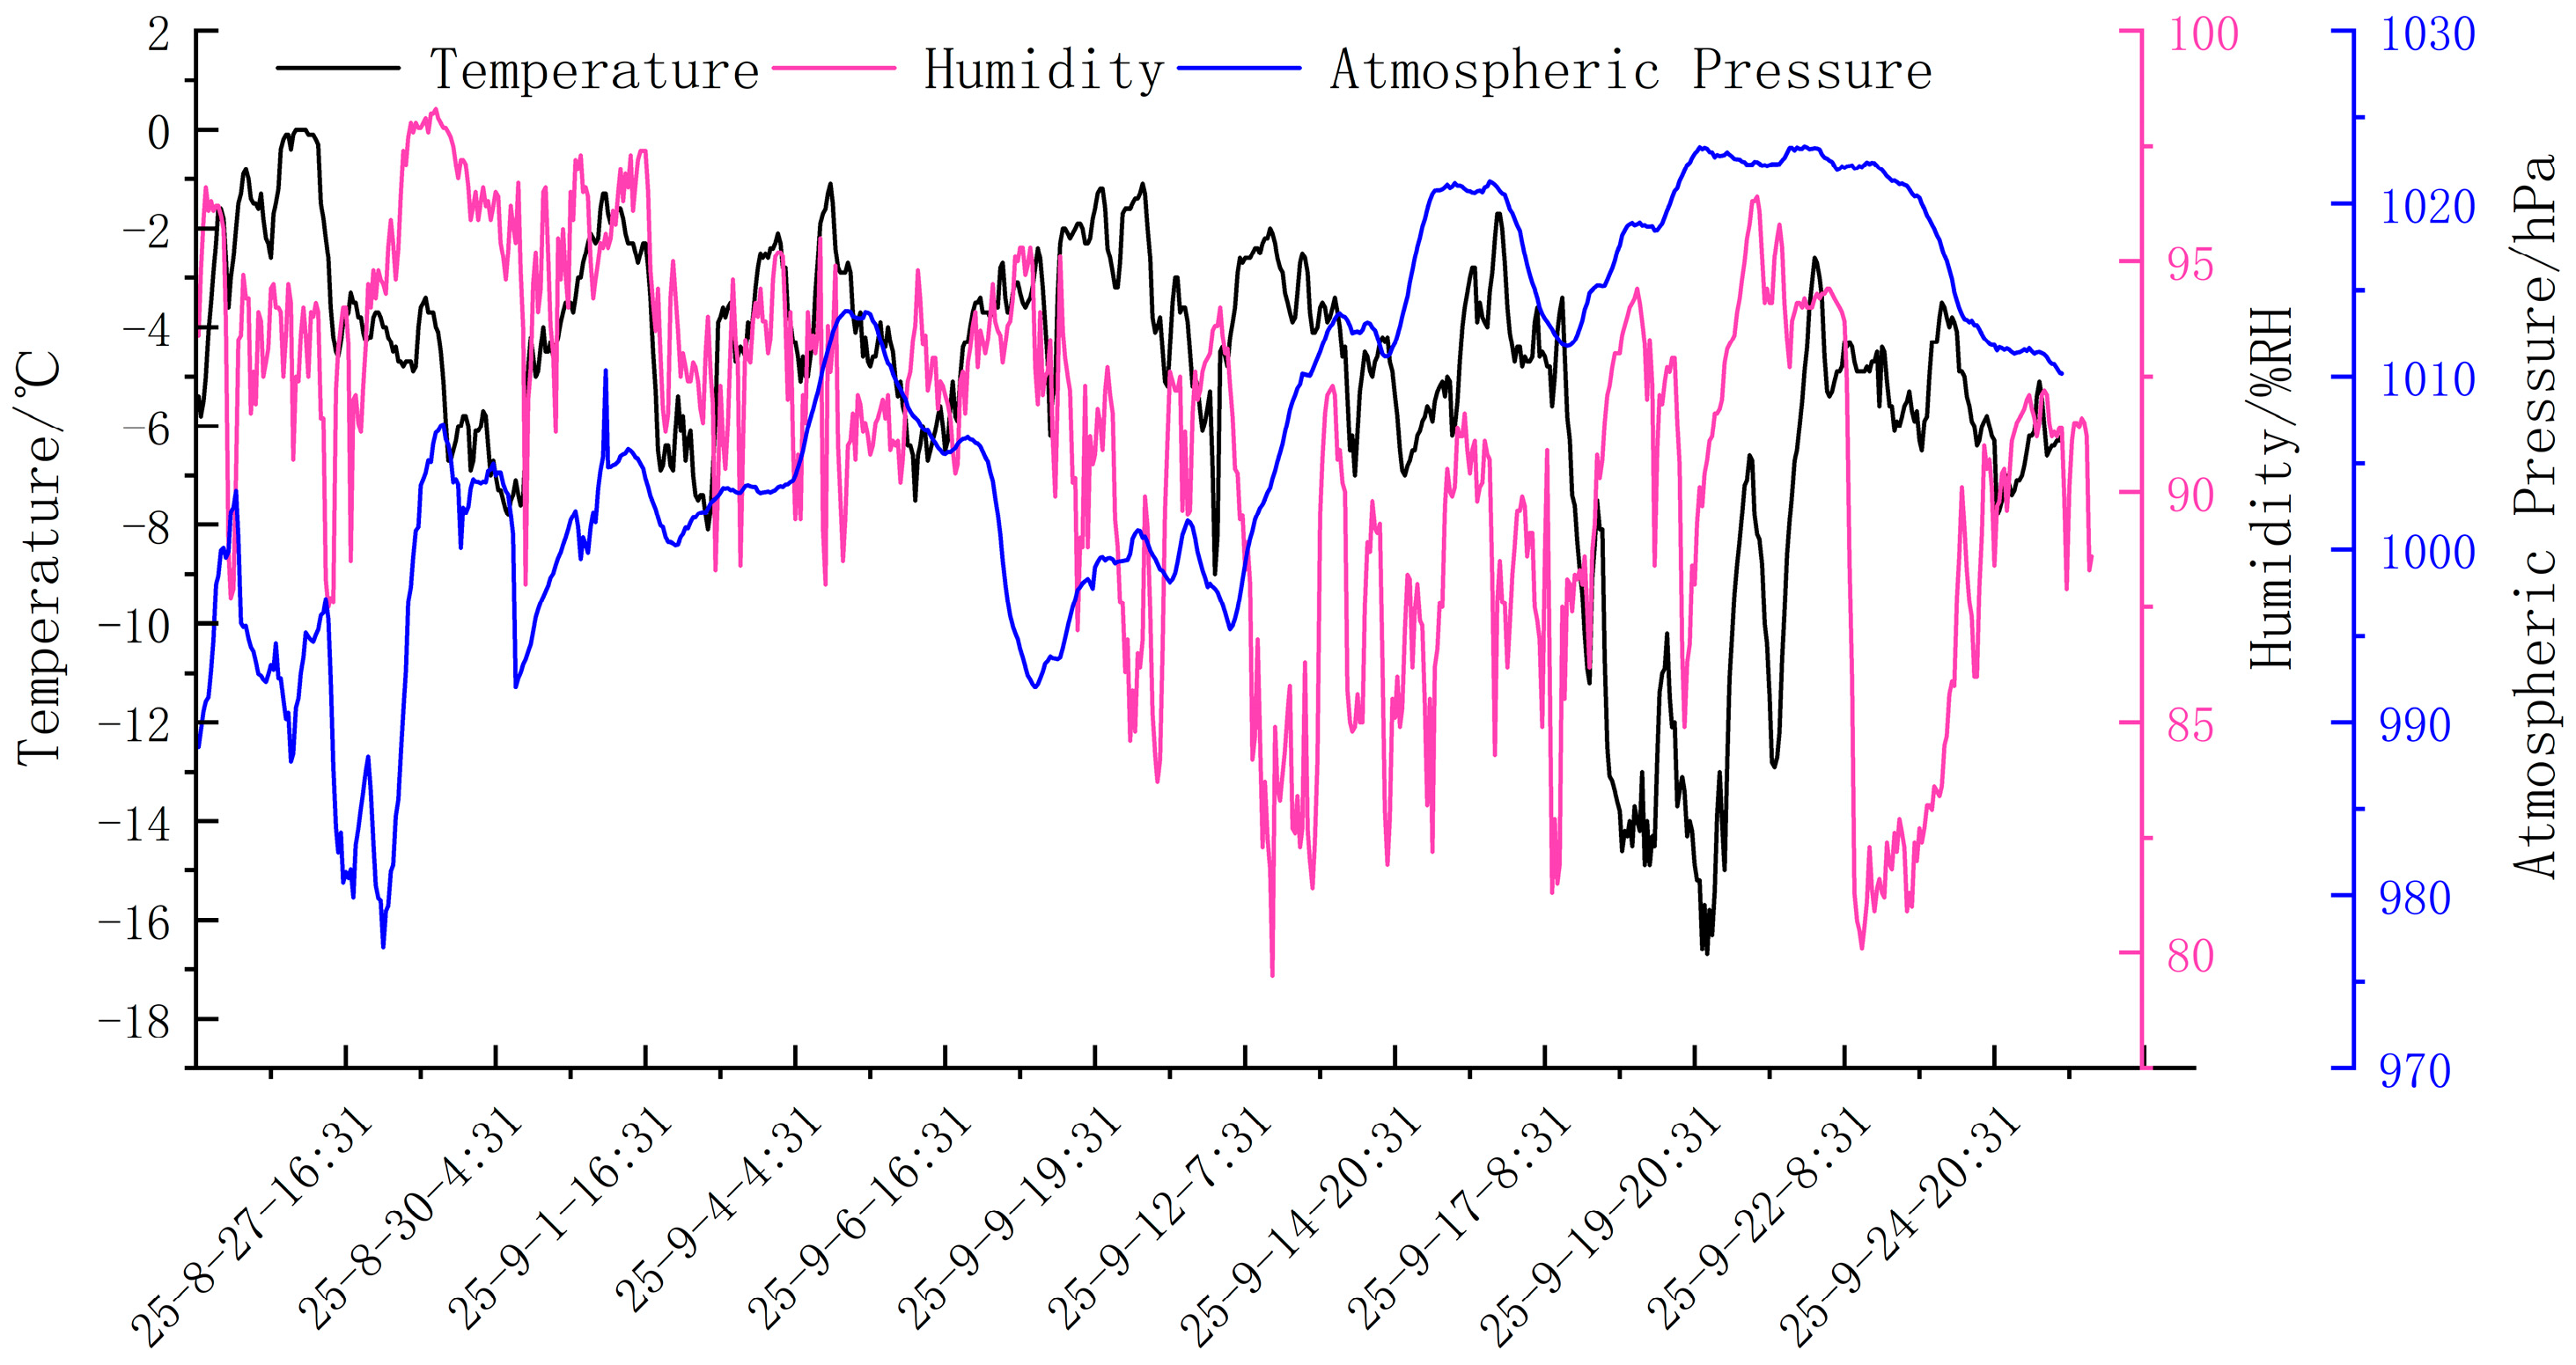
During the buoy’s deployment, the power supply module voltage was synchronously monitored by the main buoy control board at a sampling frequency of once per hour. As shown in Figure 12, during the observation period, the supply voltage remained stable within a narrow range of 12.5 V to 13 V, exhibiting only minor fluctuations. This voltage range conforms to normal expectations for a 12 V power system, indicating stable and reliable operation of the power supply module during long-term observation. Despite significant ambient temperature variations in the Arctic (see Figure 13), the supply voltage showed no anomalous drift, further confirming the environmental adaptability of the power system.
Figure 12.
Voltage variation of the ice-based ecological observation buoy.
Figure 13.
Meteorological data from the ice-based ecological observation buoy.
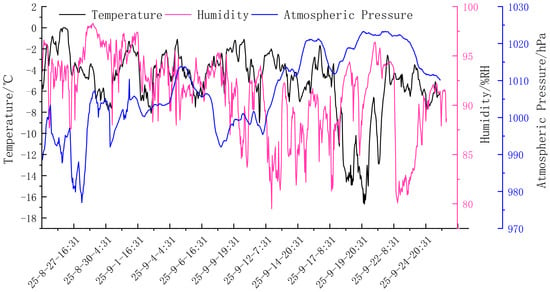
The air temperature data acquired by the ice-based ecological observation buoy is shown in Figure 13. The air temperature varied significantly during the observation period (−16.7 °C to 0 °C). At deployment, the temperature fluctuated around −4 °C. Around September 20th, the temperature dropped sharply and fluctuated violently, later returning to levels similar to those at deployment. The relative humidity ranged from 80.9% RH to 98.3% RH, with overall high humidity levels. This is because the observation system was deployed during the Arctic summer, where persistent sunlight, rapid sea ice melt, and periodic temperature rise led to generally high and fluctuating humidity. Atmospheric pressure at the deployment site fluctuated between 977.01 hPa and 1023.32 hPa, with no clear pattern.
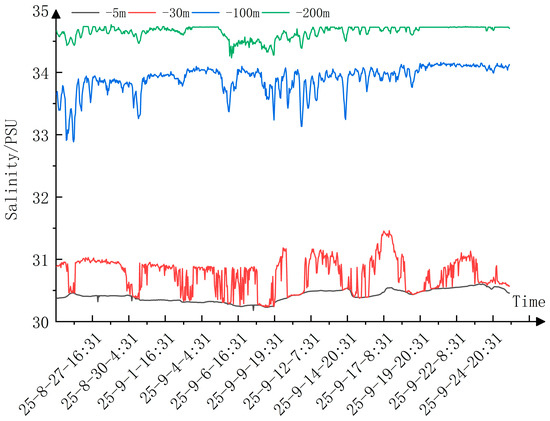
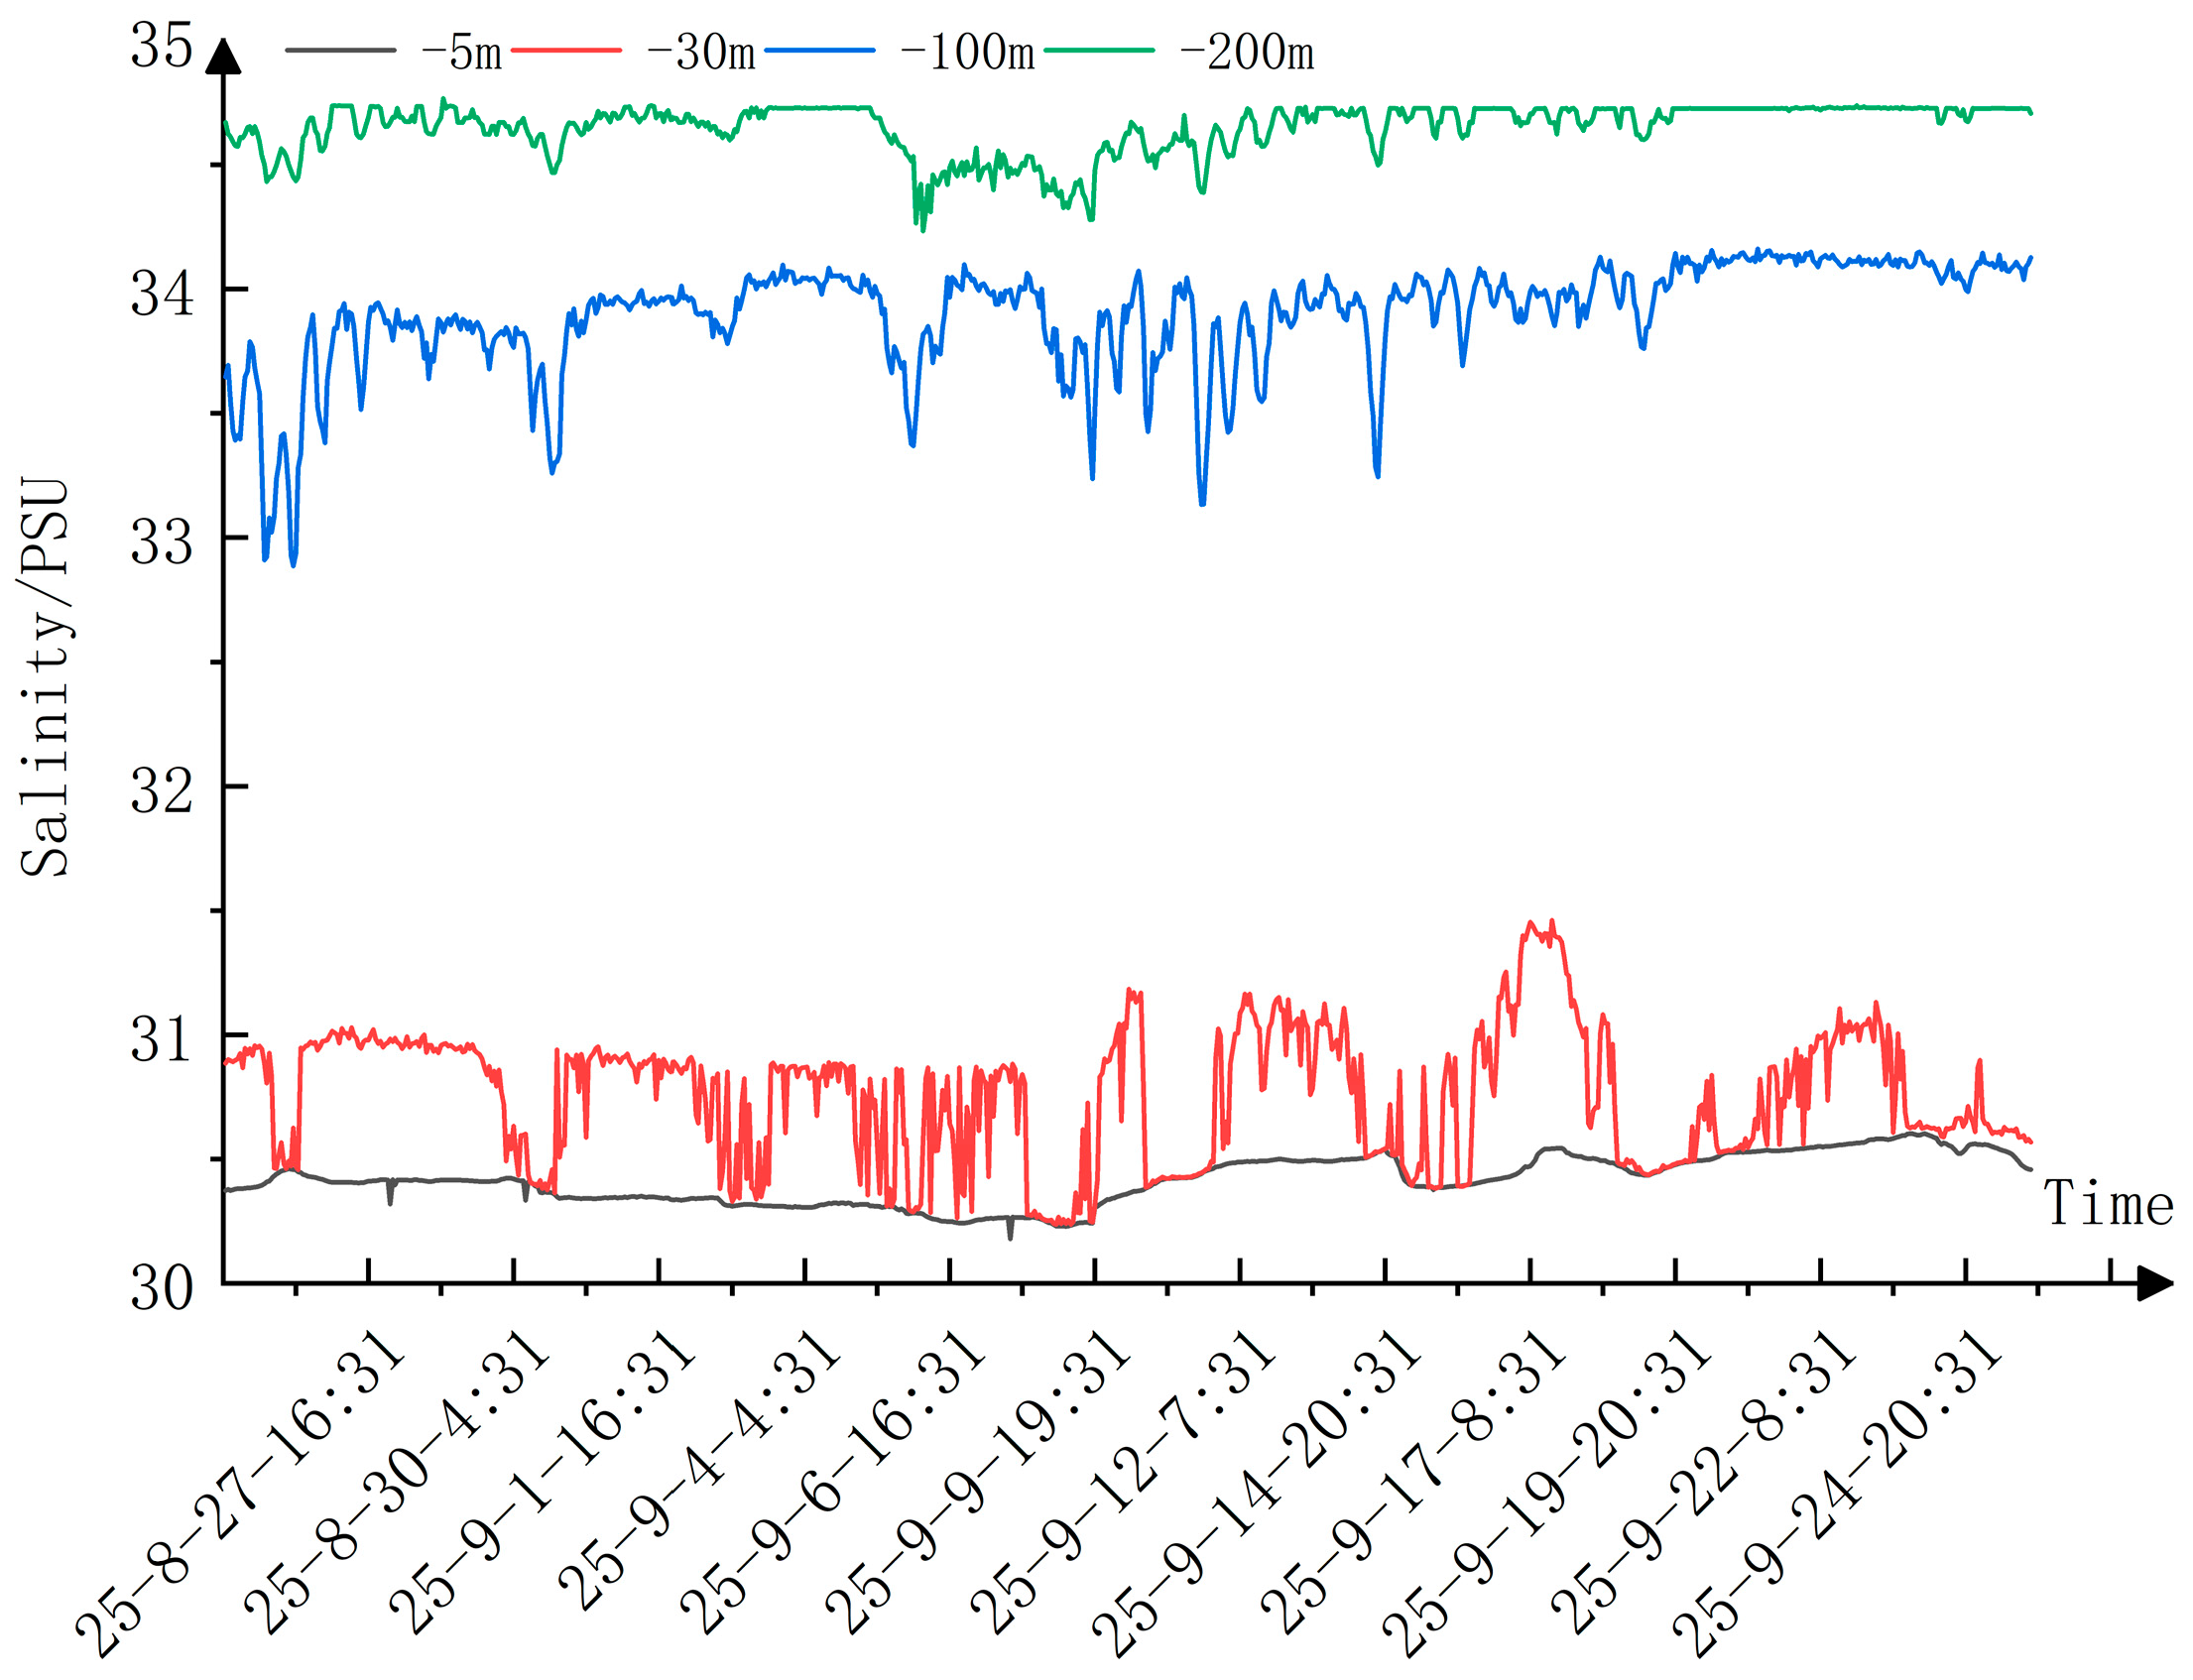
The ice-based ecological observation buoy employed RBRbrevio3 C.T.D sensors from RBR (Ottawa, ON, Canada) to obtain under-ice salinity profile data. Each sensor integrates inductive conductivity, fast-response temperature, and high-precision pressure sensors, and salinity is derived from measured conductivity, temperature, and pressure. Four sensors were rigidly mounted at preset depths of 5 m, 30 m, 100 m, and 200 m along a Kevlar safety rope. A 15 kg weight was attached to the end of the rope to suppress current-induced motion, ensuring depth stability at all levels throughout the observation period. The resulting measurements constitute quasi-synchronous time-series data at fixed depths. As shown in Figure 14. Salinity at 5 m under the ice fluctuated slightly, but salinity at the 30 m, 100 m, and 200 m depths fluctuated significantly. This is because the surface layer interacts directly with the atmosphere, and its salinity is primarily controlled by air–sea freshwater fluxes such as evaporation and precipitation and is well-mixed by dynamic processes such as wind and waves, resulting in a relatively uniform salinity distribution. In contrast, the halocline is a transition layer where water masses with different temperature and salinity characteristics from the surface layer stratify according to density at this depth, making it the layer with the largest salinity gradient, the observation data indicate that its vertical gradient value can reach, on average, more than 0.033 psu per meter, and exceeds 0.054 psu at certain depths.
Figure 14.
Multi-layer seawater salinity data from the ice-based ecological observation buoy.
The underwater image data acquired and transmitted back by the ice-based ecological observation buoy underwent encoding processing. To ensure transmission reliability, the system uses Base64 encoding to convert image data into .txt format and divides the daily data into 40 packets for transmission, reducing the risk of packet loss due to network instability.
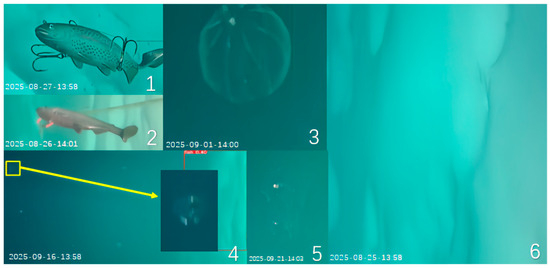
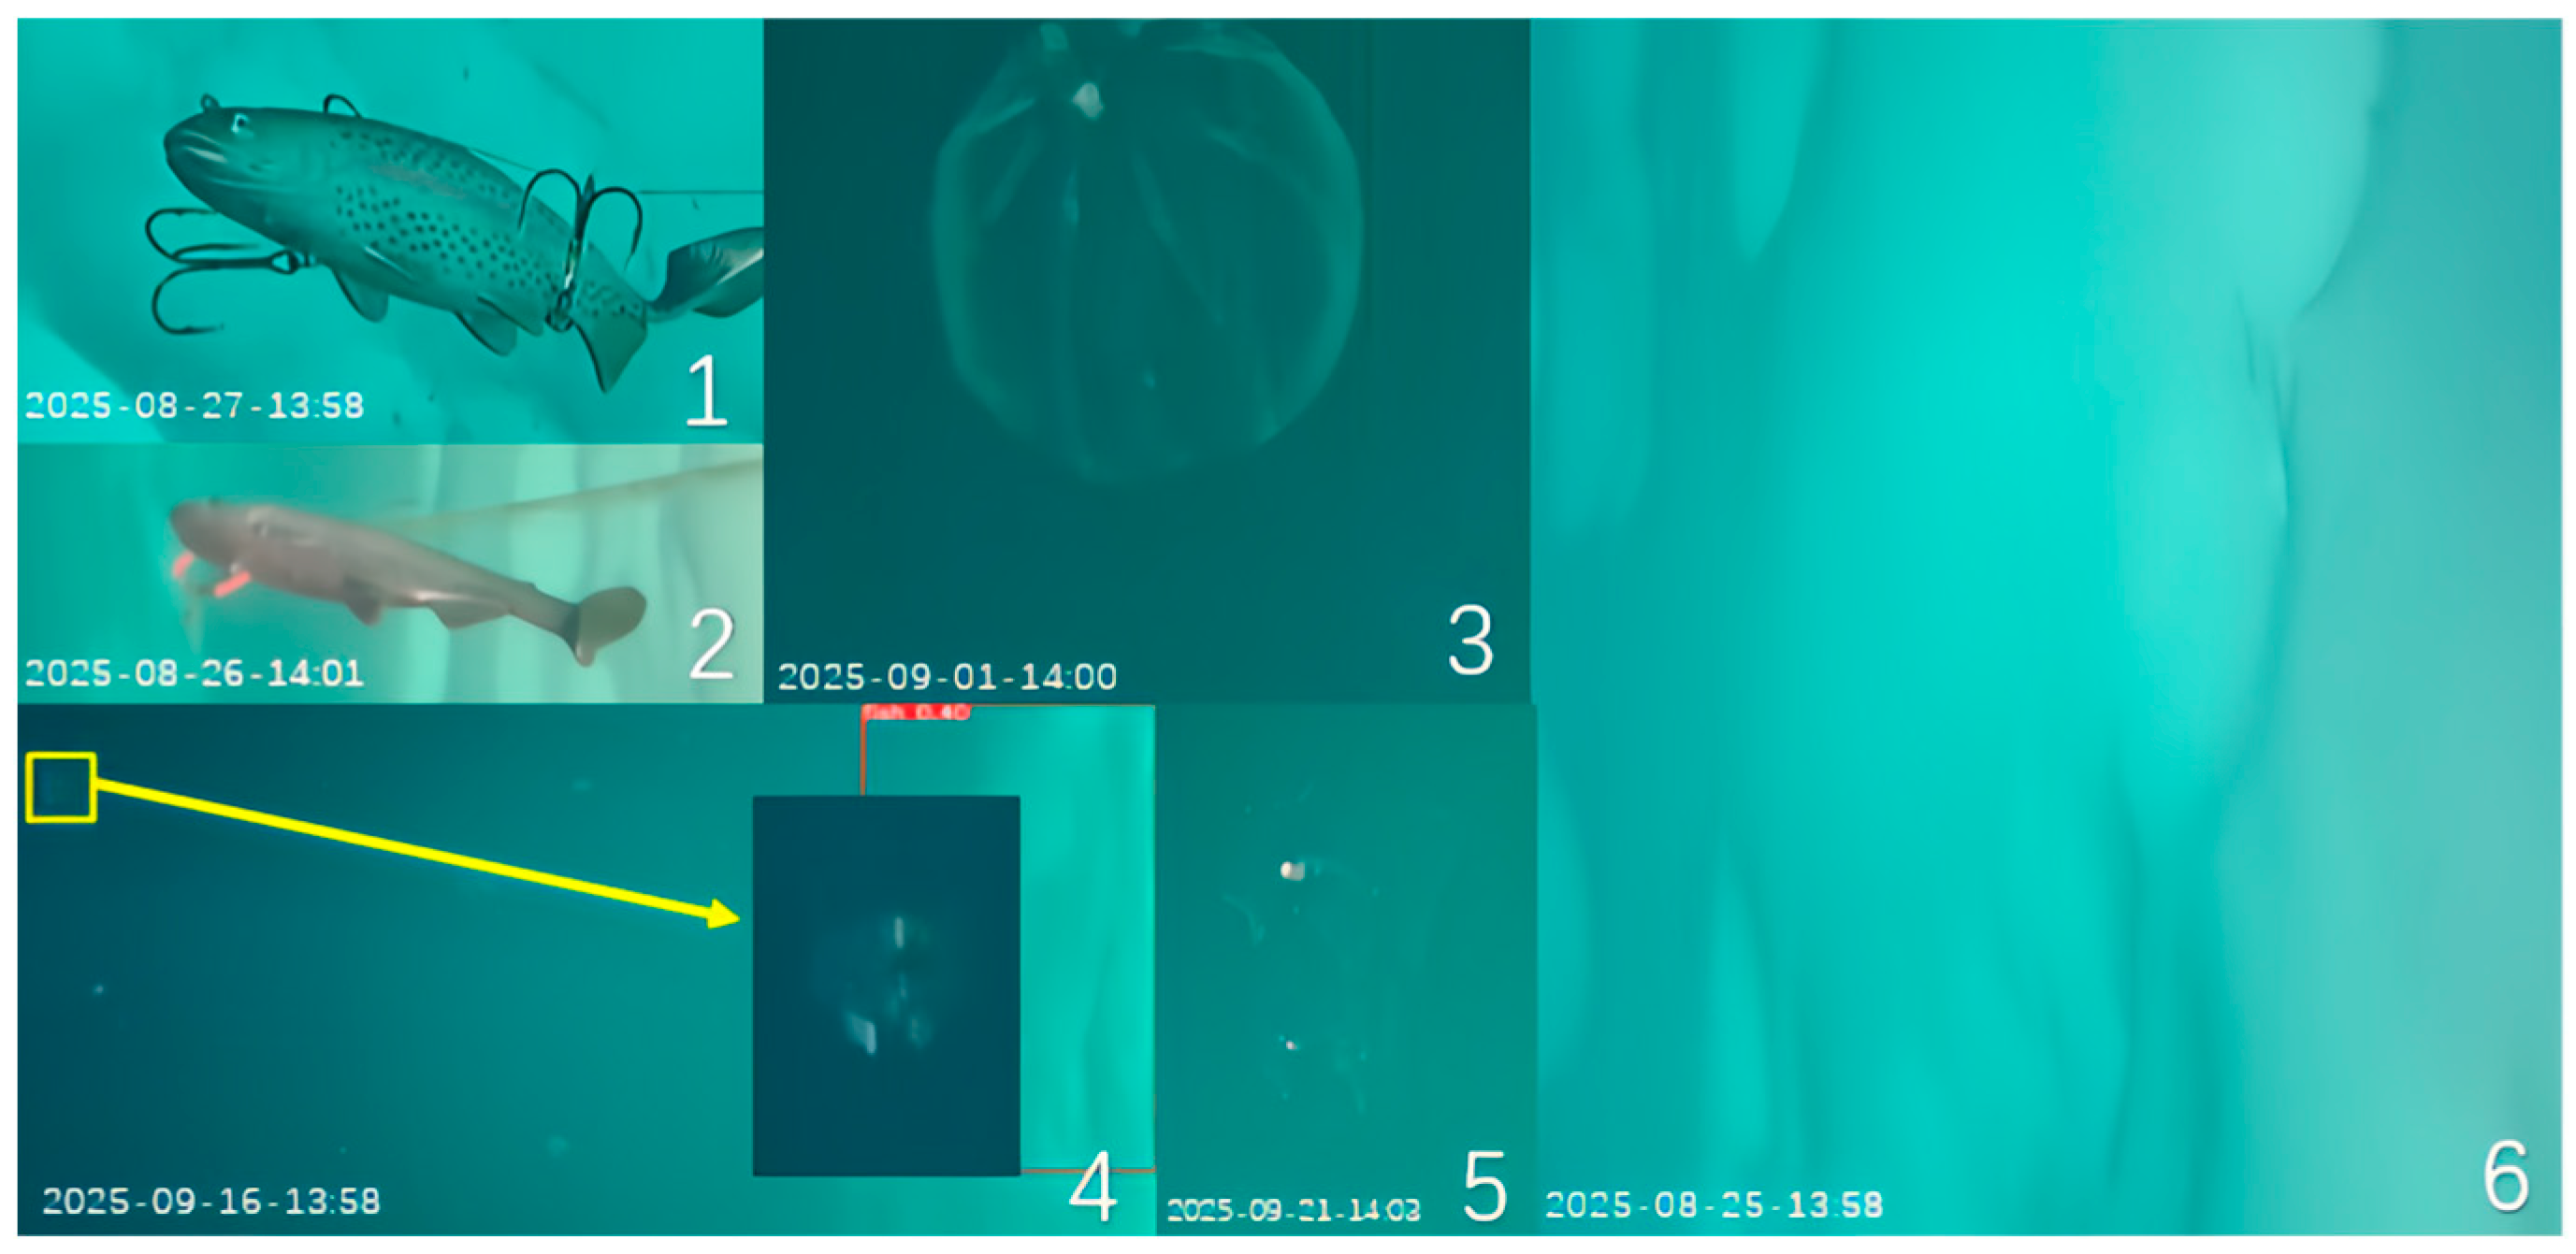
To maximize data return under the constraints of high polar satellite communication costs, the system adopted a first-frame transmission strategy. In addition to transmitting all static images processed onboard, the first valid frame of each mission was also sent to verify the communication link and provide baseline scene coverage. Owing to this transmission strategy, the images lack fixed reference objects, and thus, absolute size estimation and scale calibration cannot yet be performed. As shown in Figure 15, the system successfully recorded the preset bionic fish reference targets (Figure 15(1,2)) as well as multiple suspected biological targets (Figure 15(3,5) and the partial view in Figure 15(4)). The images were collected by a unit fixed 3 m beneath the ice, with a resolution of 1920 × 1080, under artificial constant illumination. Capture times were calibrated using satellite timestamps, and all images were transmitted via Base64 encoding and subsequently decoded for restoration. Due to the limited number of clear and unambiguously identifiable real fish samples obtained at this stage, a quantitative evaluation of the recognition algorithm has not yet been carried out. Nevertheless, this in situ image dataset—encompassing reference objects, environmental backgrounds, and suspected targets—provides indispensable empirical support for subsequent algorithm optimization and training, as well as for establishing visual observation methodologies for sub-ice biological communities in polar environments.
Figure 15.
Restored image data from the ice-based ecological observation buoy. (1) Bionic fish; (2) Bionic fish; (3) Suspected biological target; (4) The first frame image and suspected biological target; (5) Suspected biological target; (6) The first frame image.
6. Conclusions
This study successfully developed and deployed a polar ice-based ecological observation buoy system during China’s 15th Arctic Scientific Expedition. Its fundamental innovation lies in achieving, for the first time on an ice-based unmanned platform, long-term, in situ, and quasi-real-time observations of physical, chemical, and biological visual information at the Arctic sea-ice interface—overcoming the limitations of existing observation networks (e.g., IABP), which can only obtain indirect biological indicators.
- This system fills the technical gap in China for long-term, continuous underwater image observation in the high-latitude Arctic Ocean. By integrating a low-power imaging module with edge AI processing, the system enables automatic identification and transmission of under-ice biological imagery. During the observation period, it successfully captured and transmitted underwater images containing both bionic-fish reference targets and multiple suspected biological entities, directly confirming the effective operation and ecological monitoring capability of the imaging system. For the first time, continuous in situ sub-ice biological image sequences from the central Arctic Ocean were obtained.
- A data transmission scheme combining dual Iridium 9523 modules and Skylink was proposed to adapt to the harsh Arctic environment. Conventional sensor data are ensured through dual-redundant Iridium 9523 links (100% return rate). Image data, after onboard AI preprocessing and filtering, are transmitted via a Skylink module with an average power consumption of only 15 W, reducing the daily image transmission volume by an order of magnitude and enabling sustainable return of large datasets under comparable energy budgets.
- The system was successfully deployed during the expedition, demonstrating high operational reliability. Over one month of ice drift, the power-supply voltage fluctuated by only 0.5 V, and all sensor datasets remained complete. From the low-profile anti-melt structural design and rigid sensor fixation to anti-interference software and fault-tolerant communication mechanisms, the entire system exhibited strong resilience to the complex polar environment, laying a solid engineering foundation for long-term, year-scale observations.
Future work will focus on the following aspects: First, using the in situ image and synchronous environmental dataset obtained in this expedition to establish the first visual sample library for the Arctic sub-ice environment, optimize recognition algorithms, and explore the relationships between biological activity and environmental variables. Second, extending the deployment duration to a year-scale to verify all-season reliability, and conducting multi-region comparative observations to evaluate networking capabilities. Meanwhile, efforts will be directed toward equipment miniaturization and lightweight design, as well as exploring integration with the BeiDou satellite system to establish an autonomous and controllable communication link. The system’s open-architecture design equips it with the potential to evolve into a key node of an intelligent, multi-dimensional polar observation network.
Author Contributions
Conceptualization, X.H. and G.L.; methodology, X.H.; software, L.K.; validation, L.K.; formal analysis, X.H.; investigation, X.H. and G.L.; resources, L.K.; data curation, X.H.; writing—original draft preparation, X.H. and L.K.; writing—review and editing, L.K.; visualization, Y.D.; supervision, Y.D.; project administration, L.K.; funding acquisition, L.K. and Y.D. All authors have read and agreed to the published version of the manuscript.
Funding
This research was funded in part by the National Key Research and Development Program of China under grant number 2022YFC2807603; in part by the National Natural Science Foundation of China under grant number 62503353; and in part by Research and Development of Key Technologies for New Power System Sources and Storage under Extreme Conditions and Simulation Test Platform under grant number SXEIRI-ZDZD-2024002.
Data Availability Statement
The data that support the findings of this study are available from the corresponding authors upon reasonable request.
Conflicts of Interest
The authors declare no conflicts of interest.
References
- Yuan, Z.; Le, X.; Chen, J.; Zuo, G.; Yang, W. Structural characteristics of the ocean-ice-atmosphere observation system of unmanned ice station (UNIS) in polar environment. J. Ship Mech. 2021, 25, 1057–1065. [Google Scholar]
- Planck, C.; Whitlock, J.; Polashenski, C.; Perovich, D. The evolution of the seasonal ice mass balance buoy. Cold Reg. Sci. Technol. 2019, 165, 102792. [Google Scholar] [CrossRef] [Scilit]
- Toole, J.; Krishfield, R.; Proshutinsky, A.; Ashjian, C.; Doherty, K.; Frye, D.; Hammar, T.; Kemp, J.; Peters, D.; Timmermans, M.; et al. Ice-tethered profilers sample the upper Arctic Ocean. Eos Trans. Am. Geophys. Union 2006, 87, 434–438. [Google Scholar] [CrossRef] [Scilit]
- Castro, S.; Wick, G.; Steele, M. Validation of satellite sea surface temperature analyses in the Beaufort Sea using UpTempO buoys. Remote Sens. Environ. 2016, 187, 458–475. [Google Scholar] [CrossRef] [Scilit]
- Zuo, G.; Dou, Y.; WU, S.; Chang, X.; Kou, L.; Li, W.; Yang, B. Design and application of vertical temperature profile observation system for Arctic sea ice melt pond. J. Taiyuan Univ. Technol. 2024, 55, 1083–1088. [Google Scholar]
- Liu, S. The progress and prospect on the 40th anniversary of Chinese Arctic and Antarctic Scientific Expeditions. Chin. J. Polar Res. 2024, 36, 317–328. [Google Scholar]
- Cui, L.; Xiong, Y.; Zhang, W. The Application of polar satellite-tracing hydro-meteorological Automatic observing buoy in the second Chinese Arctic research expedition. J. Ocean Technol. 2004, 23, 54–57. [Google Scholar]
- Jiao, Y.; Zhao, J.; Shi, J.; Wu, W.; Zhang, H. Design and deployment of anchorage surveying flow system in polar region. J. Ocean Technol. 2008, 27, 22–25. [Google Scholar]
- Li, C.; Li, B.; Chen, Y.; Dou, Y.; Zuo, G.; Yang, B.; Lu, T. Development and application of polar subglacial shallow surface acoustic monitoring buoy system. Chin. J. Polar Res. 2023, 35, 251–267. [Google Scholar]
- Wang, R.; Lin, L.; Li, H.; Zhang, R.; Li, Y. Potential USE of environmental DNA methods in the arctic marine fish diversity research. Chin. J. Polar Res. 2021, 33, 148–155. [Google Scholar]
- Kawakami, T.; Yamazaki, A.; Jiang, H.; Ueno, H.; Kasai, A. Distribution and habitat preference of polar cod (Boreogadus saida) across Bering and Chukchi Seas using eDNA. Front. Mar. Sci. 2023, 10, 1193083. [Google Scholar] [CrossRef] [Scilit]
- Huang, X.; Jia, F.; Xiao, Z.; Zhang, T.; Lei, M.; Luo, W. The application status and key technologies of autonomous underwater vehicles in polar regions. Ship Sci. Technol. 2024, 46, 1–9. [Google Scholar]
- Yang, S.; Li, Y.; Chen, X.; Niu, D.; Ma, W.; He, D.; Lan, S. Characteristic analysis on temperature and dissolved oxygen in the Bering Sea based on underwater glider observation data. Adv. Mar. Sci. 2021, 39, 355–363. [Google Scholar]
- Zhang, W.; Wang, F.; Xu, Q.; Yuan, C.; Zhao, W. Response of pelagic ecosystem to inflow waters and sea ice changes in the Pan-Arctic Ocean: A review. Adv. Mar. Sci. 2021, 39, 339–345. [Google Scholar]
- Sun, J.; Song, Y.; Shi, Y.; Zhai, J.; Yan, W. Progress of marine biodiversity studies in China seas in the past decade. Biodivers. Sci. 2022, 30, 181–195. [Google Scholar] [CrossRef] [Scilit]
- Cheng, X.; Fan, S.; Zheng, L.; Zhou, J. Critical technologies for detection of polar environment. Bull. Chin. Acad. Sci. 2022, 37, 921–931. [Google Scholar]
- Li, S.; Liu, J.; Xu, H.X.; Zhao, H.Y.; Wang, Y.Q. Research status of autonomous underwater vehicles in China. Sci. Sin. Inf. 2018, 48, 1152–1164. [Google Scholar] [CrossRef] [Scilit]
- Craig, M.; Michael, D.; John, G.; Victoria, H.; Ron, K.; James, M.; Christopher, J.; Hanumant, S.; Timothy, P.; Jeremy, W. Emerging technologies and approaches for in situ, autonomous observing in the arctic. Oceanography 2022, 35, 210–221. [Google Scholar] [CrossRef] [Scilit]
- Fan, S.; Bose, N.; Liang, Z. Polar AUV challenges and applications: A review. Drones 2024, 8, 413. [Google Scholar] [CrossRef] [Scilit]

Disclaimer/Publisher’s Note: The statements, opinions and data contained in all publications are solely those of the individual author(s) and contributor(s) and not of MDPI and/or the editor(s). MDPI and/or the editor(s) disclaim responsibility for any injury to people or property resulting from any ideas, methods, instructions or products referred to in the content. |
© 2025 by the authors. Licensee MDPI, Basel, Switzerland. This article is an open access article distributed under the terms and conditions of the Creative Commons Attribution (CC BY) license (https://creativecommons.org/licenses/by/4.0/).