


Abstract
Soil erosion and nutrient loss degrade the soil resource base and water quality in dryland agricultural landscapes, yet optimal design of vegetation buffers for soil conservation under intensifying rainfall remains poorly quantified, particularly for nutrient retention. This study is novel in integrating event-scale rainfall-simulation experiments, Bayesian hierarchical modelling, Causal Forest analysis, and WEPP simulations to quantify how the sequential addition of biocrusts and grasses to shrub buffers shifts density thresholds for runoff, soil loss, and nutrient export across varying rainfall intensities. Experiments were conducted across a continuous shrub-density gradient (0–11,429 plants ha−1) representing three configurations: shrub monoculture, shrub-biocrust, and shrub-biocrust-grass on agricultural hillslopes of the Chinese Loess Plateau. Runoff, soil loss, and exports of total nitrogen (TN) and total phosphorus (TP) were measured. Results demonstrate three main findings. First, multilayer shrub–biocrust–grass buffers exhibited lower soil loss than monocultures. Posterior estimates indicate reductions from approximately 3.8 t ha−1 at moderate monoculture density to below 1.0 t ha−1 at lower planting densities, with 94% of the highest-density intervals reflecting uncertainty in these estimates. Second, Causal Forest analysis reveals a functional separation of controls: rainfall intensity dominates soil loss (88% importance) and runoff (84%), whereas nutrient retention responds more strongly to buffer structure and density management. Third, WEPP simulations across rainfall intensities (50–180 mm h−1) and slopes (10–30%) identify an optimal multilayer buffer density of 3800–5700 plants ha−1, which delivers robust multifunctional benefits with 50–67% lower planting requirements than conventional high-density monocultures. These findings demonstrate that multilayer vegetation buffers enhance soil retention and reduce nitrogen and phosphorus losses from hillslopes, sustaining the soil resource base and protecting water quality in dryland agricultural landscapes. The integrated modelling framework provides transferable, evidence-based density recommendations for climate-resilient soil conservation in similar dryland regions.
1. Introduction
Drylands cover more than 40% of the Earth’s terrestrial surface and support over two billion people, while providing critical ecosystem services that underpin global food security, biodiversity conservation, and climate regulation through carbon sequestration [1,2,3,4]. Despite sparse vegetation, these regions store approximately 241 Pg of carbon, about 15.5% of the global soil organic carbon pool [5,6]. However, these landscapes are increasingly threatened by climate variability, intense rainfall events, and unsustainable land use, all of which accelerate land degradation and reduce the long-term capacity of soils to support productive agriculture and ecosystem functioning [7,8,9].
Soil erosion represents the most pervasive manifestation of dryland degradation [10]. In agricultural landscapes, erosion not only removes topsoil and weakens soil structure, but also mobilises nutrient-rich particles and dissolved forms of nitrogen and phosphorus, thereby reducing soil fertility and increasing the risk of downstream water pollution [11,12]. These losses have direct consequences for agricultural sustainability because they diminish the soil resource base on which crop productivity depends nutrients [13,14]. At the same time, erosion contributes to broader environmental change by destabilising soil carbon stocks and reinforcing feedbacks between land degradation and climate change [6,15]. Under increasingly erratic rainfall regimes, the challenge is therefore not only to reduce sediment loss, but also to retain soil nutrients and maintain the functional integrity of agricultural landscapes under climatic stress.
The Chinese Loess Plateau exemplifies these coupled challenges. As the world’s largest loess deposit, it is characterised by highly erodible yet agriculturally valuable soils and has long been recognised as a global hotspot of soil erosion and non-point source pollution [16,17,18,19]. Over recent decades, large-scale ecological restoration, particularly through the Grain for Green Project (GGP), has substantially increased vegetation cover and reduced sediment delivery by converting steep cropland into forest and shrubland [20]. These interventions have contributed to slope stabilisation and landscape recovery, while also helping protect the soil and water resources that sustain rainfed agriculture in downstream and adjacent areas [21]. However, the dominant restoration strategy has often relied on high-density shrub or tree planting, and this has created new ecohydrological concerns in water-limited regions, including deep soil desiccation, reduced vegetation vitality, and questions about long-term sustainability [22,23,24,25].
These concerns are especially important in semiarid agricultural environments, where conservation measures must balance erosion control with water-use efficiency and long-term land productivity. Previous studies on the Loess Plateau have shown that shrub planting can reduce runoff and soil loss [25,26,27]. However, most of this work has evaluated only a few planting densities or broad vegetation categories, rather than testing continuous density gradients that are more useful for identifying thresholds and practical design ranges. In addition, earlier studies have focused mainly on runoff and sediment reduction, while giving less attention to associated losses of TN and TP, even though these are critical indicators of soil fertility decline and off-site environmental impact [28,29]. Consequently, the optimal vegetation structure and planting density required to simultaneously control erosion and nutrient export, while avoiding inefficient high-density monocultures in water-limited drylands, remain insufficiently resolved.
Another important limitation in the existing literature is that vegetation is often treated as a single cover variable, even though different vegetation components can play complementary functional roles [30,31]. Shrubs may reinforce deeper soil layers and intercept rainfall, while biological soil crusts can stabilise the immediate surface and grasses can increase near-surface roughness, reinforce topsoil, and reduce flow concentration [32,33,34]. Yet the extent to which these components interact across a continuous shrub-density gradient remains poorly resolved, particularly under short-duration, high-intensity rainfall events that dominate erosion processes in dryland environments. Existing studies rarely test whether adding biocrusts and grasses to shrub buffers fundamentally alters the density thresholds required to control runoff, soil loss, and nutrient export [35,36,37]. As a result, the joint effects of vegetation structural complexity, planting density, and rainfall intensity on multifunctional soil conservation performance remain insufficiently quantified.
To address this gap, we apply an integrated modelling framework that combines controlled rainfall-simulation experiments, Bayesian hierarchical modelling, Causal Forest analysis, and process-based WEPP simulations. The novelty of this study lies in integrating these approaches with a continuous shrub-density gradient and sequential vegetation structural enhancement (shrubs, biocrusts, and grasses) to evaluate context-specific vegetation buffer designs for soil conservation and fertility retention under intensifying rainfall. We evaluate vegetation buffer configurations that are representative of conservation practices applicable to marginal agricultural hillslopes and buffer zones within agricultural landscapes. While our experimental plots did not include crops, the tested configurations are intended for implementation on non-cropped areas of agricultural land (e.g., contour buffer strips, edge-of-field buffers, or retired marginal slopes) to protect soil resources and retain nutrients from adjacent cropped areas. Using a controlled rainfall-simulation experiment spanning a continuous shrub-density gradient and multiple rainfall intensities, this study aims to:
- Quantify the interactive effects of vegetation structure, planting density, and rainfall intensity on runoff, soil loss, and nutrient (TN, TP) export from hillslopes managed with conservation buffers representative of agricultural landscapes.
- Assess whether incorporating biocrusts and grasses into shrub-based conservation buffers shifts functional thresholds for soil fertility retention under intensifying rainfall.
- Identify optimal shrub-density ranges and vegetation configurations that deliver robust, cost-effective soil conservation benefits for farmers, providing actionable guidance for climate-resilient agricultural land management.
2. Materials and Methods
2.1. Location of the Study Area
Figure 1 shows the geographical location of the study area on the Chinese Loess Plateau. The study was conducted at the Dingxi Institute of Soil and Water Conservation, Gansu Province, China (35°34′45.88″ N, 104°38′5.67″ E), located in the semiarid region of the Chinese Loess Plateau. The study area lies within the Dingxi region, where elevations range from 1811 to 2505 m, with an average of approximately 2040 m a.s.l. This region is globally recognised for its extreme vulnerability to soil erosion and land degradation. The area experiences a continental monsoon climate, characterised by warm, humid summers and cold, dry winters [38]. Mean annual precipitation is approximately 421 mm, of which nearly 78% occurs between May and September, predominantly as short-duration, high-intensity rainfall events that strongly influence surface runoff generation and sediment transport [39]. Runoff in this region is generated primarily by infiltration-excess (Hortonian) overland flow due to the low infiltration capacity of the surface loess [40]. Groundwater is deep and does not interact with hillslope hydrological processes. Potential evapotranspiration greatly exceeds precipitation, resulting in a persistent water deficit. Topographically, the landscape is dominated by undulating loess hills and deeply incised valleys, with slopes commonly exceeding 15°, which substantially amplifies erosion risk [18,39]. The dominant soil is Malan loess, a highly erodible material characterised by a fine, silt-dominated texture and a porous structure [41,42]. Soil properties at the study site are consistent with regional measurements [40]: dry bulk density ranges from 1.11 to 1.38 g cm−1 (mean 1.26 g cm−3), organic carbon content from 1.6 to 3.7 g kg−3, and texture is silt loam (10–12% clay, >80% silt, <8% sand). According to the FAO-WRB classification, the soil is a Calcaric Regosol [40]; in the Chinese Soil Classification it is a Cumulic Cambisol, and in USDA Soil Taxonomy it is a Typic Haplustoll.
Figure 1.
Geographical location of the study area on the Chinese Loess Plateau. (a) Map of the Loess Plateau showing the study site at the Dingxi Institute of Soil and Water Conservation, Gansu Province, China (35.579437° N, 104.635083° E). Elevation is represented by the color gradient (m). (b) Photographs of the experimental plots at the Dingxi Institute, showing the rainfall simulation setup. Both images illustrate the same location and equipment layout.
Historical land-use practices, especially intensive cultivation and agricultural expansion, have led to widespread degradation of natural grasslands and forest vegetation [43]. This has weakened soil structure, reduced organic carbon content, and diminished water-holding capacity, collectively increasing erosion susceptibility [44]. Owing to the combined influence of erosive rainfall regimes, fragile soil properties, steep terrain, and long-term anthropogenic disturbance, the Dingxi area provides an ideal natural laboratory for investigating soil erosion dynamics and evaluating the effectiveness of conservation strategies, including terracing, mulching, and multi-component vegetation restoration [20,45]. Importantly, the environmental conditions of the Dingxi region are highly representative of the broader Loess Plateau, ensuring that findings from this study are transferable to other semiarid regions facing similar climatic, geomorphological, and socio-economic challenges. The region is representative of semiarid agricultural landscapes where smallholder farmers cultivate rainfed crops on steep slopes, making soil conservation a priority for sustaining livelihoods.
2.2. Experimental Setup
To evaluate how sequential vegetation buffer configurations regulate runoff, soil erosion, and nutrient loss during extreme rainfall, we conducted a controlled rainfall simulation experiment aligned with the study objectives (Figure 2). Seven standardised runoff plots (7.0 m × 1.5 m; 10.5 m2), each with a uniform slope of 20%, were constructed to represent typical hillslope conditions of the Chinese Loess Plateau. The experimental unit was the individual plot. Repeated rainfall simulations on each plot were analysed as repeated measurements nested within plot, with rainfall intensity (50, 80, and 120 mm h−1) applied in randomised order within each phase to reduce order effects and limit temporal pseudoreplication. The experiment followed a phased vegetation establishment trajectory that mirrors common conservation practices in the region. The Phase factor (I, II, III) represents cumulative vegetation complexity applied sequentially to the same plots over time, rather than independent treatments on separate plots (Figure 2b). This design allows isolation of incremental functional gains associated with increasing buffer structural complexity. Carry-over effects were minimised by allowing a 45–90 day equilibration period between phases and by returning soil moisture to near-initial conditions before each simulation (48 h interval).
Figure 2.
Controlled rainfall-simulation experiment and treatment design across sequential vegetation configurations and shrub-density gradients. (a) Rainfall-simulation facility and standardised runoff plots (7.0 m × 1.5 m; 20% slope) used to quantify runoff, sediment, and nutrient responses under calibrated rainfall intensities (50–120 mm h−1) delivered by a Norton ladder-type rainfall simulator. (b) Schematic of the sequential vegetation configurations and shrub-density treatments applied to the plots: Phase I, Caragana korshinskii monoculture; Phase II, shrubs + biological soil crust (biocrust); and Phase III, shrubs + biocrust + grasses. Treatments span a density gradient from C0 (bare-soil control) to C12 (12 shrubs per plot; 10.5 m2), with intermediate levels C2–C10 (2–10 shrubs per plot), corresponding to approximately 0–11,429 plants ha−1. Roman numerals (I–III) denote the vegetation configuration phase.
2.2.1. Phase I: Shrub-Based Conservation Buffers
In the initial buffer configuration (Phase I), we established monocultures of Caragana korshinskii, a drought-tolerant shrub widely used in regional soil and water conservation programs. One-year-old seedlings were planted in April 2024 and allowed to establish through the growing season. By March 2025, after 11 months of growth, the shrubs had developed stable root systems and canopy structure. All spontaneous herbs and volunteer vegetation were manually removed before rainfall simulations to ensure a shrub-only configuration. Shrubs were arranged across a gradient of six planting densities: 2, 4, 6, 8, 10, and 12 plants per plot (10.5 m2), along with a bare-soil control (0 plants). These densities correspond to approximately 1905–11,429 plants ha−1, spanning the range commonly applied in dryland conservation programs. Rainfall simulations for Phase I were conducted in March 2025, with each of the three rainfall intensities (50, 80, and 120 mm h−1) applied to all plots in a fully randomised order.
2.2.2. Phase II: Shrub + Biocrust Enhanced Buffers
Immediately after completing the Phase I simulations (March 2025), we added a biological soil crust (biocrust) layer to all vegetated plots. In early April 2025, biocrust material was collected from nearby undisturbed slopes with similar soil properties and aspect. The collected crust was gently fragmented and uniformly applied across the soil surface of each plot. Following application, plots were lightly irrigated during dry periods (approximately twice per week) to maintain surface moisture and promote crust re-establishment. The plots were left undisturbed for 45 days to allow the biocrust to colonize and stabilise. By mid-June 2025, the biocrust had formed a visually continuous, cohesive surface layer, indicating functional stabilization and effective surface protection. Rainfall simulations for Phase II were then conducted in June 2025, following the same randomisation and intensity sequence as Phase I.
2.2.3. Phase III: Multilayer Vegetation Buffers
Immediately after the Phase II simulations (June 2025), native grass species (Setaria viridis and Bothriochloa ischaemum, locally common) were evenly sown across all shrub–biocrust plots. Grass seeds were irrigated as needed to ensure germination and early establishment. The plots were maintained for 72 days, allowing the grasses to develop a continuous and visually uniform ground layer between shrub canopies and above the biocrust. By September 2025, the grass cover was fully established. Rainfall simulations for Phase III were completed in September 2025, again using the same randomisation and intensity scheme. The complete sequence of vegetation configurations, including shrub density gradients, biocrust application, and grass establishment, is illustrated in Figure 1b, which provides a schematic overview of vegetation structure across all phases.
These configurations represent increasing levels of vegetation complexity that farmers or land managers can implement as cost-effective erosion control measures on marginal agricultural slopes.
2.3. Data Collection Procedure and Integrated Analytical Framework
Data collection was systematically conducted to capture the dynamics of soil and vegetation responses to different buffer configurations, thereby providing the empirical foundation for a multi-method analytical framework that incorporates Bayesian inference, causal machine learning, and process-based modeling. The overall workflow linking field measurements, statistical inference, and model-based extrapolation is summarised in Figure 3. A 48 h interval was maintained between successive rainfall simulations on the same plot to allow soil moisture to return to near initial conditions, ensuring consistent antecedent moisture across runs. Between the three experimental phases, a longer equilibration period (45–90 days) was provided to allow full development of the added vegetation components (biocrust, grasses). Runoff was collected at 5 min intervals during simulated rainfall events (50–120 mm h−1) using 20 L graduated containers, with composite samples stored in 1000 L tanks for sediment analysis. Sediment concentration was determined by dividing the dry sediment mass by the runoff water volume in each sample; the average concentration was then calculated across all samples. This sediment data were converted to soil loss (t ha−1), providing a standardized measure. TN was quantified using the Kjeldahl method to ensure comprehensive nitrogen measurement [46,47], while TP was assessed using standard analytical protocols. Pollution loads (kg ha−1) were calculated by multiplying solute concentrations (mg L−1) by the corresponding runoff volumes. A total of 189 runoff samples were collected (7 plots × 3 phases × 3 rainfall intensities × 3 replicate events per intensity). From these, 189 sediment samples, 189 TN samples, and 189 TP samples were analysed. This integrated framework provided complementary evidence through rigorous statistical estimation, causal identification, and mechanistic validation, ensuring robust ecological inference across methodological paradigms.
Figure 3.
Integrated modelling workflow combining rainfall-simulation experiments, Bayesian GLMM, Causal Forest analysis, and WEPP-based extrapolation to generate soil conservation recommendations. Abbreviations: GLMM, generalised linear mixed model; WEPP, Water Erosion Prediction Project; TN, total nitrogen; TP, total phosphorus.
2.3.1. Bayesian Generalised Linear Mixed Modelling
We employed a Bayesian generalised linear mixed modelling framework to quantify phase-associated differences across four critical response variables: runoff, soil loss, TN, and TP. For each response variable, we specified a unified model structure: For each response variable, we specified a unified model structure:
where represents the response measurement for observation in plot (runoff, soil loss, TN, or TP), and is its expected value. denoting treatment phase (categorical: Caragana only, +Biocrust, +Grass), as plant density (continuous), and is rainfall intensity (categorical: 50, 80, 120 mm h−1). Categorical predictors were implemented using dummy (indicator) variables with an appropriate reference level. The interaction terms and allow the effect of treatment to vary with plant density and rainfall regime, respectively, directly testing our hypotheses about density-dependent synergies and climate resilience. We used a Gamma distribution with a log-link because all response variables are strictly positive and right-skewed; this specification ensures positive fitted values and accommodates heteroscedasticity, with variance approximately proportional to the square of the mean. The shape parameter controls dispersion (larger implies lower variance at a given mean). Because the same plots were observed repeatedly across phases, the Bayesian GLMM was used to estimate phase-associated differences while accounting for repeated measurements at the plot level, rather than to infer fully independent treatment effects among separately randomised vegetation treatments.
To regularise estimation while remaining weakly informative, we assigned the following priors: Half-Normal for all fixed-effect coefficients and Gamma for all random-effect coefficients. These priors were selected to constrain implausibly large coefficients while remaining sufficiently diffuse to allow the data to dominate posterior inference: for all fixed-effect coefficients , ~Half-Normal , ~Gamma .
Models were fitted in PyMC using the No-U-Turn Sampler (NUTS) with 4 parallel chains, each run for 4000 warm-up (tuning) and 4000 post-warm-up iterations. Convergence was assessed using the potential scale reduction statistic ( < 1.01), effective sample sizes >1000 for all parameters, and visual inspection of trace plots. In addition, we assessed chain mixing, stationarity, and sampling adequacy using both bulk and tail effective sample sizes. We report posterior means and 94% highest density intervals (HDIs), and interpret effects as ecologically meaningful when the 94% HDI for a coefficient excludes zero. Model adequacy and robustness were further evaluated using posterior predictive checks, prior sensitivity analyses, and model comparisons.
2.3.2. Causal Forest Machine Learning Analysis
To complement the Bayesian analysis and explore heterogeneity in vegetation-phase performance across environmental gradients, we applied a Causal Forest analysis using the CausalForestDML estimator implemented in the econml package. Separate models were fitted for each outcome variable (runoff, soil loss, TN, and TP). The treatment variable was coded as vegetation phase (Phase I, Phase II, Phase III), while rainfall intensity (mm h−1) and plant density (plants plot−1, converted to plants ha−1) were included as effect-modifying covariates. We used these models to estimate heterogeneous treatment effects and average treatment effects across the observed density-rainfall space. A fixed random seed (random_state = 42) was used to ensure reproducibility. The Causal Forest was implemented with 2000 trees, a minimum leaf size of 5, a maximum depth of 10, and an honesty fraction of 0.5. Inference was performed using 500 bootstrap replicates. Nuisance parameters were estimated using gradient boosting with 100 estimators and a learning rate of 0.1.
The estimator was used to obtain average treatment effects, heterogeneous treatment-effect surfaces, and impurity-based variable-importance scores. These variable-importance values are interpreted here as model-based measures of predictive contribution to treatment-effect heterogeneity, rather than as formal causal attributions of underlying mechanisms. Accordingly, the Causal Forest results are used to characterise context dependence and relative predictive importance rather than to make strong mechanistic causal claims.
The interpretation of these results depends on assumptions such as overlap and limited unmeasured confounding. Although the controlled experimental design supports these assumptions to some extent, the sequential use of the same plots across phases limits strict causal interpretation. We therefore treat the Causal Forest analysis as complementary evidence for phase-associated heterogeneity under the observed experimental conditions.
2.3.3. Water Erosion Prediction Project (WEPP)
The WEPP model is a physically based, detailed simulation tool designed to predict runoff and soil erosion patterns across varied landscapes, especially those with steep slopes [48,49]. We selected WEPP because it is a physically based, event-scale model that explicitly represents infiltration, runoff, detachment, and sediment transport on hillslopes processes critical for dryland erosion. Unlike empirical models such as USLE/RUSLE, which provide long-term average erosion rates but cannot resolve event-scale dynamics or the effects of changing vegetation structure, WEPP simulates runoff and sediment responses to specific storms, slope profiles, and management practices [50,51]. In contrast to catchment-scale models such as SWAT, WEPP is designed for hillslope and small-watershed applications [52], making it particularly well-suited to our plot-scale experiments on steep Loess Plateau slopes, where short flow paths and micro-topography strongly control erosion processes.
On the other hand, few studies have evaluated WEPP’s performance in arid and semiarid regions, where conditions differ markedly from those under which the model was developed [53]. In these environments, WEPP is especially sensitive to parameterisation because surface crusting, highly variable infiltration, and patchy vegetation create sharp thresholds in runoff generation and sediment detachment [53]. To address this, we implemented a targeted calibration scheme specifically designed for dryland conditions, as described below.
2.3.4. Process-Based Modelling and Spatial Extrapolation
We implemented the WEPP model (version 2023) to simulate runoff and sediment dynamics across experimental plots representing the shrub density gradients and treatment phases examined in our study. The model was parameterized using climate data derived from our artificial rainfall simulations, with the single-storm mode employing rainfall intensity (50, 80, and 120 mm h−1) and duration parameters that replicated the experimental conditions. Climate files were generated using the single-storm mode of CLIGEN 4.3, with rainfall depth, duration, intensity, and time-to-peak specified from field measurements. Soil files were created using measured properties from the experimental site (Table S1): dry bulk density 1.3 g cm−3, saturated hydraulic conductivity 10 mm h−1, texture (70% silt, 20% clay, <10% sand), albedo 0.23, and initial saturation 30–35% based on laboratory analysis of field samples. Effective hydraulic conductivity (Ke) was derived from measured runoff depth averaged across three replications per plot, and interrill erodibility (Ki) was calculated from average soil erosion rates during rainfall events. Management profiles encoded the specific shrub density treatments and biocrust-grass phase transitions from our experimental design.
The WEPP model was calibrated using field-measured runoff and sediment data from rainfall intensities of 50 and 80 mm h−1 (combined dataset, two-thirds of the runs) using the Shuffled Complex Evolution algorithm (50,000 iterations). Calibration targeted the following parameters: effective hydraulic conductivity (Ke), interrill erodibility (Ki), rill erodibility (Kr), and critical shear stress (τ_c). Validation was performed against the independent dataset from the highest rainfall intensity (120 mm h−1), which was not used during calibration. This split (calibration on lower intensities, validation on extreme intensity) tests the model’s ability to predict runoff and soil loss under more severe hydrological forcing than used for parameter estimation. To further assess robustness, we also performed 5-fold cross-validation across all intensities; the average cross-validation performance was consistent with the split-sample validation, indicating no severe overfitting.
Building on the validated hydrological foundation, we developed an empirical framework for nutrient dynamics projection, linking TN and TP export to both soil loss and runoff:
where S is WEPP-simulated soil loss (t ha−1), Q is the measured runoff volume (mm), and ,, , are regression coefficients estimated from the experimental dataset. This formulation accounts for nitrogen primarily transported in runoff and phosphorus largely bound to sediment, providing a more realistic approximation of nutrient export than using soil loss alone. For rainfall intensities of 50–180 mm h−1 and slope gradients of 10–30%, we calculated the planting density that maximised buffer performance. Optimisation was performed by identifying the density that yielded the highest average reduction efficiency across four critical response variables: runoff, soil loss, TN, and TP. The analysis integrated Bayesian posterior distributions with Causal Forest insights to ensure robust density recommendations. Planting densities were converted from the experimental plot-scale (10.5 m2) to ecologically meaningful units (plants ha−1) using standard area conversion factors, enabling direct application to landscape-scale restoration projects. Standardized runoff plots (7.0 m × 1.5 m) are well-suited for quantifying event-scale splash and sheet erosion under controlled conditions, which is the primary focus of this study. However, they do not capture gully erosion or concentrated flow processes that become important at larger catchment scales. Similarly, the WEPP model provides a physically based, event-scale representation of runoff and sediment dynamics. Still, its application in drylands requires careful calibration due to sensitivity to surface crusting, patchy vegetation, and infiltration variability.
2.4. Rainfall Simulation Experiments
To systematically assess the response of different vegetation configurations under varying hydrological forcing, we employed controlled rainfall simulations across a gradient of intensities (50, 80, and 120 mm h−1). These intensities were strategically selected to represent key hydrological thresholds in the semiarid Loess Plateau: a sub-threshold event (50 mm h−1) [54], a typical erosive storm (80 mm h−1) [55], and an extreme event (120 mm h−1) that probes the upper limits of system resilience. The experiments were conducted using a calibrated Norton ladder-type rainfall simulator, positioned 3.5 m above the soil surface to achieve terminal raindrop velocity (Figure 2a). The system was equipped with six Veejet 80,100 nozzles (1.1 m spacing) operating at a constant pressure of 41 kPa. Before the experimental series, the simulator was rigorously calibrated for each target intensity; rainfall uniformity was confirmed to exceed 85% across the plot area using a network of strategically placed rain gauges. Each unique treatment combination, spanning the vegetation configuration, plant density, and rainfall intensity, was replicated in a randomised sequence. A 48 h interval was maintained between successive simulations on a given plot to standardise initial soil moisture conditions, thereby isolating treatment effects from antecedent moisture variability. This controlled approach generated a high-fidelity dataset on runoff, sediment yield, and nutrient transport for mechanistic analysis.
Use of AI Tools: AI-assisted tools, including ChatGPT (OpenAI GPT-5) and Grammarly (Premium version), were used solely for language refinement, grammar correction, clarity improvement, and formatting. These tools were not used for data analysis, modeling, or interpretation. All scientific content, methods, and results were developed and verified by the authors.
3. Results
3.1. Divergent Effects of Vegetation Structure on Climate Resilience of Soil Conservation Functions in Agricultural Systems
Event-scale results demonstrated a consistent phase ordering (Phase III < Phase II < Phase I < bare soil) across all rainfall intensities (50, 80, and 120 mm h−1), with the magnitude of differences amplifying under extreme rainfall (120 mm h−1), particularly for soil loss and nutrient export (Figure 4). As shown in Figure 4, the relationship between rainfall intensity and response variables was distinctly nonlinear within the observed range. For soil loss, increasing intensity from 50 to 80 mm h−1 resulted in comparable values across most treatments, but further increase from 80 to 120 mm h−1 tripled or quadrupled soil loss in Phase I and bare soil, while Phase III showed only a modest increase (≤50%). This nonlinear amplification reflects the interactive effects of raindrop kinetic energy, surface sealing, and runoff velocity thresholds, which are partially dampened by multilayer vegetation. Runoff also increased with intensity, with a clear threshold behaviour: at 120 mm h−1, runoff ratios (runoff/rainfall) increased sharply in monocultures but remained nearly constant in Phase III, indicating that dense ground cover and biocrusts maintain infiltration capacity even under the highest observed intensity. Shrub monocultures (Phase I) remained vulnerable even at moderate densities, while enhanced communities (Phases II–III) achieved substantial reductions at lower densities. For instance, Phase I had 3.77 t ha−1 soil loss at 8 plants, whereas the addition of biocrusts (Phase II) and grasses (Phase III) achieved substantial reductions at much lower densities (≤1.57 t ha−1 at 2 plants in Phase II; ≤0.95 t ha−1 across all Phase III densities). Runoff declined with increasing density across all phases but remained comparatively less controllable than erosion and nutrient export. Patterns at lower intensities (50 and 80 mm h−1) were directionally consistent, with progressively higher fluxes at higher rainfall and stronger reductions in Phases II–III relative to Phase I (Figure 4).
Figure 4.
Observed event-scale responses for runoff, soil loss, total nitrogen (TN), and total phosphorus (TP) across experimental plots with varying vegetation configurations and plant densities under three rainfall intensities (50, 80, 120 mm h−1), four vegetation densities (0, 2, 4, 6, 8, 10, 12 plants plot−1), and across three treatment phases (I–III). Each row corresponds to an ecosystem function: Row 1: Runoff (mm); Row 2: Soil loss (t ha−1); Row 3: TN (kg ha−1); Row 4: TP (kg ha−1). Columns represent rainfall intensity ((left) = 50 mm h−1, (middle) = 80 mm h−1, (right) = 120 mm h−1).
Normalised reduction–benefit curves (Figure 5) reveal rapid multifunctional gains at low to moderate shrub densities followed by pronounced diminishing returns at higher densities, indicating clear density thresholds. These thresholds systematically shifted to lower densities from Phase I to Phase III, demonstrating that increased structural complexity enables near-maximal erosion and nutrient control with substantially reduced planting effort. Bayesian GLMMs quantify these patterns and their storm-dependence (Table 1). Mean treatment effects were negative for all functions, strongest for soil loss (β = −1.02, 94% HDI −1.06 to −0.97), and smaller for runoff (β = −0.72, −0.82 to −0.62), TN (β = −0.36, −0.40 to −0.32), and TP (β = −0.44, −0.48 to −0.39). Treatment efficacy attenuated with rainfall intensity (β_(treat × rain) > 0), most strongly for runoff (β = 0.57, 94% HDI 0.46–0.67), and weaker for soil loss and nutrients. Density enhanced efficacy for runoff (β = −0.26, −0.36 to −0.16), TN (β = −0.11, −0.15 to −0.06), and TP (β = −0.05; Table 2), consistent with the observed and normalised density-response curves (Figure 4 and Figure 5).
Figure 5.
Optimal planting density for erosion and nutrient regulation across three restoration phases and three rainfall intensities. (a) Phase I (Caragana) at 50 mm h−1; (b) Phase I at 80 mm h−1; (c) Phase I at 120 mm h−1; (d) Phase II (Caragana + Biocrust) at 50 mm h−1; (e) Phase II at 80 mm h−1; (f) Phase II at 120 mm h−1; (g) Phase III (Caragana + Grass) at 50 mm h−1; (h) Phase III at 80 mm h−1; (i) Phase III at 120 mm h−1. Each panel shows the response of soil loss, runoff, total nitrogen (TN), and total phosphorus (TP) across plant density. Dashed vertical lines indicate thresholds of diminishing returns, and shaded areas denote density ranges for maximal buffer efficiency.
Table 1.
Bayesian treatment effects and resilience classes for runoff, soil loss, TN, and TP quantifying the effectiveness of different vegetation buffer configurations for protecting soil fertility in agricultural systems.
Table 2.
Synthesis of phase effects and dominant drivers across response variables.
3.2. Context-Dependent Efficacy and Mechanistic Drivers of Restoration Outcomes
3.2.1. Heterogeneous Buffer Responses Across Shrub-Density and Rainfall Gradients
Causal Forest response surfaces reveal pronounced heterogeneity in buffer performance across the shrub-density–rainfall space, with clear density–rainfall trade-offs that differ among ecosystem functions (Figure 6). For each function, an optimal boundary emerges beyond which further increases in shrub density yield only marginal additional benefits. This boundary shifts systematically with rainfall intensity and function type. Runoff and soil loss require progressively higher shrub densities under stronger storms to approach near-maximal mitigation, whereas TN and TP exhibit a broader management-sensitive domain, with disproportionate gains at increasing density under low to moderate rainfall but weaker performance at low density under high rainfall.
Figure 6.
Contour plots of treatment-induced reductions in soil loss, runoff, total nitrogen (TN), and total phosphorus (TP) across shrub density (plants m−2) and rainfall intensity (mm h−1). The color scale represents treatment effect magnitude, with higher values indicating stronger reductions. Contours labeled “Optimal” denote density–rainfall combinations achieving maximum mitigation. Panels: (top left) = soil loss; (top right) = runoff; (bottom left) = TN; (bottom right) = TP.
3.2.2. Functional Separation of Climatic Versus Management Controls
Driver-importance analysis highlights a clear functional separation of controls (Figure 7A). Rainfall intensity dominates soil loss (88% relative importance) and runoff (84%), indicating strong climatic constraint on these processes (Table 2). In contrast, TN export is jointly regulated by shrub density and rainfall (54% vs. 46%), while TP remains primarily rainfall-mediated but retains substantial management sensitivity (65% rainfall importance). These patterns demonstrate that erosion processes are largely climate-driven, whereas nutrient retention responds more strongly to buffer structure and planting density.
Figure 7.
Causal driver analysis and strategic intervention framework. (A) Relative importance of rainfall (climate control) and plant density (management control) for soil loss, runoff, total nitrogen (TN), and total phosphorus (TP) derived from Causal Forest analysis. (B) Strategic intervention framework positioning each ecosystem function in the climate versus management-control space to guide restoration priorities and treatment choices.
3.2.3. Average Treatment Effects and Phase Progression
Across all functions, average treatment effects are consistently negative (runoff −3.26; TN −2.38; soil loss −0.80; TP −0.77), indicating overall benefits of vegetation buffers while underscoring strong context dependence in where and when benefits are maximised (Figure 7A). Bayesian phase-progression coefficients show increasingly negative log-scale reductions from Phase I to Phase III for runoff, soil loss, TN, and TP, confirming that structural complexity enhances buffer effectiveness. These trends are consistent across Bayesian posterior estimates, percentage reductions derived from log-scale coefficients, and Causal Forest average treatment effects (ATEs), demonstrating strong cross-method convergence (Figure 8; Table 2).
Figure 8.
Methodological triangulation of treatment effects. (a) Bayesian posterior distributions of phase effects on soil loss, runoff, total nitrogen (TN), and total phosphorus (TP). (b) Corresponding percentage reductions obtained by transforming the log-scale coefficients. (c) Causal Forest average treatment effects (ATE) with uncertainty intervals, summarised by resilience classes (high, medium, low, very low).
3.2.4. Implications for Function-Specific Buffer Design
Synthesising mean effects with dominant drivers yields a function-specific planning logic (Figure 7B; Table 3). Runoff and soil loss are primarily climate-constrained, requiring density escalation under extreme rainfall, whereas nutrient regulation is more optimisable through vegetation structure and density management. This differentiation highlights why uniform planting prescriptions underperform and supports a shift toward function- and context-specific restoration strategies that align planting density and structural complexity with dominant controlling processes.
Table 3.
Climate and slope adaptive planting density framework.
3.3. Extrapolated Erosion and Nutrient Dynamics Across Climate and Slope Gradients
Our comprehensive analysis across extended environmental gradients reveals three fundamental patterns that redefine the optimisation of planting density for dryland soil conservation. First, we document a universal density escalation under climate extremes, where optimal planting densities increase dramatically with both rainfall intensity and slope gradient across all restoration phases. Phase I systems consistently require maximum density investment (11,429 plants ha−1) beyond 80 mm h−1 rainfall, with this threshold lowering to 50 mm h−1 on steeper slopes (30%), reflecting the compound stress of hydrological forcing and gravitational transport on simple shrub monocultures. Second, we identify a remarkable phase transition in which ecological complexity substantially reduces slope-sensitive density requirements. While Phase I systems exhibit a strong slope dependence, requiring 67–83% higher densities on 20–30% slopes compared to gentle terrain, Phase III systems maintain optimal performance across the topographic gradient with consistent medium densities (3810–5714 plants ha−1; Table 3).
This demonstrates that multilayered ecosystems develop emergent stabilization properties that buffer against slope-induced erosion. Third, we observe critical climate-topography interactions that dictate strategic density management. On gentle slopes (10%), all phases maintain effective performance at lower densities (1905–5714 plants ha−1) even under extreme rainfall, while steep slopes (30%) necessitate maximum density investment (11,429 plants ha−1) across most rainfall scenarios (Extended results with detailed performance metrics in Supplementary File Table S2). This interaction reveals that topographic context fundamentally modulates climate vulnerability, with gentle slopes offering natural resilience while steep slopes demand intensive intervention. These findings transform soil conservation planning from uniform prescriptions to precision, function-oriented design, enabling strategic phase selection and density optimization to maximize climate resilience while minimizing resource investments across heterogeneous dryland agricultural landscapes. It is important to note that ‘optimal’ here refers to the density that balances the four functions equally (runoff, soil loss, TN, TP) within the experimental ranges of rainfall and slope. Managers may shift to lower or higher densities depending on whether erosion control or nutrient retention is prioritised.
3.4. Calibration and Performance of the WEPP-Based Process Model
The WEPP model was successfully calibrated and validated using data from field-controlled experiments, demonstrating strong predictive capability for runoff and soil loss across varying rainfall intensities, slope gradients, and plant densities. For nutrient transport, strong empirical correlations were observed between measured erosion and nutrient losses (Figure S1), with Pearson’s r values ranging from 0.85 to 0.93 for runoff, soil loss, TN, and TP. These significant relationships supported the use of WEPP-simulated runoff and sediment outputs to predict nutrient export dynamics across experimental conditions. Model validation demonstrated excellent performance for runoff (R2 = 0.90, NSE = 0.90, RMSE = 2.82 mm, MAE = 2.07 mm) (Figure 9a) and soil loss (R2 = 0.93, NSE = 0.93, RMSE = 1.29 t ha−1, MAE = 0.76 t ha−1) (Figure 9b). Nutrient predictions based on erosion correlations were also robust, with TN (R2 = 0.83, NSE = 0.83, RMSE = 2.42 kg ha−1, MAE = 1.90 kg ha−1) (Figure 9c) and TP (R2 = 0.74, NSE = 0.74, RMSE = 0.72 kg ha−1, MAE = 0.54 kg ha−1) (Figure 9d) showing strong agreement with field observations (additionally see Supplementary Figure S1).
Figure 9.
Validation of WEPP-simulated runoff, soil loss, and nutrient predictions. Observed versus simulated (a) runoff, (b) soil loss, and nutrient predictions for (c) total nitrogen (TN) and (d) total phosphorus (TP) based on correlations with field-measured erosion. Model performance metrics include R2 (coefficient of determination), NSE (Nash-Sutcliffe efficiency), RMSE (root mean square error), and MAE (mean absolute error).
4. Discussion
4.1. Vegetation Structural Complexity, Not Cover Alone, Underpins Climate-Resilient Soil Conservation in Agricultural Systems
Our results demonstrate that soil conservation outcomes on loess hillslopes are governed primarily by vegetation structure and functional complementarity, rather than shrub cover or planting density alone. Large-scale soil conservation programs on the Loess Plateau, particularly under the Grain for Green Project, have relied heavily on high-density shrub monocultures (e.g., Caragana korshinskii) to stabilise slopes and reduce erosion [56,57]. While these interventions have successfully stabilised hillslopes and boosted vegetation indices [58,59], our results show diminishing returns with density and strong storm sensitivity for some functions, particularly runoff, suggesting that “more shrubs” is not a universally efficient strategy under intensifying rainfall.
The superiority of the Phase III system is therefore not merely a consequence of greater biomass or cover; it arises from emergent interactions among complementary functional groups. Where Phase I required 11,429 plants ha−1 to maintain 70–90% sediment reduction under extreme rainfall (180 mm h−1), the Phase III system achieved comparable or superior erosion control with only 5714 plants ha−1, halving the planting density while sustaining high performance (Table 3). This efficiency gain reflects a shift from a single dominant mechanism (deep-root binding) to a multi-mechanism buffering system that integrates the complementary functional roles of shrubs, biocrusts, and grasses, including hydraulic redistribution and microclimate regulation [60].
Mechanistically, each component of the Phase III system occupies a distinct functional role in space and soil protection. Biocrusts form a cohesive, roughened surface skin that dissipates raindrop energy, occludes the most erodible fine particles, and modulates pore connectivity, thereby increasing resistance to shear and delaying the onset of overland flow [61,62]. Fibrous grass roots densely reinforce the upper soil layer, anchoring aggregates at the interface where flow is most energetic and enhancing small-scale roughness that breaks up concentrated rills [63]. Deep-rooted shrubs, in turn, stabilise the subsurface structure and contribute to hydraulic redistribution, lifting water from deeper horizons and redistributing it laterally or upward, which buffers near-surface moisture and sustains plant activity during dry intervals [64]. These complementary roles also generate beneficial microclimates. Shrub canopies and grass cover lower surface temperatures, reduce evaporative demand, and maintain higher soil moisture in the upper profile, thereby enhancing infiltration capacity and reducing the frequency and magnitude of infiltration-excess overland flow during intense storms [65,66]. Together, these layers form a vertically stratified “defence cascade”: biocrusts and grasses slow and disperse surface flow, shrubs reinforce deeper soil horizons, and the full assemblage shifts hydrological thresholds so that even extreme rainfall generates far less runoff, sediment, and nutrient export. This mechanism addresses concerns that high-density shrub planting trades erosion control for soil moisture depletion, showing instead that well-designed vegetation combinations can achieve equal or greater protection at lower planting densities.
The structural mechanisms identified here vertical stratification, functional complementarity, and density-dependent thresholds are broadly consistent with findings from other dryland and semi-arid environments globally. Vegetation structural effects on runoff and soil loss operate across multiple dimensions including aboveground cover, surface litter, and root reinforcement, with their relative importance varying by scale and context [67]. In sub-Saharan Africa, buffer strips combining diverse vegetation types have been recommended for filtering runoff and stabilising soils under climate change [68], while agroforestry systems with multilayer canopies have demonstrated soil conservation benefits across diverse climatic zones [69,70]. Vegetation plays a multi-layered defence role against erosion by intercepting rainfall, binding soil with roots, and improving infiltration.
However, direct quantitative comparison is complicated by differences in soil types, rainfall regimes, slope characteristics, and vegetation species. For example, Mediterranean buffer studies typically operate on clay-rich soils with seasonal drought–flood cycles [71], whereas our loess soils are uniquely silt-dominated and highly erodible. Sandy soils in Sahelian regions present different infiltration and root reinforcement dynamics [72]. Therefore, the specific density thresholds we report (3800–5700 plants ha−1) are calibrated for loess conditions and should be treated as a methodological template rather than universal prescriptions. Future multi-site validation studies across contrasting soil-climate combinations are essential to establish the transferability of these density-function relationships.
4.2. Function-Specific Density Thresholds and Context-Dependent Design of Conservation Buffers for Agricultural Systems
By quantifying function-specific optimal density ranges, our results challenge the prevailing paradigm of universal vegetation or density targets. As shown in Figure 4, clear thresholds of diminishing returns emerge beyond which additional planting yields only marginal gains. We show that the density required to maximize soil loss reduction can be 30–50% lower than that needed to optimize nutrient retention within the same system (Table S2). This creates a trade-off: managers prioritising erosion control on steep slopes may accept lower densities, whereas those concerned with eutrophication of downstream waters should invest in higher densities or multilayer configurations. The choice depends on local environmental and agricultural priorities. Although increasing density and advancing vegetation configuration complexity consistently reduced runoff, soil loss, and TN/TP export across all rainfall and slope gradients, the magnitude and sensitivity of these gains differed by function.
Under extreme rainfall (180 mm h−1), steeper slopes amplified absolute losses. Still, they did not alter the functional ranking of treatments: under the conditions tested (rainfall up to 180 mm h−1, slopes up to 30%), Phase III consistently outperformed Phases I and II for all hydrological and soil conservation metrics (Figure 10). These findings indicate that buffer effectiveness is best understood as a matching problem, where vegetation architecture and density must be aligned with climatic forcing, slope conditions, and targeted soil conservation outcomes. Rather than maximising cover everywhere, conservation planning should prioritise structural configuration and density optimisation tailored to the local context. In this sense, our integrated modeling framework reframes soil conservation from blanket planting toward predictive, function-oriented design, directly supporting climate-resilient and resource-efficient agricultural land management.
Figure 10.
Effects of plant density, slope, and restoration phase on runoff, soil loss, and nutrient export under extreme rainfall (180 mm h−1). Panels represent slope gradients of 10%, 20%, and 30%. Colors denote the restoration phases: Control (bare soil), Phase I (Caragana shrubs), Phase II (shrubs and biocrusts), and Phase III (shrubs, biocrusts, and grasses).
These function-specific thresholds provide actionable guidance for targeting conservation investments. For example, in watersheds where eutrophication from agricultural runoff is the primary concern [73,74] (e.g., the Yellow River Basin), managers should prioritize multilayer buffer configurations that maximize nutrient retention, even if this requires slightly higher densities than for erosion control alone. Conversely, on extremely steep slopes (>30%) where soil loss threatens immediate crop productivity, the climate-resilient properties of multilayer buffers (Figure 10) justify the investment despite higher establishment costs.
Our findings are broadly consistent with, and extend, previous studies. The diminishing returns observed with increasing vegetation density (Figure 5) mirror the sediment-trapping efficiency of vegetative filter strips, which has been shown to increase with density but at a decreasing rate [75]. Similarly, studies on shrub encroachment in semi-arid grasslands have demonstrated that while woody plants can increase soil carbon and nutrients, these benefits are context-dependent and can collapse under extreme disturbance [76], supporting our observation that high-density monocultures are vulnerable under extreme rainfall. The enhanced performance of our multilayer Phase III system is reinforced by experimental evidence from the Loess Plateau showing that grass combined with biocrusts significantly reduces soil erosion during rainstorms. Furthermore, the function-specific trade-off between erosion control and nutrient retention identified here has also been observed in riparian buffer studies, where grass strips effectively trapped sediments but showed variable nutrient retention depending on vegetation type and hydrological conditions [77]. Collectively, these comparisons indicate that the principles of structural complementarity and density optimisation are transferable across dryland agricultural systems, although the specific density thresholds must be calibrated to local soil, climate, and slope conditions.
4.3. A Hybrid Mechanistic and Causal Framework Advances Predictive Soil Conservation
This study advances soil conservation science by integrating Bayesian inference, Causal Forest analysis, and process-based modelling (WEPP) within a single, empirically constrained framework. Traditional regression approaches or stand-alone process models often fail to capture nonlinear responses and context-dependent interactions in vegetation-hydrology-nutrient systems. Our hybrid framework addresses this limitation by combining: (i) Bayesian GLMMs to estimate treatment effects and uncertainty, (ii) Causal Forests to identify heterogeneous responses and dominant drivers, and (iii) WEPP simulations to extrapolate mechanisms across unobserved climate and slope gradients. The strong empirical correlations among runoff, soil loss, and nutrient export (r ≥ 0.85; Figure S1) provide a robust basis for the linear nutrient regression approach used in extrapolation, while the process-based WEPP component ensures physical realism for runoff and erosion under unobserved conditions.
Bayesian modelling explicitly quantified uncertainty and storm-related attenuation of vegetation buffer effects, offering a probabilistic understanding of soil conservation performance under extremes [78,79]. Causal Forests revealed strong nonlinearities and context dependence, showing that density effects weaken under steep slopes and extreme rainfall as physical controls dominate [80]. For example, on 30% slopes, the relative importance of plant density for soil loss control declined from ~40% to ~12%, with slope emerging as the dominant driver (Table 3; Figure 10). Such patterns are often obscured in average-effect models and help explain why restoration strategies that succeed locally may fail when scaled up. We note that while the Causal Forest provided predictive feature importances, formal causal inference would require additional assumptions (e.g., no unmeasured confounding) that are only partially satisfied by our experimental design. Therefore, we interpret the driver importance as indicative rather than strictly causal. Coupling these causal insights with a validated WEPP model provided a mechanistically grounded scaling pathway. WEPP preserved physical realism in runoff and erosion processes, while field-derived causal relationships captured biotic sensitivity in nutrient transport. The model showed strong validation performance against the independent 120 mm h−1 dataset (R2 = 0.90 for runoff, 0.93 for soil loss; Figure 9), giving confidence in its ability to simulate extreme rainfall responses within the observed range. This combination revealed a partial decoupling between physical and biogeochemical resilience, enabling robust extrapolation across rainfall and slope gradients. The integrated framework is transferable to other dryland regions where controlled experiments can be combined with similar modelling tools, though local calibration of soil and vegetation parameters is required. In contrast to earlier studies relying on linear regressions or isolated models [18,81,82,83,84,85,86], our framework links empirical evidence to predictive, mechanistic understanding.
4.4. Practical Recommendations for Agricultural and Dryland Conservation Management
Our findings demonstrate that structurally diverse multilayer vegetation buffers (shrubs + biocrust + grasses, Phase III) achieve superior soil and nutrient retention at substantially lower planting densities than conventional high-density monocultures. Optimal densities range from 3800 to 5700 plants ha−1, representing a 50–67% reduction in planting requirements compared to 11,429 plants ha−1 monocultures, translating to reduced establishment costs and lower water competition with adjacent crops (Figure 5 and Figure 10; Table 3). Density recommendations should be tailored to environmental and functional priorities: on erosion-prone slopes (>20%), 5000–5700 plants ha−1 achieve ≥85% sediment reduction; for moderate slopes (10–20%), 3800–5000 plants ha−1 suffices; for nutrient-sensitive watersheds, multilayer configurations maximize nitrogen and phosphorus retention, which were 30–36% more responsive to vegetation structure than soil loss alone. Under extreme rainfall (>120 mm h−1), density alone cannot replace structural complexity; Phase III buffers maintain performance more effectively than monocultures across all tested conditions.
To support long-term effectiveness, land managers should consider periodic weed control, replanting grasses as needed, monitoring shrub survival, avoiding direct fertilizer application in the buffer, and protecting biocrust after extreme rainfall events. The optimal frequency of these actions remains to be determined, as our experiment covered a single growing season. These recommendations are derived directly from our experiments and should be interpreted in the context of our study site (loess soils) and experimental conditions (single season, controlled rainfall). While local adaptation may be necessary, they provide evidence-based guidance on selecting buffer density and configuration to achieve function-specific conservation objectives. Beyond farm-level applications, these results may inform broader dryland restoration and watershed management by providing quantified thresholds for erosion and nutrient retention. With appropriate local validation, they could offer preliminary insights relevant to policy frameworks such as the Sustainable Development Goals or water quality regulations, but direct transfer to other regions requires site-specific calibration.
4.5. Limitations and Future Research Directions
Our findings are based on plot-scale experiments involving a single shrub species (Caragana korshinskii) and a limited range of extreme rainfall scenarios on the central Loess Plateau. A further limitation is that the standard runoff-plot design primarily captures splash erosion, sheet erosion, and event-scale overland-flow responses, but does not represent gully erosion and sediment-connectivity processes that become important at watershed and catchment scales. Accordingly, the present findings are most directly applicable to plot- and hillslope-scale buffer performance rather than to full catchment-scale erosion dynamics. The sequential experimental design, in which the same plots were used across Phases I–III, may introduce temporal confounding, although equilibration periods (45–90 days) and moisture standardisation (48 h interval) mitigated legacy effects. Despite equilibration periods and moisture standardization, potential carry-over effects, such as soil conditioning, structural changes, and moisture memory, may still influence results and limit strict causal attribution across phases. Buffers were established in non-cropped areas, and extrapolation to in-field cropping systems should be approached cautiously. Long-term dynamics, including shrub aging, grass community turnover, biocrust succession, and nutrient retention trajectories, were not explicitly represented and should be prioritized for future research. WEPP simulations for unobserved rainfall intensities (150–180 mm h−1) and slopes (10–30%) are presented as model-based projections informed by model validation correlations, and formal uncertainty quantification should be incorporated in future studies. Causal inference from the Causal Forest analysis remains conditional on model assumptions, and extrapolation to other dryland systems should account for local soil properties, storm regimes, and species pools.
Nevertheless, the density-dependent and structural mechanisms identified here are consistent with broader dryland evidence and provide a transferable template for designing multilayered, climate-resilient soil conservation practices. Coupling this integrated modelling framework with remote sensing and spatial planning tools offers a clear pathway for scaling function-oriented soil conservation strategies across heterogeneous agricultural landscapes. Future work should integrate more comprehensive process-based biogeochemical models suitable for plot-to-hillslope scales to capture nutrient cycling processes (e.g., plant uptake, mineralization) beyond the empirical relationships used here.
5. Conclusions
This study demonstrates that multilayer vegetation buffers (shrubs + biocrusts + grasses) provide superior soil and nutrient retention compared to shrub monocultures while requiring 50–67% lower planting densities. WEPP simulations suggest a model-based optimal density range of 3800–5700 plants ha−1, which balances erosion control and nutrient retention under rainfall intensities up to 180 mm h−1 and slopes up to 30%. A key functional separation emerged: rainfall intensity predominantly influences soil loss and runoff, whereas nutrient retention is more responsive to buffer structure and density management. These results support a shift from uniform planting prescriptions toward function-specific, context-adapted buffer design. Multilayer buffers also reduce establishment costs and competition with adjacent crops while maintaining soil fertility, offering practical guidance for sustainable dryland agriculture.
The integrated experimental modeling framework provides transferable guidance for climate-resilient soil conservation planning in other dryland regions, provided that local calibration accounts for site-specific soil properties, rainfall regimes, and vegetation. Although this study is limited to a single season and plot-scale experiments, the findings offer a practical template for linking empirical experimentation with predictive modelling. Future work should extend the framework to multi-year dynamics, larger spatial scales, and additional dryland systems to further validate and refine buffer density recommendations.
Supplementary Materials
The following supporting information can be downloaded at: https://www.mdpi.com/article/10.3390/agriculture16090993/s1. Figure S1: Correlation structure among hydrological, erosion and nutrient responses and their main drivers across all rainfall-simulation plots; Table S1: Measured soil properties at the rainfall-simulation site on the Loess Plateau and their relevance for hydrological and erosion modelling in this study; Table S2: Complete optimal planting densities and performance metrics across environmental gradients and ecosystem functions.
Author Contributions
Conceptualization, M.A.A. and W.W.; methodology, M.A.A.; software, M.A.A.; validation, M.A.A., W.W. and G.F.G.; formal analysis, M.A.A.; investigation, M.A.A.; resources, W.W.; data curation, M.A.A.; writing—original draft preparation, M.A.A.; writing—review and editing, M.A.A., W.W. and G.F.G.; visualization, M.A.A.; supervision, W.W.; project administration, W.W.; funding acquisition, W.W.; data processing and literature review, G.F.G. All authors have read and agreed to the published version of the manuscript.
Funding
This research was funded by National Key Research and Development Project of China (2022YFF1300403; 2024YFF1306304) and National Natural Science Foundation of China Joint Key Project (U21A2011).
Data Availability Statement
The original contributions presented in this study are included in the article. Further inquiries can be directed to the corresponding author.
Acknowledgments
During the preparation of this manuscript, the authors used AI-assisted tools, including ChatGPT (OpenAI GPT-5) and Grammarly (Premium version), for language refinement, grammar correction, and formatting. The authors have carefully reviewed and edited all outputs and take full responsibility for the content of this publication.
Conflicts of Interest
The authors affirm that they have no conflicts of interest regarding this research paper.
References
- Burrell, A.L.; Evans, J.P.; De Kauwe, M.G. Anthropogenic climate change has driven over 5 million km2 of drylands towards desertification. Nat. Commun. 2020, 11, 3853. [Google Scholar] [CrossRef] [Scilit]
- Franceschinis, C.; McBratney, A.; Eusse-Villa, L.; Field, D.; Thiene, M.; Meyerhoff, J. Society’s willingness to pay its way to soil security. Soil Secur. 2023, 13, 100122. [Google Scholar] [CrossRef] [Scilit]
- Jain, S.; Srivastava, A.; Khadke, L.; Chatterjee, U.; Elbeltagi, A. Global-scale water security and desertification management amidst climate change. Environ. Sci. Pollut. Res. 2024, 31, 58720–58744. [Google Scholar] [CrossRef] [Scilit]
- Lewin, A.; Murali, G.; Rachmilevitch, S.; Roll, U. Global evaluation of current and future threats to drylands and their vertebrate biodiversity. Nat. Ecol. Evol. 2024, 8, 1448–1458. [Google Scholar] [CrossRef] [Scilit]
- Li, Y.; Zhang, X.; Wang, B.; Wu, X.; Wang, Z.; Liu, L.; Yang, H. Revegetation promotes soil mineral-associated organic carbon sequestration and soil carbon stability in the Tengger Desert, northern China. Soil Biol. Biochem. 2023, 185, 109155. [Google Scholar] [CrossRef] [Scilit]
- Arshad, M.S.; Sanaullah, M.; Farooq, M. Soil carbon sequestration in dryland agriculture. In Innovations in Dryland Agriculture; Springer: Berlin/Heidelberg, Germany, 2017; pp. 469–490. [Google Scholar]
- Janoušková, M.; Kohout, P.; Moradi, J.; Doubková, P.; Frouz, J.; Vosolsobě, S.; Rydlova, J. Microarthropods influence the composition of rhizospheric fungal communities by stimulating specific taxa. Soil Biol. Biochem. 2018, 122, 120–130. [Google Scholar] [CrossRef] [Scilit]
- Lal, R. Carbon cycling in global drylands. Curr. Clim. Change Rep. 2019, 5, 221–232. [Google Scholar] [CrossRef] [Scilit]
- Pal, S.C.; Chatterjee, U.; Chakrabortty, R.; Roy, P.; Chowdhuri, I.; Saha, A.; Islam, A.R.M.T.; Alam, E.; Islam, M.K. Anthropogenic drivers induced desertification under changing climate: Issues, policy interventions, and the way forward. Prog. Disaster Sci. 2023, 20, 100303. [Google Scholar] [CrossRef] [Scilit]
- Seeboonruang, U.; Mandadi, R.; Thammaboribal, P.; Gonzales, A.L.; Kanchan, A.; Ganni, S.V.S.A.B. Assessing the Combined Impacts of Future Climate and Land Use Changes on Soil Loss and Sediment Retention in the Lam Phra Phloeng Watershed, Thailand. Agriculture 2025, 15, 2511. [Google Scholar] [CrossRef] [Scilit]
- Oueld Lhaj, M.; Moussadek, R.; Zouahri, A.; Sanad, H.; Saafadi, L.; Mdarhri Alaoui, M.; Mouhir, L. Sustainable agriculture through agricultural waste management: A comprehensive review of composting’s impact on soil health in Moroccan agricultural ecosystems. Agriculture 2024, 14, 2356. [Google Scholar] [CrossRef] [Scilit]
- Adão, F.; Pádua, L.; Sousa, J.J. Evaluating soil degradation in agricultural soil with ground-penetrating radar: A systematic review of applications and challenges. Agriculture 2025, 15, 852. [Google Scholar] [CrossRef] [Scilit]
- Sanderman, J.; Berhe, A.A. The soil carbon erosion paradox. Nat. Clim. Change 2017, 7, 317–319. [Google Scholar] [CrossRef] [Scilit]
- Xiao, H.; Li, Z.; Chang, X.; Huang, B.; Nie, X.; Liu, C.; Liu, L.; Wang, D.; Jiang, J. The mineralization and sequestration of organic carbon in relation to agricultural soil erosion. Geoderma 2018, 329, 73–81. [Google Scholar] [CrossRef] [Scilit]
- Lal, R. Carbon sequestration in dryland ecosystems. Environ. Manag. 2004, 33, 528–544. [Google Scholar] [CrossRef] [Scilit]
- Li, S.; Chow, R.; Su, H.; Han, F.; Li, Z. Multiple Isotopes and GIS Analyses Reveal Sources and Drivers of Nitrate in the Loess Plateau’s Groundwater. Environ. Pollut. 2025, 384, 127022. [Google Scholar] [CrossRef] [Scilit] [PubMed]
- Wen, X.; Deng, X. Current soil erosion assessment in the Loess Plateau of China: A mini-review. J. Clean. Prod. 2020, 276, 123091. [Google Scholar] [CrossRef] [Scilit]
- Ame, M.A.; Wei, W.; Zhang, S.; Liu, W.; Chen, L. The Effects of Rainfall and Terracing–Mulch Combinations on Soil Erosion in a Loess Hilly Area, China: Insights from Plot Simulations and WEPP Modeling. Land 2025, 14, 432. [Google Scholar] [CrossRef] [Scilit]
- Wang, Y.; Liu, Y.; Wu, H.; Ding, J.; Xiao, Q.; Chen, W. Evaluation of the Synergistic Control Efficiency of Multi-Dimensional Best Management Practices Based on the HYPE Model for Nitrogen and Phosphorus Pollution in Rural Small Watersheds. Agriculture 2025, 15, 2030. [Google Scholar] [CrossRef] [Scilit]
- Zhang, G.; An, C.; Wang, C.; Wang, B.; Yu, B.; Fu, X. Numerical modeling of effects of vegetation restoration on runoff and sediment yield on the Loess Plateau, China. Catena 2024, 247, 108501. [Google Scholar] [CrossRef] [Scilit]
- Ji, W.; Ma, Y.; Li, L.; Liu, M.; Wei, H. Ecosystem Supporting Services Can Directly and Indirectly Affect the Well-Being of Ethnic Minority Rural Residents: A Case Study in the Oasis Region of Western China. Agriculture 2025, 15, 1756. [Google Scholar] [CrossRef] [Scilit]
- Gong, C.; Tan, Q.; Liu, G.; Xu, M. Positive effects of mixed-species plantations on soil water storage across the Chinese Loess Plateau. For. Ecol. Manag. 2024, 552, 121571. [Google Scholar] [CrossRef] [Scilit]
- Dang, X.; Gao, S.; Tao, R.; Liu, G.; Xia, Z.; Fan, L.; Bi, W. Do environmental conservation programs contribute to sustainable livelihoods? Evidence from China’s grain-for-green program in northern Shaanxi province. Sci. Total Environ. 2020, 719, 137436. [Google Scholar] [CrossRef] [Scilit] [PubMed]
- Cuneo, I.F.; Knipfer, T.; Mandal, P.; Brodersen, C.R.; McElrone, A.J. Water uptake can occur through woody portions of roots and facilitates localized embolism repair in grapevine. New Phytol. 2018, 218, 506–516. [Google Scholar] [CrossRef] [Scilit]
- He, J.; Li, Y.; Shi, X.; Hou, H. Integrating the impacts of vegetation coverage on ecosystem services to determine ecological restoration targets for adaptive management on the Loess Plateau, China. Land Degrad. Dev. 2023, 34, 5697–5712. [Google Scholar] [CrossRef] [Scilit]
- Yang, Q.; Fan, J.; Luo, Z. Response of soil moisture and vegetation growth to precipitation under different land uses in the Northern Loess Plateau, China. Catena 2024, 236, 107728. [Google Scholar] [CrossRef] [Scilit]
- Tang, C.; Liu, Y.; Li, Z.; Guo, L.; Xu, A.; Zhao, J. Effectiveness of vegetation cover pattern on regulating soil erosion and runoff generation in red soil environment, Southern China. Ecol. Indic. 2021, 129, 107956. [Google Scholar] [CrossRef] [Scilit]
- Niu, L.; Hu, J.; Li, P.; Zhao, G.; Mu, X. The effect of vegetation restoration on erosion processes and runoff on a hillslope under simulated rainfall. Water 2025, 17, 2411. [Google Scholar] [CrossRef] [Scilit]
- Su, Y.; Zhang, Y.; Wang, H.; Zhang, T. Effects of vegetation spatial pattern on erosion and sediment particle sorting in the loess convex hillslope. Sci. Rep. 2022, 12, 14187. [Google Scholar] [CrossRef] [Scilit] [PubMed]
- Zuazo, V.H.D.; Pleguezuelo, C.R.R. Soil-erosion and runoff prevention by plant covers: A review. Sustain. Agric. 2009, 785–811. [Google Scholar]
- Wu, G.L.; Liu, Y.F.; Cui, Z.; Liu, Y.; Shi, Z.H.; Yin, R.; Kardol, P. Trade-off between vegetation type, soil erosion control and surface water in global semi-arid regions: A meta-analysis. J. Appl. Ecol. 2020, 57, 875–885. [Google Scholar] [CrossRef] [Scilit]
- Zhu, P.; Feng, T.; Yang, L.; Wang, D.; Chen, X.; Zhang, F.; Li, C. Biological soil crusts decrease soil erodibility of economic fruit forests land through its consolidation effect in the Three Gorges Reservoir area. Catena 2024, 243, 108200. [Google Scholar] [CrossRef] [Scilit]
- Belnap, J. Biological soil crusts and wind erosion. In Biological Soil Crusts: Structure, Function, and Management; Springer: Berlin/Heidelberg, Germany, 2001; pp. 339–347. [Google Scholar]
- da Silva, L.d.C.M.; Avanzi, J.C.; Peixoto, D.S.; Merlo, M.N.; Borghi, E.; de Resende, A.V.; Acuna-Guzman, S.F.; Silva, B.M. Ecological intensification of cropping systems enhances soil functions, mitigates soil erosion, and promotes crop resilience to dry spells in the Brazilian Cerrado. Int. Soil Water Conserv. Res. 2021, 9, 591–604. [Google Scholar] [CrossRef] [Scilit]
- Wang, X.; Zhang, K.; Li, J.; Li, Q.; Na, W.; Gao, Y.; Gao, Z. Seasonal soil water dynamics under different tree plants and mulching treatments in the Loess Hilly Region of China. Ecol. Eng. 2024, 207, 107350. [Google Scholar] [CrossRef] [Scilit]
- Yang, X.; Ma, J.; Wang, L.; Wang, D.; Lang, W.; Liu, X. Nonlinear climate–ecosystem functional interactions shape aboveground forest biomass dynamics in the Qilian Mountains: Insights from remote sensing and explainable machine learning. Ecol. Inform. 2025, 93, 103546. [Google Scholar] [CrossRef] [Scilit]
- Zhao, Y.; Sui, S.; Hai, L. Effects of Vegetation and Slope Gradient on Rainfall-Induced Erosion of Reconstructed Iron Tailings Slopes: An Experimental Study. Land Degrad. Dev. 2025, 36, 4703–4717. [Google Scholar] [CrossRef] [Scilit]
- Sun, W.; Shao, Q.; Liu, J. Soil erosion and its response to the changes of precipitation and vegetation cover on the Loess Plateau. J. Geogr. Sci. 2013, 23, 1091–1106. [Google Scholar] [CrossRef] [Scilit]
- Chen, H.; Zhang, X.; Abla, M.; Lü, D.; Yan, R.; Ren, Q.; Ren, Z.; Yang, Y.; Zhao, W.; Lin, P. Effects of vegetation and rainfall types on surface runoff and soil erosion on steep slopes on the Loess Plateau, China. Catena 2018, 170, 141–149. [Google Scholar] [CrossRef] [Scilit]
- Wu, Q.; Xie, T.; Liu, C.; Li, W.; Zhang, L.; Ran, G.; Xu, Y.; Tang, Y.; Han, Z.; Hu, C. Improving the understanding of rainfall-runoff processes: Temporal dynamic of event runoff response in Loess Plateau, China. J. Environ. Manag. 2025, 375, 123436. [Google Scholar] [CrossRef] [Scilit] [PubMed]
- Hou, K.; Qian, H.; Zhang, Y.; Qu, W.; Ren, W.; Wang, H. Relationship between fractal characteristics of grain-size and physical properties: Insights from a typical loess profile of the loess Plateau. Catena 2021, 207, 105653. [Google Scholar] [CrossRef] [Scilit]
- Duan, Z.; Song, K.; Zhang, N.; Zheng, L.-C.; Yan, X.-S.; Zhang, M.-M. Characteristics and mechanisms of soil structure damage under salt weathering. Soil Tillage Res. 2024, 238, 106030. [Google Scholar] [CrossRef] [Scilit]
- Zhang, Z.; Shi, Y.; Zhuang, L.; Chen, Z.; Yan, Y.; Qin, J.; Zhao, X. Spatiotemporal Dynamics and Category Transition of Rural Socio-Ecological System Vulnerability: A Multi-Scale Analysis in the Loess Plateau, China. Ecol. Indic. 2025, 178, 113831. [Google Scholar]
- Wu, W.; Chen, G.; Meng, T.; Li, C.; Feng, H.; Si, B.; Siddique, K.H. Effect of different vegetation restoration on soil properties in the semi-arid Loess Plateau of China. Catena 2023, 220, 106630. [Google Scholar]
- Guo, M.; Wang, W.; Wang, T.; Wang, W.; Kang, H. Impacts of different vegetation restoration options on gully head soil resistance and soil erosion in loess tablelands. Earth Surf. Process. Landf. 2020, 45, 1038–1050. [Google Scholar]
- Sáez-Plaza, P.; Navas, M.J.; Wybraniec, S.; Michałowski, T.; Asuero, A.G. An overview of the Kjeldahl method of nitrogen determination. Part II. Sample preparation, working scale, instrumental finish, and quality control. Crit. Rev. Anal. Chem. 2013, 43, 224–272. [Google Scholar] [CrossRef] [Scilit]
- Moraghan, J.; Rego, T.; Sahrawat, K. Effect of water pretreatment on total nitrogen analysis of soils by the Kjeldahl method. Soil Sci. Soc. Am. J. 1983, 47, 213–217. [Google Scholar]
- Flanagan, D.C.; Ascough, J.C.; Nearing, M.A.; Laflen, J.M. The water erosion prediction project (WEPP) model. In Landscape Erosion and Evolution Modeling; Springer: Berlin/Heidelberg, Germany, 2001; pp. 145–199. [Google Scholar]
- Dun, S.; Wu, J.Q.; Elliot, W.J.; Robichaud, P.R.; Flanagan, D.C.; Frankenberger, J.R.; Brown, R.E.; Xu, A.C. Adapting the Water Erosion Prediction Project (WEPP) model for forest applications. J. Hydrol. 2009, 366, 46–54. [Google Scholar] [CrossRef] [Scilit]
- Foster, G.R.; Lane, L.J.; Schertz, D.; Nordin, J.; Wingate, G. User Requirements: Used-Water Erosion Prediction Project (WEPP). 1987. Available online: https://www.ars.usda.gov/ARSUserFiles/50201000/WEPP/docs/wepp-user-requirements.pdf (accessed on 27 April 2026).
- Wu, S.; Chen, L.; Wang, N.; Zhang, J.; Wang, S.; Bagarello, V.; Ferro, V. Variable scale effects on hillslope soil erosion during rainfall-runoff processes. Catena 2021, 207, 105606. [Google Scholar] [CrossRef] [Scilit]
- Yu, B.; Ciesiolka, C.; Rose, C.; Coughlan, K. A validation test of WEPP to predict runoff and soil loss from a pineapple farm on a sandy soil in subtropical Queensland, Australia. Soil Res. 2000, 38, 537–554. [Google Scholar]
- Mahmoodabadi, M.; Cerdà, A. WEPP calibration for improved predictions of interrill erosion in semi-arid to arid environments. Geoderma 2013, 204, 75–83. [Google Scholar] [CrossRef] [Scilit]
- Liu, Y.-F.; Liu, Y.; Wu, G.-L.; Shi, Z.-H. Runoff maintenance and sediment reduction of different grasslands based on simulated rainfall experiments. J. Hydrol. 2019, 572, 329–335. [Google Scholar] [CrossRef] [Scilit]
- Wu, Q.; Wang, L.; Wu, F. Tillage–impact on infiltration of the Loess Plateau of China. Acta Agric. Scand. Sect. B Soil Plant Sci. 2014, 64, 341–349. [Google Scholar] [CrossRef] [Scilit]
- Feng, T.; Zheng, H.; Wei, W.; Wang, P.; Bi, H.; Zhang, J.; Wei, T.; Wang, R.; Wang, L. Natural forests accelerate soil hydrological processes and enhance water-holding capacities compared to planted forests after long-term restoration. Water Resour. Res. 2025, 61, e2025WR040857. [Google Scholar] [CrossRef] [Scilit]
- Che, C.; Xiao, S.; Ding, A.; Peng, X.; Su, J. The characteristics of radial growth and ecological response of Caragana korshinskii Kom. under different precipitation gradient in the western Loess Plateau, China. Front. Plant Sci. 2022, 13, 862529. [Google Scholar] [CrossRef] [Scilit]
- Liu, Y.; Kong, C.; Zhang, Y.; Liu, G.; Huang, J.; Li, G.; Du, S. Monitoring and evaluation of the effects of Grain for Green Project on the Loess Plateau: A case study of Wuqi County in China. Int. J. Appl. Earth Obs. Geoinf. 2024, 132, 104006. [Google Scholar] [CrossRef] [Scilit]
- Deng, L.; Shangguan, Z.; Sweeney, S. Grain for Green” driven land use change and carbon sequestration on the Loess Plateau, China. Sci. Rep. 2014, 4, 7039. [Google Scholar] [CrossRef] [Scilit]
- Liu, C.L.C.; Kuchma, O.; Krutovsky, K.V. Mixed-species versus monocultures in plantation forestry: Development, benefits, ecosystem services and perspectives for the future. Glob. Ecol. Conserv. 2018, 15, e00419. [Google Scholar] [CrossRef] [Scilit]
- Yang, Y.; Deng, Y.; Cai, C.; Wang, F.; Fang, Y.; Duan, X. Biocrusts’ impact on hydrological processes and erosion dynamics: A review. Geoderma 2025, 459, 117383. [Google Scholar] [CrossRef] [Scilit]
- Guida, G.; Nicosia, A.; Settanni, L.; Ferro, V. A review on effects of biological soil crusts on hydrological processes. Earth Sci. Rev. 2023, 243, 104516. [Google Scholar] [CrossRef] [Scilit]
- Zhang, X.; Li, P.; Li, Z.B.; Yu, G.Q. Effects of grass strips distribution on soil erosion and its optimal configuration on hillslopes. Catena 2024, 238, 107882. [Google Scholar] [CrossRef] [Scilit]
- Kizito, F.; Dragila, M.; Senè, M.; Brooks, J.R.; Meinzer, F.C.; Diedhiou, I.; Diouf, M.; Lufafa, A.; Dick, R.; Selker, J. Hydraulic redistribution by two semi-arid shrub species: Implications for Sahelian agro-ecosystems. J. Arid Environ. 2012, 83, 69–77. [Google Scholar] [CrossRef] [Scilit]
- Eldridge, D.J.; Reed, S.; Travers, S.K.; Bowker, M.A.; Maestre, F.T.; Ding, J.; Havrilla, C.; Rodriguez-Caballero, E.; Barger, N.; Weber, B. The pervasive and multifaceted influence of biocrusts on water in the world’s drylands. Glob. Change Biol. 2020, 26, 6003–6014. [Google Scholar] [CrossRef] [Scilit]
- Zhang, Y.; Pang, Z.; Chen, J.; Chen, X.; Wang, E. Root-mediated regulation of soil infiltration dynamics in eroded Mollisols. Geoderma 2025, 462, 117508. [Google Scholar] [CrossRef] [Scilit]
- Liu, J.; Gao, G.; Wang, S.; Jiao, L.; Wu, X.; Fu, B. The effects of vegetation on runoff and soil loss: Multidimensional structure analysis and scale characteristics. J. Geogr. Sci. 2018, 28, 59–78. [Google Scholar] [CrossRef] [Scilit]
- Otieno, M. Current climate, soil, and natural vegetation. In Sustainable Agroecological Practices in Sub-Saharan Africa in the Face of Climate Change; Springer: Berlin/Heidelberg, Germany, 2024; pp. 21–51. [Google Scholar]
- Sauer, T.J.; Dold, C.; Ashworth, A.J.; Nieman, C.C.; Hernandez-Ramirez, G.; Philipp, D.; Gennadiev, A.N.; Chendev, Y.G. Agroforestry practices for soil conservation and resilient agriculture. In Agroforestry and Ecosystem Services; Springer: Berlin/Heidelberg, Germany, 2021; pp. 19–48. [Google Scholar]
- Sharma, P.; Upadhyayb, L.; Megha, B.; Anas, M.; Rastogi, M.; Painkra, D.S. A Review on Agroforestry Practices for Biodiversity Restoration and Ecosystem Resilience. Arch. Curr. Res. Int. 2026, 26, 312–331. [Google Scholar] [CrossRef] [Scilit]
- Ola, A.; Dodd, I.; Quinton, J. Can we manipulate root system architecture to control soil erosion? Soil 2015, 1, 603–612. [Google Scholar] [CrossRef] [Scilit]
- Gong, J.; Zhang, Q.; Wang, H.; Jiang, Y.; Ren, Z.; Ma, L. Research progress and prospect of gravity erosion in loess region. Proc. SHS Web Conf. 2023, 166, 01073. [Google Scholar] [CrossRef] [Scilit]
- Guo, H.; Li, Y.; Wang, X.; Ruan, H.; Abegunrin, T.P.; Wei, L.; Huang, Z.; Are, K.S.; Awe, G.O. Characteristics of nitrogen output during typical rainfall in different sugarcane growth stages in a southern subtropical watershed. Agriculture 2023, 13, 1613. [Google Scholar] [CrossRef] [Scilit]
- Jayaraman, S.; Dang, Y.P.; Naorem, A.; Page, K.L.; Dalal, R.C. Conservation agriculture as a system to enhance ecosystem services. Agriculture 2021, 11, 718. [Google Scholar] [CrossRef] [Scilit]
- Oku, E.; Fagbola, O.; Truong, P. Evaluation of vetiver grass buffer strips and organomineral fertilization for the improvement of soil physical properties. Agric. Nat. Resour. 2011, 45, 824–831. [Google Scholar]
- Cai, Y.; Yan, Y.; Xu, D.; Xu, X.; Wang, C.; Wang, X.; Chen, J.; Xin, X.; Eldridge, D.J. The fertile island effect collapses under extreme overgrazing: Evidence from a shrub-encroached grassland. Plant Soil 2020, 448, 201–212. [Google Scholar] [CrossRef] [Scilit]
- Akter, S.; Li, X.; Dzakpasu, M.; Ifon, B.E.; Manirakiza, B.; Muyembe, D.K.; Zhang, Y.; Huang, J.; Guadie, A. Nutrient and sediment retention by riparian vegetated buffer strips: Impacts of buffer length, vegetation type, and season. Agric. Ecosyst. Environ. 2024, 369, 109050. [Google Scholar] [CrossRef] [Scilit]
- Kaurila, K.; Lignell, R.; Thingstad, F.; Kuosa, H.; Vanhatalo, J. Bayesian calibration and uncertainty quantification for a large nutrient load impact model. Ecol. Inform. 2025, 85, 102976. [Google Scholar] [CrossRef] [Scilit]
- Aquino-López, M.A.; Anderson, L.; Sanchez-Cabeza, J.-A.; Ruiz-Fernández, A.C.; Christen, J.A. Bayesian Approaches to Proxy Uncertainty Quantification in Paleoecology: A Mathematical Justification and Practical Integration. J. Agric. Biol. Environ. Stat. 2024, 31, 162–175. [Google Scholar] [CrossRef] [Scilit]
- Miller, S. Causal forest estimation of heterogeneous and time-varying environmental policy effects. J. Environ. Econ. Manag. 2020, 103, 102337. [Google Scholar] [CrossRef] [Scilit]
- Feng, J.; Wei, W.; Pan, D. Effects of rainfall and terracing-vegetation combinations on water erosion in a loess hilly area, China. J. Environ. Manag. 2020, 261, 110247. [Google Scholar] [CrossRef] [Scilit]
- Bogunović, I.; Filipović, V. Mulch as a nature-based solution to halt and reverse land degradation in agricultural areas. Curr. Opin. Environ. Sci. Health 2023, 34, 100488. [Google Scholar] [CrossRef] [Scilit]
- Tian, P.; Tian, X.; Geng, R.; Zhao, G.; Yang, L.; Mu, X.; Gao, P.; Sun, W.; Liu, Y. Response of soil erosion to vegetation restoration and terracing on the Loess Plateau. Catena 2023, 227, 107103. [Google Scholar] [CrossRef] [Scilit]
- Rutebuka, J.; Uwimanzi, A.M.; Nkundwakazi, O.; Kagabo, D.M.; Mbonigaba, J.J.M.; Vermeir, P.; Verdoodt, A. Effectiveness of terracing techniques for controlling soil erosion by water in Rwanda. J. Environ. Manag. 2021, 277, 111369. [Google Scholar] [CrossRef] [Scilit]
- Xu, Q.-X.; Wu, P.; Dai, J.-F.; Wang, T.-W.; Li, Z.-X.; Cai, C.-F.; Shi, Z.-H. The effects of rainfall regimes and terracing on runoff and erosion in the Three Gorges area, China. Environ. Sci. Pollut. Res. 2018, 25, 9474–9484. [Google Scholar] [CrossRef] [Scilit]
- Liu, S.; Dong, Y.; Li, D.; Liu, Q.; Wang, J.; Zhang, X. Effects of different terrace protection measures in a sloping land consolidation project targeting soil erosion at the slope scale. Ecol. Eng. 2013, 53, 46–53. [Google Scholar] [CrossRef] [Scilit]
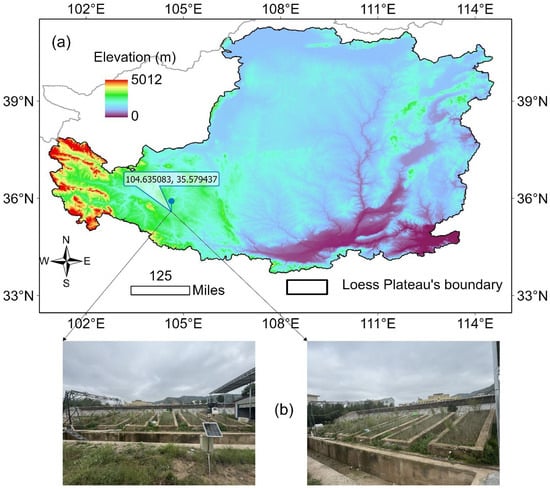
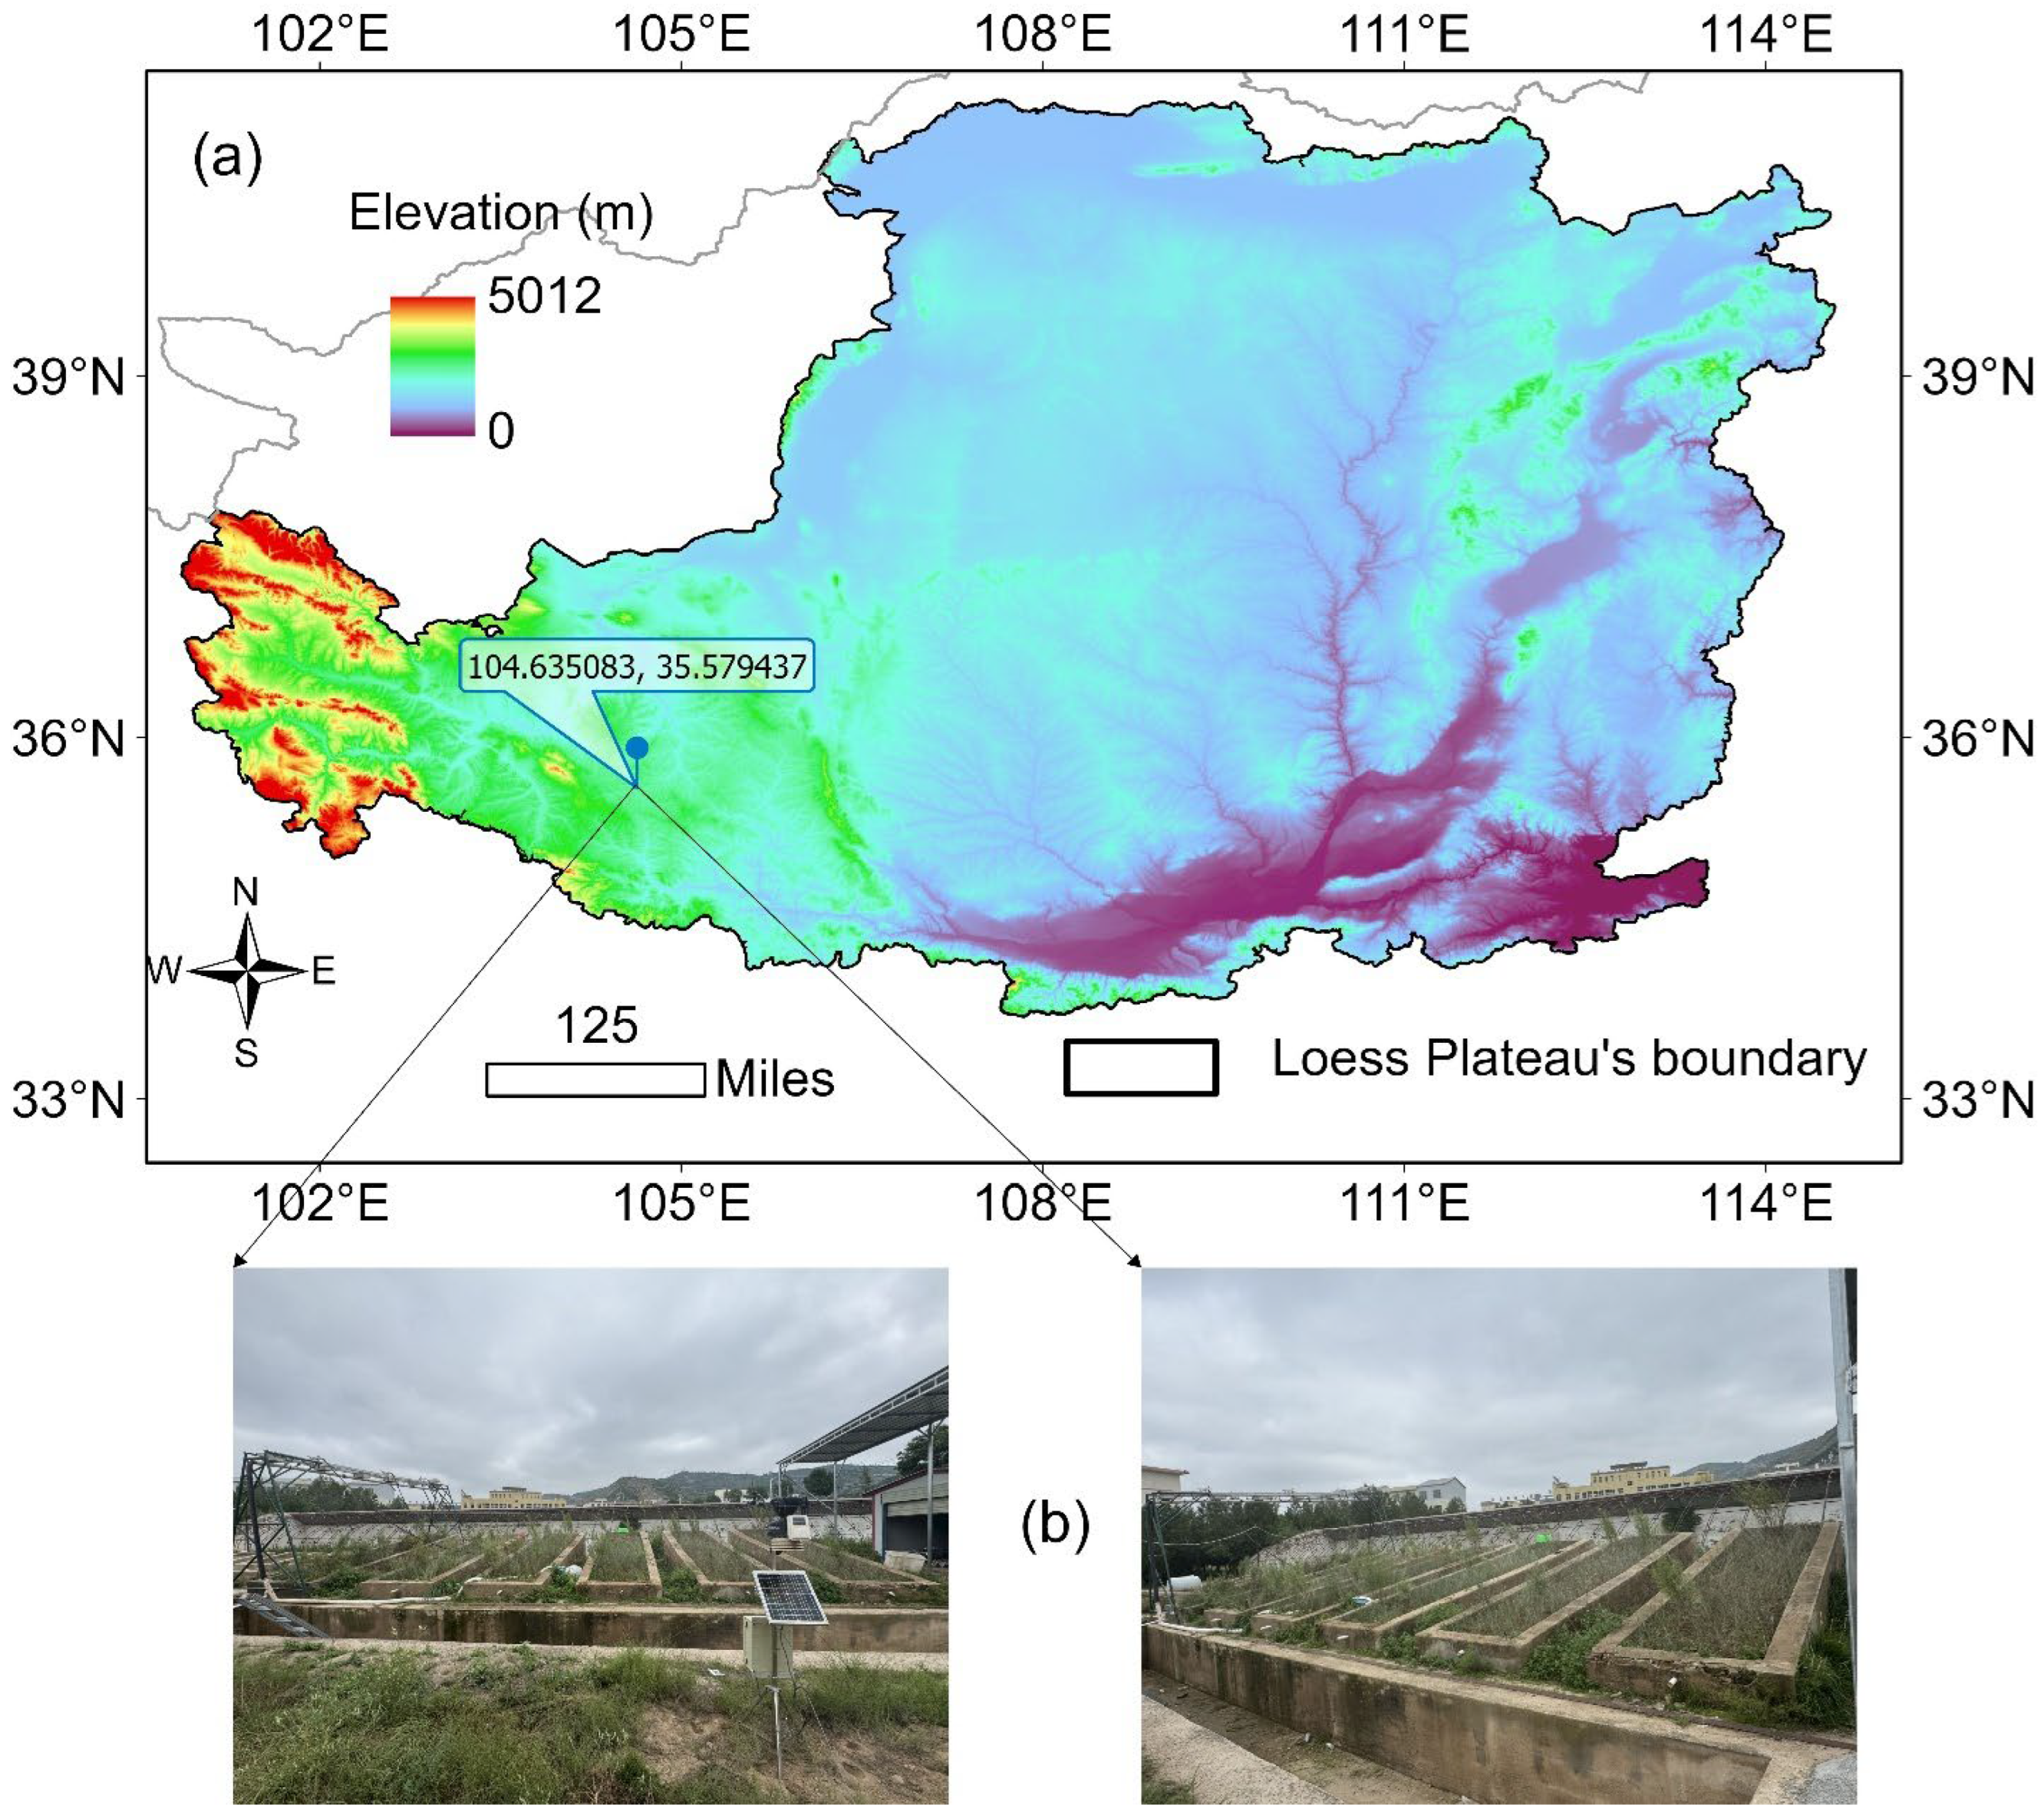
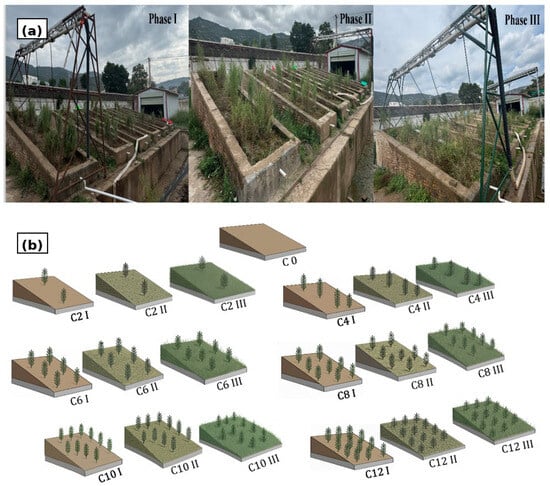
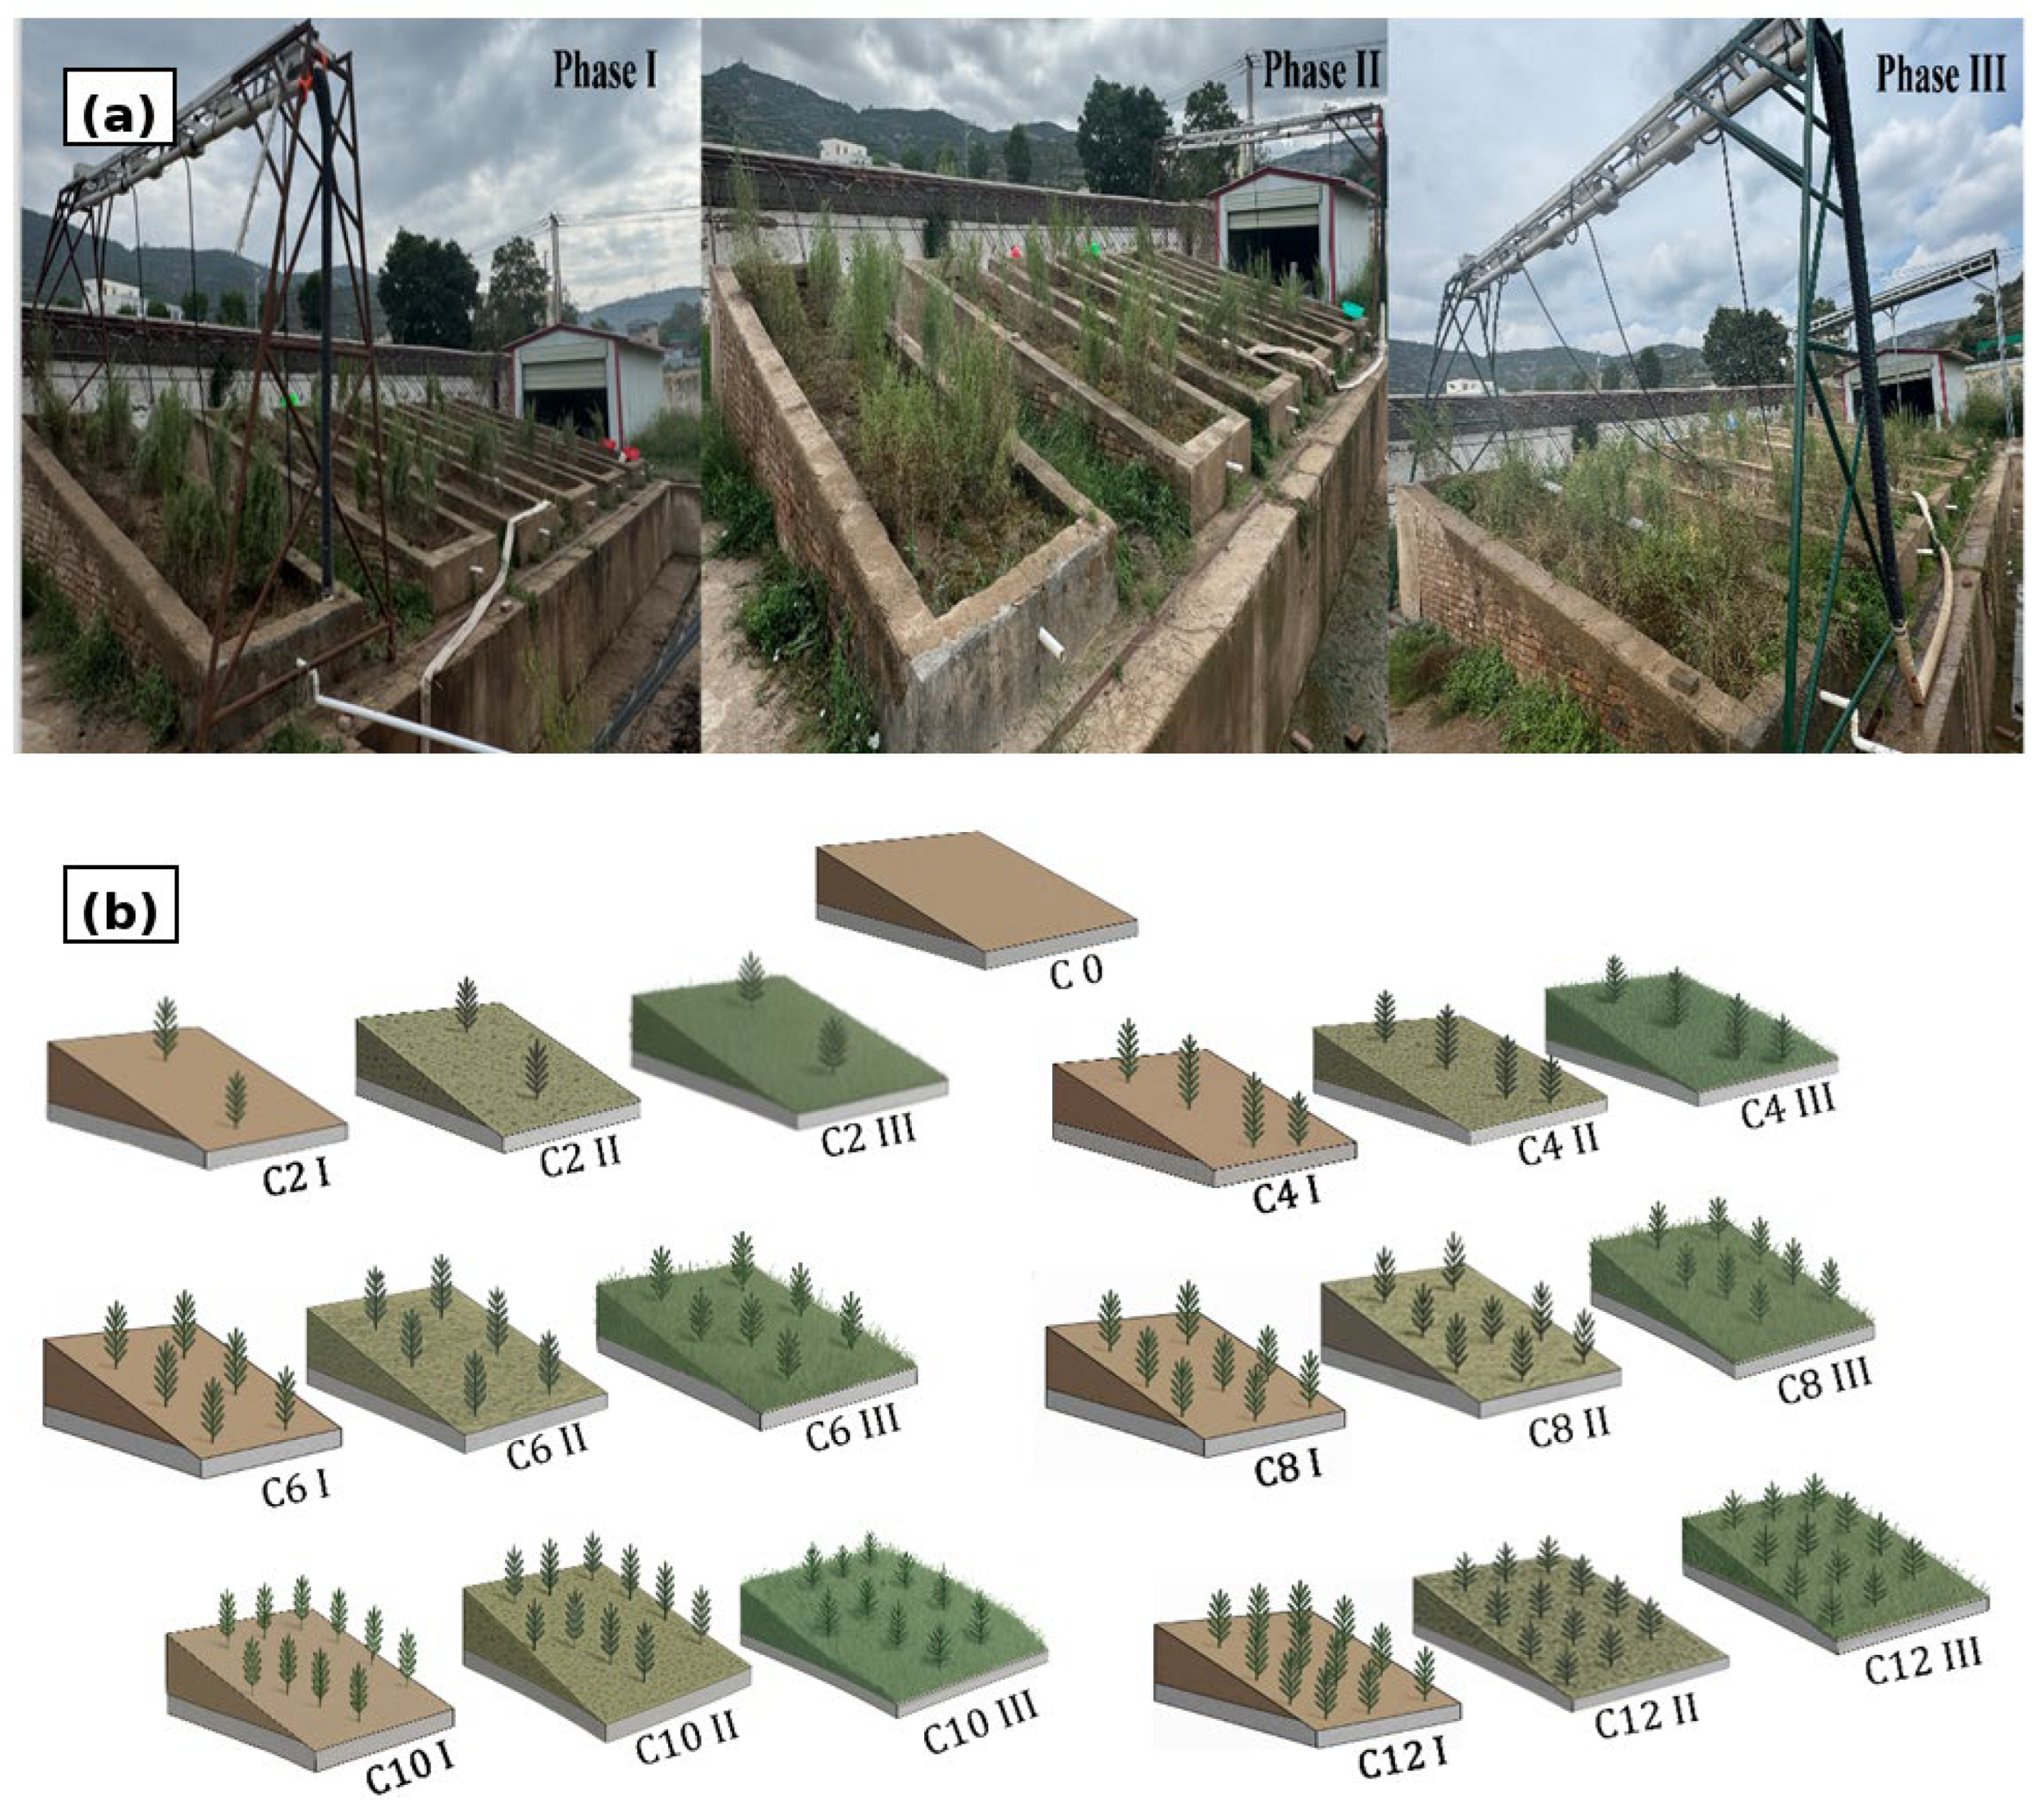
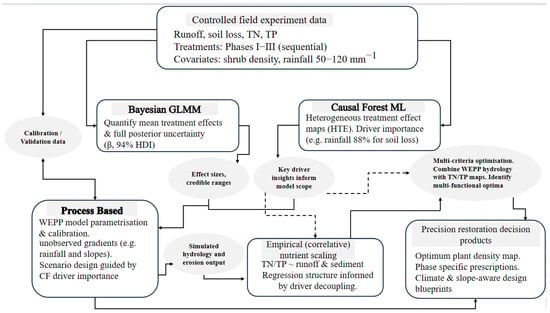
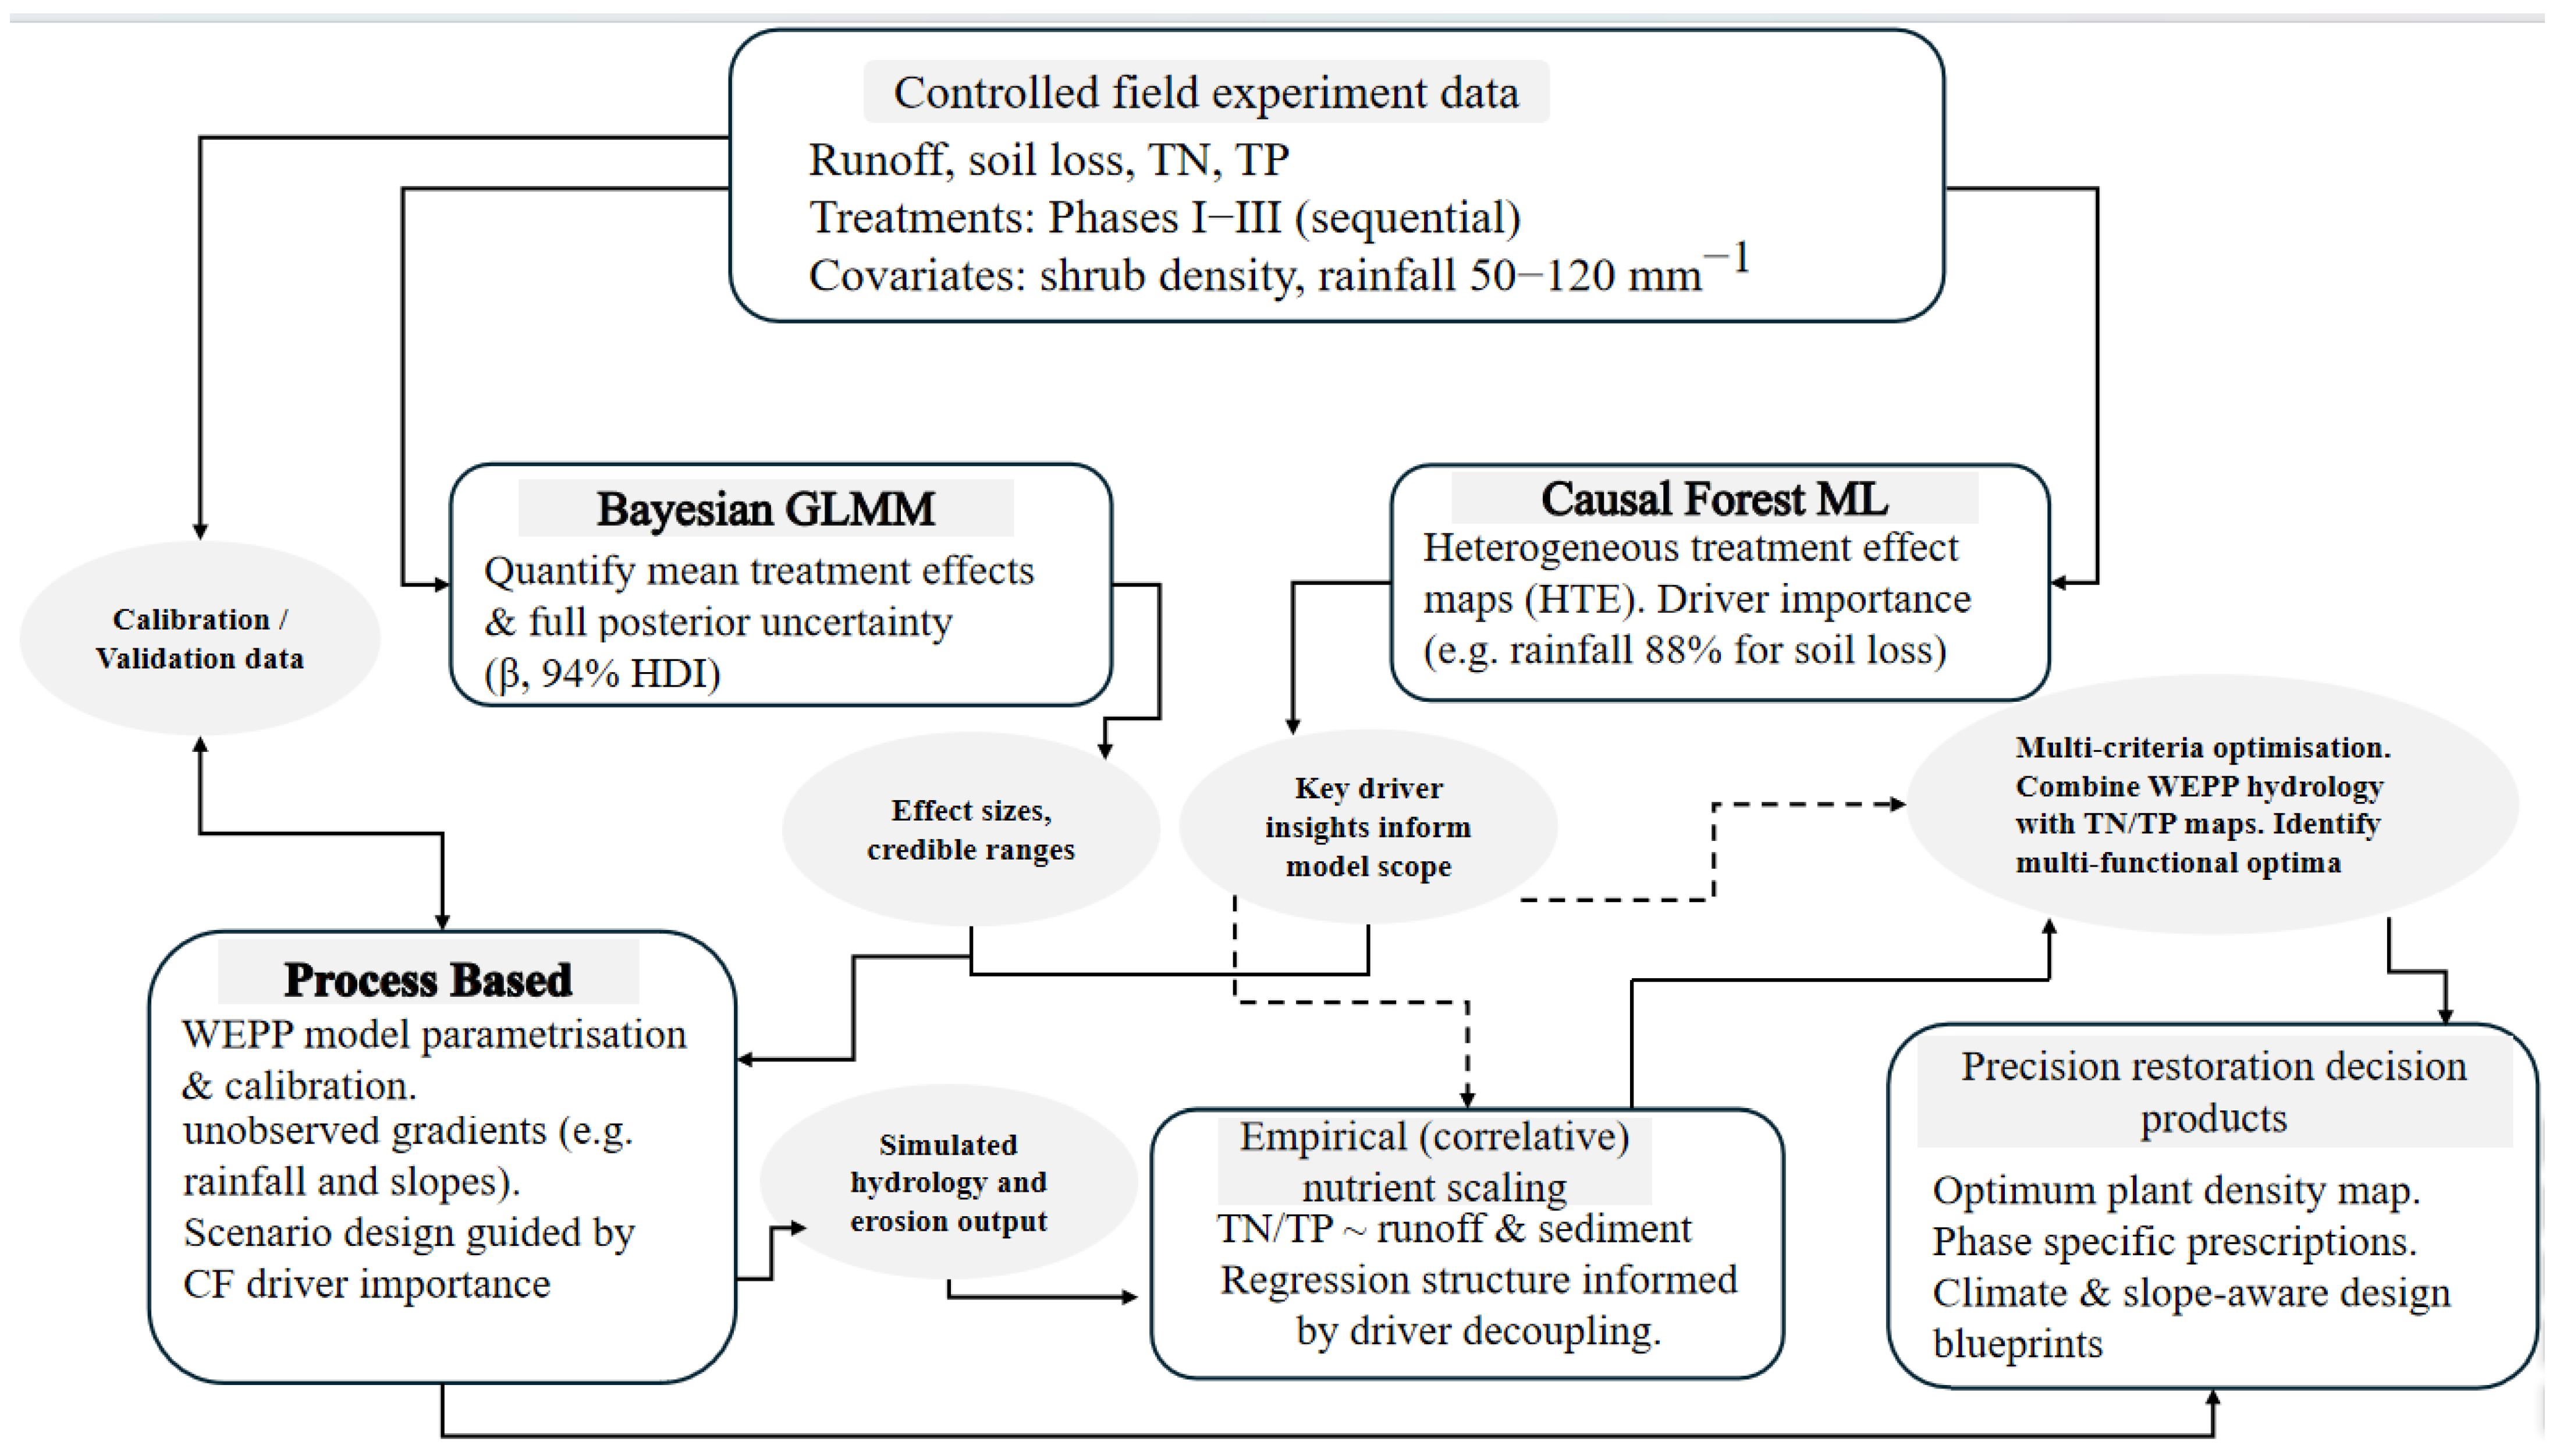
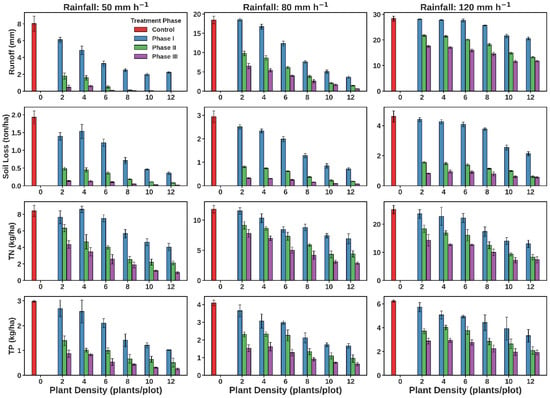
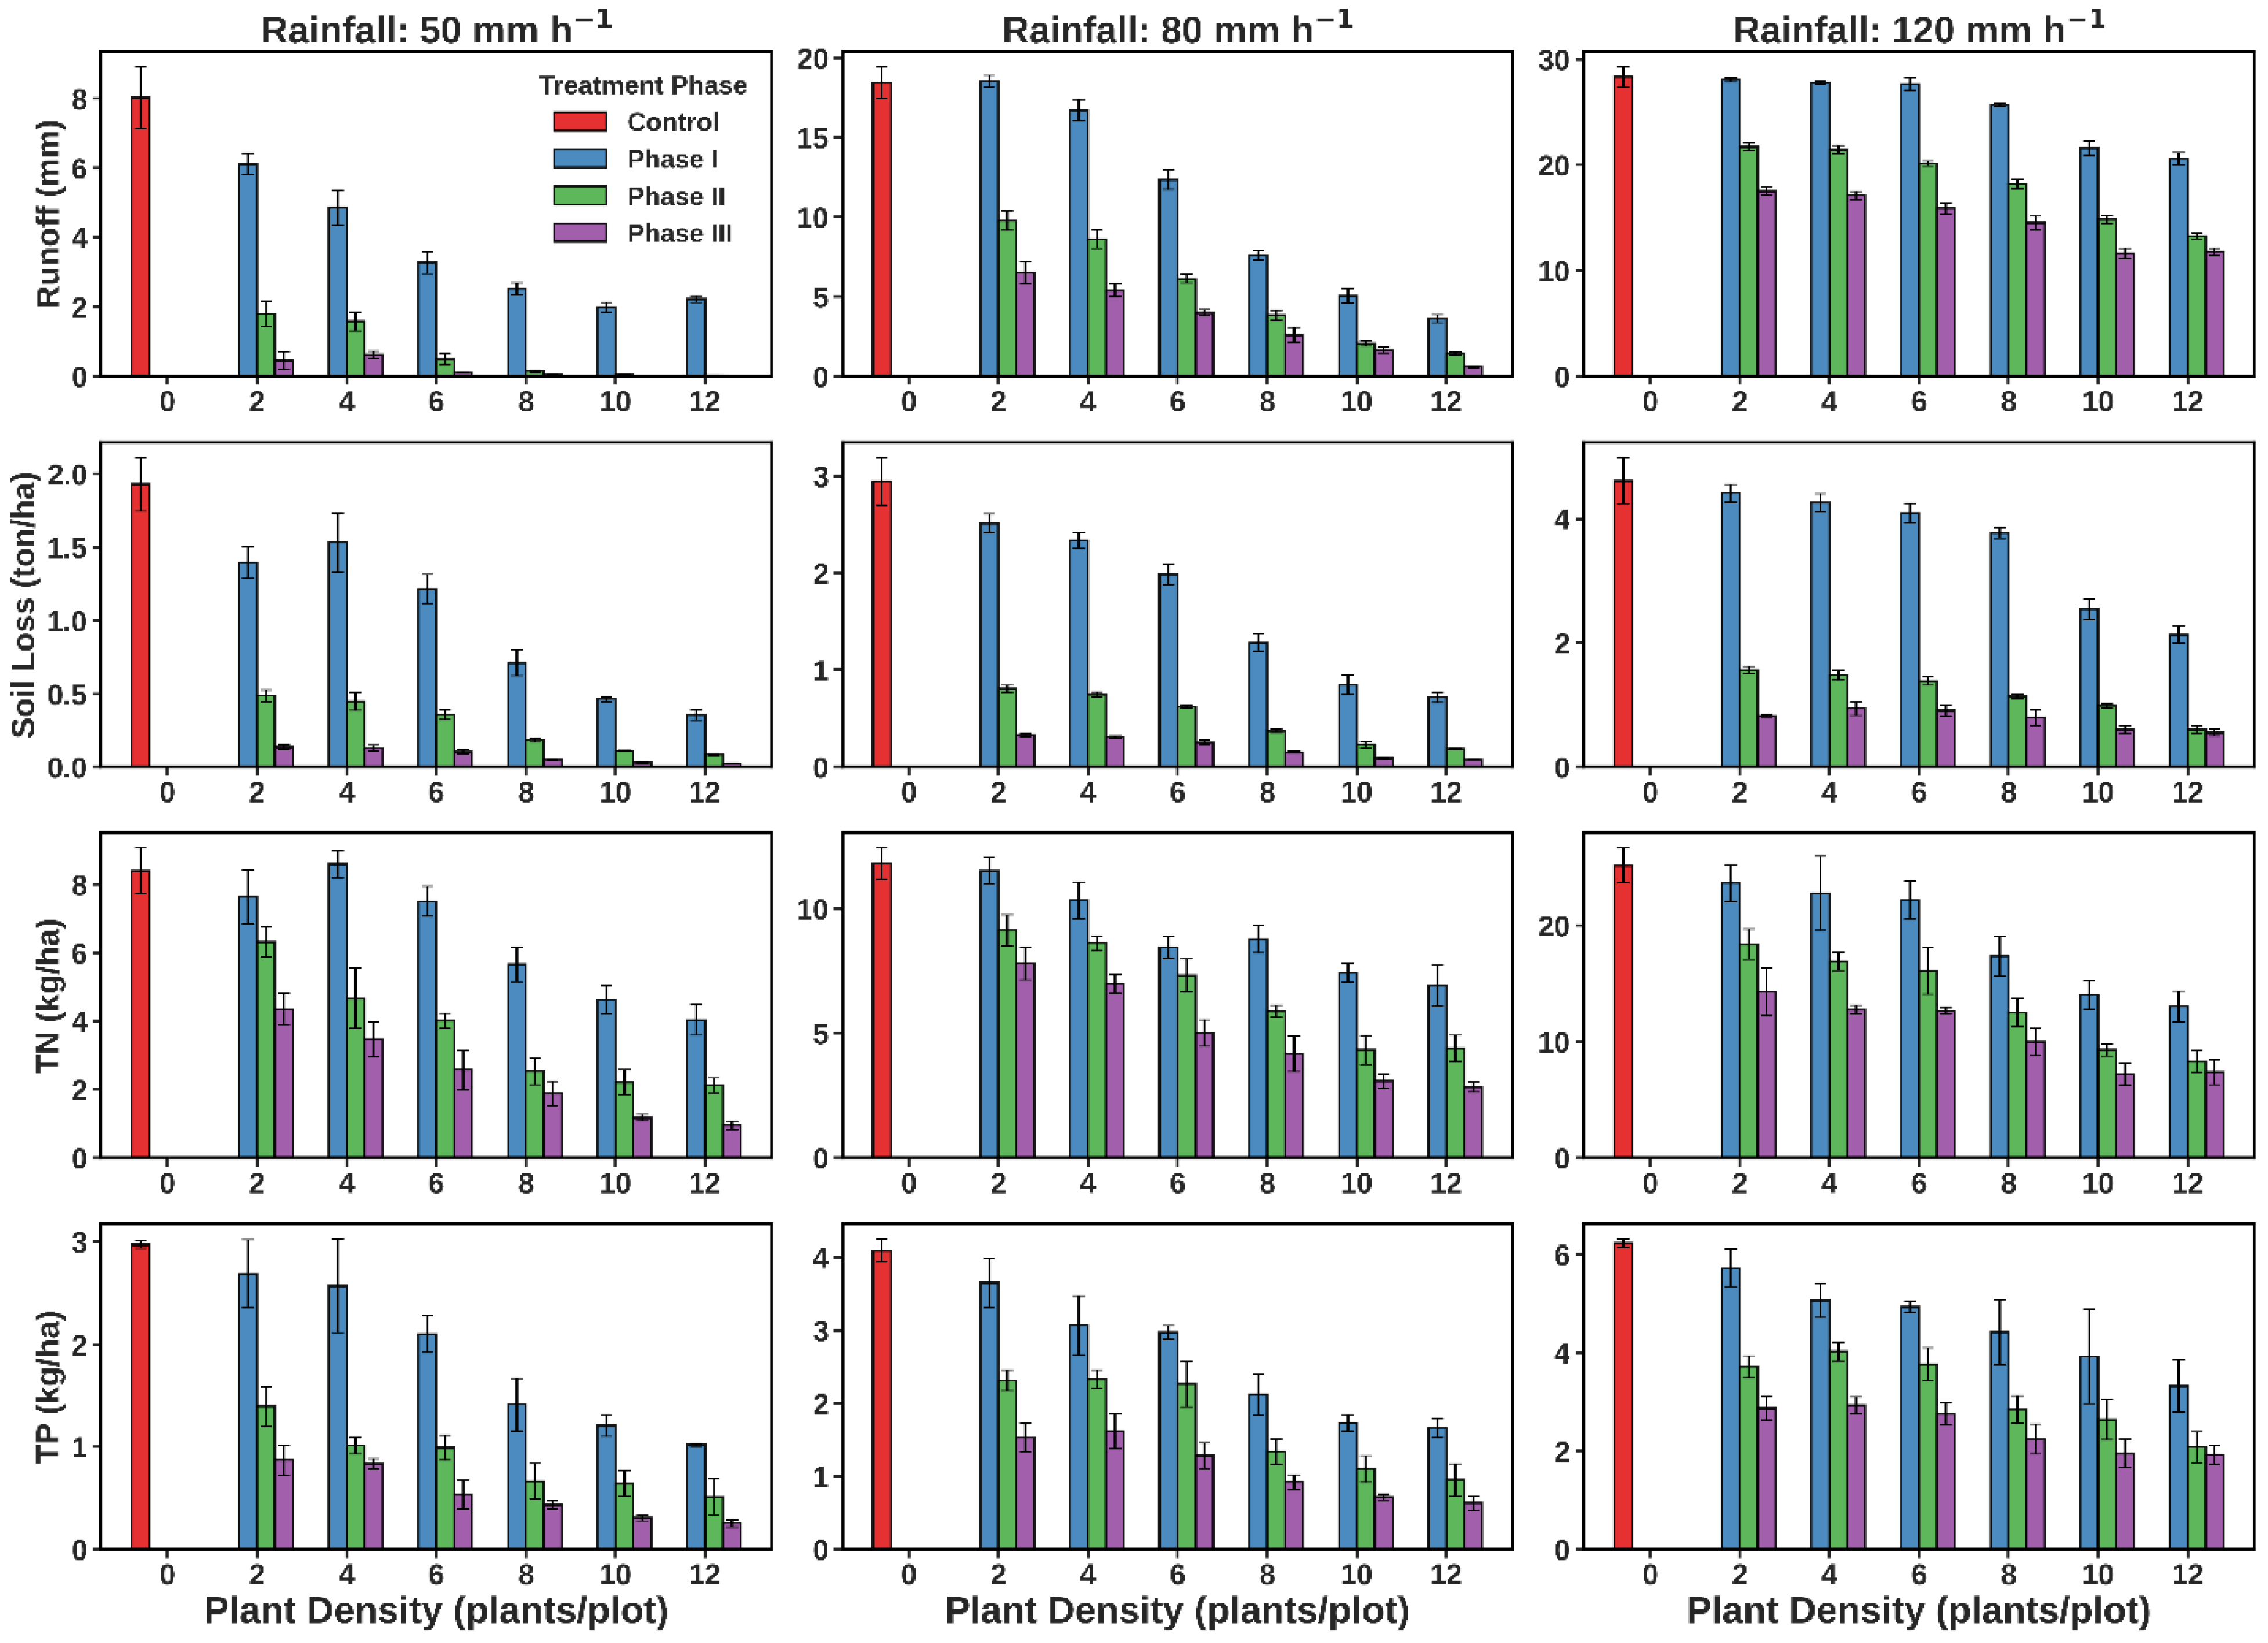
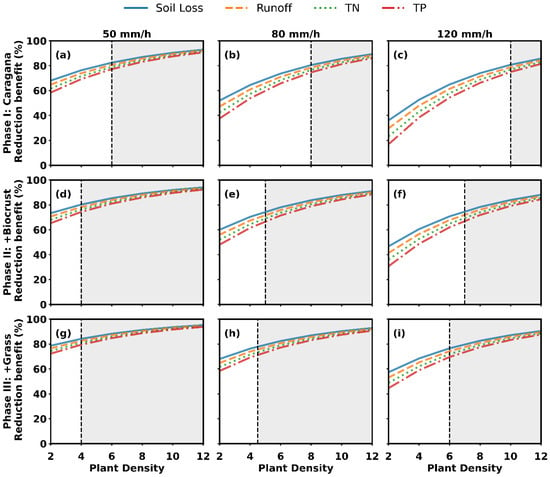
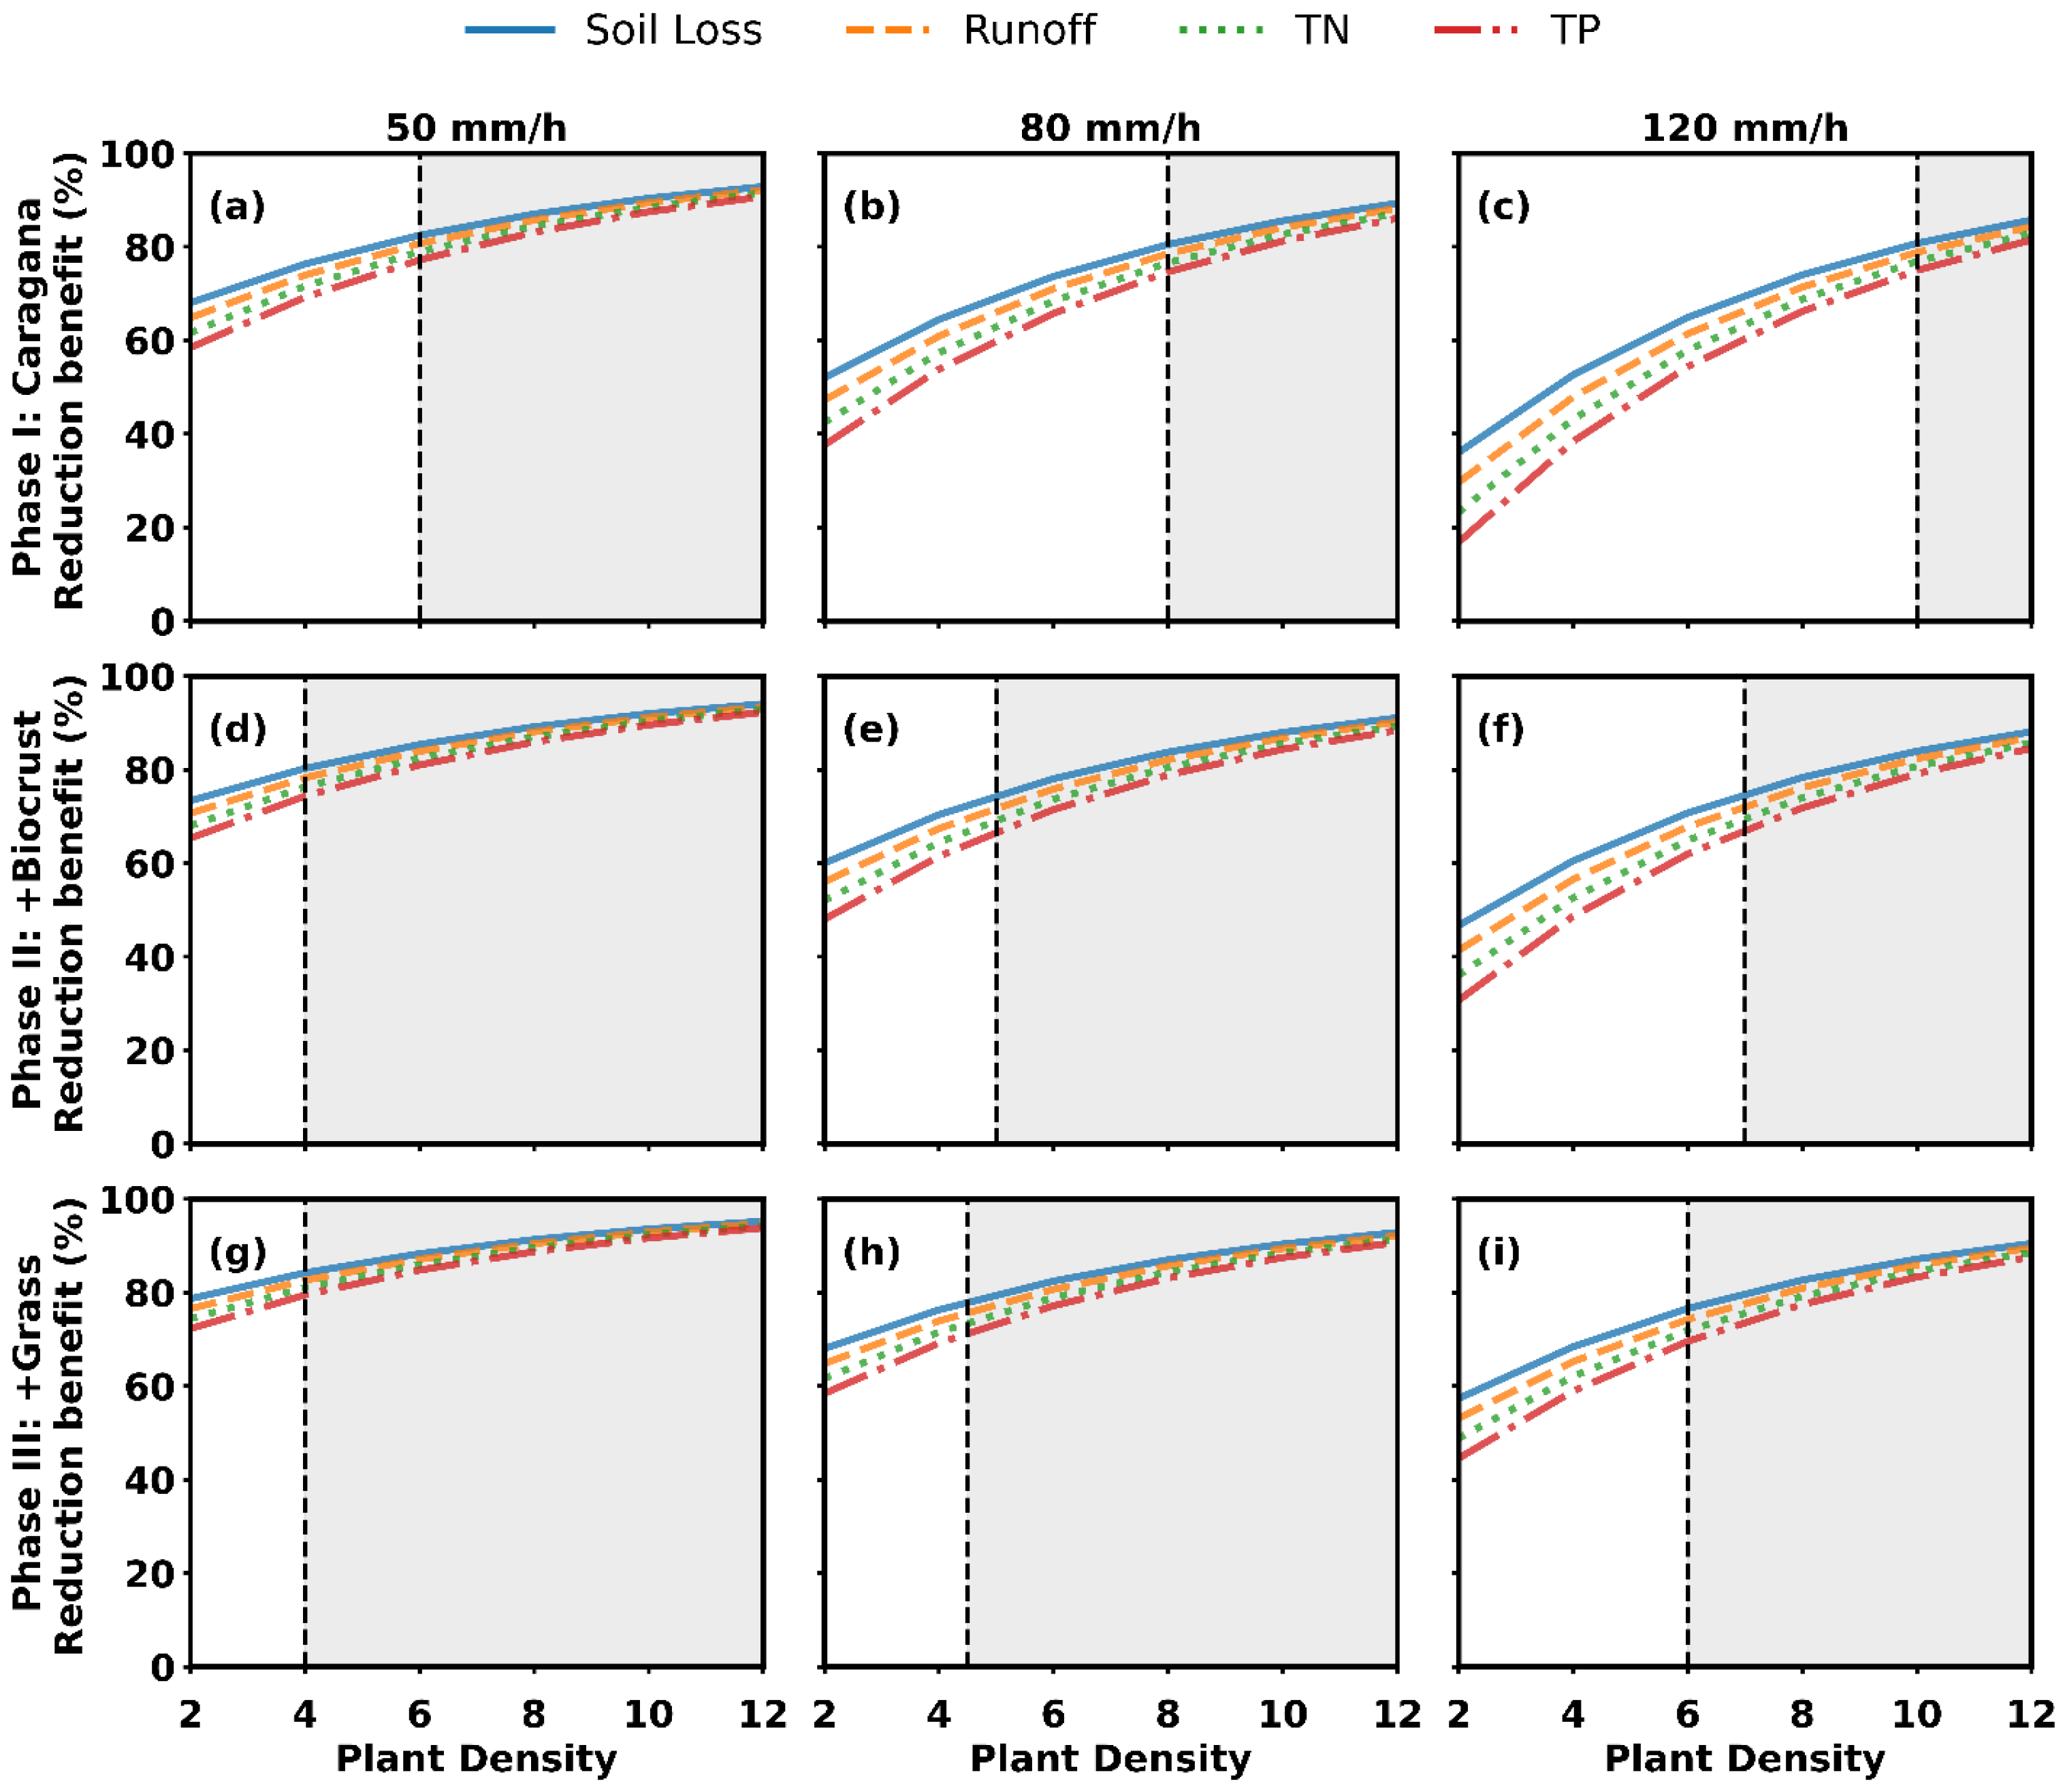
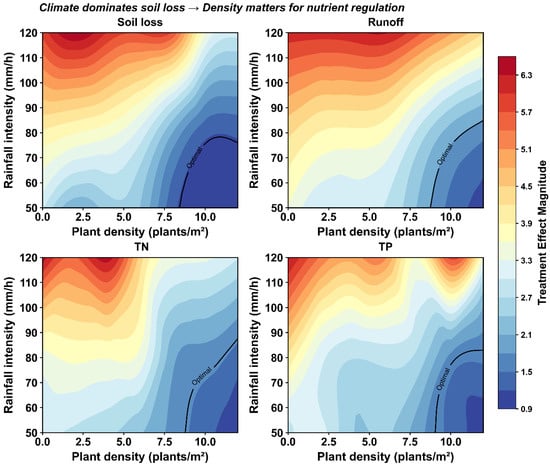
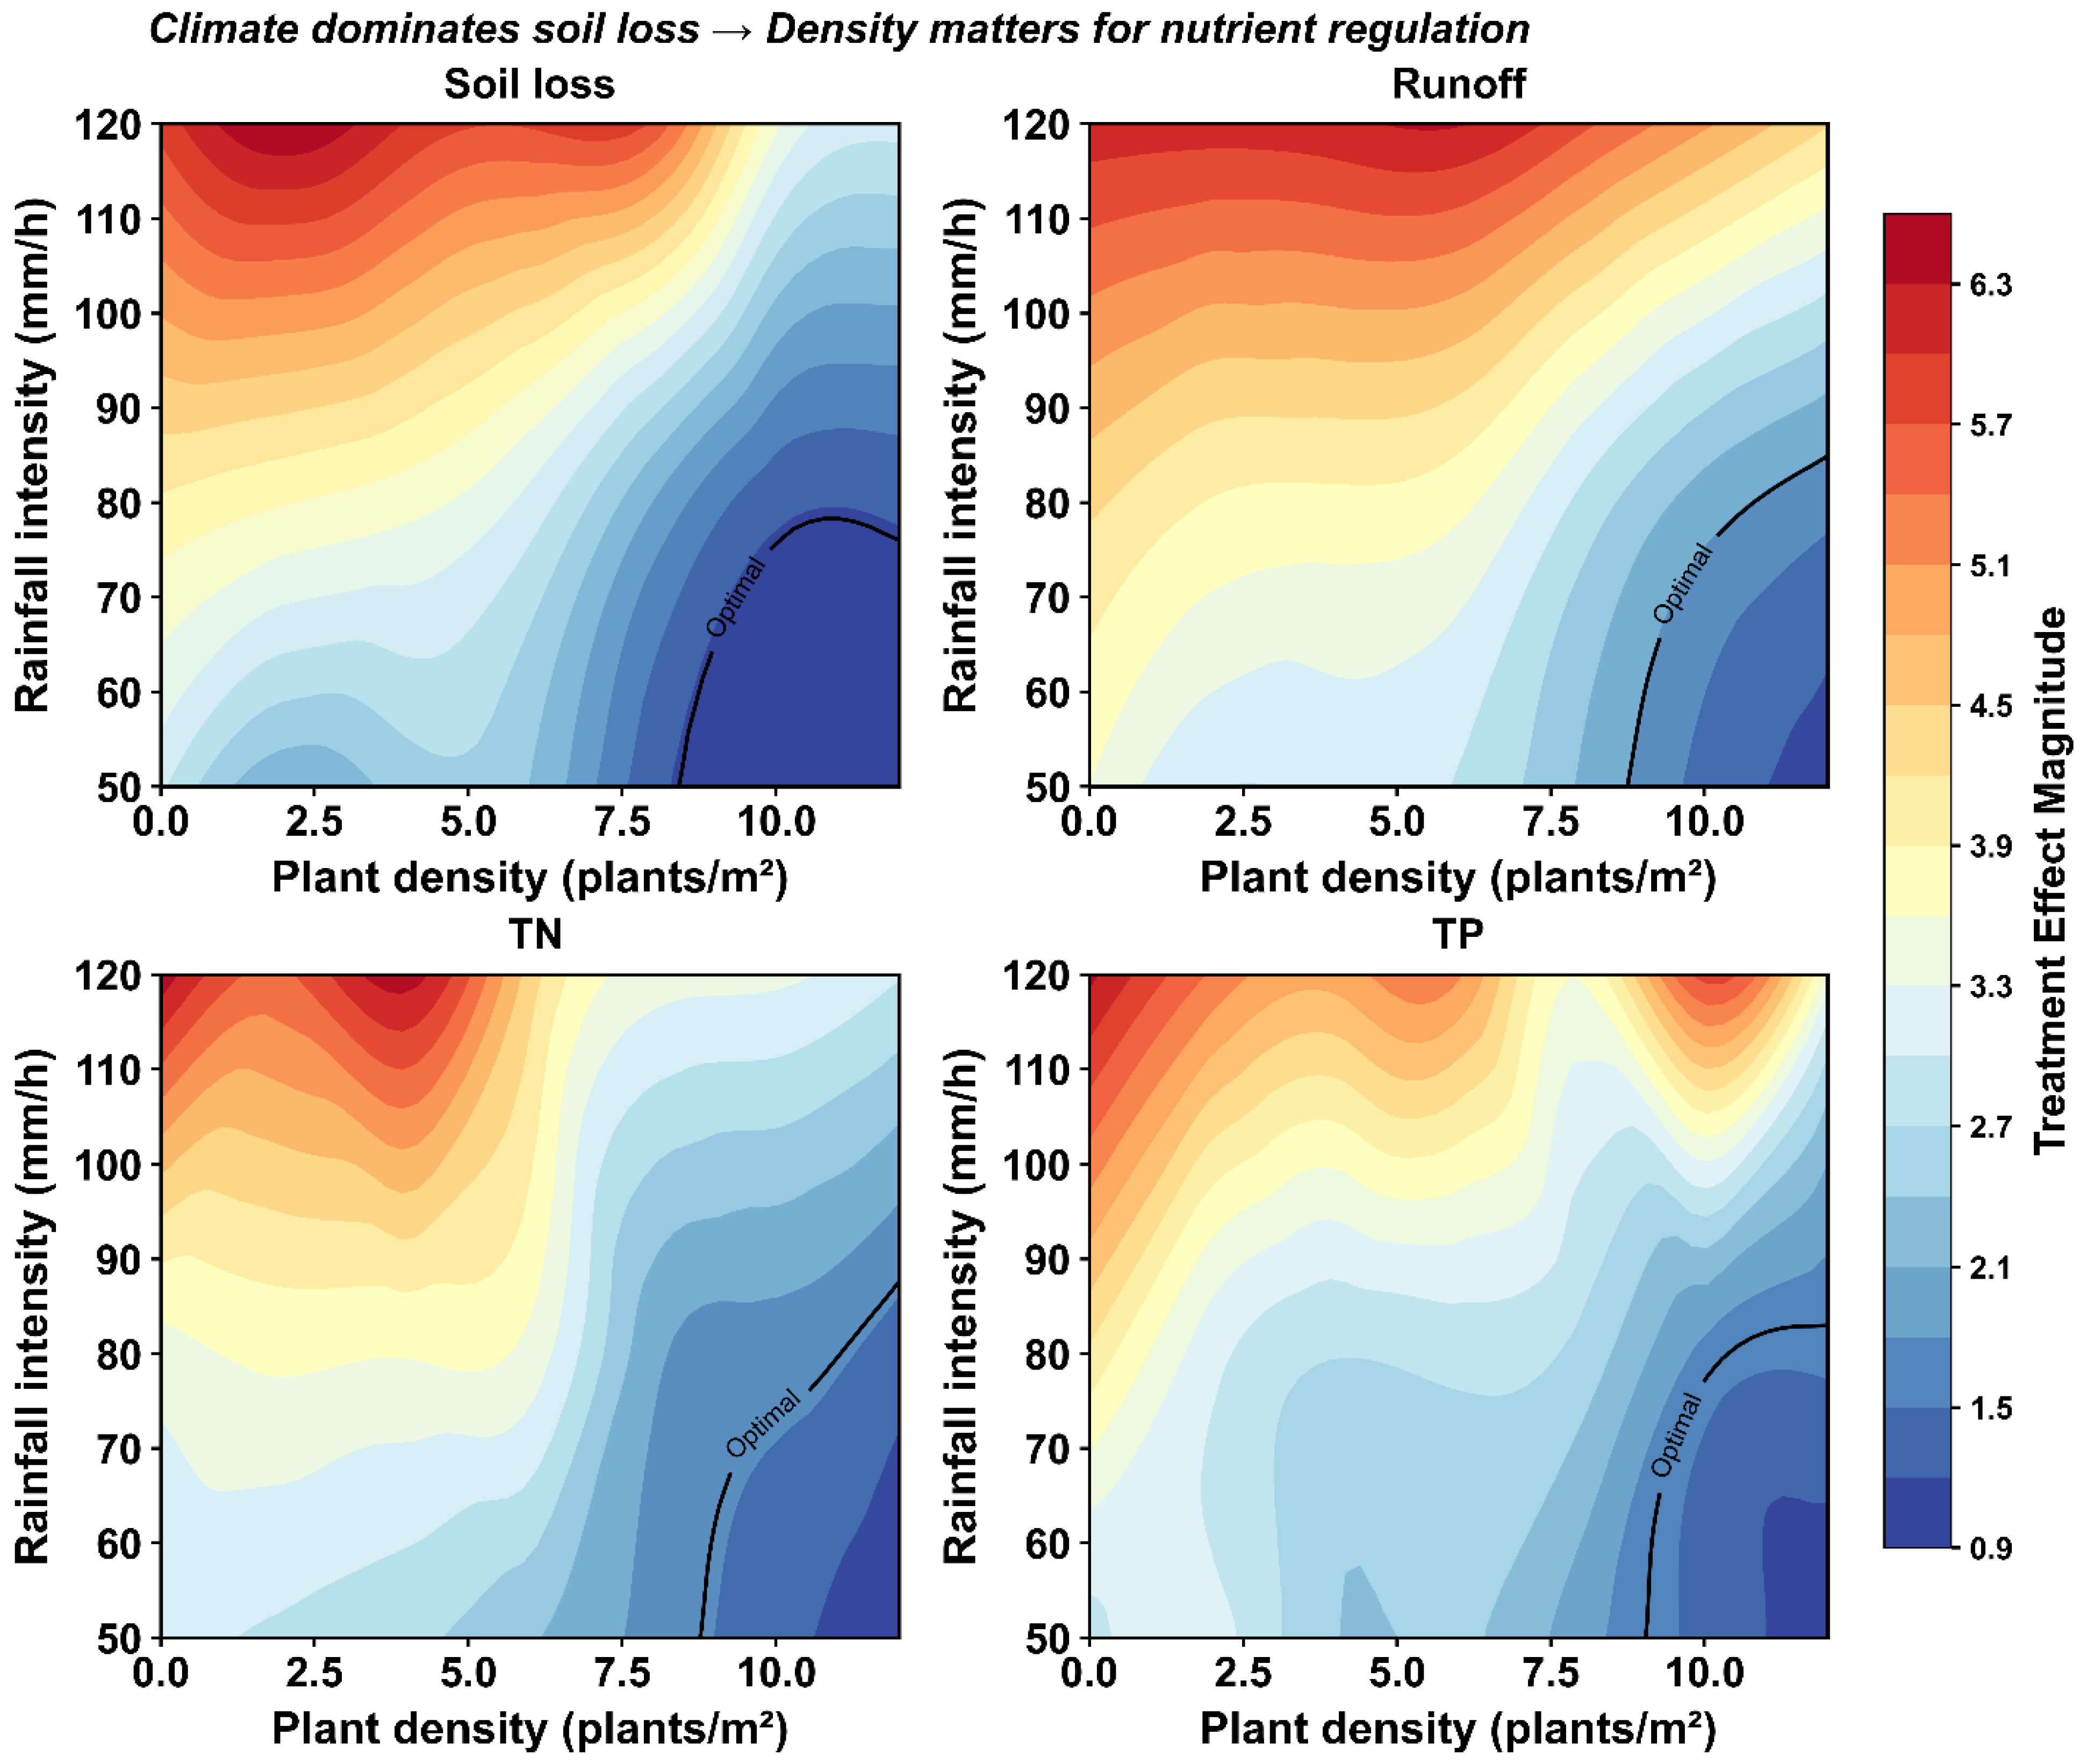
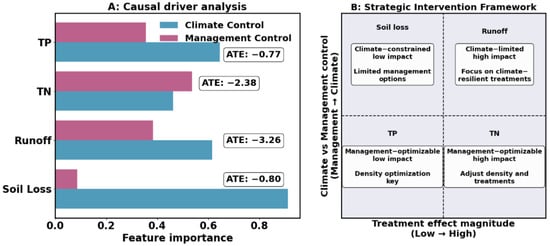
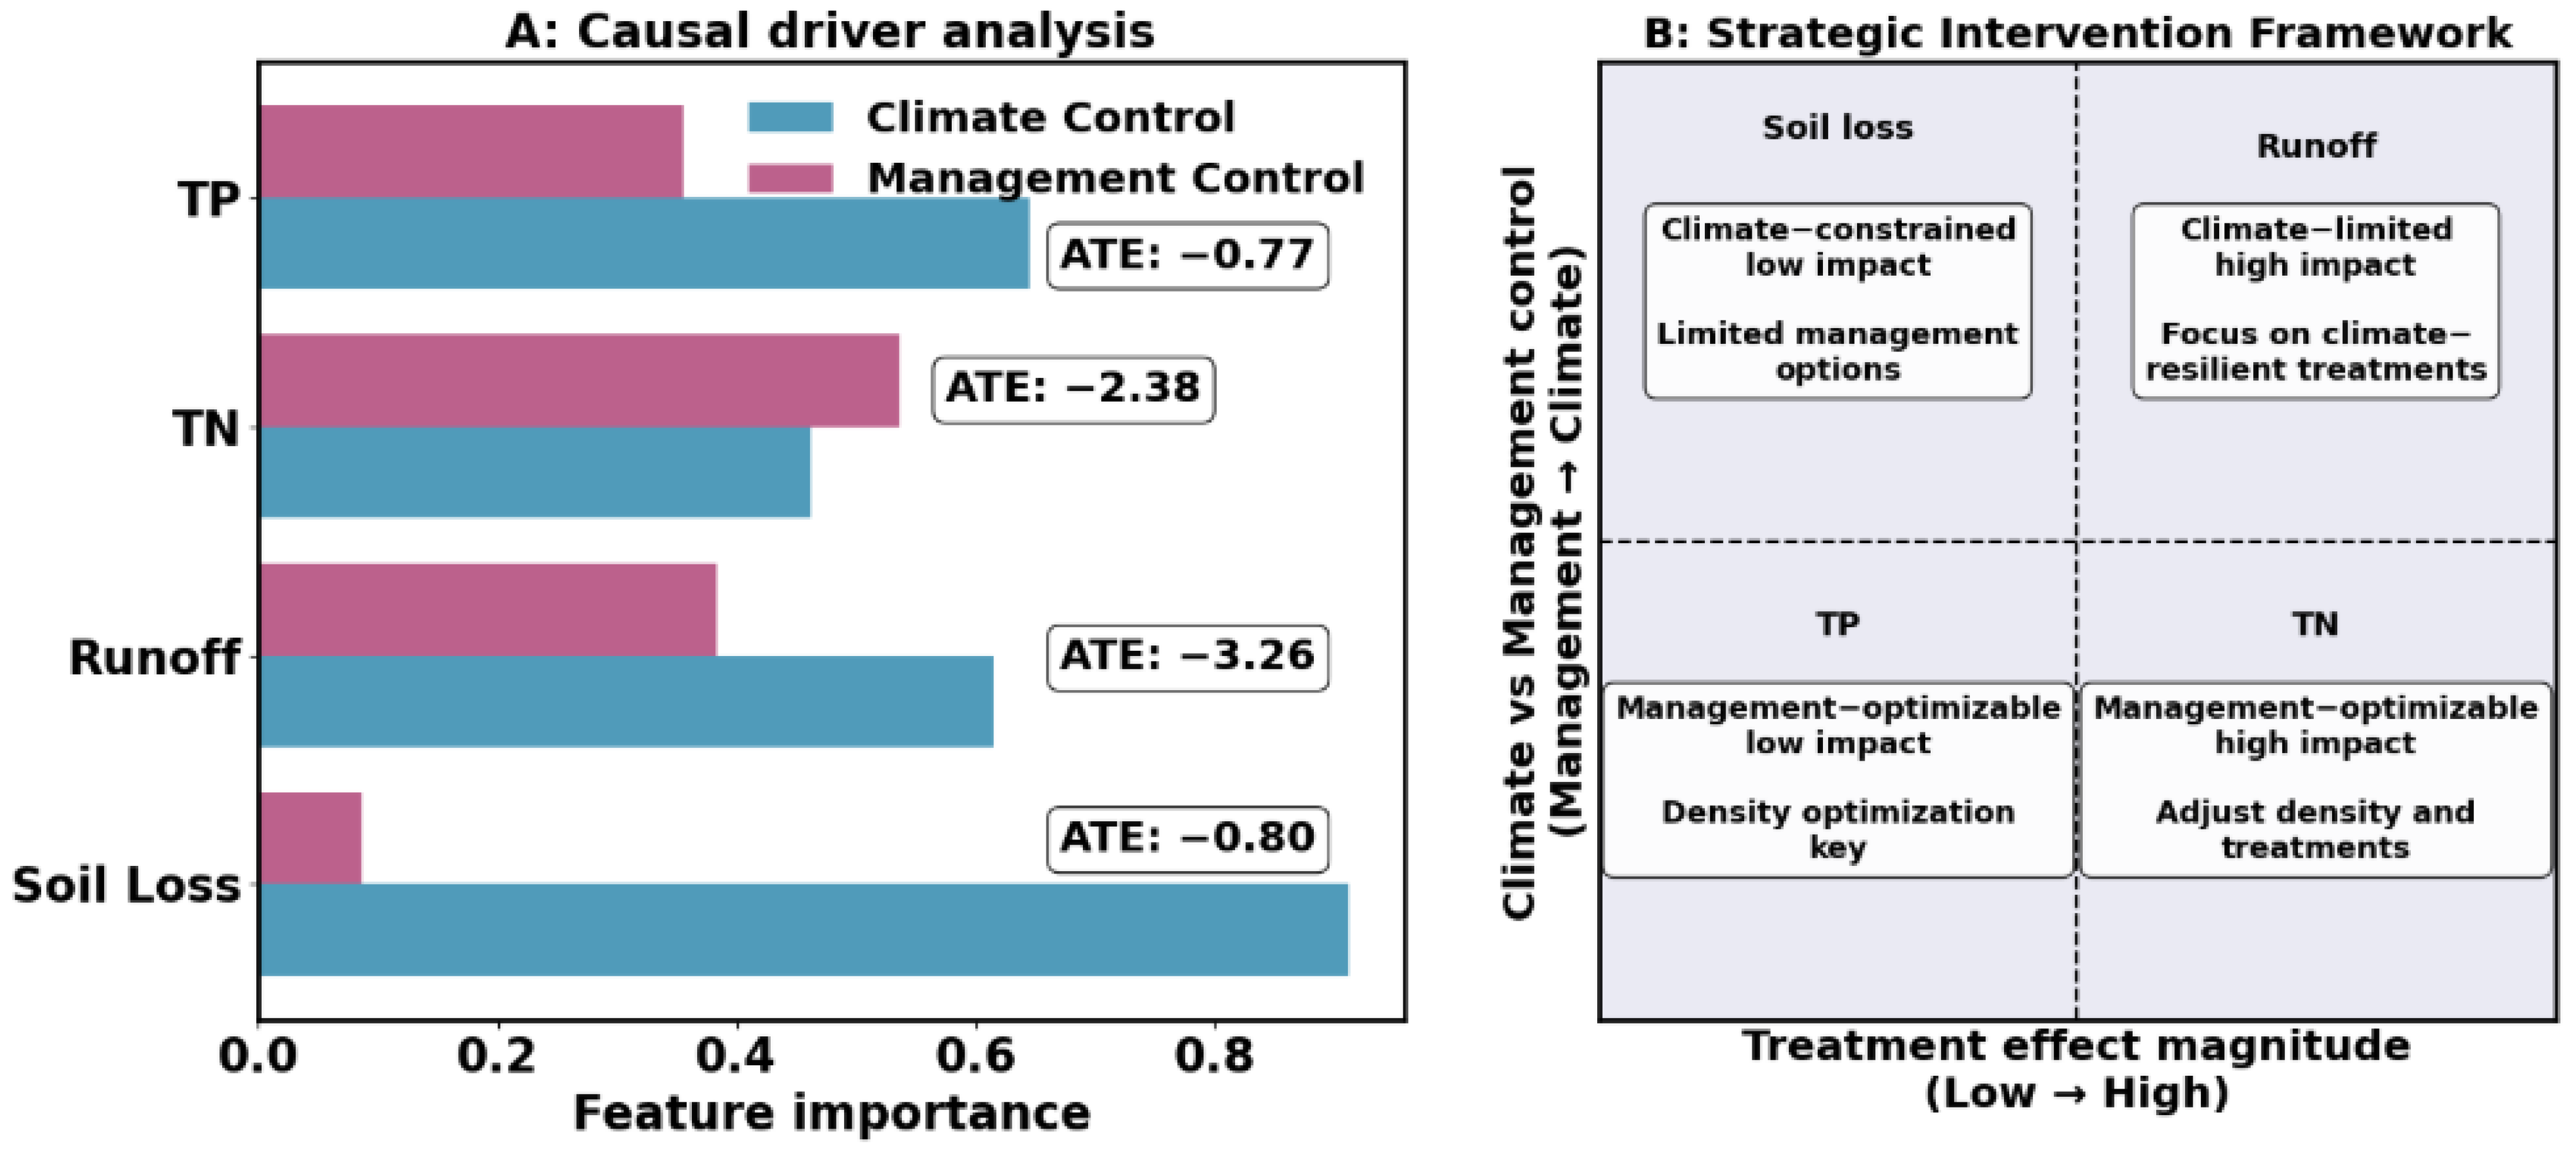
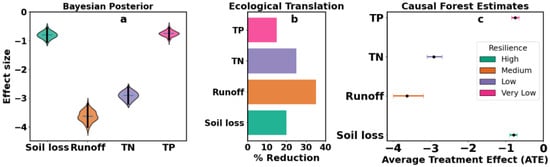
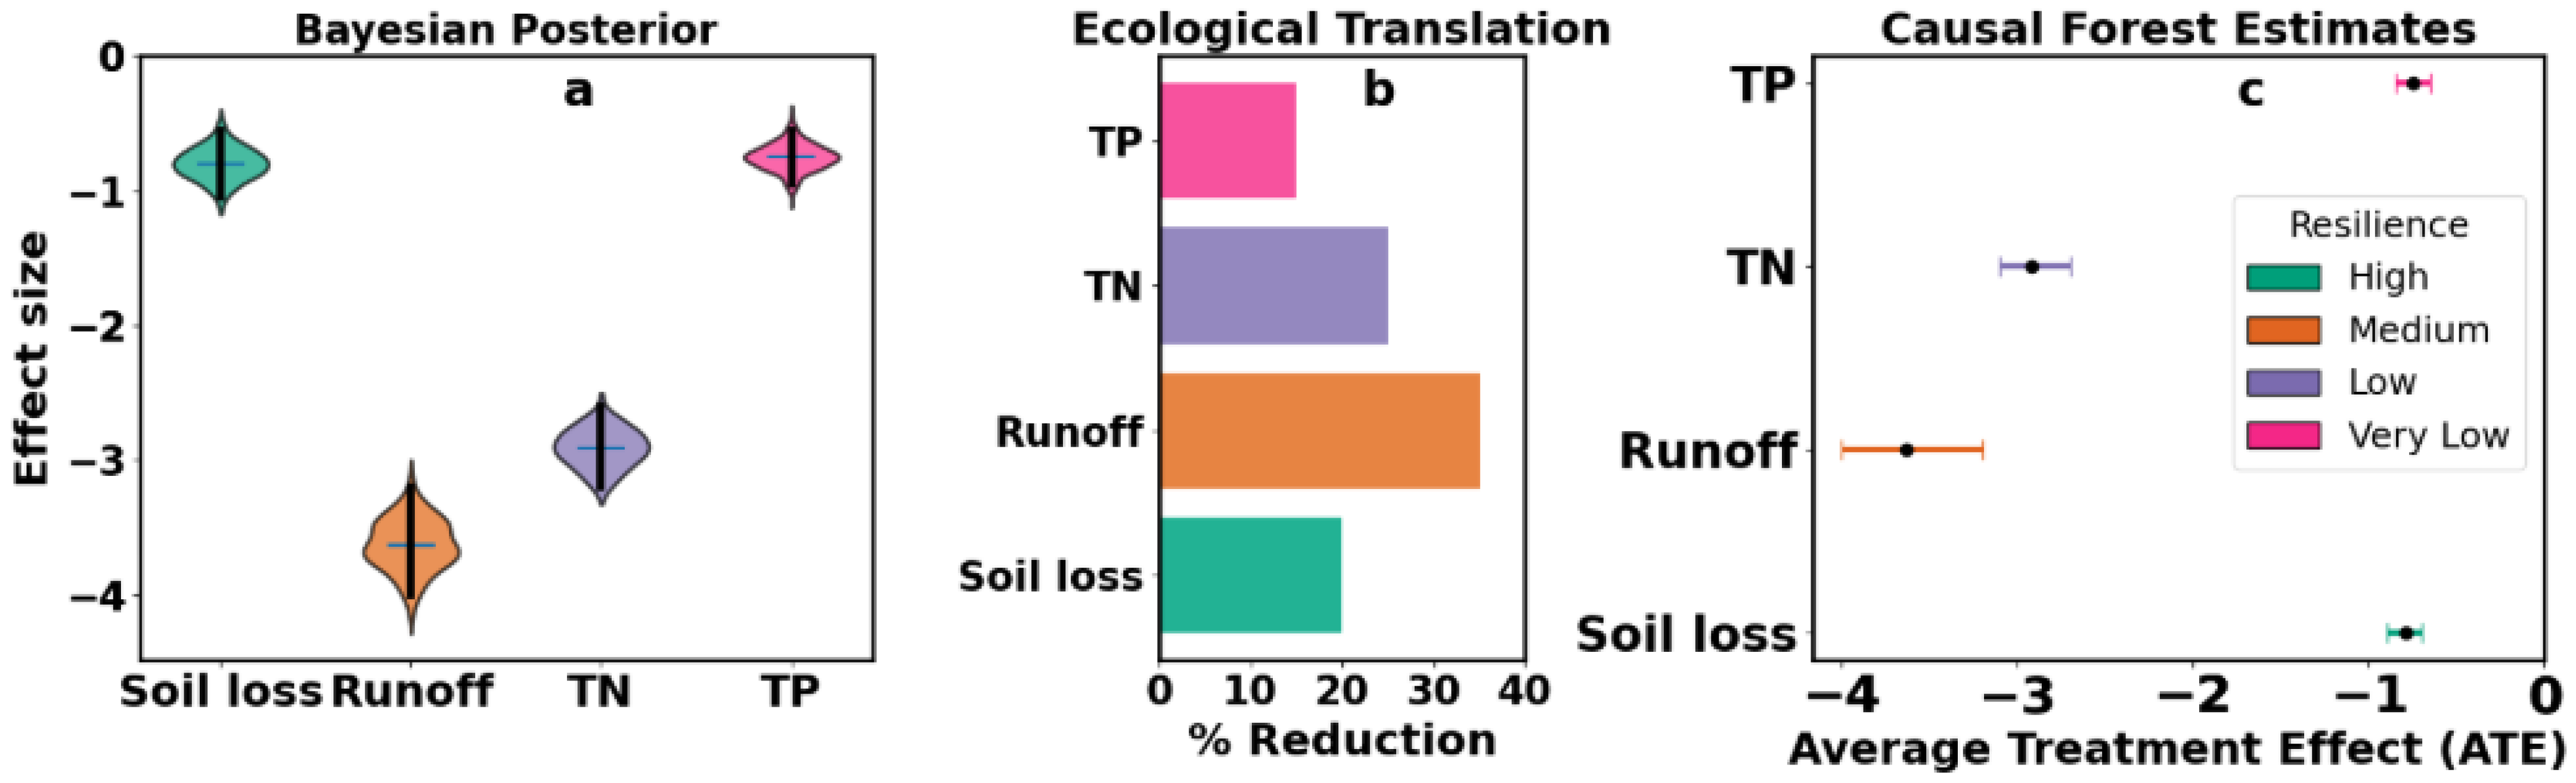
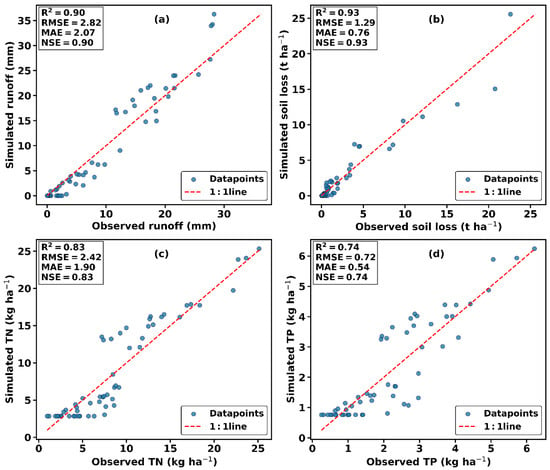
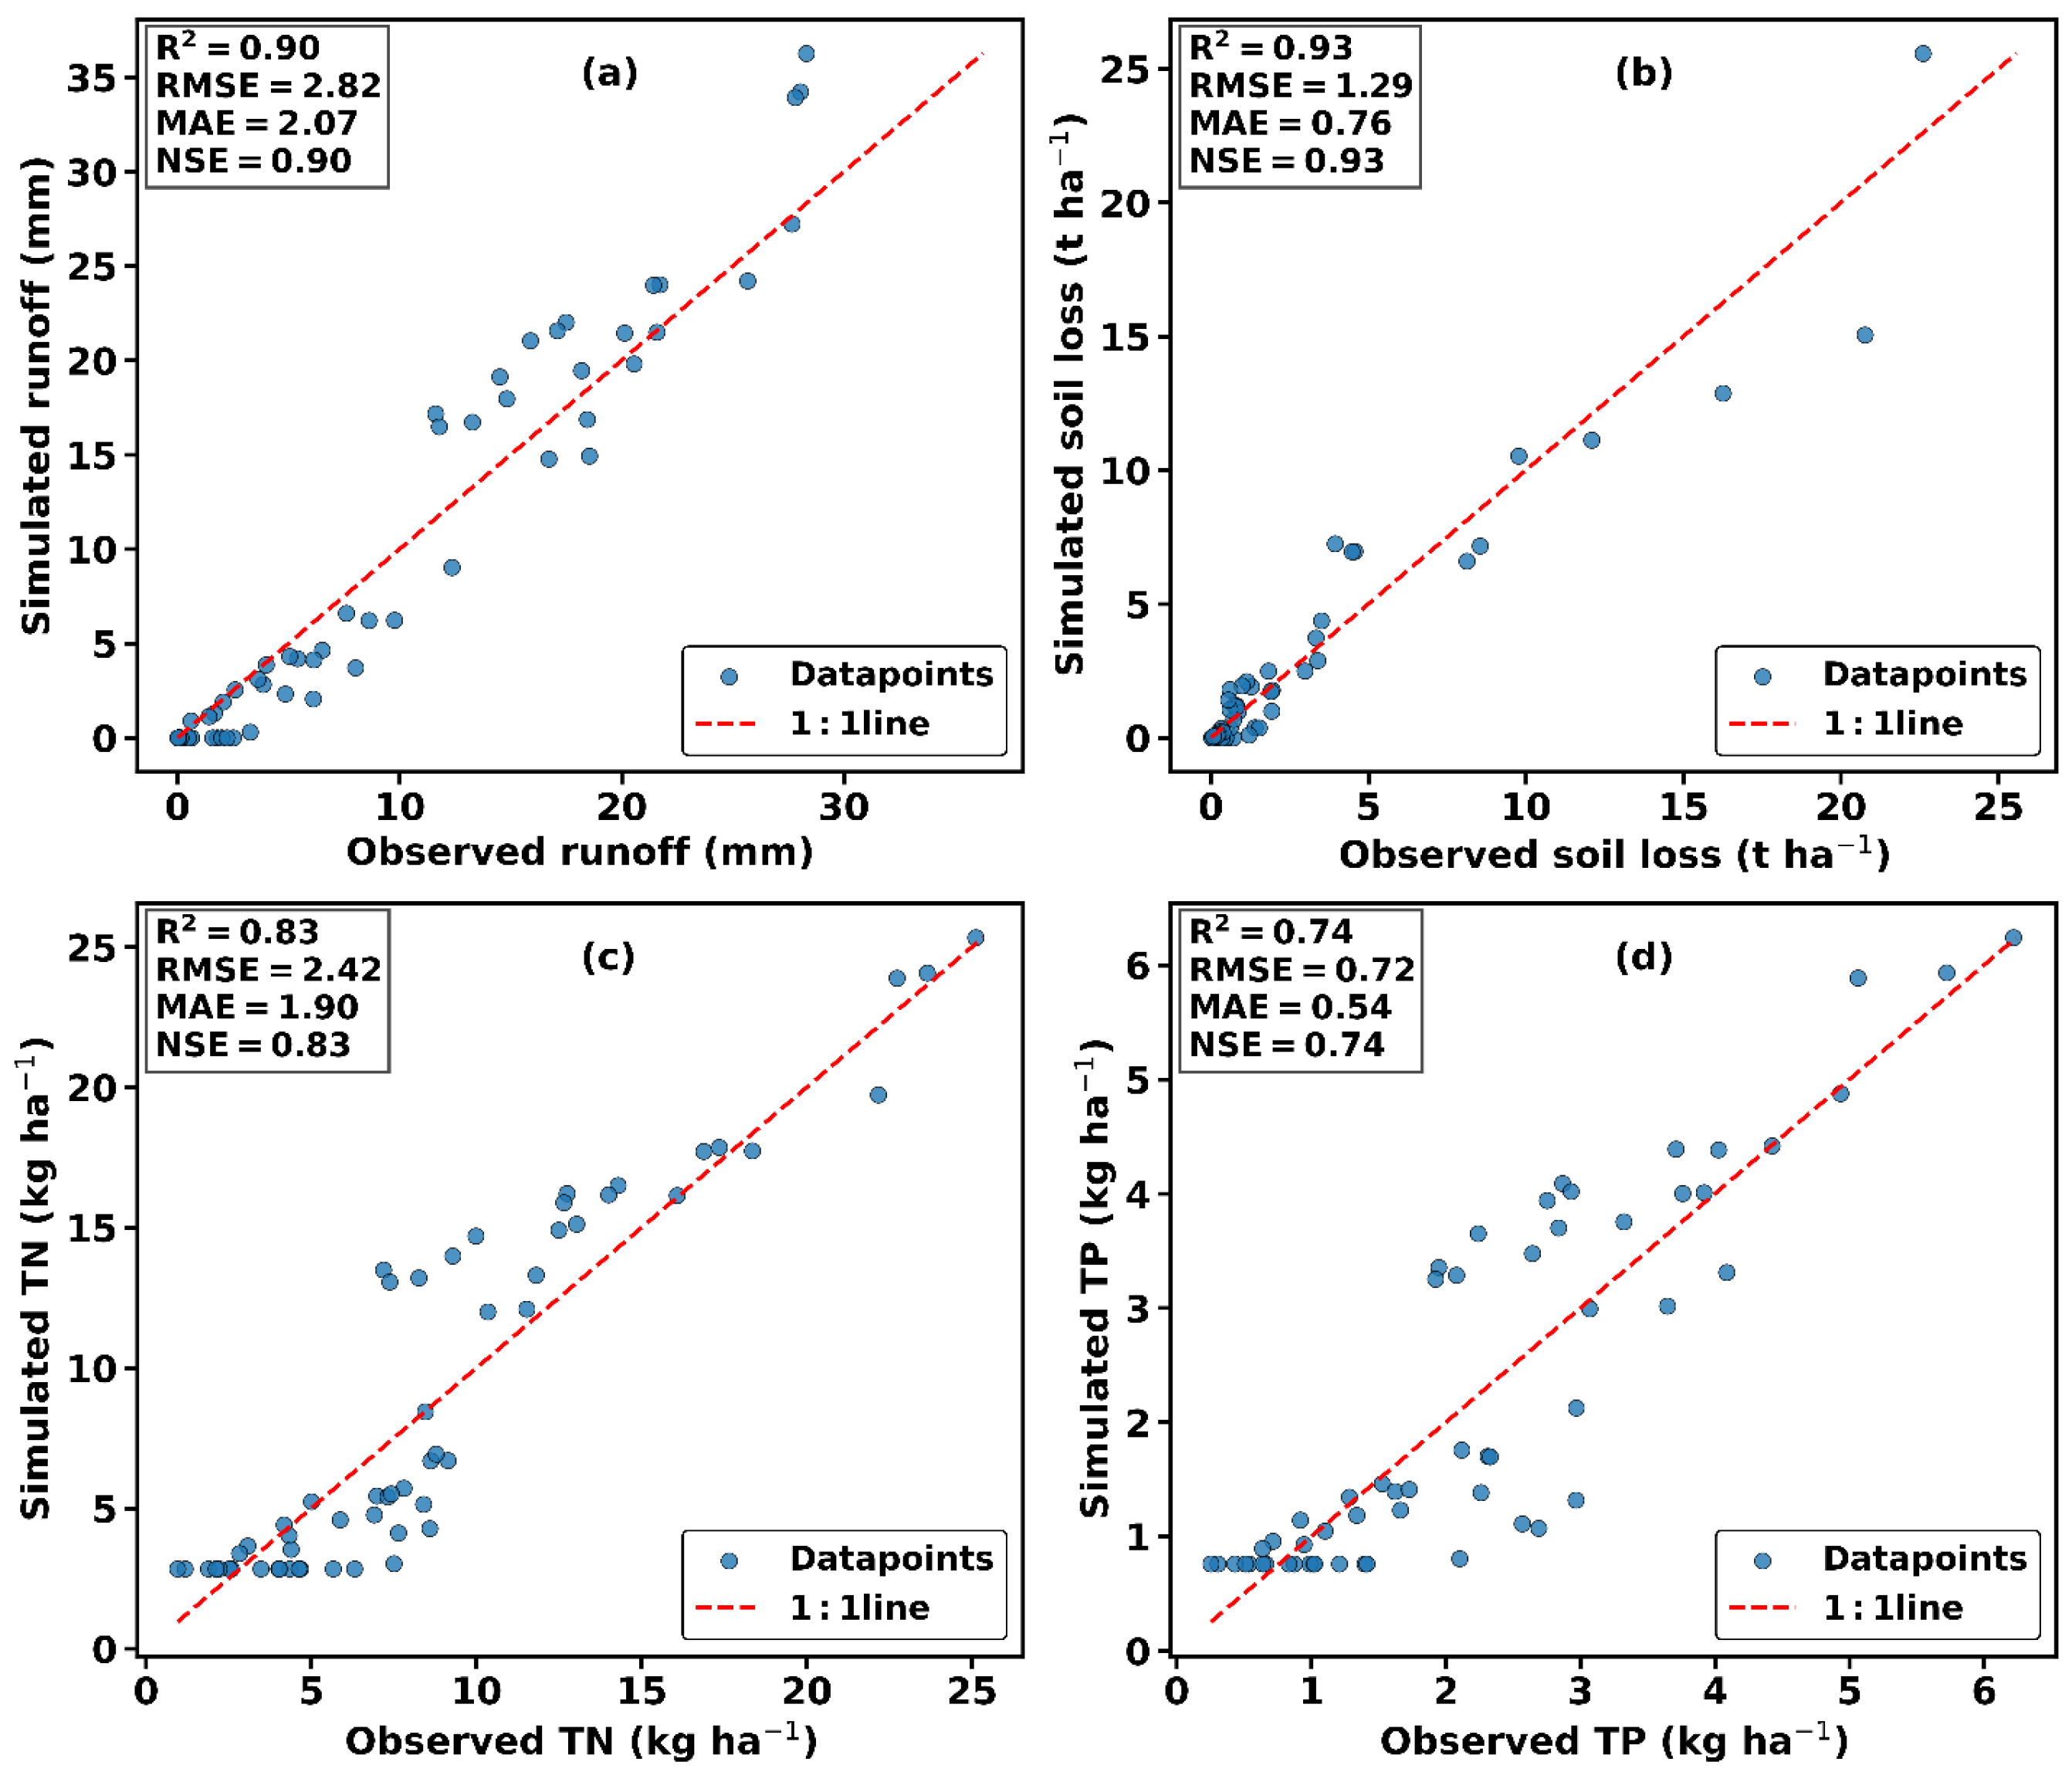
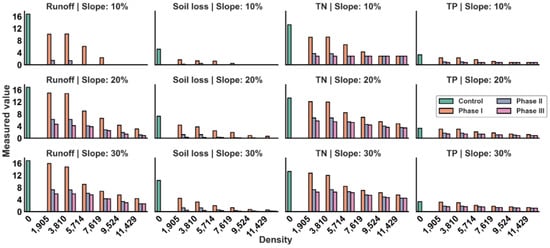
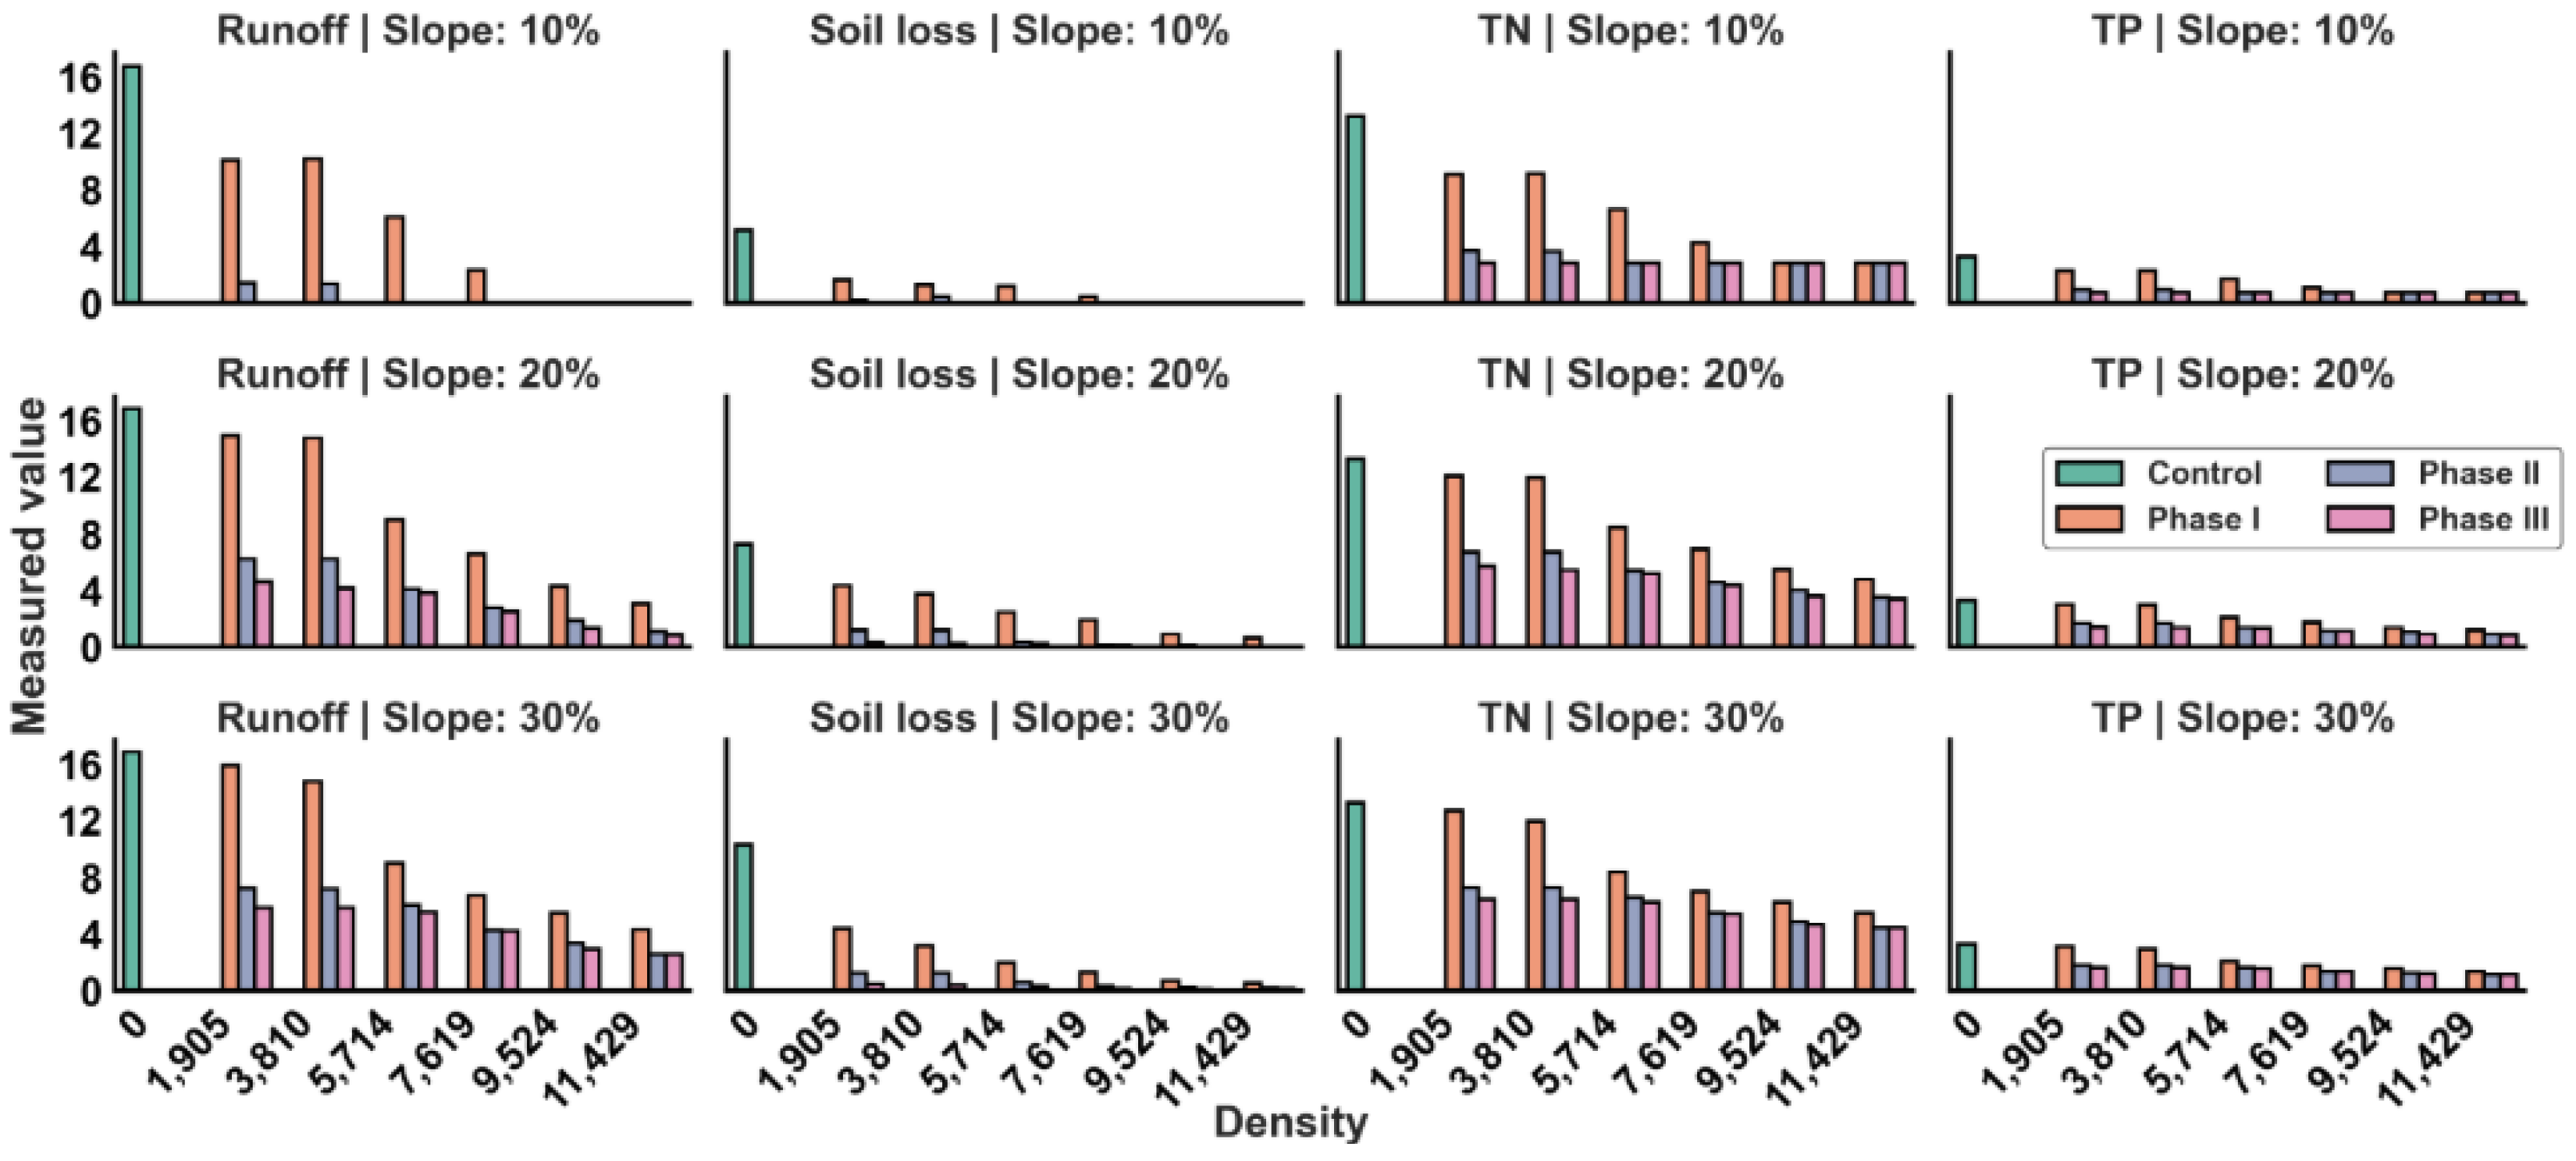

Disclaimer/Publisher’s Note: The statements, opinions and data contained in all publications are solely those of the individual author(s) and contributor(s) and not of MDPI and/or the editor(s). MDPI and/or the editor(s) disclaim responsibility for any injury to people or property resulting from any ideas, methods, instructions or products referred to in the content. |
© 2026 by the authors. Licensee MDPI, Basel, Switzerland. This article is an open access article distributed under the terms and conditions of the Creative Commons Attribution (CC BY) license.