Article

Design and Research of a Quadrangular Frustum-Shaped Soil Surface Microtopography Processing Device Based on DEM

1
College of Education, Hunan Agricultural University, Changsha 410128, China
2
College of Electrical and Mechanical Engineering, Hunan Agricultural University, Changsha 410128, China
3
Yuelushan Laboratory, Changsha 410128, China
*
Author to whom correspondence should be addressed.
Agriculture 2026, 16(9), 994; https://doi.org/10.3390/agriculture16090994
Submission received: 9 April 2026 / Revised: 25 April 2026 / Accepted: 28 April 2026 / Published: 30 April 2026

Abstract

The construction of soil surface microtopography not only effectively mitigates soil erosion, improves soil structure, and enhances soil ecological functions, but also significantly optimizes the seedbed environment for seedling emergence and crop growth. In this study, targeting the specific characteristics of red-yellow soils in Southern China, a quadrangular frustum-shaped soil surface microtopography processing device was designed and fabricated based on the 2BYG-230 rapeseed seeder. The motion trajectory and force distribution of the device were analyzed using the Discrete Element Method (DEM) software, EDEM, followed by three-factor and three-level orthogonal tests. The results indicated that the order of significance for factors affecting the microtopography formation effect was working load > working speed > microstructure height. Using the formation qualification rate as the evaluation index, the soil disturbance patterns were analyzed to determine the optimal combination of operating parameters: a working load of 260 N, a working speed of 0.34 m/s, and a microstructure height of 42 mm. Under these optimized conditions, the microtopography formation qualification rate reached 93.6%. Furthermore, the seedling emergence rate following the operation of the optimized device was 74.33%, representing a 4.96% increase compared to pre-optimization levels. The optimized processing device designed in this study markedly outperformed its predecessor, creating a soil surface microtopography more conducive to rapeseed growth while demonstrating substantial potential for water and soil conservation and ecological improvement. This research provides theoretical support for enhancing the ecological functions of Southern red-yellow soils and for the structural design of surface microtopography processing equipment.

1. Introduction

Cultivated land is one of the most precious agricultural resources and essential factors of production; the maintenance of its soil ecological functions plays a fundamental role in soil and water conservation, nutrient cycling, and sustainable agricultural development. China’s per capital cultivated land area accounts for only 42% of the global average [1,2]. Furthermore, the increasing frequency of extreme climate events in recent years has intensified soil erosion, leading to severe soil nutrient loss [3,4,5]. Southern red-yellow soil is the predominant soil type in southern China, and its physicochemical properties differ significantly from those in other agricultural regions [6,7,8]. Currently, seedbeds are primarily prepared through rotary tillage to pulverize the soil prior to sowing [9,10]. However, due to a lack of subsequent soil conditioning, when soil structure is excessively disrupted, the stability of original aggregates is compromised, leading to a marked reduction in interparticle cohesion [11,12,13]. Under the direct impact of raindrop kinetic energy, individual soil particles are detached and dislodged from their original positions via splash erosion, forming transportable suspended particles. Subsequently, under the scouring action of surface runoff, these particles are transported in large quantities, resulting in sheet erosion and even gully erosion. Research indicates that this erosion process is highly selective, preferentially removing fine particle fractions rich in organic matter, clay, and nutrients (e.g., nitrogen, phosphorus, and potassium), while leaving behind relatively infertile coarse sand fractions. This systematic degradation of topsoil fertility ensues [14,15,16,17,18].
Constructing soil surface microtopography is an effective approach to reducing soil erosion and enhancing the potential for soil ecological improvement [19,20,21]. Common geometric shapes of microtopography include quadrangular pyramids, triangular pyramids, and cone frustums; however, the performance of devices generating these different geometries differs significantly across various soil types and environments [22,23,24]. Currently, research on soil surface microtopography processing technologies and associated packing devices primarily focuses on the effects of different soil micro-topography and compaction on seedbed physical properties and crop emergence, as well as the effects of opener packer wheels and their applied packing force on the emergence and yield of different crops; meanwhile, related R&D enterprises are focusing on intelligent control of machinery and the preparation of high-quality seeding environments under special soil conditions (e.g., rice stubble fields, crusted or compacted soils) [25,26,27,28]. The International Soil and Water Renewables company (USA) developed a convex-tooth packer that processes a series of regular micro-pit arrays on the soil through mechanical rolling, which effectively intercepts surface runoff and provides excellent moisture conservation [29]. Kverneland developed an adjustable-force packing wheel that allows for the flexible adjustment of the relative position between the wheel and the disc furrower, as well as the downward pre-load, thereby optimizing the formation depth of the microtopography [30]. The aforementioned devices are predominantly commercially developed, most of them use convex-tooth or elastic rollers for compaction to improve seed-soil contact in arid regions, but they lack a theoretical framework for “microtopography construction” aimed at runoff control in cohesive soils.
In recent years, research on soil microtopography devices has developed rapidly, with focal points gradually shifting toward bionic structural design, adhesion reduction and desorption technologies for high-moisture cohesive soils, contour-following control for complex terrains, and fundamental kinematic and dynamic simulation analyses [31,32,33,34,35]. Zhang et al. developed and thoroughly analyzed the operational trajectories of bionic convex-tooth packers based on kinematics and dynamics; their results indicated that the device causes soil flow and deformation through extrusion to form regular micro-pit arrays, simultaneously reducing surface water flow velocity and achieving seed zone compaction [36,37,38,39]. To address the challenge of soil adhesion in the high-moisture ridge-culture regions of Northeast China, Bi et al. developed a snail-inspired bionic packing wheel, which not only adequately compacts moist soil but also successfully processes specific microstructures [40]. Addressing the issue of missed compaction by traditional rigid wheels on uneven surfaces, Jia et al. designed a contour-following elastic packing roller that adapts spontaneously to surface irregularities, ensuring uniform microtopography processing depth [41,42]. However, the aforementioned studies primarily target soil surface microtopography processing and bionic/profiling devices for northern regions; research specifically tailored to the characteristics of Southern red-yellow soils remains relatively sparse.
To address these issues, this study designed and fabricated a quadrangular frustum-shaped soil surface microtopography processing device based on the characteristics of Southern red-yellow soil and the 2BYG-230 Rapeseed Rotary Tillage Fertilization and Sowing Machine (Sangruite Agricultural Machinery Equipment Co., Ltd., Changsha, Hunan Province, China). The variations in force and motion trajectories during the operation of the device were theoretically calculated and further analyzed using the Discrete Element Method. A three-factor and three-level orthogonal experiment was conducted to explore the influence of working load, working speed, and microstructure height on the microtopography formation effect. On this basis, field experiments were performed to validate the optimized device, aiming to provide a soil surface microtopography processing solution for Southern red-yellow soil regions that simultaneously preserves soil and water while optimizing the seedbed, thereby enhancing soil ecosystem stability and the quality of rapeseed seedling emergence and growth.

2. Material and Method

2.1. Mechanics and Kinematic Trajectory Analysis of the Soil Surface Microtopography Processing Device

2.1.1. Structural Principles of the Soil Surface Microtopography Processing Device

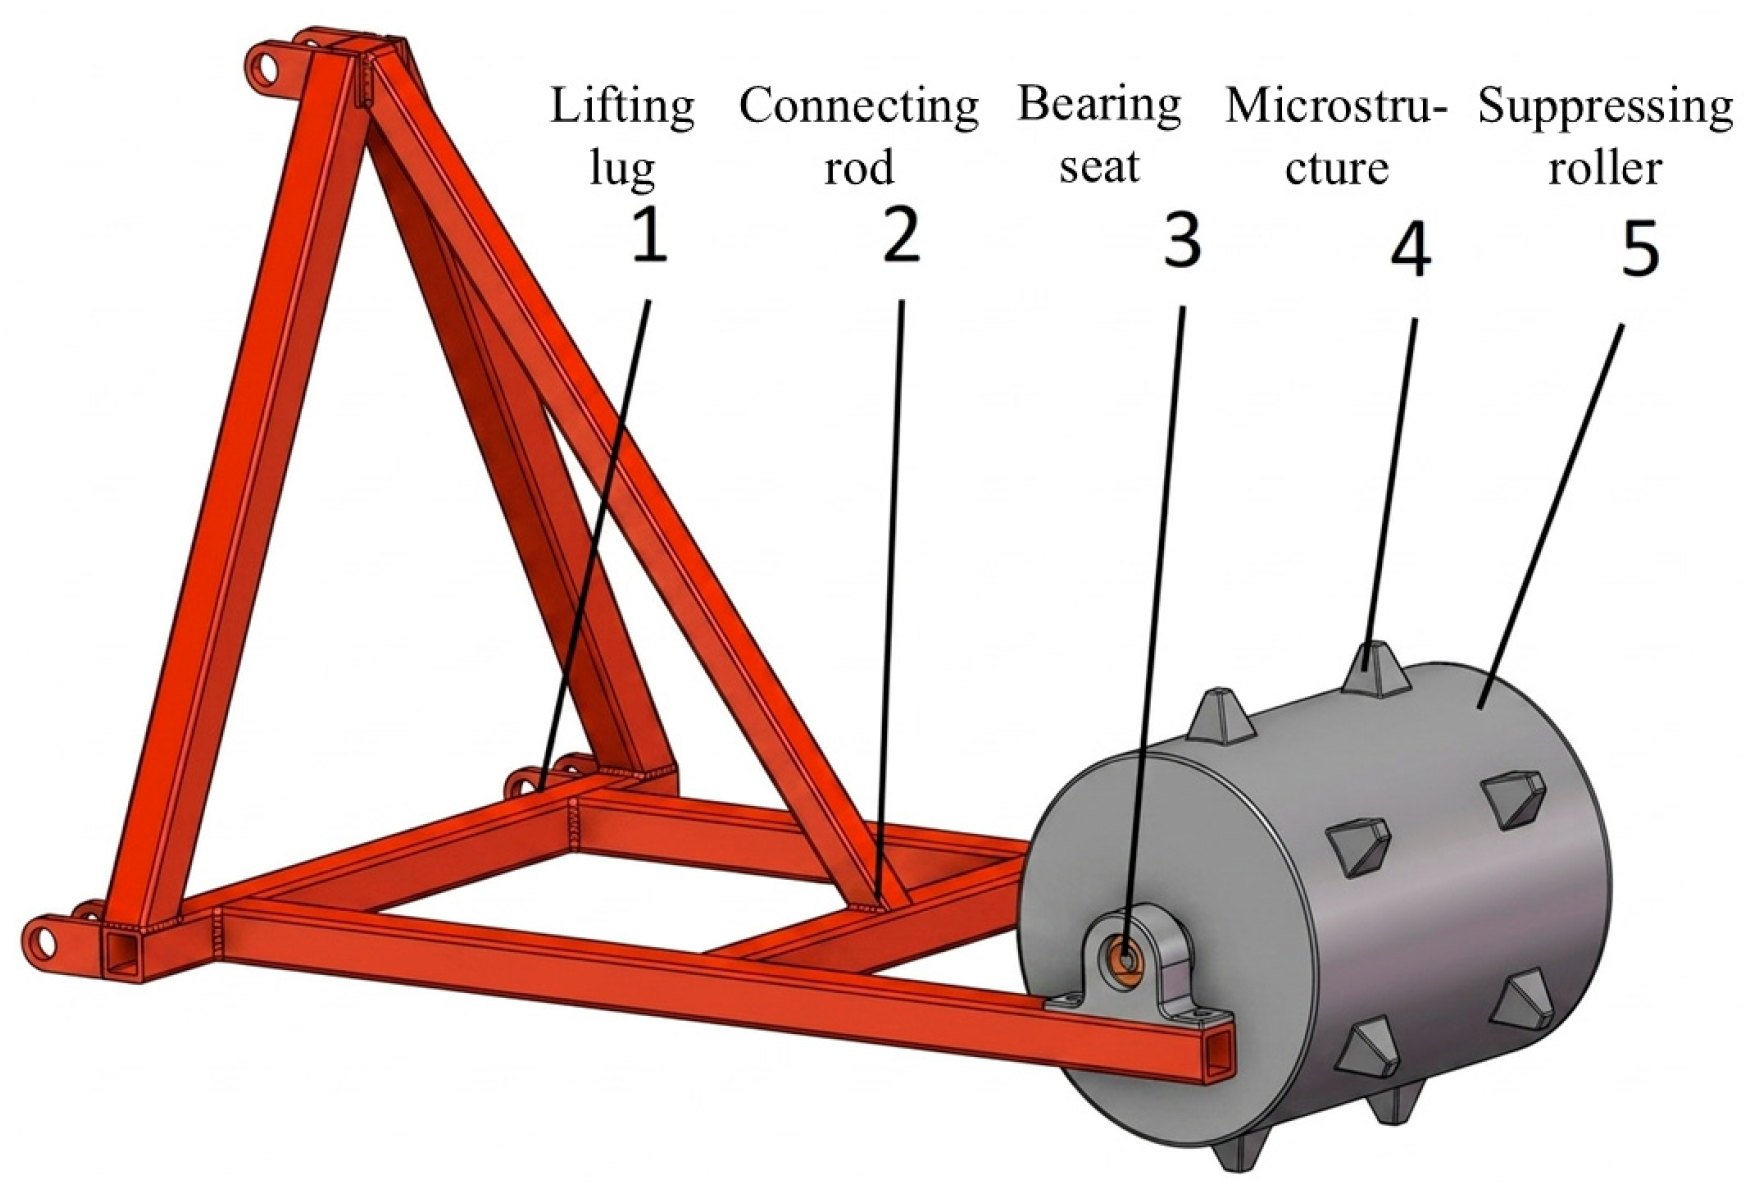
The soil surface microtopography processing device is illustrated in Figure 1. The device primarily consists of a packing unit and a frame. The packing unit is further composed of a roller drum and microstructures uniformly distributed on its surface. The frame, which includes lifting lugs, connecting rods, and bearing blocks, serves to securely mount the packing unit. During operation, the device is mechanically coupled to a tractor via a three-point hitch. Driven by the tractor’s traction, the device performs a pure rolling motion on the soil surface. The microstructures, evenly arranged on the roller drum, bear the static weight of the equipment and periodically penetrate and exit the soil, consequently forming a series of regular microtopographic features on the soil surface.

2.1.2. Mechanics Analysis of the Soil Surface Microtopography Processing Device

Due to the presence of microstructures, the force distribution across the surface of the packing unit is non-uniform. Prior to conducting the mechanics analysis of the soil surface microtopography processing device, the following assumptions are made: (1) the height of the microstructures is relatively small compared to the diameter of the roller drum, and given their quadrangular frustum profile and the minimal soil sinkage, the dimensions of the microstructures can be reasonably neglected; (2) when the horizontal velocity of the packing unit remains constant, the device moves synchronously with the leading traction machine, performing solely rolling motion without relative sliding, thus allowing it to be modeled as a rigid wheel [43].
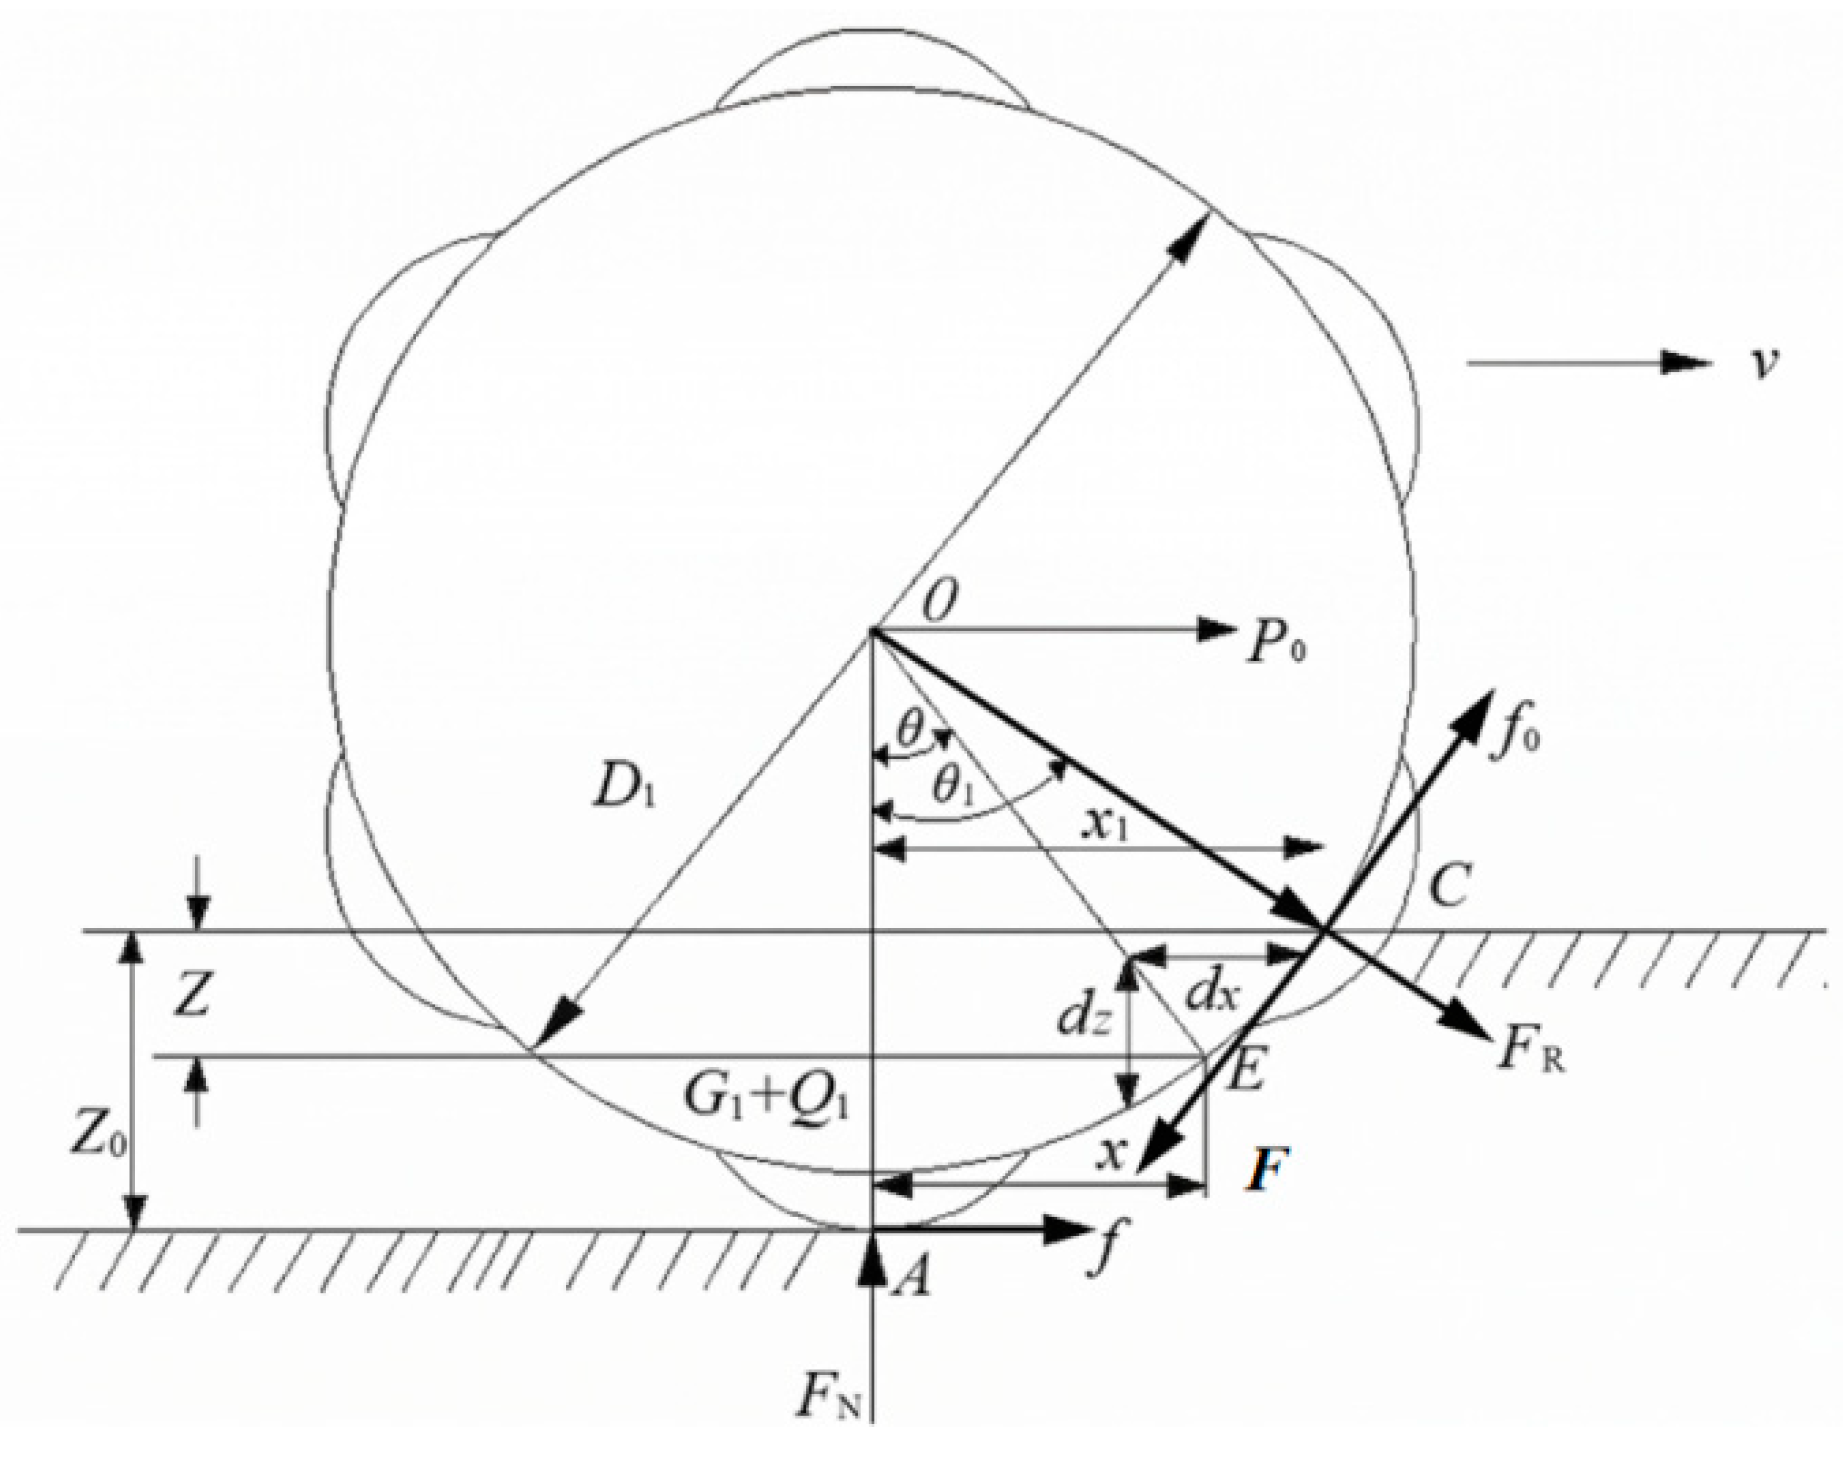
During operation, the device is subjected to the traction force P0, the soil friction force f, and the traction resistance F. The normal support force FN and the working load Q mutually counteract each other. When the horizontal velocity of the packing unit is maintained constant, the traction resistance F constitutes the predominant component of the device’s overall working resistance.
As illustrated in Figure 2, Z0 denotes the maximum sinkage of the packing unit, while Z represents the sinkage corresponding to point E on the roller periphery. FR is the compressive reaction force exerted by the soil at point C on the roller edge. The variables x and x1 are the x-coordinates of points E and C, respectively. The terms dx and dz represent the infinitesimal displacements of the micro-segments (with arc length s) at points E and D along the x and z axes, specifically ds = cosθ1dx and ds = sinθdz. The arc CEA defines the soil–contact interface, where θ1 is the central angle corresponding to the maximum sinkage Z0, and θ is the central angle corresponding to sinkage Z. The vertical load Q comprises the gravitational force G1 and the external load Q1, while P0 represents the traction force acting on the packing unit. FN is the normal support force on the bottom surface of the packing unit, with f and f0 denoting the friction forces at points A and C, respectively.
Due to the complex interaction between the packing unit and the surface soil, the force equilibrium equations for the packing unit can be formally derived based on the mechanics analysis as follows [35,41]:
F = 0 θ 1 F R sin θ
Q = 0 θ 1 F R cos θ
where Q is the vertical load of the packing unit (comprising gravity and external load), in N; FR is the compressive reaction force corresponding to the infinitesimal segment at point E on the CEA soil-contact interface, expressed as
F R = B p d θ
where B is the width of the packing unit, in mm; p is the soil compressive strength, in kPa.
sin θ = d z r d θ
The relationship between the soil compressive strength p and the sinkage Z can be accurately determined using the Bekker equation:
p = k Z n
where k is the soil deformation modulus; n is the soil deformation index.
Based on reference [44], the soil deformation modulus k is directly proportional to the velocity v. Substituting Equation (5) into Equation (1) and simplifying yields
F = k B 0 Z 0 Z d z = k B Z 0 n + 1 n + 1
As shown in Figure 1 and Figure 2, the relationship between x and the sinkage is
x 2 = r 2 r ( Z 0 Z ) 2
The load of the device is equal to the total soil compressive reaction force. From Equation (2), it follows that
Q = k B 0 x Z n d z
The sinkage difference Z0Z is relatively small compared to the diameter of the rigid packing roller 2r; therefore, (Z0Z)2 can be reasonably neglected to obtain an approximation [45,46]:
x 2 = 2 r ( Z 0 Z )
Differentiating the transformed Equation (9) yields
d x = r d z x = r d z 2 ( Z 0 Z )
Substituting Equation (10) into Equation (8) yields
Q = k B 0 Z 0 Z n r 2 ( Z 0 Z ) d z
By integrating and subsequently expanding Equation (11), we obtain
Q = 2 r k B ( 3 n 3 Z 2 n + 1 2 )
Simplifying and rearranging Equation (12) ultimately yields the maximum sinkage Z0:
Z 0 = 3 2 Q 2 ( 3 n ) k B r 2 2 n + 1
Substituting Equation (13) into Equation (6) yields the traction resistance F:
F = k B n + 1 3 Q ( 3 n ) k B 2 2 n + 2 2 n + 1
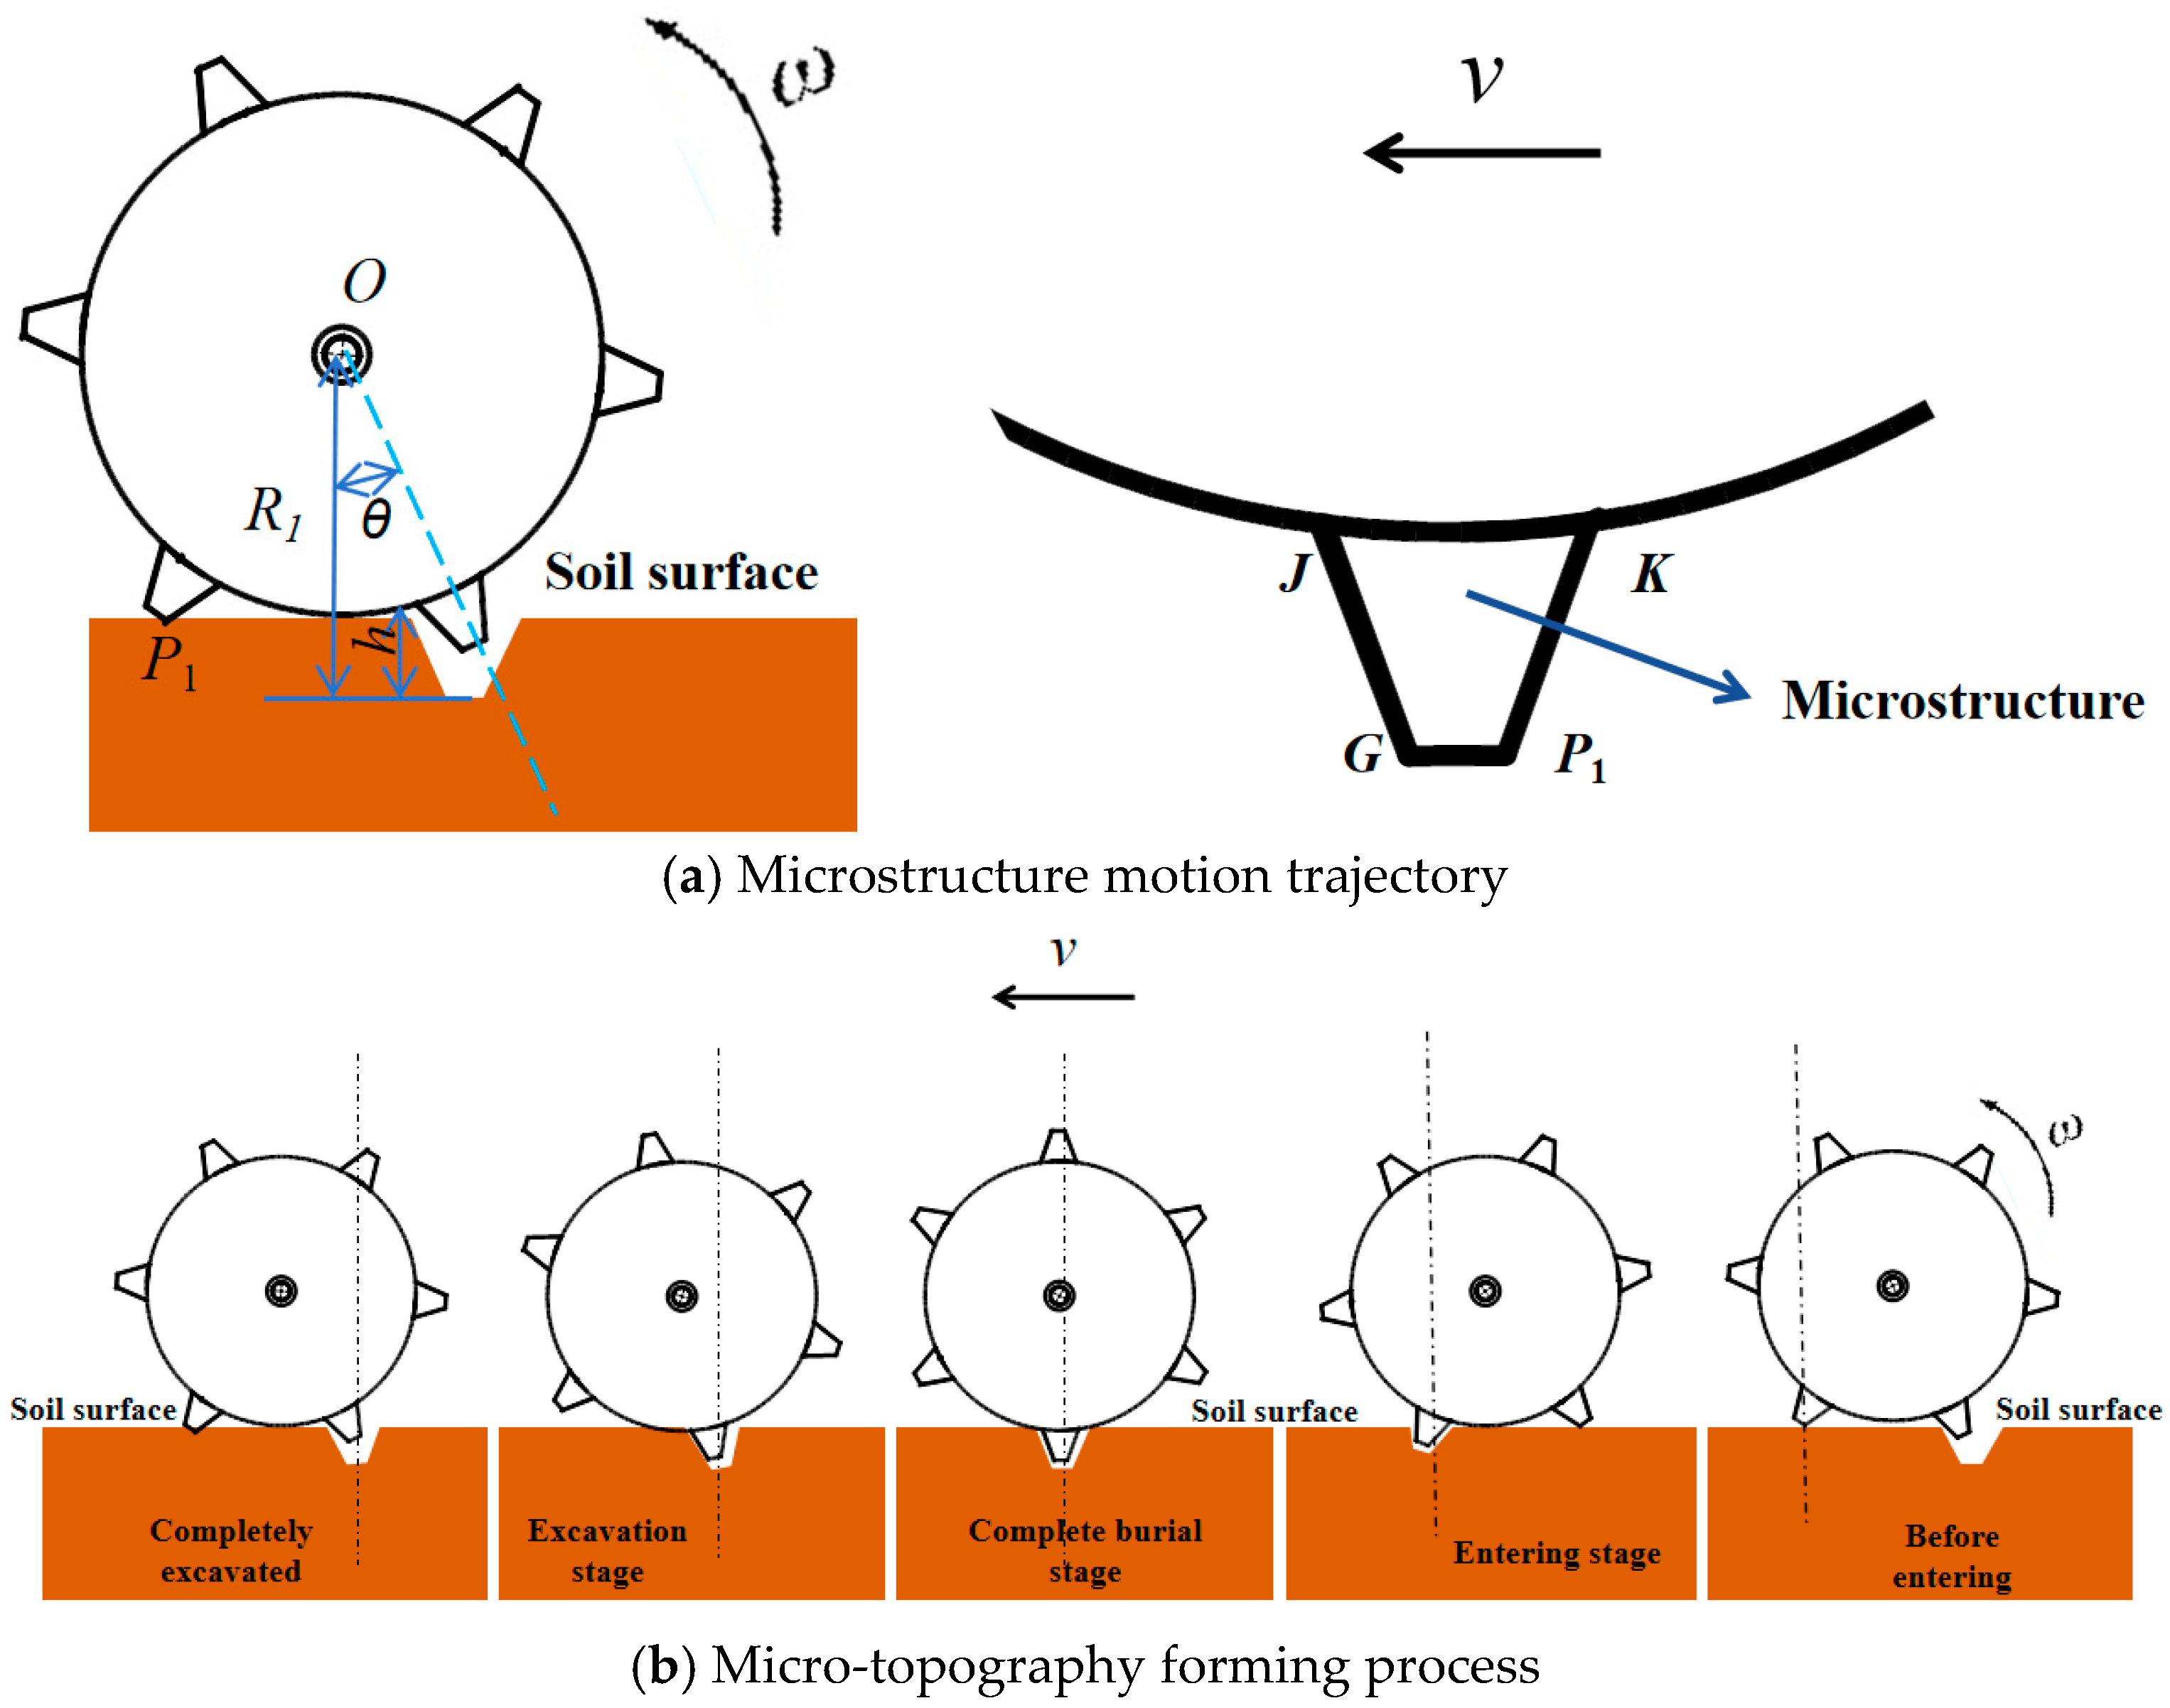
It can be inferred from Equation (14) that the traction resistance F of the packing unit is primarily associated with the working load and working speed (since k is directly proportional to v), both of which significantly influence the operational performance. During the movement, the interaction effects of the microstructures on the soil and the resulting variations in kinematic trends are highly complex. As illustrated in Figure 3, the soil surface microtopography processing device is driven forward by the power mechanism, while the microstructures rotate uniformly around the axis along the horizontal direction. This movement constitutes a composite motion, combining horizontal translation and circular rotation. The microstructures subject the soil to shearing, compression, and extrusion during the penetration, full penetration, and exit stages, ultimately forming regular microtopographic features on the soil surface.
During the kinematic process, when the microstructure edge P1 initiates contact with the soil, the GP1, KP1 surfaces first exert extrusion forces on the soil as the device rotates, as shown in Figure 3. Simultaneously, the soil exerts an upward reaction force on the microstructure, generating relative motion in the forward direction; this represents the penetration stage. As the center of gravity O shifts forward and the device continues its progression, the contact interface between the microstructure and the soil becomes relatively stable, with consistent relative velocities. At this full penetration stage, microtopography is formed beneath the roller drum, and the underlying soil is effectively compacted. When the roller drum drives the JG surface to shear and extrude the soil leftward, the KP1 surface loses contact with the soil until the subsequent microstructure impacts the soil, completing the formation of a single micro-unit. At this point, the microstructure has completely emerged from the soil.

2.2. Design of the Quadrangular Frustum-Shaped Soil Surface Microtopography Processing Device

2.2.1. Design of the Packing Roller Drum Diameter

As a critical component, the diameter of the packing roller drum significantly impacts the operational performance. A smaller diameter results in a higher slip rate, making the device highly susceptible to soil dragging and mounding phenomena [47,48]. Conversely, an excessively large diameter reduces the overall stability of the equipment while simultaneously increasing working resistance and manufacturing costs. According to reference [49], to ensure normal transmission, the packing roller drum must satisfy the following condition:
D 1 2 M Q f
where D1 is the diameter of the packing roller drum (mm); M is the transmission torque consumed by the packing roller drum (N·mm); Q is the total load acting on the packing roller drum (N); and f′ is the friction coefficient between the soil and the packing roller drum.
Based on Equation (15) and the relevant requirements in agricultural machinery handbooks, and considering actual operational conditions, the diameter of the packing roller drum is generally selected within the range of 300 to 600 mm [50]. To minimize rolling resistance during operation while fulfilling transmission requirements and agronomic standards—and by referencing the specifications of the 2BYG-230 rapeseed seeder [51]—the outer diameter D1 of the packing roller drum was determined to be 400 mm, with a wall thickness of 6 mm.

2.2.2. Design of the Packing Roller Drum Length

To prevent mutual interference between the packing units during operation and to ensure that the surface soil is adequately compacted, the raised bed of the 2BYG-230 rapeseed seeder was utilized as a design reference. With a designated sowing row spacing of 300 mm, the length of the packing roller drum should satisfy the following requirement:
B = 3 l 1 + 2 w
where B is the length of the packing roller drum (mm); l1 is the distance from the seed furrow to the microtopography (mm); and w is the length of the microstructure (mm).
The axial spacing of the microstructures was determined to be 100 mm. Given a microstructure length w of 40 mm, the length of the packing roller drum B was consequently calculated to be 380 mm.

2.2.3. Arrangement and Dimensions of Microstructures

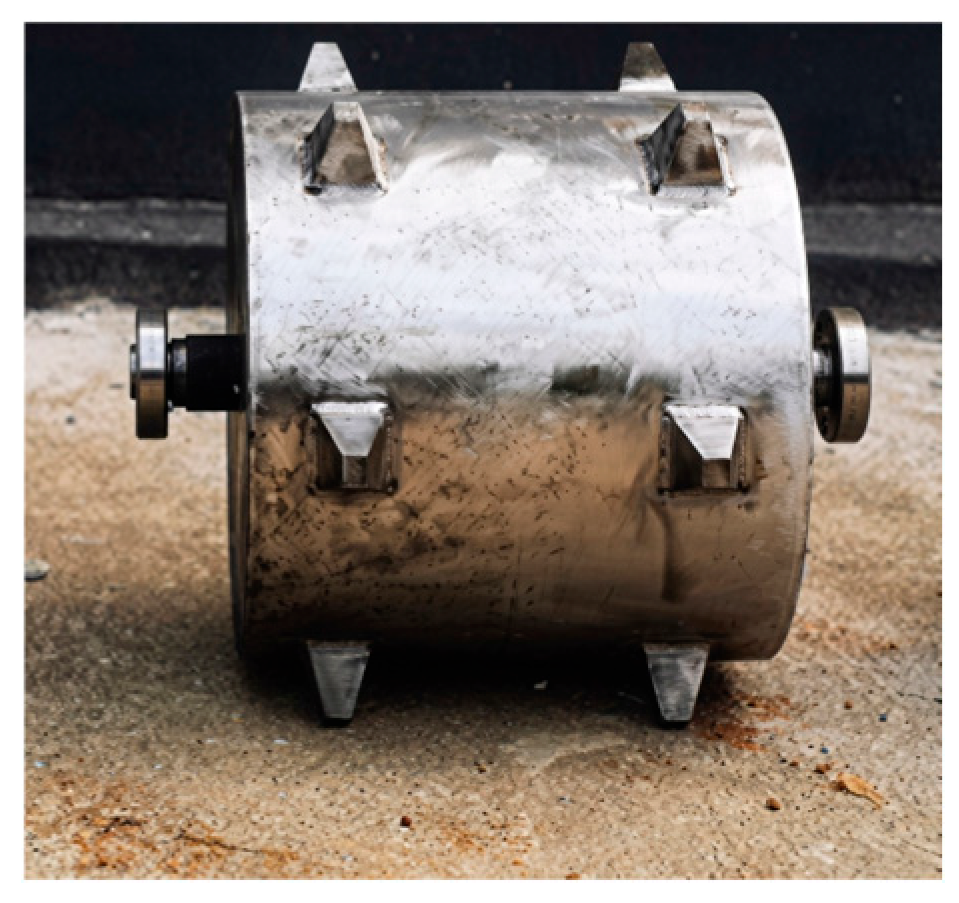
The arrangement of microstructures on the packing roller drum directly influences the packing performance. Therefore, the radial distribution of microstructures on the drum should adhere to consistent installation angles and uniform axial distribution, with the axes equidistantly spaced. To ensure microtopography processing efficiency and prevent mutual interference between adjacent micro-units, the number of radial microstructures along the generatrix was determined to be 2, resulting in a total of 12 microstructures installed on a single packing roller drum. Based on reference [16] and the agronomic requirements for rapeseed cultivation, the fundamental dimensions of the microstructures were established as follows: a top base of 15 mm × 15 mm, a bottom base of 40 mm × 40 mm, and a reference height of 40 mm. The fabricated quadrangular frustum-shaped soil surface microtopography processing device is illustrated in Figure 4.

2.3. Discrete Element Method (DEM) Simulation of the Working Process

2.3.1. Simulation Modeling

To accurately determine the structural and operational parameters of the soil surface microtopography processing device, Discrete Element Method (DEM) simulations were conducted for parameter optimization. The simulation parameters, as listed in Table 1, were previously calibrated by the research team using red-yellow soil samples collected from the experimental site [52]. To account for the cohesiveness of the soil, the Hertz–Mindlin with JKR (Johnson–Kendall–Roberts) model was specifically selected as the contact model. Soil particles were assigned radii ranging from 2.0 to 2.5 mm, and the soil bin dimensions (Length × Width × Height) were set to 1000 mm × 500 mm × 200 mm.
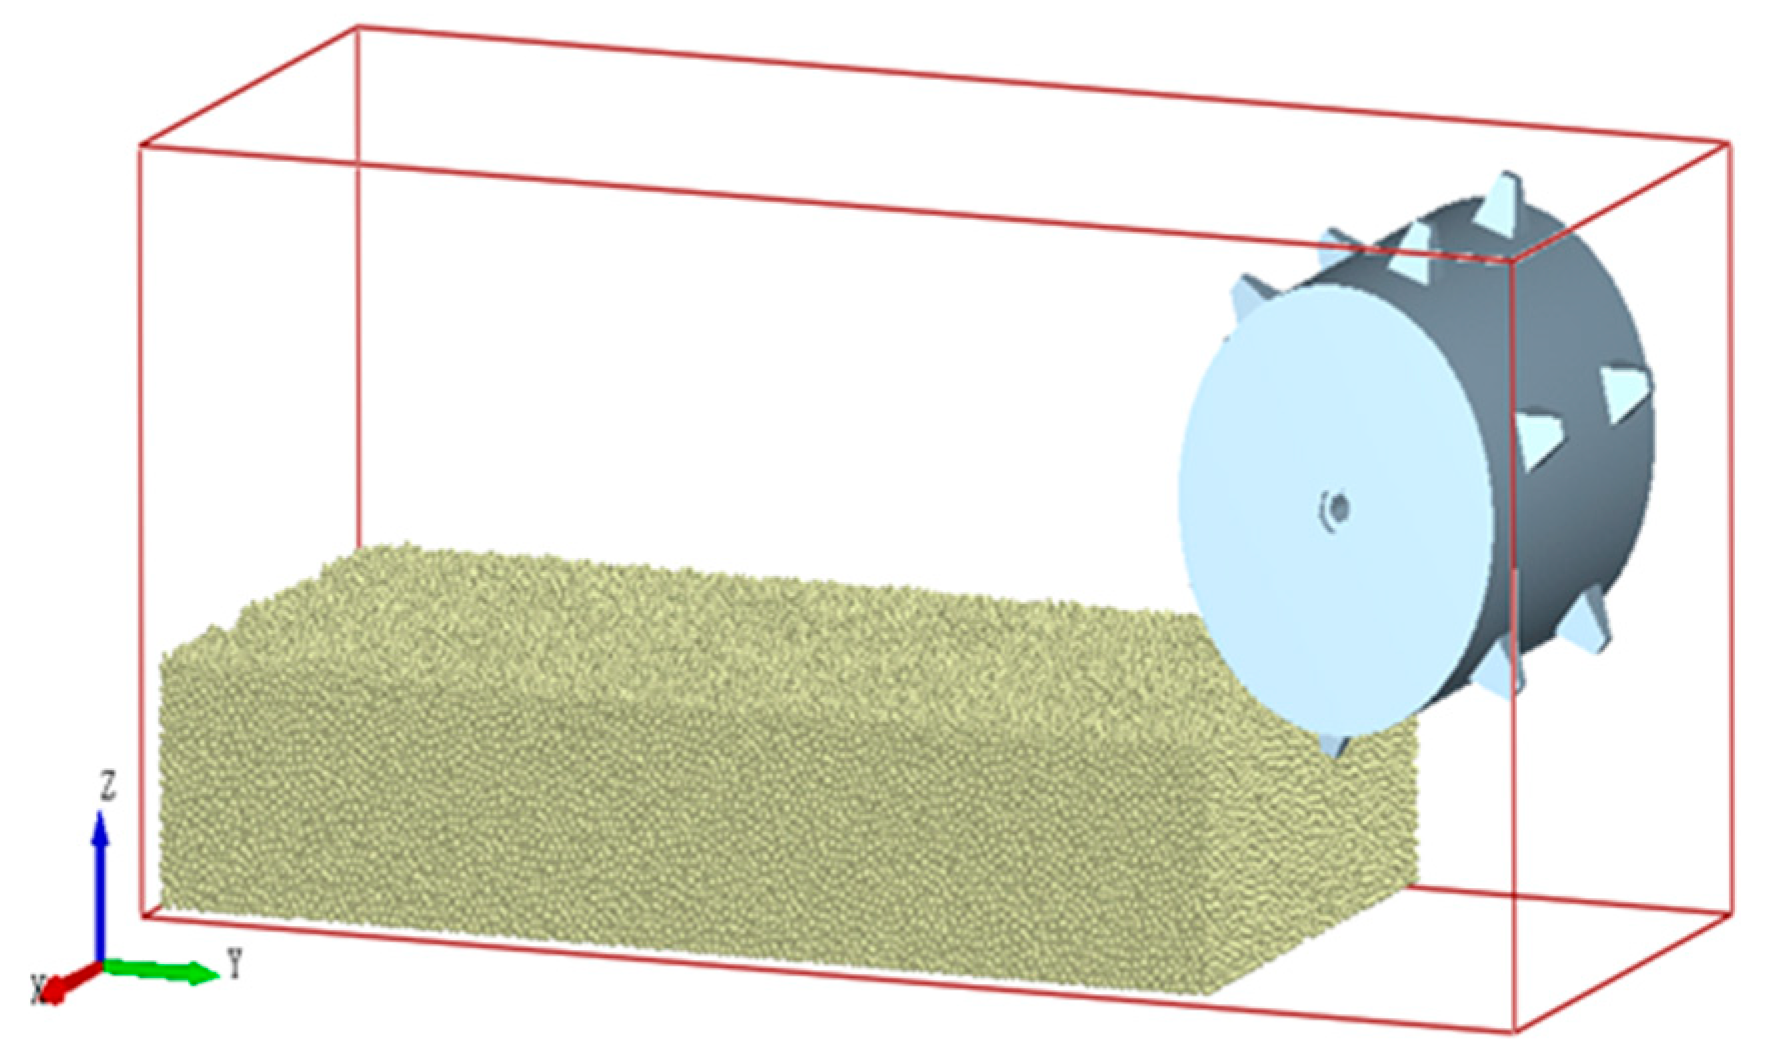
The designed device model was subsequently imported into the EDEM software(v 2021.2), where rolling and sliding contact parameters were precisely defined. The resulting soil bin–device simulation model is depicted in Figure 5. The time step was fixed at 20% of the Rayleigh time step value. To fully ensure that the movement of soil particles reached a stable equilibrium during analysis, the total simulation duration was set to 5 s: the device entered the soil bin during the 0–0.5 s interval, followed by 4 s of effective operation, and finally exited the working area between 4.5 and 5 s, at which point the device completely ceased forward motion to allow for particle stabilization.

2.3.2. Experimental Setup

Based on the ridge planting mode in Southern China (with a ridge height of 300 mm) and standard tractor forward speeds, the operating speed of the device was set within the range of 0.2 to 0.4 m/s. To investigate the influence patterns of working load, working speed, and microstructure height on the microtopography formation and to identify the optimal parameter combination, a three-factor and three-level orthogonal experiment was conducted using the Box–Behnken Design (BBD) module in Design-Expert v10 software. A total of 17 experimental runs were designed; the factor levels and the specific experimental design are detailed in Table 2 and Table 3, respectively.

2.3.3. Evaluation Indices for Surface Microtopography Formation Quality

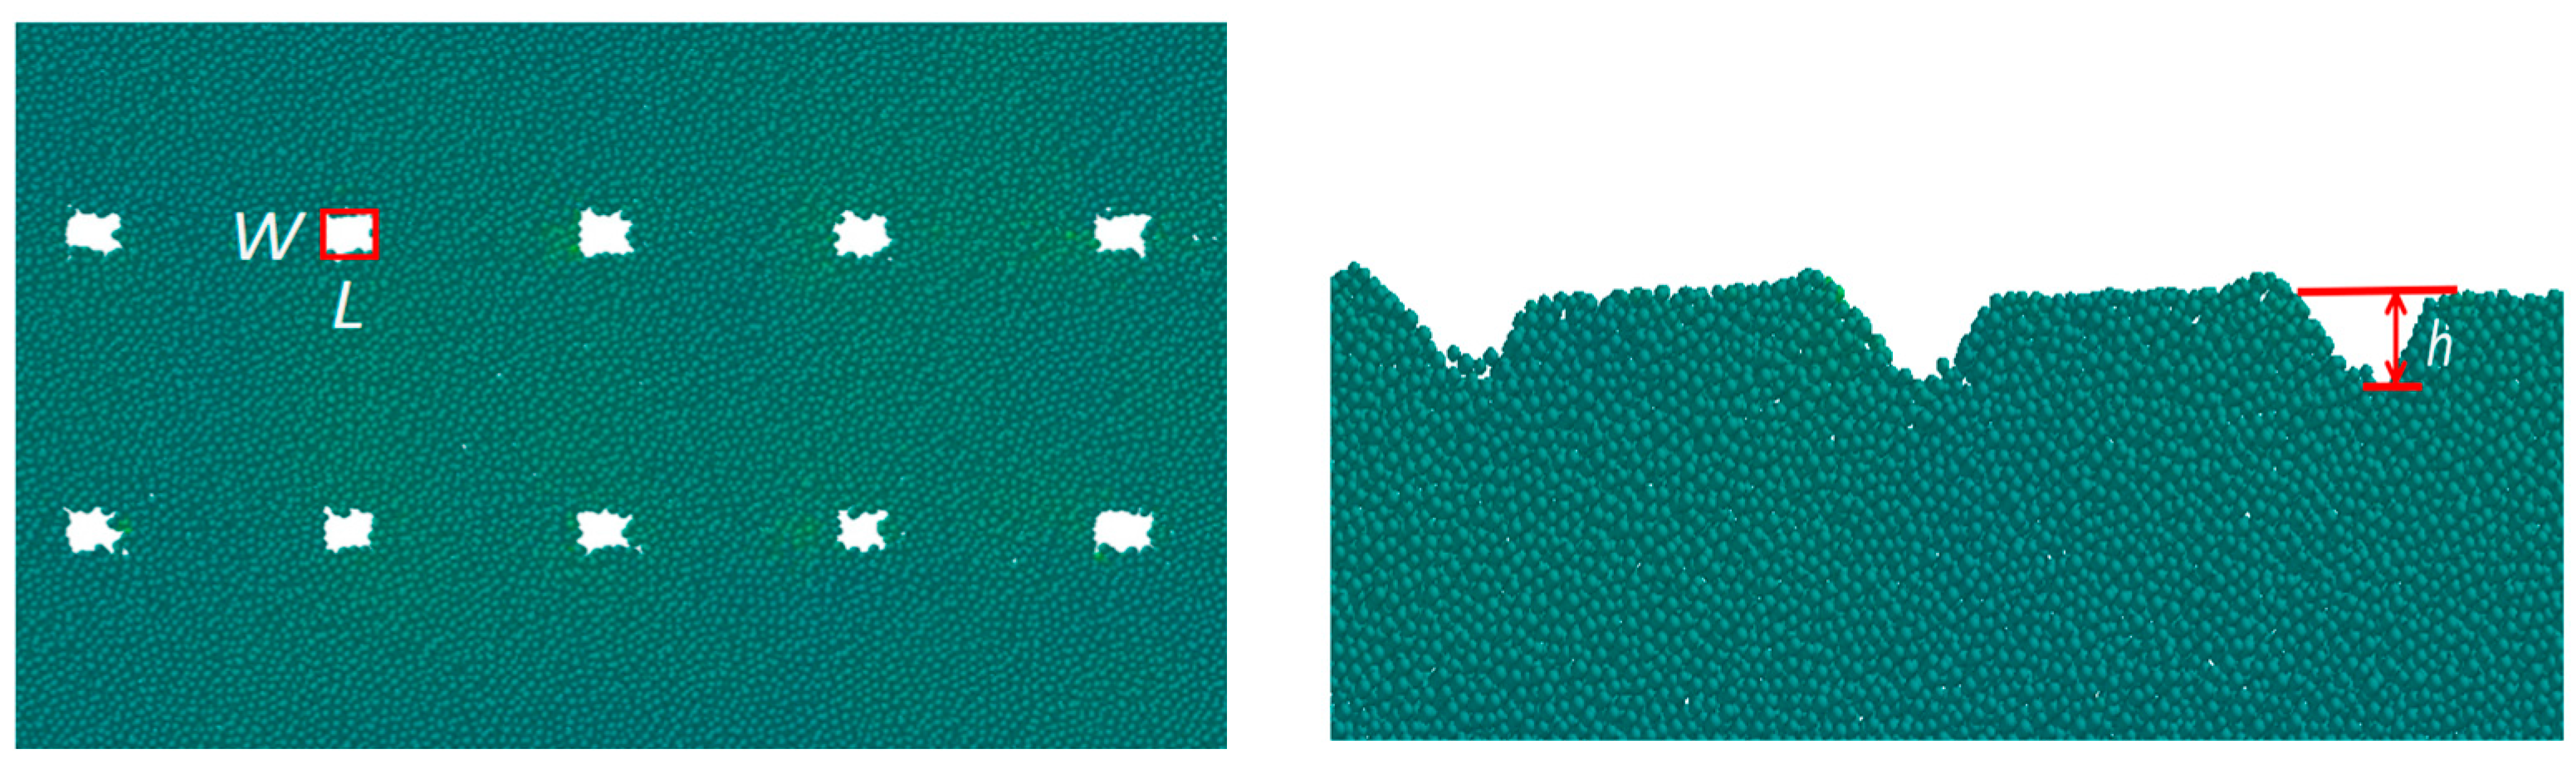
The formation of the soil surface microtopography in the DEM simulation is illustrated in Figure 6. To quantitatively evaluate the effectiveness of microtopography formation within the discrete element simulation, the qualification rates for microtopography length, width, and height, along with the overall microtopography formation qualification rate, were defined as evaluation indices. The specific definitions are as follows:
δ = L L 0
where δ is the microtopography length qualification rate (%); L represents the actual length formed along the longitudinal direction of travel (mm); and L0 is the original design length of the microstructure (mm).
γ = w w 0
where γ signifies the microtopography width qualification rate (%); w is the formed width measured transversely perpendicular to the direction of travel (mm); and w0 is the original width of the microstructure (mm).
η = h h 0
where η denotes the microtopography height formation qualification rate (%); h is the actual height formed on the bed surface within the soil bin (mm); and h0 is the original height of the microstructure (mm).
f 1 = ( 0.3 δ + 0.3 γ + 0.4 η ) × 100 %
where f1 is the overall microtopography formation qualification rate (%).

2.4. Field Trials and Analysis

2.4.1. Experimental Conditions

To validate the reliability of the Discrete Element Method (DEM) simulation results, field validation trials were conducted. The experimental site was located at the research base of Hunan Agricultural University (113.0° E, 28.2° N) in 2024, featuring Southern red-yellow soil. The experimental area measured 20 m in length and 3 m in width. Two plots were specifically prepared through rotary tillage and ridging: one served as the experimental zone for the pre-optimized soil surface microtopography processing device, while the other was designated for the optimized version. Each plot had an effective length of 10 m and a width of 1 m. Within each 10-m experimental group, we measured the dimensions of 50 individual microstructures. With three full replicates performed for each trial, this resulted in a total of 150 data points per device type. The rapeseed variety used for the study was Xiangzayou 787.
Before the trials, the fundamental soil parameters of the experimental plots were precisely measured, including soil moisture content (determined using a DHS-10 Rapid Moisture Analyzer (Shanghai Shangyi Instrument Equipment Co., Ltd., Shanghai, China)), soil bulk density (measured via the core sampler method), and soil penetration resistance (measured with a TJSD-750 soil hardness tester (Zhejiang Top Cloud Agriculture Technology Co., Ltd., Hangzhou, China). Sampling procedures strictly followed the GB/T 5262–2008 [53] specifications, employing a five-point sampling grid with 2 m2 quadrats. Sampling depths were set at 0–100 mm and 100–200 mm. The collected soil samples were immediately placed in sealed bags and labeled with the sampling depth and identification number to facilitate subsequent data processing.

2.4.2. Experimental Indices and Scheme

The primary evaluation indices for the field trials included the field microtopography formation qualification rate and the average rapeseed seedling emergence rate.
(1)
Field Microtopography Formation Qualification Rate
For each trial, the corresponding values of 50 microstructures were measured within a single 10-m distance. The average value of these measurements was subsequently used as the result for one trial, and a total of three replicates were consistently performed.
(2)
Average Rapeseed Seedling Emergence Rate
The seedling emergence rate is a critical indicator for assessing the quantity of emerging seeds. The measurement period extended from the initiation of the emergence stage until its conclusion, when the number of emerged seedlings remained stable. The emergence rate was calculated as follows:
λ = x 1 x 2 × 100 %
where λ represents the average seedling emergence rate (%); x1 is the total number of emerged seedlings in the microtopography-processed area; and x2 is the total number of seeds sown in the same area.
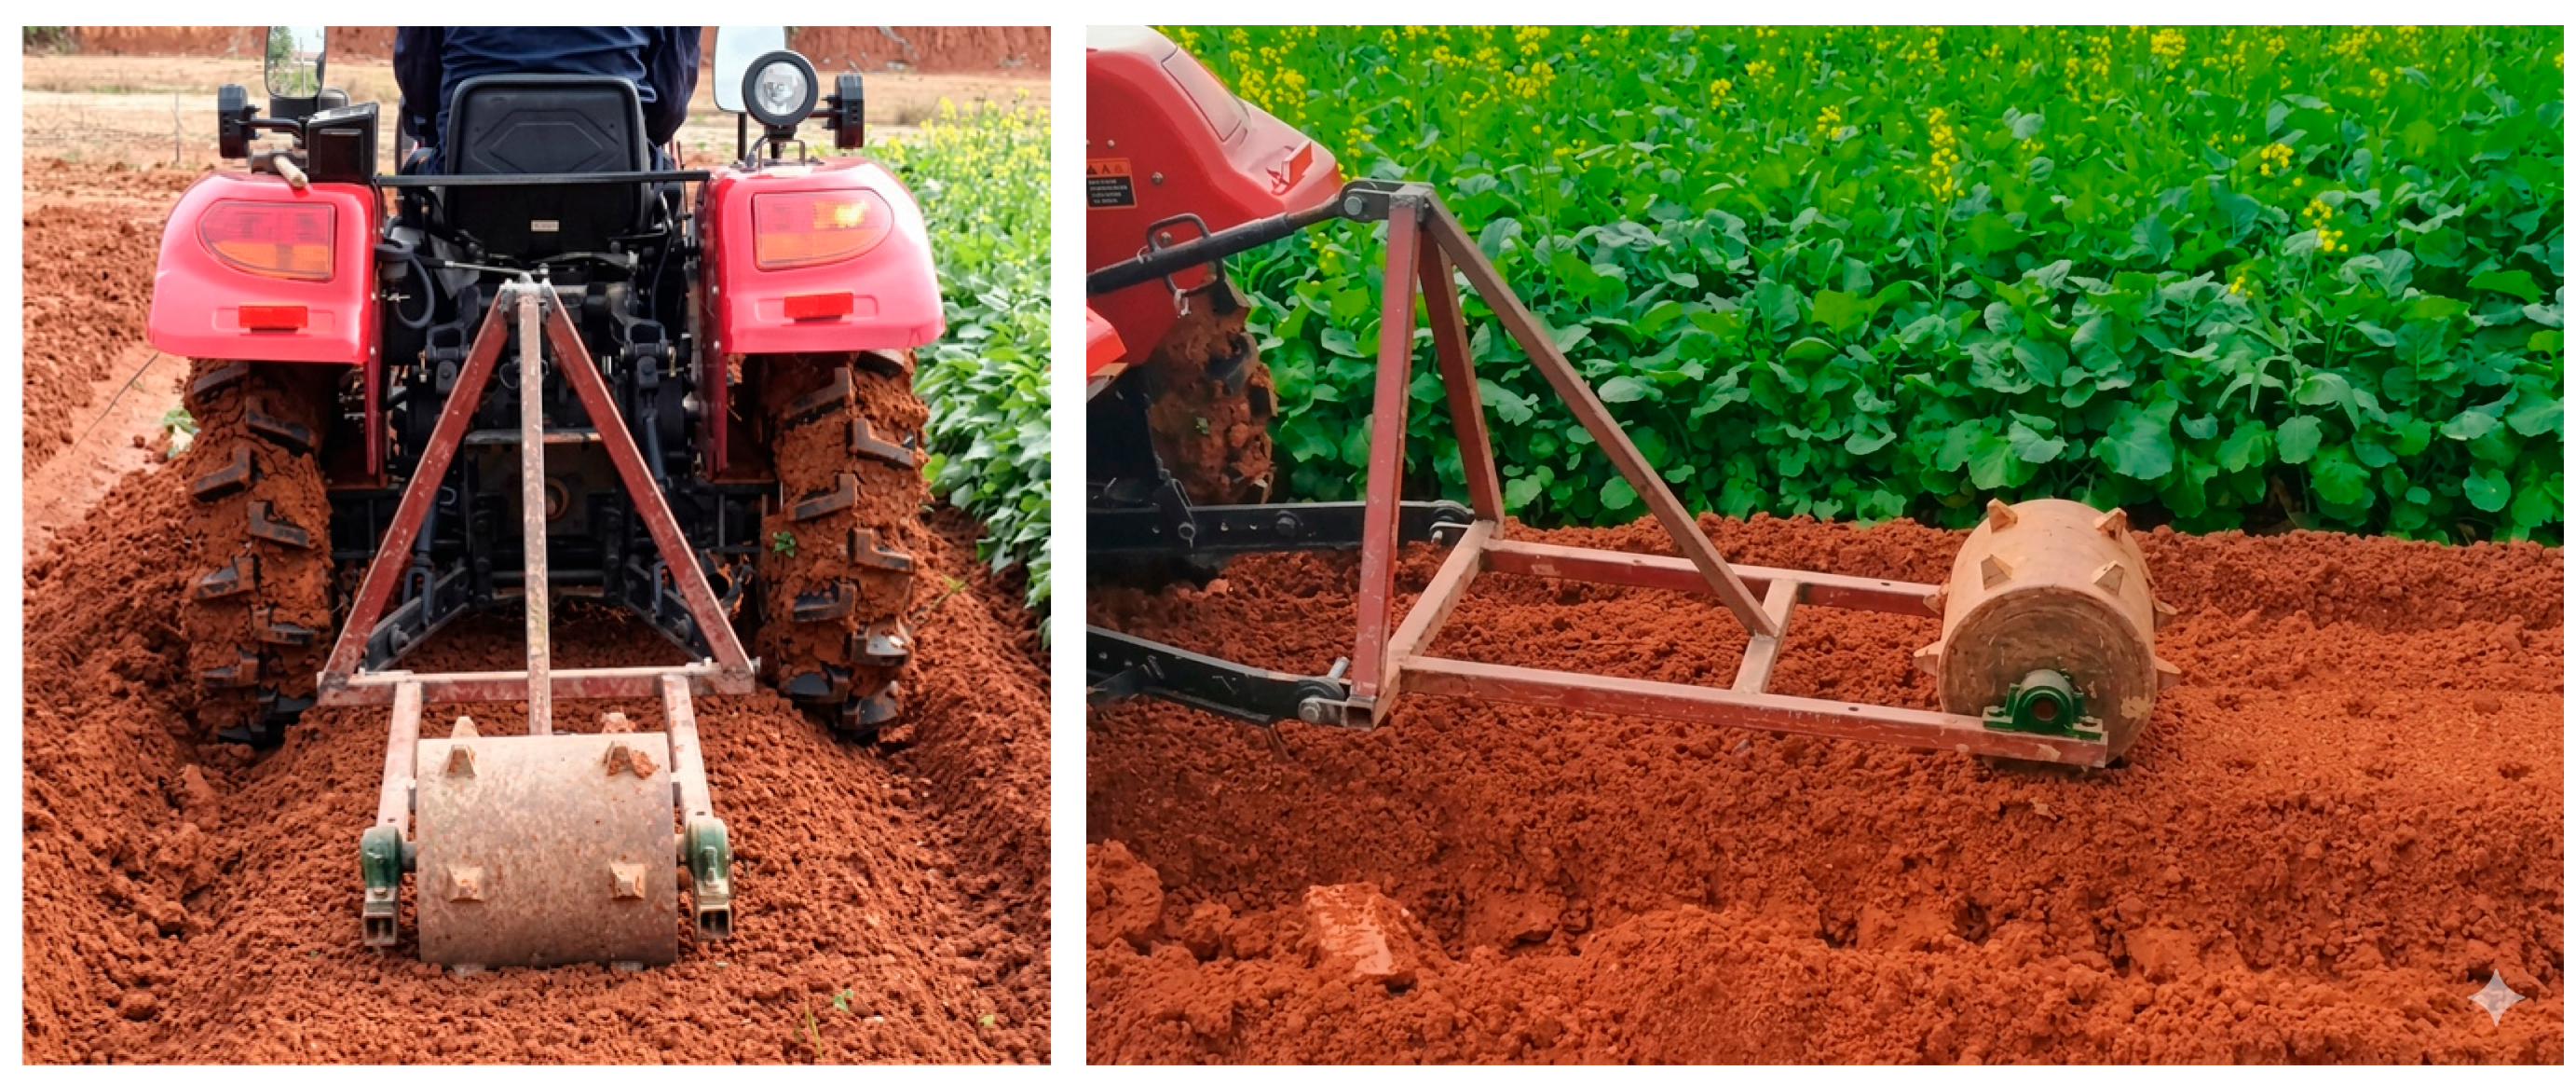
Each experimental plot was divided into three groups, with each group having an effective length of 3.3 m and a width of 1 m. A total of 150 seeds were sown in each group. To ensure consistency between field trials and simulation settings, the operating speed was set at 0.34 m/s and the microstructure height at 42 mm. The pre-optimized and optimized devices were respectively coupled to a Dongfanghong tractor for the field operations, as illustrated in Figure 7.

3. Results and Discussion

3.1. Analysis of Discrete Element Method (DEM) Simulation Results

3.1.1. Analysis of Soil Particle Kinematic Characteristics

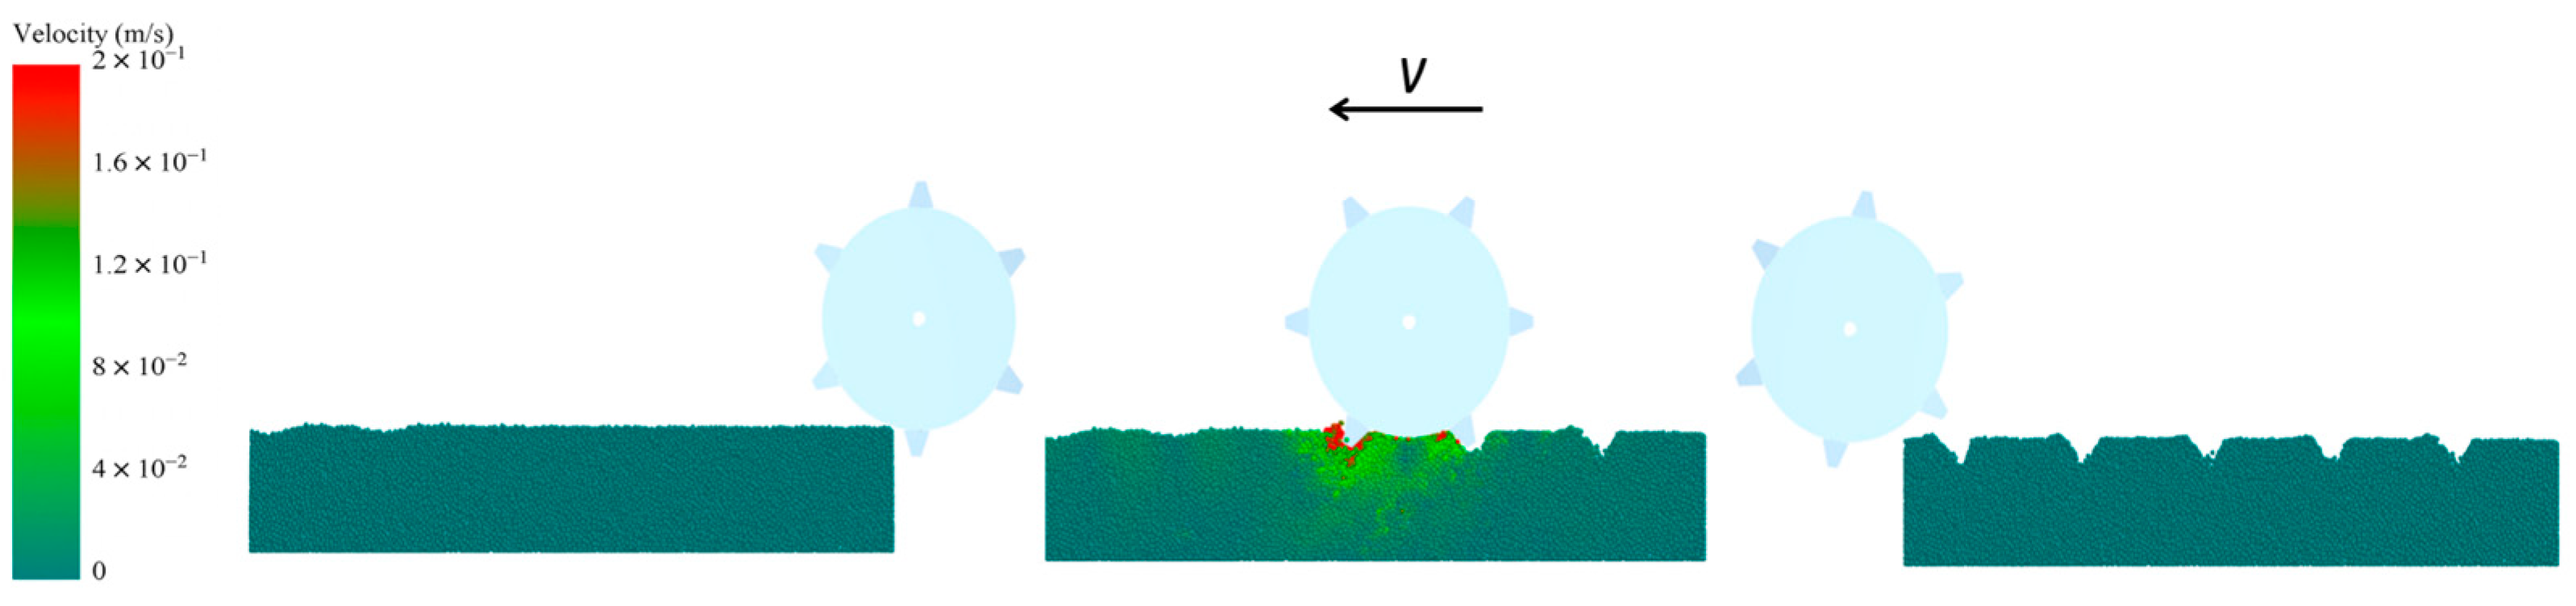
As illustrated in Figure 8, Because the microtopography processing device is a driven component, its rotation direction should be opposite to the forward direction. When it’s in operation, the microstructure shearing and extruding the soil surface to form quadrangular frustum-shaped micro-units. Soil particles subjected to higher force magnitudes are represented in red, while those under lower forces are shown in green. To clarify the patterns of soil particle disturbance and explore the interaction mechanisms between individual microstructures and soil particles, the following factors were analyzed:
(1)
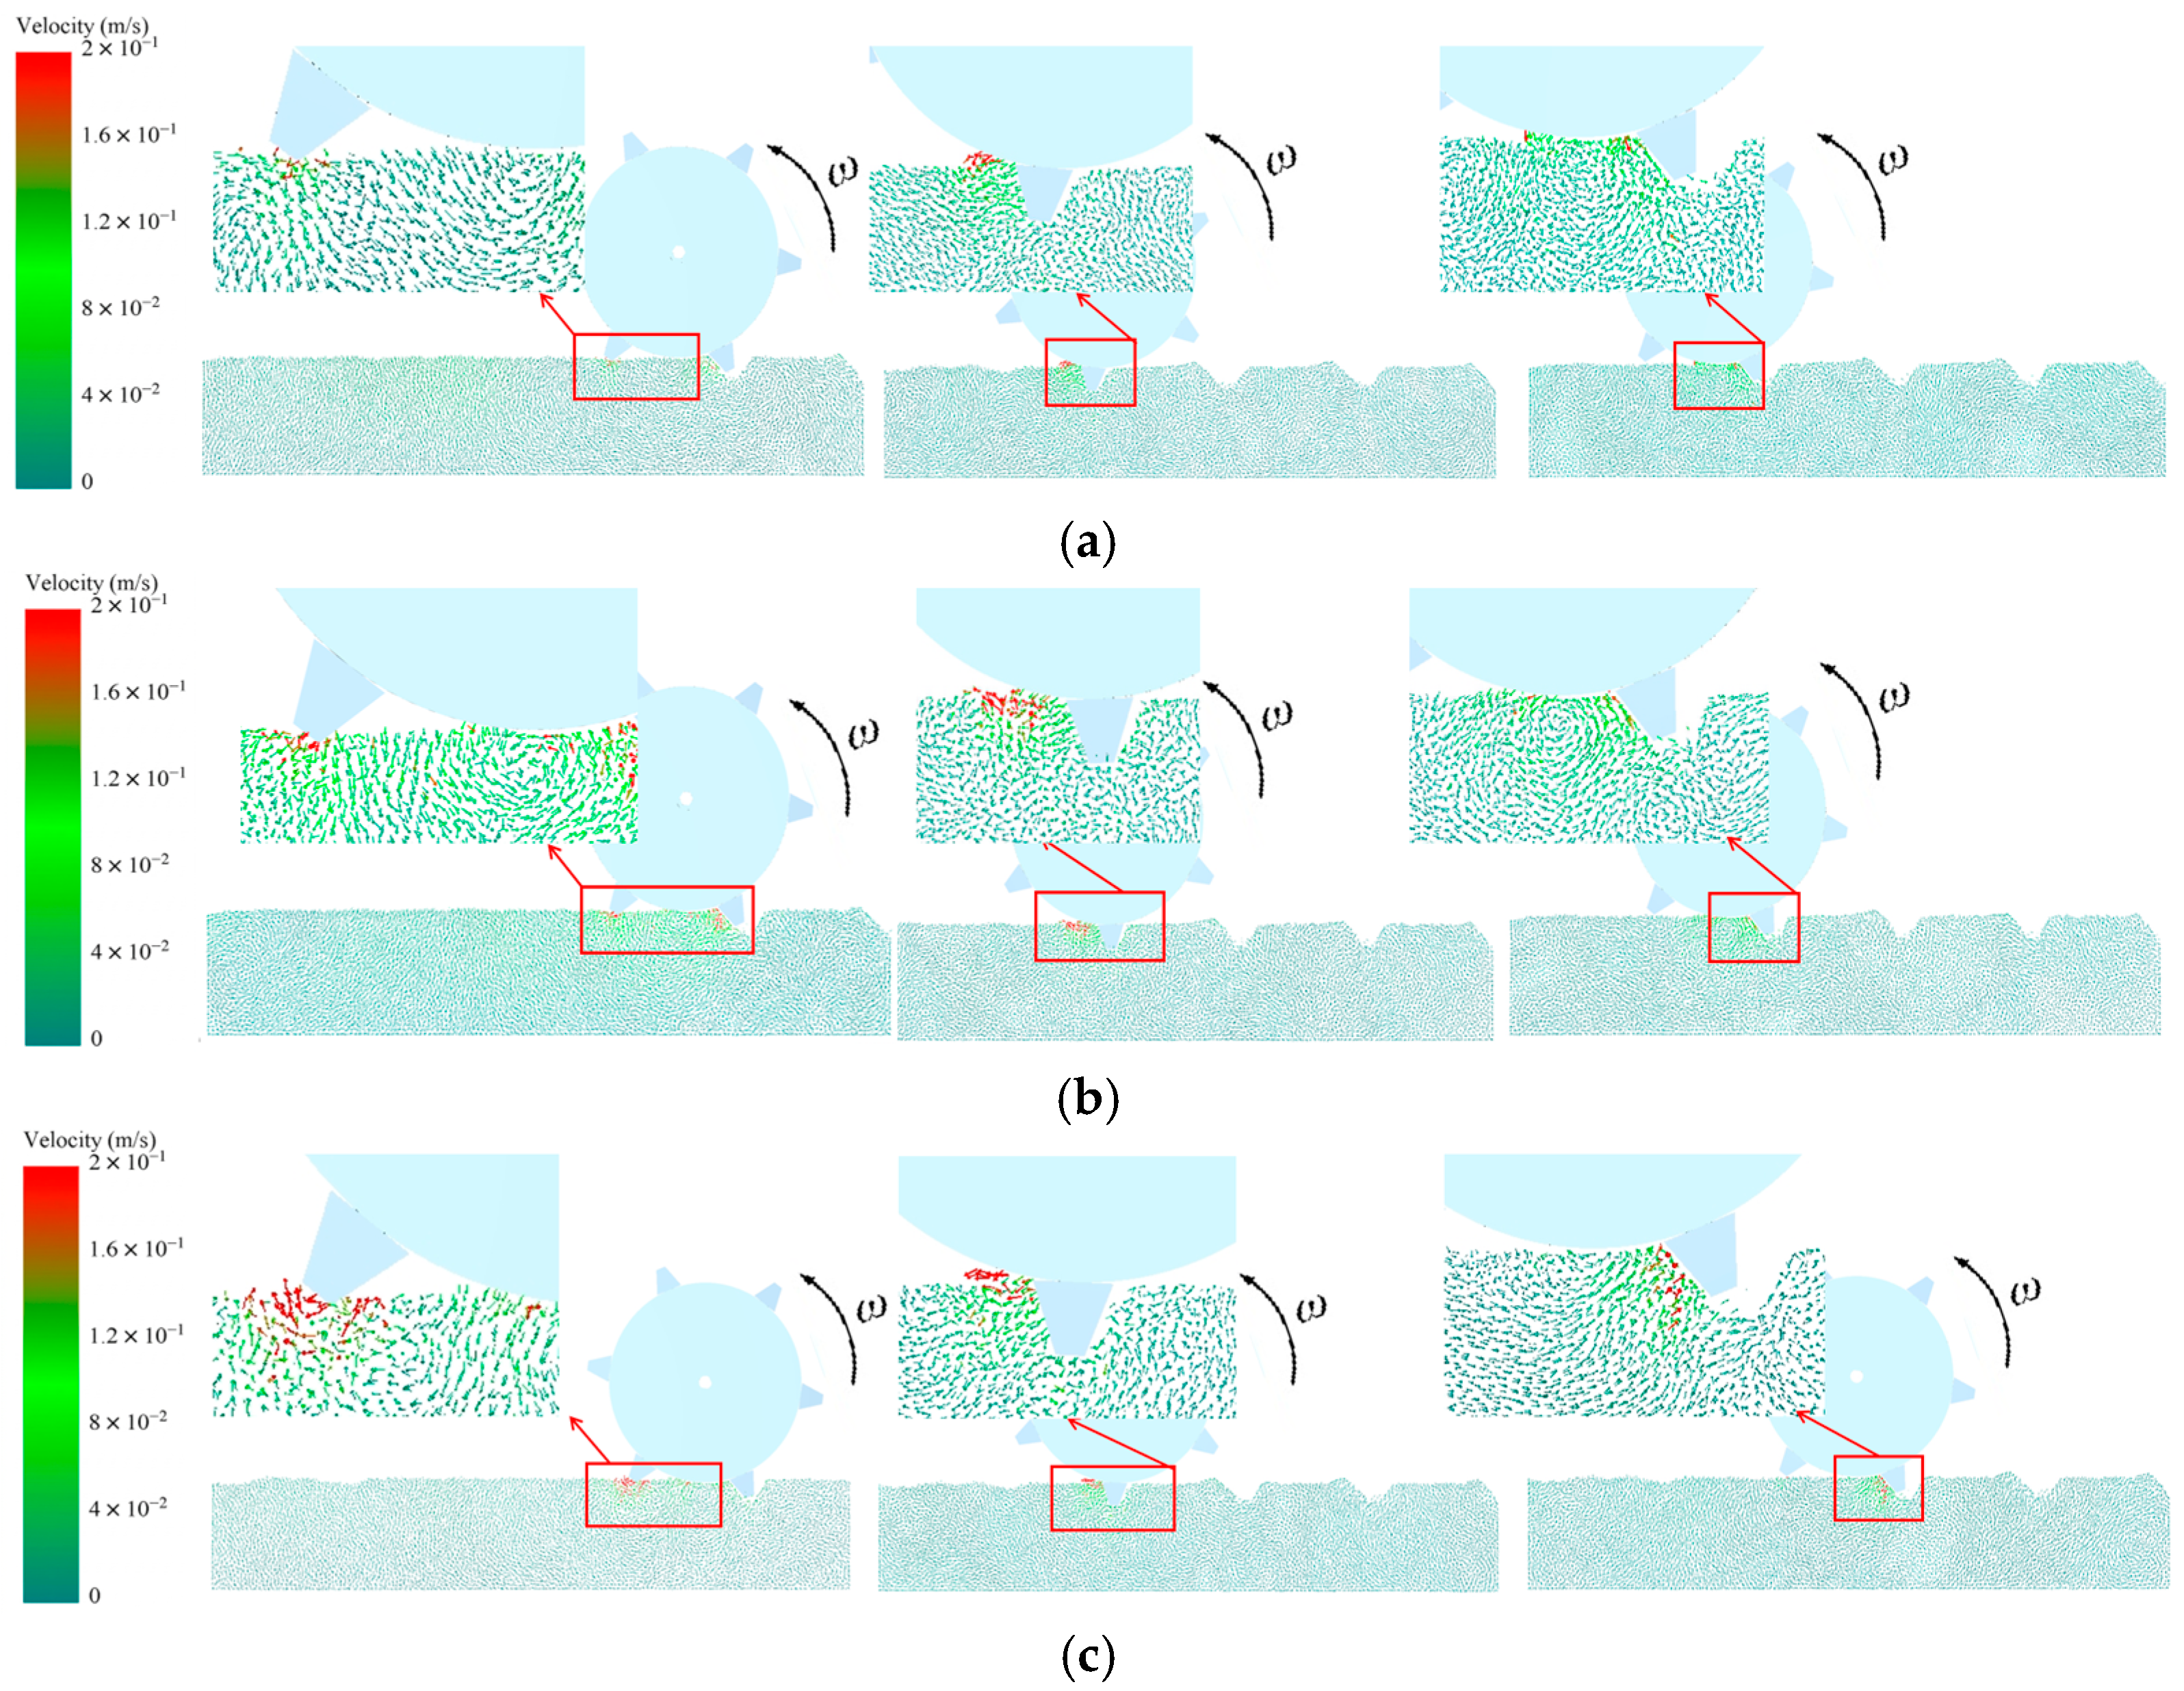
Effects of Working Load. As shown in Figure 9a–c, red particles are primarily concentrated at the contact interface between the packing roller, the microstructures, and the soil, with the soil particle velocity vectors directed upward. Prior to soil penetration, the velocity of the soil particles beneath the microstructure increases with the load, indicating that the packing effect of the microstructure is significantly enhanced by higher loads. Upon complete penetration, a greater load results in a stronger extrusion effect and markedly more pronounced soil disturbance. Conversely, during the emergence (exit) stage, the soil disturbance remains inconspicuous regardless of the applied load.
(2)
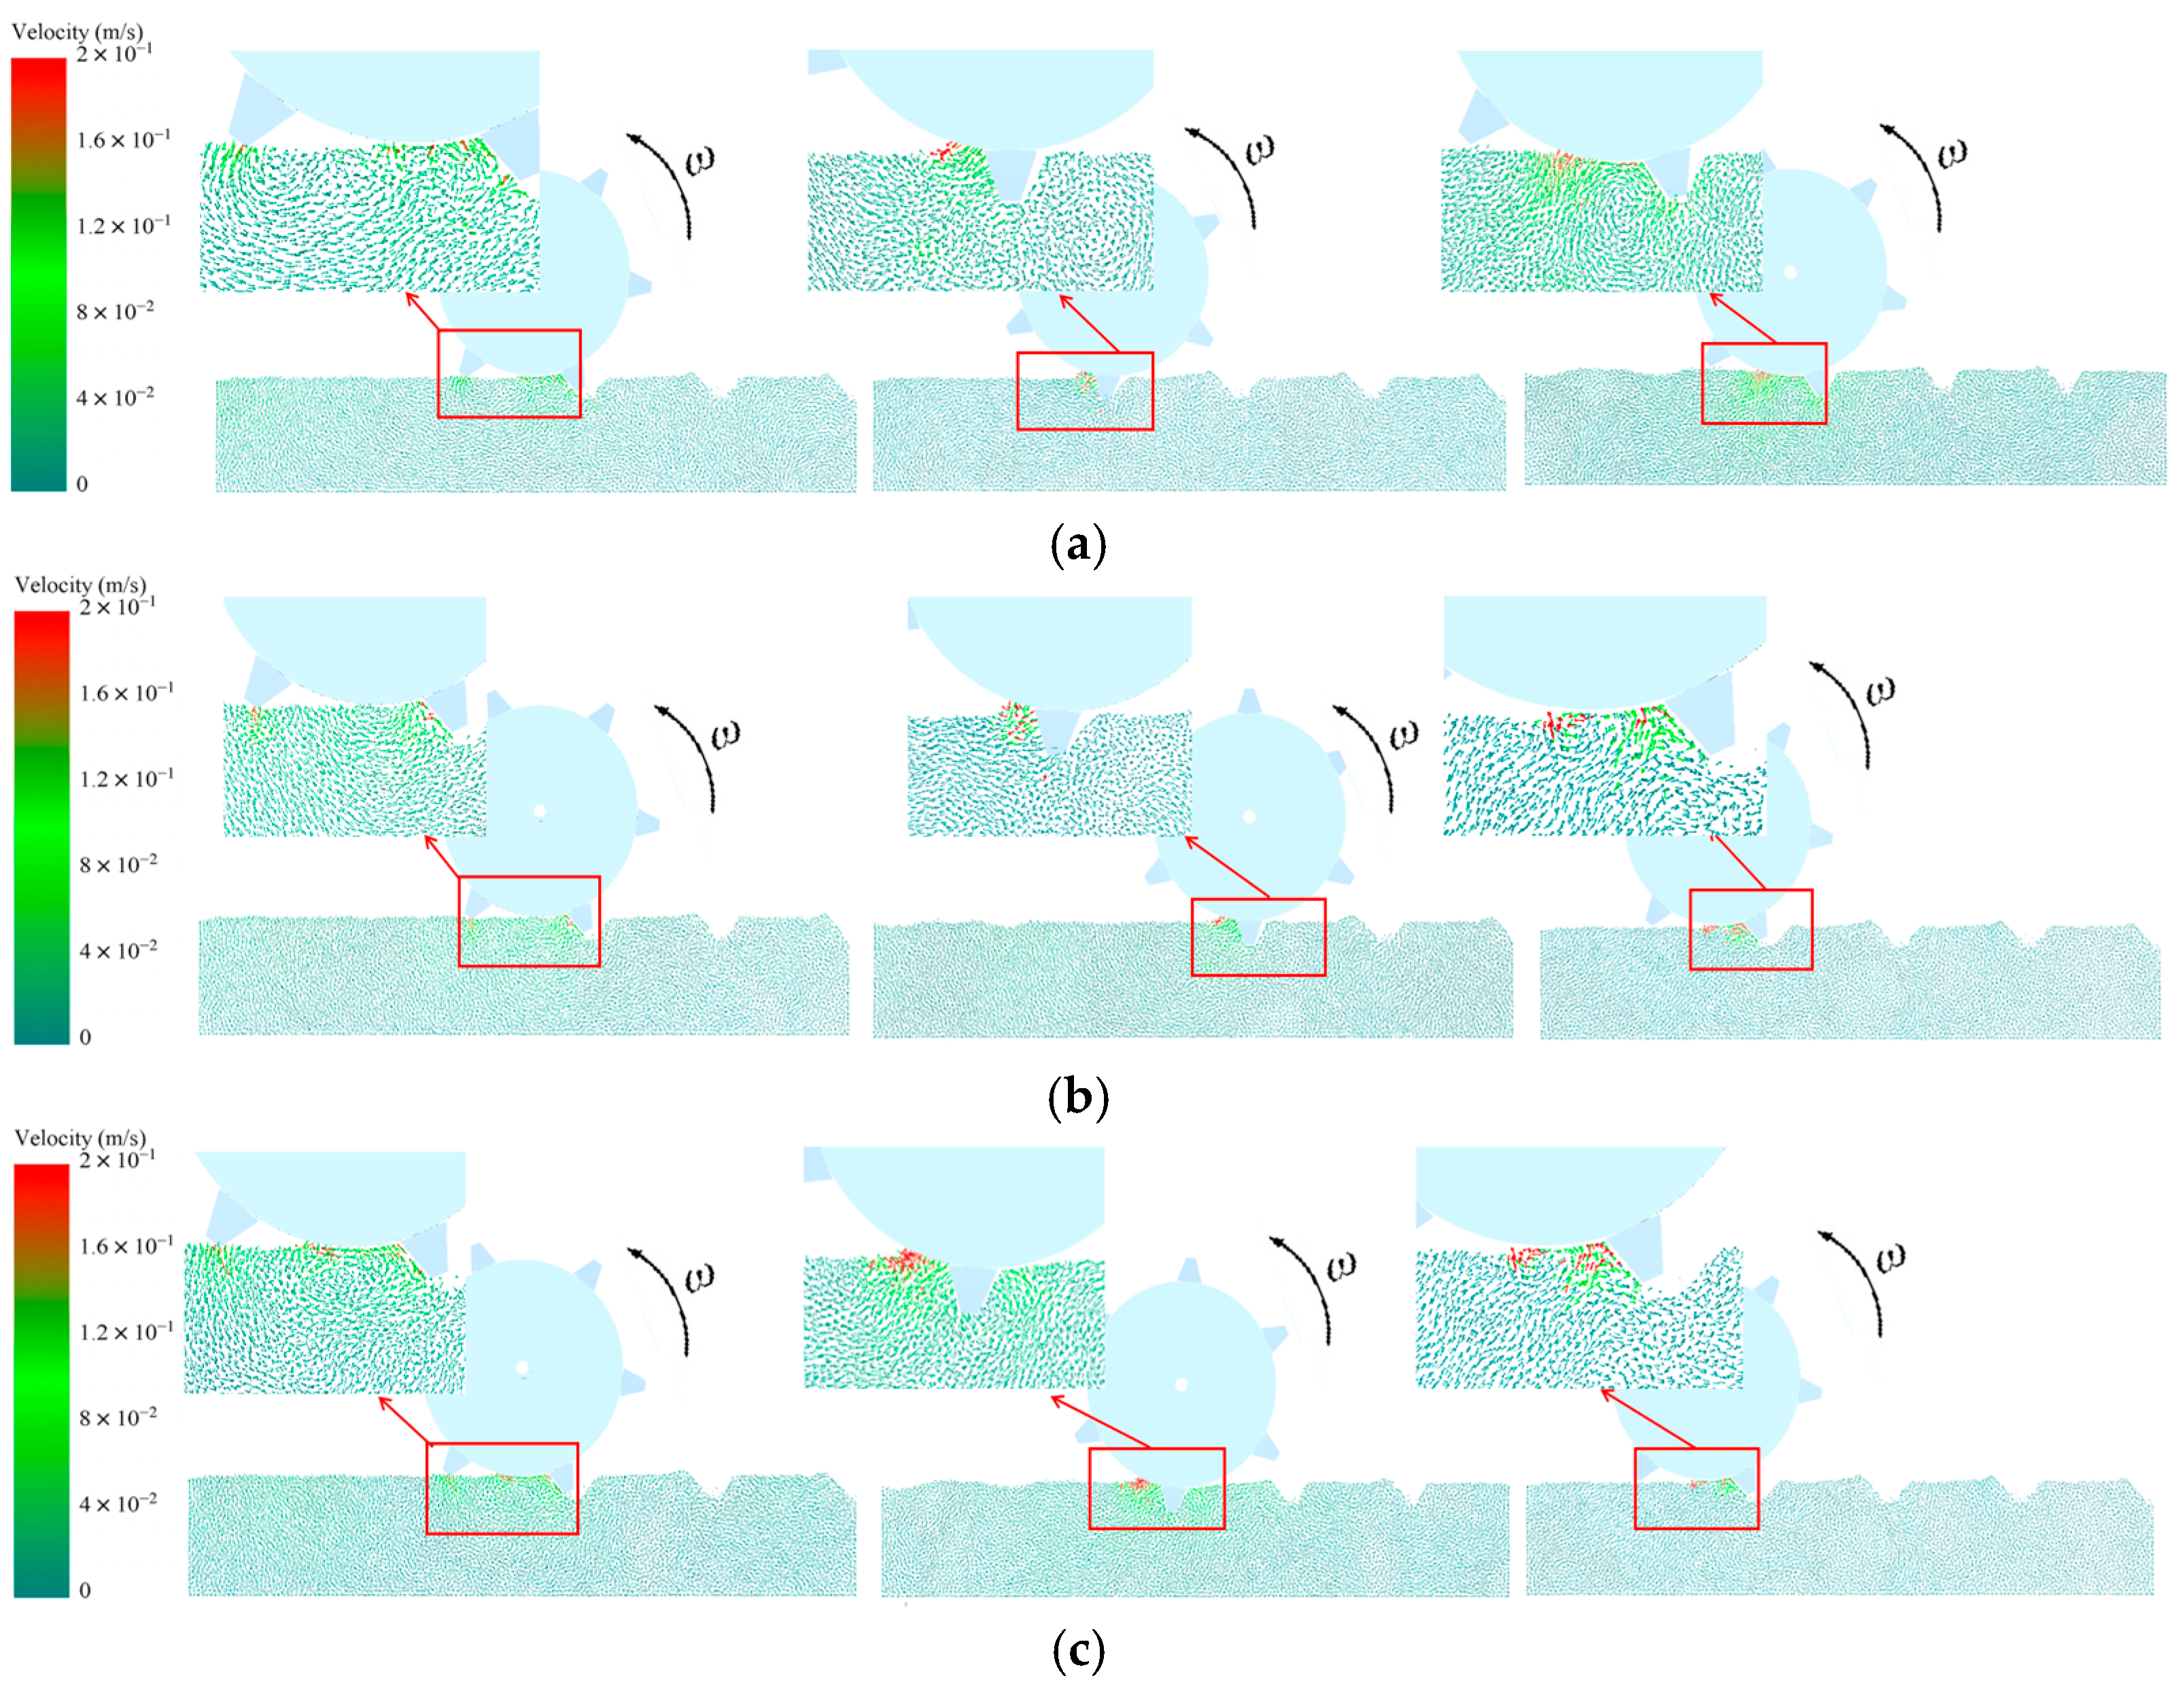
Effects of Working Speed. As depicted in Figure 10, prior to penetration, the extrusion effect of the microstructure on the soil is not significantly apparent as the working speed increases. At the stage of complete penetration, the velocities of the microstructure and the surrounding soil are basically consistent. Substantial compaction forces are observed at the leading edge of the microstructure, squeezing soil particles toward the periphery of the micro-unit. Higher forward speeds result in a stronger extrusion effect. During emergence, the extrusion effect on the soil on the leading side of the microstructure increases proportionally with the forward speed, demonstrating intensified soil disturbance and consequently producing longer formed microtopography.
(3)
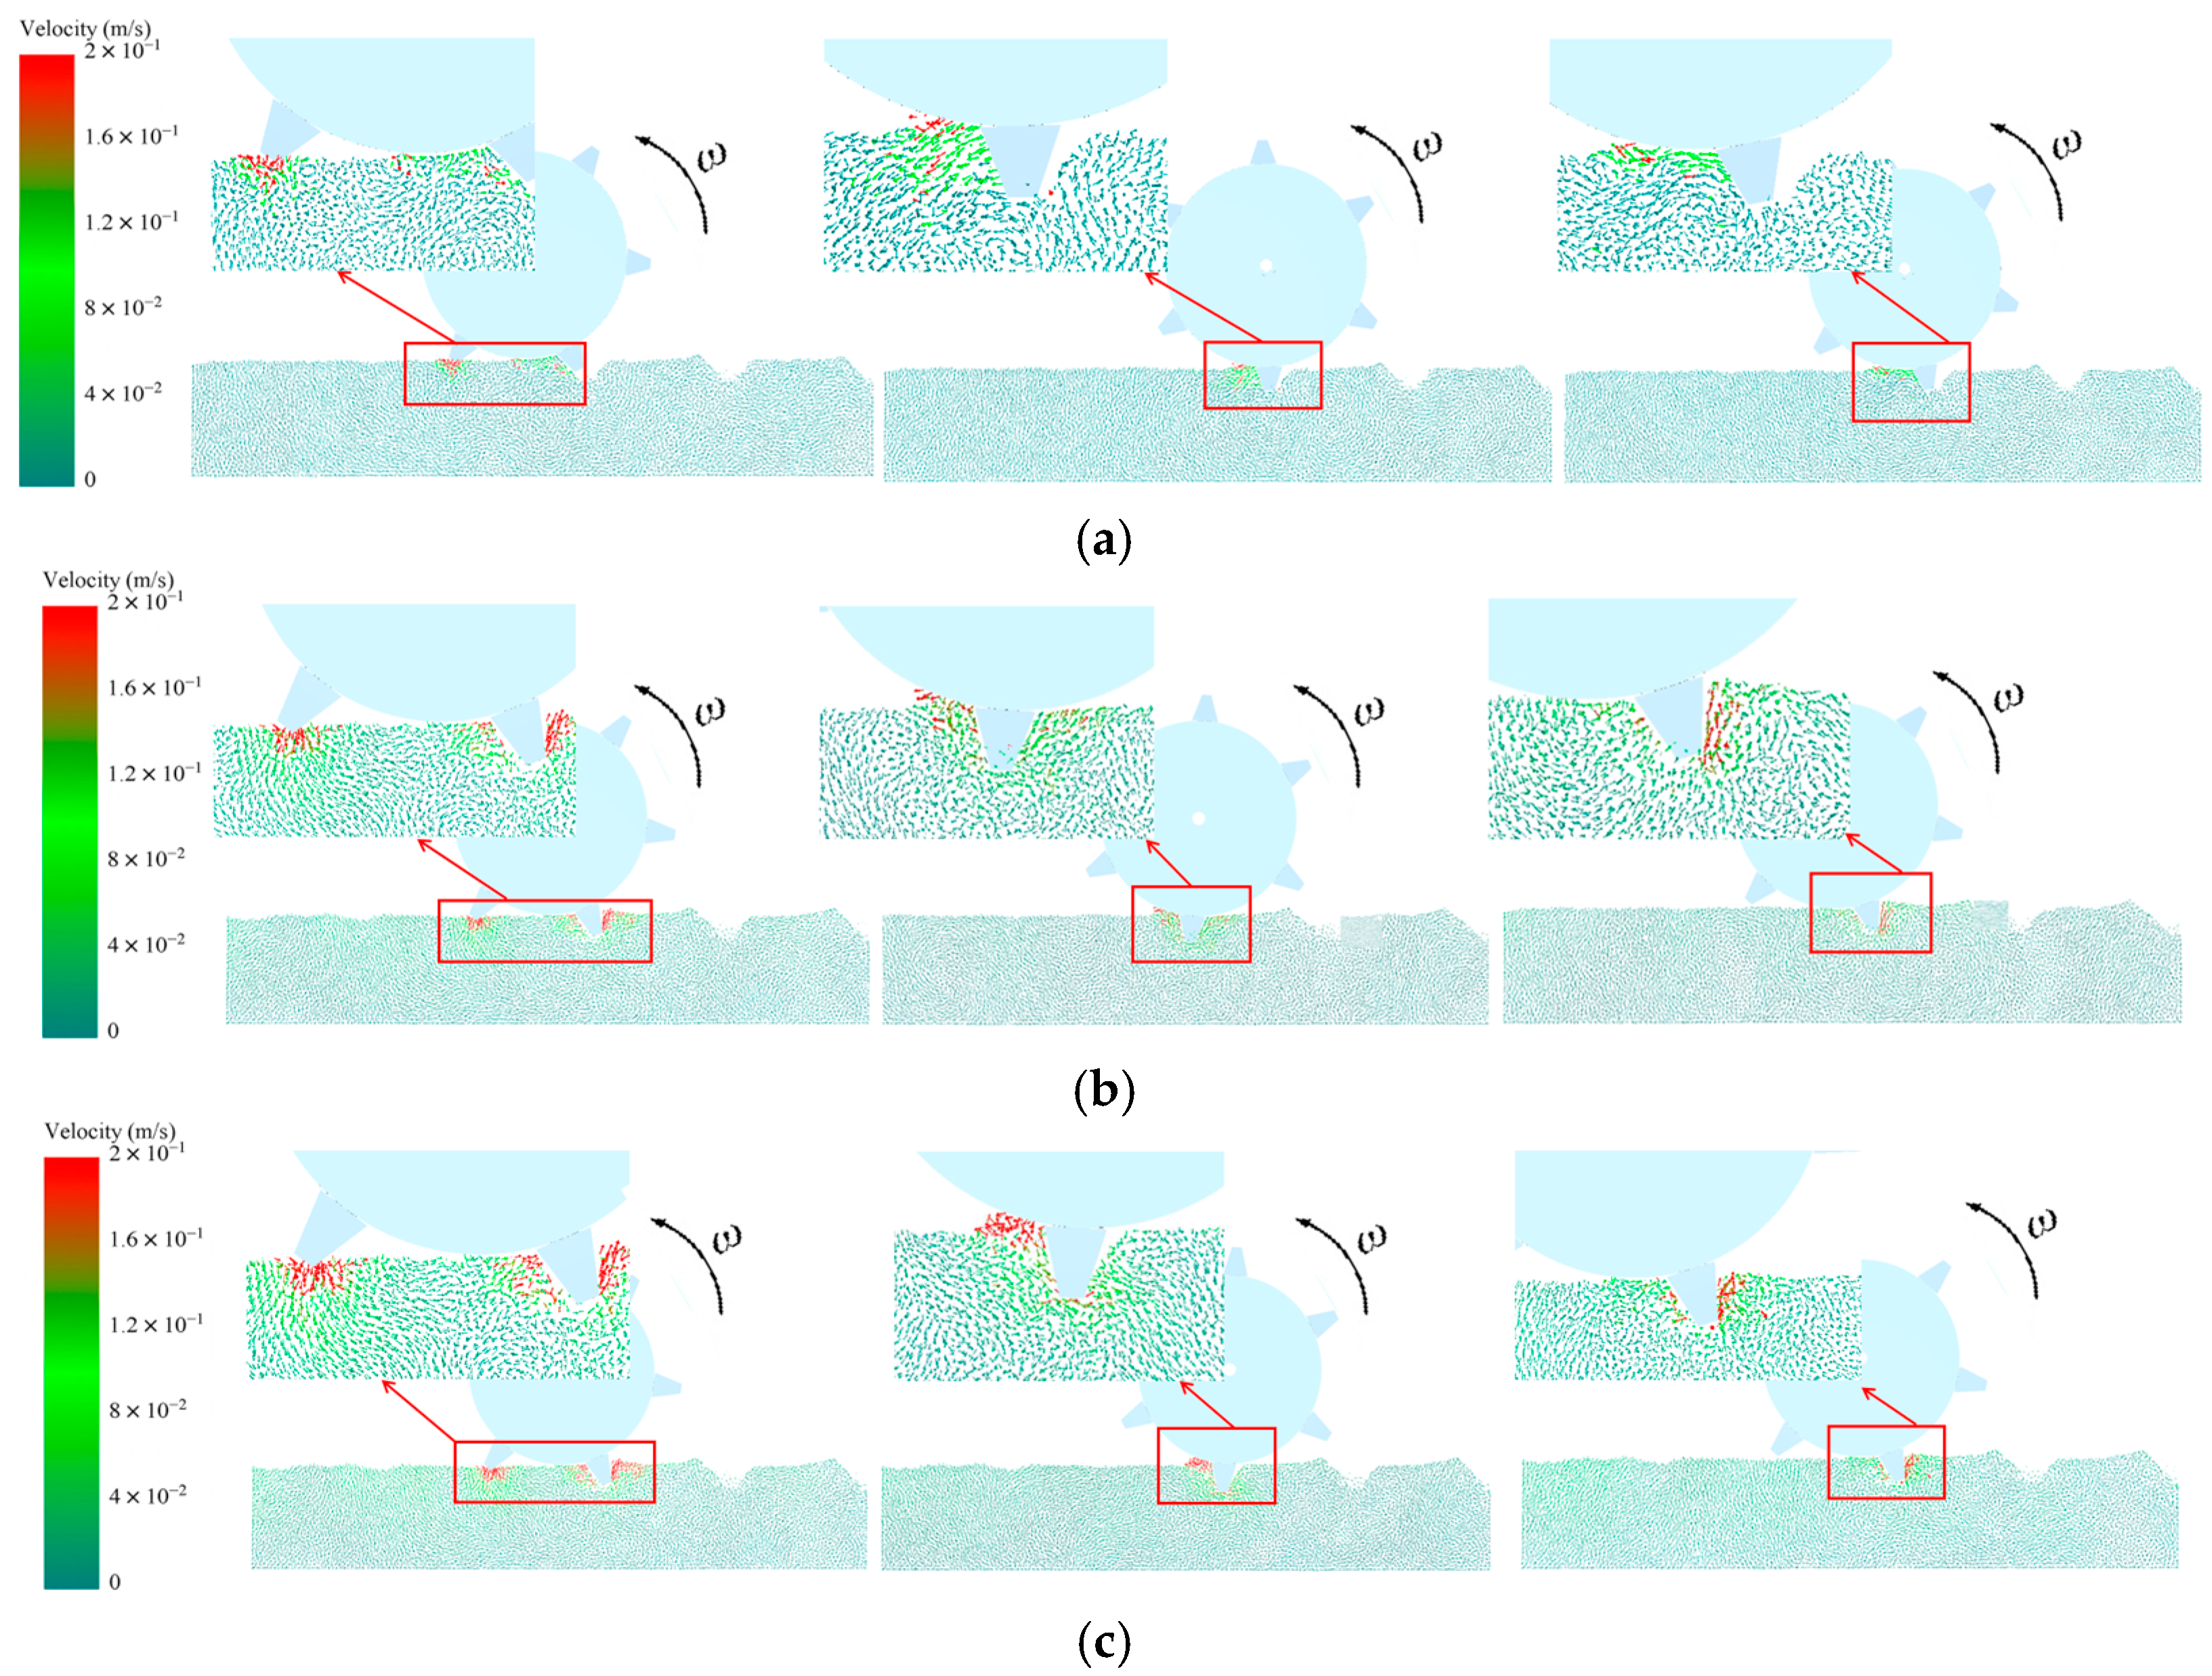
Effects of Microstructure Dimensions. As shown in Figure 11, prior to the penetration of different microstructures, the soil particles surrounding the roller and microstructures move downward and to the left, with particles in contact with the microstructure appearing red. As the microstructure height increases, the disturbance to the surrounding soil is continuously enhanced. During complete penetration, the relative velocity between the microstructure and the surrounding soil remains largely uniform. Greater microstructure heights lead to more intensive soil extrusion and a significantly larger number of affected soil particles. During emergence, as the height increases, the deeper microtopography results in a slight accumulation of soil at the exit end.

3.1.2. Analysis of the Effects of Individual Factors on the Microtopography Qualification Rate

The effects of various factors on the microtopography qualification rate are summarized in Table 4. Variance analysis of quadratic term model for the qualification rate of objective function micro-morphology are summarized in Table 5. Through a comprehensive analysis, the microtopography qualification rate was determined by using the original microstructure dimensions as a reference and comparing the measured qualification rates for microtopography length, width, and height. The overall qualification rate was calculated according to Equation (22). Based on the Analysis of Variance (ANOVA), the second-order polynomial regression equation was derived as follows:
f1 = 94.74 − 0.57A − 2.15B − 0.56C − 0.35AB − 0.10AC + 0.2BC − 0.82A2 + 0.31B2 − 0.27C2
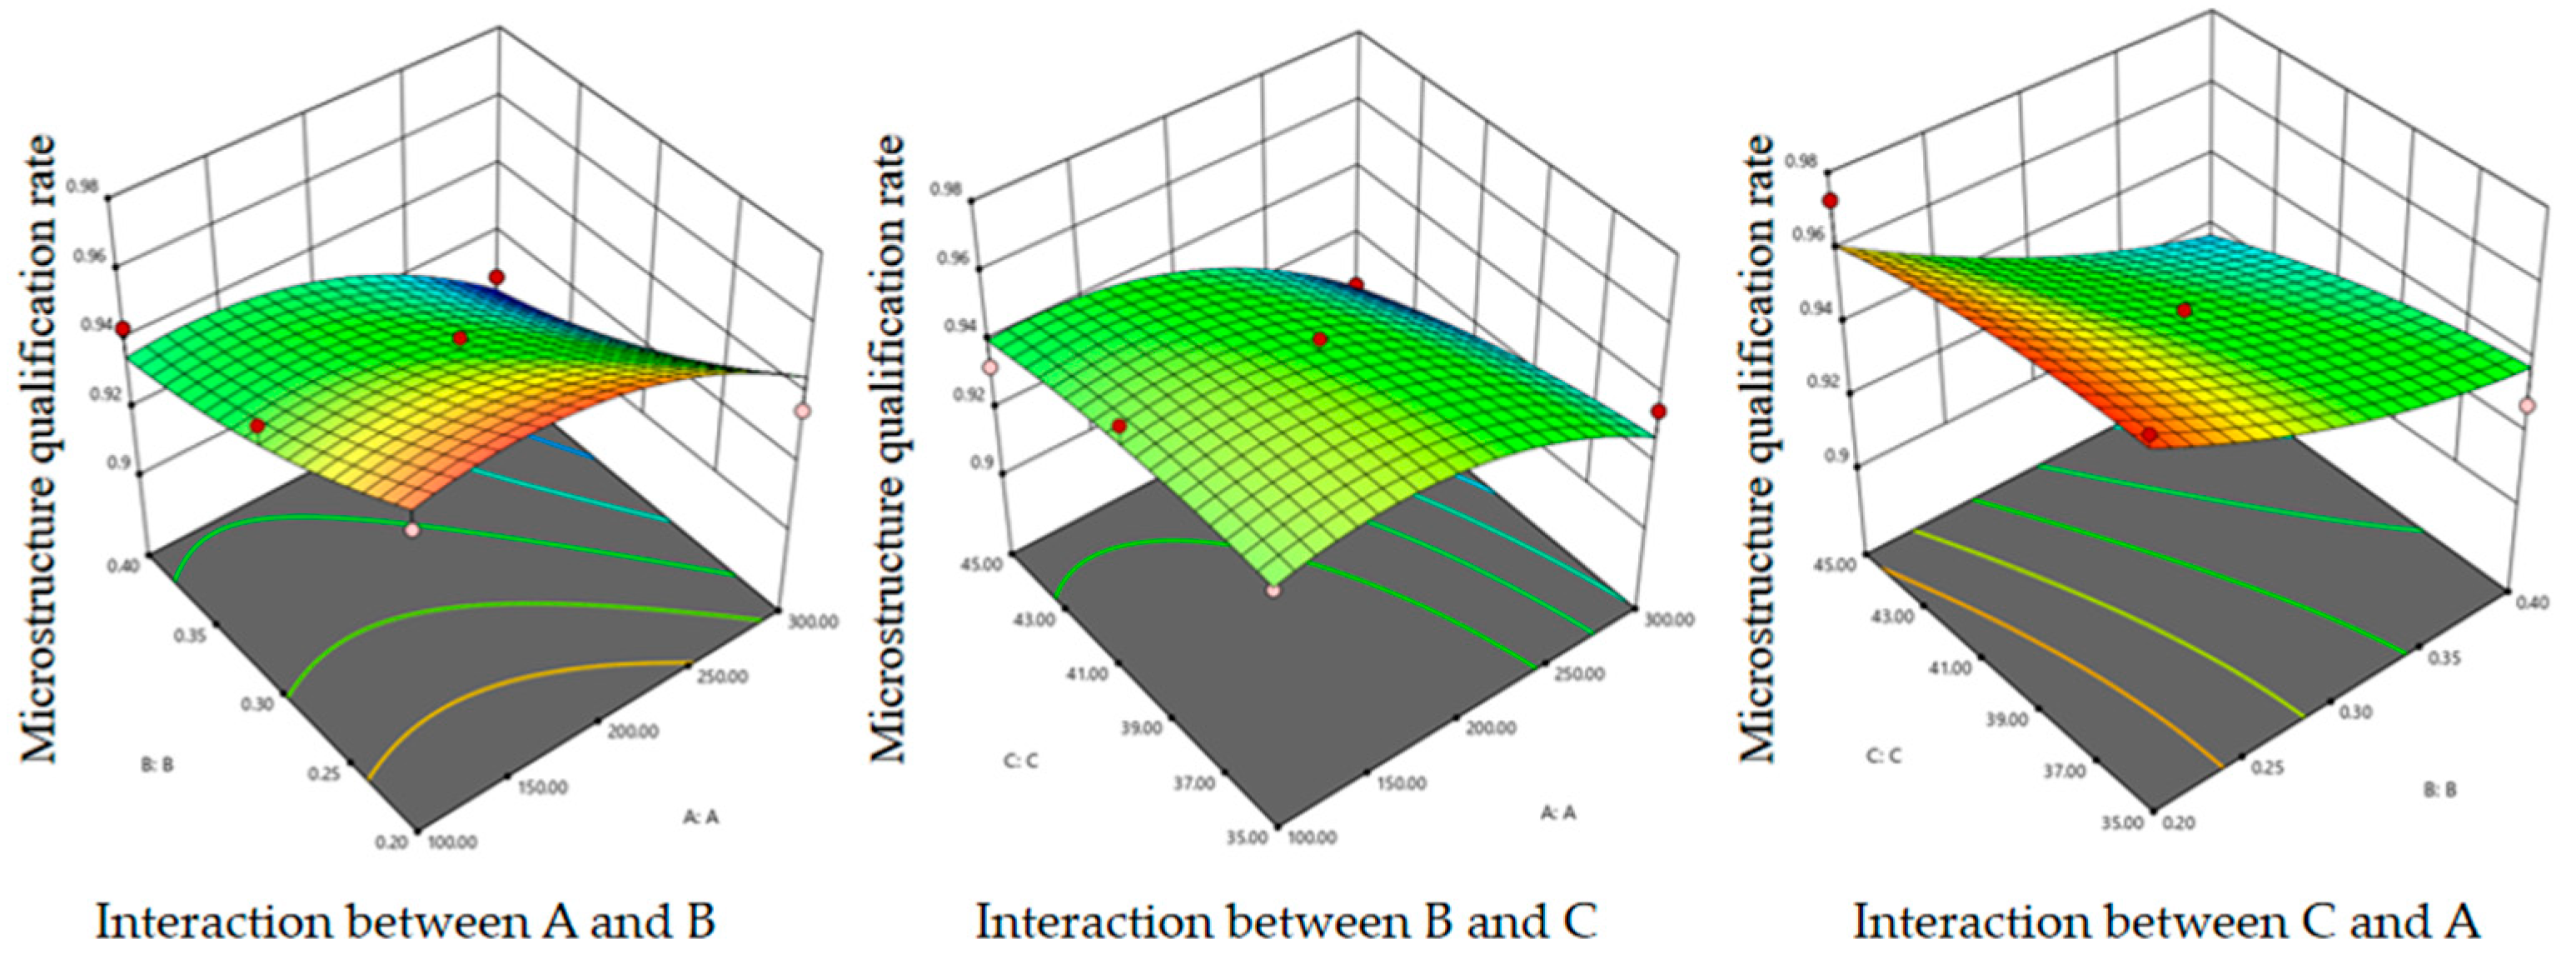
The ANOVA results for the regression equation indicated that the experimental model was highly significant p = 0.0005 (p < 0.01), suggesting that the experimental design was highly valid and robust. The statistical indicators (R2 = 0.9571, R2adj = 0.9019, CV = 0.58%, Adeq precision = 15.564) collectively demonstrated a high degree of fit for the regression equation. This relatively low value is primarily attributed to the highly controlled nature of the Discrete Element Method (DEM) simulation environment. Unlike field experiments, simulation parameters such as soil density, particle distribution, and boundary conditions are strictly defined in the EDEM software, which significantly minimizes random error and experimental noise. “Adeq Precision” is a measure of the Signal-to-Noise Ratio (S/N) for the regression model. It compares the range of the predicted values at the design points to the average prediction error. According to standard statistical practice for Response Surface Methodology (RSM), a ratio greater than 4 is desirable, indicating that the model has an adequate signal and can be used to navigate the design space. Our reported value of 15.564 is well above this threshold, confirming that the second-order polynomial regression model (Equation (22)) is robust and suitable for predicting the microtopography formation qualification rate under various parameters. Working speed (B) exerted a highly significant impact on the microtopography formation qualification rate, while all other factors had significant effects. As shown in Figure 12, based on the F-test results, the ranking of the factors’ influence on the qualification rate was B (working speed) > A (working load) > C (microstructure height).

3.1.3. Experimental Results and Parameter Optimization

As we can see from the simulation, during the stage prior to penetration and post-penetration, if the microstructure causes significant soil disturbance, it leads to the “backfilling” phenomenon where soil particles are lifted or dragged back into the newly formed pit. This directly reduces the actual height (h) and length (L) of the microtopography, thereby lowering the qualification rate. So, a superior microtopography formation effect typically correlates with reduced soil disturbance during microstructure emergence, which consequently indicates higher operational stability of the processing device. To determine the optimal parameter combination for maximum formation stability, the ranges for working load, working speed, and microstructure height were set to 100–300 N, 0.2–0.4 m/s, and 35–45 mm, respectively. Using the microtopography qualification rate as the evaluation index and incorporating the aforementioned boundary conditions, a mathematical optimization model was established.
min   y 1 ( x 1 , x 2 , x 3 ) m a x   y 2 ( x 1 , x 2 , x 3 ) s . t . 100 x 1 300 0.2 x 2 0.4 35 x 3 45
The Numerical Optimization module of Design-Expert software was employed to solve the quadratic regression equation. Several parameter sets yielding high operational performance were identified. The combination with the highest qualification rate was ultimately selected as the optimal parameter set: a working load of 260 N, a working speed of 0.34 m/s, and a microstructure height of 42 mm. Under these optimized conditions, the microtopography formation qualification rate reached 93.6%.

3.2. Experimental Results of the Device Under Optimal Parameters

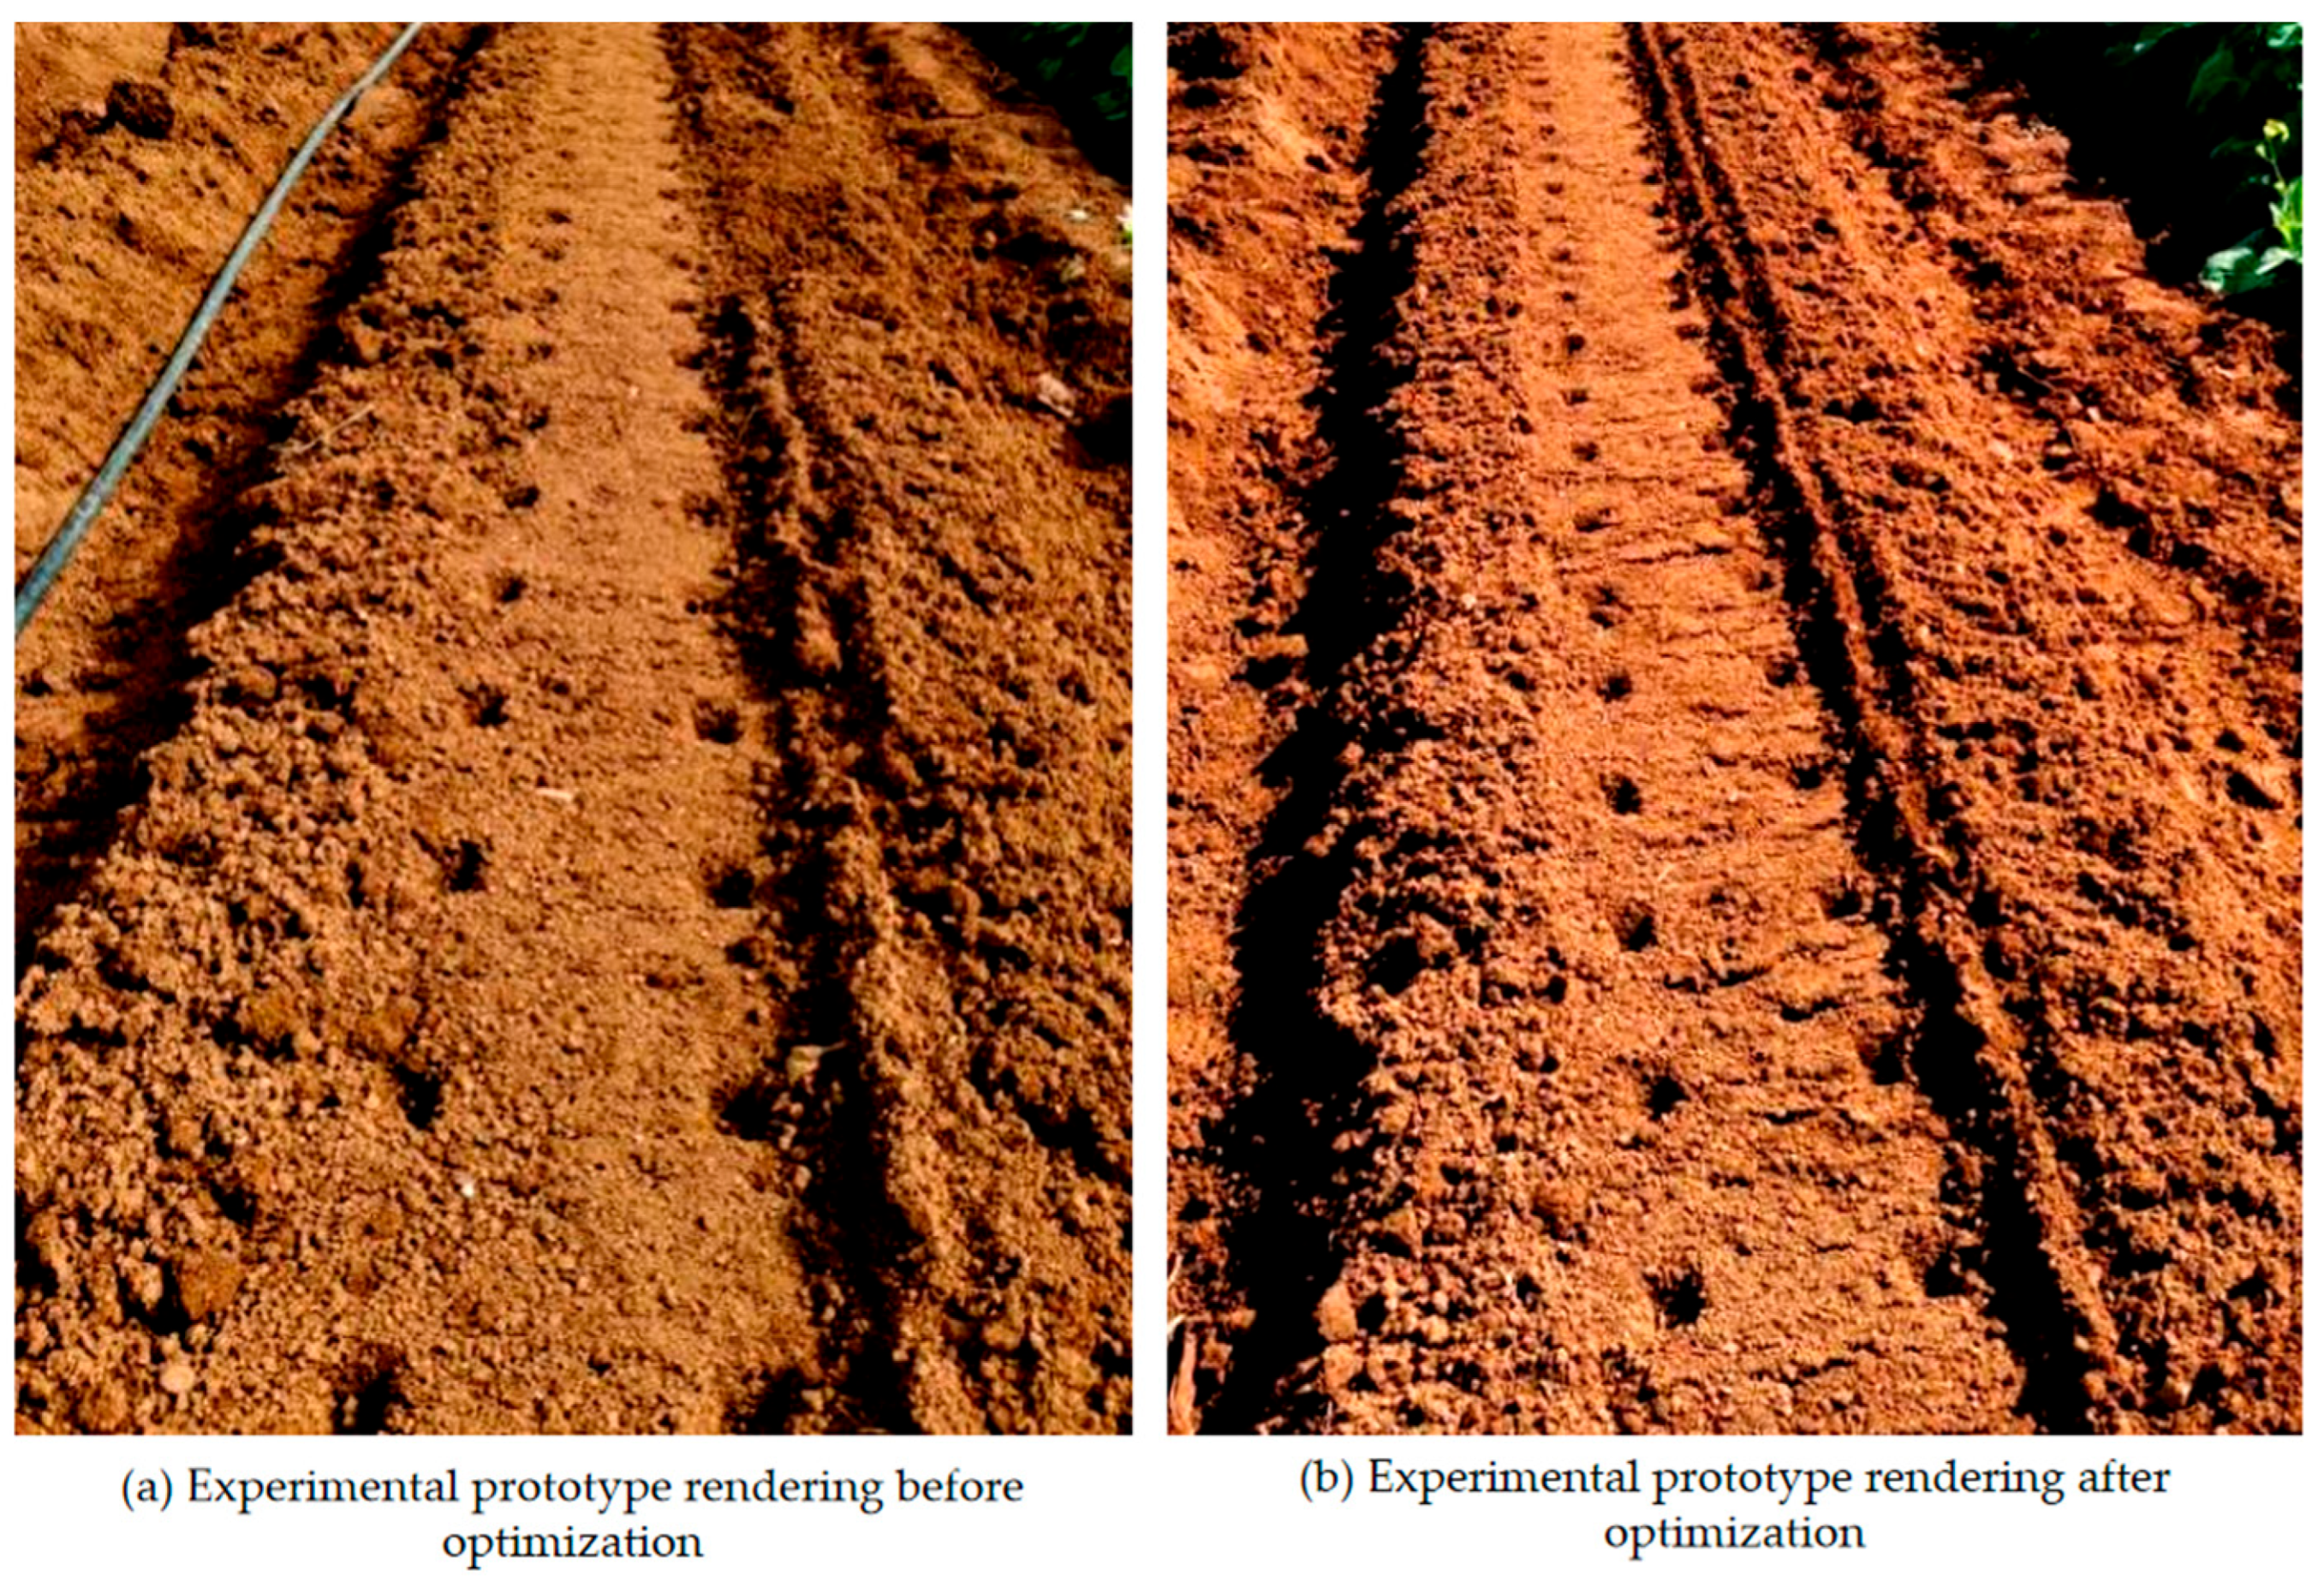
As shown in Table 6, prior to the field trials, the soil moisture content (Sunne electronic halogen moisture analyzer), bulk density (200 cm3 core sampler), and penetration resistance (JK-750-I soil hardness tester) at different depths were precisely measured. Following the completion of the field trials, the microtopography formation effects produced by the device before and after optimization were individually measured, as illustrated in the experimental results in Figure 13. The growth performance of the rapeseed seeds was closely monitored and recorded from the initial sowing stage until complete seedling emergence.
(1)
Qualification Rate of Field Micro-topographical Formation
As summarized in Table 7 and Table 8, the qualification rates of the field micro-topography for the experimental prototype were compared before and after optimization. Field measurements indicated that after the operation of the optimized soil micro-topography forming device, the micro-topographical length ranged from 37.6 to 47.8 mm (mean: 42.8 mm), which exceeded the original design dimensions of the micro-structures. The width and height of the formed micro-topography averaged 38.4 mm (range: 36.5–45.2 mm) and 39.1 mm (range: 36.7–44.5 mm), respectively. It was observed that the micro-structures exerted significant disturbance on the soil during the forming process, leading to relatively large dimensional fluctuations. Notably, the phenomenon of soil backfilling occurred during height formation, resulting in micro-topographical heights slightly lower than the initial dimensions of the micro-structures.
The experimental results demonstrated that the qualification rate of the optimized micro-topography varied between 93.4% and 94.5%, with a mean value of 94.2%. This represents a marked increase of 3.6% compared to the device prior to optimization. Consequently, these findings indicate that the optimized soil micro-topography forming device exhibits consistently high operational stability.
(2)
Seed Emergence Rate
As indicated in Table 9, the mean emergence rate of rapeseed after the operation of the optimized device was 74.33%, whereas the rate for the non-optimized device was 69.37%. Thus, the optimized device substantially improved the rapeseed emergence rate by 4.96%.
The soil environment prepared by the optimized device proved more conducive to rapeseed emergence. This improvement is attributed to the fact that the optimized connection between the micro-structures and the press roller provided a higher ground contact pressure. This ensured that the seeds in the furrows achieved more thorough contact with the soil. Field trial results collectively confirm that the treatment using the optimized device is effectively instrumental in enhancing the seed emergence rate.

3.3. Discussion

(1)
The field test qualification rate of the soil micro morphology processing device developed in this study reached 94.2%, and the seed emergence rate after micro morphology processing increased by 4.96% compared to before optimization. This is consistent with the existing research conclusion that micro morphology can effectively improve soil moisture content and crop yield. And research has found that soil erosion after the operation of micro scale processing devices is only 8% of that of traditional farming methods, further highlighting the advantages of micro scale processing.
(2)
The quadrangular frustum-shaped micro morphology processing device designed in this study was mainly optimized for the physical properties of southern red and yellow soil. This type of soil is the most important cultivated soil type in the middle and lower reaches of the Yangtze River, with extremely high cohesiveness, and is prone to nutrient loss and structural damage under rainfall splashing and surface runoff erosion. However, due to limitations in the experimental environment and site conditions, on-site verification was only conducted at the Changsha Experimental Base in Hunan Province. Although the red and yellow soils in this region are typical, there may still be slight differences in soil physicochemical properties between different subregions. In addition, there are significant differences in the mechanical response characteristics of soils with different textures (such as sand or clay), and the universality of existing optimization parameters in other extreme soil environments still needs further verification. Future research will introduce more diverse soil samples for multi-point field experiments to further enhance the operational reliability and promotional value of the device in complex geographical environments.
(3)
This study focuses on the mechanical design and forming quality of a quadrilateral small terrain processing device, with forming qualification rate as the core evaluation index. Although constructing small surface terrains is widely recognized as an effective means of reducing soil erosion, improving soil structure, and enhancing ecological functions, this study still lacks fluid dynamics coupling in quantitatively predicting erosion reduction, and can only simulate the mechanical compression and shear processes of soil particles by soil contacting components. However, the erosion and sediment transport of small terrains by surface runoff are complex fluid solid coupling processes. To quantitatively predict erosion reduction (such as specific values of runoff or sediment yield), it is necessary to further couple existing DEM models with computational fluid dynamics (CFD) models.
(4)
In this study, the compaction device was simplified to a basic rigid wheel model for mechanical derivation. Although this model offers high computational efficiency and theoretical reference value for analyzing the fundamental evolution patterns between tillage resistance and sinkage, it still has limitations in describing the complex soil–tool interactions. Specifically, it fails to adequately account for the elastic recovery characteristics of the southern red-yellow soil after compression. This may lead to minor discrepancies between the theoretically calculated final sinkage depth and the actual depth of the formed micro-topography. Furthermore, to simplify the integral calculation, the influence of the specific geometric singularities of the truncated quadrangular pyramid micro-structure on soil flow was omitted from the theoretical derivation.

4. Conclusions

In this study, based on the 2BYG-230 rapeseed seeder, the micro-topographical formation process was analyzed using Discrete Element Method (DEM) simulations. Through a multiple factor orthogonal experiment find that the order of significance for the factors affecting the formation effect is operating load > operating speed > micro-structure height. Through simulation, the movement of soil particles before, during, and after the penetration of a single micro-structure was investigated. It was found that as the load, speed, and height increased, the shearing and compression effects of the microstructures on the soil were continually enhanced, leading to more pronounced soil disturbance. Through simulation-based optimization, the optimal combination of operating parameters was determined as: an operating load of 260 N, an operating speed of 0.34 m/s, and a micro-structure height of 42 mm. Under these parameters, the simulated qualification rate was 93.6%. Subsequently, a prototype of the soil micro-topography forming device with quadrilateral frustum-shaped structures was fabricated and tested in the field. The results showed that the field qualification rate was 94.2% (a 3.6% increase over the non-optimized version) and the seed emergence rate increased by 4.96%. These results strongly validate the structural and operating parameters derived from the DEM simulations, showing good agreement between experimental and simulated data. This study provides technical support for ecological function enhancement and sustainable agricultural production in the red and yellow soil regions of Southern China.

Author Contributions

Conceptualization, X.J.; investigation, Y.M. and S.X.; resources, Z.Z. and X.J.; writing—original draft preparation, Y.M.; writing—review and editing, X.J.; supervision, X.J.; funding acquisition, X.J. All authors have read and agreed to the published version of the manuscript.

Funding

This research was funded by the Yuelushan Laboratory Breeding Program (YLS-2025-ZY03021; YLS-2025-ZY01008), Hunan Provincial Science and Technology Plan (2024JK2033), and Hunan Agriculture Research System (HARS-03).

Institutional Review Board Statement

Not applicable.

Data Availability Statement

The data presented in this study are available upon request from the corresponding author due to protections for ongoing research.

Conflicts of Interest

The authors declare no conflicts of interest.

References

  1. The General Office of the State Council. The Total Cultivated Land Area in China Has Reached 1.94 Billion Mu, an Increase of 28 Million Mu from 2020. 30 September 2025. Available online: https://www.gov.cn/lianbo/bumen/202509/content_7040244.html (accessed on 23 April 2026).
  2. Permanent Mission of the People’s Republic of Chinato the United Nations Agencies for Food and Agriculture. The State of Land and Water Resources in the World Food and Agriculture Sector by 2025. 16 December 2025. Available online: https://cnafun.moa.gov.cn/news/gjxw/202512/t20251216_6479759.html (accessed on 23 April 2026).
  3. Chiurciu, I.A.; Dana, D.; Chereji, A.I.; Chereji, I.; Voicu, V.; Firățoiu, A. Research on Soil and Nutrient Losses through Liquid Runoff, in Order to Mitigate the Climate Risks to Which Romania Is Exposed, in the Context of CAP. Earth 2022, 3, 639–651. [Google Scholar] [CrossRef] [Scilit]
  4. Yang, Q.; Peng, J.; Ni, S.; Zhang, C.; Wang, J.; Cai, C. Soil erosion-induced decline in aggregate stability and soil organic carbon reduces aggregate-associated microbial diversity and multifunctionality of agricultural slope in the Mollisol region. Land Degrad. Dev. 2024, 35, 3714–3726. [Google Scholar] [CrossRef] [Scilit]
  5. Shao, F.F.; Tao, W.H.; Wang, Q.J.; Wu, J.H.; Su, L.J.; Yan, H.K.; Zhang, Y.B. A mathematical model using an equivalent exchange layer for predicting raindrop-induced nutrient ejection from soil to runoff on bare and vegetated slopes. J. Hydrol. 2023, 620, 129546. [Google Scholar] [CrossRef] [Scilit]
  6. Zhang, M.; He, Z.; Wilson, M.J. Chemical and Physical Characteristics of Red Soils from Zhejiang Province, Southern China. In The Red Soils of China; Springer: Dordrecht, The Netherlands, 2004; pp. 63–87. [Google Scholar]
  7. Gao, H.; Zhang, B.B.; Zhao, M.J.; Yang, X.L. Grain productivity potential of cultivated land and yield gap analysis in China. J. China Agric. Univ. 2020, 25, 10–18. [Google Scholar]
  8. Hong, S.W.; Lee, I.B.; Seo, I.H.; Kwon, K.S.; Kim, T.W.; Son, Y.H.; Kim, M.Y. Measurement and prediction of soil erosion in dry field using portable wind erosion tunnel. Biosyst. Eng. 2014, 118, 68–82. [Google Scholar] [CrossRef] [Scilit]
  9. Cao, Z.; Chen, G.; Zhang, S.; Wu, Y.; Dong, F.; Guo, Y.; Wang, J.; Jiang, F. An Assessment of Soil Loss by Water Erosion in No-Tillage and Mulching, China. Water 2023, 15, 2821. [Google Scholar] [CrossRef] [Scilit]
  10. Zhao, X.; Song, X.; Wang, D.; Li, L.; Meng, P.; Fu, C.; Wang, L.; Wei, W.; Yang, N.; Liu, Y.; et al. Optimizing Straw Mulching Methods to Control Soil and Water Losses on Loess Sloped Farmland. Agronomy 2024, 14, 696. [Google Scholar] [CrossRef] [Scilit]
  11. Liao, Q.X.; Zhang, J.Q.; Zhang, Q.S.; Du, W.B.; Lin, J.X.; Wang, L.Z. Design and Test of Rapeseed Seed Bed Preparation Device Combined with Parallel Plow Group Turnbuckle and Rotary Tillage. Trans. Chin. Soc. Agric. Mach. 2024, 55, 190–201. [Google Scholar]
  12. Zhao, Z.H.; Wu, M.L.; Xie, S.P.; Luo, H.F.; Li, P.C.; Zeng, Y.; Jiang, X.H. Parameter calibration for the discrete element simulation of soil-preceding rice stubble and its rotary tillage trajectory. Trans. Chin. Soc. Agric. Eng. 2024, 40, 72–82. [Google Scholar]
  13. Zhou, H.N.; Wang, Z.X.; Wang, W.C.; Zhang, Y.F. Biaxial deep rotary tillage with straw returning improves straw burial and crop development in a rice-wheat rotation system. J. Chin. Agric. Mech. 2026, 47, 260–267. [Google Scholar]
  14. Luo, G.; Yu, S.; Han, Y.; Gu, H.; Yang, X.; Li, Y.; Wu, T.; Li, F. Effects of Artificially Crushing Bedrock by Rotary Tillage on Soil Infiltration: A Field Study in a Shallow Hillslope in China. J. Soil Sci. Plant Nutr. 2024, 24, 6514–6525. [Google Scholar] [CrossRef] [Scilit]
  15. Luo, B.; Han, Z.; Yang, J.; Wang, Q. Assessment of Erosion Characteristics in Purple and Yellow Soils Using Simulated Rainfall Experiments. Int. J. Environ. Res. Public Health 2021, 19, 357. [Google Scholar] [CrossRef] [Scilit] [PubMed]
  16. Li, J.; Luo, B.; Liu, B.; Wei, X.; Zhong, S.; Wei, C. Raindrop-impact-induced ejection characteristics of surface particles for soils with a textural gradient. CATENA 2023, 223, 106930. [Google Scholar] [CrossRef] [Scilit]
  17. An, J.; Wu, Y.; Wu, X.; Wang, L.; Xiao, P. Soil aggregate loss affected by raindrop impact and runoff under surface hydrologic conditions within contour ridge systems. Soil Tillage Res. 2021, 209, 104937. [Google Scholar] [CrossRef] [Scilit]
  18. Zhang, X.J. Roles of raindrop impact in detachment and transport processes of interrill soil erosion. Int. Soil Water Conserv. Res. 2023, 11, 592–601. [Google Scholar] [CrossRef] [Scilit]
  19. Liang, X.; Feng, J.; Ye, Z.; Zhang, L.; Li, J.; Lu, X.; Zhao, S.; Liu, Q.; Zheng, Z.; Wang, Y. The Effect of Soil Surface Mounds and Depressions on Runoff. Sustainability 2022, 15, 175. [Google Scholar] [CrossRef] [Scilit]
  20. He, S.; Luo, J.; Zheng, Z.; Ding, W.; Liu, J. Response of Hydrodynamic Characteristics to Tillage-Induced Microtopography of Rill Erosion Processes under Heavy Rainfalls. Land 2024, 13, 685. [Google Scholar] [CrossRef] [Scilit]
  21. Luo, J.; Zheng, Z.; Li, T.; He, S.; Zhang, X.; Huang, H.; Wang, Y. Quantifying the contributions of soil surface microtopography and sediment concentration to rill erosion. Sci. Total Environ. 2021, 752, 141886. [Google Scholar] [CrossRef] [Scilit]
  22. Foote, W.; Nuti, R.; Edmisten, K.; Collins, G.; Whitaker, J.; Jordan, D.; Shew, B.; Meijer, A. Crop Responses to Furrow Diking in North Carolina. Crops Soils 2014, 47, 36–40. [Google Scholar] [CrossRef] [Scilit]
  23. Salem, H.M.; Valero, C.; Muñoz, M.Á.; Gil-Rodríguez, M. Effect of integrated reservoir tillage for in-situ rainwater harvesting and other tillage practices on soil physical properties. Soil Tillage Res. 2015, 151, 50–60. [Google Scholar] [CrossRef] [Scilit]
  24. Smith, R.B.; Oster, J.D.; Phene, C.J. Subsurface drip produced highest net return in Westlands area study. Calif. Agric. 1991, 45, 8–10. [Google Scholar] [CrossRef] [Scilit]
  25. Altikat, S.; Celik, A. The effects of tillage and intra-row compaction on seedbed properties and red lentil emergence under dry land conditions. Soil Tillage Res. 2011, 114, 1–8. [Google Scholar] [CrossRef] [Scilit]
  26. Great Plains International. Simba Aqueel II. Available online: https://greatplainsag.com/en-gb/video/9700/aqueel-ii (accessed on 23 April 2026).
  27. Johnston, A.M.; Lafond, G.P.; May, W.E.; Hnatowich, G.L.; Hultgreen, G.E. Opener packer wheel and packing force effects on crop emergence and yield of direct seeded wheat, canola and field peas. Can. J. Plant Sci. 2003, 83, 129–139. [Google Scholar] [CrossRef] [Scilit]
  28. Schaffert Manufacturing. Claw-Type Soil Surface Micro-Topography Forming Device. Available online: https://www.schaffert.com/furrow-v-closers/ (accessed on 23 April 2026).
  29. Patrick, C.; Kechavarzi, C.; James, I.T.; O‘Dogherty, M.; Godwin, R.J. Developing reservoir tillage technology for semi-arid environments. Soil Use Manag. 2007, 23, 185–191. [Google Scholar] [CrossRef] [Scilit]
  30. Kverneland Group. Adjustable Soil Surface Micro-Topography Forming Device. Available online: https://ien.kvernelandgroup.com (accessed on 23 April 2026).
  31. Geng, Y.L.; Zhong, X.K.; Wang, X.L.; Zhang, X.C.; Wei, Z.C.; Wu, D. Research on precise regulation of no-tillage seeder compaction pressure. J. Chin. Agric. Mech. 2022, 43, 1–14. [Google Scholar]
  32. Tong, J.; Zhang, Q.Z.; Chang, Y.; Li, M.; Zhang, L.L.; Liu, X. Finite element analysis and experimental verification of bionic press roller for adhesion and resistance reduction. Trans. Chin. Soc. Agric. Mach. 2014, 45, 85–92. [Google Scholar]
  33. Tong, J.; Zhang, Q.Z.; Chang, Y.; Chen, D.H.; Dong, W.H.; Zhang, L.L. Adhesion and resistance reduction test of rib-type bionic press roller. Trans. Chin. Soc. Agric. Mach. 2014, 45, 135–140. [Google Scholar]
  34. Kang, D.X. Design and Research of Combined Soil Preparation Machine for Subsoiling, Stubble Cleaning and Pressing. Master’s Thesis, Gansu Agricultural University, Lanzhou, China, 2020. [Google Scholar]
  35. Liu, H.J.; Han, J.Y.; Chen, J.Q.; Lv, J.Q.; Zhao, S.H. Performance Simulation and Experiment on Rigid Press Wheel for Hilly Area. Trans. Chin. Soc. Agric. Mach. 2018, 49, 114–122. [Google Scholar]
  36. Zhang, Z.H.; Zhao, L.L.; Lai, Q.H.; Tong, J. Operation mechanism analysis and experiments of shovel-type rolling soil-engaging components based on DEM-MBD coupling. Trans. Chin. Soc. Agric. Eng. 2022, 38, 10–20. [Google Scholar]
  37. Zhang, Z.H.; Tong, J.; Chen, D.H.; Sun, J.Y.; Ma, Y.H. Modal analysis of bionic convex teeth rolling component composed of different materials. Trans. Chin. Soc. Agric. Eng. 2012, 28, 8–15. [Google Scholar]
  38. Zhang, Z.H.; Zhang, G.K.; Tong, J. Analysis of Kinematics and Dynamics in Toothed Wheel Operating Process. J. Anhui Agric. Sci. 2016, 44, 316–321. [Google Scholar]
  39. Zhang, Z.H.; Zhang, G.K.; Tong, J.; Carr, S.; Lai, Q.H.; Zhang, Z.G.; Fang, Q.R. Kinematics and Dynamics Analysis of Toothed Wheel Based on Finite Element Method. J. Anhui Agric. Sci. 2016, 44, 325–329. [Google Scholar]
  40. Bi, S.Y.; Liu, W.D.; Guo, L.J. Design and experiment of coupled bionic press wheel in ridge cultivation area in northeast China. J. Agric. Mech. Res. 2021, 43, 134–140. [Google Scholar]
  41. Jia, H.L.; Wang, W.J.; Zhuang, J.; Luo, X.F.; Yao, P.F.; Li, Y. Design and Experiment on Reducing Soil Adhesion and Anti-slip Structure of Profiling Elastic Press Roller. Trans. Chin. Soc. Agric. Mach. 2015, 46, 20–27. [Google Scholar]
  42. Jia, H.L.; Wang, W.P.; Chen, Z.; Zhuang, J.; Wang, W.P.; Liu, H.L. Real-time pressure measurement of profiling elastic press roller based on soil cone index. J. Jilin Univ. (Eng. Technol. Ed.) 2018, 48, 1169–1175. [Google Scholar]
  43. Guo, H.; Chen, Z.; Jia, H.L.; Zheng, T.Z.; Wang, G.; Wang, Q. Design and experiment of soil-covering and soil-compacting device withcone-shaped structure of wheel. Trans. Chin. Soc. Agric. Eng. 2019, 33, 56–65. [Google Scholar]
  44. Chen, B. Analytical Dynamics; Peking University Press: Beijing, China, 1987. [Google Scholar]
  45. Wright, A. Tyrelsoil Interaction Modelling Within a Virtual Proving Ground Environment. Master’s Thesis, Cranfield University, Shrivenham, UK, 2012. [Google Scholar]
  46. Zhuang, J.D. Computational Automotive Terramechanics; China Machine Press: Beijing, China, 2002. [Google Scholar]
  47. Jia, M.Y. Experimental Study and Computer-Aided Design of Soil Surface Micro-Topography Processing Device for No-Till Seeder. Master’s Thesis, China Agricultural University, Beijing, China, 2002. [Google Scholar]
  48. He, J.; Li, H.W.; Mao, N.; Wang, S.D. Experiment and research on drilling and subsoiling combined machine for no-tillage maize. J. Agric. Mech. Res. 2004, 163–166. [Google Scholar]
  49. Jin, T.; Zhang, Q.Z.; Guo, L.; Chang, Y.; Guo, Y.J.; Zhu, F.W.; Chen, D.H.; Liu, X. Compaction performance of biomimetic press roller to soil. J. Bionic Eng. 2015, 12, 152–159. [Google Scholar] [CrossRef] [Scilit]
  50. Luo, H.Q.; Gao, H.W. Study on combined press for permanent raised beds planter. J. Beijing Technol. Bus. Univ. (Nat. Sci. Ed.) 2008, 21–24. [Google Scholar]
  51. Liu, J.W. Development and Industrialization of Rapeseed Combined Seeder. Hunan Province: Nanxian Weiye Machinery Manufacturing Co., Ltd., 29 September 2018. Available online: https://kns.cnki.net/kcms2/article/abstract?v=tdDAU2ZCd1odL02o_lVIj3Uyw3KdKe1XwuTGrXq62EWZXr_n9no6GEJy_eUGp9loifNRdIezo05L3BrzpIGy7Ah2llyHfs0hNXjh7T-2sahDmxHmxbt6UYmHsooXY2ty2hBlg03yiiP4nGl5XGhLyGws_tkGCtZTDU_4JPQFFLY=&uniplatform=NZKPT&language=CHS (accessed on 23 April 2026).
  52. Xie, S.; Jiang, X. Parameter calibration of discrete element simulation model for red and yellow soil in southern China. Agric. Eng. Equip. 2023, 50, 44–49. [Google Scholar]
  53. GB/T 5262-2008; Agricultural Machinery Testing Conditions—General Rules for Measuring Methods. Standards Press of China: Beijing, China, 2008.
Figure 1. Schematic diagram of soil surface micro-topography processing device.
Agriculture 16 00994 g001
Figure 2. Force analysis of suppression parts.
Agriculture 16 00994 g002
Figure 3. Micro-structure Movement Trajectory and Micro-morphology Forming Process.
Agriculture 16 00994 g003
Figure 4. Quadrilateral shape soil surface micro morphology processing device.
Agriculture 16 00994 g004
Figure 5. Soil trough-soil surface micro-topography processing device model.
Agriculture 16 00994 g005
Figure 6. Simulation test of micro-morphology forming.
Agriculture 16 00994 g006
Figure 7. Field test prototype.
Agriculture 16 00994 g007
Figure 8. Simulate and test the movement of micro-topography machining device.
Agriculture 16 00994 g008
Figure 9. Vector diagram of three processes of soil under different loads: before burying, completely burying and unearthed. (a) Velocity vector diagrams during different stages (Prior to penetration; During penetration; Post-penetration) under a working load of 100 N. (b) Velocity vector diagrams during different stages (Prior to penetration; During penetration; Post-penetration) under a working load of 200 N. (c) Velocity vector diagrams during different stages (Prior to penetration; During penetration; Post-penetration) under a working load of 300 N.
Agriculture 16 00994 g009
Figure 10. Vector diagram of three processes of soil before burying, completely burying and unearthed at different working speeds. (a) Velocity vector diagrams during different stages (Prior to penetration; During penetration; Post-penetration) at a working speed of 0.2 m/s. (b) Velocity vector diagrams during different penetration stages (Prior to penetration; During penetration; Post-penetration) at a working speed of 0.3 m/s. (c) Velocity vector diagrams during different stages (Prior to penetration; During penetration; Post-penetration) at a working speed of 0.4 m/s.
Agriculture 16 00994 g010
Figure 11. Vector diagram of three processes of soil before burial, completely burial and excavation under different micro-structure heights. (a) Velocity vector diagrams during different stages (Prior to penetration; During penetration; Post-penetration) with a microstructure height of 35 mm. (b) Velocity vector diagrams during different stages (Prior to penetration; During penetration; Post-penetration) with a microstructure height of 40 mm. (c) Velocity vector diagrams during different stages (Prior to penetration; During penetration; Post-penetration) with a microstructure height of 45 mm.
Agriculture 16 00994 g011
Figure 12. Influence of various factors on the qualified rate of micro-morphology.
Agriculture 16 00994 g012
Figure 13. Effect diagram of field experiment.
Agriculture 16 00994 g013
Table 1. Main parameters of EDEM simulation.
Material properties of the soil bin (65Mn steel)Density ρ (kg/m3)7850
Shear modulus G (MPa)7.0 × 10⁴
Poisson’s ratio ν0.30
Soil intrinsic parametersSoil density ρ s (kg/m3)2650
Shear modulus G (kPa)1 × 10⁸
Poisson’s ratio ν0.36
Soil-to-65Mn contact parametersStatic friction coefficient μ210.40
Rolling friction coefficient μ20.04
Restitution coefficient e20.40
Soil-to-soil contact parametersJKR surface energy (J/m2)0.84
Static friction coefficient μ10.63
Kinetic friction coefficient μ110.46
Restitution coefficient e10.32
Table 2. Test factor level value.
LevelExperimental Factors
Working Load
A (N)
Working Speed
B (m/s)
Microstructure Height C (mm)
−11000.245
02000.340
13000.435
Table 3. Simulation experiment design.
NO.Experimental Factors
Working Load
A (N)
Working Speed
B (m/s)
Microstructure Height C (mm)
13000.3045
23000.2040
33000.4040
41000.3035
52000.4045
62000.4035
72000.3040
81000.3045
93000.3035
101000.4040
112000.2045
122000.3045
133000.3040
142000.2035
151000.3040
161000.2040
172000.3040
Table 4. Test results of micro-topographical qualification rate.
Trial No.Micro-TopographicalQualification Rate of Micro-Topographical
LengthWidthHeightLengthWidthHeightTotal (f1)
144.937.140.289.09%92.75%89.33%90.44%
245.542.138.987.91%95.01%97.25%93.20%
346.737.137.685.65%92.75%94.00%90.64%
442.537.233.294.12%93.00%94.86%93.95%
545.838.241.687.34%95.50%92.44%91.73%
645.638.338.687.72%95.75%90.67%91.42%
743.337.738.592.38%94.25%96.25%94.20%
842.737.241.993.68%93.00%93.11%93.27%
944.237.933.590.50%94.75%95.71%93.55%
1044.638.838.789.69%97.00%96.75%94.37%
1142.93843.593.24%95.00%96.67%94.88%
1243.838.648.591.32%96.50%92.78%93.57%
1343.438.536.892.17%96.25%92.00%93.55%
1441.838.334.695.69%95.75%98.86%96.66%
1543.74237.991.53%95.24%94.75%93.79%
1642.837.938.593.46%94.75%96.25%94.75%
1744.538.838.389.89%97.00%95.75%94.14%
Table 5. Variance analysis of quadratic term model for the qualification rate of objective function micro-morphology.
Source of VariationMean SquareDegrees of FreedomSum of SquaresF1 ValueP1 ValueSSA
model46.8595.2117.350.0005**
A3.2513.2510.830.0133*
B36.98136.98123.23<0.0001*
C2.7812.789.270.0187*
AB0.4910.491.630.242
AC0.0410.040.130.7258
BC0.1610.160.530.489
A22.4212.428.060.0251*
B20.3810.381.270.2978
C20.2710.270.920.3707
Residual2.170.3
Lack of Fit1.9860.332.630.4396
Pure Error0.1310.13
Total48.9516
R2 = 0.9571; R2adj = 0.9019; CV = 0.58%; Adeq precision = 15.564. Note: ** indicates that the term is highly significant (p < 0.01); * indicates that the term is significant (p < 0.05).
Table 6. Basic soil parameters.
Soil Depth (mm)Moisture Content/%Bulk Density (g·cm−3)Solidity/kPa
0~10017.521.13546
100~20020.151.55752
Table 7. Field test results of the test prototype before optimization.
NO.Micro-Topographical
Length/mmWidth/mmHeight/mmQualification Rate/%
144.7 ± 1.637.2 ± 1.736.4 ± 2.490.7
243.8 ± 1.837.5 ± 1.735.6 ± 2.991.0
343.2 ± 1.936.4 ± 2.035.2 ± 2.590.2
mean43.937.035.790.6
Table 8. Field test results of optimized test prototype.
NO.Micro-Topographical
Length/mmWidth/mmHeight/mmQualification Rate/%
143.5 ± 1.238.2 ± 1.839.6 ± 2.193.99
242.2 ± 1.737.8 ± 1.738.5 ± 2.093.4
342.8 ± 1.539.1 ± 1.839.2 ± 2.094.5
mean42.838.439.194.2
Table 9. Seedling emergence rate of rape seeds after machine operation.
Device TypeSeedling Emergence Rate (%)
123Average
Optimized device73.673.875.674.33
Device before optimization70.569.468.269.37
Disclaimer/Publisher’s Note: The statements, opinions and data contained in all publications are solely those of the individual author(s) and contributor(s) and not of MDPI and/or the editor(s). MDPI and/or the editor(s) disclaim responsibility for any injury to people or property resulting from any ideas, methods, instructions or products referred to in the content.