


Abstract
(1) Background: Soil fertility in organic systems depends on interactions between physicochemical properties and biological processes that regulate nutrient availability along the soil profile. However, information on their vertical distribution remains limited, particularly for root crops such as sugar beet. This study evaluated depth-related patterns in soils from three organic farms growing sugar beet. (2) Methods: Soil profiles (0–120 cm) were sampled and analyzed for physicochemical properties, mineral nitrogen (N) forms, and biological indicators, including the QBS-ar index, microbial abundance, and functional genes involved in N and carbon cycling. (3) Results: Nitrate-N and total mineral N were mainly concentrated in the 0–40 cm layer and declined markedly with depth. Microbial abundance and most N-cycling functional genes were similarly enriched in the topsoil, showing clear vertical stratification. Statistical analyses suggested that functional gene composition was associated with mineral N gradients after accounting for soil depth. (4) Conclusions: These findings provide an exploratory indication of relationships between mineral N forms and microbial indicators in an organically managed sugar beet system. Given the limited number of sampling units, results should be interpreted cautiously. However, these results highlight the value of soil profile approaches for understanding N redistribution and improving nutrient management strategies.
1. Introduction
Soil nitrogen (N) is highly dynamic in agroecosystems, and its efficiency depends on the synchronization between soil N supply and crop demand [1]. Insufficient N availability constrains crop growth, whereas excessive N inputs can promote nitrate accumulation in deeper soil layers and increase leaching risks, thereby generating agronomic and environmental pressures. Similar constraints may also arise from an imbalanced vertical distribution of mineral N within the soil profile [1,2]. Such profile-scale N imbalances are particularly critical in sugar beet (Beta vulgaris L.) production systems [3], as this crop can access N from deep soil layers through its taproot system, allowing continued uptake when topsoil N becomes limiting [4,5]. Consequently, the vertical distribution of mineral N becomes a key factor shaping sugar beet N uptake dynamics, highlighting the limitations of topsoil-based N assessment and the need for a profile-scale perspective [6,7].
As agriculture moves toward greener production systems and improved nutrient-use efficiency, N management has increasingly focused on regulating soil–plant interactions rather than solely controlling fertilizer inputs [8]. Within this framework, the concept of “soil health” has been proposed as an integrative framework to identify key physicochemical and biological constraints limiting crop production and nutrient availability [9]. In Europe, this concept has been incorporated into the EU Soil Strategy for 2030 and the proposed Soil Monitoring Law to promote indicator-based soil and nutrient management practices [10]. Previous field studies in sugar beet systems have also shown that improved coordination of N input with agronomic management can enhance N-use efficiency while maintaining crop performance under specific environmental conditions [11,12].
For sugar beet systems, the identification of profile-scale N constraints remains insufficiently understood, particularly where crop performance may be influenced by the vertical distribution of mineral N rather than by topsoil conditions alone. Profile-scale N constraints are expected to be particularly relevant under organic management, where N supplies rely on the mineralization of organic inputs, cover crops, and crop residues rather than on direct mineral fertilization. Because N release from organic sources is regulated by residue quality, microbial activity, and environmental conditions, the timing of N availability may not synchronize with crop demand during critical growth stages. Recent studies have demonstrated temporal asynchrony between soil N availability and crop N demand [13], highlighting the potential for mismatches between N supply and crop demand in biologically regulated systems. This mismatch is especially relevant when cover crops act as major N sources, as their contribution to the subsequent sugar beet crop depends on residue traits and decomposition dynamics that jointly control the magnitude and timing of N release [14]. Under these conditions, asynchronous N supply may promote the redistribution and persistence of mineral N along the soil profile [15,16], but integrated profile-scale assessments of mineral N distribution under organically managed sugar beet conditions remain scarce.
Given that sugar beet N availability is jointly regulated by soil profile processes and management practices, no single indicator can fully capture the N supply status. Profile-scale mineral N pools directly reflect N availability and potential risks at different depths, whereas environmental constraints modulate N transformation processes and root uptake. Biological indicators provide complementary ecological information on soil quality: the Soil Biological Quality index based on microarthropods (QBS-ar) is a soil-fauna-based indicator derived from the eco-morphological adaptations of soil microarthropod communities. The index integrates information on soil structural stability, aeration, and microhabitat conditions, thereby providing ecological context for interpreting variability in soil N availability and biologically mediated N turnover processes [17,18]. In this study, it was included to provide complementary ecological context rather than as a direct driver of microbial functional patterns. In addition, microbial functional genes involved in nitrification and denitrification provide process-oriented indicators of the potential for N transformation, offering a mechanistic basis for assessing the likelihood of N accumulation or loss across soil layers [19,20].
Based on this background, the present study focuses on a field-scale assessment of mineral N distribution and associated microbial indicators in organically managed sugar beet systems in the Veneto region (Northern Italy). Particular attention was given to the vertical organization of mineral N forms and microbial functional genes across the soil profile. Using a soil profile-scale approach, this study aimed to: (1) characterize the vertical stratification of mineral N along the soil profile; (2) evaluate the abundance of associated microbial functional genes; and (3) explore the relationships among soil properties, biological indicators, and N dynamics in organic sugar beet systems.
2. Materials and Methods
2.1. Study Area
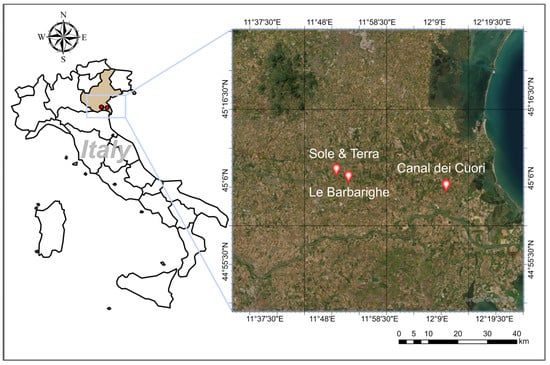
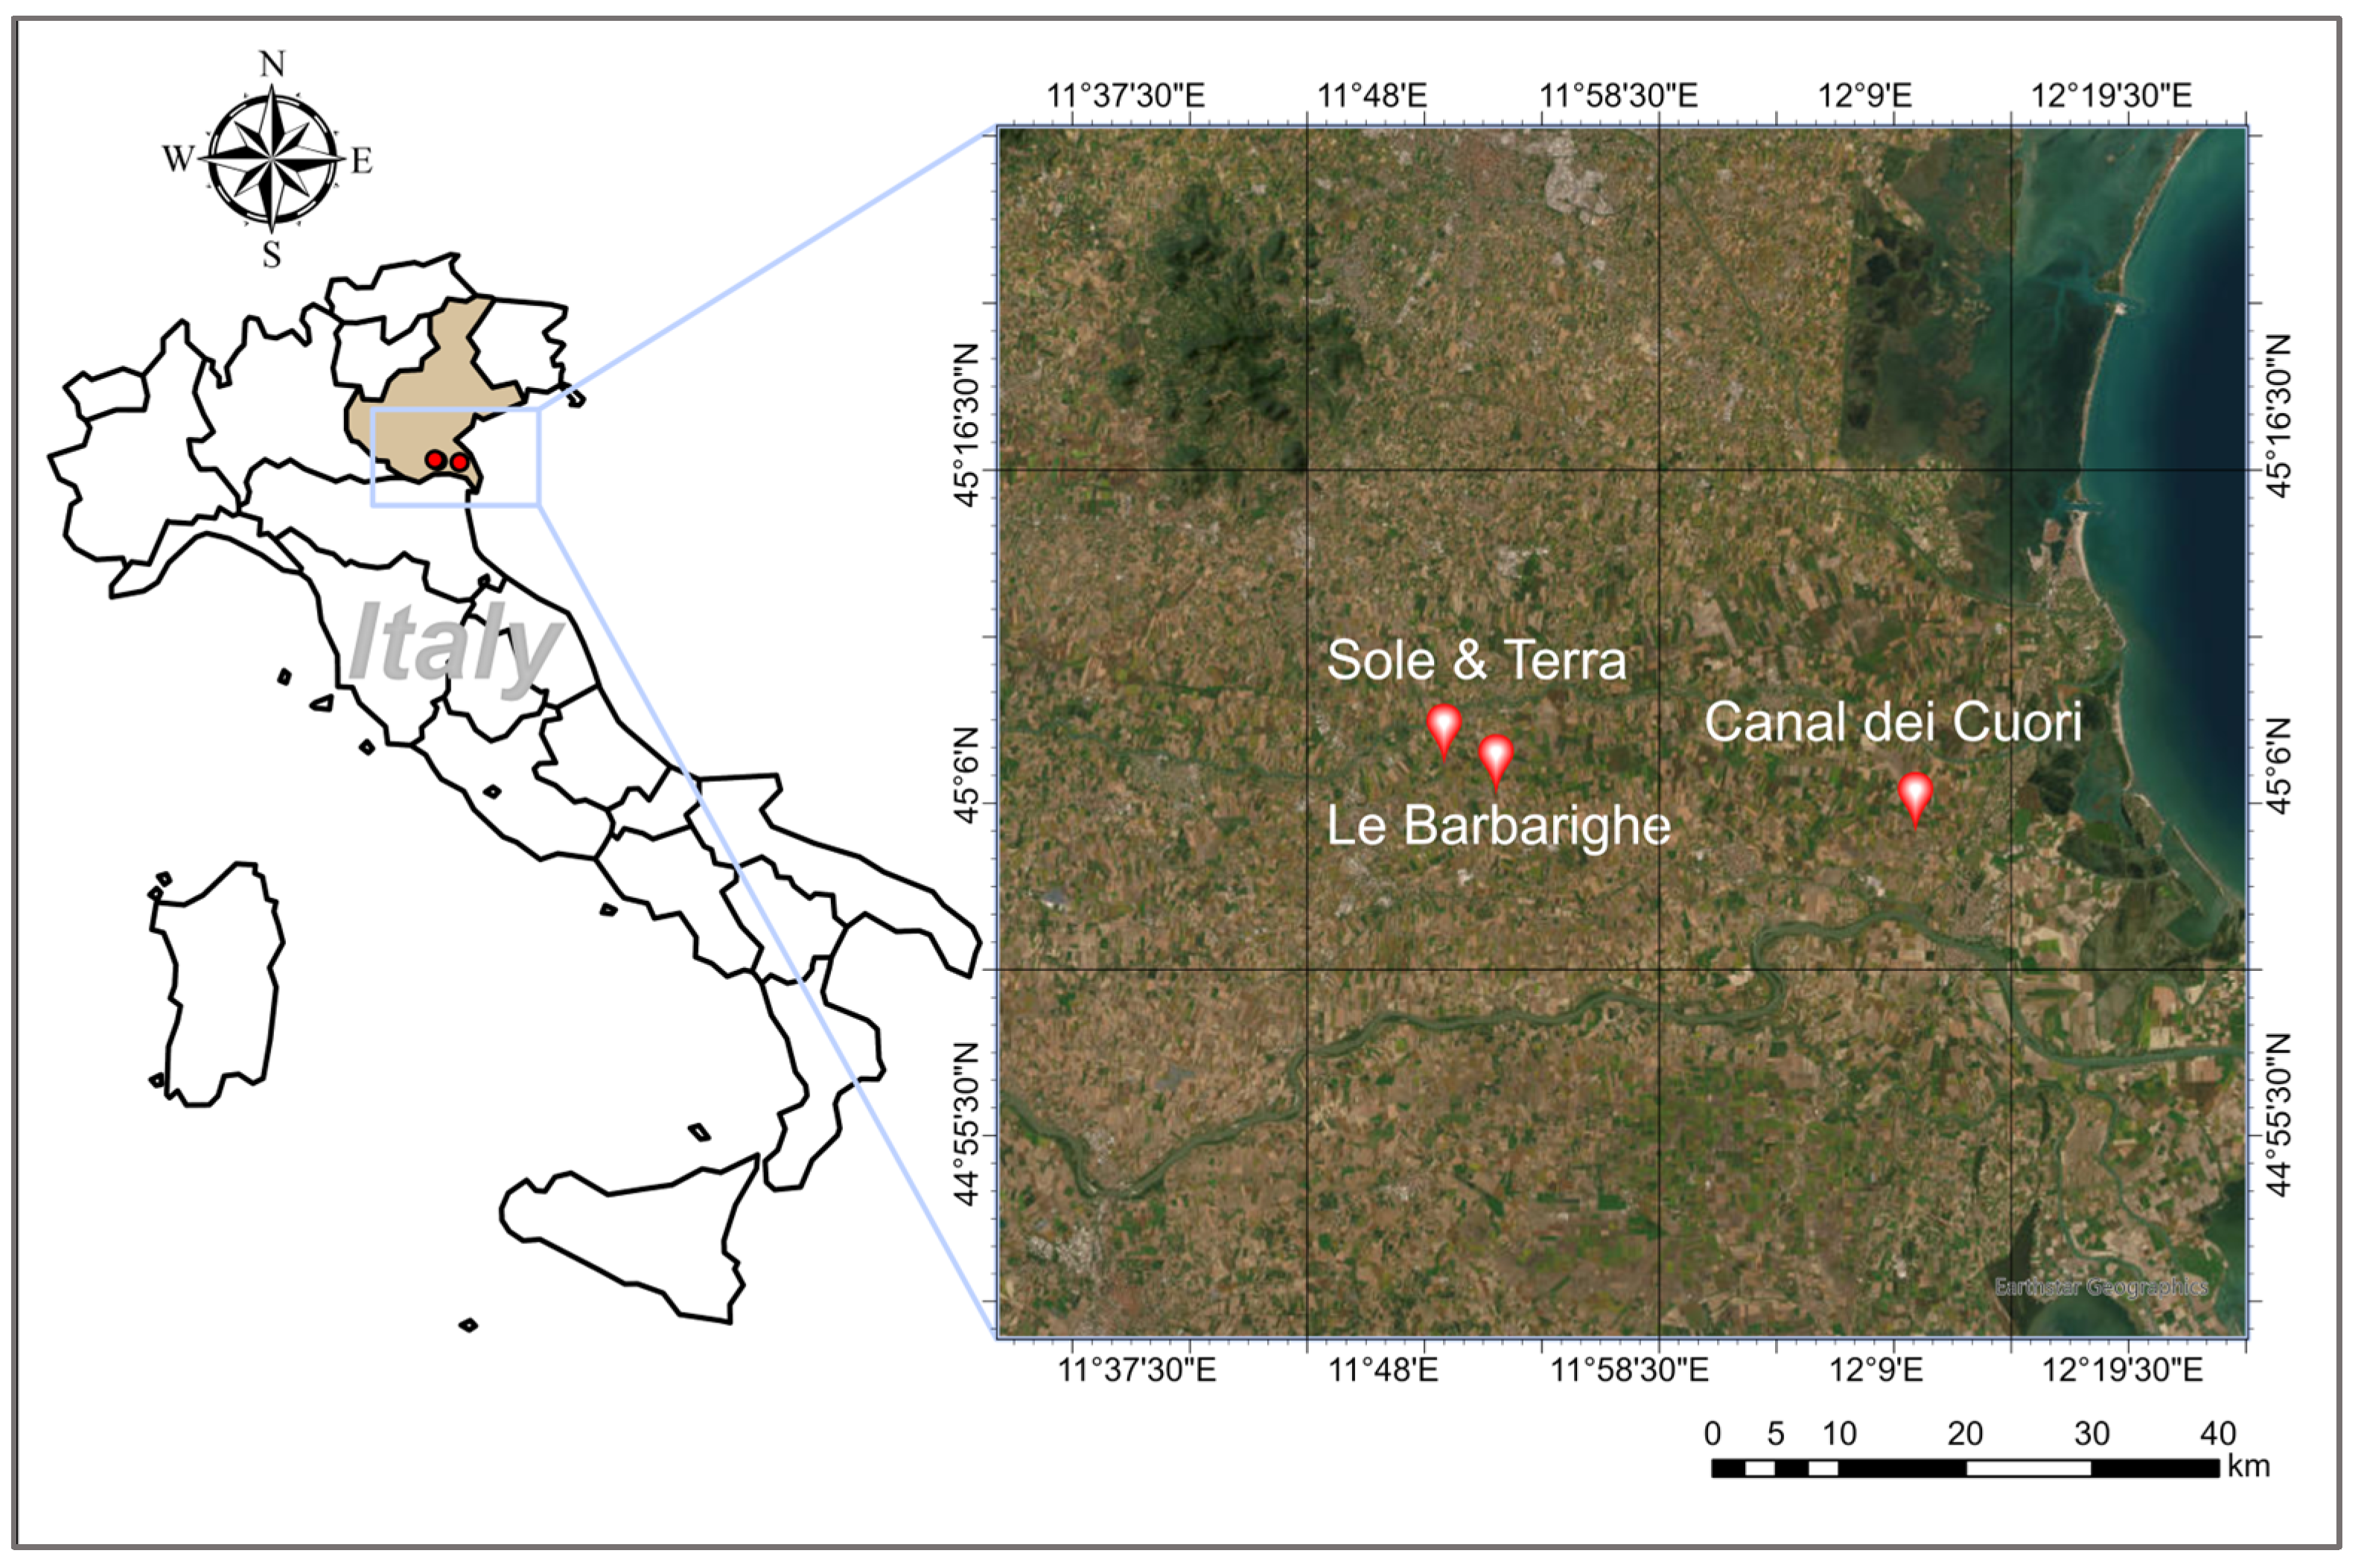
The study was conducted at three sugar beet farms located in the Province of Rovigo, within the Veneto Region: Le Barbarighe (45°06′10″ N, 11°53′03″ E), Sole & Terra (45°07′05″ N, 11°50′50″ E), and Canal dei Cuori (45°05′02″ N, 12°10′55″ E) (Figure 1). The area is characterized by a temperate climate and intensive agriculture, with soils predominantly developed on alluvial deposits from the Po and Adige rivers. The experimental design comprised four composite sampling units (S1–S4) distributed across the three farms.
Figure 1.
Geographic location of the three organic sugar beet farms in Rovigo Province (Veneto Region, northeastern Italy): Le Barbarighe (S1–S2), Sole & Terra (S3), and Canal dei Cuori (S4).
Le Barbarighe (S1 and S2) is situated on an ancient levee of the Po River. The soils are partially decarbonated with carbonate accumulation in the deeper horizons, exhibiting silty clay loam textures in the topsoil and fine silty textures at depth, and are poorly drained. They are classified as Endogleyic Hypocalcic Calcisols (Orthosiltic). Sole & Terra (S3) is located at the margin of a crevasse splay area in the recent Adige plain. Its soils display weak profile differentiation and a sandy texture throughout the profile, with moderately rapid drainage, and are classified as Haplic Fluvisols (Calcaric, Hypereutric, Orthoarenic). In contrast, Canal dei Cuori (S4) lies in a morphologically depressed area of the Po, where hydromorphic soils feature surface organic matter accumulation and buried organic horizons. The soils here have a silty clay loam texture in the topsoil and fine silty materials at depth, and are classified as Gleyic Phaeozems (Pachic, Orthosiltic) [21].
At Le Barbarighe, two adjacent field units under organic management but with contrasting tillage systems, conventional tillage (S1) and no tillage (S2), were selected. At Sole & Terra (S3) and Canal dei Cuori (S4), one representative field unit was selected at each farm. All selected fields had been managed under certified organic practices for more than 10 years and cultivated with sugar beet during the sampling year.
Fertility management in all farms relied on organic amendments, mainly composted manure derived from livestock manure and plant residues, applied according to farm-specific practices. Additional N inputs were provided through cover crops and crop residue incorporation. However, detailed long-term records of amendment composition and application rates were not fully available for all sites.
2.2. Soil Sampling and Experimental Design
Soil sampling was conducted in June 2025. Within each field unit, one composite sampling unit was established in a homogeneous area identified based on uniform crop growth, topography, and management history. Each composite sampling unit consisted of five sampling points arranged along a diagonal transect, with an inter-point distance of approximately 10 m, to cover a representative portion of the field. At each sampling point, soil was collected using a manual auger and sectioned in the field according to pedogenetic horizons rather than predefined fixed-depth intervals. Accordingly, the original sampled depth ranges differed among field units: 0–50, 50–80, and 80–120 cm in S1; 0–50, 50–80, and 80–120 cm in S2; 0–40, 40–90, and 90–120 cm in S3; and 0–50, 50–70, 70–100, and 100–120 cm in S4.
To facilitate comparison among sites, the original horizon-based measurements were subsequently harmonized into three common depth classes (0–40, 40–80, and 80–120 cm), selected to encompass the effective rooting zone of sugar beet and to capture potential contributions of subsoil N pools to crop N uptake [6]. When a target depth class overlapped more than one sampled layer, the corresponding value was calculated by thickness-weighted averaging according to the actual overlap between each original layer and the target interval, as follows:
where is the harmonized value for the target depth interval, is the measured value in the -th original sampled layer, and is the thickness of overlap (cm) between that layer and the target depth interval. This harmonization procedure applied thickness-weighted averaging based on overlapping intervals and is conceptually aligned with widely used soil profile harmonization methods for standardizing uneven depth intervals into common analytical layers for comparative analysis [22,23]. Although this harmonization was necessary to allow comparison among uneven soil profiles, it may have reduced the representation of fine-scale depth-related variability. For each standardized depth class, equal masses of soil from the five sampling points were pooled to form one composite sample. As a result, four independent composite sampling units (S1–S4) were obtained, each comprising three depth-specific subsamples. In total, twelve depth-specific composite soil samples were obtained (4 sampling units × 3 standardized depth layers).
The composite sampling unit (S1–S4) was considered the independent experimental unit, while soil depth (0–40, 40–80, and 80–120 cm) was treated as a within-unit repeated factor in the statistical analyses. Accordingly, the study was based on four independent composite sampling units, a limitation that should be considered when interpreting the statistical results. Fresh soil samples were gently homogenized and passed through a 2-mm sieve to remove roots and stones. Samples for mineral N determination were stored at 4 °C and extracted within 48 h after sampling. Samples for DNA extraction were stored at −20 °C until analysis, while samples for physicochemical analyses were air-dried and stored at room temperature.
2.3. Soil Quality Assessment Based on Soil Arthropods
For soil biological quality assessment, three topsoil clods (0–10 cm, excluding litter) were collected per composite sampling unit and processed using a Berlese–Tullgren extractor. Microarthropods were identified at group level and assigned eco-morphological index (EMI) scores according to the standardized QBS-ar protocol [17], and the QBS-ar values were calculated as the sum of EMI scores of all detected groups.
2.4. Soil Physicochemical Analysis
Soil pH and electrical conductivity (EC) were measured in a 1:2.5 (w/v) soil-to-deionized water suspension following standard procedures. Soil organic carbon (Corg) and total N (Ntot) percentages were also measured. Corg was measured using the ignition method with a Skalar Primacs ATC 100-IC-E analyzer (Skalar Analytical BV, Breda, The Netherlands). Ntot was determined using an automatic CNS analyzer (Vario Macro CNS, Elementar, Hanau, Germany). Available phosphorus (P) was measured using the Olsen method [24]. Exchangeable base cations (Ca2+, Mg2+, K+, and Na+) were determined by barium chloride extraction according to the Italian official analytical method established by Ministerial Decree (DM) 13 September 1999 and quantified by inductively coupled plasma optical emission spectrometry (ICP-OES) (Spectro Arcos MV, Spectro Ametek, Kleve, Germany) [25].
2.5. Mineral Nitrogen Determination
Fresh soil was extracted with 2 M KCl at a soil-to-solution ratio of 1:5 (w/v) [26]. Total extractable mineral N and mineral N forms, namely nitrate-N, nitrite-N, and ammonium-N, were determined in the resulting extracts. Soil suspensions were shaken for 1 h, filtered, and then analyzed using a continuous flow analyzer according to standard colorimetric methods [27]. Concentrations were expressed on a dry soil weight basis.
2.6. DNA Extraction and Quantitative PCR Analysis
Total soil DNA was extracted from 0.5 g of soil using a commercial soil DNA extraction protocol. Quantitative PCR (qPCR) was used to quantify functional genes associated with microbial N cycling (amoA_Archaea, amoA_Bacteria, nifH, nirK, and nosZ), together with gh48 and NRPS1, as complementary markers of broader microbial functional potential. Amplifications were performed using SYBR Green intercalating agent on a real-time PCR system. Each reaction was conducted in triplicate, and standard curves were generated using serial dilutions of plasmids containing the target gene fragments. Gene copy numbers were expressed per gram of dry soil. In this study, functional gene abundance was used as a proxy for microbial functional potential and not as a direct measurement of actual N transformation rates. Primer sets and amplification conditions were as previously established [28,29,30].
2.7. Statistical Analysis
All statistical analyses were conducted using SPSS 25.0 (IBM Corp., Armonk, NY, USA) and R version 4.4.2. Prior to analysis, data were examined for normality and homoscedasticity using the Shapiro–Wilk and Levene tests, respectively. When necessary, variables were log10-transformed to improve distributional properties. The composite sampling unit (S1–S4) was treated as the independent unit of observation, and results are presented as means ± standard deviation (SD) unless otherwise stated.
Pearson correlation analysis was used to assess pairwise relationships among soil physicochemical properties, mineral N forms, and functional gene abundances. To reduce the risk of Type I errors associated with multiple testing, p-values were adjusted using the false discovery rate (FDR) procedure, and significance was accepted at adjusted p < 0.05. Correlation analysis was used as an exploratory approach to identify associations within the dataset rather than to infer causal relationships.
Partial redundancy analysis (pRDA) was performed in R using the vegan package, with soil depth treated as a conditioning variable to account for vertical stratification effects. Given the limited number of independent composite sampling units, pRDA was also used as an exploratory multivariate approach. Therefore, statistical results should be interpreted cautiously and viewed as pattern-oriented rather than confirmatory, highlighting relationships that may warrant further investigation in larger datasets.
All figures were generated using Origin 2021 (OriginLab Corp., Northampton, MA, USA) and R version 4.4.2 (R Foundation for Statistical Computing, Vienna, Austria).
3. Results
3.1. Topsoil Physicochemical and Biological Properties
Topsoil across the study area was consistently alkaline and non-saline, with pH values ranging from 8.1 to 8.4, while EC remained below 0.20 mS cm−1 at all sites (Table 1). Despite marked differences in particle-size distribution among sampling sites, the soils were generally characterized by moderate to high sand contents (37–77%) and relatively low clay contents (14–38%).
Table 1.
Physicochemical and biological properties of topsoil (0–40 cm) of each sampling unit (S1–S4).
Corg and Ntot varied among sites, with higher values in S1 and S2 than in S3 and S4. Olsen P concentrations were relatively similar across sites. Exchangeable K, Ca, and Mg, together with the derived cation ratios (Mg/K and Ca/Mg), were measured at all sites and are reported as background indicators of topsoil chemical conditions within the study area. Overall, physicochemical conditions generally fell within ranges reported as suitable for sugar beet cultivation in the literature.
The QBS-ar index ranged from 110 to 172 across sampling units. S4 showed the highest value (172), whereas S3 had the lowest (110). S1 and S2 shared the same intermediate QBS-ar value (140).
3.2. Vertical Distribution of Mineral Nitrogen Forms and Total Mineral N
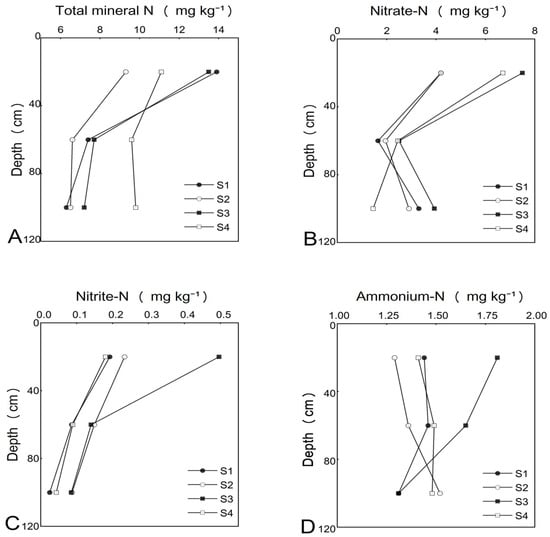
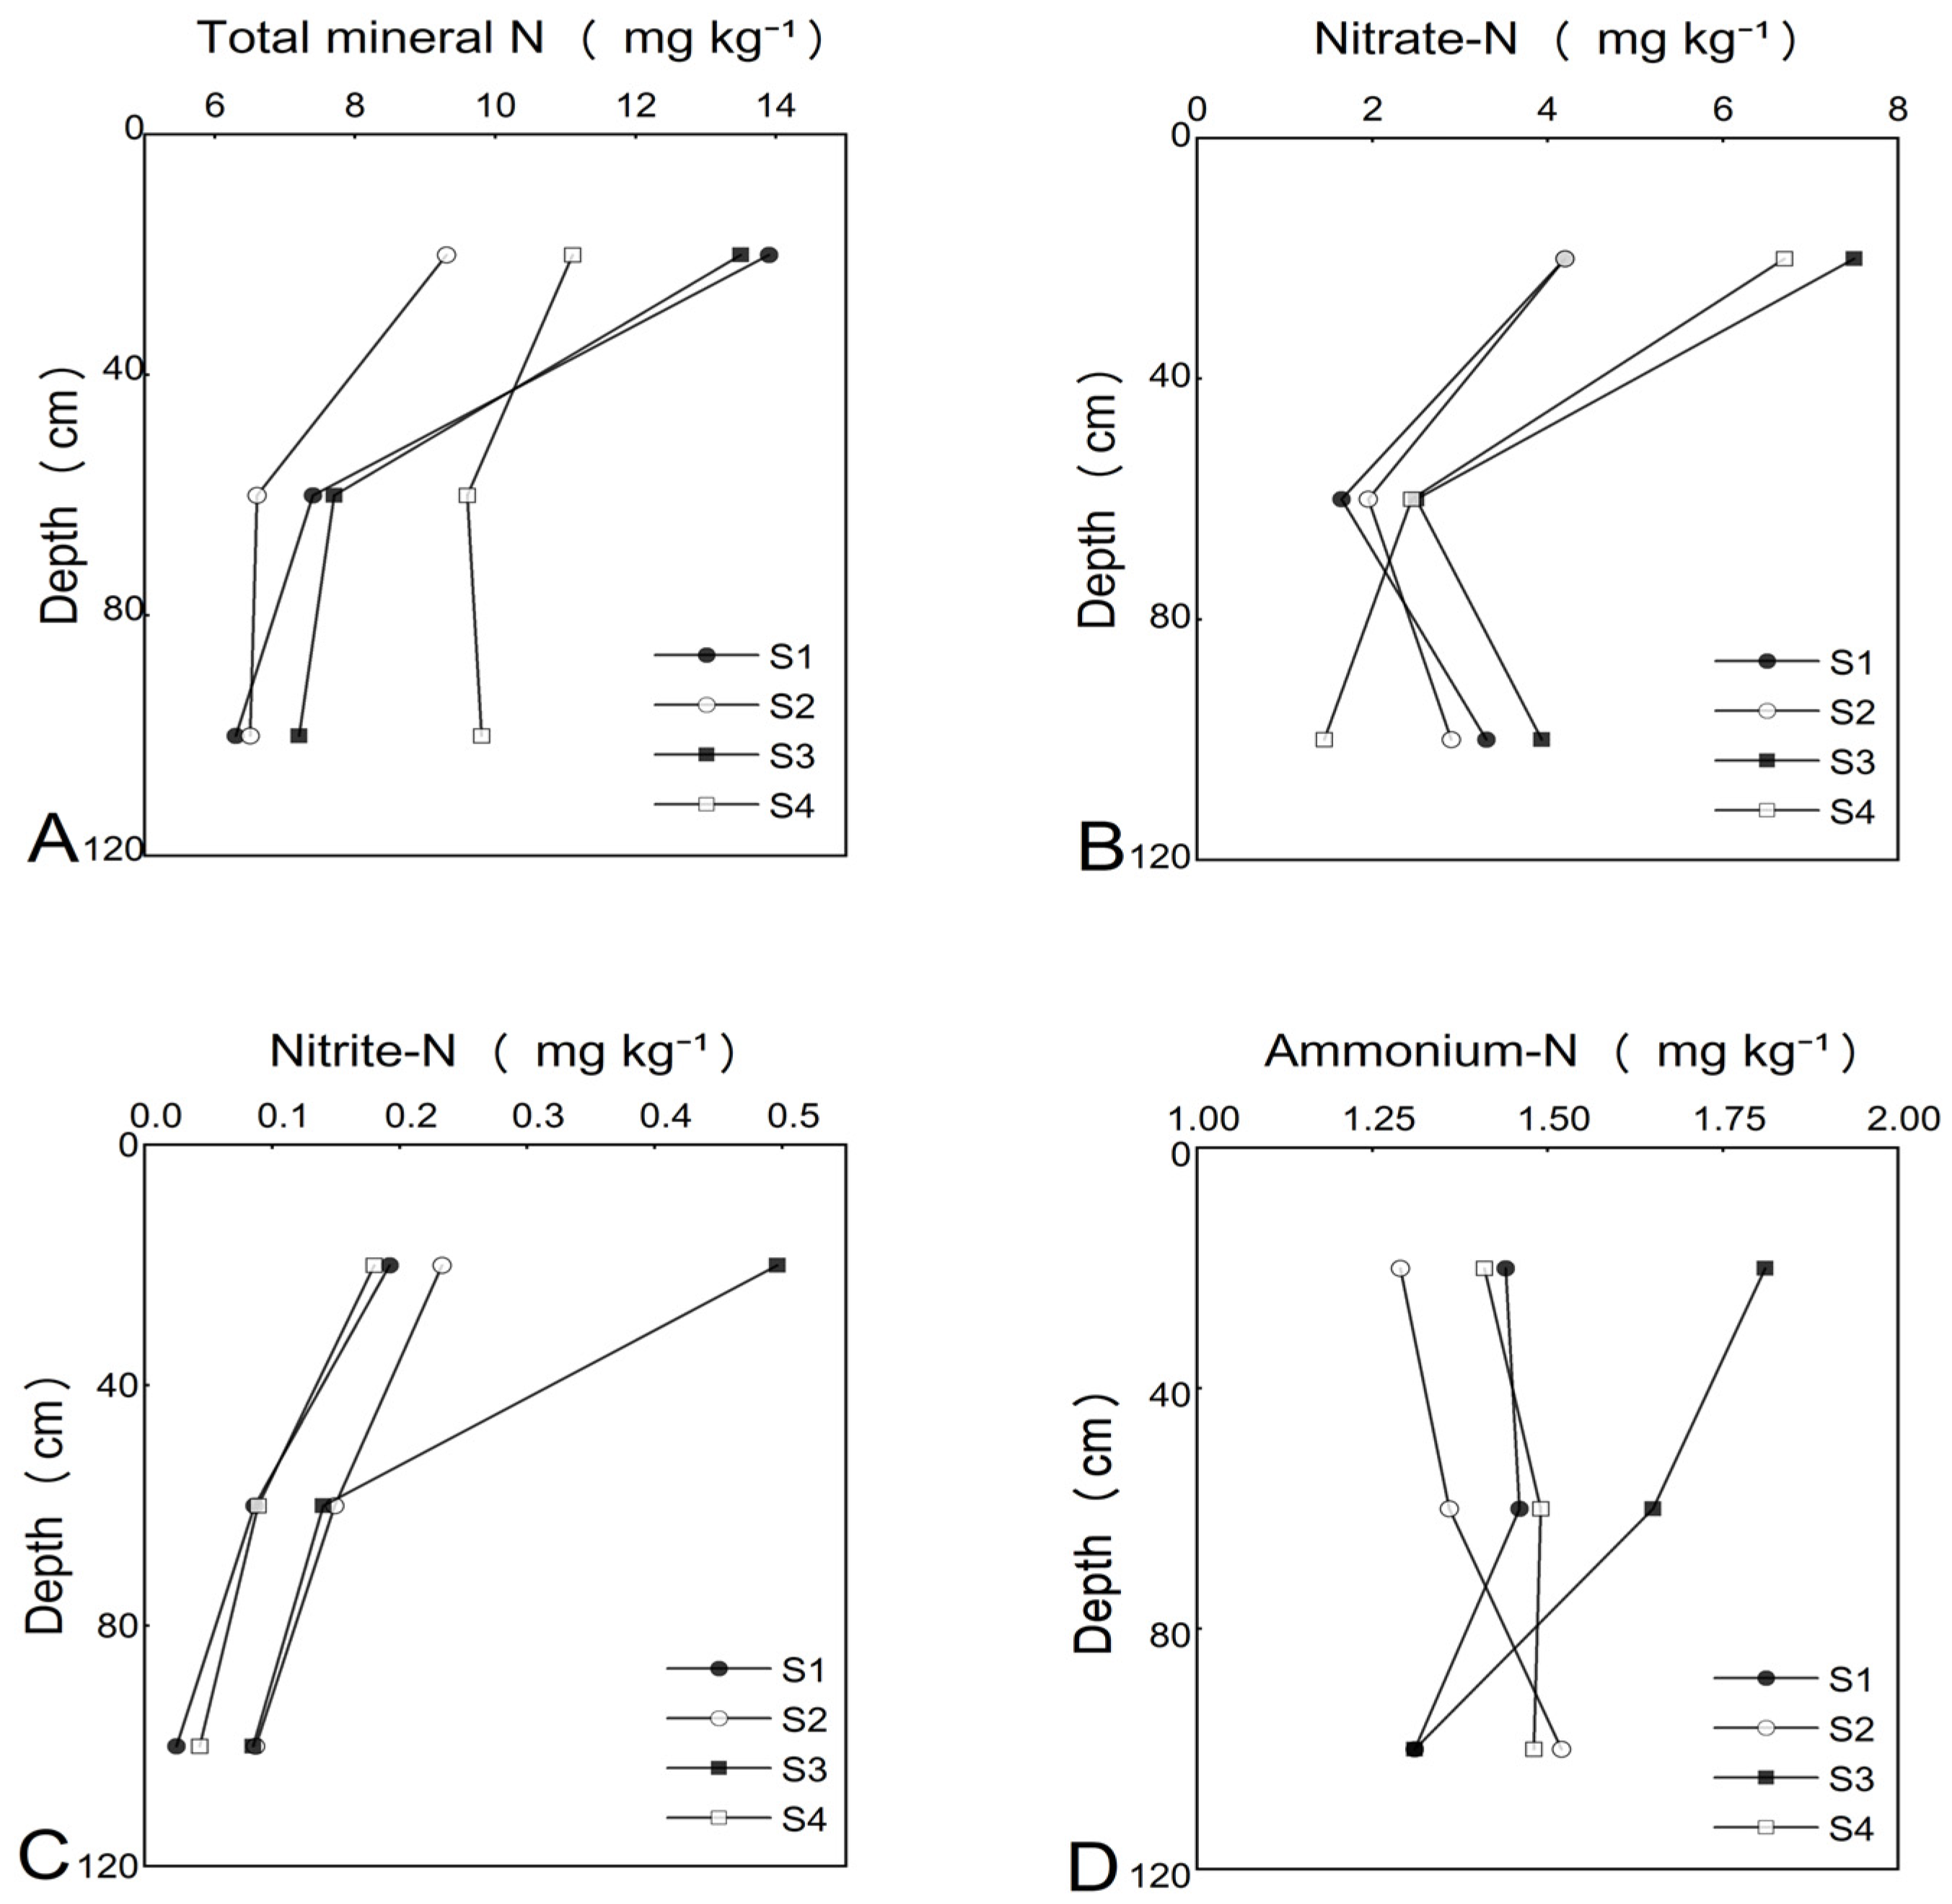
Total mineral N represents the combined concentration of extractable mineral N forms, including nitrate-N, nitrite-N, and ammonium-N. Mineral N forms exhibited clear vertical gradients along the 0–120 cm soil profile (Figure 2 and Table 2). Pooled layer-wise means and farm-specific means (S1–S4) revealed variability in mineral N profile shape among farms (Figure 2 and Table 2).
Figure 2.
Vertical distribution (0–120 cm) of mineral N forms across the studied farms (S1–S4). Panels show (A) total mineral N, (B) nitrate-N, (C) nitrite-N, and (D) ammonium-N (mg kg−1). Symbols represent farm-specific mean values for each standardized depth interval (0–40, 40–80, and 80–120 cm). Lines connect depths within the same farm to illustrate profile trends.
Table 2.
Soil physicochemical properties and mineral N forms across soil layers (0–120 cm). Values represent pooled means ± standard deviation across sampling sites.
Distinct vertical differentiation was observed among individual mineral N forms (Figure 2; Table 2). Nitrate-N showed the most evident depth pattern, with pooled means decreasing from 5.65 ± 0.85 mg kg−1 at 0–40 cm to 2.14 ± 0.20 mg kg−1 at 40–80 cm, and 2.90 ± 0.53 mg kg−1 at 80–120 cm (Table 2). Consistent patterns were observed across farms, with higher nitrate-N concentrations in the topsoil and site-dependent variability in the deepest layer (Figure 2B). In contrast, nitrite-N concentrations were low throughout the profile and decreased with depth, from 0.28 ± 0.07 to 0.06 ± 0.02 mg kg−1 (Table 2 and Figure 2C). Ammonium-N varied only marginally among depth layers and remained relatively stable across the entire profile, ranging from approximately 1.41–1.49 mg kg−1 (Table 2 and Figure 2D).
The vertical distribution of total mineral N closely mirrored that of nitrate-N, with oxidized N forms dominating depth-related variability in mineral N (Figure 2 and Table 2). Total mineral N was highest in the topsoil, at 11.95 ± 1.08 mg kg−1 at 0–40 cm, and decreased to 7.83 ± 0.64 mg kg−1 and 7.45 ± 0.81 mg kg−1 at 40–80 cm and 80–120 cm, respectively (Table 2). Absolute levels differed among farms, but the overall depth pattern was broadly comparable (Figure 2A).
3.3. Distribution Patterns of Microbial Functional Genes
The selected gene panel included markers related to N transformation processes, microbial abundance, and broader microbial functional potential.
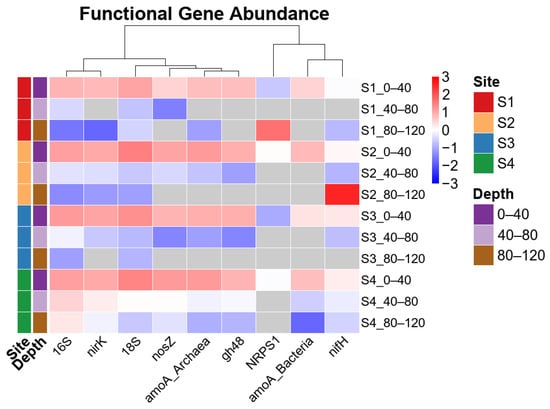
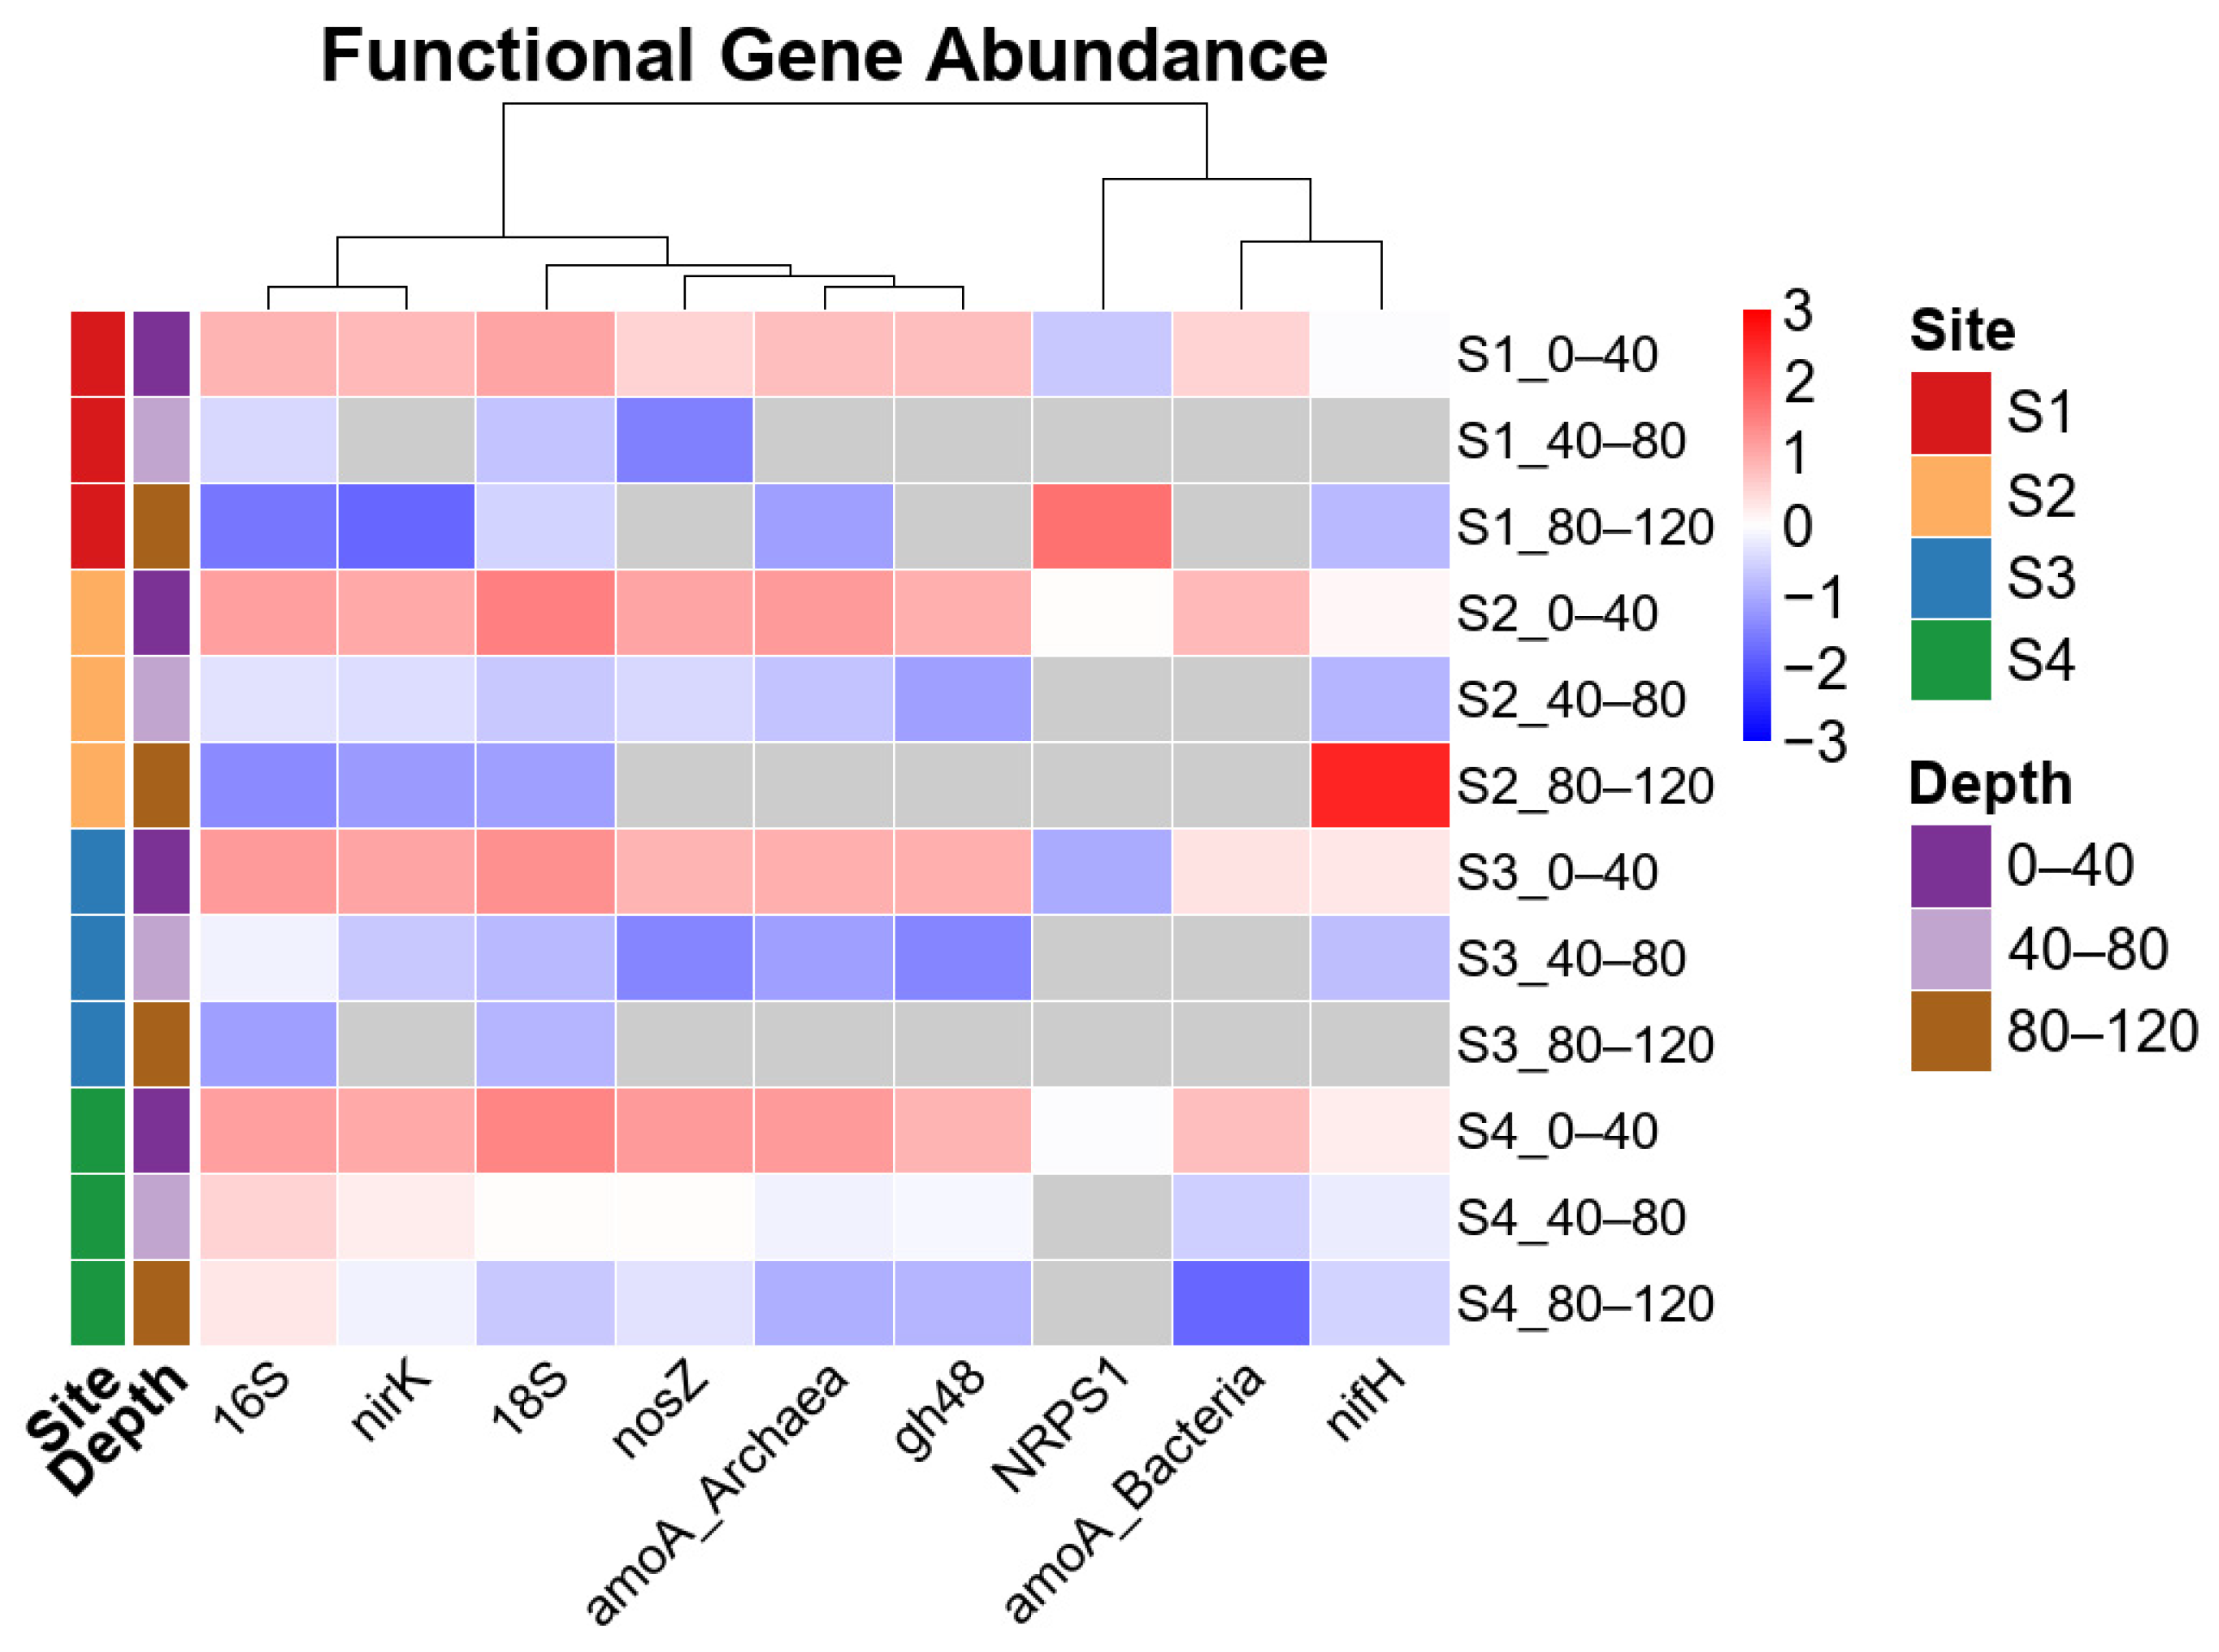
The overall distribution of microbial functional genes was primarily structured by soil depth, whereas differences among farms played a comparatively weaker role (Figure 3). Following log10 transformation and row-wise standardization of gene copy numbers, most functional genes exhibited higher relative abundances in the topsoil (0–40 cm), with progressively lower values in the 40–80 cm and 80–120 cm layers.
Figure 3.
Heatmap showing the distribution of microbial functional gene copy numbers across soil samples from the three organic farms. Colors represent log10-transformed gene copy numbers standardized within each gene (row-wise scaling). Columns correspond to farm × depth combinations (0–40, 40–80, and 80–120 cm), and rows represent individual genes including microbial abundance markers (16S and 18S rRNA) and N- and carbon-cycling genes.
N-cycling genes, including nifH, nirK, and nosZ, generally displayed clear depth-dependent declines across all farms. Although minor site-specific variations were observed, their vertical patterns were highly consistent, with the lowest relative abundances typically detected in deep soils. Nitrification-related genes (amoA_Archaea and amoA_Bacteria) exhibited similar depth-related responses, albeit with slightly greater variability among farms.
Ribosomal gene markers (16S and 18S rRNA) showed comparatively weaker but still discernible depth gradients, characterized by relatively higher standardized abundances in the topsoil and gradual decreases with increasing soil depth.
Hierarchical clustering further revealed two primary functional modules. The majority of N-cycling genes, together with the cellulolytic gene gh48, formed a dominant cluster characterized by strong depth stratification. In contrast, NRPS1 grouped with nifH and amoA_Bacteria, forming a distinct sub-cluster that exhibited site-specific variability and a less uniform vertical decline.
Overall, soil depth exerted a stronger influence on the distribution of microbial functional genes than differences among farms.
3.4. Soil Properties, Mineral Nitrogen and Microbial Indicator Correlation
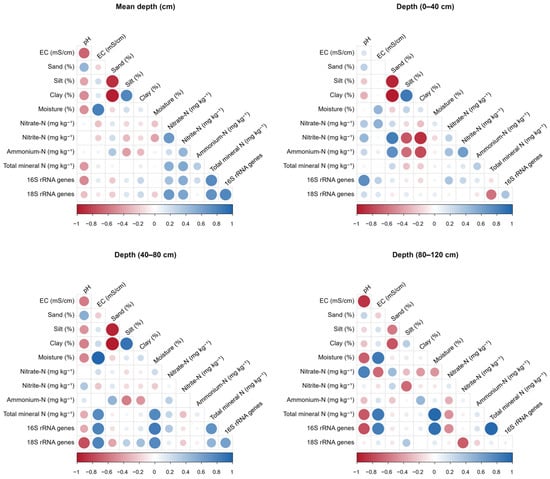
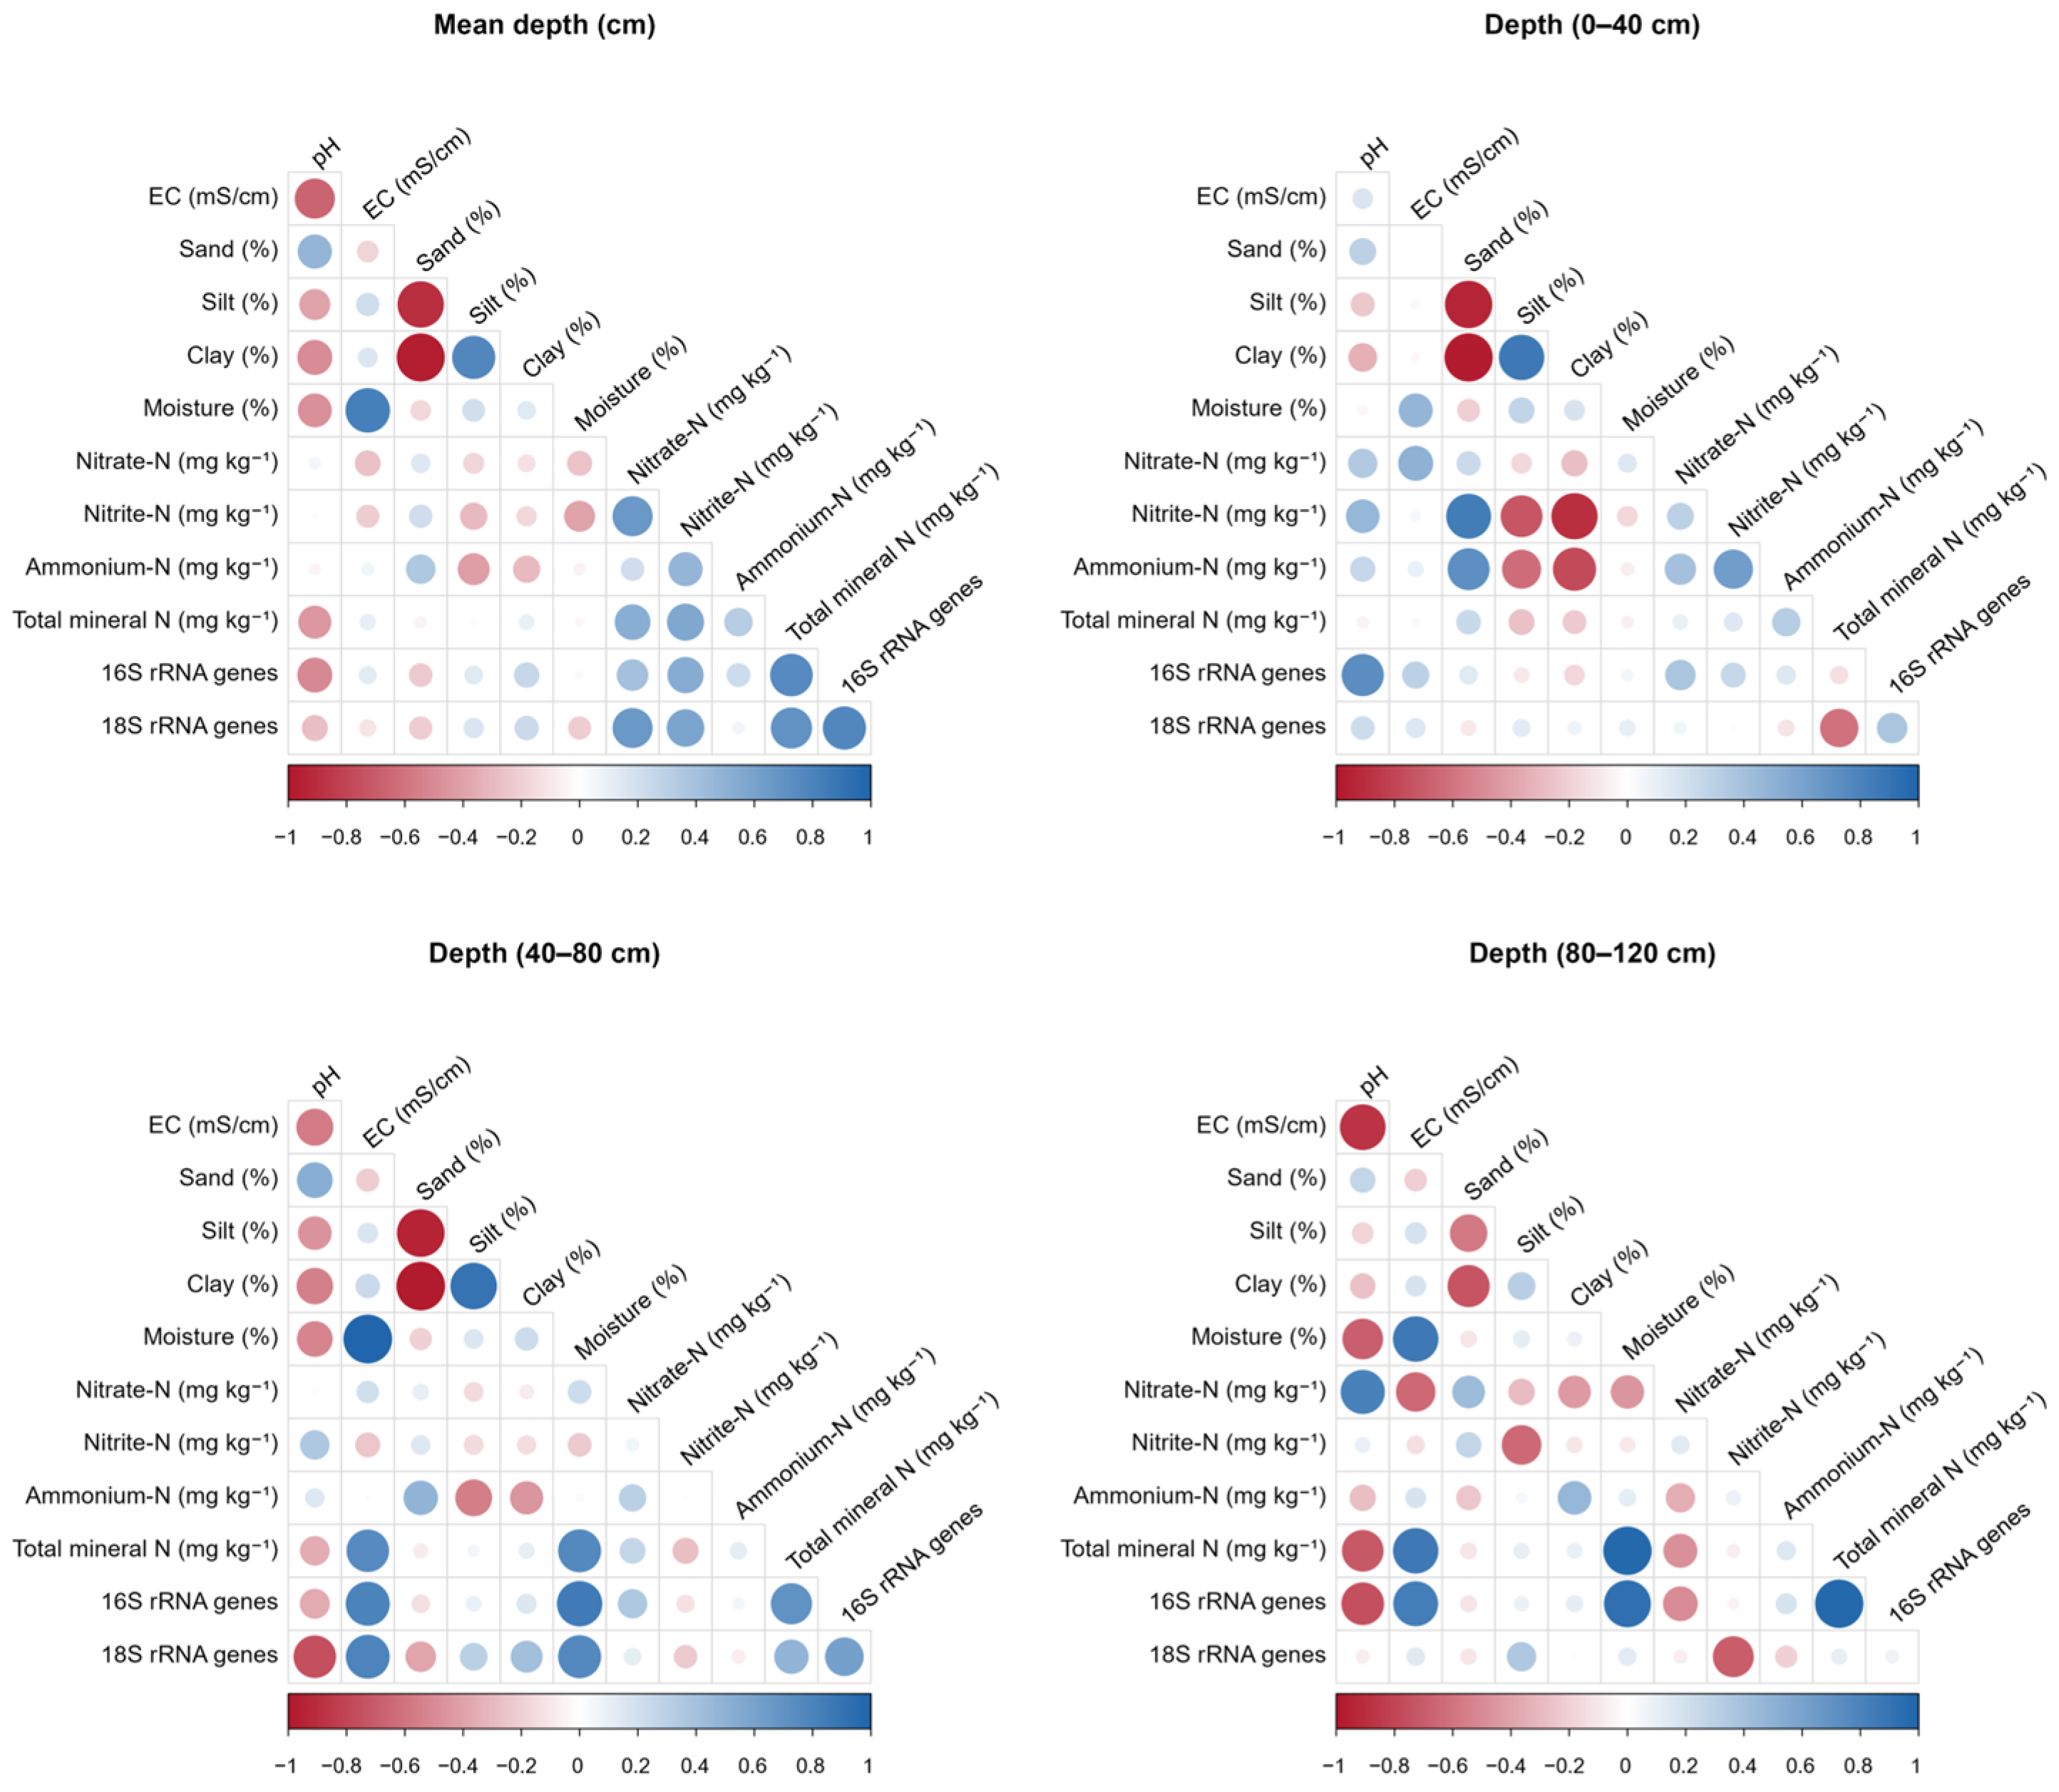
Pearson correlation analysis revealed consistent relationships among soil physicochemical properties, mineral N forms, and microbial indicators (Figure 4). Strong correlations were observed among soil texture components, with sand content negatively correlated with silt and clay fractions, while silt and clay were positively correlated with each other. Soil moisture content was positively associated with finer particle fractions.
Figure 4.
Pearson correlation matrix showing relationships among soil physicochemical properties, mineral N forms, and microbial abundance indicators (16S and 18S rRNA gene copy numbers). Circle color and size indicate the direction and magnitude of correlations (blue = positive, red = negative; larger circles indicate stronger correlations). Significance was assessed using FDR-adjusted p-values (p < 0.05).
Among mineral N forms, nitrate-N showed positive correlations with total mineral N and soil moisture, whereas ammonium-N exhibited weaker and less consistent relationships with other N forms. Microbial abundance indicators, represented by 16S and 18S rRNA gene copy numbers, were positively correlated with total mineral N and soil moisture at the whole-profile scale. These correlations describe whole-profile associations and should not be interpreted as evidence of direct mechanistic relationships.
3.5. Environmental Drivers of Nitrogen-Cycling Functional Genes
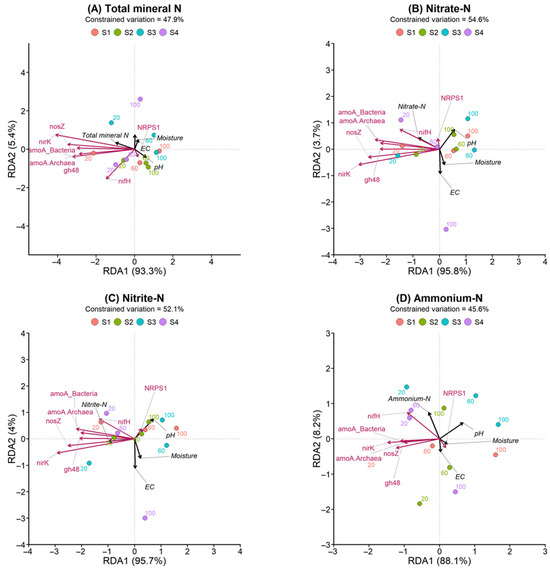
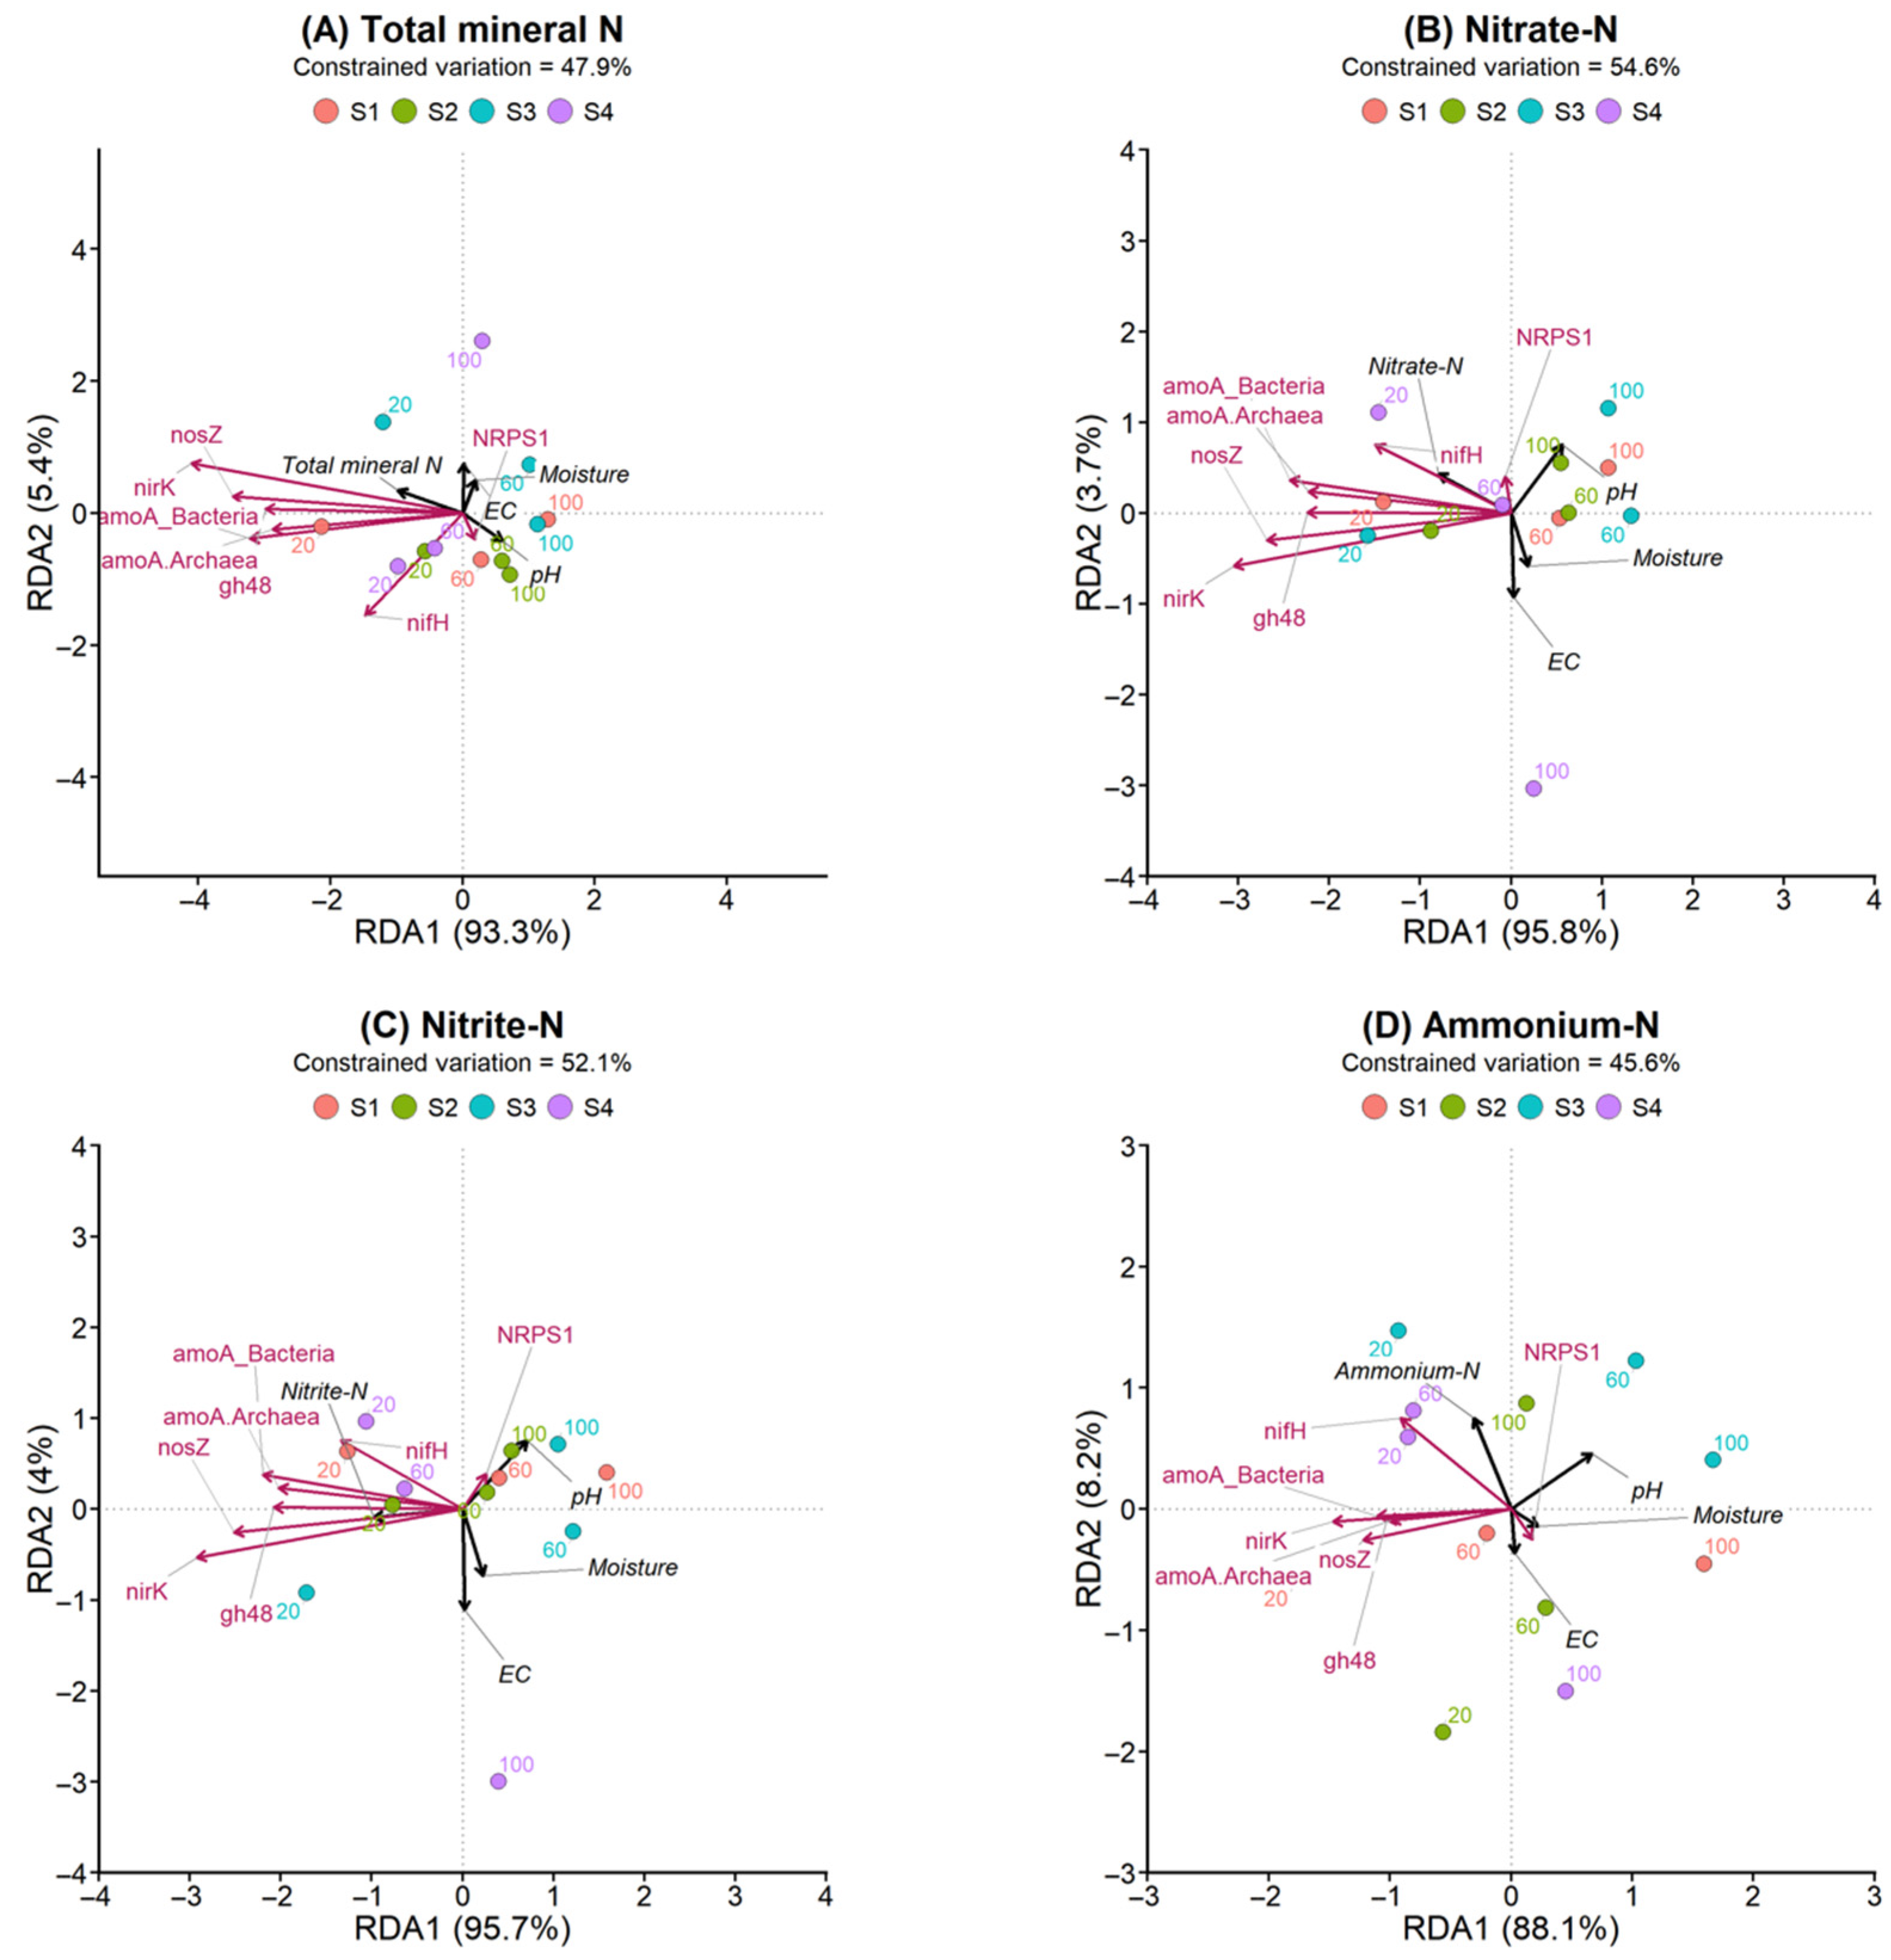
Partial redundancy analysis (pRDA) performed after conditioning on soil depth showed that environmental variables explained 45.6–54.6% of the variation in N-cycling functional gene composition across the four models (Figure 5). In all cases, RDA1 accounted for most of the constrained variation (88.1–95.8%), whereas RDA2 explained only a small proportion (3.7–8.2%). The primary ordination axis was characterized by EC and pH on the positive side and by several functional genes on the negative side.
Figure 5.
Partial redundancy analysis (pRDA) ordinations showing relationships between soil physicochemical variables and N-cycling functional genes after accounting for the effect of soil depth (conditioning variable). Panels correspond to models including (A) total mineral N, (B) nitrate-N, (C) nitrite-N, and (D) ammonium-N. Black arrows represent soil physicochemical variables, and magenta arrows represent functional genes. Sample labels 20, 60, and 100 correspond to the standardized depth classes 0–40, 40–80, and 80–120 cm, respectively. Arrow directions indicate correlations with ordination axes, whereas arrow lengths represent relative contributions to the ordination space.
Functional genes showed consistent positioning in the ordination space across the four models. Genes such as nirK, nosZ, gh48, and amoA_Bacteria were consistently oriented toward the negative side of RDA1, whereas NRPS1 was positioned closer to the ordination center or toward the positive side of RDA1, in the direction of EC and moisture. amoA_Archaea was also generally distributed on the negative side of RDA1, while nifH tended to occupy an intermediate position, often shifted toward the upper-left sector of the ordination space. Among the mineral N variables, total mineral N, nitrate-N, and ammonium-N showed similar orientations toward the upper-left sector of the ordination space, corresponding to negative RDA1 and positive RDA2, whereas nitrite-N was distinguished by a more separate position within the left-hand sector of the ordination space. Along RDA2, pH was mainly associated with the positive side, whereas EC was consistently aligned with the negative side.
Sample scores were distributed along these gradients with a recognizable depth-related tendency. Samples labeled 20, 60, and 100, corresponding to the standardized depth classes 0–40, 40–80, and 80–120 cm, respectively, showed vertical separation in the ordination space, with 20 cm samples more frequently occurring in the upper part of the plots, 60 cm samples occupying intermediate positions, and 100 cm samples more often located in the lower part of the plots. Overall, EC, pH, and the mineral N variables included in each model were the variables most clearly aligned with the main ordination structure, whereas the separation among samples remained broadly consistent with soil depth despite conditioning on this factor. Given the limited number of independent sampling units, these pRDA results are presented as exploratory evidence of structured associations rather than as confirmatory relationships.
4. Discussion
Overall, this study indicates a vertically stratified soil system across the 0–120 cm profile. Along this gradient, mineral N, microbial abundance, and functional gene potential exhibited clear depth-related patterns. Mineral N was primarily concentrated in the 0–40 cm layer, whereas the abundances of bacterial and fungal marker genes, as well as most N-cycling functional genes, declined markedly with depth. Correlation analysis and pRDA further pointed to a scenario in which these biological patterns are associated not only with soil depth but also with mineral N forms and physicochemical variables. Collectively, these findings are consistent with a pattern whereby mineral N and microbial functional potential were concentrated in the upper soil layer, whereas evidence for pronounced nitrate accumulation in deeper layers was limited within the sampled profile.
The observed vertical differentiation of mineral N aligns with current understanding of nitrate mobility in agricultural soils. Nitrate, being highly soluble and readily transported downward, can accumulate in subsoil layers under sustained or excessive N inputs, forming deep residual N pools and posing long-term risks to groundwater quality [31,32,33]. In the present system, however, mineral N was largely confined to the upper 40 cm, with concentrations generally remaining low throughout the 40–120 cm interval. This pattern may reflect the combined effects of lower N input intensity, slower nutrient release from organic sources, and enhanced biological immobilization and turnover in the topsoil. The overall low total mineral N status across the profile supports the interpretation that the system had relatively low mineral N availability at the time of sampling, consistent with a shallow redistribution pattern rather than deep nitrate reservoir formation. This distinction is critical: increasing evidence shows that once deep nitrate storage is established, it may persist as a “legacy pool” that continues to leach downward and affect groundwater over multi-year timescales, even after management practices improve [33,34,35]. These patterns may also be partly crop-specific, as differences in rooting depth, nutrient uptake strategy, and harvested organs could influence soil N redistribution and associated microbial responses [36].
In contrast, ammonium-N exhibited a comparatively more stable distribution across the soil profile, reflecting its lower mobility and greater affinity for the soil exchange complex. Higher concentrations of exchangeable Ca and Mg in the topsoil, together with differences in cation balance, may contribute to greater aggregate stability and CEC, thereby potentially promoting the temporary retention of in the upper layer and retarding its downward movement relative to nitrate [37,38,39]. Thus, compared with nitrate-N, which more clearly reflects redistribution processes at the profile scale, ammonium-N appears to represent a locally buffered N pool, strongly influenced by exchange processes and microsite conditions.
This chemical stratification was accompanied by clear biological stratification. Higher abundances of 16S and 18S rRNA genes in the topsoil, together with their rapid decline with depth, suggest that microbial biomass and biological activity were primarily concentrated in the upper layer. The parallel decline in gh48 abundance further suggests that the input of available carbon substrates decreased with depth, likely reducing substrate supply for heterotrophic metabolism and potentially constraining microbially mediated N turnover. In this context, gh48 should be interpreted mainly as a marker associated with cellulolytic activity and the degradation of plant-derived carbon substrates. Its relationship with mineral N dynamics is therefore likely indirect, being mediated by carbon availability and heterotrophic microbial activity. Such enrichment in the topsoil aligns with previous studies showing that soil depth acts as a major ecological filter for microbial communities by simultaneously altering root influence, organic matter supply, redox heterogeneity, and pore connectivity [40,41,42,43]. The depth-related variation in amoA_Archaea, amoA_Bacteria, nirK, and nosZ further supports this interpretation, indicating the potential for both nitrification and denitrification was concentrated primarily in the upper soil, where substrate availability and microbial activity most strongly overlapped. Although S1 and S2 differed in management regime, the overall vertical organization of mineral N and functional genes remained broadly similar, suggesting that, within this dataset, soil depth was a stronger determinant of profile-scale N dynamics than management differences per se. In this regard, it should be noted that the absence of uncultivated and conventionally managed control soils limits the ability to attribute the observed patterns specifically to organic farming practices. Therefore, the results should be interpreted as descriptive of the studied systems rather than as evidence of management effects and should not be generalized to other farming systems.
Against this backdrop, the correlation analysis illustrates the association between physicochemical habitat and biological activity across the profile. The negative correlations of sand with silt and clay, along with the positive association between finer particle fractions and moisture, reflect the well-established role of texture on water retention and habitat stability. These physical properties do not merely constitute background conditions; they can also shape substrate diffusion pathways, oxygen supply, and the maintenance of microenvironments favorable for microbial transformation processes. Within this framework, nitrate-N was more closely related than ammonium-N to total mineral N and moisture, suggesting that nitrate better captures the more mobile and integrative component of mineral N variation across the profile. By contrast, the weaker and less stable correlations involving ammonium-N are consistent with its retention on exchange sites and stronger dependence on local microscale conditions. The positive correlations of 16S and 18S abundances with moisture and total mineral N suggest that shared environmental drivers in the topsoil simultaneously favored microbial abundance and mineral N availability, rather than being linked through a simple unidirectional causal relationship. Similar coupling patterns have been reported in profile-based and long-term agricultural studies, where moisture, texture, and substrate supply jointly shape whether mineral N remains closely aligned with microbial functional potential or becomes partly decoupled at greater depth [43,44,45].
According to the pRDA, even after accounting for soil depth, environmental gradients still explained a substantial proportion of the variation in N-cycling functional gene composition. This point is particularly important, as it indicates that the functional gene pattern was not merely a reflection of the depth gradient, but remained associated with mineral N forms and habitat properties within an already stratified profile. Total mineral N, nitrate-N, and ammonium-N showed broadly similar orientations, whereas nitrite-N occupied a more distinct position. Thus, the former three variables were more closely aligned with the main gradient of soil functional organization represented in the ordination, whereas nitrite-N showed a more separate positioning within the constrained space. Given the typically short residence time of nitrite in soil, this separation is ecologically plausible and may indicate stronger control by small-scale heterogeneity. At the same time, the relative separation of pH and EC from several functional genes shows how these variables described a broader habitat gradient rather than a direct suppressive effect. The predominantly alkaline conditions observed in these soils may also have contributed to shaping mineral N distribution and microbial habitat quality, particularly by influencing the local chemical environment and microsite suitability for microbial activity. Rather than interpreting them mechanistically as simple inhibitory factors, it is more appropriate to view pH and EC as integrative indicators of habitat quality differences that may influence the functional balance among nitrifiers, denitrifiers, and carbon-degrading groups. Previous studies have shown that pH is among the strongest predictors of microbial community composition, while salinity or EC gradients may weaken or reorganize the coupling between microbial functional traits and N transformation [46,47]. In this sense, the pRDA does not simply restate depth stratification; rather, it suggests that, even after accounting for depth, mineral N forms and habitat conditions remained associated with the partitioning of microbial functional structure.
Within this interpretative framework, the QBS-ar index carries complementary ecological significance. Although this index was measured only in the topsoil and was not included in the multivariate analysis, it provides complementary ecological context for interpreting topsoil biological activity. However, QBS-ar should be regarded as a complementary ecological indicator rather than as a direct explanatory variable of functional gene patterns. Although its spatial variation was broadly consistent with the overall distribution of soil properties and microbial indicators, this correspondence should not be interpreted as evidence of a direct relationship. For instance, S4, which had the highest organic carbon content, also showed the highest QBS-ar value, whereas the sandier S3 had the lowest value. This pattern may indicate that variation among sampling units in soil texture, organic matter status, and habitat stability contributed to differences in soil faunal community complexity and the ecological quality of the topsoil habitat. Since higher QBS-ar values are generally associated with more stable and less disturbed soils, these results provide complementary ecological support for the interpretation that the topsoil represented the most biologically active layer. This interpretation is consistent with the observed concentration of mineral N and microbial indicators in the upper layer, but should not be taken as evidence of a direct linkage between QBS-ar and functional gene composition [17,18].
In a broader agronomic context, a distinctive feature of the present system was that mineral N was retained mainly in the upper soil layer rather than showing clear accumulation at depth. In contrast to intensive agricultural systems, where deep nitrate storage often develops below the biologically active layer and contributes to the formation of a legacy N pool [33,34,35,48,49], no clear evidence of deep nitrate accumulation was observed within the sampled depth range in the present system. In the organically managed sugar beet system studied here, mineral N and microbial functional potential were more strongly co-concentrated in the biologically active upper profile. Evidence for deep historical accumulation was weak, but topsoil N turnover may still be highly sensitive to short-term variation in residue inputs, moisture conditions, and management timing. From a management perspective, this point is especially important because sugar beet quality depends not only on the total amount of N supplied, but also on the timing and location of plant-available N. Excess mineral N late in the growing season has been reported to reduce sucrose concentration and purity while increasing N-containing impurities [3,6]. In this study, total mineral N across the 0–120 cm profile ranged from 7.45 to 11.95 mg kg−1, indicating a generally low mineral N status within the sampled soil layer. Previous studies have shown that higher mineral N concentrations at greater soil depths (e.g., approximately 20 mg kg−1 at 2.5–3.0 m) may be associated with an increased risk of quality penalties in sugar beet. Although no agronomic quality traits were measured in the present study, these findings may provide broader agronomic context for interpreting the observed N profile patterns [6]. Although the present sampling did not extend to that depth, this threshold still provides a meaningful agronomic reference. Within the 0–120 cm profile investigated here, mineral N concentrations remained below that reference value, indicating no clear sign of high-risk deep accumulation in the studied system. Nevertheless, this does not diminish the importance of short-term warning signals. Under organically managed conditions that rely heavily on microbial regulation, even soils with relatively modest total N reserves may release substantial amounts of mineral N over short periods when temperature and moisture are favorable for rapid organic matter decomposition. Such mineralization pulses, even if limited in magnitude or duration, may still be sufficient to disrupt the balance of N supply during late sugar beet growth and thereby potentially affect sugar accumulation and technological quality. In this respect, monitoring the rapid response of microbial activity to environmental variation, such as changes in moisture and carbon input, may be more informative for anticipating and managing crop quality risk than simply tracking the total size of the soil N pool.
5. Conclusions
Overall, these findings highlight soil depth as a key environmental gradient shaping both mineral N pools and microbial functional structure within the investigated organically managed system. Integrating mineral N measurements with functional gene indicators may support a depth-resolved monitoring framework. This approach may support improved nutrient regulation, facilitate early detection of sub-root-zone N risks, and help interpret implications for crop N management and quality in organic sugar beet systems. More broadly, these results emphasize the importance of incorporating soil profile diagnostics into N management strategies for organic sugar beet systems. At the same time, these conclusions should be interpreted considering several limitations. The dataset was based on four independent composite sampling units and was analyzed using exploratory statistical approaches, which limits the strength of inference. Furthermore, functional gene abundance was used as a proxy for microbial functional potential and does not represent a direct measurement of actual N transformation rates. Finally, because the study did not include unmanaged or conventionally managed reference soils, the observed patterns should be interpreted as specific to the investigated organically managed sugar beet system rather than as direct effects of organic management itself. Moreover, other unmeasured profile-scale factors, such as depth-dependent O2 and potentially CO2 gradients, may also influence microbial activity and N transformation pathways through their effects on microsite heterogeneity. These factors were not directly assessed in the present study and therefore remain to be clarified in future research. Future studies including replicated sites and contrasting management systems will be necessary to test the generality of these patterns.
Author Contributions
Conceptualization, P.S. and S.L.; methodology, S.L., C.C., F.R. and M.G. (Marco Gnudi); formal analysis, S.L.; investigation, S.L., C.C., F.G., G.Z., C.M., M.G. (Maria Giordano), L.G., S.R., A.S. and G.C.; resources, P.S., F.R., M.G. (Marco Gnudi), G.G. and Y.W.; data curation, S.L.; writing—original draft preparation, S.L.; writing—review and editing, C.C., F.R., M.G. (Marco Gnudi), F.G., G.Z., C.M., M.G. (Maria Giordano), L.G., S.R., A.S., G.C., G.G., Y.W. and P.S.; visualization, S.L.; supervision, P.S.; project administration, P.S.; funding acquisition, P.S. All authors have read and agreed to the published version of the manuscript.
Funding
This project was funded by CABI (CSR 2023–2027), and the European Union Next-Generation EU—Piano Nazionale di Ripresa e Resilienza (PNRR)—Missione 4 Componente 2, Investimento 1.4 (D.D. 1032 17/06/2022). Li Shunlei (Grant No. 202408110030) was funded by the China Scholarship Council (CSC), whose support is gratefully acknowledged.
Data Availability Statement
The data presented in this study are available from the corresponding author upon reasonable request.
Conflicts of Interest
The authors declare no conflicts of interest.
References
- Varga, I.; Jović, J.; Rastija, M.; Markulj Kulundžić, A.; Zebec, V.; Lončarić, Z.; Iljkić, D.; Antunović, M. Efficiency and Management of Nitrogen Fertilization in Sugar Beet as Spring Crop: A Review. Nitrogen 2022, 3, 170–185. [Google Scholar] [CrossRef] [Scilit]
- Ghimire, D.; Maharjan, B. Optimizing Nitrogen Management to Enhance Irrigated Sugar Beet Yield and Quality. Agron. J. 2024, 116, 2564–2572. [Google Scholar] [CrossRef] [Scilit]
- Draycott, A.P. Nutrients for Sugar Beet Production: Soil–Plant Relationships; CABI Publishing: Wallingford, UK, 2003. [Google Scholar]
- Lamlom, S.F.; Abdelghany, A.M.; El-Banna, A.A.A.; El-Manhaly, M.M.; Elsheikh, A.M.; Bassiony, N.A.M.; Teiba, I.I.; El-Sorady, G.A.; Ren, H.; Ahmad, S.; et al. Cultivar-Specific Nitrogen and Potassium Recommendations Optimize Yield and Quality Attributes in Sugar Beet. Sci. Rep. 2025, 15, 27550. [Google Scholar] [CrossRef] [Scilit] [PubMed]
- Thorup-Kristensen, K.; Halberg, N.; Nicolaisen, M.; Olesen, J.E.; Crews, T.E.; Hinsinger, P.; Kirkegaard, J.; Pierret, A.; Dresbøll, D.B. Digging Deeper for Agricultural Resources, the Value of Deep Rooting. Trends Plant Sci. 2020, 25, 406–417. [Google Scholar] [CrossRef] [Scilit] [PubMed]
- Stevanato, P.; Zavalloni, C.; Marchetti, R.; Bertaggia, M.; Saccomani, M.; McGrath, J.M.; Panella, L.W.; Biancardi, E. Relationship between Subsoil Nitrogen Availability and Sugarbeet Processing Quality. Agron. J. 2010, 102, 17–22. [Google Scholar] [CrossRef] [Scilit]
- Stevanato, P.; Squartini, A.; Concheri, G.; Saccomani, M. Sugar Beet Yield and Processing Quality in Relation to Nitrogen Content and Microbiological Diversity of Deep Soil Layer. Sugar Tech 2016, 18, 67–74. [Google Scholar] [CrossRef] [Scilit]
- Zhang, X.; Davidson, E.A.; Mauzerall, D.L.; Searchinger, T.D.; Dumas, P.; Shen, Y. Managing Nitrogen for Sustainable Development. Nature 2015, 528, 51–59. [Google Scholar] [CrossRef] [Scilit]
- Lehmann, J.; Bossio, D.A.; Kögel-Knabner, I.; Rillig, M.C. The Concept and Future Prospects of Soil Health. Nat. Rev. Earth Environ. 2020, 1, 544–553. [Google Scholar] [CrossRef] [Scilit]
- European Commission. EU Soil Strategy for 2030—Reaping the Benefits of Healthy Soils for People, Food, Nature and Climate; COM (2021) 699 final; European Commission: Brussels, Belgium, 2021. [Google Scholar]
- Su, J.; Zhou, H.; Wang, K.; Fan, H.; Hou, Z. Effects of Nitrogen Fertilizer Management on Dry Matter Accumulation and Yield of Drip-Irrigated Sugar Beet in Arid Areas. Agronomy 2024, 14, 1010. [Google Scholar] [CrossRef] [Scilit]
- Zhou, H.; Wang, L.; Xu, P.; Liu, D.; Zhang, L.; Hao, Y.; Wang, K.; Fan, H. Nitrogen Use Efficiency of Drip Irrigated Sugar Beet as Affected by Sub-Optimal Levels of Nitrogen and Irrigation. Agric. Water Manag. 2024, 298, 108849. [Google Scholar] [CrossRef] [Scilit]
- Zhu, Y.; Archontoulis, S.V.; Castellano, M.J. Quantifying the Timing Asynchrony between Soil Nitrogen Availability and Maize Nitrogen Uptake. Plant Soil. 2025, 513, 2939–2954. [Google Scholar] [CrossRef] [Scilit]
- Koch, H.-J.; Grunwald, D.; Essich, L.; Ruser, R. Cover Crop Characteristics Modulate Amount and Timing of Nitrogen Supply of Fertilized Sugar Beet (Beta vulgaris L.) in Temperate Climate. Can. J. Plant Sci. 2025, 105, 1–13. [Google Scholar] [CrossRef] [Scilit]
- Hina, N.S. Global Meta-Analysis of Nitrate Leaching Vulnerability in Synthetic and Organic Fertilizers over the Past Four Decades. Water 2024, 16, 457. [Google Scholar] [CrossRef] [Scilit]
- Quemada, M.; Baranski, M.; Nobel-de Lange, M.N.J.; Vallejo, A.; Cooper, J.M. Meta-Analysis of Strategies to Control Nitrate Leaching in Irrigated Agricultural Systems and Their Effects on Crop Yield. Agric. Ecosyst. Environ. 2013, 174, 1–10. [Google Scholar] [CrossRef] [Scilit]
- Parisi, V.; Menta, C.; Gardi, C.; Jacomini, C.; Mozzanica, E. Microarthropod Communities as a Tool to Assess Soil Quality and Biodiversity: A New Approach in Italy. Agric. Ecosyst. Environ. 2005, 105, 323–333. [Google Scholar] [CrossRef] [Scilit]
- Menta, C.; Conti, F.D.; Pinto, S.; Bodini, A. Soil Biological Quality Index (QBS-ar): 15 Years of Application at Global Scale. Ecol. Indic. 2018, 85, 773–780. [Google Scholar] [CrossRef] [Scilit]
- Petersen, D.G.; Blazewicz, S.J.; Firestone, M.; Herman, D.J.; Turetsky, M.; Waldrop, M. Abundance of Microbial Genes Associated with Nitrogen Cycling as Indices of Biogeochemical Process Rates across a Vegetation Gradient in Alaska. Environ. Microbiol. 2012, 14, 993–1008. [Google Scholar] [CrossRef] [Scilit] [PubMed]
- Kuypers, M.M.M.; Marchant, H.K.; Kartal, B. The Microbial Nitrogen-Cycling Network. Nat. Rev. Microbiol. 2018, 16, 263–276. [Google Scholar] [CrossRef] [Scilit] [PubMed]
- IUSS Working Group WRB. World Reference Base for Soil Resources 2006: A Framework for International Classification, Correlation and Communication; World Soil Resources Reports 103; Food and Agriculture Organization of the United Nations: Rome, Italy, 2006. [Google Scholar]
- Simperegui, K.B.D.; Kouame, A.K.K.; Kwesie, B.; Bindraban, P.S.; Adzawla, W.; Asamoah, E.; El Gharous, M. Digital Mapping of Ghana’s Soil Properties and Nutrients: Performance of Spline and Weighted Average Approaches. Geoderma 2025, 459, 117365. [Google Scholar] [CrossRef] [Scilit]
- Bishop, T.F.A.; McBratney, A.B.; Laslett, G.M. Modelling Soil Attribute Depth Functions with Equal-Area Quadratic Smoothing Splines. Geoderma 1999, 91, 27–45. [Google Scholar] [CrossRef] [Scilit]
- Olsen, S.R.; Cole, C.V.; Watanabe, F.S.; Dean, L.A. Estimation of Available Phosphorus in Soils by Extraction with Sodium Bicarbonate; USDA Circular 939; U.S. Government Printing Office: Washington, DC, USA, 1954.
- Sumner, M.E.; Miller, W.P. Cation Exchange Capacity and Exchange Coefficients. In Methods of Soil Analysis, Part 3: Chemical Methods; Sparks, D.L., Ed.; SSSA Book Series 5; SSSA: Madison, WI, USA, 1996; pp. 1201–1229. [Google Scholar] [CrossRef] [Scilit]
- Keeney, D.R.; Nelson, D.W. Nitrogen—Inorganic Forms. In Methods of Soil Analysis, Part 2: Chemical and Microbiological Properties, 2nd ed.; Page, A.L., Miller, R.H., Keeney, D.R., Eds.; ASA/SSSA: Madison, WI, USA, 1982; pp. 643–698. [Google Scholar] [CrossRef] [Scilit]
- Sims, G.K.; Ellsworth, T.R.; Mulvaney, R.L. Microscale Determination of Inorganic Nitrogen in Water and Soil Extracts. Commun. Soil Sci. Plant Anal. 1995, 26, 303–316. [Google Scholar] [CrossRef] [Scilit]
- Rotthauwe, J.H.; Witzel, K.P.; Liesack, W. The Ammonia Monooxygenase Structural Gene amoA as a Functional Marker: Molecular Fine-Scale Analysis of Natural Ammonia-Oxidizing Populations. Appl. Environ. Microbiol. 1997, 63, 4704–4712. [Google Scholar] [CrossRef] [Scilit]
- Henry, S.; Bru, D.; Stres, B.; Hallet, S.; Philippot, L. Quantitative Detection of the nosZ Gene, Encoding Nitrous Oxide Reductase, and Comparison of the Abundances of 16S rRNA, narG, nirK, and nosZ Genes in Soils. Appl. Environ. Microbiol. 2006, 72, 5181–5189. [Google Scholar] [CrossRef] [Scilit]
- Throbäck, I.N.; Enwall, K.; Jarvis, Å.; Hallin, S. Reassessing PCR Primers Targeting nirS, nirK and nosZ Genes for Community Surveys of Denitrifying Bacteria with DGGE. FEMS Microbiol. Ecol. 2004, 49, 401–417. [Google Scholar] [CrossRef] [Scilit]
- Zilio, M.; Motta, S.; Tambone, F.; Scaglia, B.; Boccasile, G.; Squartini, A.; Adani, F. The Distribution of Functional N-Cycle Related Genes and Ammonia and Nitrate Nitrogen in Soil Profiles Fertilized with Mineral and Organic N Fertilizer. PLoS ONE 2020, 15, e0228364. [Google Scholar] [CrossRef] [Scilit]
- Wang, Y.; Ji, H.; Wang, R.; Hu, Y.; Guo, S. Synthetic Fertilizer Increases Denitrifier Abundance and Depletes Subsoil Total N in a Long-Term Fertilization Experiment. Front. Microbiol. 2020, 11, 2026. [Google Scholar] [CrossRef] [Scilit] [PubMed]
- Sebilo, M.; Mayer, B.; Nicolardot, B.; Pinay, G.; Mariotti, A. Long-Term Fate of Nitrate Fertilizer in Agricultural Soils. Proc. Natl. Acad. Sci. USA 2013, 110, 18185–18189. [Google Scholar] [CrossRef] [Scilit] [PubMed]
- Van Meter, K.J.; Basu, N.B.; Veenstra, J.J.; Burras, C.L. The Nitrogen Legacy: Emerging Evidence of Nitrogen Accumulation in Anthropogenic Landscapes. Environ. Res. Lett. 2016, 11, 035014. [Google Scholar] [CrossRef] [Scilit]
- Jessen, S.; Postma, D.; Thorling, L.; Müller, S.; Leskelä, J.; Engesgaard, P. Decadal Variations in Groundwater Quality: A Legacy from Nitrate Leaching and Denitrification by Pyrite in a Sandy Aquifer. Water Resour. Res. 2016, 53, 184–198. [Google Scholar] [CrossRef] [Scilit]
- Bell, C.W.; Asao, S.; Calderon, F.; Wolk, B.; Wallenstein, M.D. Plant Nitrogen Uptake Drives Rhizosphere Bacterial Community Assembly during Plant Growth. Soil. Biol. Biochem. 2015, 85, 170–182. [Google Scholar] [CrossRef] [Scilit]
- Dontsova, K.M.; Norton, L.D.; Johnston, C.T. Calcium and Magnesium Effects on Ammonia Adsorption by Soil Clays. Soil. Sci. Soc. Am. J. 2005, 69, 1225–1232. [Google Scholar] [CrossRef] [Scilit]
- Lima, A.F.L.; Campos, M.C.C.; Silva, J.B.; Araújo, W.O.; Mantovanelli, B.C.; Souza, F.G.; Beirigo, R.M.; Silva, D.M.P.; Macedo, R.S.; Oliveira, F.P. The Stability of Aggregates in Different Amazonian Agroecosystems Is Influenced by the Texture, Acidity, and Availability of Ca and Mg in the Soil. Agronomy 2024, 14, 677. [Google Scholar] [CrossRef] [Scilit]
- Nieder, R.; Benbi, D.K.; Scherer, H.W. Fixation and Defixation of Ammonium in Soils: A Review. Biol. Fertil. Soils 2011, 47, 1–14. [Google Scholar] [CrossRef] [Scilit]
- Eilers, K.G.; Debenport, S.; Anderson, S.; Fierer, N. Digging Deeper to Find Unique Microbial Communities: The Strong Effect of Depth on the Structure of Bacterial and Archaeal Communities in Soil. Soil Biol. Biochem. 2012, 50, 58–65. [Google Scholar] [CrossRef] [Scilit]
- Rumpel, C.; Kögel-Knabner, I. Deep Soil Organic Matter—A Key but Poorly Understood Component of Terrestrial C Cycle. Plant Soil 2011, 338, 143–158. [Google Scholar] [CrossRef] [Scilit]
- Wang, H.; Li, X.; Li, X.; Li, X.; Wang, J.; Zhang, H. Changes of Microbial Population and N-Cycling Function Genes with Depth in Three Chinese Paddy Soils. PLoS ONE 2017, 12, e0189506. [Google Scholar] [CrossRef] [Scilit]
- Rchiad, Z.; Dai, M.; Hamel, C.; Bainard, L.D.; Cade-Menun, B.J.; Terrat, Y.; St-Arnaud, M.; Hijri, M. Soil Depth Significantly Shifted Microbial Community Structures and Functions in a Semiarid Prairie Agroecosystem. Front. Microbiol. 2022, 13, 815890. [Google Scholar] [CrossRef] [Scilit]
- Huang, L.; Levintal, E.; Erikson, C.B.; Coyotl, A.; Horwath, W.R.; Dahlke, H.E.; Mazza Rodrigues, J.L. Molecular and Dual-Isotopic Profiling of the Microbial Controls on Nitrogen Leaching in Agricultural Soils under Managed Aquifer Recharge. Environ. Sci. Technol. 2023, 57, 11084–11095. [Google Scholar] [CrossRef] [Scilit]
- Bak, F.; Nybroe, O.; Zheng, B.; Badawi, N.; Hao, X.; Nicolaisen, M.H.; Aamand, J. Preferential Flow Paths Shape the Structure of Bacterial Communities in a Clayey till Depth Profile. FEMS Microbiol. Ecol. 2019, 95, fiz008. [Google Scholar] [CrossRef] [Scilit] [PubMed]
- Fierer, N.; Jackson, R.B. The Diversity and Biogeography of Soil Bacterial Communities. Proc. Natl. Acad. Sci. USA 2006, 103, 626–631. [Google Scholar] [CrossRef] [Scilit] [PubMed]
- Li, X.; Wang, A.; Wan, W.; Luo, X.; Zheng, L.; He, G.; Huang, D.; Chen, W.; Huang, Q. High Salinity Inhibits Soil Bacterial Community Mediating Nitrogen Cycling. Appl. Environ. Microbiol. 2021, 87, e01366-21. [Google Scholar] [CrossRef] [Scilit] [PubMed]
- Ju, X.T.; Kou, C.L.; Zhang, F.S.; Christie, P. Nitrogen Balance and Groundwater Nitrate Contamination: Comparison among Three Intensive Cropping Systems on the North China Plain. Environ. Pollut. 2006, 143, 117–125. [Google Scholar] [CrossRef] [Scilit] [PubMed]
- Zhou, J.; Gu, B.; Schlesinger, W.H.; Ju, X. Significant Accumulation of Nitrate in Chinese Semi-Humid Croplands. Sci. Rep. 2016, 6, 25088. [Google Scholar] [CrossRef] [Scilit] [PubMed]

Disclaimer/Publisher’s Note: The statements, opinions and data contained in all publications are solely those of the individual author(s) and contributor(s) and not of MDPI and/or the editor(s). MDPI and/or the editor(s) disclaim responsibility for any injury to people or property resulting from any ideas, methods, instructions or products referred to in the content. |
© 2026 by the authors. Licensee MDPI, Basel, Switzerland. This article is an open access article distributed under the terms and conditions of the Creative Commons Attribution (CC BY) license.