


Abstract
Prices and quantities in agricultural commodity and food product markets are subject to constant changes due to evolving supply and demand conditions. Big and sudden shifts in supply or demand may lead to price movements that bring negative consequences for food producers or consumers. Factors causing such movements can be of different natures, but substantial changes in the world energy price levels are supposed to be one of the most important. The purpose of the study was to investigate the effect of global energy price shocks on the evolution of food commodities and food consumer prices. Using the World Bank data on the respective price indices, we looked for shocks in these data series by utilizing statistical tools. Having identified three global energy price shocks in the period 2000–2024 induced by the financial crisis of 2008, the COVID-19 pandemic, and the outbreak of war in Ukraine, their influence on the world agricultural commodity prices and food consumer prices was assessed. It was found that the series of energy, food commodity, and food consumer price indices were related in the long term. Also, the occurrence of global energy price shocks to a visible extent translated into global food commodity and food consumer price shocks. Applying various statistical and econometric techniques, including Chow tests and MS-VAR modelling, enables the identification of which breaking points led to regime changes between the analysed variables. The most sensitive to the structural breaking points appeared to be the relation between energy and consumer food prices. This discovery can be considered our major contribution.
1. Introduction
Energy and food prices are of key importance for the economic welfare of both producers and consumers. They are volatile components of the overall price-level changes responsible for inflation; therefore, a better understanding of how they are connected and interact, especially during periods of strong upturns and downturns, is important for market participants and policymakers. Energy markets and food markets are coupled through input costs, technological choices, and policy linkages. While exact cost percentages are rarely published, energy costs can represent 10–30% of total food production costs, depending on the product and region. For energy-intensive products (like meat or processed foods), the share is typically higher. Particularly, oil underpins modern agri-food systems by powering on-farm machinery, irrigation pumps, and cold chains, by determining transport and logistics costs along global value chains, and by partaking in the natural-gas-derived fertiliser and agrichemical industry. Consequently, shocks to oil prices can drive rapid overall energy price changes and spill over into food prices with potentially profound welfare implications.
Empirical studies consistently document that changes in energy prices feed through to the costs of agricultural inputs and commodities, as well as prices of food products. Analyses are conducted at both the national and international levels. For example, researchers found that rising energy prices in Iran can significantly increase domestic agricultural production costs, which decreases the profitability and quantity supplied of food commodities, contributing to inflationary pressure in food markets [1]. Moessner [2] studied the effects of country-specific energy prices on food consumer price inflation in 36 OECD member and candidate countries, finding that energy inflation has a significant effect on food inflation, which becomes significantly stronger with greater energy dependence. Karakotsios et al. [3] found causal relationships between crude oil and world food prices, as well as long-run feedback effects.
Particularly, Radmehr and Rastegari Henneberry [1] indicated that the impact of energy prices on food prices may be direct and indirect. In the direct impact, changes in energy prices influence the cost of energy-intensive inputs like fuel and chemical inputs, as well as transportation costs, which affect the cost of agricultural production, food processing and marketing, and food consumer prices. Hanson et al. [4] proved that the rise in oil prices is a factor that increases production costs and agricultural and food prices. Dvoskin and Heady [5] showed that doubling the energy price causes a 5% drop in energy demand in food production and a 12% increase in the food production cost.
In the indirect impact, the influence of energy prices on food prices is attributed to the impact of energy prices on exchange rates. Abbott et al. [6] showed that changes in oil prices affect the local currency, while Harri et al. [7] indicated that corn, cotton, and soybean prices are linked to oil prices, and wheat prices are not, and that exchange rates play a role in this linkage over time. They showed that local currency changes caused by changes in energy prices affect domestic food prices and food trade. In general, energy price shocks interact with macroeconomic policy uncertainty and exchange rates and influence food market outcomes, implying that price effects are not isolated to energy–food links but also depend on broader economic conditions [8].
Empirical studies attempt to address the transmission of prices both in the food supply chain and between markets. Alnour et al. [8] showed that energy price increases are passed through into food prices asymmetrically, with prices rising quickly when energy costs rise but declining more slowly when energy costs fall. Ibrahim [9] identified no significant influence of oil price reduction on food prices, both in the long and short run, while the significant relation between oil price increases and food prices exists only in the short run. Zhang [10] highlighted that the speed and magnitude of food price increases are notably faster when energy costs rise, as compared with their decline, and that this asymmetric transmission can exacerbate food price volatility and contribute to persistent inflation in food markets. This is because long-term asymmetry leads to long-term wage rises, which amplify the transmission effect and increase the pressure on food prices.
On the other hand, analysing grain markets in China and the U.S., it was proved that higher crude oil prices increase shipping and import costs, which strengthens the transmission of global price changes into domestic food prices and raises food supply costs [11]. Also, Arintoko [12], Ali [13], and Gradzewicz [14] provide empirical evidence of asymmetric or country-level effects of energy shocks on food prices or general inflation. Dai et al. [15] and Zhang [16] applied econometric and connectedness approaches to understand how shocks in energy markets transmit to food markets or broader commodity and financial markets.
While many studies have shown that energy prices co-move with food prices [17,18], the causal relationship between energy and food prices is not so obvious. Three groups of research findings can be distinguished in the literature in this field [1]. The first one argues that there is no evidence to support the effect of energy prices on food prices. For instance, Reboredo [17] explored the causal linkage between world energy prices and wheat, soybean, and corn prices and found no causal relation. Fewowe [19] showed that agricultural commodity prices in South Africa are neutral to global oil prices. Results obtained by Zhang et al. [20] indicated no long-run relationship between fuel and agricultural commodity prices. Also, Baumeister and Kilian [21] showed that rises in agricultural commodity prices contribute little to retail food price increases, while the link between oil and agricultural commodity prices is rather driven by common macroeconomic determinants of these prices than the pass-through from higher oil prices.
The second group includes studies examining the relationship between energy and food prices during the two following time periods. While no link is observed in the first period, it emerges in the second. For example, Chen et al. [22] showed that in the period of 2005–2008, changes in crude oil price significantly influenced grain prices, implying that during the period of higher crude oil prices, these commodities are competing with the demand for biofuels. Nazlioglu et al. [23], looking for the volatility spillover among energy prices and selected agricultural commodity prices, did not find it in the period of 1986–2005, but found it in the period of 2006–2011.
Studies from the third group found that changes in energy prices cause food price fluctuations. For example, Hanson et al. [4] analysed the effects of a world oil price shock on agriculture in the U.S., taking into consideration direct and indirect cost linkages. Nazlioglu et al. [24] showed that changes in energy prices affect crop prices, which are significantly increased by the weak dollar. Hezareh et al. [25] indicated the permanent effect of oil price shocks on food prices in both oil-exporting and importing countries. Esmaeili and Shokoohi [26] found that the crude oil price has an indirect effect on the world GDP via its impacts on the food production index. Alghalith [27] showed that an increase in oil prices raises food prices, higher oil price volatility leads to higher food prices, and an increase in oil supply reduces food prices.
In standard microeconomic theory, an increase in input costs for producers tends to shift the supply for food leftward (a decrease in supply at every price level) because producing the same quantity of food becomes more expensive. Conversely, a decrease in energy costs reduces input costs and shifts supply outward. This effect is observed in both theoretical and empirical agricultural economics literature. For example, Baffes [28] concluded that higher crude oil prices raise overall production costs in agriculture due to energy-intensive activities across the supply chain, leading to reduced agricultural supply and higher food prices in equilibrium. Moreover, international analyses confirm that energy price shocks influence transportation costs and agricultural machinery operations, which further constrain supply by raising costs across multiple stages of production and distribution [29].
Regarding the demand side, energy price changes can influence food demand both indirectly through real income effects and directly through competition effects. In the first case, when household energy expenditures rise (higher fuel, electricity, or heating costs), real disposable income falls, which can reduce overall consumption, including food, especially for lower-income households with a high share of expenditure on energy and food. This income effect is well documented in applied economic studies on price pass-through and consumer demand [30,31].
The second case refers, for example, to extensive use of agricultural commodities as raw materials for producing energy, for instance, biofuels [32]. Higher energy prices can increase demand for energy crops used for biofuel production (e.g., ethanol), diverting land and resources away from food crops. This can reduce the effective supply of food and simultaneously bolster food commodity prices. Kirikkaleli and Darbaz [33] noted that such a demand shift can feed back into food markets by increasing grain prices.
Summarising, high energy prices cause lower supply and potentially lower demand for expensive foods, which can lead to higher food prices, which may be accompanied by uneven effects across different food types. On the contrary, low energy prices cause higher supply and potentially higher demand, which stabilise or reduce food prices.
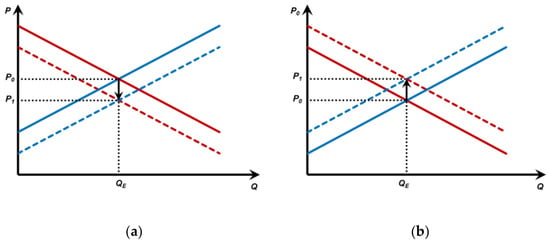
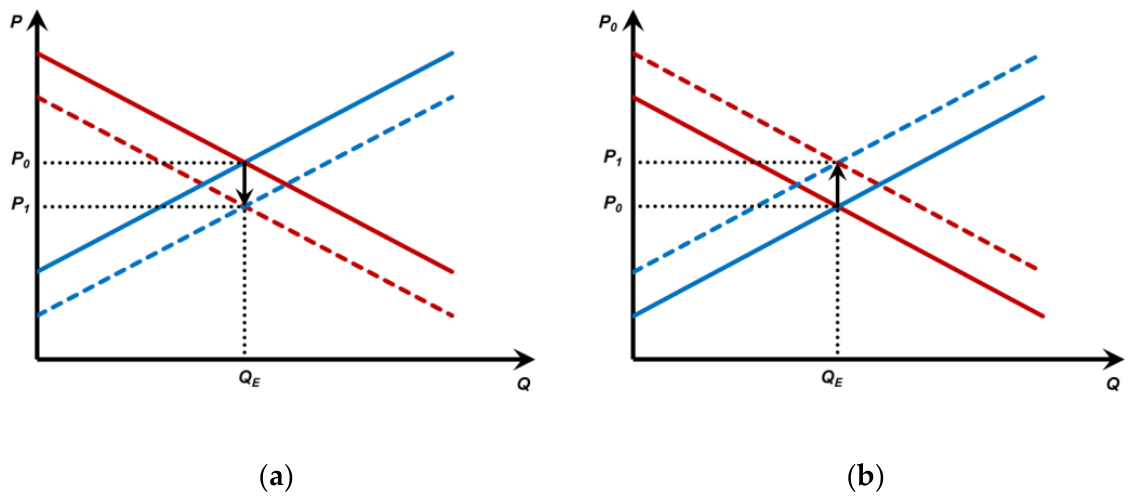
To imply a theoretical basis for our study, in Figure 1, we illustrate two completely opposite types of price shocks. In panel (a), a negative price shock is a combination of downward shifts in both supply (blue lines) and demand (red lines), whereas in panel (b), a positive price shock is a combination of upward shifts in supply and demand. Obviously, between these two diametrically different cases, there are also other combinations of supply and demand shifts leading to price plunges or price jumps.
Figure 1.
Illustration of a negative (panel (a)) and a positive (panel (b)) price shocks.
Within this framework, the main aim of the paper is to investigate the occurrence of the global energy price shocks in the period of 2000–2024 and their effect on the evolution of world agricultural commodity and consumer food prices. Particularly, we are interested in the energy, agricultural, and food price changes observed after the beginning of the 2008 financial crisis, as well as after the outbreaks of the Coronavirus disease 2019 (COVID-19) pandemic and the war in Ukraine in 2022.
The literature shows that the global financial crisis of 2008 caused a negative global demand shock and energy price collapse, followed by a gradual recovery. Hamilton [34] showed that oil prices peaked in mid-2008 and then collapsed alongside the global demand contraction. Kilian [35] provided structural decomposition showing that the 2008 collapse was largely driven by a negative global demand shock. Also, the International Monetary Fund [36] documented the sharp decline in global energy prices during the financial crisis.
The COVID-19 pandemic caused extreme demand collapse with supply constraints, and energy prices recorded an immediate drop and a subsequent strong increase. The International Energy Agency [37] reported that it was the largest annual decline in global energy demand since World War II. The U.S. Energy Information Administration [38] documented the April 2020 collapse in oil demand and prices, including negative West Texas Intermediate [WTI] futures. On this main global oil price benchmark, traders were willing to pay others to take these future contracts off their hands. Figiel et al. [39] noticed that food commodity prices followed the same direction, but their drop was much less extreme. Narayan [40] described the strong rebound in energy demand and price pressures in 2021.
Finally, regarding the war in Ukraine, we could observe a negative supply shock, immediate and persistent price increase, especially in gas markets, with persistent volatility as a longer-term effect. International Energy Agency [41] analysed the structural shift in global energy markets following Russia’s invasion of Ukraine, European Central Bank [42] documented how the war caused a major surge in European gas and electricity prices, Boungou and Yatié [43] showed global financial and commodity market volatility following the invasion, whereas the World Bank [44] concluded that the war triggered one of the largest commodity price shocks since the 1970s. Particularly, Amaglobeli [45] analysed policy responses to simultaneous energy and food price surges in the post-Ukraine war period.
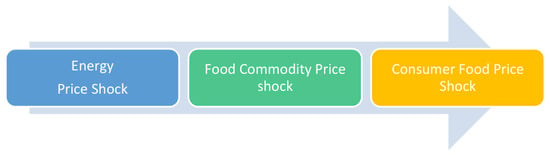
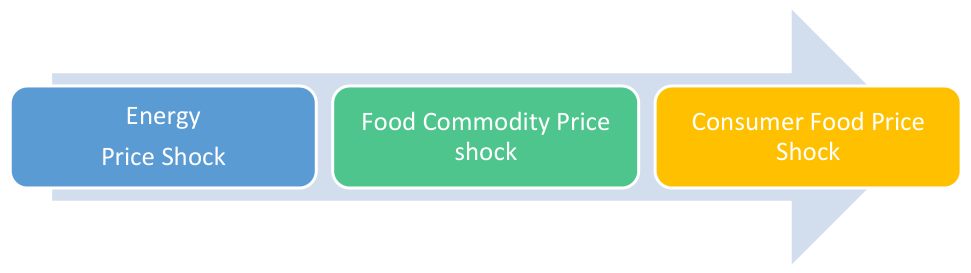
Based on the above literature findings, we formulate a research hypothesis about a causal relationship between energy price shocks and food commodity and consumer food price shocks. Its essence is presented in Figure 2.
Figure 2.
Hypothesised causation between energy price shocks and food commodity and consumer food price shocks.
As transmission of energy shocks can vary depending on the macroeconomic context or market regime, classical linear models, which assume constant parameters, often fail to capture the true dynamics of energy markets or the impacts of shocks on inflation, GDP, or other commodities like food. New models that take into account the possibility that relationships between variables are nonlinear and context-dependent have emerged. Baumeister and Peersman [46] examined the time-varying effects of oil supply shocks on the U.S. economy. They employed Time-Varying Parameter VAR (TVP-VAR) models, confirming that the economy’s response to oil price shocks differs significantly across periods or regimes. They showed that since the mid-1980s, the price elasticity of oil demand has declined substantially. As a result, a given oil production shortfall leads to a stronger oil price response and more severe macroeconomic consequences over time, whereas a comparable increase in oil prices is associated with smaller output effects. Such a character of energy shocks’ transmission provides strong motivation for using models that account for regime changes, like Markov–Switching VARs.
A key tool for identifying regimes in economic data is structural break analysis. For example, Bai and Perron [47] developed a methodology for detecting multiple breakpoints in time series, where model parameters may shift abruptly. In the energy context, this means that events like financial crises, pandemics, or wars can create new regimes in which the relationships between energy prices, inflation, and other macro variables structurally change. Combined, these studies support the use of nonlinear or time-varying models in energy, food, and macroeconomic research to account for changes in volatility and shock transmission.
Although existing studies broadly examine the relationship between energy and food prices, there is limited evidence that simultaneously accounts for long-term, causal interactions and structural breaks associated with major global energy shocks. In particular, the literature lacks a comprehensive analysis that integrates multiple crises, such as the 2008 financial crisis, the COVID-19 pandemic, and the war in Ukraine, into a unified framework to assess how these events have altered the regimes between energy, food commodity, and consumer food prices over time. The research gap we sought to address was how price relationships in the global food supply chain respond to these energy shocks.
Consequently, we ask the following research questions:
- How did the dynamics of the global energy, food commodities, and consumer food prices look, and whether the analysed events constituted structural breaks in these data series in the analysed period?
- What is the character of mutual relationships between the considered variables, especially in terms of causation over time?
- To what extent did global energy price shocks influence food commodity and food consumer price shocks, and what was the impact of food commodity price shocks on food consumer price shocks?
- Can the financial crisis of 2008, the COVID-19 pandemic, and the outbreak of the war in Ukraine be considered as structural breakpoints altering the character of the relationships between the analysed variables?
It was found that the 2008 financial crisis, the COVID-19 pandemic, and the 2022 war in Ukraine represent structural breakpoints in global price dynamics. Not only are global commodity markets highly sensitive to systemic geopolitical and financial shocks, but also the spillover from energy to food markets reflects deep interdependencies driven by transportation costs, fertiliser production, supply chain logistics, and expectations. It was found that the detrended series of energy, food commodities, and food consumer price indices were related in the long term, proving long-run cyclical links. The occurrence of global energy price shocks to a visible extent translates into global food commodity and food consumer price shocks, but the shock transmission is asymmetric, suggesting incomplete and nonlinear pass-through. Finally, it turns out that disruptions altering supply chain structures may influence relationships between food commodities and consumer food prices more than purely financial shocks. The principal conclusion is that although shocks caused by energy prices imply shocks in both food commodities and consumer food prices, they do not always persistently change the relationship between them. In particular, the relationship between energy and consumer food prices proved to be the most sensitive to the structural breaking points.
2. Materials and Methods
In the analyses carried out, the following time series were utilised:
- world energy price monthly indices based on nominal U.S. dollars, 2010 = 100, January 1960–May 2025, reported by the World Bank (data available at https://www.worldbank.org/en/research/commodity-markets, accessed on 12 July 2025);
- world food commodity price monthly indices based on nominal US dollars, 2010 = 100, January 1960–May 2025, reported by the World Bank (data available at https://www.worldbank.org/en/research/commodity-markets, accessed on 12 July 2025);
- monthly world consumer price indices (CPI) regarding food, 2015 = 100, January 2000–December 2024, reported by the Food and Agriculture Organization (data available at https://data360.worldbank.org/en/dataset/FAO_CP, accessed on 12 July 2025).
Weights used in the World Bank Commodity Price Index (in %) regarding energy are the following: coal 4.7, crude oil 84.6, natural gas 10.8. Weights used in the World Bank Commodity Price Index (in %) regarding food: cereals 28.2 (rice 30.1, wheat 25.2, maize 40.7, barley 4.1), oils and meals 40.8 (soybeans 24.6, soybean oil 13.0, soybean meal 26.3, palm oil 30.2, coconut oil 3.1, groundnut oil 2.8), and other food 31.0 (sugar 31.5, bananas 15.7, meat/beef 19.2, oranges 11.6).
The operational names for these series were as follows: energy prices (index), food commodity prices (index), and food consumer prices (world food CPI).
Because of the CPI’s availability, the analysed period was limited to 2000–2024 (300 observations), which allowed comparisons of changes in variables at the three key breaking points of focus: September 2008 for the world financial crisis, March 2020 for the COVID pandemic, and March 2022 for the Russian aggression on Ukraine. For homogeneity of analyses, January 2010 was made the base period for all indices.
Firstly, we present the collected data series graphically and their calculated basic descriptive statistics. Then, the seasonality was excluded with the TRAMO SEATS procedure [48], and the augmented Dickey–Fuller (ADF) [49] and Kwiatkowski–Phillips–Schmidt–Shin (KPSS) [50] tests were applied to test stationarity and avoid false identification in levels. Because CPI was I(2), we decided to apply the Hodrick–Prescott (HP) [51] filter to exclude trends from all data series. Three shocks were tested for structural break in a single data series, taking advantage of the Chow test [52]. Statistical methods were employed, including correlations, cross-correlations, and cointegration testing [53], in which the Johansen test was performed for data series with and without trends. Afterwards, we performed causality tests in the Granger sense [54]. Apart from Granger testing, causal relationships were studied through impulse response functions in two-variable VARs.
In the following step, we utilised Chow tests for a structural break to characterise relationships between the world energy and both food price indices. They were applied to regressions with one, two, and three breaking points (September 2008, March 2020, March 2022), as well as breaking points were specified as split points for 45 monthly observations (22 months before and 22 months after the month of the breaking point).
Finally, the Markov switching–vector autoregressive (MS-VAR) model [55] was applied to introduce changing regimes when studying the relationships between pairs of variables. The MS-VAR was chosen because of the method of data transformation (first differences in CPIs were still not stationary). Moreover, in the context of the 2008 financial crisis, the COVID-19 pandemic, and the 2022 war outbreak in Ukraine, each of these events represents a potential structural break that alters energy market dynamics and can spill over into food markets. In MS-VAR models, parameters change discretely across regimes, in contrast to TVP-VAR models, in which they change gradually [56]. MS-VAR modelling captures sudden regime shifts, allowing researchers to detect when the system has entered a new regime, as well as better forecast the effects of energy shocks under different macroeconomic conditions.
In order to remain consistent with the order of research questions, firstly, we illustrate shocks in single variables, also detrended ones, answering if analysed breaking points cause structural changes (Chow test). Secondly, we focus on shock connections—primarily on mutual relationships between variables (correlations and Johansen test), then on causational relationships (Granger causality). Thirdly, we analyse the translation between variables, taking advantage of IRFs. Finally, we answer whether the three analysed breaking points caused structural changes in mutual relationships between variables (Chow test), and utilising MS-VARs, we analyse whether regimes between variables switch in these breaking points. In each of the four results subsections, one research question is being addressed.
Specifically, our VAR analysis involved the following steps. For a pair of variables, we fitted VAR models with lag values selected via the Akaike criterion (AIC). For these models, we performed IRFs. Having estimated values, we then extracted each equation independently for every variable included in one model and performed once again re-estimation with Markov switching models. We have used the Markov switching model (MSM) from the R version 4.5.1 (13 June 2025 ucrt) package (MSwM). MSM allows parameters of a regression to change depending on which regime (unobserved state) the system is in. Thus, in each regime, parameters of the model change according to some transition matrix of a Markov chain, so we estimate the possible number of regimes, and in every regime, a linear regression model is taken from the VAR specification for every variable. The number of regimes was chosen by minimizing the AIC and BIC criteria.
As an exemplary equation, we consider here an equation taken from VAR(2) for food commodity (FoodCom) dependent on its lagged own values and energy prices (Energy), which is specified as follows:
where —coefficients on the first lag, —coefficients on the second lag, —random noise. This equation is then re-estimated for a number of regimes, while using AIC and BIC criteria, and the number of regimes is determined. Here, we found 4 regimes, so we obtain 4 equations of the form:
These are the new equations for the price index of food commodities in the context of Markov switching. Thus, for this MSM, we estimate coefficients that are different in every regime, so we have and , , where is a number of the regimes. Simultaneously, a transition matrix is estimated (filtered probabilities), which provides probabilities of moving from the regime to regime at time . When moving from one regime to the other, we change coefficients. After estimation, the procedure updates probabilities. Since at this step we have access to the full history of the process, we update filtered probabilities and obtain the so-called smoothed probabilities, which can be later used to interpret economic phases. We report regime classifications at any time using these probabilities.
We utilised the Python 3.11.13 language to perform HP filtering, stationarity tests, Johansen, and Granger causality tests. We use the GNU Regression, Econometrics and Time-series Library (GRETL) [57] to calculate basic statistics, correlations, and cross-correlation coefficients, and to perform the TRAMO-SEATS procedure and Chow tests. We utilised R version 4.5.1 (13 June 2025 ucrt) software to perform VAR modelling. All figures were prepared in Excel.
3. Results
3.1. Identification of Shocks in Single Variables
3.1.1. Variability of the Analysed Prices
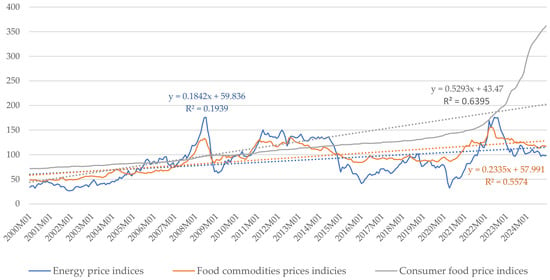
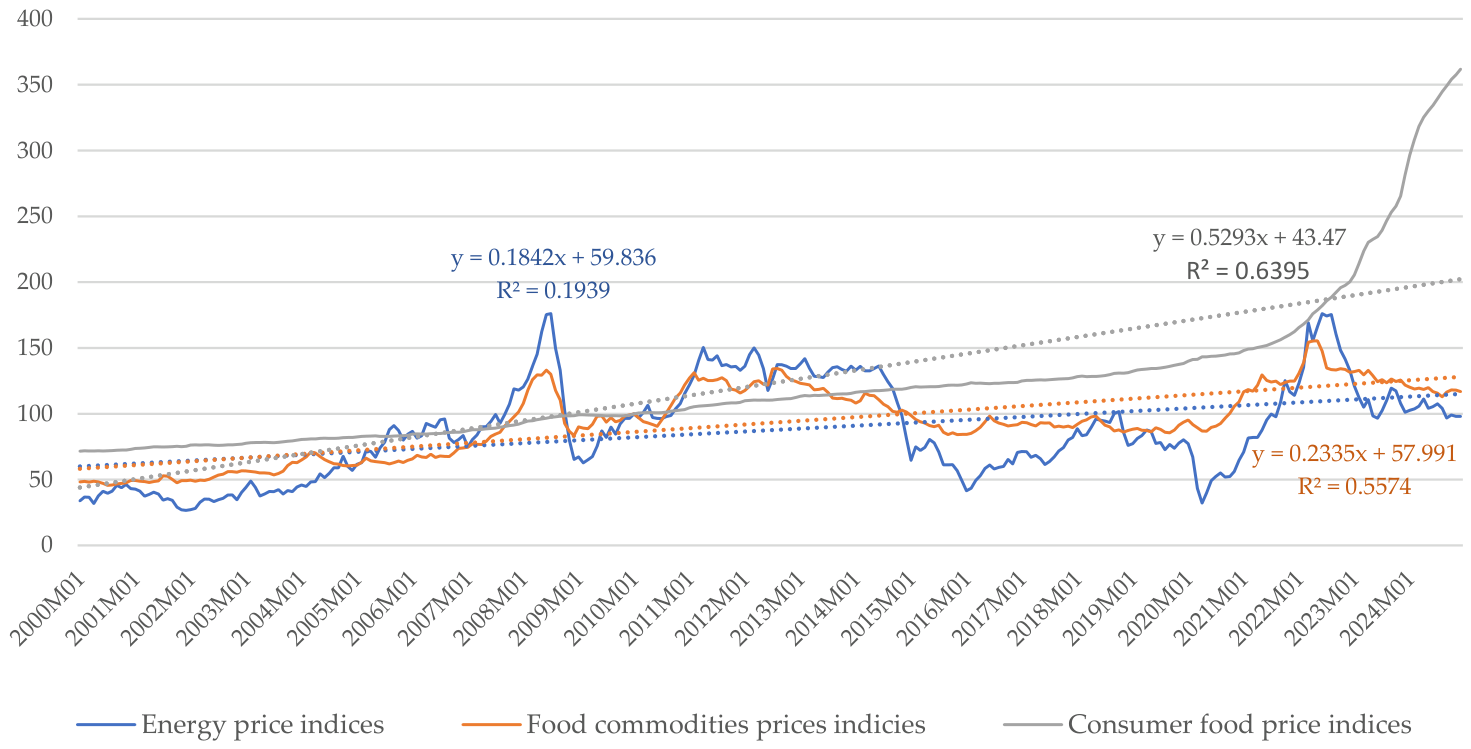
Figure 3 illustrates the monthly world indices of energy, food commodity, and consumer food prices in the period of 2000–2024. The summary of their descriptive statistics is presented in Table 1. Food CPI increased 5.1 times (from 71.6 to 361.8), whereas the variability interval for the energy price index was between 26.7 and 176.1, and the food commodities index ranged from 45.7 to 155.5. The least variable was the food commodities index, whose coefficient of variation amounted to 29.1. Both the energy price and the world food CPI are characterised by high variability (above 40%) around the mean. The mean was the highest for the world food CPI—123.1 as compared to 87.6 for the energy price index and 93.1 for the food commodities price index. During the analysed period, world CPI was increasing the most (by 0.53 p.p. monthly), whereas the energy price index was increasing by 0.18 p.p. monthly and the food commodities by 0.23 p.p. monthly.
Figure 3.
Monthly indices of world energy prices, world food commodities (based on nominal U.S. dollars, January 2010 = 100), and world food CPI in 2000–2024. The dotted lines are estimated respective time series linear trends.
Table 1.
Basic statistics of the analysed data series.
3.1.2. The Morphology of the Price Movements
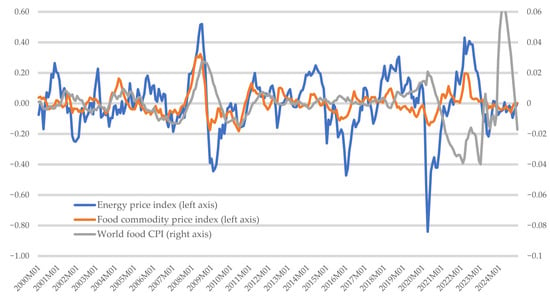
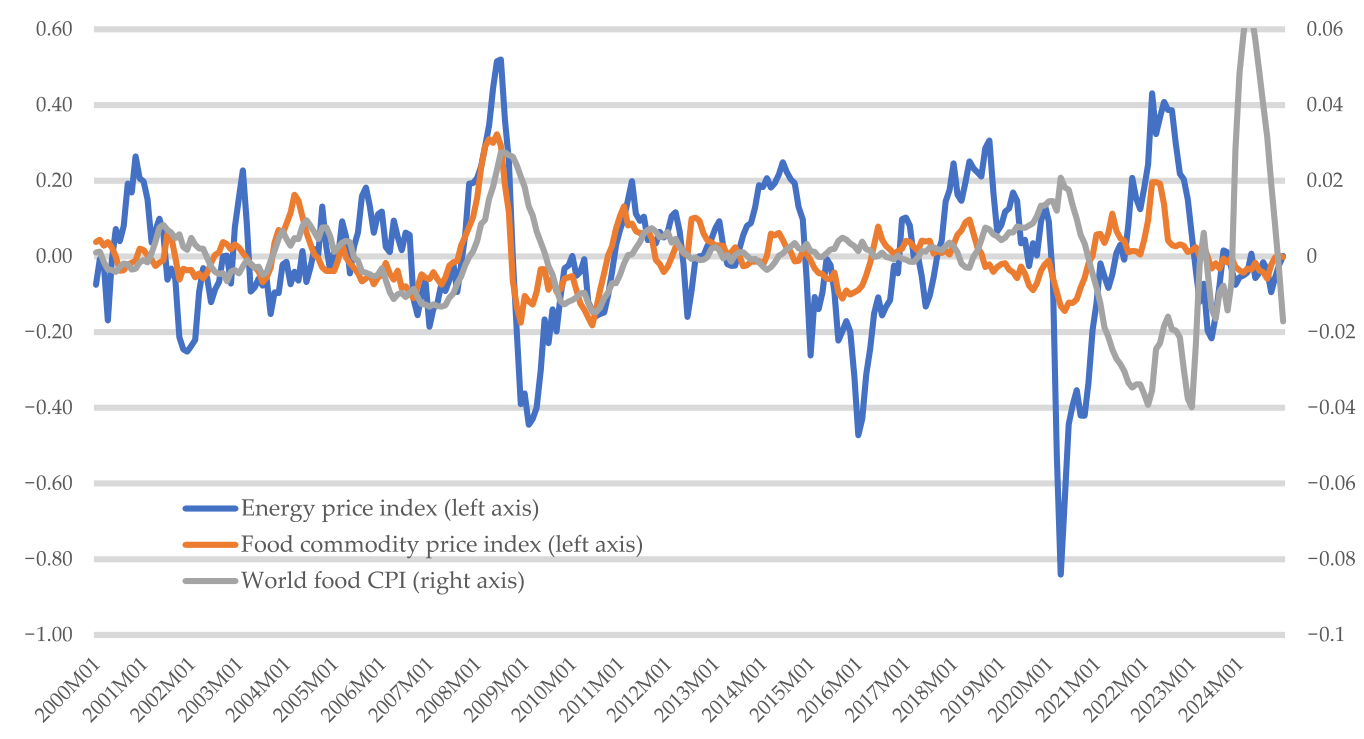
As deflation of prices paid by final consumers is an extremely rare phenomenon, the food CPI series showed a strong increasing trend. Therefore, in the next step, we performed an ADF and KPSS test in order to test stationarity. Table 2 presents the results obtained for levels, first and second differences in variables, whereas Figure 4 illustrates detrended data series, of which we took advantage when analysing relationships between variables. It appeared that world food CPI may be I(2) (the tests’ results are unambiguous), whereas energy and food commodities prices are I(1). Therefore, in further analysis, we could not utilise first differences in logarithms, and we were forced to take advantage of filters. After applying the HP filter to data with excluded seasonality, taking advantage of the TRAMO SEATS procedure, and logarithmising, we obtained a stationary data series (Figure 4).
Table 2.
Results (p-values) of the ADF test (with constant and linear trend) and KPSS test (with trend) performed on logarithmised data (with seasonality excluded) and their first and second differences.
Figure 4.
Detrended monthly world energy, food commodity, and consumer food price indices in 2000–2024.
In the analysed period, the standard deviation of the detrended energy price index amounted to 0.18 and was more than twice as high as the detrended food commodity price index standard deviation (0.08). The variability of the detrended world food CPI was lower—it amounted to 0.01. It is also worth noticing that only the war in Ukraine clearly caused an immediate energy price increase (negative supply shock). The 2008 financial crisis and the COVID-19 pandemic initially caused energy price collapses (negative demand shocks), followed by dynamic price rebounds.
3.1.3. Structural Changes in the Analysed Series in the Breaking Points
Table 3 presents the results of the Chow test for single variables regarding the following breakpoints: September 2008, March 2020, and March 2022. We applied the Chow tests to series that were first filtered using the HP filter to remove long-term trends. In almost all situations, we were able to reject the H0 hypothesis of no structural change in the data series. Only CPI showed no structural change in reference to the 2008 financial crisis, nor did the food commodities price index in reference to the COVID-19 pandemic. However, together with other breakpoints, even these ones become statistically significant, which proves the correct selection of these breaking points.
Table 3.
Results of the Chow test for single variables. F-statistics and p-values for one, two, and three breaking points.
3.2. Connectedness of the Shocks
3.2.1. Mutual Relationships Between Analysed Variables
Table 4 presents the correlation analysis between detrended variables and results of cross-correlations (precisely the highest correlation index with the delay for which it was obtained), whereas Table 5 presents the results of the Johansen tests regarding cointegration. It turned out that only the energy price and food commodities price indices are strongly and simultaneously correlated with each other. However, taking into account 12-month delays, the levels of correlation indexes increase, and for all the relationships, we obtained significant results. Energy prices were found to be particularly strongly correlated with food commodity prices, with correlation coefficients exceeding 0.6. Importantly, in the case of CPIs, the strongest correlation indices were obtained for variables with a lag of a few months. Changes in energy prices and food commodities price index tend to precede changes in the CPI by approximately 7 and 11 months, respectively, suggesting a delayed transmission effect in the international food chains.
Table 4.
Correlations and cross-correlations between variables.
Table 5.
Results of the Johansen tests between logs of analysed variables (first line H0: rank ≤ 1, second line H0: rank = 0).
Although the world food CPI seems to be the I(2) variable, we decided to perform the Johansen test for all three pairs of price indices to check the existence of a cointegration relation, that is, a long-run equilibrium relationship between variables. In our analysis, no cointegration was observed between energy and both food commodities and food consumer prices, which means that they do not follow the same trends; therefore, if divergences appear, no error-correction mechanism exists to return them to a long-run equilibrium. There is one cointegration relation between food commodities and food consumer prices, which means that these data series follow the same trends and try to stay in long-run equilibrium. This result is in accordance with the economic theory and confirms the proper functioning of the market mechanism. This is how agri-food markets should work.
In the next step, we repeated the procedure with the data series after the HP filter. Table 6 presents the results. It turns out that when eliminating trends, there exists a long-run equilibrium relationship in all three relationships we observe. The appearance of more than one cointegration relation between cycles of agri-food prices and energy prices seems to be a very interesting finding. Moreover, a tighter long-term relationship between the detrended series of food commodities and consumer food prices highlights the significant role of cyclical co-movements of these two variables.
Table 6.
Results of the Johansen tests between detrended variables (first line H0: rank ≤ 1, second line H0: rank = 0).
3.2.2. Causal Relationships Between Analysed Variables
In the next step, we employed a VAR model and performed Granger causality tests. As not all variables were integrated of order one, the tests were conducted on detrended data series. Table 7 presents the results of Granger causality tests. It turned out that all the analysed impacts are not statistically significant. Surprisingly, the energy price index neither helps predict food commodity prices nor consumer food prices. It appears that other production factors and world phenomena impact food commodity prices to a greater extent than energy prices, and consumer food prices to a greater extent than both energy prices and food commodity prices.
Table 7.
Results of the Granger causality test (p-value).
3.3. Impulse Response Functions
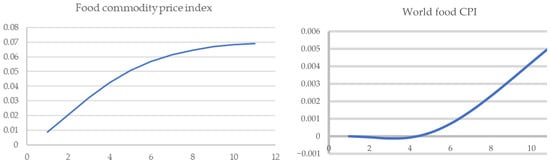
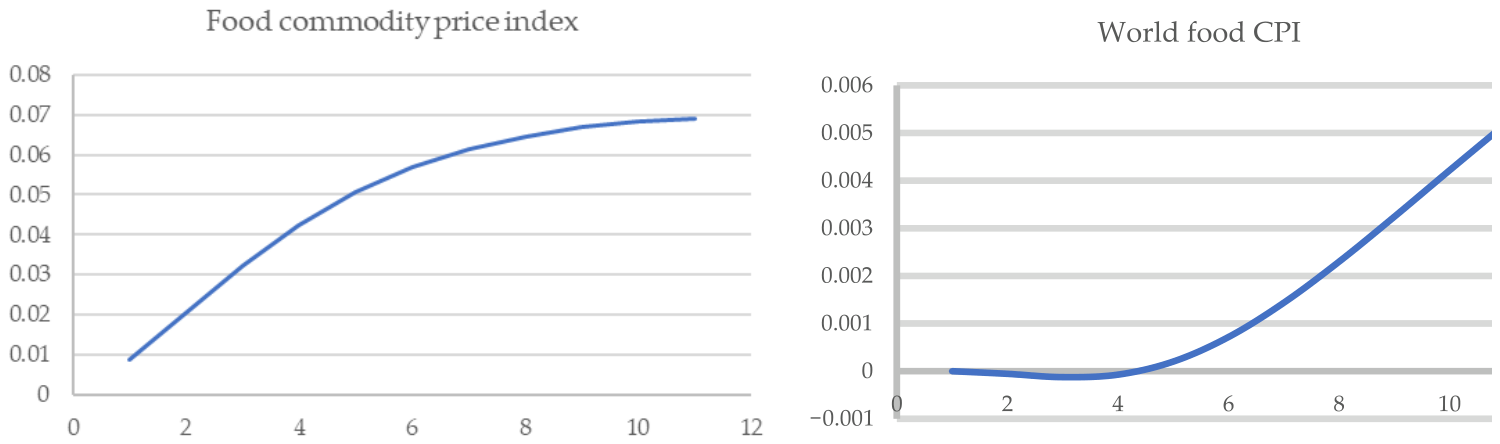
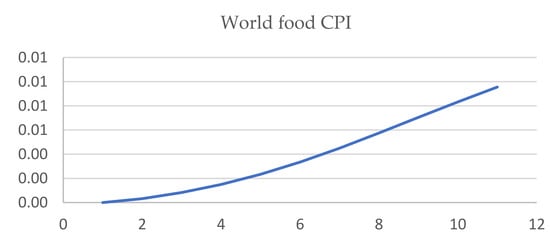
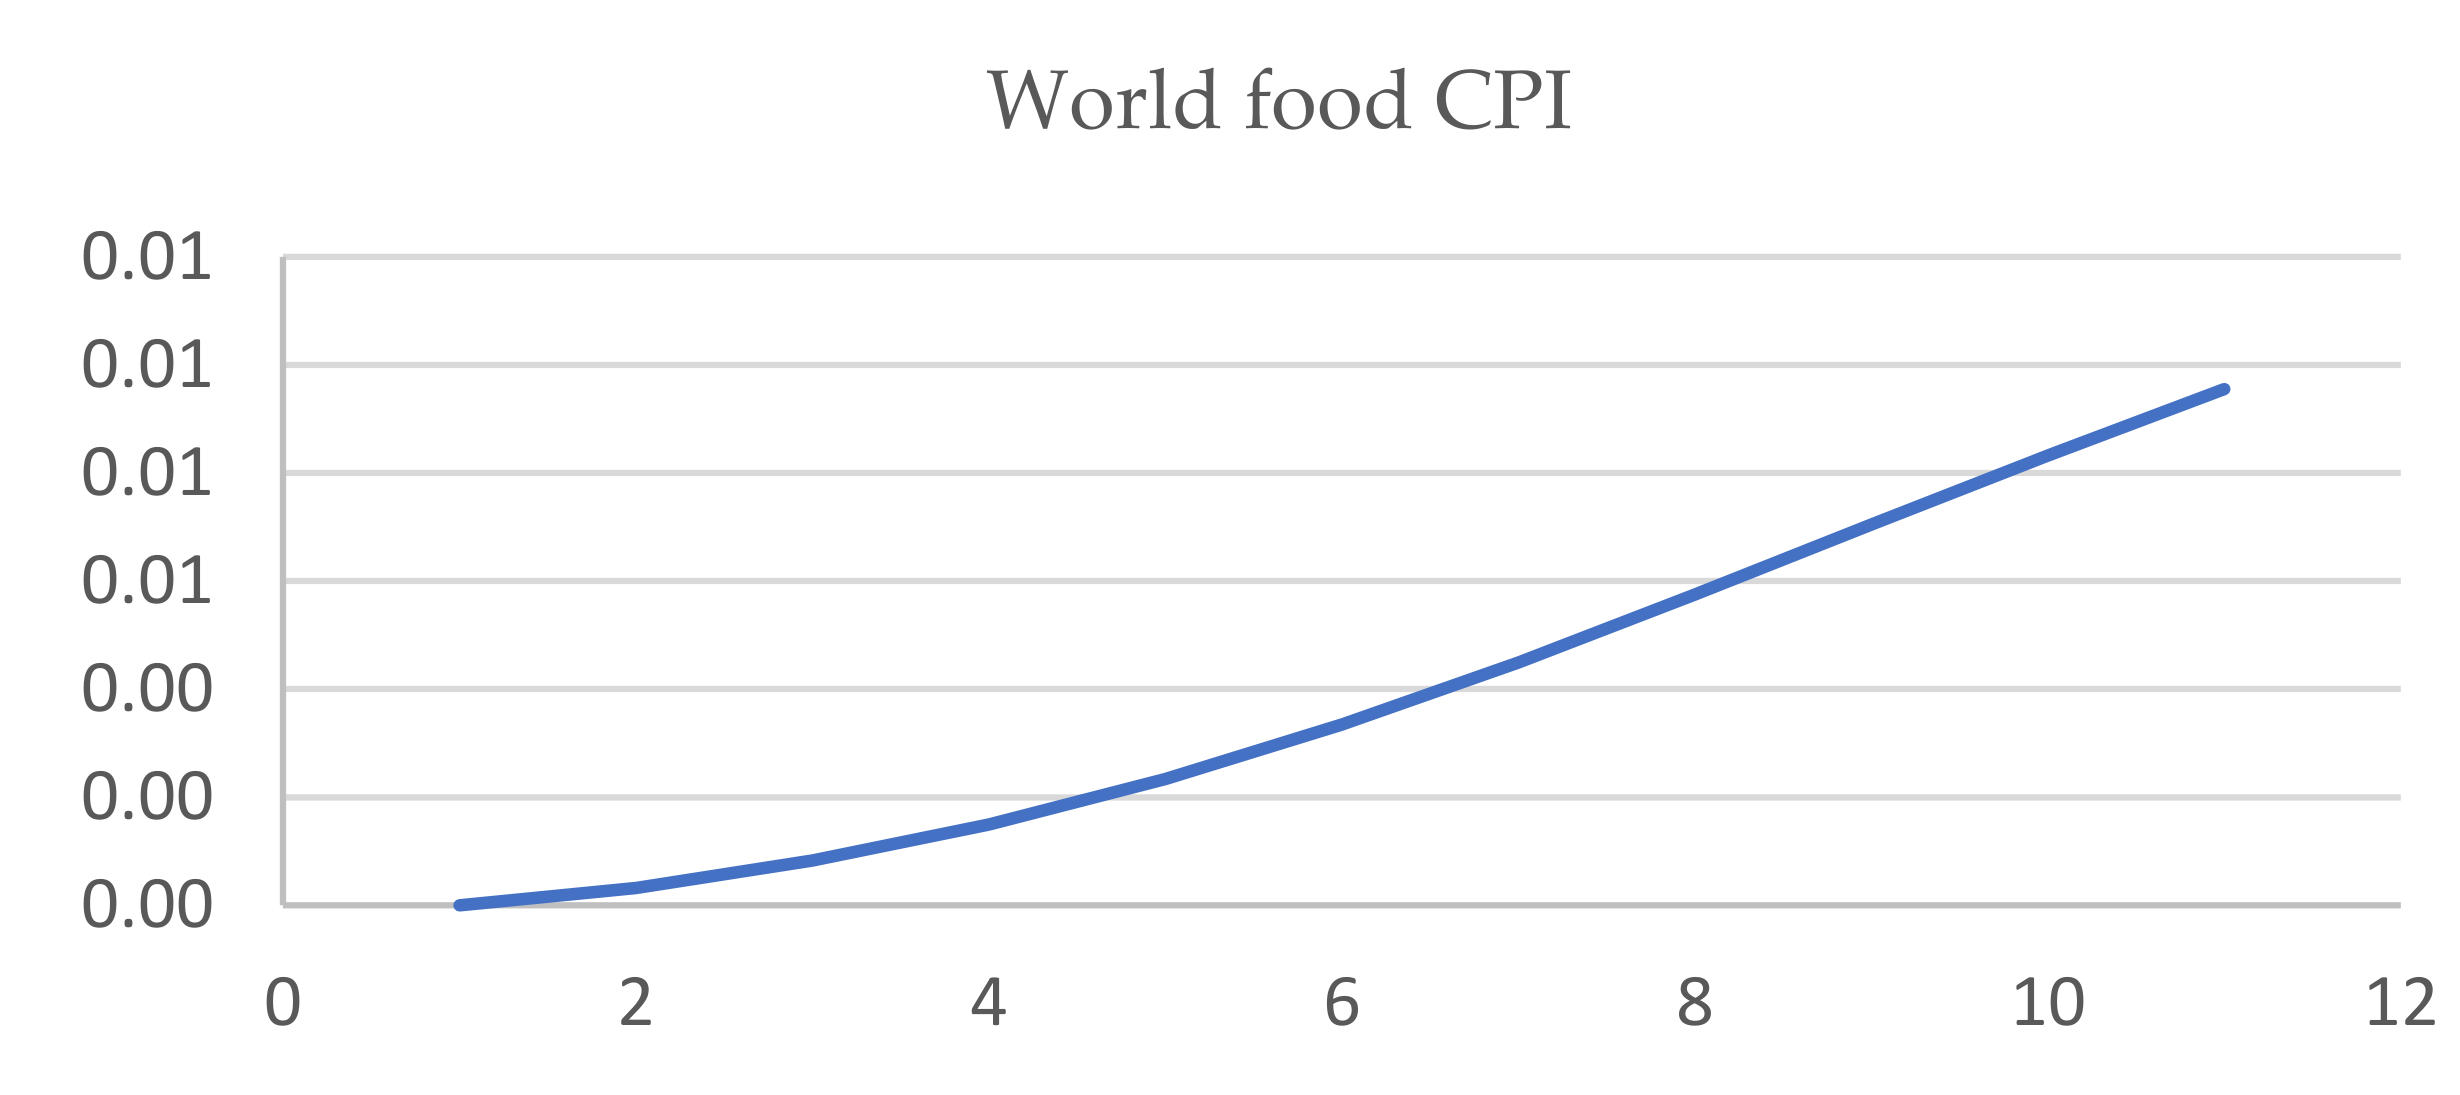
Figure 5 and Figure 6 present cumulative responses to shocks in energy and food commodity prices, respectively. The impact of a positive energy shock on food commodities prices is immediate and high, stabilising after ca. 9 months. On CPIs, this impact is more than 10 times weaker and delayed (by 4 months), increasing steadily over time.
Figure 5.
Cumulative impulse response functions for simple VAR models. Impact of energy price index increase (cause), months.
Figure 6.
Cumulative impulse response functions for simple VAR models. Impact of food commodities price index increase (cause), months.
As expected, a rise in food commodity prices leads to CPI growth. It also happens immediately, and this impact becomes stronger over time; however, the increase is ca. 7 times lower than the impact of energy prices on food commodity prices. It can be supposed that the impulse coming from energy prices goes through food commodity prices, and then to the world food CPI, weakening over time. After 10 months, the cumulative reaction of the world food CPI to the shock in energy prices is ca. 2 times lower than to the shock in food commodities prices. Also, the delay in response of the world food CPI to the energy price indicates that the impact of energy prices on world food CPI is at least partly indirect through the prices of food commodities.
3.4. Changes in Regimes Between Variables in Breaking Points
3.4.1. Chow Tests for Pairs of Variables
Table 8 presents the results of Chow tests regarding the relationships between both food commodity prices and CPIs with energy prices, whereas Table 9 illustrates these results regarding the relationships between food commodity prices and CPIs. The war in Ukraine neither appears to constitute a structural breaking point in the relationship between the two food indices, nor in the relationship between the energy price index and the food commodities price index. However, it appeared that joining two or including three braking points altogether in the models makes all three structural changes statistically significant, which indicates that all three regression models are unstable.
Table 8.
Results of the Chow test. F-statistics and p-values for relationships of food commodities price index and CPIs with energy price index regarding one, two, and three breaking points.
Table 9.
Results of the Chow test. F-statistics and p-values for relationships of CPIs with the food commodities price index regarding one, two, and three breaking points.
Finally, we performed the Chow tests for the above relationships separately for the three breaking points within the 45-month periods (Table 10). Overall, these results confirm the findings of the Chow tests obtained for the full sample period. Only the Russian invasion of Ukraine did not prove to be a significant structural break for the regression of the food commodities price index on energy prices when taking the shorter period. Interestingly, this breakpoint proved to be insignificant also regarding the regression of world food CPI on food commodities prices. This means that the breakpoints in 2008 and 2020 cause greater structural changes in the food chains than the war.
Table 10.
Results of the Chow test. F-statistic and p-value for pairs of variables and three breaking points separately based on regressions embracing 22 months before and after the breakpoint.
3.4.2. Regime Switches Modelling
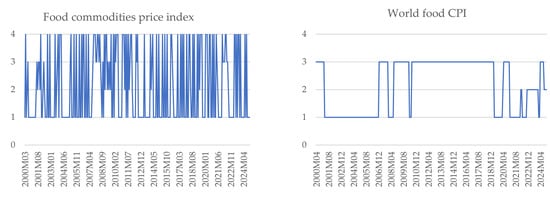
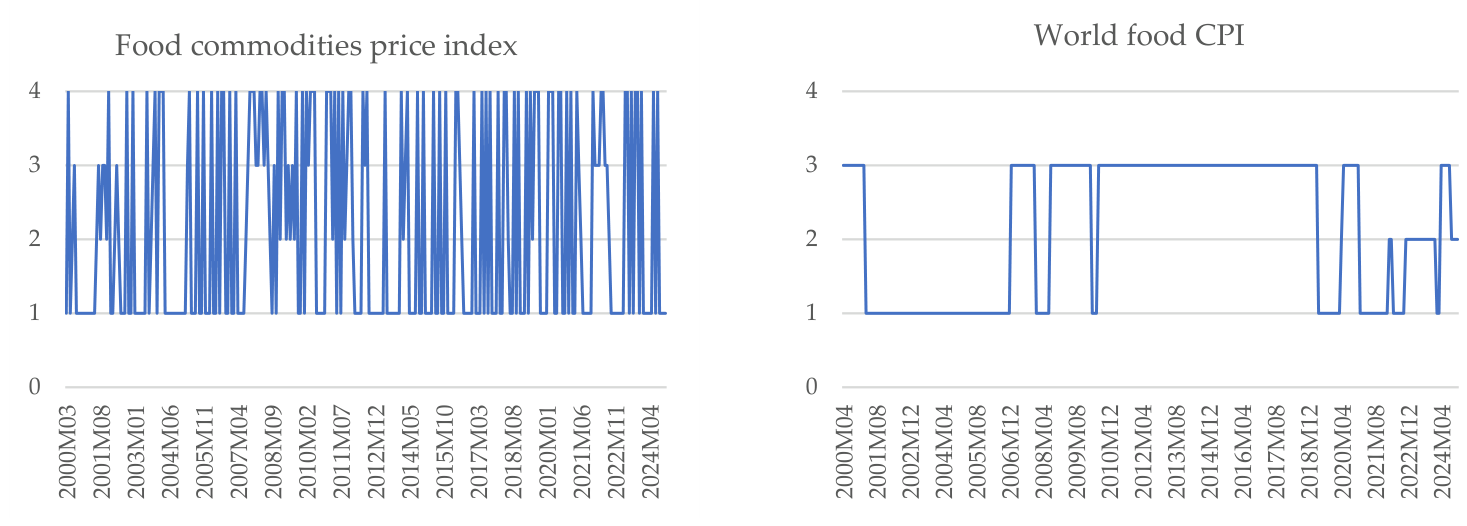
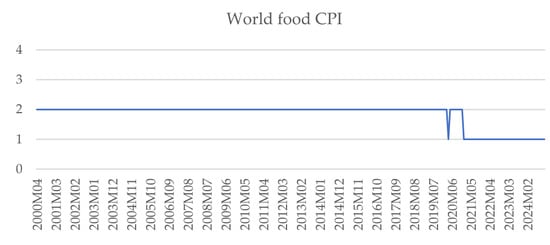
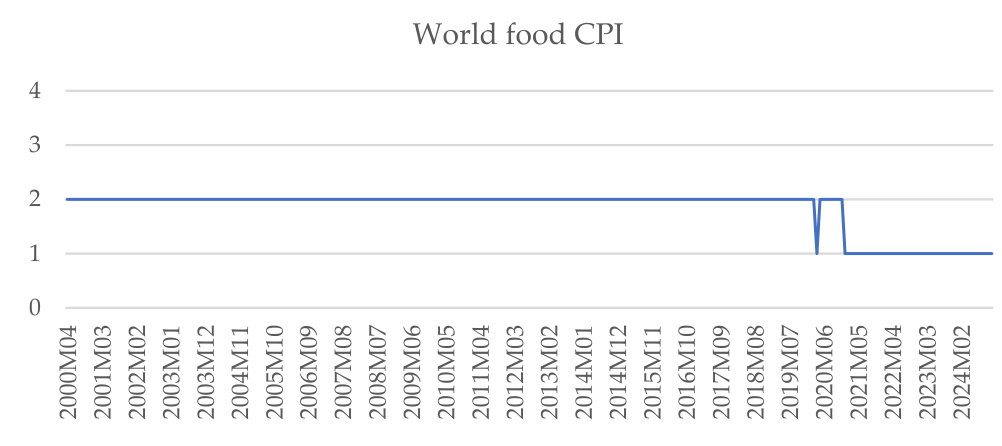
Finally, Figure 7 and Figure 8 present the results of the Markov–Switching VAR modelling. Here, the results are also presented according to the sources of disturbances. Figure 7 deals with the impact of changes in the energy price index, whereas Figure 8 deals with the impact of changes in the food commodity price index. Results seem to be very diverse.
Figure 7.
Results of MS-VAR modelling (smoothed probabilities regime classification). Impact of energy price index changes (cause).
Figure 8.
Results of MS-VAR modelling (smoothed probabilities regime classification). Impact of food commodity price index changes (cause).
The four regimes observed regarding the relationship between food commodity prices and energy prices, in response to energy price changes, were very unstable during the whole analysed period. Most of the time (164 months, that is, over 13.5 years), the relationship between energy and food commodity prices fell under regime 1. Regime 4 was observed during 86 months (above 7 years), and the remaining 2 and 3 during 22 and 26 months, respectively. After the financial crisis, regimes 3 and 2 happened more frequently (until 2010 compared to the rest of the observations), whereas in the years of 2020–2022, regime changes seem to be less frequent. In general, we cannot say that the three analysed breaking points change the regime between energy and food commodities prices.
On the contrary, the regimes regarding the food commodity price index and world food CPI, in response to food commodity price changes (Figure 8), were the most stable. We can observe only two regimes, which replaced each other in the year of 2021, between the COVID-19 pandemic and the Russian invasion. Regime 1 was observed during 16.5% of the analysed period, whereas regime 2 was observed during 83.5% of it.
The partly indirect relationship between the energy price index and the world food CPI falls under three regimes. During the financial crisis, we can observe fluctuations between two of them and the final replacement of regime 1 by regime 3. During the COVID-19 pandemic, the relationship fluctuated between regimes 1 and 3 again, whereas the outbreak of Russian aggression caused a move to regime 2, which was also unstable. The most prevalent regime during the analysed period was regime 3, occurring in 54.5% of the months, while regime 1 was observed in 38% of the months.
The MS-VAR modelling shows that energy shocks influence world food CPI quite clearly, changing the regimes between these two variables. During the financial crisis, we could observe a change from regime 1 to regime 3. During the COVID-19 pandemic, regimes 1 and 3 were replaced one after another, and during the war outbreak, regime 1 switched to regime 2. This indicates that the direct impact of the change in energy prices prevails over the indirect impact through food commodity prices. All three structural breaks did not influence the regime between energy prices and food commodities, as, in fact, it cannot be claimed that any stable regime between these two prices exists at all. We can rather observe fluctuations between two regimes (1 and 4). Finally, the impact of structural breaks on the relationship between the food commodities price index and the food CPI appears more ambiguous, although it is nevertheless observable.
Summarising the structural break analysis, the 2008 financial crisis affected the regime between energy prices and the world food CPI, the COVID-19 pandemic impacted both the regime between energy prices and the world food CPI and the regime between food commodities and the world food CPI, whereas the 2022 war outbreak affected only the regime between the energy price index and the world food CPI. No breaking point led to a regime change between the two food indices, which may indicate that there is no stable regime between these variables. The most persistent was the structural break connected with the COVID-19 pandemic in reference to the relationship between the commodity price index and world food CPI; the second most persistent could be regarded as the structural break connected with the financial crisis in reference to the relationship between the energy price index and world food CPI. Surprisingly, the most sensitive to the structural breaks proved to be the relation between energy and consumer food prices.
4. Discussion
The purpose of the study was to investigate the connections between shocks in the world energy price index, world food commodities price index, and world food CPI during the period of 2000–2024. We answered the four research questions. Firstly, we presented the dynamics in the analysed variables. We analysed the following three shocks: the financial crisis, the COVID-19 pandemic, and the war in Ukraine. Results of the Chow tests indicated that all three shocks appeared to constitute structural breaks in the analysed data series. These results are consistent with the literature [34,35,36,37,38,39,40,41,42,43,44,45].
Secondly, we investigated the character of mutual relationships. Since we did not include exchange rates, we focused on the direct impact of energy prices, as suggested by Radmehr and Rastegari Henneberry [1]. The energy price index was highly correlated only with the food commodity price index, which is in accordance with the majority of the literature [18]. Delays in CPI responses testify to the existence of a pass-through mechanism and indicate the significance of market power in shaping the behaviour of consumer food prices. Moreover, energy prices were not cointegrated with the two food price indices, and no Granger causality was found among the three analysed data series. As shown in the literature review, there is a large body of studies indicating no long-run relationship and no causal effect of energy prices on food prices [17,19,20].
Such results are being explained by several structural and market-specific factors affecting the transmission of energy price shocks to food prices. In particular, energy costs often constitute only a limited share of total production costs in the food sector, which weakens their long-run influence on food prices. In addition, imperfect and delayed pass-through along the supply chain, combined with the presence of market power at different stages of distribution, may lead firms to adjust margins rather than immediately transmit cost changes to prices. Price rigidities and contractual arrangements can further dampen the responsiveness of food prices to energy price fluctuations, resulting in weak or statistically insignificant long-run relationships.
Although energy prices neither impact food commodity prices nor world food consumer prices, after using the HP filter, there are long-run equilibrium relationships between all three variables. This suggests that cyclical co-movements, rather than trends, drive interconnected dynamics. This finding supports the view that both consumer food and food commodity markets are connected to the energy market primarily through business-cycle mechanisms rather than deterministic long-run price parity. Consequently, macroeconomic and cost channels associated with cyclical components prevail over structural forces, such as technological change, policy shifts, globalisation, or decarbonization, that drive trend components of the variables.
The third research question concerns the shock translations, and the results indicate that changes in energy prices that imply agricultural and food price fluctuations are in line with the literature [1,7,24,25,26,27]. It appears that energy shocks immediately transmit to food commodity prices, operating through several well-established global price transmission mechanisms. First, energy constitutes a direct input in agricultural production via fuel, electricity, and nitrogen-based fertilisers, so increases in energy prices raise marginal production costs and, in turn, global food commodity prices. Second, food processing, storage, and refrigeration are energy-intensive stages of the value chain, which amplifies cost pressures along downstream segments. Third, higher energy prices increase transportation and logistics costs, affecting international trade margins and contributing to co-movement in globally traded agricultural commodities. Fourth, energy and agricultural markets are linked through biofuel demand, whereby higher oil prices increase demand for crops used as feedstocks, thereby tightening global food supply.
The transmission of energy prices to consumer food prices proved to be delayed and weaker, and food commodity shocks influence food CPI more strongly than energy shocks. These patterns also highlight nonlinear and asymmetric transmission mechanisms within global supply chains, reflecting market power, price rigidities, and the buffering role of agricultural and energy policies. Final consumers are partially shielded from upstream volatility, but only temporarily. Over time, pressures accumulate. This result is consistent with other empirical studies suggesting stronger and more immediate effects on commodity prices than on CPI food inflation [18,21]. The pass-through of energy price shocks to consumer food prices is typically partial, especially as it reflects differences in market structure across countries.
Answering the fourth research question, it was proved that the financial crisis of 2008, the COVID-19 pandemic, and the 2022 war in Ukraine could be considered as structural breakpoints altering global energy price dynamics, having a spillover effect on the food commodities and consumer food markets. These events were not merely temporary disturbances but altered the underlying relationships between energy and food markets. Results of the Chow tests indicated that these three shocks change the character of relationships between the analysed data series. However, the MS-VAR modelling pointed out that crises differ not only in magnitude but also in structural persistence. It turned out that pandemic-related disruptions may have permanently altered supply chain structures and price formation mechanisms, to a greater extent than purely financial shocks, causing regime instability noticed in the food commodities–food CPI and energy–food CPI relationships. Results showed that these two relationships could be temporarily changed in the face of international supply chain disturbances.
The significance of this study lies in its comprehensive analysis of the transmission of global energy price shocks to agricultural and food markets, covering multiple major crises over a long-time horizon. While numerous studies have examined the impact of individual energy price shocks on commodity markets, most focus on isolated events or short periods. Simultaneously considering three breaking points enables a more holistic understanding of how global energy disruptions affect both agricultural commodity prices and consumer food prices.
Our findings contribute to the literature in several important ways. We demonstrate a long-term relationship between detrended energy prices, agricultural commodities, and consumer food price indices, providing evidence of persistent linkages beyond short-term fluctuations. We show that global energy price shocks translate noticeably into shocks in agricultural and food markets, highlighting the vulnerability of global food systems to energy volatility. Moreover, by employing advanced econometric techniques, including Chow testing and MS-VAR models, we identify which structural breaks signal regime shifts in the relationships between energy and both agricultural and food prices, offering a more nuanced understanding of how crises alter market dynamics. In other words, this work extends existing research on energy–food price interactions by integrating multiple crises, using robust statistical methods, and focusing on both commodity and consumer price levels. Most importantly, it contributes to filling the research gap identified in this study, namely, how price relationships within the global food supply chain respond to energy shocks.
The findings carry several policy implications. Energy market volatility directly affects agricultural production costs, implying that energy and food policies are inherently linked. Governments should prioritise diversification of energy sources, adoption of renewable inputs in agriculture, and targeted interventions upstream in supply chains rather than relying solely on consumer-level subsidies. Monetary authorities must account for delayed food CPI effects when designing inflation policy, while social programmes should target vulnerable households exposed to lagged food inflation. Furthermore, structural breaks differ in persistence, suggesting that crisis-specific, regime-aware policies are necessary, particularly in response to pandemics, financial shocks, or geopolitical conflicts. At the global level, coordinated energy and food security strategies are crucial to mitigate spillovers and protect food system stability.
Overall, the study underscores the importance of recognising regime-dependent, nonlinear interactions in commodity markets. Understanding the transmission of shocks across energy and food sectors is essential for designing resilient macroeconomic, agricultural, and social policies in an increasingly volatile global environment.
5. Conclusions
According to the theory, energy is a cost driver in food systems. Empirical studies analyse supply-side impacts of changing input and production costs, as well as price transmission mechanisms. Higher energy prices increase production and distribution costs, reducing supply and contributing to food price inflation. From the other side, energy price changes can influence food demand indirectly through the real income effect and directly through competition effects. Energy price increases reduce real household income and can shift food demand, sometimes toward cheaper staples. The outcome is also affected by other factors like macroeconomic conditions, biofuel policies, or global trade dynamics. Although the relationship has been more often perceived as nonlinear and context-dependent, the three braking points we analysed caused energy shocks that had substantial and lasting effects on food systems and inflation in food markets worldwide.
In summary, three principal conclusions can be drawn from this study. First, cyclical co-movements rather than trends drive the interconnected dynamics between energy, food commodities, and consumer food prices. Second, although global energy price shocks are visibly transmitted to global food commodities and consumer food prices, the delay in transmission to consumer food prices suggests incomplete and nonlinear pass-through. Third, structural breaks do not always persistently alter the relationships between energy, food commodity, and consumer food prices, with the relationship between energy and consumer food prices proving to be the most sensitive to structural breaking points.
The limitation of this study is that, like the majority of studies in this area, it focuses on investigating the link between global oil prices and global food prices. In fact, there is a research gap in how regional energy prices could influence regional food prices. One of the main reasons for the scarce literature available could be the difficulty in accessing data resources. Hence, due to the different economic structures of countries with different income levels, conducting an empirical study in this scientific field can significantly contribute to the ongoing debate on the relationship between energy price policies and food prices. Given the importance of this issue, our future attempts will be directed to fill this research gap.
Secondly, most studies examining the relationship between energy and food prices rely on Granger causality tests and time-varying impulse response analysis to assess cross-market price transmission. However, Granger causality does not establish true causal relationships. It only detects statistical predictive power. Similarly, while time-varying impulse response functions capture dynamic responses, they are limited in scope. These functions show whether the impact of a shock intensifies or weakens at a given moment, but they fail to provide comprehensive insights over extended horizons or to identify the directionality of international grain price influences. To compare, MS-VAR and TVP-VAR models allow for recognising when the system has entered a new regime, modelling volatility, as well as for better forecasting the effects of energy shocks under different macroeconomic conditions. Therefore, in future studies, these models should be prioritised. Country-level MS-VAR or panel regime-switching models could especially reveal regional differences.
Other future research directions include using threshold models or quantile regressions that could detect whether transmission intensifies during extreme shocks. Incorporating covariates (e.g., policy indices, geopolitical risk indicators) into regime switching could explain why certain crises generate more persistent regimes. Additionally, analysing specific food categories (grains, meat, dairy) may reveal heterogeneous responses. Future studies could assess how renewable energy expansion changes the analysed dynamics; combining macro time series with industrial organisation data could test the hypothesis of supply chain power asymmetry.
Author Contributions
Conceptualization, S.F.; methodology, J.G., S.F., and J.K.-G.; software, J.G., and J.K.-G.; validation, J.G., S.F., and J.K.-G.; formal analysis, J.G. and J.K.-G.; investigation, J.G., S.F., and J.K.-G.; resources, S.F. and J.K.-G.; data curation, S.F., J.G., and J.K.-G.; writing—original draft preparation, J.G., S.F., and J.K.-G.; writing—review and editing, J.G., S.F., and J.K.-G.; visualisation, S.F. and J.K.-G.; supervision, J.G., S.F., and J.K.-G.; project administration, J.G., S.F., and J.K.-G.; funding acquisition, S.F. and J.K.-G. All authors have read and agreed to the published version of the manuscript.
Funding
The research was partially funded by the FoSSNet project.
Institutional Review Board Statement
Not applicable.
Data Availability Statement
The detailed results obtained are available on request from the corresponding author. Publicly available datasets analysed in this study can be found here: https://data360.worldbank.org/en/dataset/FAO_CP and https://www.worldbank.org/en/research/commodity-markets, accessed on 12 July 2025.
Conflicts of Interest
The authors declare no conflicts of interest.
References
- Radmehr, R.; Rastegari Henneberry, S. Energy price policies and food prices: Empirical evidence from Iran. Energies 2020, 13, 4031. [Google Scholar] [CrossRef] [Scilit]
- Moessner, R. Effects of Energy Prices on Food Consumer Price Inflation; CESifo Working Paper, No. 11682; CESifo GmbH: Munich, Germany, 2025. [Google Scholar]
- Karakotsios, A.; Katrakilidis, C.; Kroupis, N. The dynamic linkages between food prices and oil prices. Does asymmetry matter? J. Econ. Asymmetries 2021, 23, e00203. [Google Scholar] [CrossRef] [Scilit]
- Hanson, K.; Robinson, S.; Schluter, G. Sectoral effects of a world oil price shock: Economy-wide linkages to the agricultural sector. J. Agric. Resour. Econ. 1993, 18, 96–116. [Google Scholar] [CrossRef]
- Dvoskin, D.; Heady, E.O. Commodity prices and resource use under various energy alternatives in agriculture. West. J. Agric. Econ. 1977, 2, 53–62. [Google Scholar]
- Abbott, P.C.; Hurt, C.; Tyner, W.E. What’s Driving Food Prices? Farm Foundation: Oak Brook, IL, USA, 2008. [Google Scholar]
- Harri, A.; Nalley, L.; Hudson, D. The relationship between oil, exchange rates, and commodity prices. J. Agric. Appl. Econ. 2009, 41, 501–510. [Google Scholar] [CrossRef] [Scilit]
- Alnour, M.; Altıntaş, H.; Rahman, M.N. Unveiling the asymmetric response of global food prices to the energy prices shocks and economic policy uncertainty. World Dev. Sustain. 2023, 3, 100083. [Google Scholar] [CrossRef] [Scilit]
- Ibrahim, M.H. Oil and food prices in Malaysia: A nonlinear ARDL analysis. Agric. Food Econ. 2015, 3, 2. [Google Scholar] [CrossRef] [Scilit]
- Zhang, Y. Asymmetric transmission of energy prices to food prices in UK grocery retail. Adv. Econ. Manag. Political Sci. 2025, 242, 70–76. [Google Scholar] [CrossRef] [Scilit]
- Zhuang, X.; Wang, S.; Tang, Z.; Fu, Z.; Dong, B. Food security under energy shock: Research on the transmission mechanism of the effect of international crude oil prices on Chinese and U.S. grain prices. Systems 2025, 13, 870. [Google Scholar] [CrossRef] [Scilit]
- Arintoko, A.; Badriah, L.S.; Kadarwaiti, N. The asymmetric effects of global energy and food prices, exchange rate dynamics, and monetary policy conduct on inflation in Indonasia. Ekonomika 2024, 103, 66–89. [Google Scholar] [CrossRef] [Scilit]
- Ali, S.; Mughal, K.M.; Gillani, D.Q. Examine the impact of energy cost on the food inflation: Fresh evidence from Pakistan economy. Int. J. Appl. Soc. Sci. 2025, 5, 132–145. [Google Scholar] [CrossRef] [Scilit]
- Gradzewicz, M.; Jabłonowski, J.; Sasiela, M.; Żółkiewski, Z. The impact of energy price increases on the Polish economy. Energy Econ. 2024, 140, 107944. [Google Scholar] [CrossRef] [Scilit]
- Dai, Y.-S.; Dai, P.-F.; Goutte, S.; Nguyen, D.K.; Zhou, W.-X. Moment connectedness in the energy–food nexus: A time–frequency perspective. arXiv 2025, arXiv:2510.24174. [Google Scholar] [CrossRef] [Scilit]
- Zhang, T.; Xu, H.-C.; Zhou, W.-X. The impact of external uncertainties on the extreme return connectedness between food, fossil energy, and clean energy markets. arXiv 2025, arXiv:2503.06603. [Google Scholar] [CrossRef] [Scilit]
- Reboredo, J.C. Do food and oil prices co-move? Energy Policy 2012, 49, 456–467. [Google Scholar] [CrossRef] [Scilit]
- Saghaian, S.H. The impact of the oil sector on commodity prices: Correlation or causation? J. Agric. Appl. Econ. 2010, 42, 477–485. [Google Scholar] [CrossRef] [Scilit]
- Fowowe, B. Do oil prices drive agricultural commodity prices? Evidence from South Africa. Energy 2016, 104, 149–157. [Google Scholar] [CrossRef] [Scilit]
- Zhang, Z.; Lohr, L.; Escalante, C.; Wetzstein, M. Food versus fuel: What do prices tell us? Energy Policy 2010, 38, 445–451. [Google Scholar] [CrossRef] [Scilit]
- Baumeister, C.; Kilian, L. Do oil price increases cause higher food prices? Econ. Policy 2014, 29, 691–747. [Google Scholar] [CrossRef] [Scilit]
- Chen, S.-T.; Kuo, H.-I.; Chen, C.-C. Modeling the relationship between the oil price and global food prices. Appl. Energy 2010, 87, 2517–2525. [Google Scholar] [CrossRef] [Scilit]
- Nazlioglu, S.; Erdem, C.; Soytas, U. Volatility spillover between oil and agricultural commodity markets. Energy Econ. 2013, 36, 658–665. [Google Scholar] [CrossRef] [Scilit]
- Nazlioglu, S.; Soytas, U. Oil price, agricultural commodity prices, and the dollar: A panel cointegration and causality analysis. Energy Econ. 2012, 34, 1098–1104. [Google Scholar] [CrossRef] [Scilit]
- Hezareh, R.; Shnoushi, N.; Mohammadi, H.; Saghaian, S.M. Analysing the role of economic variables on food prices in the selected oil exporting and importing countries. Agric. Econ. 2015, 9, 75–96. [Google Scholar]
- Esmaeili, A.; Shokoohi, Z. Assessing the effect of oil price on world food prices: Application of principal component analysis. Energy Policy 2011, 39, 1022–1025. [Google Scholar] [CrossRef] [Scilit]
- Alghalith, M. The interaction between food prices and oil prices. Energy Econ. 2010, 32, 1520–1522. [Google Scholar] [CrossRef] [Scilit]
- Baffes, J. Oil spills on other commodities. Resour. Policy 2007, 32, 126–134. [Google Scholar] [CrossRef] [Scilit]
- Zimmer, Y.; Marques, G.V. Energy cost to produce and transport crops—The driver for crop prices? Case study for Mato Grosso, Brazil. Energy 2021, 225, 120260. [Google Scholar] [CrossRef] [Scilit]
- Edelstein, P.; Kilian, L. How sensitive are consumer expenditures to retail energy prices? J. Monet. Econ. 2009, 56, 766–779. [Google Scholar] [CrossRef] [Scilit]
- Deaton, A.; Muellbauer, J. An Almost Ideal Demand System. Am. Econ. Rev. 1980, 70, 312–326. [Google Scholar]
- Figiel, S.; Hamulczuk, M. The effects of increase in the production of biofuels on world agricultural prices and food security. Eur. Sci. J. 2013, 9, 10–17. [Google Scholar]
- Kirikkaleli, D.; Darbaz, I. The causal linkage between energy price and food price. Energies 2021, 14, 4182. [Google Scholar] [CrossRef] [Scilit]
- Hamilton, J.D. Causes and consequences of the oil shock of 2007–2008. Brook. Pap. Econ. Act. 2009, 40, 215–261. [Google Scholar] [CrossRef] [Scilit]
- Kilian, L. Not all oil price shocks are alike: Disentangling demand and supply shocks in the crude oil market. Am. Econ. Rev. 2009, 99, 1053–1069. [Google Scholar] [CrossRef] [Scilit]
- International Monetary Fund. World Economic Outlook: Crisis and Recovery; IMF: Washington, DC, USA, 2009. [Google Scholar]
- International Energy Agency. Global Energy Review 2020; IEA: Paris, France, 2020.
- U.S. Energy Information Administration. Short-Term Energy Outlook, May 2020; EIA: Washington, DC, USA, 2020.
- Figiel, S.; Floriańczyk, Z.; Wigier, M. Impact of the COVID-19 pandemic on the world energy and food commodity prices: Implications for global economic growth. Energies 2023, 16, 3152. [Google Scholar] [CrossRef] [Scilit]
- Narayan, P.K. Oil price news and COVID-19—Is there any connection? Energy Res. Lett. 2020, 1, 13176. [Google Scholar] [CrossRef] [Scilit]
- International Energy Agency. World Energy Outlook 2021; IEA: Paris, France, 2021.
- European Central Bank. The Impact of the War in Ukraine on Euro Area Energy Markets. Economic Bulletin Issue 4. 2022. Available online: https://www.ecb.europa.eu/press/economic-bulletin/html/eb202204.en.html#toc15 (accessed on 12 July 2025).
- Boungou, W.; Yatié, A. The impact of the Ukraine–Russia war on world stock market returns. Econ. Lett. 2022, 215, 110516. [Google Scholar] [CrossRef] [Scilit]
- World Bank. Commodity Markets Outlook: The Impact of the War in Ukraine on Commodity Markets; World Bank: Washington, DC, USA, 2022. [Google Scholar]
- Amaglobeli, D.; Gu, M.; Hanedar, E.; Hong, G.H.; Thévenot, C. Policy Responses to High Energy and Food Prices; WP/23/74; International Monetary Fund: Washington, DC, USA, 2023. [Google Scholar]
- Baumeister, C.; Peersman, G. Time-varying effects of oil supply shocks on the US economy. Am. Econ. J. Macroecon. 2013, 5, 1–28. [Google Scholar] [CrossRef] [Scilit]
- Bai, J.; Perron, P. Computation and analysis of multiple structural change models. J. Appl. Econom. 2003, 18, 1–22. [Google Scholar] [CrossRef] [Scilit]
- Gómez, V.; Maravall, A. Automatic Modeling Methods for Univariate Series; John Wiley & Sons: New York, NY, USA, 2011. [Google Scholar] [CrossRef] [Scilit]
- Dickey, D.A.; Fuller, W.A. Likelihood ratio statistics for autoregressive time series with a unit root. Econometrica 1981, 49, 1057–1072. [Google Scholar] [CrossRef] [Scilit]
- Kwiatkowski, D.; Phillips, P.; Schmidt, P.; Shin, Y. Testing the null hypothesis of stationarity against the alternative of a unit root: How sure are we that economic time series have a unit root? J. Econom. 1992, 54, 159–178. [Google Scholar] [CrossRef] [Scilit]
- Hodrick, R.J.; Prescott, E.C. Post-war U.S. business cycles: An empirical investigation. J. Money Credit Bank. 1997, 29, 1–16. [Google Scholar] [CrossRef] [Scilit]
- Cottrell, A.; Lucchetti, R. Gretl User’s Guide. Gnu Regression, Econometrics and Time-Series Library. 2016. Available online: https://gretl.sourceforge.net/gretl-help/gretl-guide.pdf (accessed on 12 July 2025).
- Johansen, S. Estimation and hypothesis testing of cointegration vectors in Gaussian vector autoregressive models. Econometrica 1991, 59, 1551–1580. [Google Scholar] [CrossRef] [Scilit]
- Granger, C.W.J.; Maasoumi, E.; Racine, J. A Dependence Metric for Possibly Nonlinear Processes. J. Time Ser. Anal. 2004, 25, 649–669. [Google Scholar] [CrossRef] [Scilit]
- Kole, E.; van Dijk, D. Moments, shocks and spillovers in Markov-switching VAR models. J. Econom. 2023, 236, 105474. [Google Scholar] [CrossRef] [Scilit]
- Fornaciari, M.; Carlo Grillenzoni, C. Evaluation of on-line trading systems: Markov-switching vs time-varying parameter models. Decis. Support Syst. 2017, 93, 51–61. [Google Scholar] [CrossRef] [Scilit]
- Kufel, T. Rozwiązywanie Problemów z Wykorzystaniem Programu GRETL; Wydawnictwo Naukowe PWN: Warsaw, Poland, 2004. [Google Scholar]

Disclaimer/Publisher’s Note: The statements, opinions and data contained in all publications are solely those of the individual author(s) and contributor(s) and not of MDPI and/or the editor(s). MDPI and/or the editor(s) disclaim responsibility for any injury to people or property resulting from any ideas, methods, instructions or products referred to in the content. |
© 2026 by the authors. Licensee MDPI, Basel, Switzerland. This article is an open access article distributed under the terms and conditions of the Creative Commons Attribution (CC BY) license.