


Abstract
Aiming at the problems of uneven radiation distribution and difficult regulation in double-film multi-span greenhouses in the Gobi Desert, a spatiotemporal simulation model of the radiation environment based on the coupling of Rhino–Grasshopper and Radiance was constructed in this study. Parametric simulation and multi-objective optimization were adopted to significantly improve the solar radiation capture and distribution uniformity inside the greenhouse, providing a scientific basis for greenhouse design in the Gobi area. The results show that the model has high accuracy (R2 > 0.98), and the radiation inside the greenhouse presents a distribution pattern of “higher in the northeast, lower in the southwest, higher in the upper layer and lower in the lower layer”. The optimal orientation is 1° west of south, and the optimal configuration is 8 m span, 5 m eave height, and 30° roof slope. This study can provide quantitative support for the structural design, planting layout and energy-saving regulation of double-film multi-span greenhouses in arid desert areas, and has important practical value for promoting the efficient and sustainable development of facility agriculture in the Gobi Desert.
1. Introduction
In the past decade, global food security has faced superposed risks and structural challenges. On the one hand, population growth and dietary upgrading continue to push up the demand for high-quality agricultural products. On the other hand, climate warming has increased the frequency and intensity of extreme high temperatures, droughts and floods, directly impacting the stable supply of major production areas [1,2]. Meanwhile, land degradation, soil salinization, and spatiotemporal imbalance of water resources have further aggravated the uncertainty of agricultural production.
In the arid regions of Northwest China and Central Asia, there are typical Gobi Desert areas. Although they have potential resources, such as high annual total radiation and a large amount of unused land, agricultural production is limited by the extreme climate, water shortages, large diurnal temperature differences, wind and sand erosion, so the yield and quality of open-field crops are difficult to be stably guaranteed [3,4]. In this context, facility agriculture represented by greenhouses provides a suitable production environment for crop growth by establishing an enclosure structure and environmental control to isolate the adverse external climate. With the help of precision irrigation, greenhouse thermal insulation and active environmental regulation (shading, ventilation, supplementary radiation, etc.), the output efficiency of per unit water and per unit land in the Gobi Desert has been significantly improved, realizing stable anti-climate production of agricultural crops [5,6]. The Gobi Desert is characterized by high annual total radiation, strong evaporation potential and a significant diurnal temperature difference, which together determine the high sensitivity of facility agriculture and its selective utilization of radiation and heat resources. In such areas, greenhouses not only undertake the capture of radiation energy and the regulation of thermal environment required for crop growth, but also need to maintain high energy efficiency and stability under extreme radiation, low humidity and frequent dust storms [7].
Compared with single-span structures, multi-span greenhouses have higher land utilization efficiency, which can provide a higher effective cultivation area and a more continuous internal microclimate for agricultural production. However, their complex roof shape, gutters and enclosure structure shading will also cause uneven spatial radiation distribution inside, thereby affecting the photosynthetically active radiation of the crop canopy and reducing crop yield and quality [8]. To maintain the normal growth of crops at a low temperature at night and in extreme winter weather, double-film greenhouses have great development potential due to their excellent thermal insulation performance. The double-layer structure reduces the overall heat transfer coefficient of the greenhouse by forming a static or slowly flowing air cavity, and also inhibits the condensation and dripping risks of the greenhouse. Nevertheless, the multi-interface refraction, reflection and scattering effects of the double film will change the angular distribution and spectral composition of incident radiation. Combined with the periodic shading of the roof ridge, gutter and other enclosure structures of multi-span greenhouses, the irradiance of different spans and heights inside the greenhouse varies significantly [9]. Especially in periods of low solar altitude and in winter, the change in relative orientation between solar radiation and the internal structure of the greenhouse will amplify this difference [10,11]. Based on the premise of ensuring thermal performance, the collaborative optimization of radiation environment intensity and uniformity of double-film multi-span greenhouses is a core challenge of current greenhouse optimization design.
In recent years, many researchers have devoted themselves to the study of greenhouse radiation environments and proposed various calculation and modeling methods for radiation environment distribution [12]. Huang et al. [13] improved the efficiency of solar energy determination by modeling the radiation environment of solar greenhouses. Aiming at the problem that it is difficult to establish a comprehensive roof calculation equation for complex roof structures, they proposed a technology with strong applicability, high accuracy and fast simulation speed, which solved the simulation problem of complex roof radiation environments. Castellano et al. [14,15] used Autodesk Ecotect software 2011 to calculate the radiation environment distribution inside greenhouses under different photovoltaic installation modes and roof coverage rates on specific days, and optimized the photovoltaic panel configuration on greenhouse roofs. Chen et al. [16] established a simulation model of the radiation environment of greenhouses with shading nets according to the law of solar trajectory, so as to determine the optimal orientation calculation model of solar greenhouses at different latitudes. Ohashi et al. [17] and Kim et al. [18] calculated indoor solar radiation. During the simulation process, the calculation accuracy of diffuse radiation can be manually set, balancing the relationship between calculation efficiency and accuracy, and accurately describing the greenhouse radiation environment. Mu et al. [19] established a radiation environment simulation model suitable for various greenhouses based on the computer technology of ray tracing and the Monte Carlo method. Bo et al. [20] developed greenhouse radiation environment simulation software based on ray tracing and the Monte Carlo method to analyze the ray paths of sampling points. Zhang et al. [3] proposed a backward ray-tracing method, assuming sky uniformity, and comprehensively studied the influence of different roof angles on the radiation environment of solar greenhouses at the same ridge height by integrating various models and simulation methods. Xu et al. [21,22] analyzed the radiation transmittance of greenhouse roofs at different solar altitudes combined with three-dimensional simulation modeling, analyzed the spatiotemporal distribution of irradiance inside greenhouses by using the Functional–Structural Plant Model (FSPM), and proposed a three-dimensional simulation framework for greenhouse auxiliary lighting optimization. This virtual model combines the spectral power distribution (SPD) and propagation characteristics of light-emitting diode (LED) components, the radiometric properties of greenhouse materials, and the geometric structure of greenhouses to simulate the artificial radiation environment. Chen et al. [23] proposed a data-driven decision-making method for radiation environment control in different areas of greenhouses, providing a design of precise supplementary radiation deployment for actual crop conditions. Gao et al. [24] proposed a novel multi-objective optimization framework for optimizing the radiation environment of cucumber seedlings, established a data-driven prediction method for the photosynthetic rate (Pn) under varying temperatures, and improved the instantaneous radiation use efficiency by 69%. Ma et al. [25] adopted a three-dimensional canopy photosynthesis model and used the Technique for Order Preference by Similarity to an Ideal Solution (TOPSIS) to comprehensively evaluate the greenhouse radiation environment for a single fruit index. Liu et al. [15,26] established a multi-objective optimization model of a greenhouse radiation environment aiming at maximizing crop photosynthetic rate and minimizing energy consumption cost, and proposed an algorithm based on multi-objective optimization. The results showed that the CC value of the model was 0.9803, indicating that the model and algorithm had good predictive performance. Zhang et al. [27] developed a computer program in MATLAB 2019 to calculate the multiple reflected radiation of solar greenhouses. The researchers iteratively calculated the radiation reflection process of the greenhouse system using the distribution coefficients of multiple surface reflection angles.
In the Hotan Gobi Desert, Xinjiang, plastic greenhouses and simple solar greenhouses are the mainstream agriculture buildings, but they have problems such as poor thermal insulation and weak wind and sand resistance, making it difficult to carry out large-scale production. The double-film multi-span greenhouse studied in this paper can solve the above problems, but it needs to be verified by high-precision simulation. Based on the above needs and tool foundation, this paper constructs a radiation environment model based on Rhino modeling and Grasshopper–Ladybug/Honeybee (Radiance) simulation for new desert multi-span film greenhouses, which can effectively improve the solar radiation use efficiency and uniformity of greenhouses. The research objectives include: (1) establishing a parametric geometric and material model of multi-span double-film greenhouses, covering key variables such as span, bay spacing, ridge height, roof inclination and overall orientation; (2) under typical sky and solar path conditions, use Monte Carlo path tracing to calculate the irradiance intensity, direct-diffuse component and uniformity at different heights and orientations indoors, and analyze its spatiotemporal distribution law from multiple scales of typical days, typical periods and typical meteorological conditions; and (3) on the premise of maintaining the thermal insulation performance of the greenhouse, carry out sensitivity analysis and optimization direction for orientation and configuration parameters, and put forward greenhouse design suggestions with reference significance.
2. Materials and Methods
2.1. Experimental Greenhouse and Measurement Points
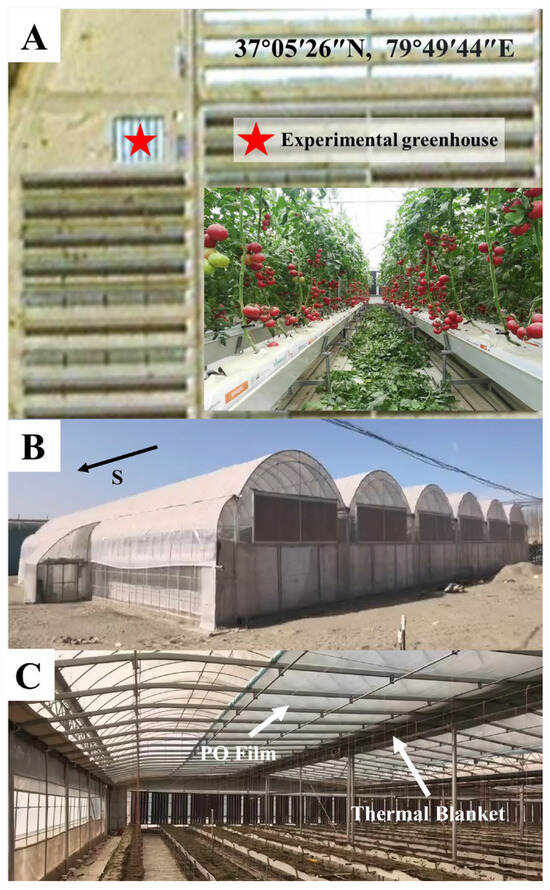
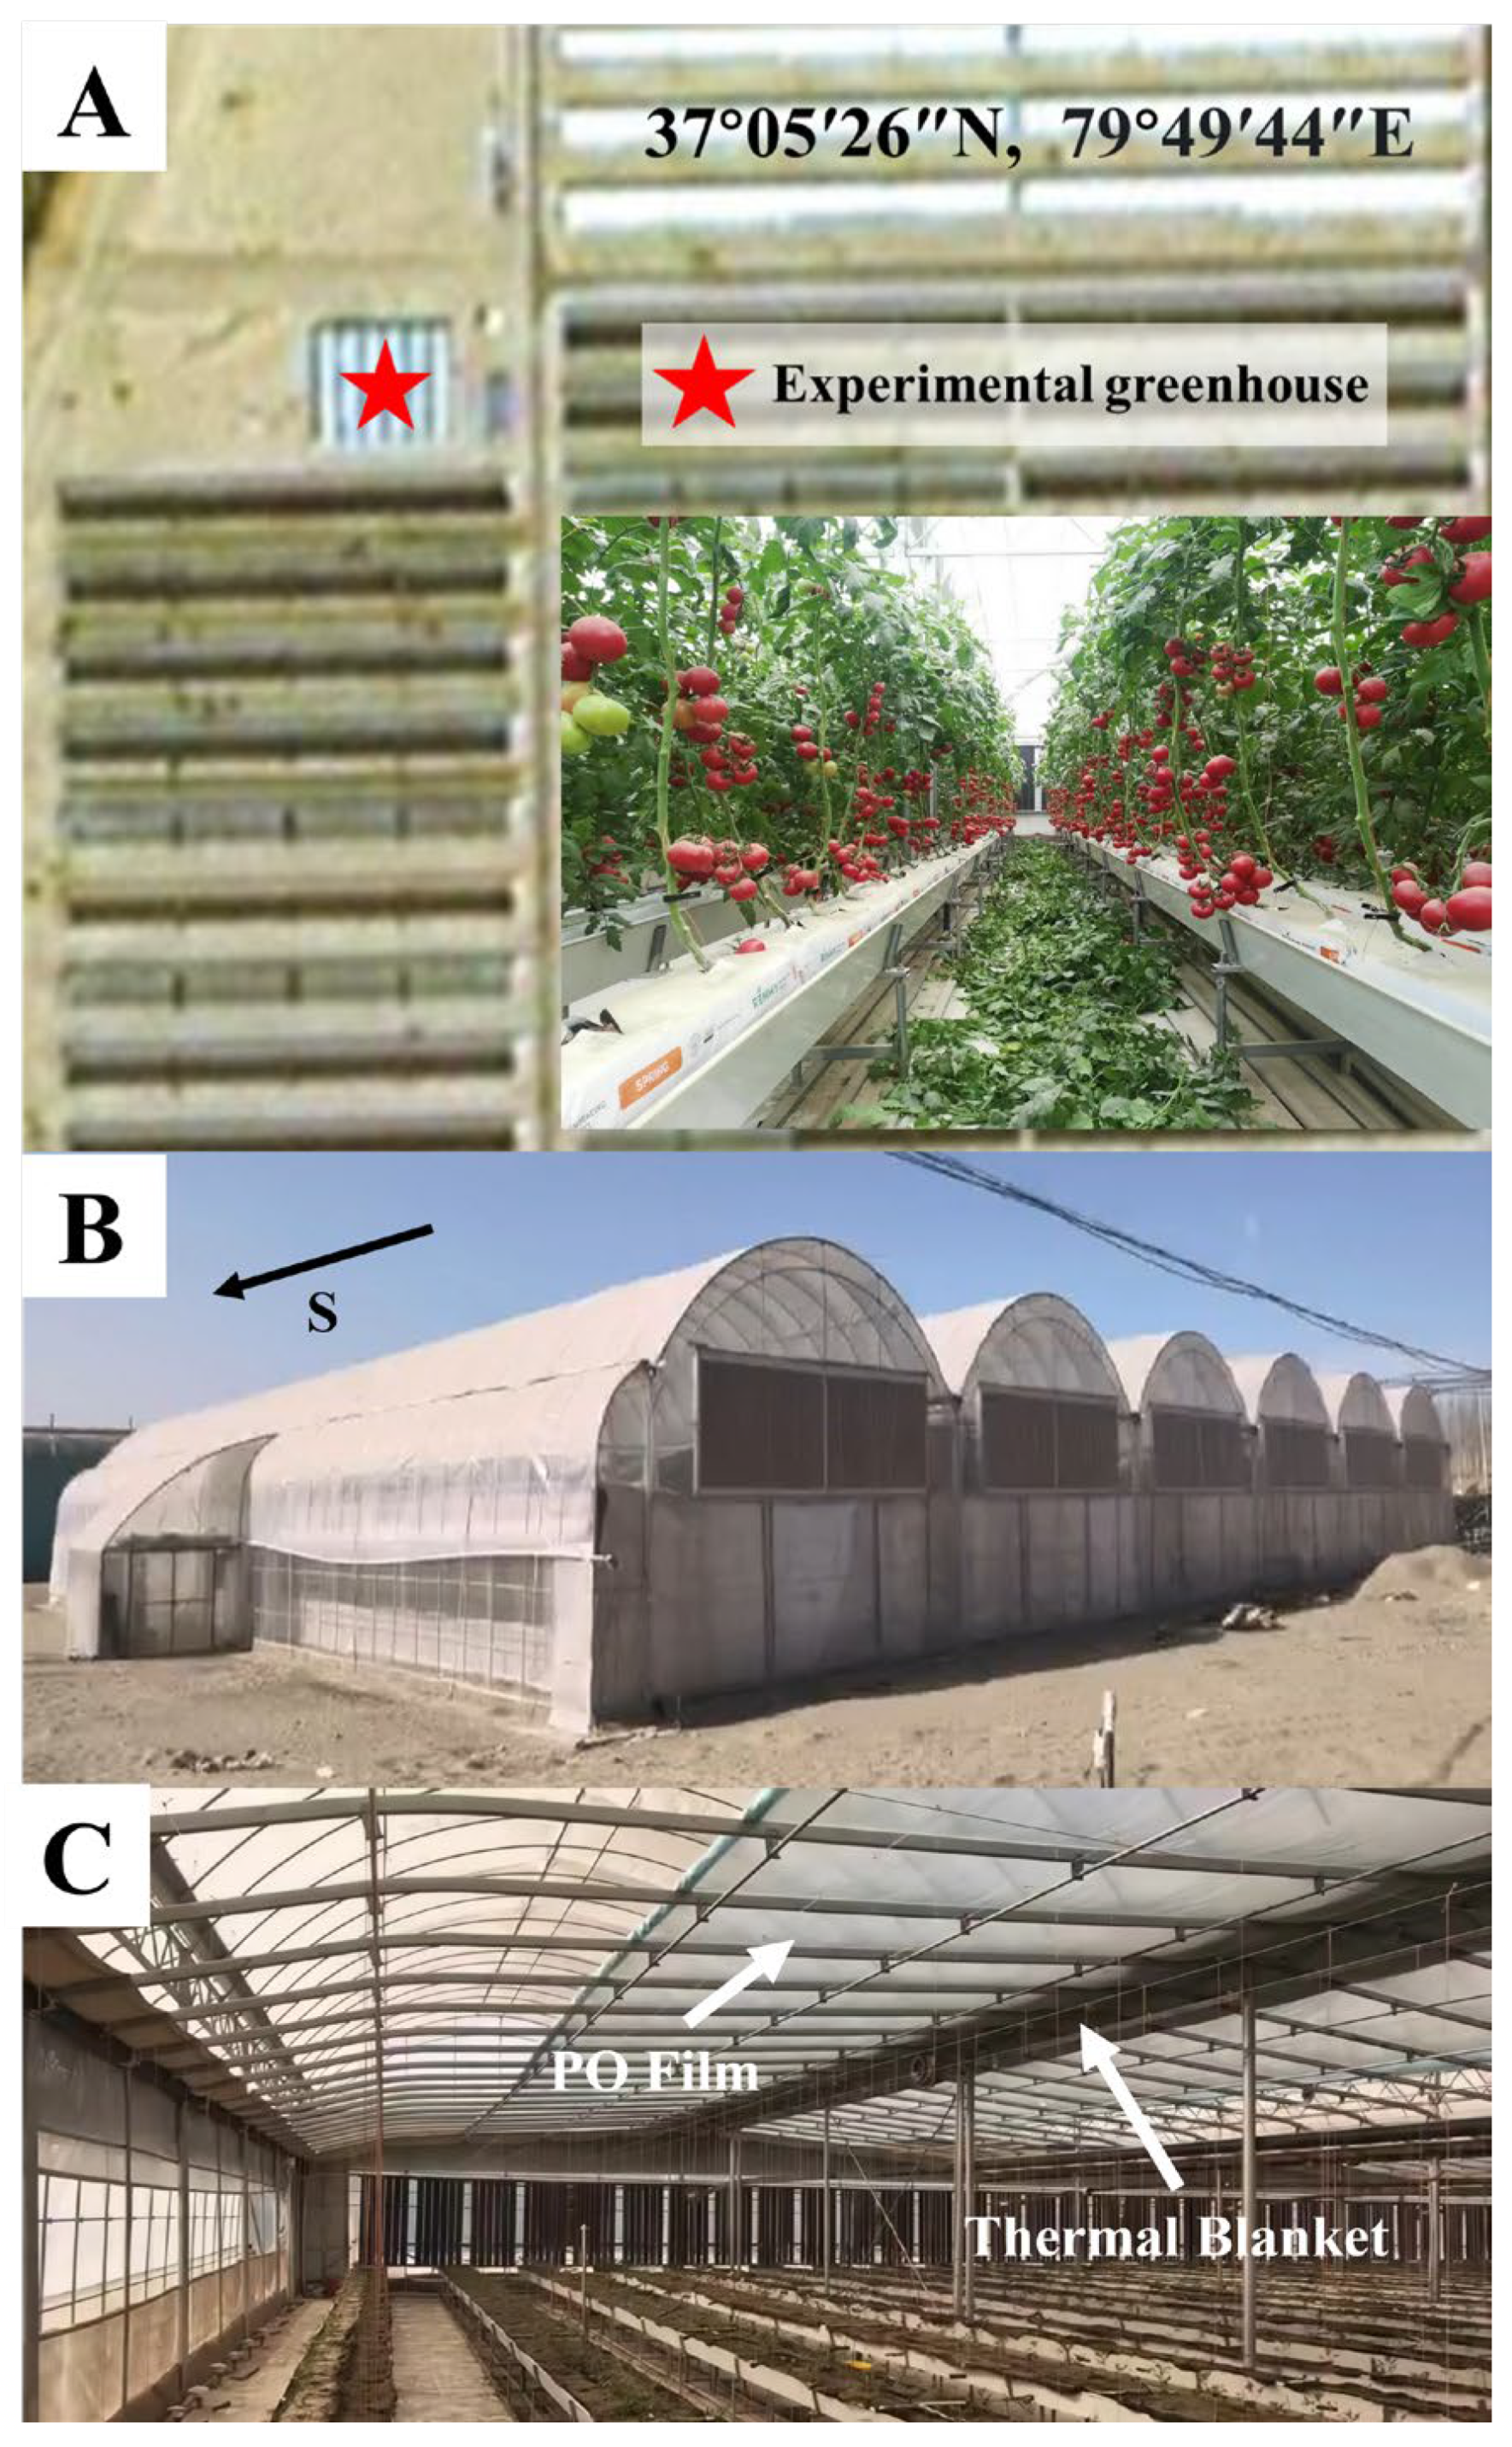
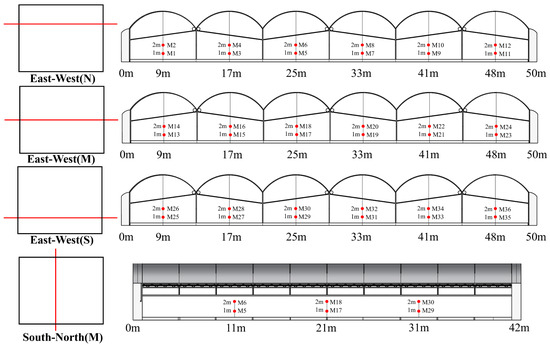
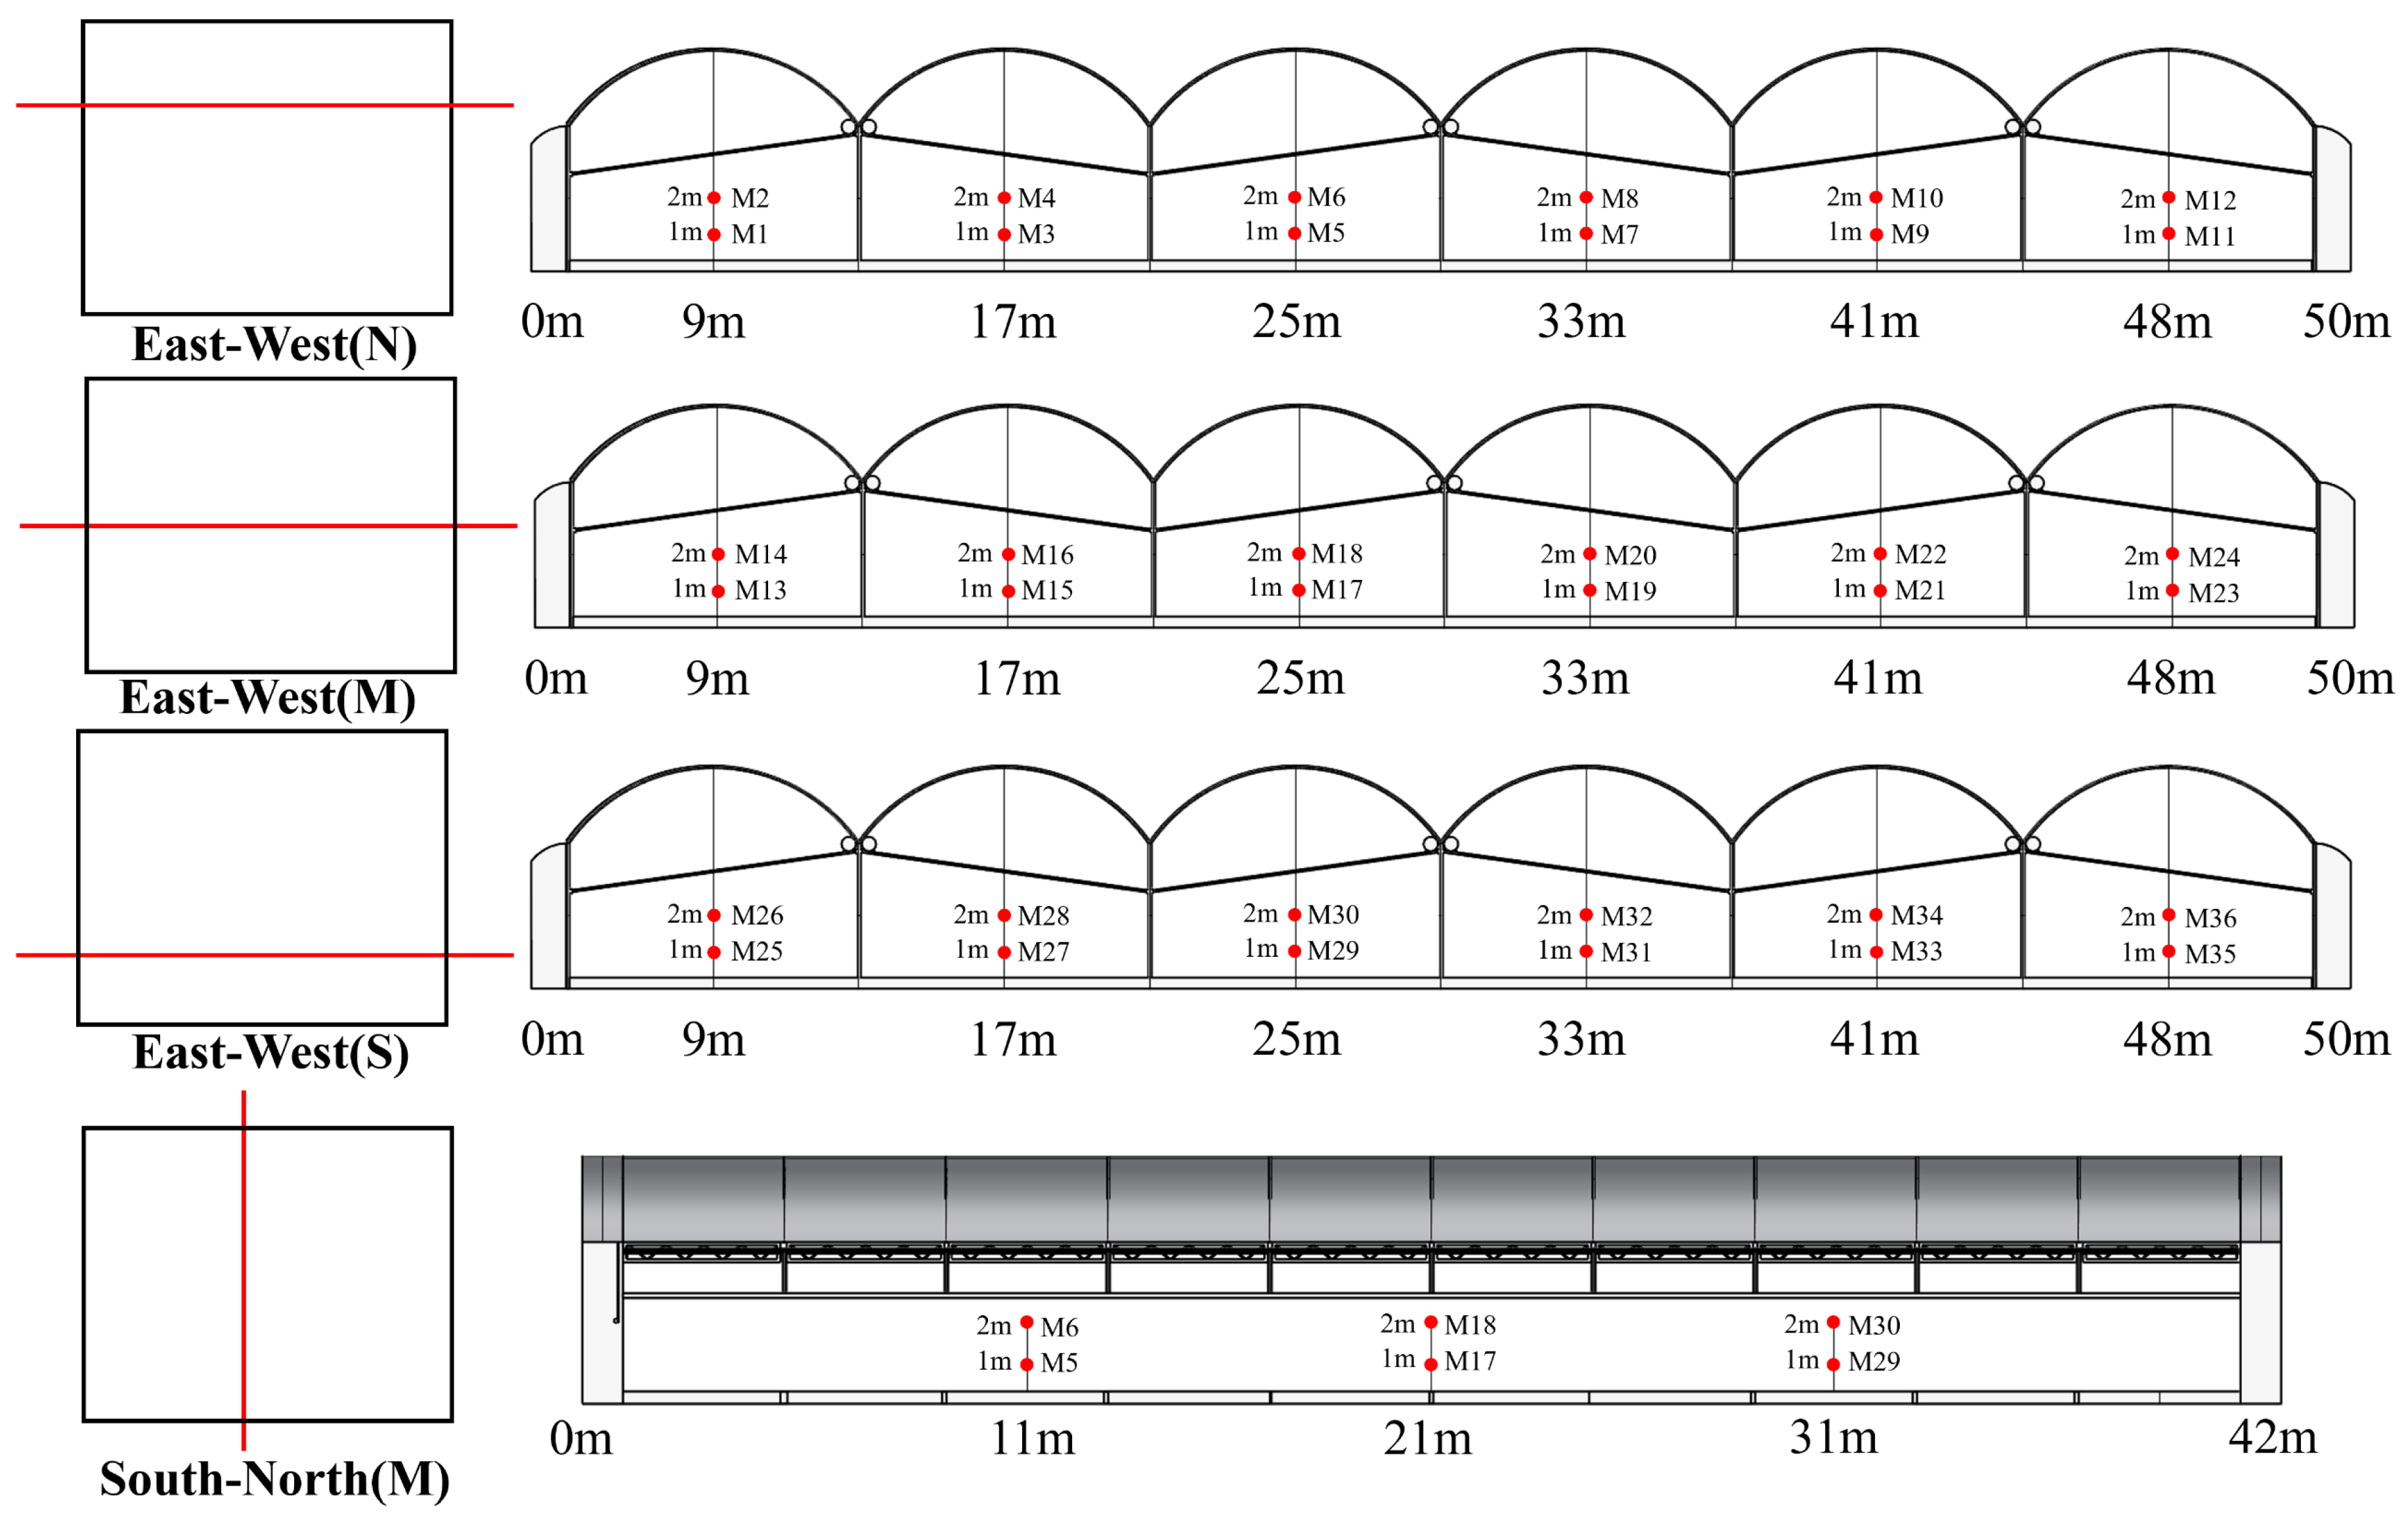
As shown in Figure 1, the experimental greenhouse is in Hotan County, Hotan Prefecture, Xinjiang Uygur Autonomous Region (37°05′26″ N, 79°49′44″ E, with an altitude ranging from 1300 to 1450 m). This region is characterized by a typical arid climate on the edge of a desert, featuring an average annual precipitation of 35.2 mm, an evaporation amount of 2480 mm, and a frost-free period of 182 days. Due to the large diurnal temperature range in the Hotan area combined with the presence of extreme temperatures during winter, conventional plastic multi-span greenhouses struggle to maintain nighttime temperatures inside the greenhouse. Therefore, a double-film structure combined with the addition of thermal insulation blankets was adopted to maintain the internal temperature. The greenhouse consists of two layers: an outer layer and an inner layer. The outer greenhouse has a span length of 50 m, a width of 42 m, an eave height of 4 m, and a ridge height of 6.1 m. A 1 m buffer zone exists between the outer greenhouse and the inner greenhouse; this zone reduces the direct contact between external air and the internal environment, thereby further improving the thermal insulation performance of the greenhouse. The inner layer of the greenhouse measures 48 m in length and 40 m in width. The north wall is treated with a fully enclosed thermal insulation blanket. The east, west, and south sides are equipped with retractable thermal insulation blankets and PO (polyolefin) film devices. During the day, these blankets are rolled up to increase the amount of light entering the greenhouse; at night, they are lowered to serve as thermal insulation for the greenhouse. Table 1 lists the main relevant parameters of the experimental instruments. The measurement of the light environment inside the greenhouse was conducted using a data logger combined with total solar radiation sensors. The measurement range of the sensors is 0~2000 W/m2. The data logger operates with a collection frequency of once every 10 min. The stored data can be viewed by inputting them into a computer. The layout of the total radiation sensors inside the greenhouse (totaling 36 sensors) is shown in Figure 2.
Figure 1.
(A) Location of the experimental greenhouse and crops planted inside; (B) external view of the experimental greenhouse; (C) internal view of the experimental greenhouse.
Table 1.
Relevant parameters of the experimental instruments.
Figure 2.
Layout diagram of the radiation sensors in the experimental greenhouse.
2.2. Theory and Methods for Constructing the Greenhouse Radiation Model
The greenhouse radiation model in this study consists of ground solar radiation and indoor radiation. Ground solar radiation includes solar radiation intensity, solar altitude angle and incidence angle [28,29]. The solar radiation inside the greenhouse is composed of direct radiation and diffuse radiation. The indoor solar radiation is calculated by the geometric projection method and ray-tracing method.
2.2.1. Terrestrial Solar Radiation Intensity
The study of the radiation environment inside the greenhouse must start from the external solar radiation. Continuous nuclear fusion reactions occur inside the sun, emitting radiation at a rate of E ≈ 3.8 × 1026 W/s, of which less than one hundred millionth of the energy reaches the Earth’s atmosphere. According to the observation data of the World Meteorological Organization (WMO) in 1981, the average solar radiation intensity at the upper boundary of the Earth’s atmosphere is 1369 W/m2. In this study, the local meteorological data were obtained by using EnergyPlus software V25.1.0, which meets the research needs by comparing with the measured values and can be used to improve the calculation accuracy. The near-ground solar radiation consists of direct radiation and diffuse radiation. According to the atmospheric transparency coefficient, the solar radiation intensity parameters at a specific point on the ground at a specific time can be calculated:
where Rdr is the direct-beam radiation intensity (W/m2); Rsc is the diffuse radiation intensity (W/m2); S0 is the solar constant (W/m2); P is the atmospheric transparency coefficient; hs is the solar elevation angle at the corresponding time; θi is the solar incidence angle at the corresponding time; and θr is the dihedral angle between the vertical plane and the horizontal plane at the corresponding time.
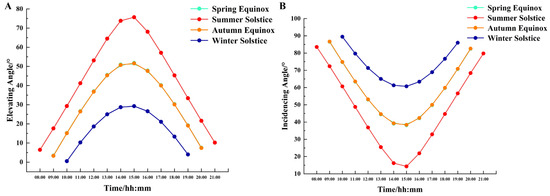
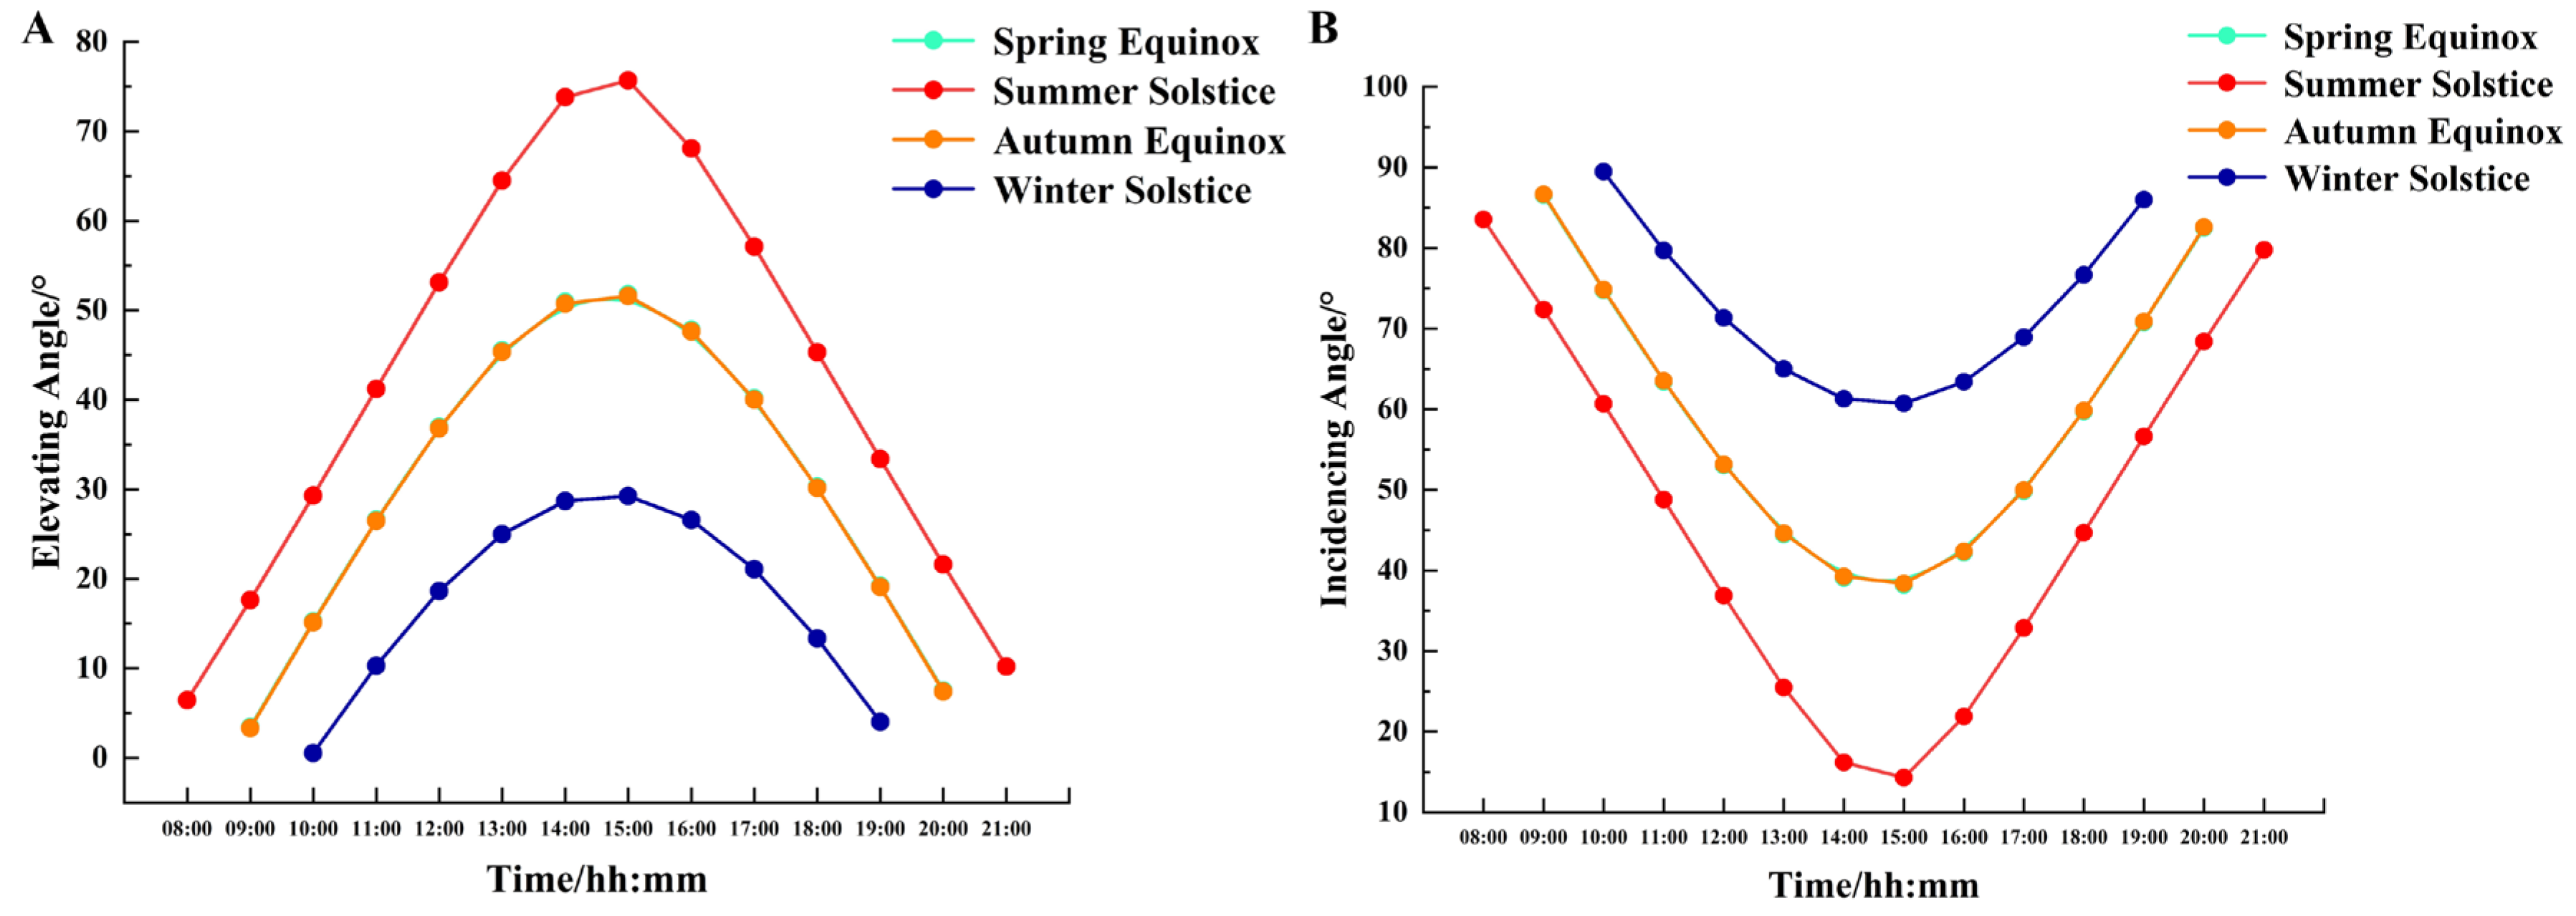
The solar incidence angle varies with the Earth’s rotation, revolution, and latitude. In this study, referencing the methods of Petrzala et al. [30], we used longitude, latitude, and time as variables to calculate the solar elevation and incidence angles for Hotan County at different times during the four solar terms of 2025: the Spring Equinox, summer solstice, Autumn Equinox, and winter solstice. The results are shown in Figure 3.
where θi is the solar incidence angle at the corresponding time; is the latitude of the calculation location; τ is the longitude of the calculation location; δ is the solar declination angle (the angle between the sun–Earth line and the Earth’s equatorial plane); N is the day number of the year; and ω is the solar hour angle.
Figure 3.
Variation in solar elevation angle and incidence angle with time under different solar terms in the Hotan region in 2025: (A) elevation angle; (B) incidence angle.
2.2.2. Solar Radiation Intensity Inside the Greenhouse
Solar radiation irradiating on different greenhouse structural materials will produce varying degrees of transmission, reflection and other radiometric phenomena. In the simulation calculation process, the solar incidence angle is taken as the independent variable to calculate the radiation transmission value of various transparent covering materials. Equation (8) is an empirical model established in this study to describe the variation law of PO film transmittance with the solar incidence angle, which is fitted by measuring the optical properties of greenhouse covering materials in Hotan.
where T0 is the transmittance of the covering material when the light incidence angle is 0°.
Due to the complex roof structure of multi-span greenhouses, direct radiation from the sun may pass through the greenhouse covering materials many times. Therefore, the ray-tracing method is used to calculate the solar radiation intensity on the greenhouse plane in this study.
2.2.3. Software Modeling
- (1)
- Introduction to Greenhouse Light Environment Simulation Software
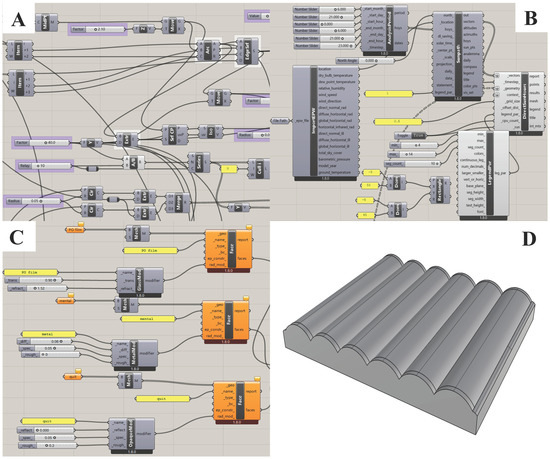
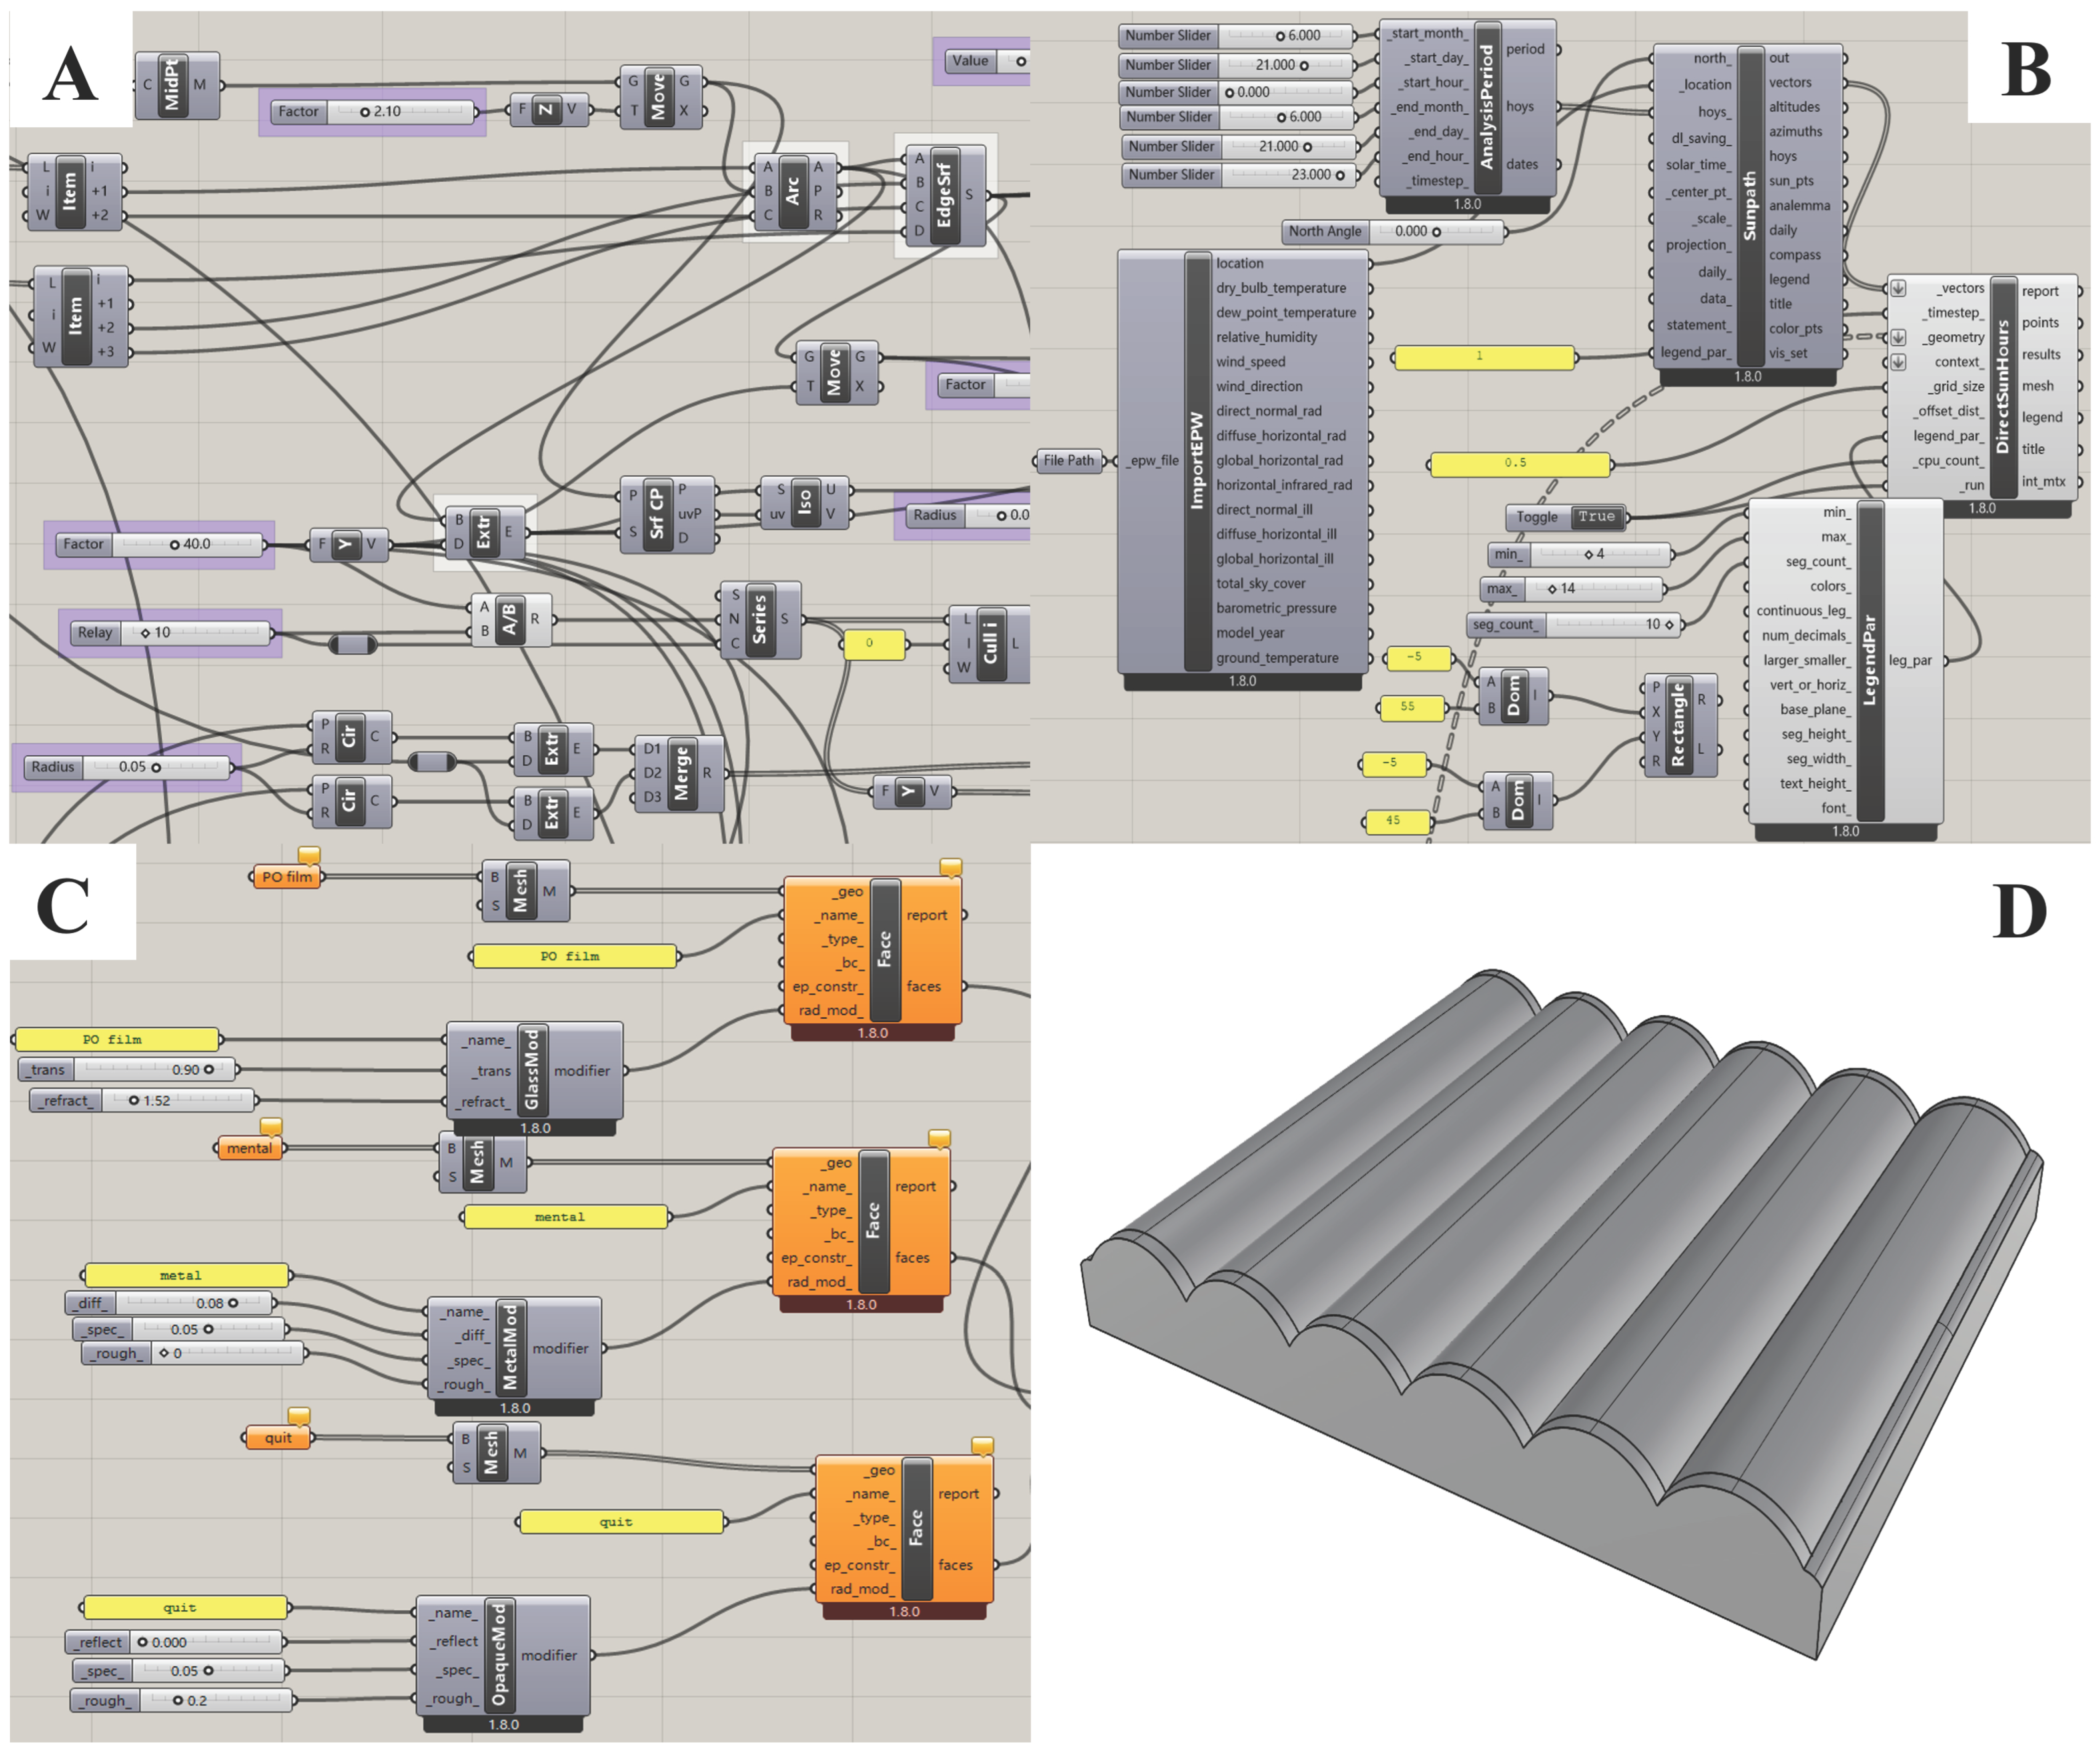
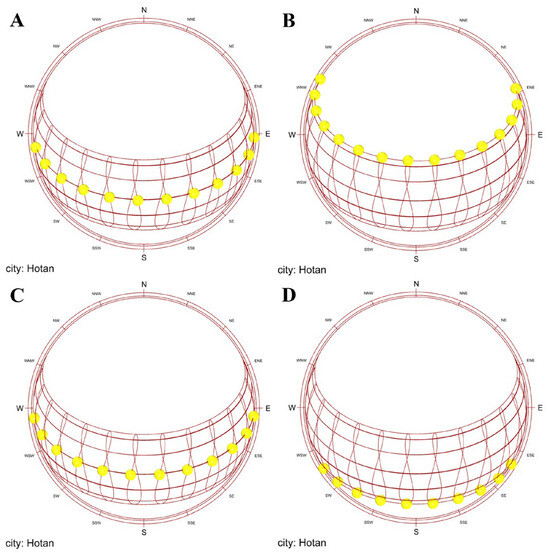
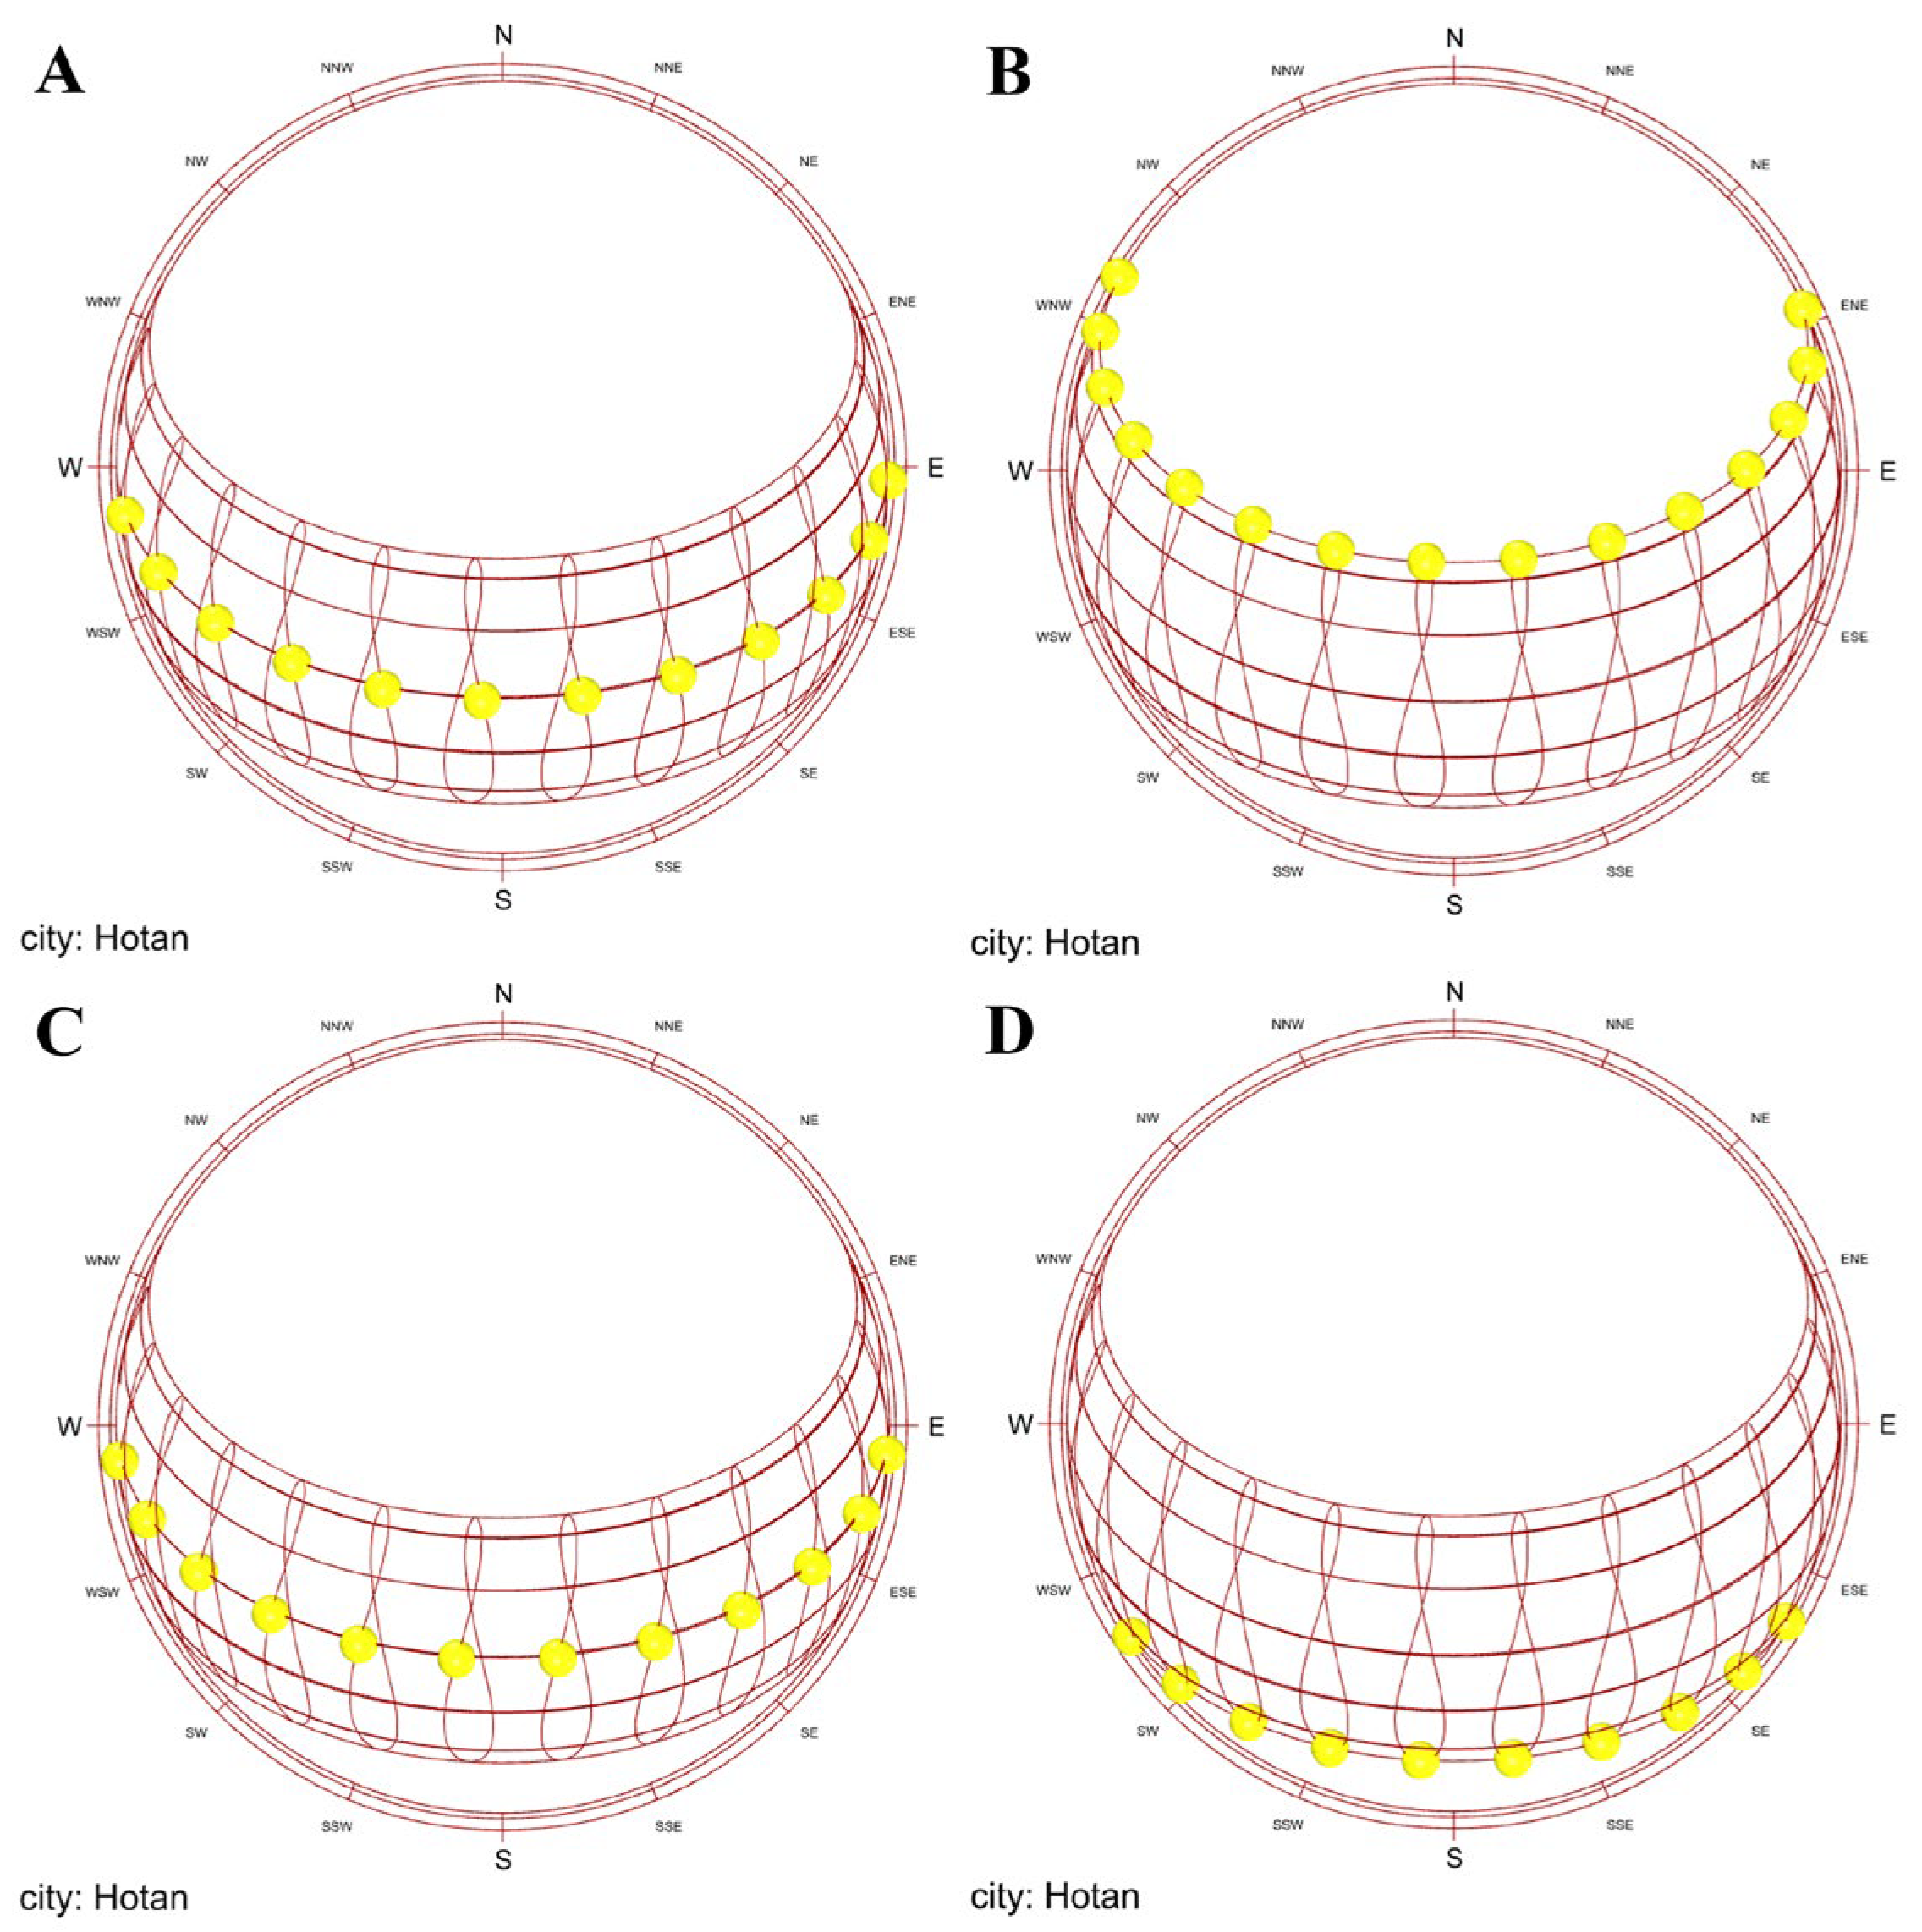
In this study, the Ladybug Tools integrated environment was used for parametric simulation and analysis of building radiometric performance. The Ladybug Tools are a set of open-source building environment simulation plug-ins, tightly integrated on the Rhino–Grasshopper parametric design platform. The core advantage of this tool chain is that it can seamlessly connect geometric modeling, meteorological data processing and physical engine calculation to realize real-time iteration between design variables and performance feedback. In terms of radiometric simulation, this study mainly uses the Honeybee module. As an advanced modeling abstraction layer, Honeybee is responsible for converting the 3D geometric model in Rhino into a standard radiometric simulation input file, and driving the industry-recognized high-precision radiation transmission engine Radiance for calculation. The Radiance engine is based on the reverse ray-tracing algorithm, which can accurately simulate the reflection, refraction and scattering behavior of rays in complex spaces. By reading the epw meteorological data in EnergyPlus, the meteorological environment of the study area can be directly obtained, such as the orientation, direct-diffuse radiation, temperature and humidity. Figure 4 shows the workflow diagram during simulation preparation and the generated model. Figure 5 shows the solar path distribution of the four solar terms of vernal equinox, summer solstice, autumnal equinox and winter solstice in Hotan obtained through the software.
Figure 4.
Grasshopper software parametric interface: (A)greenhouse modeling parameter settings; (B) irradiance simulation parameter settings; (C) greenhouse material property settings; (D) greenhouse model.
Figure 5.
Solar path diagrams for the Hotan region: (A) Spring Equinox; (B) summer solstice; (C) Autumn Equinox; (D) winter solstice.
- (2)
- Design and Functionality of Greenhouse Light Environment Simulation Software Modules
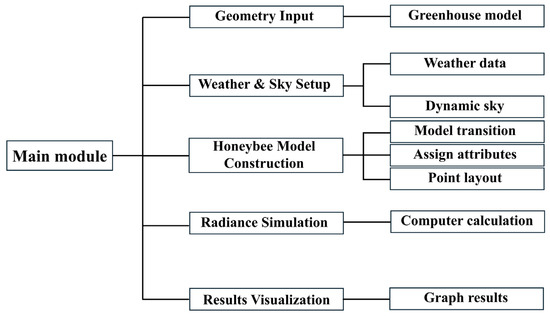
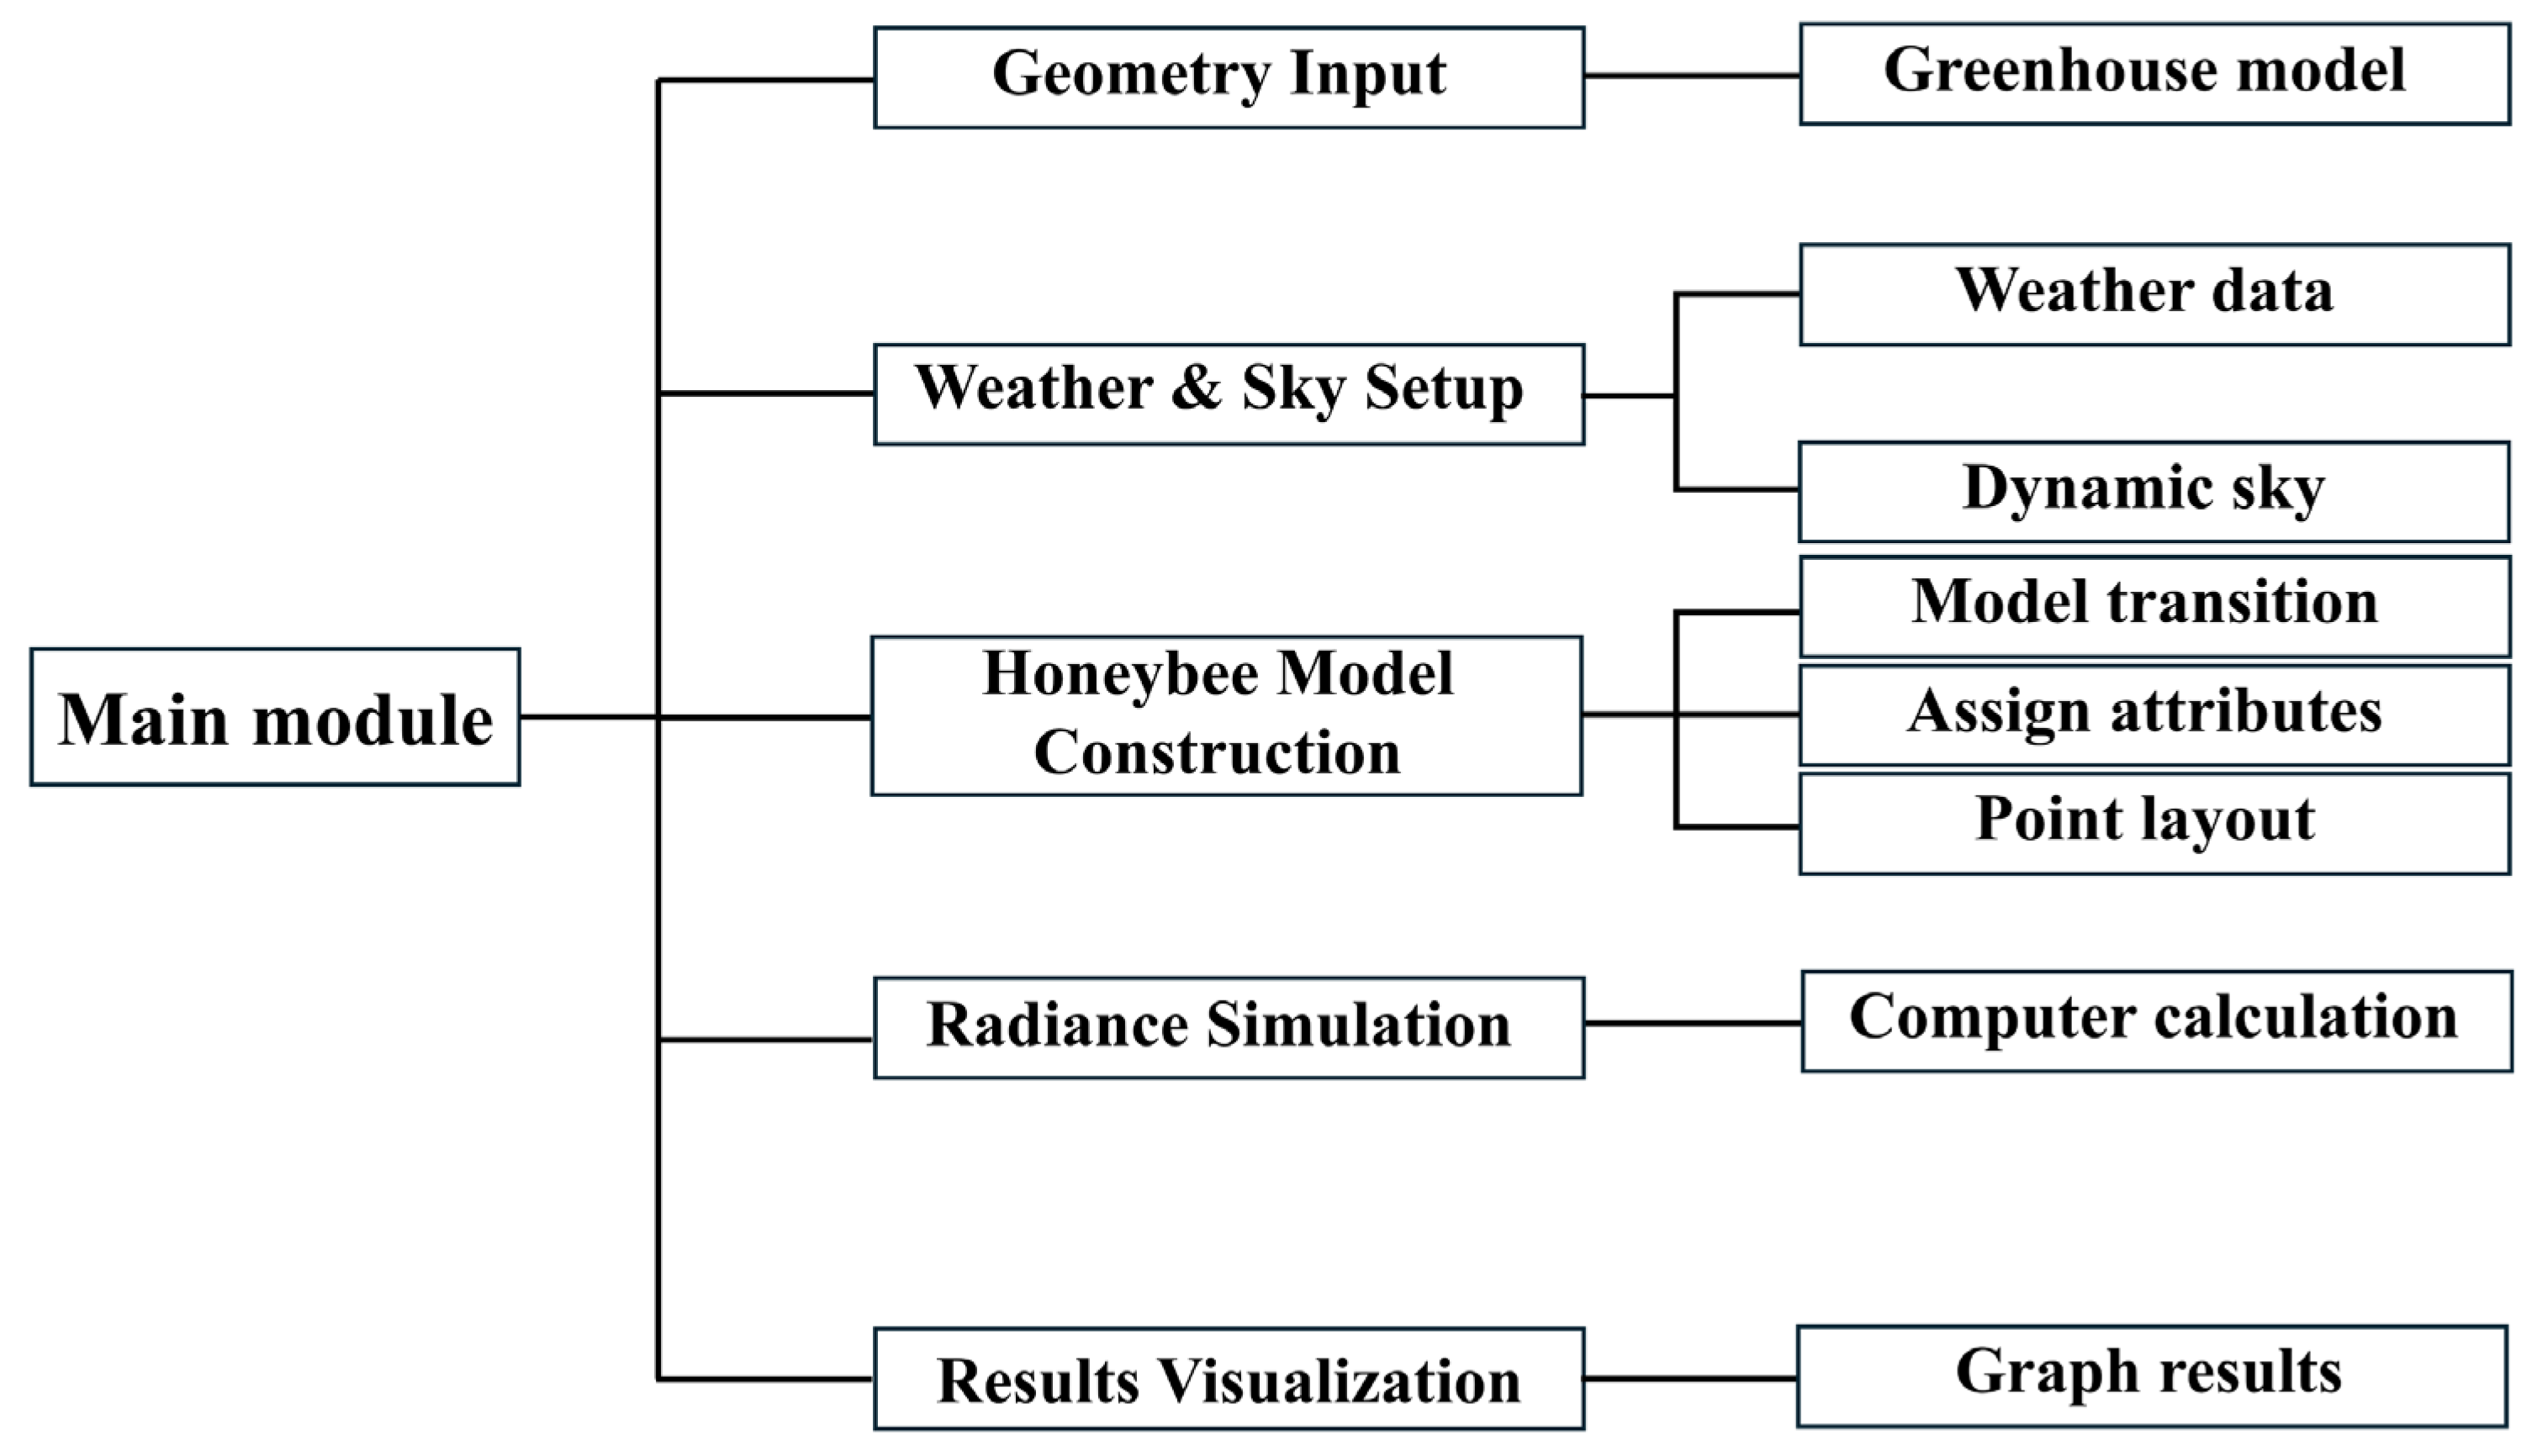
As shown in Figure 6, the building simulation with Grasshopper is mainly divided into the following steps: (1) Geometric model input. Create or import the 3D geometric model of the building to be analyzed in Rhino. This model serves as the physical basis for all subsequent simulations, and its accuracy directly affects the reliability of the simulation results. The ground is set as the reference surface, and the heights of 1 m and 2 m mentioned in the study are the vertical heights relative to the horizontal plane. (2) Meteorological data and sky model construction. Using Ladybug components, import the typical meteorological year file of the target location, and generate a dynamic sky model that meets international standards (such as CIE) through components such as Import EPW and Construct Sky Matrix, providing environmental boundary conditions for accurate Climate-Based Daylight Modeling (CBDM). (3) Honeybee model construction. Convert Rhino geometry into a Honeybee model with physical attributes through internal Honeybee components, and assign accurate radiometric material properties to building envelope elements (walls, windows, roofs, etc.), such as visible radiation reflectance and transmittance. (4) Radiance engine solution. After configuring the model, call the component to start background calculation, execute a high-precision reverse ray-tracing algorithm, and calculate the irradiance data of each sensor point at a specified time step. According to the calculation principle of Grasshopper, the solar radiation inside the greenhouse can be divided into direct radiation and diffuse radiation. The direct radiation is corrected by the cosine law for the incidence angle and the projection on the horizontal plane, and the diffuse radiation is integrated in the hemispherical space to integrate the incident components in all directions, so that the calculation results are more in line with the real optical propagation process. (5) Result visualization and post-processing. After the simulation is completed, the result data are transmitted back to Grasshopper. The simulation indicators are directly mapped to the original geometric model in the form of color heat maps through components, realizing intuitive and efficient performance evaluation and design decision support.
Figure 6.
Greenhouse simulation workflow.
2.3. Model Validation Method
A 1:1 model of the experimental greenhouse was established by the Rhino software 8.0, with a grid resolution of 1 m × 1 m, ray-tracing times of 8, a direct light sampling number of 1024, and a simulation time step of 60 min. The greenhouse is mainly divided into PO film, a steel skeleton and flexible thermal insulation walls. Table 2 shows the relevant properties of greenhouse materials. To test the accuracy of the software, the summer solstice and winter solstice were selected for verification. Combined with the sensor layout inside the greenhouse, the horizontal plane at a height of 1 m was selected for research during the simulation. For the simulation results, the measured values were used for evaluation. The evaluation methods mainly include Mean Squared Error (MSE), Mean Absolute Error (MAE), Mean Relative Error (MRE), Root Mean Square Error (RMSE) and Coefficient of Determination (R2) (Equations (9)–(13)).
Table 2.
Material property settings.
The formula for the uniformity of the solar radiation simulation (λ) is as follows:
3. Results and Analysis
3.1. Model Validation
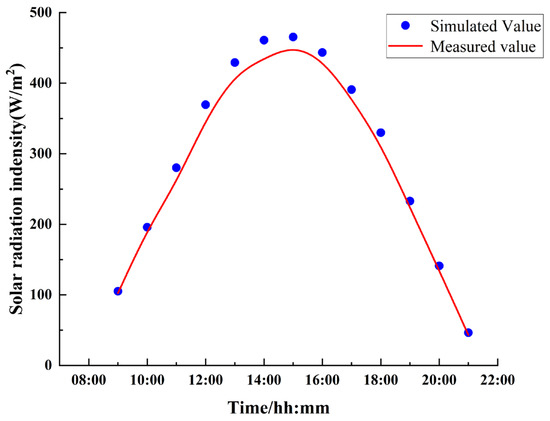
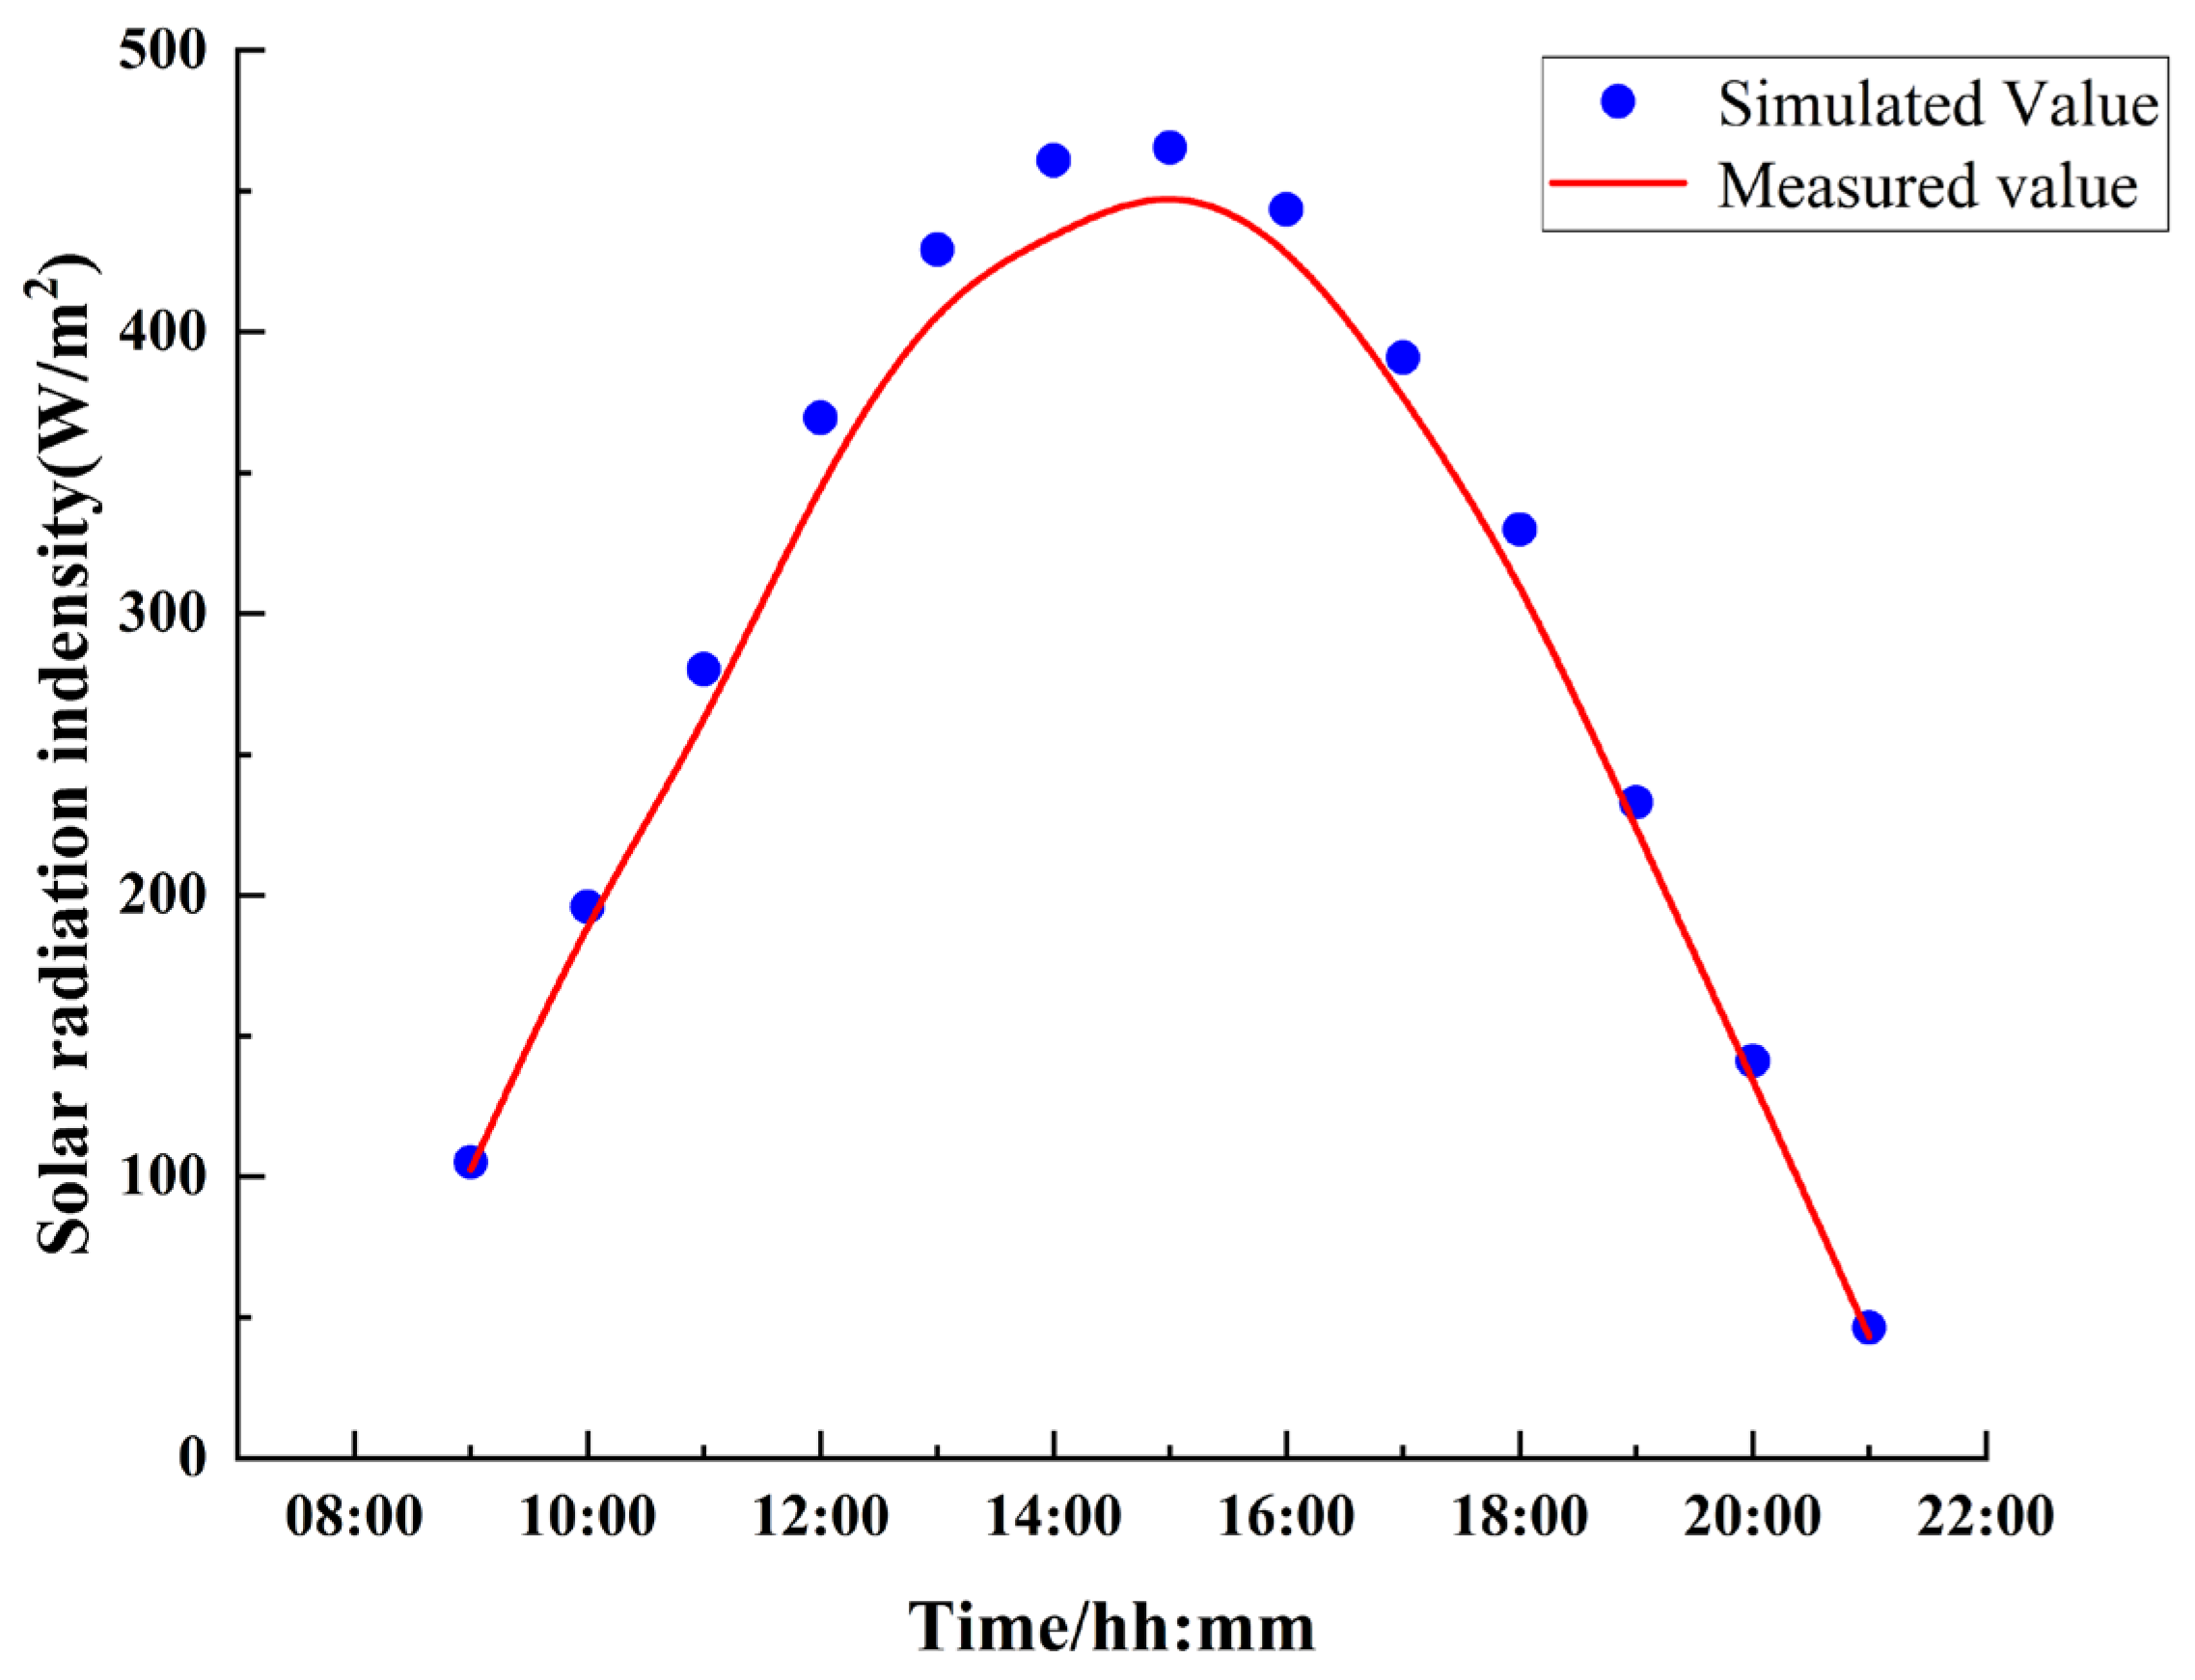
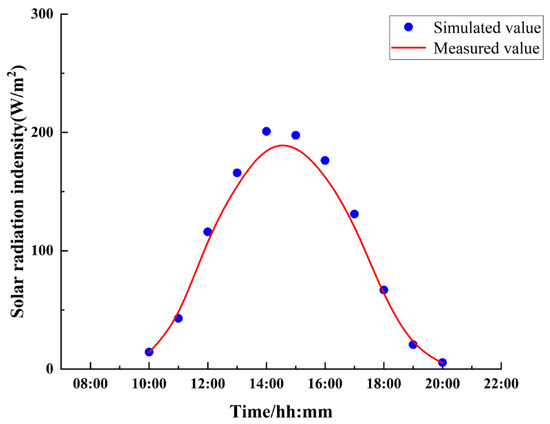
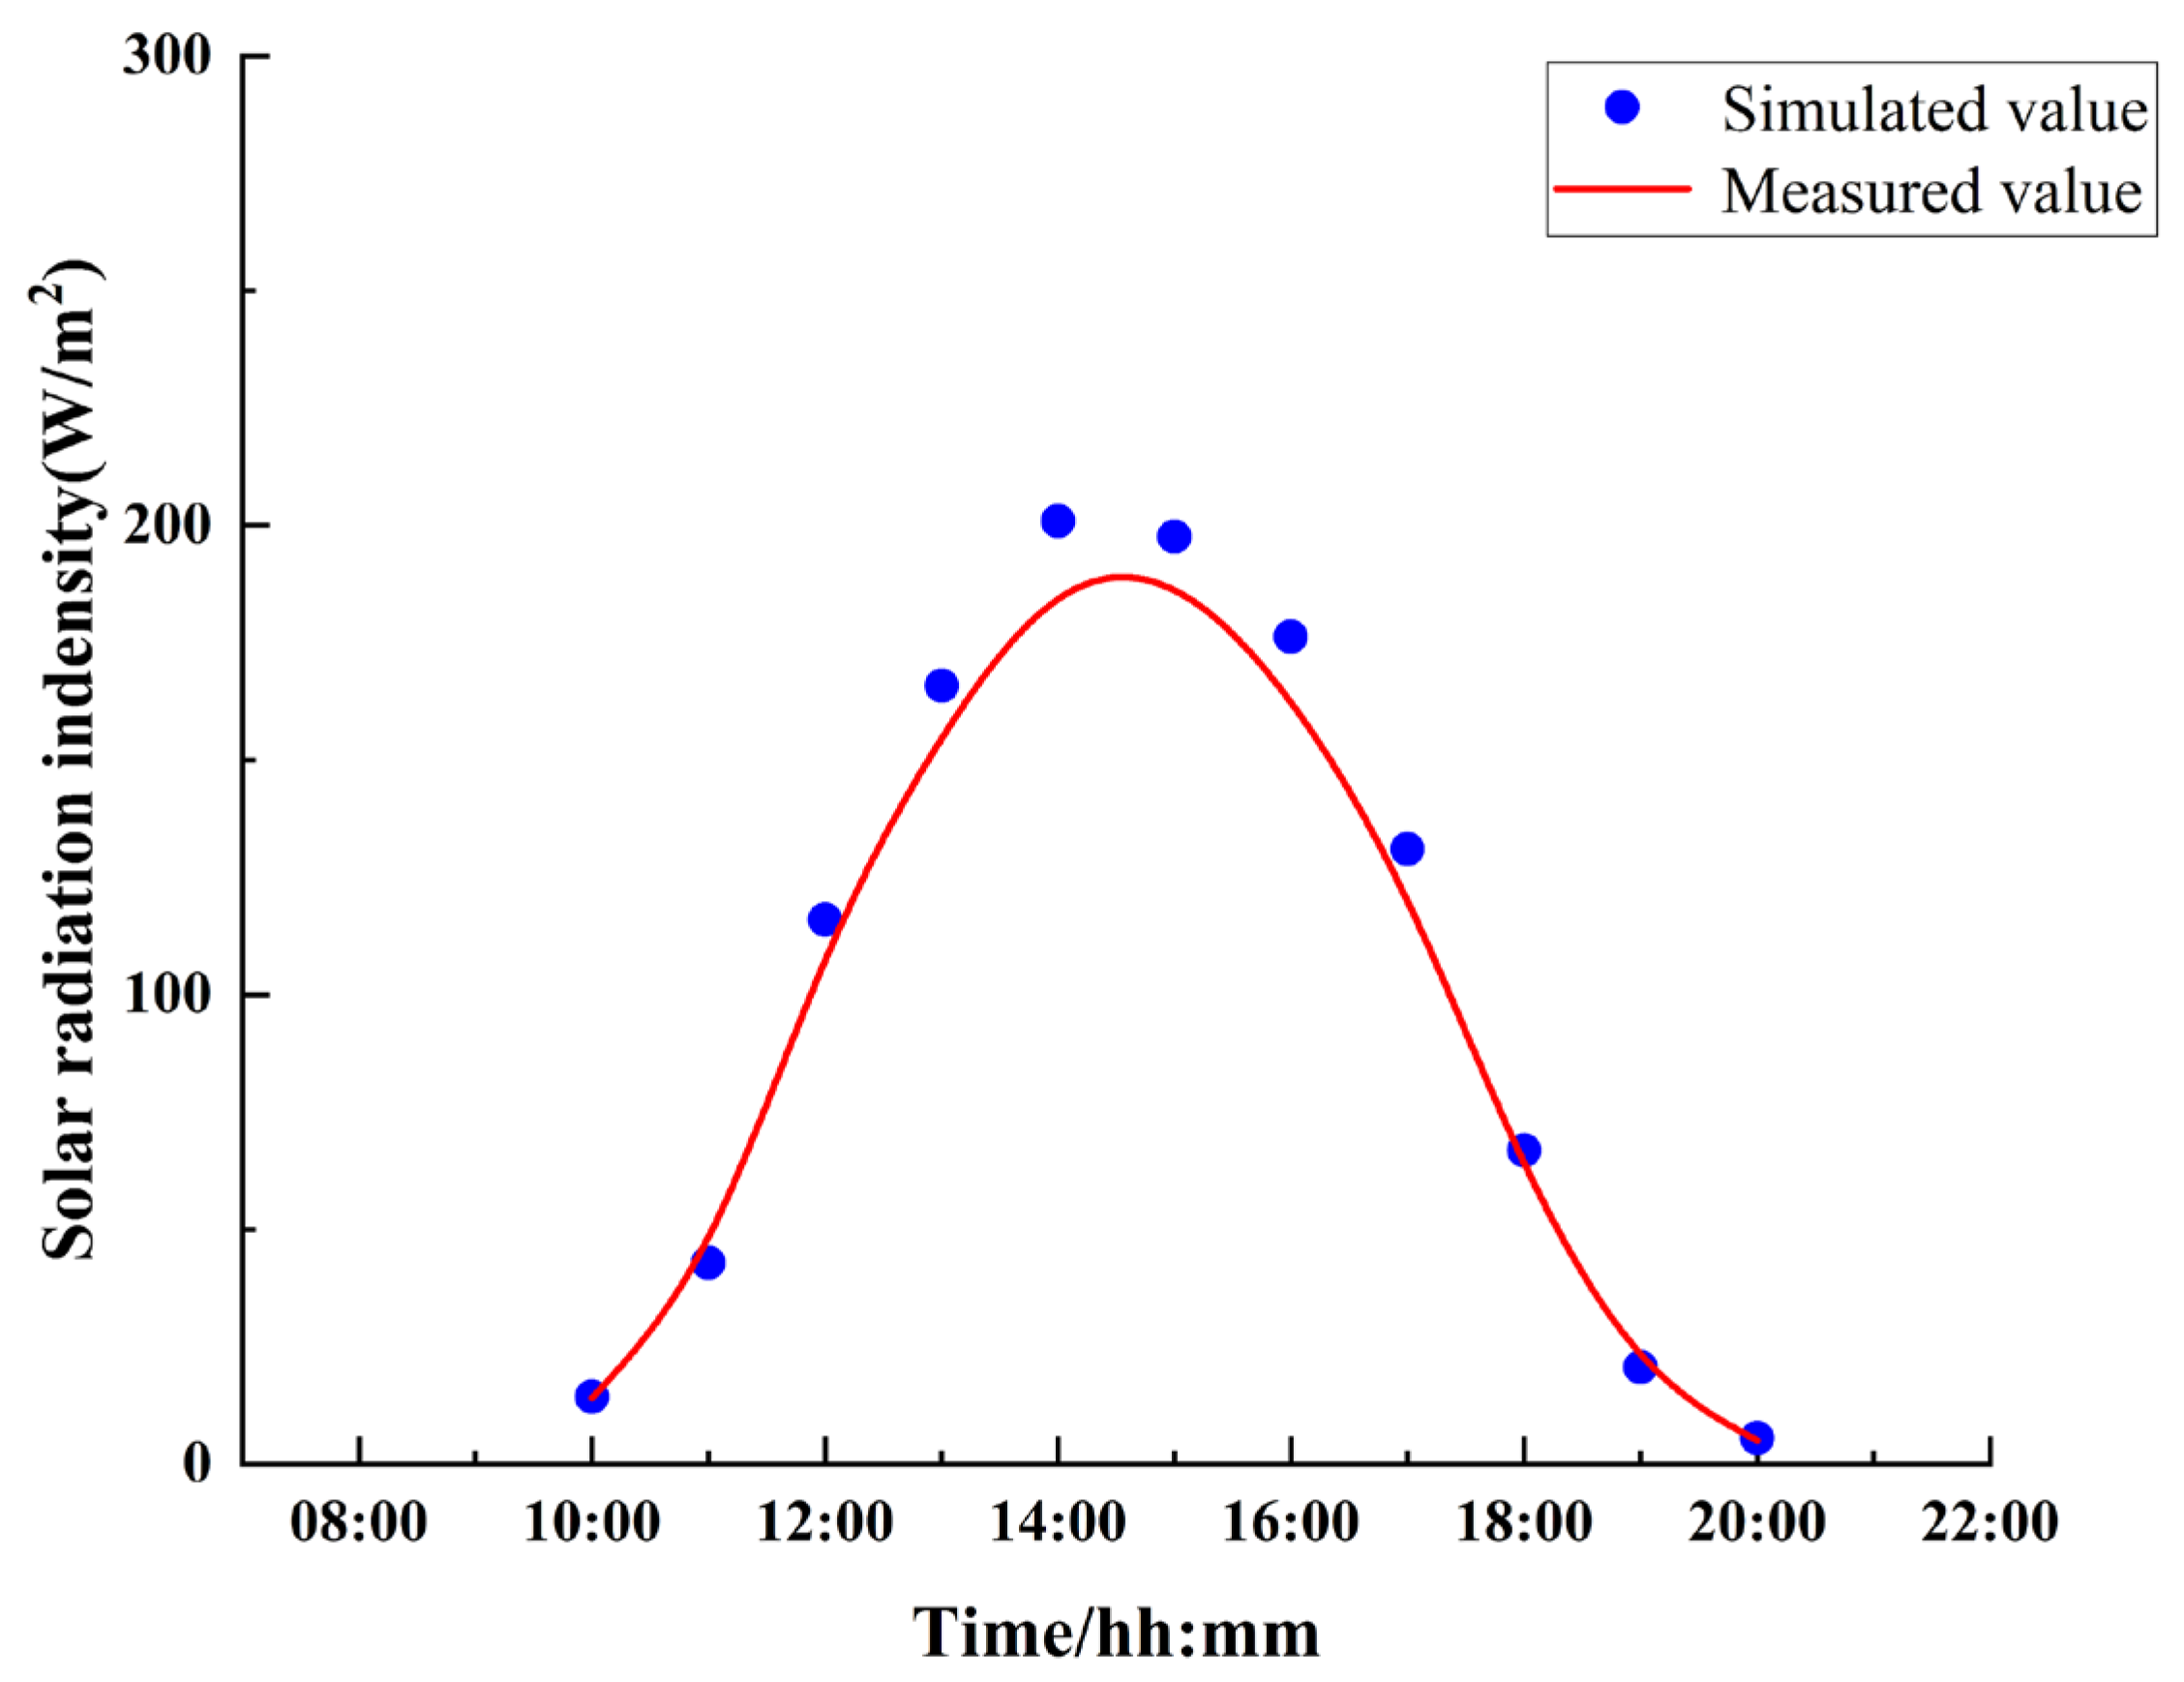
The average solar radiation intensity throughout the day from sunrise to sunset was simulated by software, as shown in Figure 7 and Figure 8. The simulated values are basically consistent with the measured values. Comparing the simulated and measured data of the summer solstice and winter solstice, the accuracy of the winter solstice is higher, but the average accuracy of both simulation results is more than 90%, proving that the software can be applied to the simulation of solar radiation inside the greenhouse at different time periods.
Figure 7.
Comparison of simulated and measured values of average solar radiation intensity inside the greenhouse on the summer solstice.
Figure 8.
Comparison of simulated and measured values of average solar radiation intensity inside the greenhouse on the winter solstice.
During the simulation of the summer solstice and winter solstice, the simulated values are always higher than the measured values. This phenomenon may be caused by the decrease in the radiation transmittance of the greenhouse film over time and the adhesion of dust. As shown in Table 3, the R2 and MRE values of the summer solstice are lower than those of the winter solstice, indicating that the smaller the solar radiation during the simulation, the higher the simulation accuracy, that is, the accuracy in winter is higher than that in summer.
Table 3.
Analysis of solar radiation simulation results for two typical weather days inside the greenhouse.
3.2. Simulation and Analysis of Light Distribution Inside the Greenhouse
3.2.1. Variation in Sunshine Duration Inside the Greenhouse with Seasons
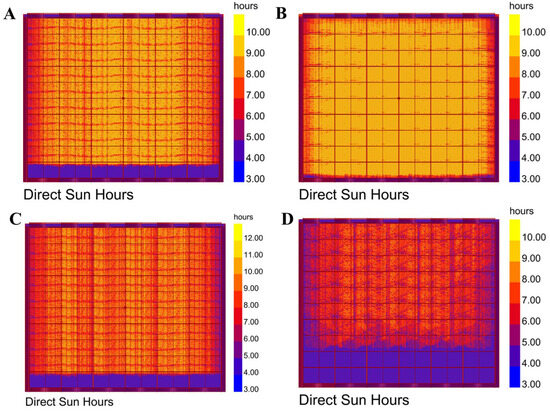
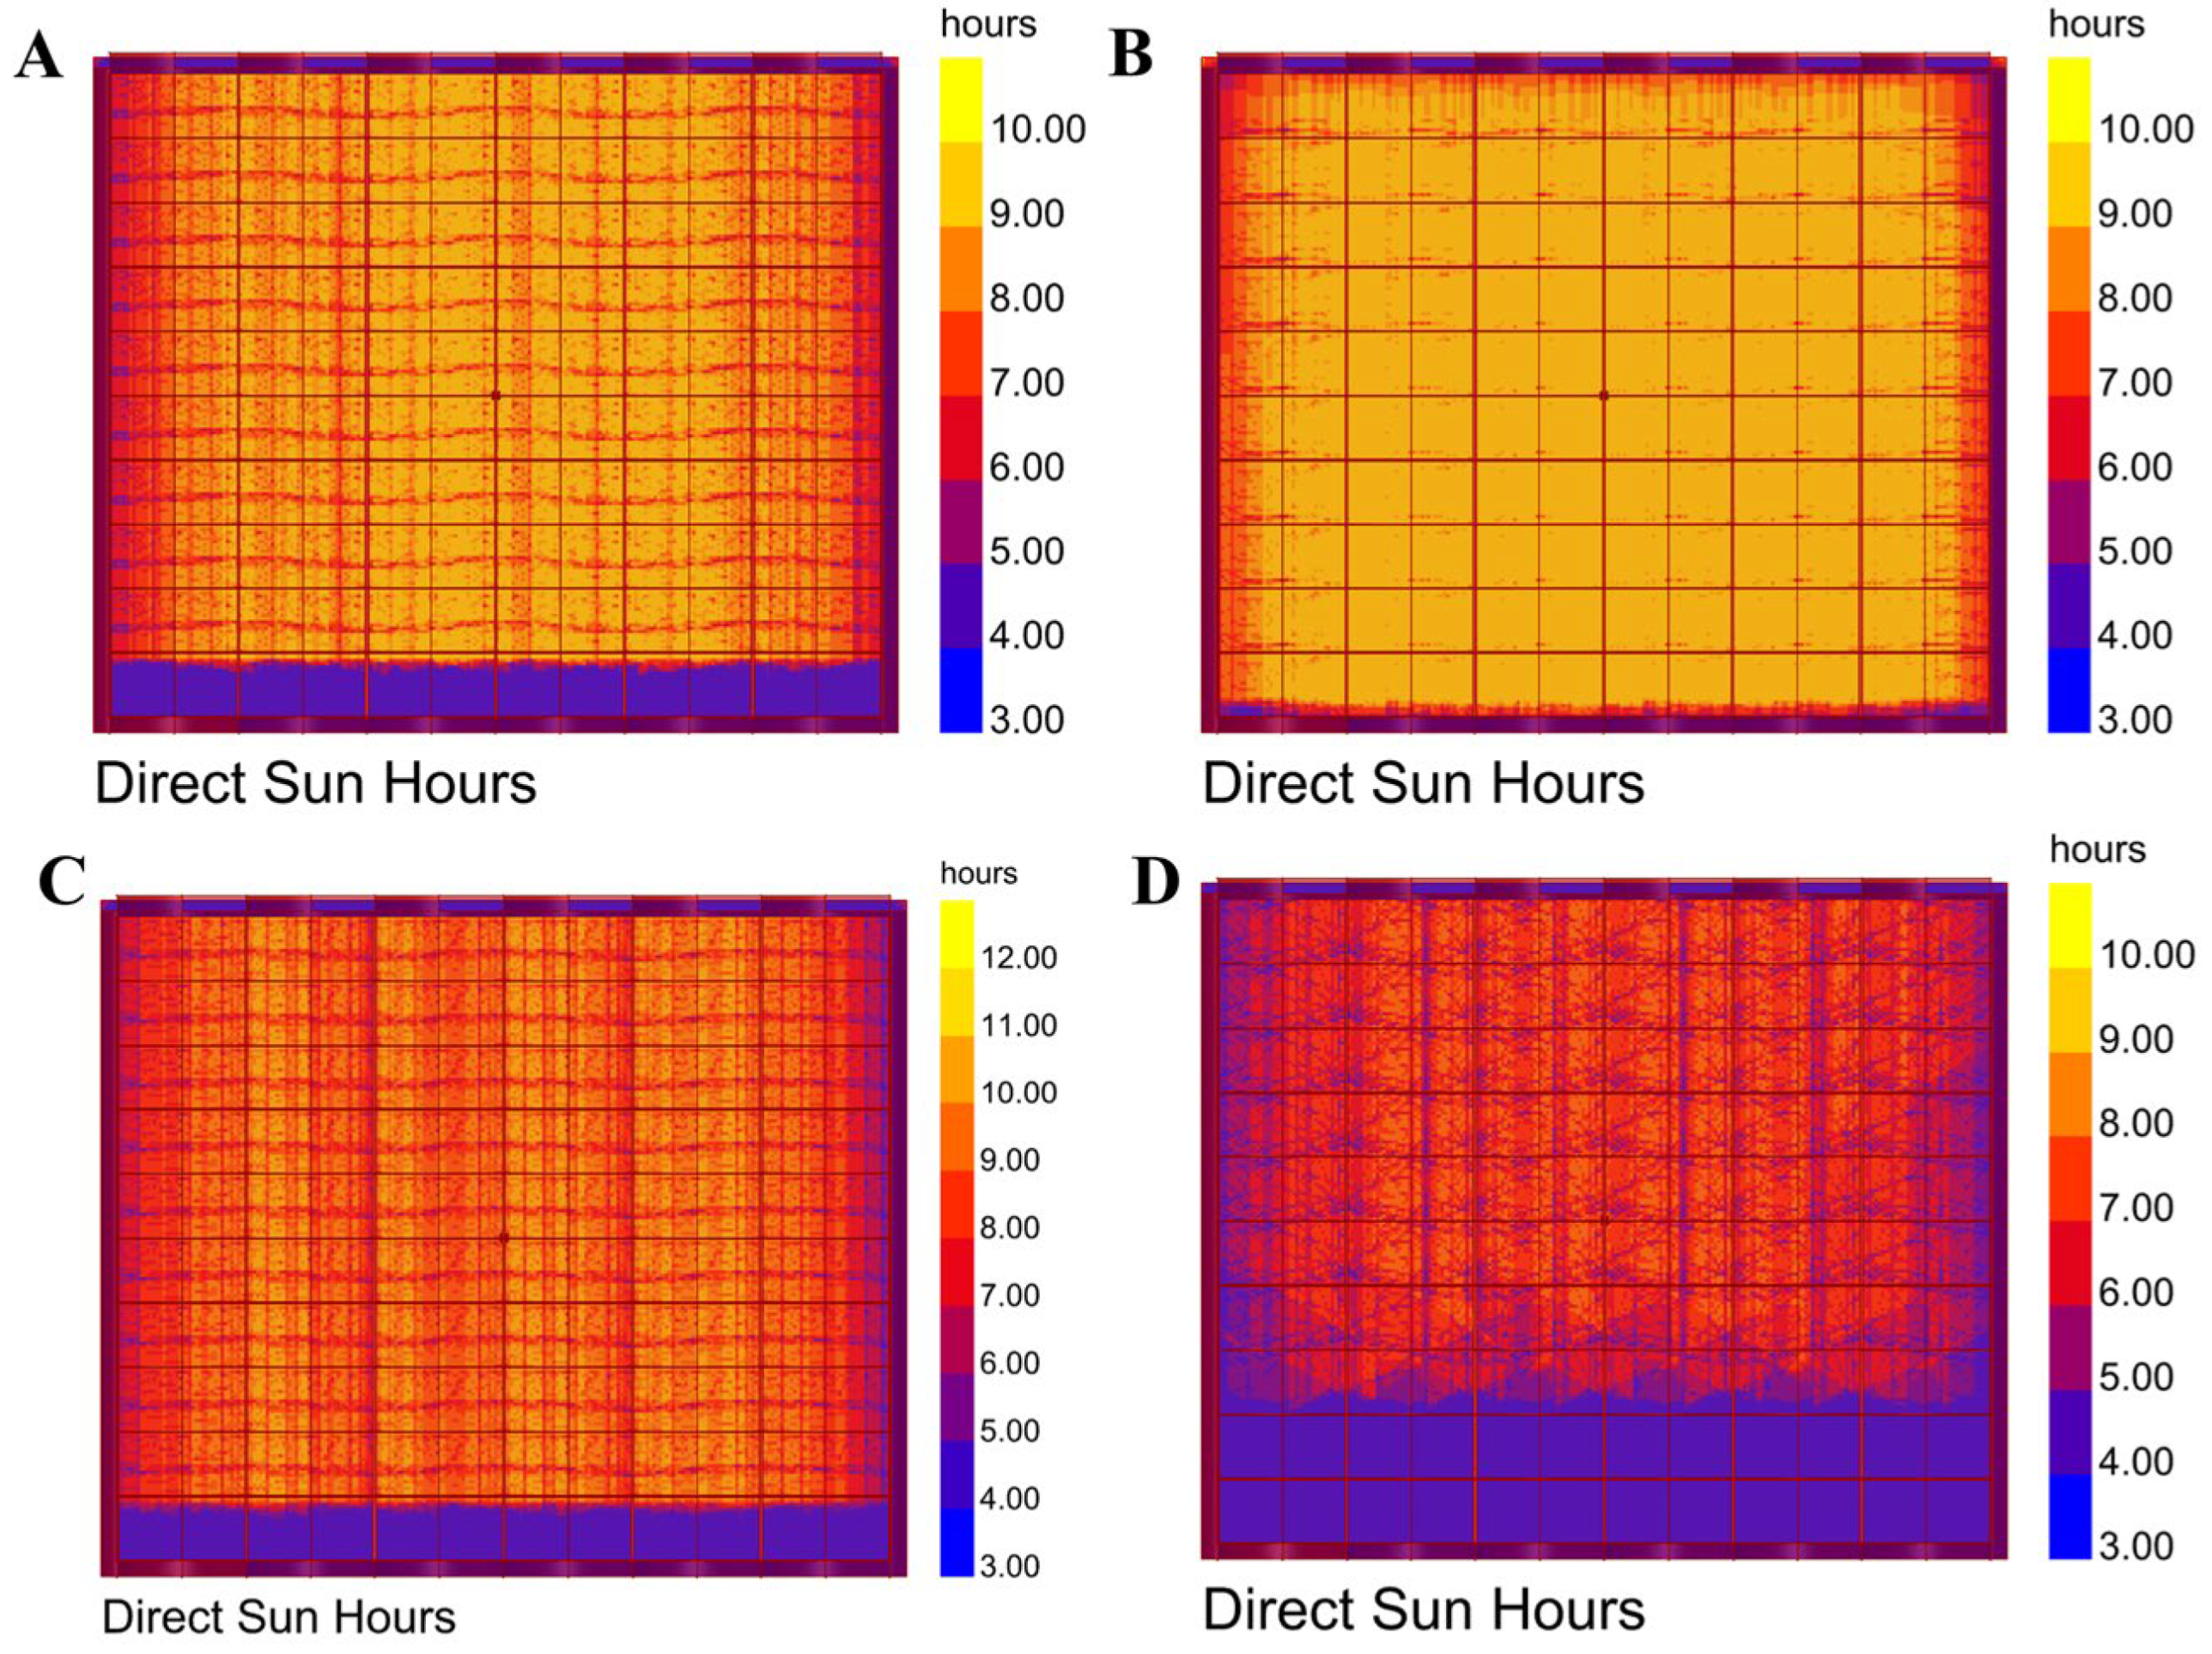
In this study, the vernal equinox, summer solstice, autumnal equinox and winter solstice were selected as typical days to simulate and study the sunshine duration inside the greenhouse. Figure 9 shows the spatial distribution heat map of direct solar radiation duration inside the greenhouse under typical solar terms (vernal equinox, summer solstice, autumnal equinox, and winter solstice) in Hotan, where sunshine duration is defined as the cumulative duration of direct radiation ≥ 50 W/m2 at a point. The central area of the greenhouse has the longest sunshine duration due to less shading from the steel skeleton and thermal insulation quilts, while the areas near the edges, especially near the south wall and side walls, are greatly reduced due to the structure setting. As shown in Figure 9B, on the summer solstice, due to the maximum solar altitude angle and long summer days, the overall sunshine coverage of the greenhouse is the widest. Even the shaded areas still show high sunshine duration, and the sunshine duration in the central area can reach more than 10 h. The average sunshine duration on the summer solstice is about 40% higher than that on the winter solstice, and the insufficient light area is about 5%. On the winter solstice, the solar altitude angle is the lowest, the days are short, and the nights are long. Although the central and northern areas of the greenhouse still have 6–7 h of sunshine, the southern area of the greenhouse is severely shaded, and a large area has less than 5 h of sunshine, forming an obvious shadow zone. The insufficient light area accounts for about 40% of the greenhouse area. The vernal equinox and autumnal equinox show strong symmetry and uniformity. Through the cloud map analysis of sunshine duration, the insufficient light area in the vernal and autumnal equinoxes is about 15%. Optimization can be carried out for the shading in the southern area of the greenhouse, so as to increase the radiation intake near the south wall of the greenhouse to eliminate the shadow zone. Alternatively, during crop planting in the greenhouse, light-loving crops can be arranged in the central and northern high-sunshine areas, and shade-tolerant varieties can be planted near the south wall to improve crop harvest inside the greenhouse.
Figure 9.
Distribution of sunshine duration inside the greenhouse across different solar terms: (A) Spring Equinox; (B) summer solstice; (C) Autumn Equinox; (D) winter solstice.
3.2.2. Variation in Solar Radiation Inside the Greenhouse with Seasons
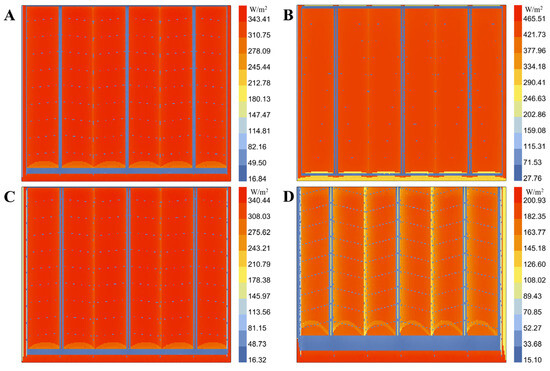
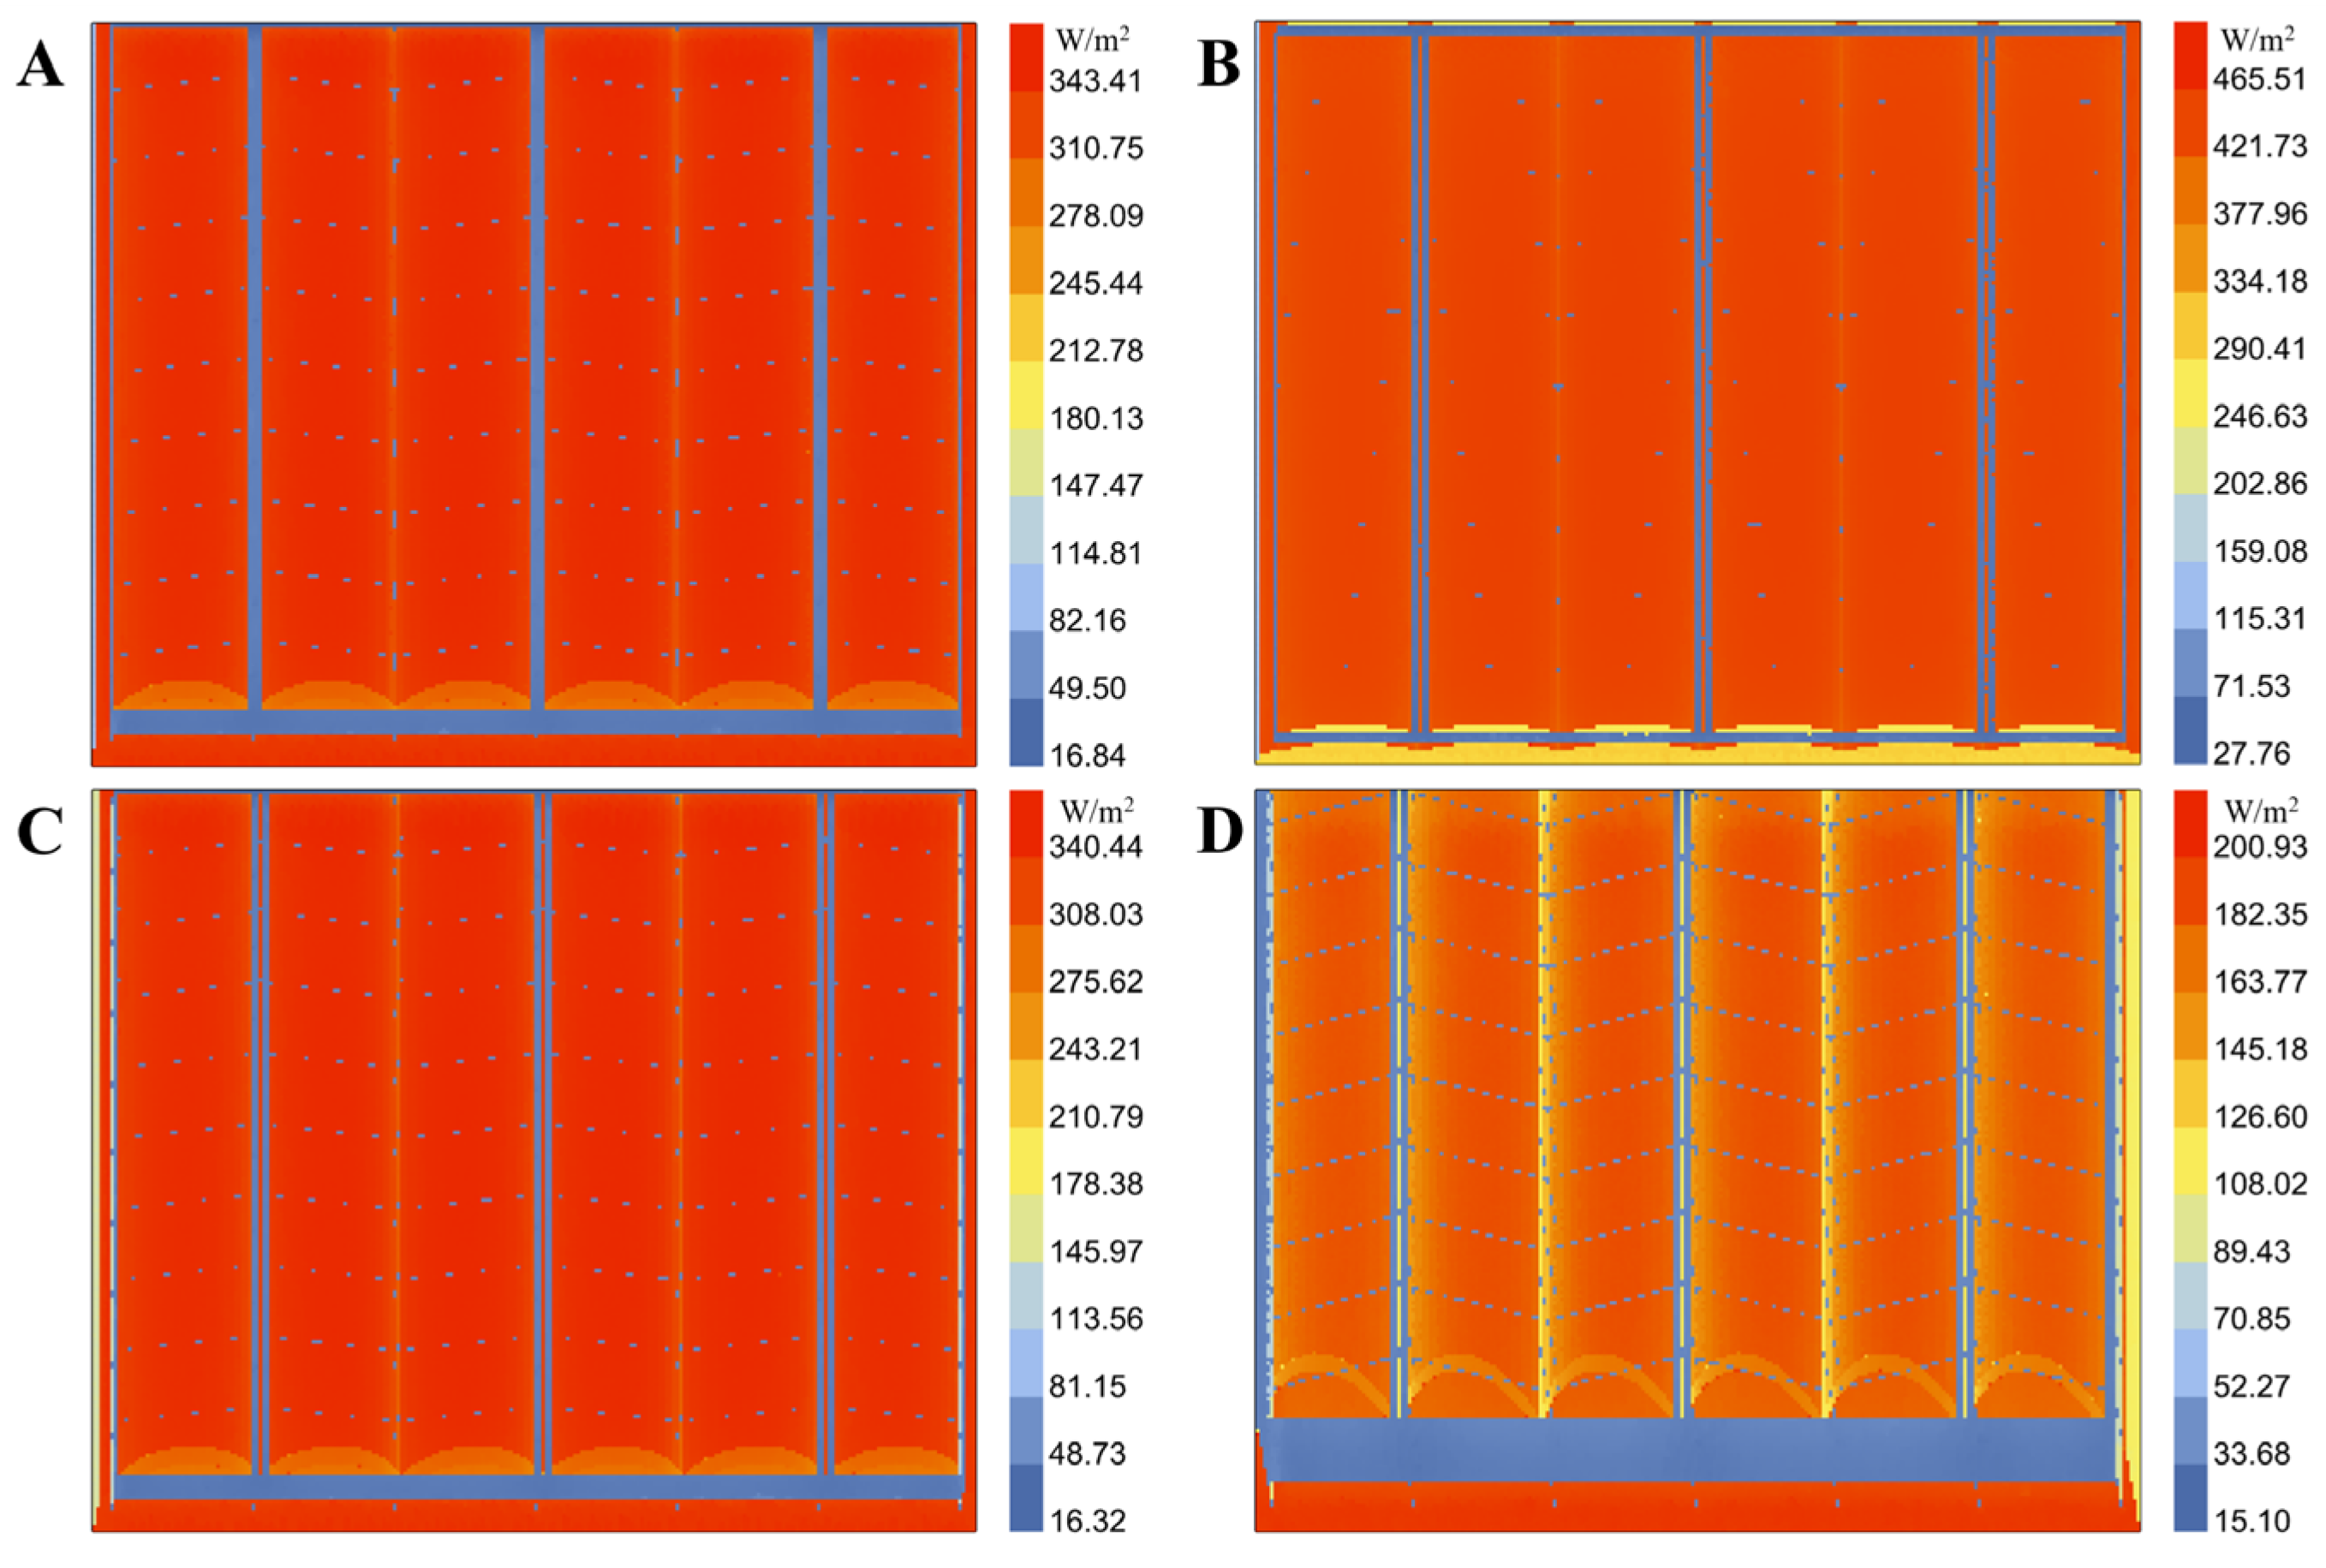
Figure 10 shows the spatial distribution of solar radiation intensity inside the greenhouse at 15:00 (peak irradiance time) on typical solar terms in Hotan. The internal radiation field presents significant characteristics of high in the north and low in the south, with severe seasonal fluctuations. On the summer solstice (Figure 10B), affected by the solar altitude angle (about 78°) and long sunshine periods, the peak value in the central area can reach 465.5 W/m2, and the radiation value in most areas is higher than 300 W/m2. As shown in Table 4, this intensity far exceeds the radiation saturation points of tomatoes, peppers and cucumbers at the flowering and fruit-setting stages, even close to the radiation inhibition critical value, indicating that the focus of summer management is shading and cooling. In contrast, the irradiance on the winter solstice (Figure 10D) is seriously insufficient. Limited by the solar altitude angle (about 29°), the overall radiation intensity is less than 50% of that on the summer solstice. The radiation value in the northern illuminated area is maintained at 100–150 W/m2, which can only meet the minimum compensation point for the vegetative growth period of crops, while the radiation value in the southern and framework thermal insulation wall shading areas is generally lower than 50 W/m2, far below the optimal growth range of crops. Therefore, it is recommended to take shading measures in summer to reduce radiation by 30–40%, and make up for irradiance loss through layout optimization or supplementary radiation in winter.
Figure 10.
Distribution of solar radiation inside the greenhouse across different solar terms (at 15:00): (A) Spring Equinox; (B) summer solstice; (C) Autumn Equinox; (D) winter solstice.
Table 4.
Radiation demand standards of main crops in the greenhouse at different growth stages (380–3000 nm).
3.2.3. Distribution of Solar Radiation at Different Heights Inside the Greenhouse
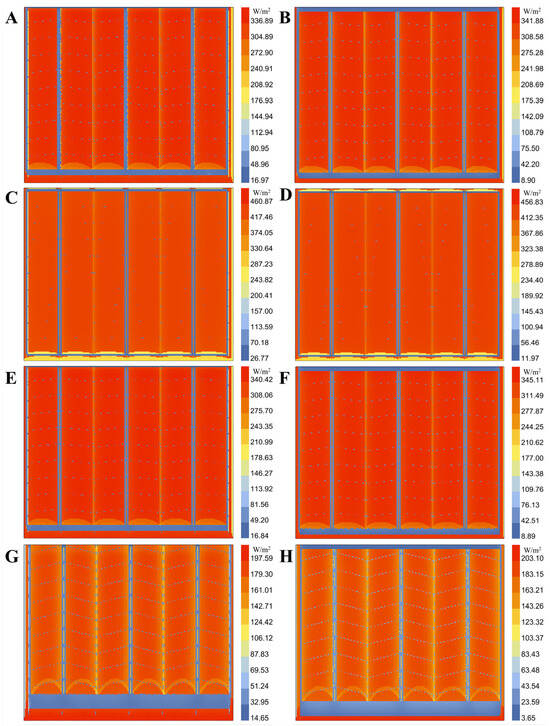
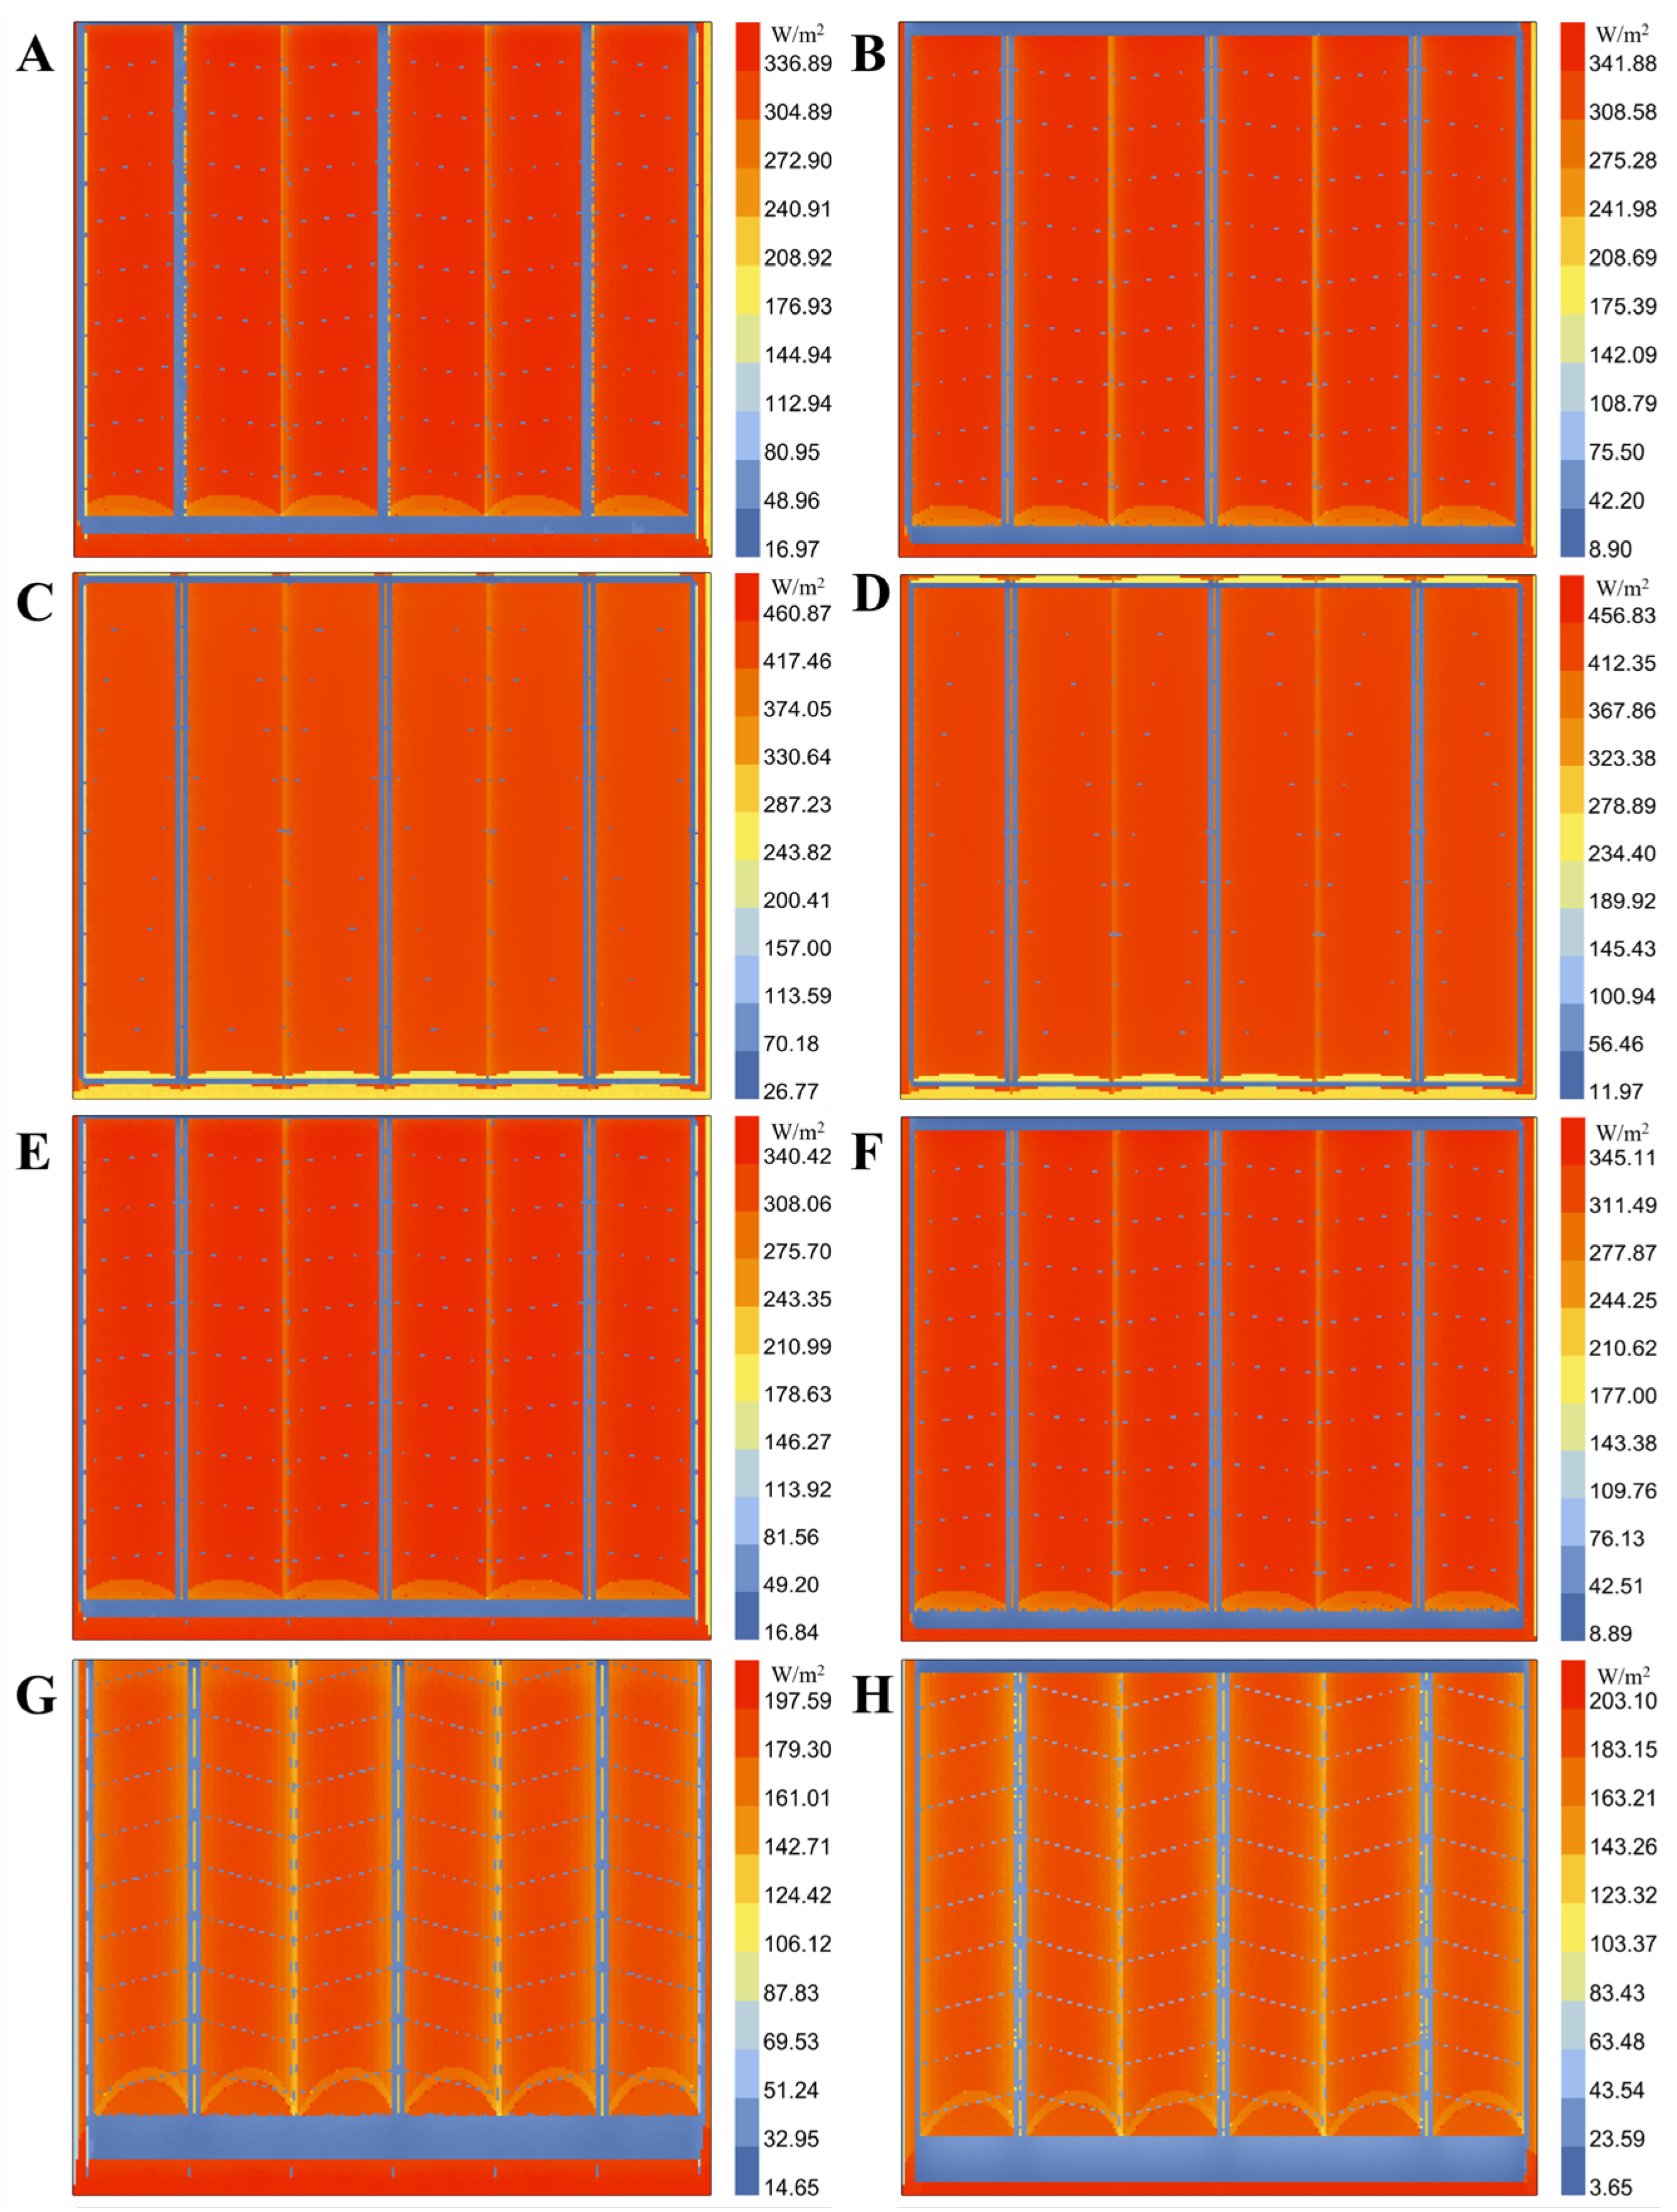
As shown in Figure 11A–H, the greenhouse is still at a high irradiance moment at 14:00 pm. Comparing the distribution of solar radiation at different horizontal heights (1 m and 2 m), it can be observed that with the increase in the research horizontal height, the distribution uniformity inside the greenhouse is significantly improved, and the coverage area of high-value regions is expanded. Except that the peak value of the summer solstice decreases with the increase in height, the peak solar radiation values of the other three solar terms increase slightly with the increase in the research horizontal plane. The phenomenon of peak decrease on the summer solstice may be because the direct radiation at 2 m height is similar to that at 1 m height, but the diffuse reflection from the ground is reduced at 2 m height, and the peak value decreases due to the lack of supplementary reflected radiation. At the same time, observing the radiation value ranges of the left and right 1 m and 2 m horizontal levels, it can be found that the lower limit of the radiation value at 2 m height is also lower than that at 1 m height. The reason is that the diffuse reflection from the ground itself is reduced in the shaded part. In summary, the radiation environment inside the greenhouse is different in vertical distribution. Compared with the 1 m height layer, the 2 m horizontal plane generally has higher radiation uniformity and weaker shadow shading, while the 1 m horizontal plane is more susceptible to side wall shading and ground reflection.
Figure 11.
Distribution maps of solar radiation inside the greenhouse at different solar terms (14:00 PM): (A) Spring Equinox at 1 m height; (B) Spring Equinox at 2 m height; (C) summer solstice at 1 m height; (D) summer solstice at 2 m height; (E) Autumn Equinox at 1 m height; (F) Autumn Equinox at 2 m height; (G) winter solstice at 1 m height; (H) winter solstice at 2 m height.
3.3. Selection of Greenhouse Construction Azimuth
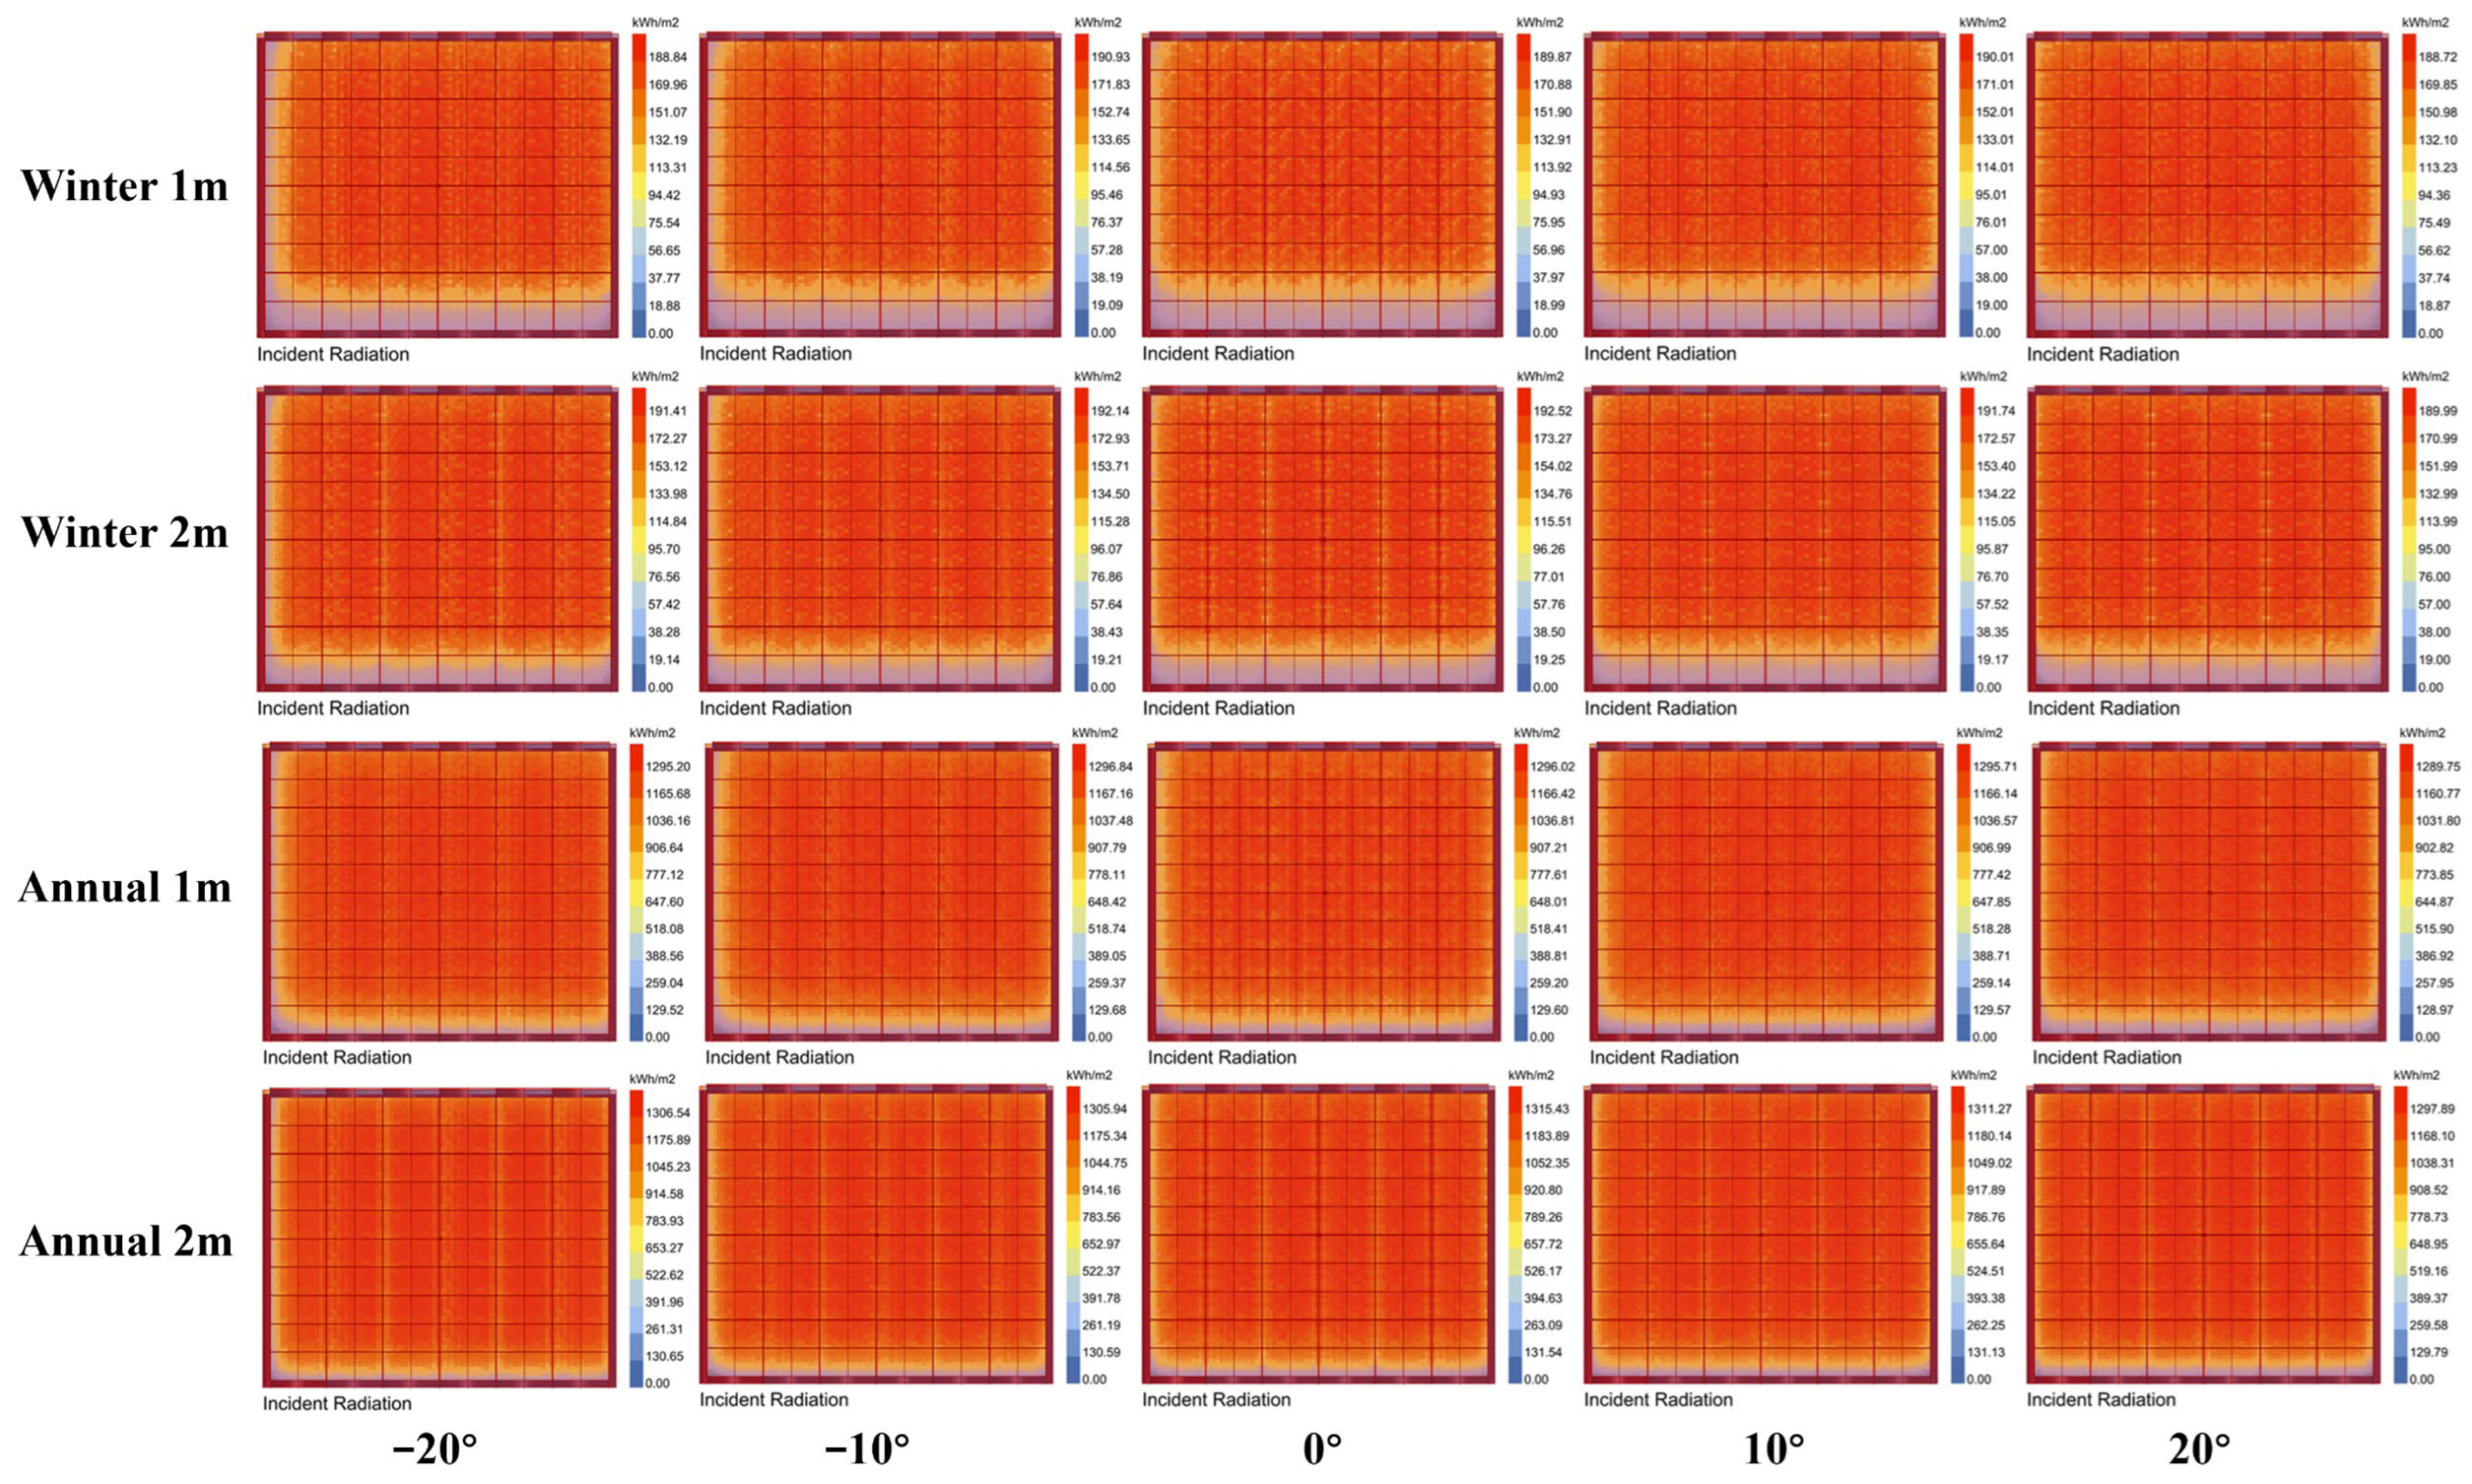
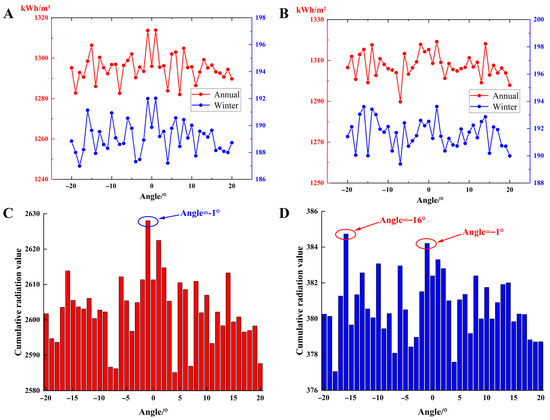
To explore the optimal orientation of the experimental greenhouse in Hotan, the radiation environment was further studied through the Grasshopper software 1.8.0 model. The optimal azimuth in the study was mainly evaluated by calculating the annual total solar radiation and winter total solar radiation inside the greenhouse. Figure 12 shows the radiation accumulation cloud maps of −20°, −10°, 0°, 10°, and 20° corresponding to the 1 m horizontal plane and 2 m horizontal plane in the whole year and winter. The due north direction is defined as 0°, the positive east direction of the greenhouse is positive, and the west direction is negative. As shown in Figure 13A,B, the two curves do not show monotonic fluctuation. In Figure 13A, the annual total radiation reaches its peak near 0°, while in Figure 13B, the maximum value is obtained at 1°. The variation trend of winter radiation accumulation is highly consistent with that of annual radiation accumulation. To maximize the internal radiation of the greenhouse, the values of Figure 13A,B are accumulated to obtain the bar charts of Figure 13C,D. From the perspective of the two planes in the whole year, the maximum radiation accumulation value can be obtained when the azimuth is −1°. However, the radiation inside the greenhouse in summer far exceeds the crop growth needs, so it is necessary to consider the winter when the solar radiation is insufficient. It can be seen from Figure 13D that the highest total radiation value can be obtained when the azimuth is between −16° and −1°. Considering the construction in the greenhouse construction process, the optimal total radiation can be obtained when the comprehensive consideration of the greenhouse azimuth is −1° (i.e., 1° west of south).
Figure 12.
Cumulative radiation at different azimuth angles on 1 m and 2 m horizontal planes for the full year and winter season.
Figure 13.
Cumulative radiation values at different azimuth angles: (A) 1 m and 2 m horizontal planes for the full year and winter; (B) 2 m horizontal plane for the full year and winter; (C) sum of annual cumulative radiation for 1 m and 2 m horizontal planes; (D) sum of winter cumulative radiation for 1 m and 2 m horizontal planes.
3.4. Selection of Greenhouse Shape
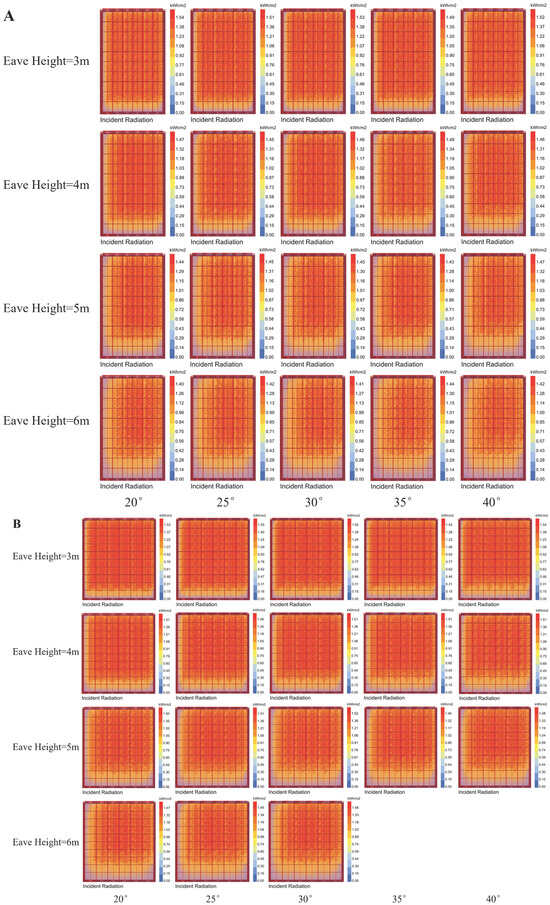
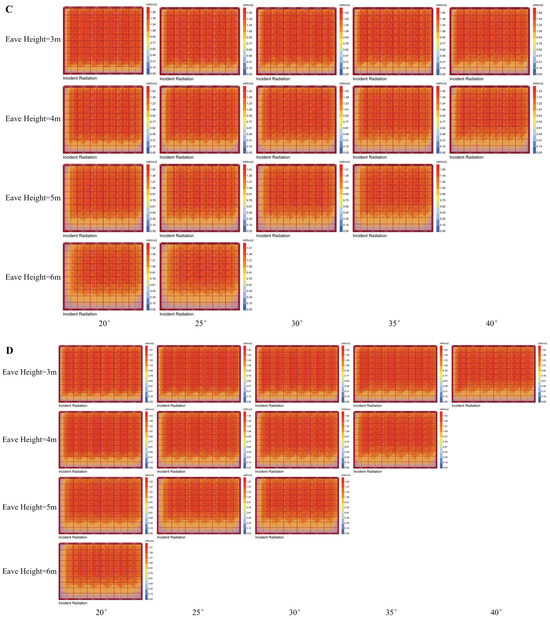
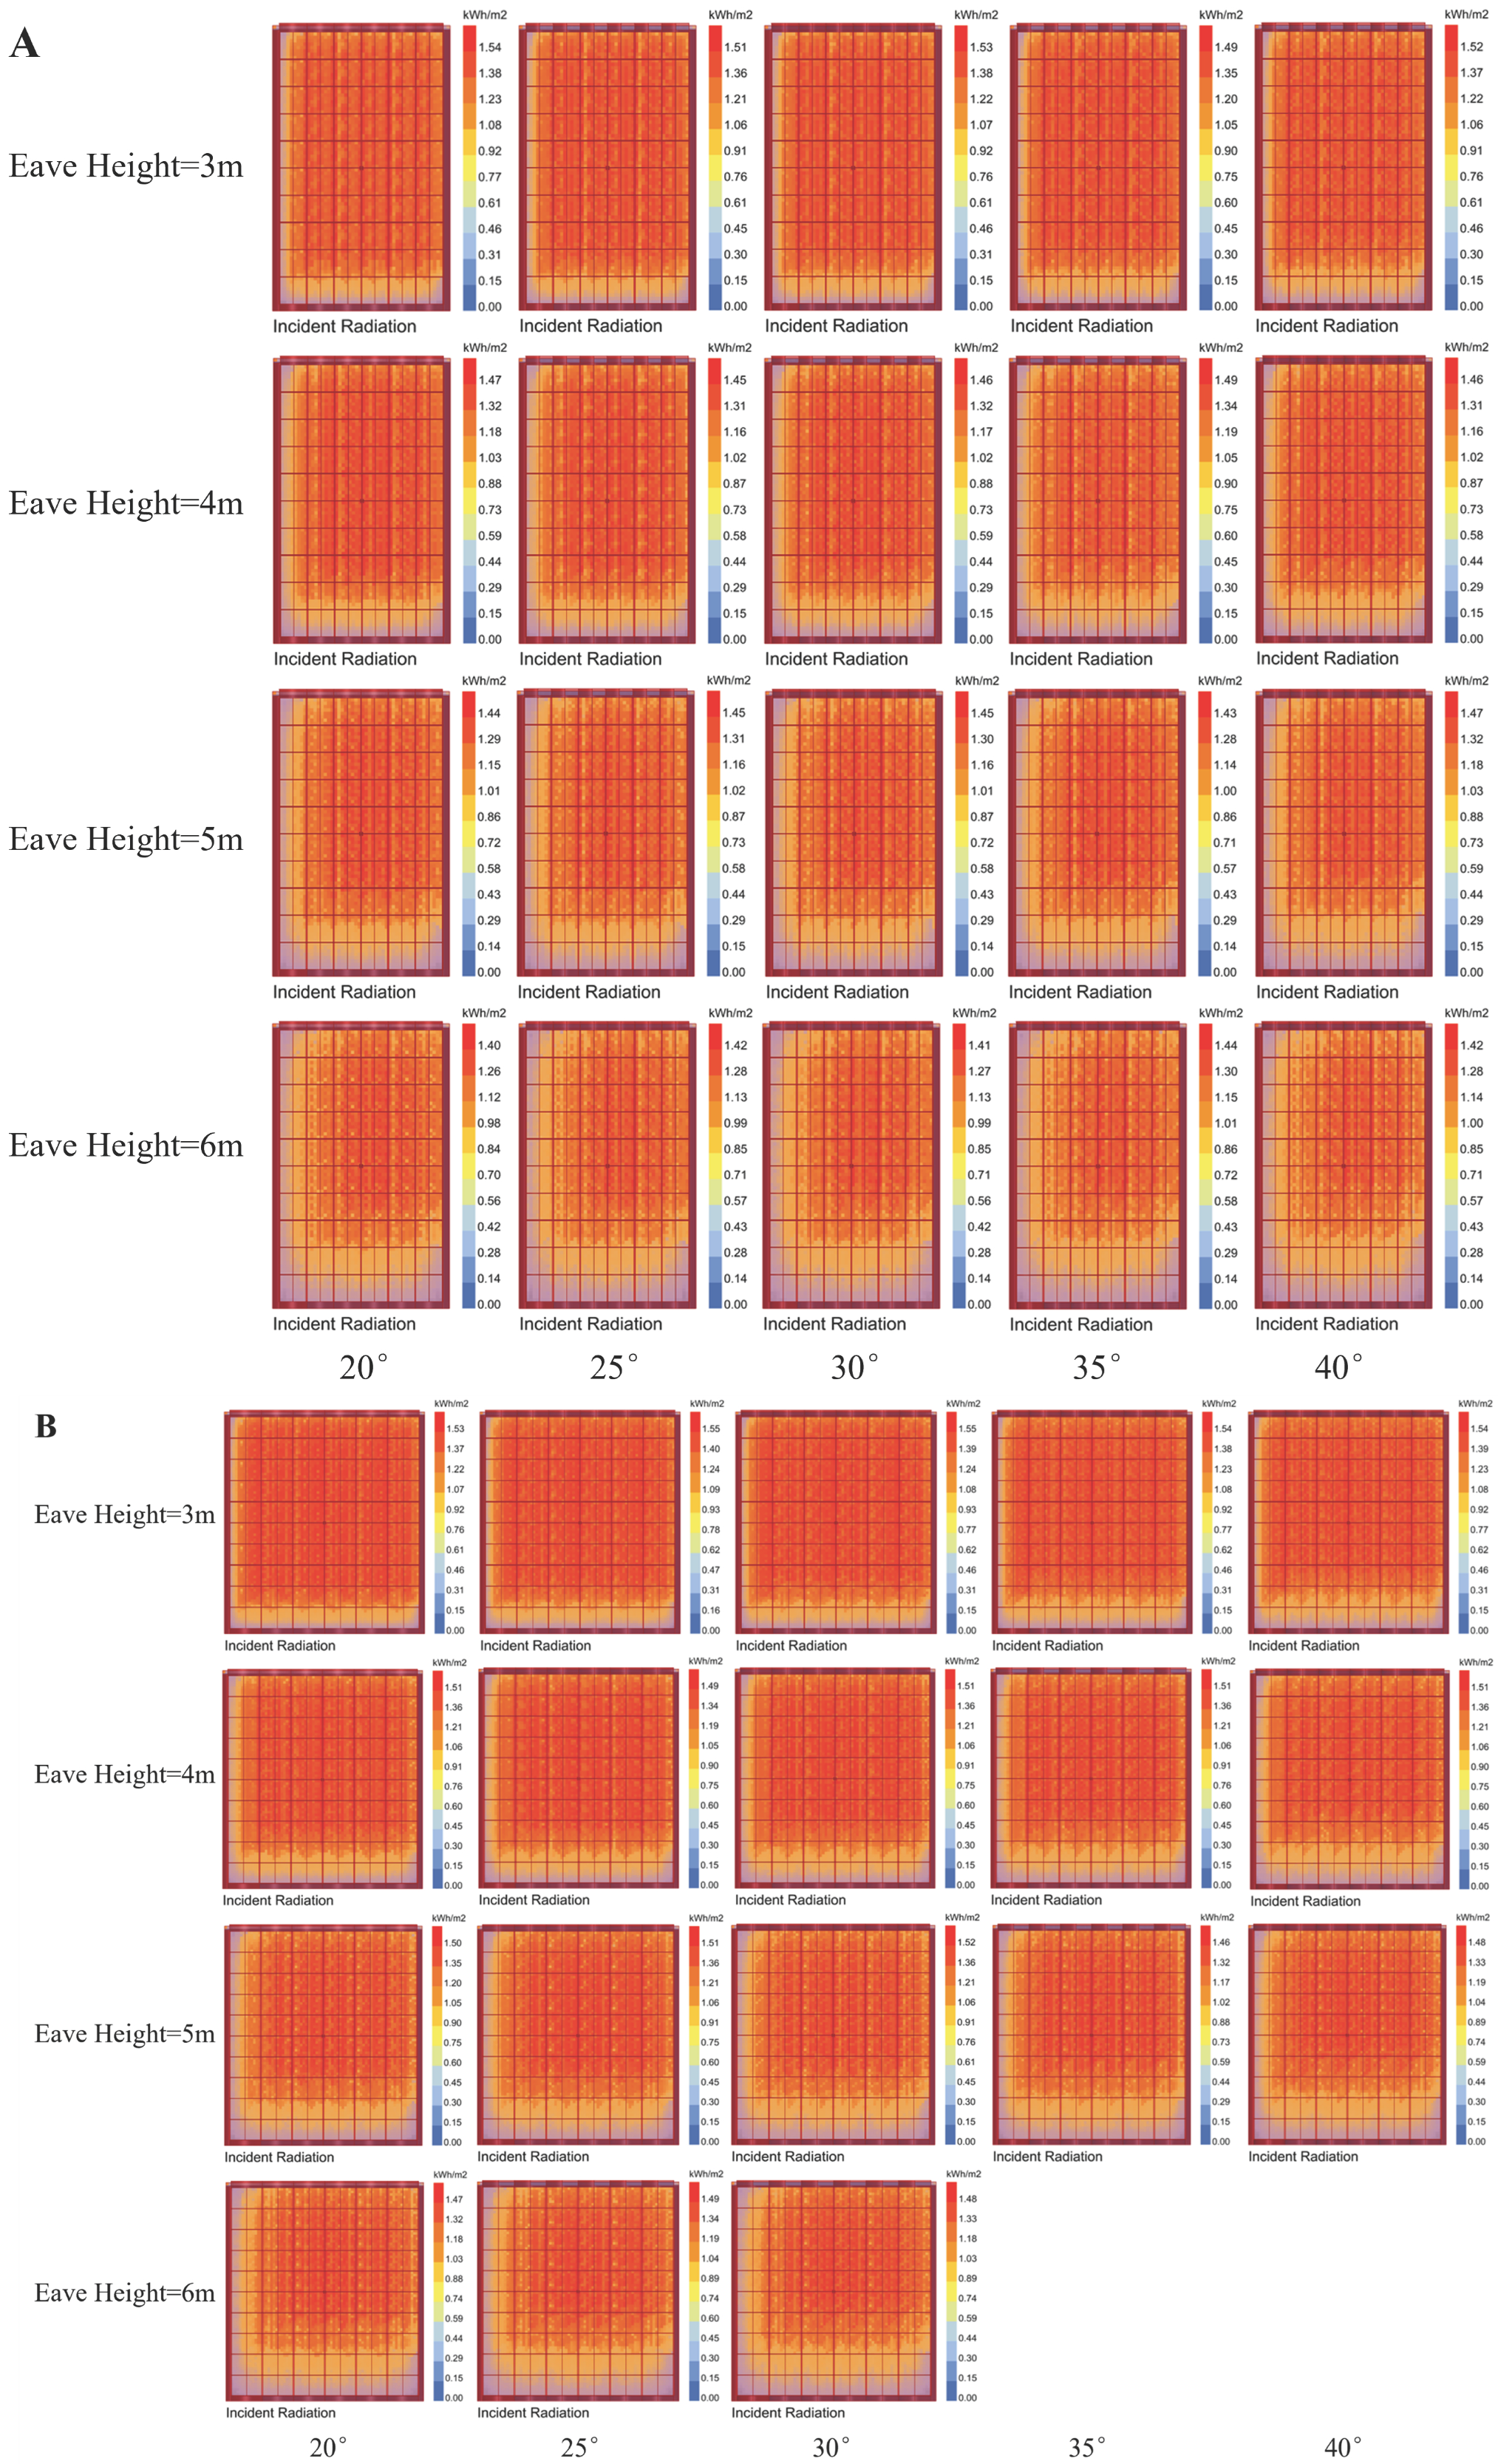
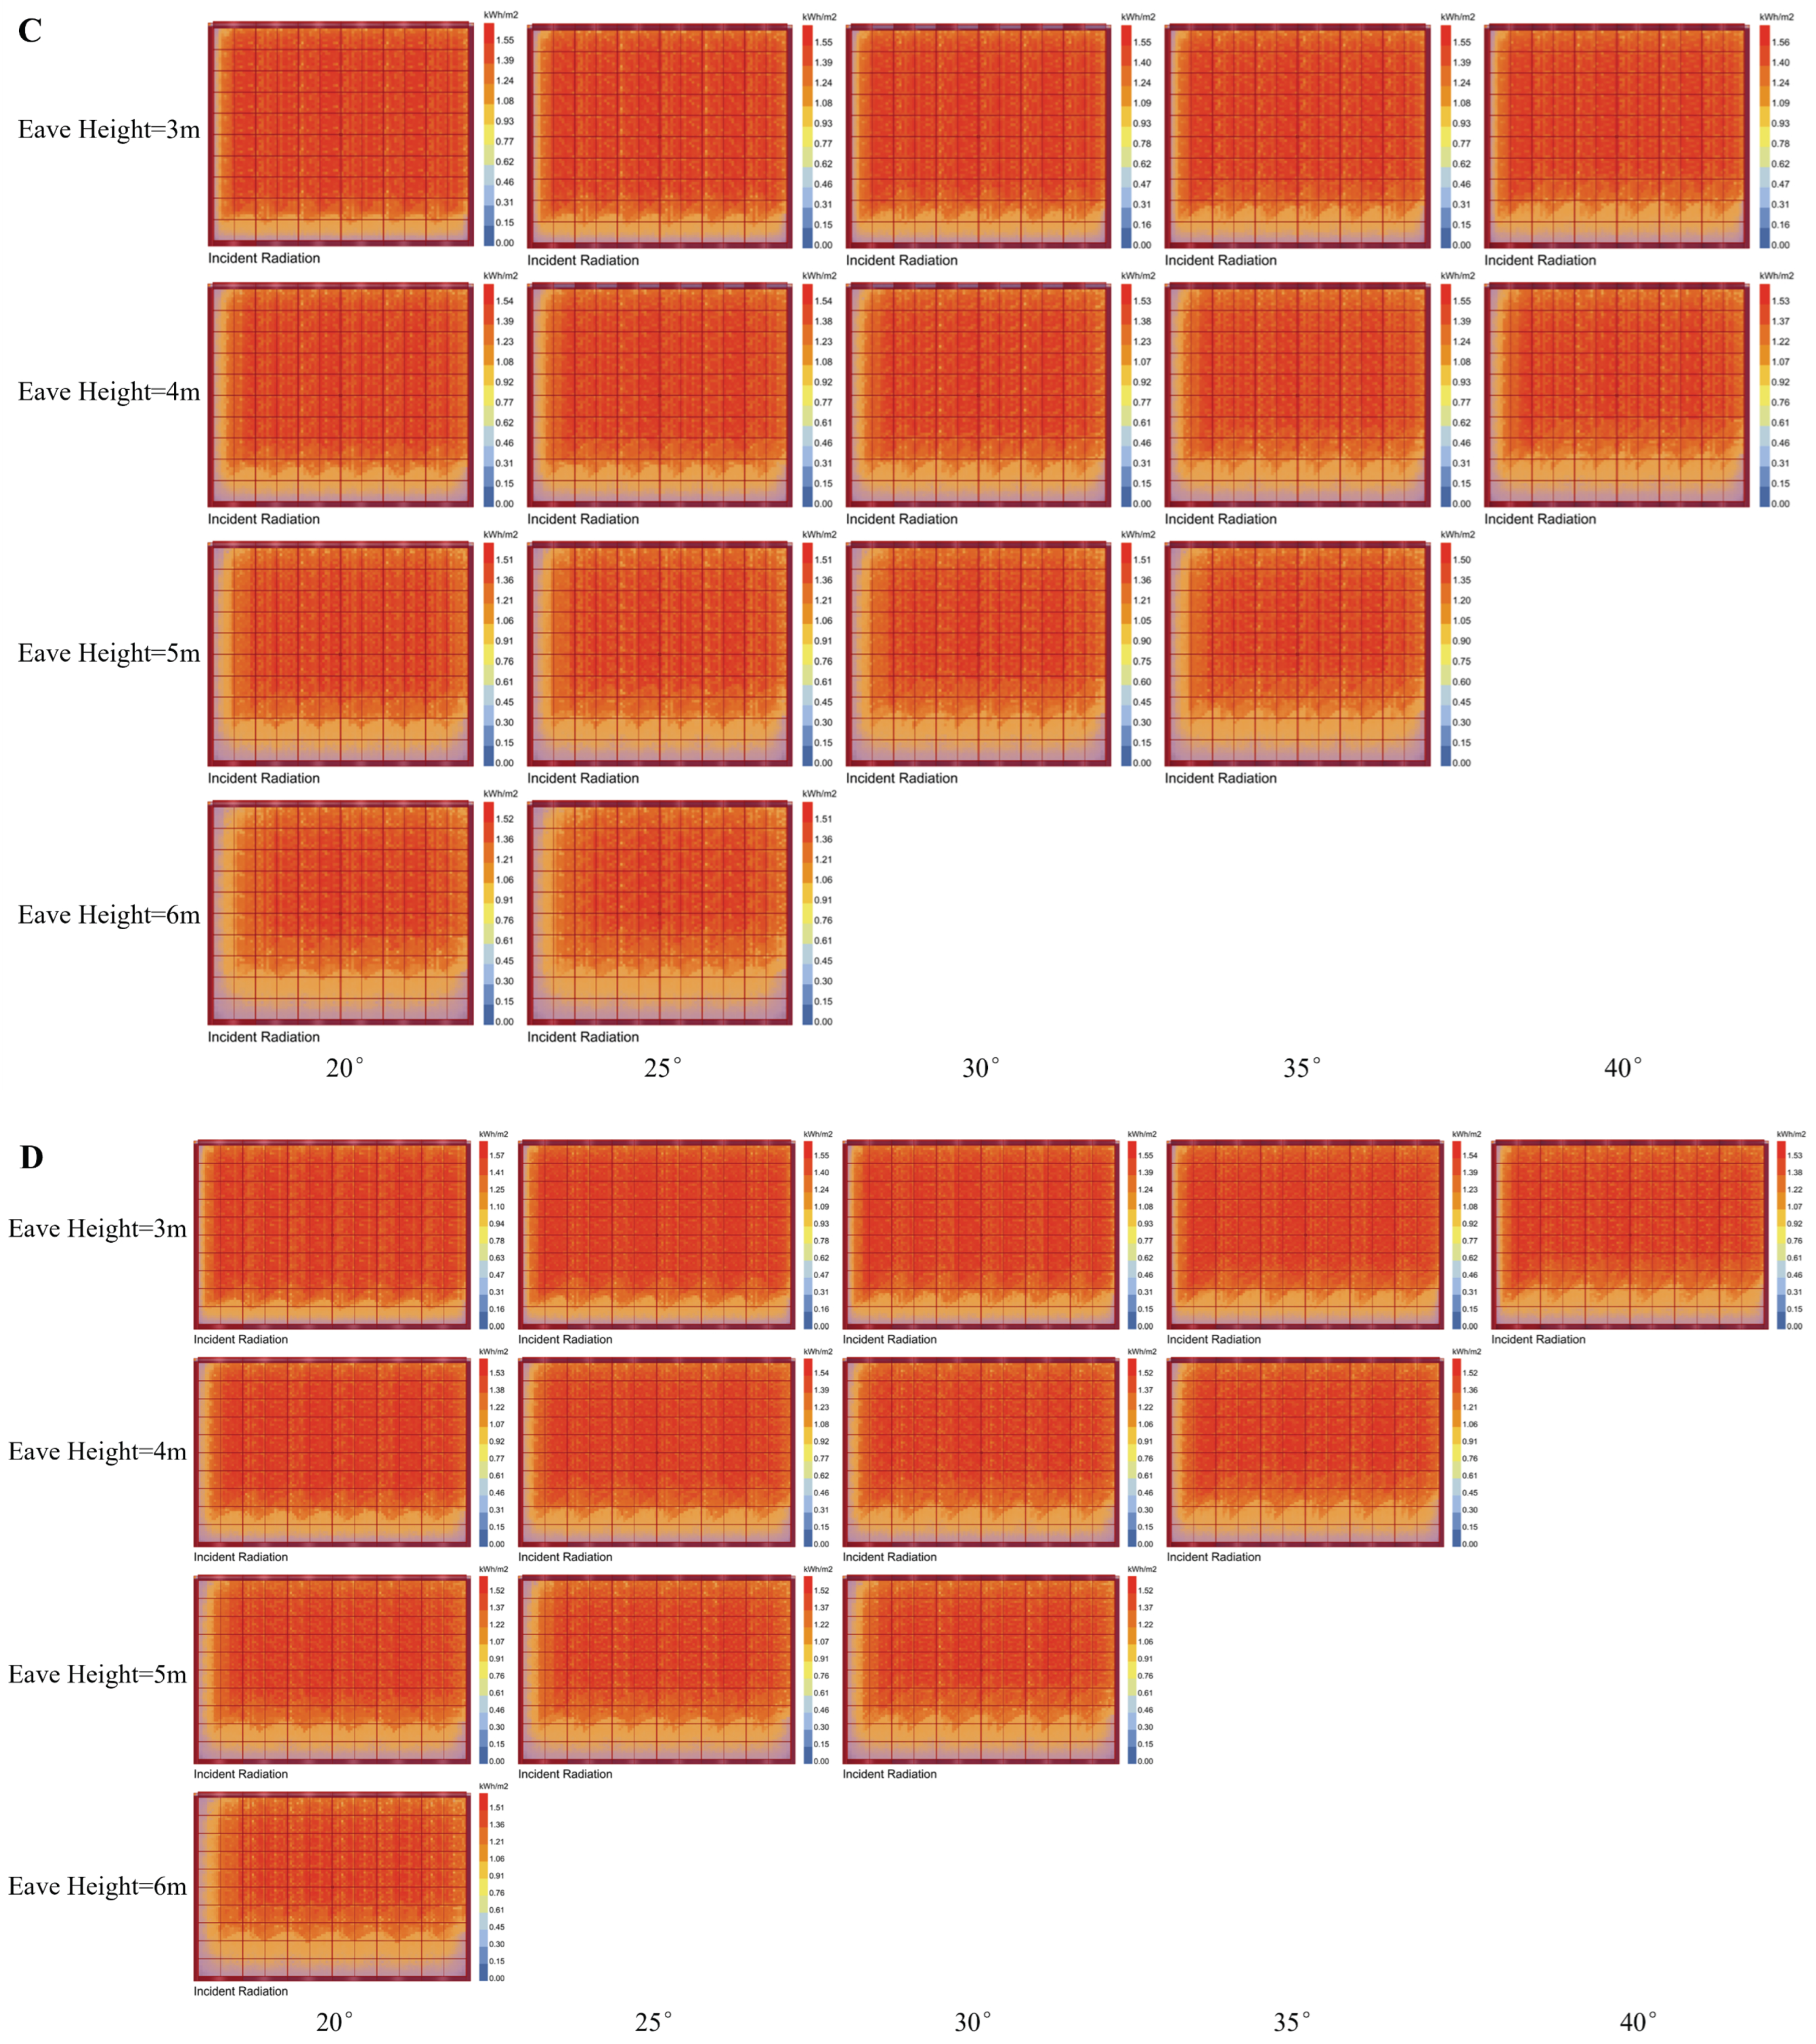
After the azimuth of the greenhouse is determined, the shape of the greenhouse also needs to be studied to complete the preliminary work of greenhouse construction. At present, the research on the geometry of the greenhouse itself mainly focuses on the span, eave height, ridge height and roof slope [31]. Parametric modeling in Grasshopper can quickly change the shape of the greenhouse to quicken the modeling speed and realize the internal simulation of greenhouses of different shapes. To systematically evaluate the influence of greenhouse geometry on the uniformity and total amount of the internal radiation environment, this study is based on four typical span–ridge height combinations (corresponding to different slopes), as shown in Table 5. Considering that the higher ridge height (>8 m) in the greenhouse construction requires a stronger skeleton structure and more covering materials, the ridge height is limited to below 8 m. The spatial distribution of the annual cumulative incident radiation on the greenhouse floor was simulated as shown in Figure 14. The results show that with the increase in slope, the radiation gradient inside the greenhouse tends to be flat without obvious change, and the total internal radiation shows a trend of first increasing and then decreasing. Under the condition of fixed span, the average radiation inside the greenhouse increases with the increase in eave height. Further considering engineering practice, for every 1 m increase in ridge height, the steel structure consumption increases by about 18–22%, the cost of covering materials increases synchronously, and the foundation load and wind resistance design level also need to be improved accordingly. High-ridge greenhouses are conducive to ventilation and radiation collection, but without considering vertical cultivation, their land output efficiency will not be significantly different. At the same time, high-ridge greenhouses will increase the difficulty of maintenance and energy consumption of facilities and equipment inside the greenhouse, while moderate ridge height is more suitable for the integration of automatic environmental control systems. In summary, the optimal shape of the experimental greenhouse is selected with a span of 8 m, eave height of 5 m, and slope of 30° (ridge height of 6.73 m), which take into account structural economy, land intensification and later operation and maintenance convenience.
Table 5.
Main parameters of the simulated greenhouse.
Figure 14.
Cumulative solar radiation in greenhouses of different shapes on the winter solstice: (A) 4 m span; (B) 6 m span; (C) 8 m span; (D) 10 m span.
4. Discussion
4.1. Advantages of Grasshopper
The simulation engine (Radiance) integrated in Grasshopper adopts a strategy combining backward ray tracing and the Monte Carlo method. The former can accurately track the ray paths of each point in the target model and effectively analyze the dynamic shadows generated by complex skeletons. The latter simulates diffuse radiation transmission through random sampling, which significantly improves the analysis of diffuse scattering while balancing calculation speed and accuracy. At the same time, the numerical simulation based on Grasshopper breaks through the limitations of physical measuring points in spatial and temporal distribution. It can not only obtain the instantaneous and cumulative radiation data of any grid point inside the greenhouse (including different heights in the crop canopy) at a very low cost, but also generate high-resolution radiation environment heat maps, providing a reference for quantifying the radiation environment’s uniformity. The parametric characteristics of Grasshopper also allow us to define the span, eave height, slope and skeleton density of the greenhouse as variable parameters. Researchers can quickly iterate hundreds of structural schemes in the same model and feedback the radiation environment under different configurations in real time, which not only greatly reduces the trial-and-error cost of multi-scheme comparison, but also provides a basis for the refined optimization of greenhouse structure.
4.2. Limitations of the Study
Although this study successfully realized the collaborative optimization of greenhouse azimuth and structural geometry by using the Grasshopper parametric platform, there are still limitations due to the underlying algorithm mechanism of the software and the current research scope. The simulation engine used in this study focuses on efficiently analyzing the spatiotemporal distribution law of the radiation environment, but the simulation convergence accuracy for a single measuring point is limited. If higher-precision fixed-point data is required, the sampling density and the number of diffuse radiation samples must be significantly increased. At present, the Grasshopper simulation mainly focuses on the passive acquisition and distribution optimization of natural solar radiation, and has not integrated the radiometric model of artificial radiation sources. Therefore, it is impossible to quantitatively evaluate the impact of artificial supplementary radiation on the radiation environment inside the greenhouse at night or under extreme weather conditions.
4.3. Analysis of Radiation Environment Characteristics of Experimental Greenhouse
The results of this study show that the greenhouse radiation environment presents a significant distribution characteristic of “higher in the northeast, lower in the southwest, higher in the upper and lower in the lower”. In the north–south gradient, due to the obstruction of the southern structure, affected by the solar azimuth and altitude angle, the northern roof receives more direct radiation, and the radiation intensity attenuates from the center to the south. In the multi-span structure, arch rods, trusses, thermal insulation quilts, etc., will form periodic shading under solar radiation, projecting shadow bands parallel and perpendicular to the roof ridge below. In terms of vertical distribution, the higher the horizontal plane, the stronger the radiation intensity. From the time dimension, season and time period have a decisive impact on radiation uniformity. Taking the summer solstice as an example, the average daily radiation uniformity reaches 93.81%, and the noon moment is as high as 96.7%, while the winter solstice decreases to 88.88% and 93.79%, respectively. This is mainly due to the low solar altitude angle in winter, which lengthens the projection of the greenhouse’s structure, increases the shadow coverage area, and exacerbates spatial non-uniformity. Despite the above fluctuations, the optimized greenhouse orientation and roof structure through parametric optimization still effectively improve the overall radiation transmission efficiency. The radiation distribution law of “higher in the northeast and lower in the southwest” finally obtained in this study is consistent with the radiation distribution characteristics of the multi-span greenhouses studied by Mu et al. [20], but the optimal orientation of 1° west of south is different from other regions. The reason is the lower solar altitude angle and latitude and longitude conditions in the Gobi Desert. At the same time, the parameters of 8 m span, 5 m eave height and 30° roof slope of multi-span greenhouses meet the greenhouse construction conditions and can be directly used in engineering design. In terms of simulation accuracy, the R2 (0.9884, 0.9901) obtained in this study is higher than that of similar studies, indicating that the simulation model is suitable for complex double-film greenhouse structures [21]. After optimization, the natural light utilization rate of double-film multi-span greenhouses can be improved, and the energy consumption of artificial supplementary light can be reduced. The double-film structure can reduce heating energy consumption, which meets the requirements of low-carbon agriculture. The development and utilization of relevant greenhouses can realize the supply of local fruits and vegetables, with a short payback period and profit space.
5. Conclusions
In this study, Grasshopper parametric modeling and Radiance ray-tracing technology were used to systematically analyze the radiation environment characteristics of double-film multi-span greenhouses in the Gobi Desert, and targeted structural optimization strategies were proposed through multi-scheme comparison. The main conclusions are as follows:
- (1)
- Model validity: The established Grasshopper–Radiance coupling model can efficiently and accurately analyze the ray transmission process under complex multi-span greenhouse structures. Verified by measured data, the coefficients of determination, R2, between the simulated and measured values of the model on typical days of the summer and winter solstices are 0.9884 and 0.9901, respectively, and the average relative error is controlled within 6.5%, with reliable accuracy, which is suitable for refined evaluation of greenhouse radiation environments.
- (2)
- Spatiotemporal distribution characteristics of radiation inside the greenhouse: The solar radiation distribution inside the greenhouse has strong seasonality and spatial correlation. The irradiance in summer is sufficient or even excessive (central peak 465.5 W/m2), while the irradiance in winter is seriously insufficient (below 50 W/m2 in the southern shaded area). The all-day radiation uniformity of the summer solstice (93.81%) is significantly better than that of the winter solstice (88.88%). The radiation distribution presents a zonal characteristic of “higher in the northeast and lower in the southwest”, and the uniformity increases significantly with height (2 m is better than 1 m).
- (3)
- Optimal greenhouse azimuth: Through the comprehensive evaluation of annual and winter cumulative radiation, the optimal azimuth of multi-span greenhouses in Hotan (37° N) is determined to be 1° west of south. This orientation maximizes the capture of weak irradiance in winter while ensuring the maximization of annual total radiation gain.
- (4)
- Optimal greenhouse geometry: Considering the radiation collection performance, structural cost and operation and maintenance convenience, the following optimal geometric parameter combination of the experimental greenhouse is recommended: span of 8 m, eave height of 5 m, and roof slope of 30° (with the corresponding ridge height about 6.73 m). This configuration not only ensures a high average radiation intensity, but also effectively alleviates the internal radiation gradient difference caused by large spans, achieving a balance between the cumulative radiation value inside the greenhouse and structural economy.
In summary, the parametric radiation environment simulation and optimization framework constructed in this study provides strong theoretical support and technical means for the scientific design and environmental regulation of multi-span greenhouses in the Gobi Desert, and helps to promote the development of facility agriculture in the region towards precision and greening. Future research can further couple artificial radiation source models and crop growth models to achieve radiation–heat–crop collaborative optimization under all-climate conditions.
Author Contributions
D.S.: Conceptualization; Data Curation; Formal Analysis; Software; Visualization; and Writing—Original Draft. W.W.: Conceptualization; Data Curation; Formal Analysis; Software; Visualization; and Writing—Review and Editing. Q.Y.: Conceptualization; Funding Acquisition; Project Administration; and Supervision. S.W.: Conceptualization; Funding Acquisition; Project Administration; and Supervision. Y.H. (Yuexuan He): Formal Analysis; Validation. Y.H. (Yanhua Hou): Funding Acquisition; Investigation; and Project Administration. C.Z.: Funding Acquisition; Investigation; and Project Administration. R.L.: Writing—Review and Editing. Y.J.: Writing—Review and Editing. All authors have read and agreed to the published version of the manuscript.
Funding
This work was supported by the Xinjiang Autonomous Region Key Research and Development Program—Department-Local Joint Project (2023B02020); Key Research and Development Project of the Science and Technology Plan of Sichuan Province (2023YFN0003); Sub-project of the Key R&D Program of the Autonomous Region (2023B02014-1); Xinjiang “2+5” Key Parks Talent Recruitment and Development Program (65320024P000043100041); and the “Small Group” Aid Xinjiang Team and Flexible Aid Xinjiang Expert Talents under the Intellectual Aid Xinjiang Innovation and Expansion Talent Program. The authors gratefully acknowledge Xinjiang Shengshi Huaqiang Agricultural-Technology” Co., Ltd. For providing excellent experimental facilities, sites and funding.
Data Availability Statement
The data will be made available on request.
Conflicts of Interest
The authors declare that they have no known competing financial interests or personal relationships that could have appeared to influence the work reported in this paper.
Abbreviations
The following abbreviations are used in this manuscript:
| PAR | photosynthetically active radiation |
| PPFD | photosynthetic photon flux density |
| PO | polyolefin |
| LED | light-emitting diode |
| SPD | spectral power distribution |
| FSPM | functional–structural plant model |
| TOPSIS | technique for order of preference by similarity to an ideal solution |
| CBDM | climate-based daylight modeling |
| TMY | typical meteorological year |
| EPW | EnergyPlus weather |
| WMO | world meteorological organization |
| MSE | mean squared error |
| MAE | mean absolute error |
| MRE | mean relative error |
| RMSE | root mean square error |
| R2 | coefficient of determination |
References
- Fan, Z.; Liu, Z.; Li, Y.; Zhang, J.; Tu, G.; Ding, T. New insights to boost the application potential of Chinese solar green-houses in cold desert regions: System design and implementation. Energy 2024, 313, 133921. [Google Scholar] [CrossRef] [Scilit]
- Bonuso, S.; Panico, S.; Baglivo, C.; Mazzeo, D.; Matera, N.; Congedo, P.M.; Oliveti, G. Dynamic analysis of the natural and mechanical ventilation of a solar greenhouse by coupling controlled mechanical ventilation (CMV) with an earth-to-air heat exchanger (EAHX). Energies 2020, 13, 3676. [Google Scholar] [CrossRef] [Scilit]
- Zhang, Y.; Xu, L.; Zhu, X.; He, B.; Chen, Y. Thermal environment model construction of Chinese solar greenhouse based on temperature–wave interaction theory. Energy Build. 2023, 279, 112648. [Google Scholar] [CrossRef] [Scilit]
- Mahmood, F.; Al-Ansari, T. Design and analysis of a renewable energy driven greenhouse integrated with a solar still for arid climates. Energy Convers. Manag. 2022, 258, 115512. [Google Scholar] [CrossRef] [Scilit]
- Liu, X.; Wu, X.; Xia, T.; Fan, Z.; Shi, W.; Li, Y.; Li, T. New insights of designing thermal insulation and heat storage of Chinese solar greenhouse in high latitudes and cold regions. Energy 2022, 242, 122953. [Google Scholar] [CrossRef] [Scilit]
- Peng, Y.; Ma, X.; Wang, Y.; Li, M.; Gao, F.; Zhou, K.; Aemixay, V. Energy performance assessment of photovoltaic greenhouses in summer based on coupled optical-electrical-thermal models and plant growth requirements. Energy Convers. Manag. 2023, 287, 117086. [Google Scholar] [CrossRef] [Scilit]
- Lahlou, F.-Z.; Mahmood, F.; Al-Ansari, T. Economic assessment of greenhouse and vertical farm production systems in arid regions: A case study of Qatar. Clean. Circ. Bioeconomy 2025, 12, 100151. [Google Scholar] [CrossRef] [Scilit]
- Allali, F.E.; Fatnassi, H.; Demrati, H.; Errais, R.; Wifaya, A.; Aharoune, A. Greenhouse cooling systems: A systematic review of research trends, challenges, and recommendations for improving sustainability. Clean. Eng. Technol. 2025, 26, 100973. [Google Scholar] [CrossRef] [Scilit]
- Allali, F.E.; Fatnassi, H.; Demrati, H.; Amarraque, A.; Bouharroud, R.; Elame, F.; Aharoune, A.; Wifaya, A. Design and Evaluation of Climate-Adaptive Greenhouses for Semi-Arid regions Using CFD model. Case Stud. Therm. Eng. 2026, 78, 107648. [Google Scholar] [CrossRef] [Scilit]
- Lyu, X.; Xu, Y.; Wei, M.; Wang, C.; Zhang, G.; Wang, S. Effects of vent opening, wind speed, and crop height on microen-vironment in three-span arched greenhouse under natural ventilation. Comput. Electron. Agric. 2022, 201, 107326. [Google Scholar] [CrossRef] [Scilit]
- Yu, G.; Zhang, S.; Li, S.; Zhang, M.; Benli, H.; Wang, Y. Numerical investigation for effects of natural light and ventilation on 3D tomato body heat distribution in a Venlo greenhouse. Inf. Process. Agric. 2023, 10, 535–546. [Google Scholar] [CrossRef] [Scilit]
- Xu, D.; Zhu, J.; Ma, Y. Advances in 3D simulation technology for solar greenhouse systems: A review. Renew. Sustain. Energy Rev. 2026, 226, 116387. [Google Scholar] [CrossRef] [Scilit]
- Huang, L.; Deng, L.; Li, A.; Gao, R.; Zhang, L.; Lei, W. Analytical model for solar radiation transmitting the curved trans-parent surface of solar greenhouse. J. Build. Eng. 2020, 32, 101785. [Google Scholar] [CrossRef] [Scilit]
- Liu, T.; Yuan, Q.; Wang, Y. Hierarchical optimization control based on crop growth model for greenhouse light environment. Comput. Electron. Agric. 2021, 180, 105854. [Google Scholar] [CrossRef] [Scilit]
- Castellano, S.; Santamaria, P.; Serio, F. Solar radiation distribution inside a monospan greenhouse with the roof entirely covered by photovoltaic panels. J. Agric. Eng. 2016, 47, 1–6. [Google Scholar] [CrossRef] [Scilit]
- Chen, C.; Li, Y.; Li, N.; Wei, S.; Yang, F.; Ling, H.; Yu, N.; Han, F. A computational model to determine the optimal orientation for solar greenhouses located at different latitudes in China. Sol. Energy 2018, 165, 19–26. [Google Scholar] [CrossRef] [Scilit]
- Ohashi, Y.; Torii, T.; Ishigami, Y.; Goto, E. Estimation of the light interception of a cultivated tomato crop canopy under different furrow distances in a greenhouse using the ray tracing. J. Agric. Meteorol. 2020, 76, 188–193. [Google Scholar] [CrossRef] [Scilit]
- Kim, J.; Kang, W.H.; Son, J.E. Interpretation and evaluation of electrical lighting in plant factories with ray-tracing simulation and 3D plant modeling. Agronomy 2020, 10, 1545. [Google Scholar] [CrossRef] [Scilit]
- Mu, Z.; Bo, Y.; Xu, J.; Song, K.; Dong, B.; Wang, J.; Shu, S.; Wang, Y.; Guo, S. Development and application of greenhouse light environment simulation technology based on light path tracing. Comput. Electron. Agric. 2024, 218, 108652. [Google Scholar] [CrossRef] [Scilit]
- Bo, Y.; Zhang, Y.; Zheng, K.; Zhang, J.; Wang, X.; Sun, J.; Wang, J.; Shu, S.; Wang, Y.; Guo, S. Light environment simulation for a three-span plastic greenhouse based on greenhouse light environment simulation software. Energy 2023, 271, 126966. [Google Scholar] [CrossRef] [Scilit]
- Xu, D.; Zhang, X.; Henke, M.; Wang, L.; Zhu, J.; Ji, F.; Ma, Y. Exploring the application mode of artificial light sources in solar greenhouses based on functional-structural plant model. Comput. Electron. Agric. 2026, 244, 111486. [Google Scholar] [CrossRef] [Scilit]
- Xu, D.; Wang, D.; Huang, X.; Lu, M.; Ji, F.; Dong, Q.; Xu, Y.; Lv, C.; Zhu, J.; Ma, Y. Precise 3D evaluation of light microclimate for summer production in insulated plastic greenhouses. Energy 2025, 335, 137982. [Google Scholar] [CrossRef] [Scilit]
- Chen, X.; Jiang, Z.; Yang, J.; Ren, J.; Rao, Y.; Zhang, W. Data-driven decision support scheme for multi-area light environment control in greenhouse. Comput. Electron. Agric. 2023, 211, 108033. [Google Scholar] [CrossRef] [Scilit]
- Gao, P.; Yang, Y.; Li, H.; Xu, J.; Tian, S.; Hu, J. Preference-informed multi-objective optimization for energy-saving light environment in greenhouse cucumber seedlings. Expert Syst. Appl. 2026, 309, 131221. [Google Scholar] [CrossRef] [Scilit]
- Ma, X.; Chang, J.; Chai, X.; Liu, Y.; Li, J. Evaluating the canopy light environment, photosynthesis, and fruit comprehensive performance of greenhouse tomato under different mechanized planting layouts. Hortic. Plant J. 2025; in press. [CrossRef] [Scilit]
- Liu, T.; Yuan, Q.; Ding, X.; Wang, Y.; Zhang, D. Multi-objective optimization for greenhouse light environment using Gaussian mixture model and an improved NSGA-II algorithm. Comput. Electron. Agric. 2023, 205, 107612. [Google Scholar] [CrossRef] [Scilit]
- Zhang, X.; Lv, J.; Xie, J.; Yu, J.; Zhang, J.; Tang, C.; Li, J.; He, Z.; Wang, C. Solar radiation allocation and spatial distribution in Chinese solar greenhouses: Model development and application. Energies 2020, 13, 1108. [Google Scholar] [CrossRef] [Scilit]
- Cocetta, G.; Casciani, D.; Bulgari, R.; Musante, F.; Kołton, A.; Rossi, M.; Ferrante, A. Light use efficiency for vegetables production in protected and indoor environments. Eur. Phys. J. Plus 2024, 132, 43. [Google Scholar] [CrossRef] [Scilit]
- Rahim Doust, J.; Nazarideljou, M.J.; Arshad, M.; Ferrante, A. Comparison of the growth, physio-biochemical characteristics, and quality indices in soilless-grown strawberries under greenhouse and open-field conditions. Horticulturae 2023, 9, 774. [Google Scholar] [CrossRef] [Scilit]
- Petržala, J.; Kómar, L.; Kocifaj, M. An advanced clear-sky model for more accurate irradiance and illuminance predictions for arbitrarily oriented inclined surfaces. Renew. Energy 2017, 106, 212–221. [Google Scholar] [CrossRef] [Scilit]
- Qi, Z.; Sun, H.; Jia, Y.; Wei, M.; Zhang, G.; Xu, J.; Sun, X.; Wang, S. Wind effect and optimization of multi-span greenhouses with different roof. Results Eng. 2026, 30, 110029. [Google Scholar] [CrossRef] [Scilit]

Disclaimer/Publisher’s Note: The statements, opinions and data contained in all publications are solely those of the individual author(s) and contributor(s) and not of MDPI and/or the editor(s). MDPI and/or the editor(s) disclaim responsibility for any injury to people or property resulting from any ideas, methods, instructions or products referred to in the content. |
© 2026 by the authors. Licensee MDPI, Basel, Switzerland. This article is an open access article distributed under the terms and conditions of the Creative Commons Attribution (CC BY) license.