


Abstract
Cultivated land spatial layout optimization is of great significance for enhancing comprehensive agricultural productivity and safeguarding food security. However, existing studies primarily focus on production suitability as the optimization objective, while rarely incorporating improvements in cultivated land use resilience and stable use as explicit objectives, which may leave optimized layouts difficult to sustain. To fill this gap, this study takes Meizhou City as a case and conceptualizes cultivated land use resilience under non-grain conversion of the agricultural production structure as a key proxy for stable use. Based on 2019 data, a resistance–reconversion capacity assessment framework is developed, and a 2035-oriented cultivated land layout is generated under a transfer-in–transfer-out area-balance constraint by integrating XGBoost–PVI, the InVEST model, and particle swarm optimization (PSO). The optimized configuration is evaluated using a 2019–2024 observation window. The results show that, after optimization, the mean and minimum cultivated land use resilience increase by 1.72% and 15.16%, respectively, and the share of cultivated land in medium-to-high resilience classes rises by approximately 11.06%. Validation further indicates that parcels selected for transfer-out and transfer-in in the optimized scheme are more likely to undergo transfer-out and restoration in practice. Incorporating cultivated land use resilience into multi-objective layout optimization can simultaneously enhance stable-use potential and spatial integration efficiency, providing decision support for cultivated land layout optimization and sustainable use.
1. Introduction
“Eliminating hunger and achieving sustainable food security” is among the United Nations Sustainable Development Goals (SDGs) to be achieved by 2030 [1]. Yet in 2024, approximately 2.3 billion people worldwide still experienced moderate or severe food insecurity [2]. Meanwhile, continued population growth is projected to double global food demand by 2050 [3], making timely progress toward this goal increasingly challenging [4]. Cultivated land is the foundation of food security [5]. A stable and sustainable supply of cultivated land is a key prerequisite for safeguarding food security [6]. Even so, unstable land use is widespread [7,8]. It is driven by urbanization and shifts in relative returns. The main outcomes include conversion of farmland to built-up land [9], cropland abandonment [10], and conversion of cropland to more profitable plantation uses [11]. For example, Japan’s arable land declined by 15,700 km2 from 1961 to 2014 [12]; in South Korea, paddy area fell by 17.8% on average from 2007 to 2019, largely due to conversion to greenhouse crops and orchards [13]. China is characterized by scarce cultivated land resources on a per-capita basis. Per capita cultivated land is less than half the world average at 0.0009 km2 [14]. To safeguard food security and maintain socio-economic stability, China has implemented stringent cultivated land protection policies, including the cultivated land balance policy (CLBP) and the permanent basic farmland protection initiative [15]. These policies aim to curb cultivated land loss driven by processes such as urbanization and have effectively supported China’s staple grain security. Nevertheless, sustainable cultivated land use in China still faces major challenges. In recent years, under the influence of urban development and agricultural structural adjustment [16,17], a spatial mismatch has emerged between the distribution of cultivated land and agricultural production suitability. On the one hand, more than 5867 km2 of cultivated land is located on slopes steeper than 25° [18], and cultivated land spatially overlaps substantially with ecologically fragile areas and zones of heavy-metal soil contamination [19]. Such land is often situated at higher elevations with steep slopes, poor soil conditions, and elevated ecological risks; it is also associated with high production costs and low profitability [20]. Consequently, it is unsuitable for stable use and is prone to marginalization and even abandonment. On the other hand, since China’s Second National Land Survey, comparative returns in agriculture have driven more than 41,333 km2 of flat land (slope < 2°) to be occupied by forest land [21], and large areas of high-quality cultivated land have been converted to non-grain land-use types such as orchard land and forest land [22]. This has produced a spatial mismatch in agricultural production, with “cultivated land moving uphill while forestry and fruit production expand on plains”, which constrains stable and continuous cultivated land use and undermines stable grain production. Therefore, optimizing cultivated land spatial layout is necessary to address agricultural spatial mismatch, improve the allocation of agricultural production patterns, and strengthen the potential for stable and sustainable use of cultivated land.
Cultivated land spatial layout optimization (CLSLO) aims to improve the efficiency of cultivated land use through planning interventions and to configure a more sustainable spatial pattern. Existing studies can be broadly grouped into two strands. The first strand treats suitability improvement as the core objective and typically follows a zoning-based strategy [23,24,25]. Indicators such as soil and site conditions are selected to build suitability or cultivated land quality evaluation systems; composite indices are then derived via standardization and weighting; and integrated evaluation models (e.g., weighted summation) are applied to classify spatial units into suitability levels. Under constraints related to area [25], terrain [26], contiguity [27], researchers then conduct zoning optimization and spatial relocation to achieve “shifting out low-suitability areas and shifting in high-suitability areas” [21]. This strand provides comparable quantitative evidence across spatial units, enabling ranking and allocation on a unified scale and quantifying improvements before and after optimization. Moreover, by linking indicators to suitability classes through a relatively explicit causal chain, results can be traced back to specific limiting factors, thereby improving the interpretability of proposed schemes. Related work has also broadened the notion of suitability by incorporating ecological suitability [28], ecological niche suitability [29], and geological environment suitability [30], which helps refine zoning and enhance the specificity of optimization strategies. As a result, suitability-oriented studies often produce intuitive and interpretable layout schemes with a degree of practical feasibility. However, cultivated land layout optimization typically involves multiple objectives simultaneously, including grain production, ecological security, farmers’ income growth, and optimization costs. Approaches that focus on suitability improvement alone often overlook trade-offs across these dimensions, limiting the ability to assess economic and ecological costs and potential risks in a timely manner. They also tend to provide limited comparisons among alternative schemes, reducing decision efficiency and flexibility. In response, the second strand emphasizes multi-objective optimization and jointly considers goals such as land suitability and spatial compactness, production suitability, ecological importance, economic feasibility, urban expansion, and quantity–quality–ecology coordination [31,32,33,34,35]. Methodologically, two approaches are common. One integrates multiple objectives into a multidimensional evaluation framework: composite indices or grades are constructed from indicators spanning production, ecology, and economy to support zoning optimization, or scenario settings are used to reflect different preference structures [36,37,38,39,40,41,42]. This approach is straightforward and highly compatible with established suitability-evaluation workflows, but it ultimately compresses multiple objectives into a single index (or a small number of grades), making it difficult to directly identify objective-specific trade-offs in the results; in essence, it remains a “weighted-average” integrated evaluation. The other approach adopts optimization algorithms or mathematical models, in which objectives are formulated as separate objective-function terms and solved simultaneously under multiple constraints (e.g., area and planning). Examples include coordinating land-use conflicts among cultivated land, construction land, and ecological land using partitioned asynchronous cellular automata, the landscape model, or spatial decision models [43,44,45]; employing the AgentLA model to jointly consider suitability and spatial compactness [46]; coupling the Soil and Water Assessment Tool (SWAT) with cellular automata (CA) to increase productivity while reducing irrigation demand [47]; and applying ant colony optimization to address multiple objectives [17,48]. Compared with evaluation-based approaches, algorithmic optimization has a clear advantage. Each objective enters the model as a separate term. The solver considers them jointly during optimization. There is no need to compress them in advance into a single composite score. This structure better captures how multiple objectives jointly shape the resulting layout. It also facilitates comparison across alternative scenarios on each objective. For these reasons, such methods are more adaptable to complex spatial problems with multiple objectives [49]. Despite these advances, existing studies still give insufficient attention to cultivated land use resilience and to the enhancement of stable use potential. Suitability-centered optimization often embeds “stability” within suitability assessments, mainly reflecting parcel-level stability attributes and providing limited insight into the overall stability of cultivated land systems after optimization. Multi-objective studies, meanwhile, typically frame objectives around cropland–other land-use conflicts or production–ecology trade-offs, and rarely conceptualize “enhancing cultivated land use resilience and stable use potential” as an independent objective comparable to the others. If this objective is neglected, optimization may still concentrate cultivated land in areas vulnerable to non-grain conversion, raising the risk of reconversion and exit from cultivation. China’s longstanding policy of dynamic equilibrium of total cultivated land [50], together with the CLBP requirement of “determining requisition by supplementation” [40], implies that any subsequent loss often triggers renewed supplementation and governance. Such cycling erodes the marginal returns to prior remediation and infrastructure investments and locks in an inefficient loop of optimization, reconversion, and additional supplementation. Frequent conversion also imposes sunk and time costs, amplifying resource waste. The practical task is therefore to design layout optimization that strengthens cultivated land use resilience and supports stable, sustained cultivation.
Resilience is a system’s capacity to absorb stress while maintaining core functions and to recover after disruption [51]. It focuses on response processes and recovery pathways under both persistent pressures and sudden disturbances, and it offers an interpretable framework for sustainability assessment and risk governance [52,53]. Originating in ecology, the concept is now widely applied to social ecological systems [54,55], where resilience depends not only on biophysical conditions but also on governance, institutions, and management actions that shape persistence and reorganization [56,57,58]. Cultivated land use systems, in particular, are strongly shaped by human management and institutional constraints [59,60]. Their capacity for stable use is bounded by natural endowments and reinforced or weakened by institutional rules and planning interventions. Against this backdrop, this study introduces the concept of cultivated land use resilience to characterize cultivated land’s capacity to maintain its use and to restore that use when the agricultural production structure is disrupted by non-grain shifts. The concept provides an analytical basis for assessing stable use potential. Importantly, the resilience discussed here concerns use maintenance and recovery under institutional constraints and planning interventions, rather than the self-organized recovery emphasized in ecological resilience.
Within the social ecological resilience framework, we define the cultivated land use system as the land use unit jointly composed of cultivated land and restorable land. Restorable land is land that was once cultivated land but is now classified as orchards, forests, or other agricultural land, has a cultivation history, and can be restored through external intervention [61]. At the raster scale, we build a use resilience assessment system based on resistance and reconversion capacity and track citywide changes in stable use potential using the spatial distribution of resilience and its structural features. Using Meizhou City in Guangdong Province as the study area and 2019 as the baseline, we identify candidate transfer out cultivated land, specify a resilience, ecology, and morphology based objective function for selecting transfer in restorable land, and apply particle swarm optimization under an area balance constraint to generate an optimized layout for the 2035 cultivated land protection special plan period. We evaluate outcomes with ten indicators and use 2019 and 2024 land use data as an observation window to assess feasibility and policy relevance. The analysis asks whether layout optimization can enhance cultivated land use resilience potential and strengthen stable use capacity under non grain shifts, and it provides planning evidence for China and other regions with comparable constraints.
2. Theoretical Framework
This section first defines the objects and goal of CLSLO. Building on this, it aligns the connotations of the “enhancing stable-use potential” goal with resilience theory, introducing and defining concepts such as cultivated land use resilience, and thereby establishes enhancing cultivated land use resilience as the core pathway to achieving the optimization goal. The theoretical framework is shown in Figure 1.
Figure 1.
Theoretical framework.
2.1. Optimization Objects and Goal of CLSLO
- (1)
- Optimization objects
The optimization objects for CLSLO comprise two parcel types, both drawn from The Third National Land Survey Database. The first is cultivated land, defined as parcels currently classified as cultivated land. The second is restorable land, referring to parcels currently classified as non-cultivated land such as orchards and woodland, but with a documented cultivation history because they were previously cultivated land and can be reconverted to cultivated land use through engineering and management interventions. Restorable land is largely formed by transfer out from cultivated land driven by agricultural restructuring and land greening, and thus represents a use-differentiated state of the cultivated land system under non-grain conversion disturbance. Given its reversible and convertible linkage with cultivated land, restorable land serves as a potential inflow pool for layout optimization. In practice, reconversion capacity varies markedly across parcels due to combined constraints from topography, planning controls, and pollution risks, leading to substantial heterogeneity in remediation feasibility and post-reconversion stability. To improve remediation efficiency and stable use, restorable parcels are excluded if slopes exceed 25°, if they fall within the ecological protection red line, if they carry an urban attribute, or if they face heavy metal pollution risk. The remaining parcels are treated as candidate restorable land with remediation potential and incorporated into the optimization model. Accordingly, the optimization focuses on existing cultivated land and candidate restorable parcels that retain remediation potential after applying the above constraints.
- (2)
- Optimization goal and its connotations
Non-grain conversion of the agricultural production structure has become a major driver of cultivated land loss and unstable use in China. It is primarily manifested as the conversion of cultivated land to other agricultural land-use types—such as orchard land, forest land, and grassland—due to agricultural restructuring and national greening initiatives [62,63]. This process is often accompanied by practices such as tree planting and fruit cultivation; root systems penetrate deeper soil layers and disturb the plough layer, thereby impairing soil physicochemical properties [64] and weakening the biophysical basis for cultivated land to persist as cropland.
Accordingly, this study takes enhancing the potential for stable cultivated land use as the goal of CLSLO and treats use stability as its key manifestation. Here, stable use refers to cultivated land maintaining its use as cultivated land over a given period without conversion, or reverting to cultivated land use within a relatively short time after conversion. By contrast, unstable use refers to cases in which cultivated land is converted to orchard land, forest land, grassland, ponds, or other land-use types due to industrial adjustment, engineering interventions, or ecological construction, and exhibits a limited capacity to revert to cultivated land use.
2.2. Core Pathway: Enhancing Cultivated Land Use Resilience
Given the optimization objects and goal, resilience is framed around cultivated land use. The focal disturbance is non-grain conversion of the agricultural production structure induced by agricultural restructuring. The core function of interest is the persistence of cultivated land use and its reconversion after conversion.
Building on existing studies of cultivated land resilience [51,65,66,67,68], this study proposes the concept of cultivated land use resilience, defined as the integrated capacity of the cultivated land system—grounded in its inherent biophysical and locational conditions—to absorb and withstand non-grain disturbances and, once disturbed, to restore (revert to) cultivated land use and remain stable thereafter. Because this study focuses on whether cultivated land use remains unchanged and, if converted, whether it can return to cultivated land use (rather than on self-evolution or transformation to a higher-level regime), cultivated land use resilience is conceptualized as comprising primarily cultivated land use resistance and reconversion capacity. Specifically, cultivated land use resistance refers to the capacity of cultivated land, relying on its own conditions, to maintain its current use when confronted with non-grain drivers (e.g., price fluctuations and policy adjustments). Cultivated land use reconversion capacity is the ability of cultivated land, after use conversion driven by non-grain conversion disturbance, to be restored and stably reconverted to cultivated land use under intrinsic site conditions and external interventions. In addition, a threshold denotes the critical value delimiting the stability domain of system resilience, reflecting the level at which a system can remain stable under gradual change over time [69]. Once a threshold is exceeded, the system may shift from one regime to another [70], potentially triggering an irreversible transition and reducing sustainability [71]. Accordingly, this study defines cultivated land that is close to this critical point—where use resilience is markedly weakened but not yet fully destabilized—as critical-resilience cultivated land. It is further distinguished into (i) cultivated land constrained by rigid constraints and (ii) cultivated land with substantially low use resilience; both are treated as priority transfer-out targets in CLSLO.
Given the common-origin relationship between cultivated land and restorable land in terms of land use, this study further proposes restorable land use resilience. Consistent with the above definitions, restorable land use resilience refers to the potential capacity of a parcel—assuming it has been restored to cultivated land—to rely on its existing biophysical and locational conditions to withstand future non-grain disturbances and, once disturbed, to restore (revert to) cultivated land use and remain stable thereafter. Specifically, restorable land use resistance refers to the ability of a parcel, once restored to cultivated land, to maintain cultivated land use when confronted with non-grain disturbances; restorable land use reconversion capacity is the ability of restorable land to regain cultivated land use after it has been restored to cultivated land and subsequently converted into non-grain cultivated land, under intrinsic site conditions and external interventions. Assessing restorable land use resilience enables the identification of candidate restorable land parcels that are more conducive to maintaining cultivated land use, which can then be prioritized as transfer-in targets.
In summary, under the resistance and reconversion capacity framework, this study develops assessment systems for cultivated land use resilience and restorable land use resilience. It identifies and transfers out cultivated land in a critical state with weakened use resilience, while prioritizing the transfer in of restorable land parcels with higher use resilience. Through a coupled outflow–inflow pathway, improvements in cultivated land use resilience are embedded in the layout optimization process to enhance the potential for stable cultivated land use.
3. Material and Methods
3.1. Study Area
Meizhou (23°23′–24°56′ N, 115°18′–116°56′ E) is located in northeastern Guangdong Province, China, and belonging to northern Guangdong. It covers a total area of 15,864.51 km2 (Figure 2). The city lies in a typical hilly–mountainous landscape; mountains, hills, tablelands, and terraces together account for 80.90% of its area, and the terrain generally slopes from north (higher) to south (lower). Meizhou has a subtropical monsoon climate with abundant water resources and sufficient heat, providing favorable conditions for crop growth. As a major grain-producing area and a key region for high-quality rice production in Guangdong Province, Meizhou plays an important role in securing grain supply for Guangdong and the broader South China region. Despite these advantages, the dominance of mountainous terrain and limited flat land have resulted in highly fragmented cultivated land, a suboptimal spatial layout, and relatively low land-use efficiency, creating an urgent need to enhance grain production capacity through spatial optimization. Moreover, Meizhou is located in a high-risk “non-grain” area in northern Guangdong; rural outmigration and farmland abandonment are prominent, exerting substantial pressure on the stability of cultivated land use. In response, the municipal government has in recent years promoted cultivated land spatial layout optimization and the cultivated land balance policy through measures such as high-standard farmland construction and cultivated land restoration. These efforts provide a solid institutional and practical basis for empirical research centered on “layout optimization–stable use.” Accordingly, Meizhou is an appropriate and practically relevant case study area.
Figure 2.
Location of the study area and the spatial distribution of DEM and restorable land.
3.2. Data Sources
The spatial datasets used in this study comprise two categories—vector and raster data—and their names and sources are summarized in Table 1. The vector datasets (land-use data, cultivated land quality classification data, and planning data), together with the raster datasets (DEM, population, GDP, and nighttime light data), were used to derive the indicators for the use-resilience assessment. In addition, annual precipitation and evapotranspiration datasets were used as inputs to the InVEST model. All raster datasets were resampled to a unified spatial resolution of 20 m.
Table 1.
Data sources and descriptions.
3.3. Methodology
3.3.1. Research Framework
The research framework consists of three steps (Figure 3). (1) Identification of transfer-out cultivated land. Drawing on resilience theory, we define cultivated land use resilience and identify critical-resilience cultivated land, including cultivated land constrained by rigid constraints and cultivated land with substantially low use resilience; these parcels are designated as transfer-out targets. (2) Construction of a transfer-in model for restorable land. First, restorable land parcels that do not satisfy the screening criteria related to topographic constraints, planning constraints, and pollution constraints are excluded. Second, for the remaining candidates, we establish a three-subobjective synergistic framework-“resilience–ecology–morphology”-by formulating an overall utility function that (i) maximizes restorable land use resilience, (ii) minimizes ecological cost, and (iii) maximizes the compactness and contiguity of the future spatial pattern. Third, a PSO-based transfer-in model for restorable land is developed. (3) Resilience-led multi-objective cultivated land layout optimization. Under the transfer-in–transfer-out area-balance constraint, weights are specified following the principle of “resilience-led, multi-objective synergy,” and the PSO algorithm is implemented to incorporate ecological cost and future compactness into the optimization model, thereby generating an optimized cultivated land pattern. Resilience was reassessed for the optimized pattern to compare cultivated land use resilience before and after optimization. The 2019–2024 observation window was used to validate the scheme’s practical feasibility and realized effects.
Figure 3.
Research framework.
3.3.2. Identification of Transfer-Out Cultivated Land
As described in Section 2.2, a subset of cultivated land can be characterized as critical-resilience cultivated land. Although not yet fully destabilized, this subset lies close to the system threshold, implying heightened instability and an elevated risk of land-use conversion. It therefore warrants priority identification and management. In this study, critical-resilience cultivated land is further divided into cultivated land constrained by rigid constraints and low-resilience cultivated land.
Identification of Cultivated Land Constrained by Rigid Constraints
Cultivated land constrained by rigid constraints refers to parcels that are currently classified as cultivated land but have exceeded at least one hard bottom-line indicator, crossing either land-use suitability limits or policy red lines, and thus approaching the critical boundary of sustainable use within the cultivated land system. Transferring out an appropriate share of such parcels can be viewed as a preventive exit strategy, which helps release governance resources and avoids the continued erosion of system stability by high-risk land. Using spatial overlay analysis, this study identifies cultivated land as transfer-out targets if it meets any of the following conditions: slopes exceeding 25°, location within the ecological protection red line, presence of an urban attribute, or exposure to heavy metal pollution risk.
Identification of Low-Resilience Cultivated Land
Low-resilience cultivated land refers to parcels for which no single indicator exceeds a suitability or policy threshold, but that simultaneously exhibit unfavorable conditions across multiple dimensions (e.g., soil, water availability, slope, location, farming conditions, and policy support), resulting in markedly low overall resilience. Transferring out such parcels helps avoid a low-efficiency maintenance trap and releases resources for reallocation, thereby improving both use resilience and the efficiency of spatial configuration. Accordingly, this study establishes a resistance–reconversion capacity framework to assess cultivated land use resilience and identify low-resilience cultivated land (Table 2). In this framework, resistance comprises intrinsic disturbance tolerance and external exposure, while reconversion capacity comprises reversibility and feasibility.
Table 2.
Framework for assessing cultivated land use resilience and restorable land use resilience.
Cultivated land’s ability to resist non grain pressures and retain its use is shaped by the interaction between internal conditions and external forces [72]. Intrinsic disturbance tolerance captures the land’s inherent suitability for continued cultivation. It is determined by water, soil, and site conditions, together with scale operation potential reflected in contiguity and regularity. Irrigation and drainage support stable cultivation by securing water supply and drainage capacity [73]. Soil conditions determine baseline productive capacity [74]. Site conditions raise mechanization and management costs through slope and elevation and increase degradation risks such as erosion, which makes cultivation more prone to marginalization and weakens resistance to conversion [75]. By contrast, scale operation potential strengthens resistance by enabling economies of scale, lowering unit costs, and improving operating efficiency [76,77]. External exposure reflects the intensity of non-grain pressure. Institutional protection reduces both the likelihood and speed of conversion through land use regulation and prioritized oversight [78,79]. Market proximity and urbanization raise opportunity costs and strengthen the relative returns to non-grain uses, increasing conversion incentives [80]. Profit-driven pressure was quantified using distance to markets, neighborhood construction land intensity, and nighttime light intensity. These variables serve as spatial proxies for parcel-level comparative returns and opportunity costs, capturing the opportunity costs of converting cultivated land to non-grain uses and the relative returns of non-grain uses, thereby indicating the economic incentive strength underlying land-use conversion. Labor outmigration, population aging, and greater distance from settlements raise daily inputs and management difficulty, heighten operational uncertainty, and weaken sustained cultivation capacity [81]. In combination, intrinsic disturbance tolerance governs whether a parcel can sustain cultivation and maintain relative returns, while external exposure governs how strongly non grain forces translate into conversion. Together, they form the core basis for the resistance dimension in the use resilience assessment.
Reversibility refers to whether non grain cultivated land retains the soil fertility basis and natural suitability required for restoration. It is the objective precondition for reconversion and is proxied by the arability foundation index, which summarizes post remediation cultivation foundations such as topsoil depth, soil organic matter, and texture. Higher values imply lower remediation intensity [82], lower failure risk, and shorter restoration cycles [83], thereby increasing the objective likelihood of returning to cultivated land use. Feasibility captures whether restoration can be delivered under real world constraints through engineering and policy support. It is reflected in resource input capacity, which signals sustained policy and fiscal backing that brings restorable parcels into implementation and reduces interruption and maintenance gaps [84], and in implementation feasibility, which captures organizational and construction costs that fall with better transport and road accessibility, improving cost and schedule control and supporting durable outcomes [85]. Subject to data availability, local government fiscal capacity, inclusion within cultivated land centralized consolidation zones, and machinery accessibility were used as proxies for the ability to support optimization-oriented consolidation and sustain subsequent inputs, thereby jointly reflecting economic and implementation constraints. Taken together, cultivated land use reconversion capacity rests on reversibility as the “can it be restored” condition and on feasibility as the “can it be delivered” pathway. The two jointly shape the probability, speed, and stability of reconversion from non grain use to cultivated land use.
The indicators were tested for multicollinearity in ArcGIS Pro3.4 using ordinary least squares (OLS). Variance inflation factors (VIFs) ranged from 1.036 to 1.755, indicating no meaningful multicollinearity [86,87]. For measurement, indicators are nondimensionalized using min–max normalization. Weights are determined using the Analytic Hierarchy Process (AHP), and cultivated land use resilience is calculated using a weighted sum model; the relevant formula is provided in Equation (1).
where represents the composite land-use resilience score of unit i; represents the weight of the -th evaluation indicator; represents the normalized score of unit on indicator ; and represents the total number of indicators, with .
3.3.3. Formulation of the Objective Functions for Restorable Land Transfer-In
Restorable land transfer-in is essentially a multi-objective spatial siting problem [17]. In addition to supporting the stable use of cultivated land, transfer-in decisions may generate external effects on ecosystem services and the morphology of the post-optimization spatial pattern. Accordingly, this study formulates a “resilience–ecology–morphology” multi-objective framework that maximizes restorable land use resilience, minimizes ecological cost, and maximizes the compactness of the future pattern, thereby enabling a systematic improvement of cultivated land layout.
Maximizing Restorable Land Use Resilience
- (1)
- Development of the indicator system for restorable land use resilience
Based on the conceptual definition of restorable land use resilience, the reconversion capacity component involves a key assumption: after a restorable parcel is restored to cultivated land through consolidation, it may be converted again to non-grain use under subsequent non-grain disturbances. In this case, the resulting non-grain state is represented by the parcel’s current land-use type and restoration attribute. Therefore, building on the cultivated land use resilience indicator system, this study introduces two restorable land–specific indicators—restoration attribute and land-use type—into the reversibility component of reconversion capacity, so as to better capture the parcel’s intrinsic potential to revert to cultivated land use.
- (2)
- Determination of indicator weights
Use resilience assessment for restorable land is essentially an out of sample inference task. It requires inferring latent resilience from observed attributes while maintaining stable discrimination on unobserved samples. Traditional weighting schemes, such as expert scoring, are better suited to composite evaluations with stable rules, near linear relationships, and a premium on interpretability. They are less effective at capturing nonlinear structure and generalizable regularities, and they are less robust for prediction. We therefore derive weights for the restorable land module by combining eXtreme Gradient Boosting (XGBoost) with permutation variable importance (PVI).
XGBoost is a machine-learning algorithm based on gradient-boosted decision trees [88], in which ensembles of trees combine predictors in different ways to generate forecasts [89]. XGBoost incorporates regularization to control model complexity, which is a key feature for improving generalization performance [90,91]. It also offers practical advantages, including automatic handling of missing values, parallel computation, and robust performance under multicollinearity and nonlinear relationships [92,93,94]. Feature importance in XGBoost is often reported using built-in measures such as gain, frequency, and coverage [95]. Because these measures are derived from training data, they may overstate the importance of variables that improve in-sample fit but contribute little to out-of-sample generalization under overfitting [96], making them unsuitable for deriving predictive weights. Therefore, this study employs PVI, which quantifies the decrease in model performance when a feature is randomly permuted; a larger decrease indicates a greater contribution to generalization performance. Using PVI to derive indicator weights offers three advantages: (i) it is computed on a validation or test set and therefore reflects performance on unseen samples; (ii) it directly measures each indicator’s contribution to predictive accuracy, aligning with the forward-looking logic of this study; and (iii) it can be computed on top of XGBoost and aligned with the selected loss/metric (e.g., Area Under the Receiver Operating Characteristic Curve (AUC)), avoiding inconsistencies between the weighting criterion and the evaluation objective [96,97,98].
Accordingly, separate XGBoost models are developed for resistance and reconversion capacity. From the final models, we compute PVI for each indicator component, sum PVI within each indicator to obtain indicator weights, and construct the use resilience score using a weighted sum. To mitigate overfitting, samples are randomly split into an 80% training set and a 20% test set. For the resistance model, parcels labeled as cultivated land versus restorable land in the Third National Land Survey dataset are used as the binary dependent variable, with 16 resistance-related indicator components as predictors. For the reconversion capacity model, the binary dependent variable distinguishes parcels that were restorable land in 2019 and became cultivated land in 2024 from parcels that were restorable land in 2019 and remained restorable land in 2024, with 6 indicator components as predictors. Model performance was evaluated using AUC. The AUC was 0.92 for resistance and 0.86 for reconversion capacity, indicating strong discriminative ability [99].
Minimizing Ecological Cost
Cultivated land restoration reshapes land-use patterns and can affect multiple ecosystem services. Minimizing ecological cost aims to improve grain production while minimizing adverse ecological impacts to the greatest extent possible [100]. In this study, ecosystem service values are quantified using the InVEST model via four modules—carbon storage, habitat quality, sediment retention, and water yield. Model outputs are normalized using min–max normalization, and equal weights (0.25 each) are assigned to the four modules. The composite ecosystem service value is then obtained using a weighted sum.
- (1)
- Carbon storage
The InVEST model estimates carbon storage using land-use maps and carbon density parameters for each land-use type [101]. Carbon density values were adopted from previous studies [102], and the calculation is provided in Equation (2).
where represents total carbon storage (t/hm2); represents aboveground carbon storage (t/hm2); represents belowground carbon storage (t/hm2); represents soil carbon storage (t/hm2); represents dead organic carbon storage (t/hm2).
- (2)
- Habitat quality
The InVEST habitat quality model estimates habitat quality by integrating the sensitivity of land-cover types with the intensity of threat factors within the study area [103]. Sensitivity parameters and threat sources were adopted from previous studies [104,105], and the calculation is provided in Equation (3).
where represents the habitat quality of unit x under land-use type j; represents the habitat suitability of land-use type j; represents the habitat degradation level of unit x under land-use type j; k is the half-saturation constant; and z is a constant, typically set to 2.5.
- (3)
- Sediment retention
Soil conservation refers to an ecosystem’s capacity to prevent soil loss (erosion control) and retain sediments through storage [106]. The corresponding equations are provided in Equations (4)–(6).
where represents soil retention (t/hm2); represents potential soil loss (t/hm2); represents actual soil loss (t/hm2); is the rainfall erosivity factor (MJ·mm/hm2·h·a); is the soil erodibility factor (t·hm2·h/MJ·hm2·mm); is the slope-length factor; is the slope-steepness factor; is the cover-management (vegetation) factor; is the support-practice (soil and water conservation) factor.
- (4)
- Water yield
The InVEST water yield model estimates water yield for each raster cell as precipitation minus actual evapotranspiration and assumes that the generated water reaches the watershed outlet via surface or subsurface runoff [107]. The calculation is provided in Equation (7).
where represents the annual water yield of unit x under land-use type j (mm); represents the actual evapotranspiration of unit x under land-use type j (mm); represents the annual precipitation of unit x under land-use type j (mm).
Maximizing the Compactness of the Future Spatial Pattern
Cropland fragmentation undermines mechanized farming operations [108] and reduces effective planted area [109], which runs counter to the goal of cultivated land layout optimization. In addition, the resilience assessment above incorporates contiguity with existing cultivated land and shape regularity as local spatial-structure indicators to represent the scaling potential of candidate parcels. However, because these indicators are defined at the parcel or neighborhood scale, they cannot capture morphological changes in the overall cultivated land pattern after transfer-in. Therefore, this study applies the four-neighborhood method to compute the boundary length of the post-optimization pattern at the raster scale [110], thereby assessing overall spatial morphology and avoiding fragmented outcomes (e.g., small isolated patches) after optimization. The compactness of the future pattern is calculated using Equations (8)–(11).
where represents the concentration–compactness of the future pattern; and represent the theoretical maximum and minimum boundary lengths, respectively; represents the actual boundary length of the new pattern; is the total number of cultivated-land pixels in the new pattern; is the raster cell size (edge length); is the area of the circle; and is the number of four-neighbor pixels of cell i that are cultivated land.
3.3.4. Resilience-Led Multi-Objective Collaborative Model for CLSLO
Particle swarm optimization (PSO) is an evolutionary algorithm widely used in spatial optimization, particularly for multi-objective problems [111]. Originally proposed by Kennedy and Eberhart and inspired by avian foraging behaviour, PSO is noted for its robustness, rapid convergence, and relatively low sensitivity to problem dimensionality [49,112]. In PSO, candidate solutions are represented as particles in the search space; the algorithm searches for an optimum by iteratively updating particle velocities and positions. Throughout this process, constraints can be incorporated to guide the search direction and ensure solution feasibility [113,114]. In this study, a particle encodes a raster-scale spatial configuration of candidate transfer-in parcels. During each iteration, a fitness function is used to evaluate and update both the individual best and the global best solutions; the velocity–position update mechanism then explores improved configurations. To guarantee feasibility, an area-balance constraint between transfer-in and transfer-out is imposed. The PSO objective function defines the fitness function. We use a linear weighted sum to collapse multiple subobjectives into a single fitness measure, enabling coordinated multi-objective optimization under fixed weight scenarios, as shown in Equation (12). The velocity and position update equations are provided in Equations (13) and (14).
where represents the PSO objective function; denotes the sub-objective for restorable land-use resilience; denotes the sub-objective for ecological costs; denotes the sub-objective for the compactness of the future pattern; are the corresponding weights.
where and denote the velocity and position of particle i at iteration , respectively; and denote the velocity and position of particle i at iteration t, respectively; denotes the inertia weight and is set to 0.7; and present individual learning factor as well as social learning factor, respectively, with = 1.8 and = 1.5; and are independent uniformly distributed random numbers in [0, 1]; and represent the local best and global best solutions, respectively. We set the PSO swarm size to Q = 40 and the maximum number of iterations to I = 1000. The transfer in scale is imposed as a hard constraint. The transfer in area is represented by a fixed number of pixels, K = 401,174.
3.3.5. Validation Analysis
We develop the cultivated land layout optimization plan using 2019 land use data, with the aim of informing spatial adjustment and remediation implementation during Guangdong Province’s cultivated land protection planning period (2021–2035). To assess the plan’s policy relevance and practical feasibility, we use 2019–2024 as an observation window and conduct validation using three indicators: the transfer-out incidence ratio, the restoration incidence ratio, and the net stable gain coefficient per unit area. These metrics quantify the observed propensity for transfer-out on the removal side, the observed propensity for restoration on the transfer-in side, and the resulting net increase in stability.
The incidence ratio is adapted from the risk ratio (relative risk) in statistics [115]. It answers how many times more likely an event is in the selected group than in the reference group. For the transfer-out side, we define a transfer out event as a parcel that was cultivated land in 2019 but became other agricultural land by 2024. The selected group consists of transfer out cultivated land identified by the optimization plan, and the reference group consists of retained cultivated land that was not selected for transfer out. The transfer out incidence ratio is computed as shown in Equation (15).
where denotes the transfer-out incidence ratio; is the share of selected transfer-out cultivated land that experienced a transfer-out event within the observation window; and is the corresponding share for unselected retained cultivated land.
For the transfer-in side, we define a restoration event as a parcel that was candidate restorable land in 2019 and became cultivated land by 2024. The selected group consists of parcels chosen for transfer-in by the optimization plan, and the reference group consists of candidate restorable land parcels that were not selected for transfer-in. The restoration incidence ratio is computed as shown in Equation (16).
where denotes the restoration incidence ratio; is the share of selected transfer-in parcels that experienced a restoration event within the observation window; and is the corresponding share for unselected candidate parcels.
We further define “stable cultivated land use” as persistence of cultivated land use within the observation window, measured as the share of area that was cultivated land in 2019 and remained cultivated land in 2024. For each 1 km2 of transfer-in and transfer-out adjustment, the transfer-out side contributes a gain in stability probability by proactively removing parcels with high transfer-out risk, while the transfer-in side contributes a gain in restoration probability by prioritizing parcels with stronger restoration potential. Together, these gains form the net stable gain coefficient per unit area. The corresponding specification is given in Equation (17).
where g denotes the net stable gain coefficient per unit area.
4. Results
4.1. Analysis of Cultivated Land Transfer-Out
The area, proportion, and spatial distribution of transfer-out cultivated land across Meizhou’s counties/districts are shown in Table 3 and Figure 4. Meizhou contains 1170.75 km2 of cultivated land in total, of which 160.47 km2 is identified as critical-resilience cultivated land and designated for transfer-out, accounting for 13.71% of the total. Transfer-out areas differ substantially among counties/districts: Wuhua transfers out 45.79 km2, whereas Meijiang transfers out only 2.82 km2. Spatially, transfer-out cultivated land occurs in all counties/districts but is mainly concentrated in the hilly regions of eastern Dapu, southern Wuhua and Fengshun, and northern Pingyuan. These parcels are predominantly located along the margins of reserved cultivated land and within scattered cultivated patches, while transfers from the cores of contiguous reserved cultivated land are limited.
Table 3.
Transfer-out cultivated land area and proportion by County/District in Meizhou.
Figure 4.
Spatial distribution of reserved cultivated land and transfer-out cultivated land.
Rigid-constraint cultivated land totals 95.61 km2, representing 59.58% of the overall transfer-out area. Within this category, cultivated land inside ecological red lines is dominant (70.52 km2, 73.75% of rigid-constraint cultivated land). The remaining shares are associated with slopes exceeding 25°, an urban attribute, and heavy-metal contamination, accounting for 16.72%, 10.23%, and 3.11%, respectively; the spatial overlap among these constraints totals 3.65 km2. Spatially, rigid-constraint cultivated land is relatively dispersed, occurring mainly in central and northern Xingning, peripheral areas of Wuhua, and northwestern and northeastern Dapu.
Meizhou’s cultivated land use resilience ranges from 44.17 to 88.40, with a mean of 71.85. Using the natural breaks method, resilience scores were classified into 15 levels (from high to low), and Levels 13–15 were defined as low-resilience cultivated land and designated for transfer-out. Low-resilience cultivated land totals 64.86 km2, accounting for 40.42% of the total transfer-out area. The mean cultivated land use resilience for this group is 59.16, markedly below the overall mean. The mean resistance and reconversion capacity are 66.79 and 47.71, respectively, indicating that limited reconversion capacity is the main driver of low cultivated land use resilience. Specifically, within the reconversion capacity dimension, mean feasibility is 57.18, whereas mean reversibility is only 38.24, suggesting weak fertility foundations and natural suitability for reversion from non-grain states back to cultivated land, and consequently low restoration efficiency. Spatially, low-resilience cultivated land exhibits a core–periphery pattern, with limited presence in Meijiang and adjacent core areas but clear concentrations in northern Pingyuan, southern Dapu, north-central Fengshun, and south-central Wuhua.
4.2. Analysis of Candidate Restorable Land
4.2.1. Analysis of Candidate Restorable Land Use Resilience
After excluding restorable land parcels with slopes exceeding 25°, those located within ecological red-line zones, those within urban-attribute areas, and those subject to heavy-metal contamination risk, a total of 431.98 km2 of restorable land was retained as transfer-in candidates. Indicator weights were derived using an XGBoost model with permutation variable importance (PVI), and a weighted-sum model was then applied to calculate restorable land use resilience for the candidate parcels. Restorable land use resilience ranges from 36.22 to 87.71, with a mean of 61.96. Using the natural breaks method, the results were classified into three levels: high resilience, moderate resilience, and low resilience. High-resilience restorable land shows resilience values of 66.91–87.71 (mean = 71.68), with mean reconversion capacity and resistance of 76.74 and 68.32, respectively, indicating favorable intrinsic conditions and external contexts for sustaining cultivated land use. However, this level covers only 114.51 km2, accounting for 26.51% of the candidate restorable land. Moderate-resilience restorable land covers 181.76 km2 (42.08%), with resilience values of 57.83–66.91 (mean = 62.25). Relative to the high-resilience group, both resistance and reconversion capacity are lower (means = 61.44 and 63.48, respectively) but remain above the acceptable baseline, thereby providing substantial transfer-in options. Low-resilience restorable land totals 135.70 km2 (31.41%), with resilience values of 36.22–57.82 (mean = 53.37); the mean resistance and reconversion capacity are 54.56 and 51.58, respectively. Spatially (Figure 5a), the three resilience levels exhibit a marked contrast along a northeast–southwest-oriented boundary. High- and moderate-resilience restorable land is mainly distributed west of this boundary, concentrated in Meijiang, Xingning, Meixian, Jiaoling, and Wuhua. In contrast, low-resilience restorable land is primarily located to the east, concentrated in Dapu and Fengshun, with additional clusters in Pingyuan in northwestern Meizhou.
Figure 5.
Spatial patterns, mean values, and area shares of land-use resilience and ecological importance: (a) spatial distribution of land-use resilience classes, mean resilience/resistance/reconversion capacity by class, and area share of each class; (b) spatial distribution of ecological-importance classes, mean composite ecological importance by class, and area share of each class.
4.2.2. Analysis of the Importance of Ecosystem Service Value in Candidate Restorable Land
The spatial distribution of the composite importance of ecosystem service value in restorable land is shown in Figure 5b. Overall, composite importance ranges from 8.24 to 81.98 (mean = 28.68), showing pronounced spatial heterogeneity. Following the classification scheme described above, composite importance was categorized into three levels: quite important, important, and relatively important. Restorable land classified as quite important covers 133.59 km2, accounting for 30.93% of the retained restorable land. Its importance values range from 39.76 to 81.98 (mean = 45.66), and thus this level corresponds to the highest ecological cost. The important level occupies the smallest share (15.69%), with importance values of 25.59–39.76 (mean = 33.99). The relatively important level spans 8.24–25.59; although its composite importance is comparatively low, it constitutes the largest proportion (53.38%) of the retained restorable land and corresponds to the lowest ecological cost. In terms of spatial pattern, the three levels display a clear south–north contrast. The quite important level is mainly distributed in northern and central Meizhou, concentrated in Dapu, Meixian, Jiaoling, Pingyuan, and eastern Xingning, with scattered patches in southern Fengshun and in northeastern and southwestern Wuhua. By contrast, the important and relatively important levels are more widespread across southern and central Meizhou, primarily concentrated in western and southern Meixian, northwestern and southern Xingning, as well as Fengshun and Wuhua.
4.3. Sensitivity Analysis of Sub-Objective Weight Combinations
Within the linearly weighted PSO framework, sub-objective weights represent decision preferences and shape the trade-offs among objectives, thereby affecting both the optimal solution and its spatial configuration. Accordingly, a multi-scenario sensitivity analysis was conducted to evaluate the robustness of the optimization results to the specified weights. With PSO parameters and constraint conditions held constant, three preference types with seven weight combinations were designed, including an ecological preference (S1), a compactness preference (S2), and resilience-led multi-objective coordination (S3–S7). PSO was then run under each scenario to derive the optimal objective utility (Table 4) and the corresponding spatial configuration of transfer-in pixels (Figure 6).
Table 4.
Sub-objective utility values and marginal changes across weight combinations.
Figure 6.
Spatial patterns of Transfer-In pixels and sub-objective utility values under alternative sub-objective weight combinations. Panels (a–g) show the spatial distribution of Transfer-In pixels for each weighting scenario, including (a) ecological preference S1 (0.1, 0.8, 0.1), (b) compactness preference S2 (0.1, 0.1, 0.8), and (c–g) resilience-led preferences S3–S7 with weights (0.4, 0.3, 0.3), (0.5, 0.25, 0.25), (0.6, 0.2, 0.2), (0.7, 0.15, 0.15), and (0.8, 0.1, 0.1), respectively. Panel (h) reports the sub-objective values for all weight combinations.
The results show that S1 substantially increases ecological utility but weakens resilience performance; moreover, its transfer-in pattern becomes more fragmented (Figure 6a), which is unfavorable for forming a contiguous, compact, and stable layout. S2 places excessive emphasis on compactness and likewise compresses the scope for joint improvement in resilience and ecological outcomes (Figure 6b). By contrast, Table 4 indicates that under the resilience-led multi-objective coordination preference (S3–S7), as the resilience weight increases from 0.4 to 0.8, resilience utility rises monotonically while ecological utility declines monotonically, whereas compactness exhibits only minor fluctuations. Meanwhile, the overall spatial patterns differ little across scenarios (Figure 6c–g), suggesting that weight perturbations mainly affect the selection of marginal candidate units rather than reshaping the global spatial structure.
Given that S3 is closest to a relatively balanced three-objective setting and exhibits a weaker resilience dominance, we adopt S3 as the baseline and evaluate S3–S7 using marginal changes. The results indicate diminishing marginal gains in resilience as the weight increases (Δ decreases from +0.0082 to +0.0032), alongside a progressively larger marginal ecological loss (Δ widens from −0.0051 to −0.0072). The ratio of resilience gain to ecological loss reaches its maximum at = 0.5 (1.60), and compactness does not decline at this point (Δ = +0.0001), only turning into a sustained loss thereafter. Accordingly, (0.50, 0.25, 0.25) is selected as an efficient setting for “resilience-led multi-objective coordination”. It yields comparatively larger resilience gains while leaving the overall spatial structure largely unchanged. Moreover, it avoids a low-efficiency range in which further resilience improvements come at a disproportionate ecological cost. This weight set is therefore used as the primary scheme in this study to support robustness.
4.4. Resilience-Led, Multi-Objective Synergistic Analysis of Transfer-In Outcomes
Figure 7 shows the spatial pattern of the final restorable-land transfer-in results, together with a county-level comparison between the total restorable-land area and the transfer-in area in Meizhou. Under the transfer-in–transfer-out area-balance constraint and the principle of resilience-led multi-objective synergy, the PSO algorithm selected 401,174 restorable-land raster cells, corresponding to a cumulative transfer-in area of 160.47 km2 (27.36% of the total restorable-land area). At the county scale, Meixian contains the largest restorable-land area and also receives the largest transfer-in area (64.66 km2; 40.29% of the total transfer-in area), followed by Xingning (33.05 km2; 20.60%). By contrast, Meijiang and Pingyuan have the smallest transfer-in areas—8.98 km2 (5.60%) and 2.92 km2 (1.82%), respectively. In terms of spatial pattern, the transfer-in parcels are relatively clustered at the macro scale, forming a belt that extends roughly from the northeast part of the study area toward the southwest. They are mainly concentrated in Meixian, Jiaoling, Fengshun, and Xingning, with only small patches in northeastern Wuhua, western Pingyuan and central Dapu. At the micro scale, transfer-in parcels are highly adjacent to reserved cultivated land and exhibit two dominant aggregation morphologies: strip-like clusters (Figure 7A,B) and near-circular clusters (Figure 7C,D). For example, in Jiaoling, Meixian and Meijiang, transfer-in parcels tend to form north–south or northwest–southeast strip-like clusters aligned with existing cultivated land, whereas in southern Xingning they form near-circular clusters contiguous with reserved cultivated land.
Figure 7.
Spatial distribution of transfer-in results and county-level comparison of restorable-land area versus transfer-in area: (A,B) representative strip-like patch clusters; (C,D) representative near-circular patch clusters.
4.5. Optimization Effects of CLSLO
After the cultivated land use-resilience assessment and layout optimization, the final cultivated land pattern improved in both suitability and stability, as evidenced in several aspects.
First, overall cultivated land use resilience is higher in Figure 8a, with the mean increasing, the lower end rising, and the distribution shifting toward higher classes. Compared with the original layout, the mean resilience score increased by 1.72% relative to the original mean, indicating an overall upward shift. The minimum value rose from 44.17 to 50.86, which represents a 15.16% increase relative to the original minimum and shows that the low-resilience tail was markedly lifted. The class results further confirm this structural improvement. Using the original layout as the baseline, the share of cultivated land with resilience scores below 60 declined from 3.98% to 0.17% and the area decreased by 44.54 km2. In contrast, the share with scores above 70 increased from 60.29% to 66.96%, with a net gain of 78.09 km2 and a relative increase of 11.06%. Overall, the optimization mainly works by removing low-resilience areas and concentrating medium- to high-resilience areas, thereby improving the distribution of cultivated land use resilience.
Figure 8.
Comparison of cultivated land pattern indicators before and after optimization: (a) area proportion by cultivated land-use resilience class; (b) area proportion by resistance class; (c) area proportion by reconversion capacity class; (d) area proportion by slope class; (e) area proportion by contiguous area class; (f) area proportion by distance-to-settlements class; (g) area proportion by neighborhood construction land intensity class; (h) area proportion by arability foundation index class; (i) area proportion by fiscal capacity class; (j) area proportion by machinery accessibility.
Second, resistance also improved after optimization (Figure 8b). The minimum resistance score increased from 50.36 to 54.58, which is an 8.38% increase relative to the original minimum. The share of cultivated land with resistance scores below 60 declined from 0.43% to 0.02%, while the share between 70 and 80 rose from 78.06% to 84.03%, with a net area gain of 69.78 km2. To trace the sources of this improvement, four indicators were examined, including slope (Figure 8d) and contiguous area (Figure 8e) as measures of intrinsic resistance, and distance to settlements (Figure 8f) and neighborhood construction land intensity (Figure 8g) share as measures of external exposure. After optimization, cultivated land no longer occurs on slopes steeper than 25 degrees, and the share on gentle slopes between 0 and 6 degrees increased by 5.33% relative to the pre-optimization pattern, providing more favorable internal conditions for resisting non grain conversion pressures. Spatial contiguity also strengthened, with the mean contiguous area increasing from 0.034 km2 to 0.044 km2, a 29.4% rise relative to the original mean, and the largest patch expanding from 0.74 km2 to 0.96 km2. External exposure was reduced as well, with the mean distance to settlements decreasing from 49.40 to 30.40, which is a 38.46% reduction relative to the original mean, accompanied by a net increase of 51.60 km2 within 100 m of settlements and a net decrease of 11.16 km2 beyond 600 m, indicating an overall shift toward locations closer to settlements. In addition, the maximum neighborhood construction land intensity fell by 4%, suggesting lower external sensitivity.
Finally, reconversion capacity improved most markedly after optimization (Figure 8c). The mean reconversion capacity increased from 68.65 to 70.77, which represents a 3.09% increase relative to the original mean. The share of cultivated land with reconversion capacity scores below 60 decreased by 22.05%, corresponding to a net reduction of 72.78 km2, whereas the share with scores above 70 increased by 11.35%, with a net gain of 64.80 km2. To further explain the mechanisms behind these changes, three indicators were examined, including the arability foundation index (Figure 8h), fiscal capacity (Figure 8i), and machinery accessibility (Figure 8j). The arability foundation index captures reversibility by reflecting the natural conditions that support converting candidate restorable land back to cultivated land. After optimization, the minimum value of this index increased by 12.50% relative to the original minimum. The share of cultivated land with scores below 60 declined to 1.49%, while the share above 80 rose from 26.49% to 29.72%, a relative increase of 12.19%, indicating that a larger proportion of cultivated land is supported by favorable natural foundations for reconversion. Fiscal capacity represents the ability to mobilize the resources required for restoration. After optimization, its mean increased from 751.20 to 808.94, a 7.69% rise relative to the original mean, and the share of cultivated land above 0.1 billion CNY per km2 increased from 11.62% to 14.50%, a relative increase of 24.74%. Machinery accessibility reflects the feasibility of engineering implementation. After optimization, its mean decreased from 116.03 to 82.44, which is a 28.95% reduction relative to the original mean. The share of cultivated land within 0.1 km increased by 6.39%, with a net gain of 53.31 km2, indicating that cultivated land becomes closer to roads and that transport accessibility and implementation conditions improve.
4.6. Validation Analysis of the Optimization Results
Overlay-based validation over the 2019–2024 observation window indicates that the optimization scheme aligns with observed land-use trajectories at both the transfer-out and transfer-in ends. On the transfer-out side, 2.94 km2 of the selected transfer-out cropland has already transitioned to other agricultural land in reality, corresponding to an observed conversion-out rate of 1.83%, which is higher than that of reserved (non-selected) cultivated land (0.95%) (Table 5). The associated occurrence-rate ratio is 1.93 (Table 5), meaning that, within the same observation period, the probability of an actual conversion-out event is 1.93 times higher for selected transfer-out units than for reserved cultivated land. This suggests that the scheme successfully identifies cultivated land with a higher real-world risk of conversion-out.
Table 5.
Validation results for the transfer-out side during the observation period.
On the transfer-in side, 9.69 km2 of the selected transfer-in candidate restorable land has already been restored and reclassified as cultivated land in reality, yielding an observed restoration rate of 6.04%, markedly higher than that of candidate units not selected for transfer-in (1.17%) (Table 6). The corresponding occurrence-rate ratio is 5.16 (Table 6), indicating that selected transfer-in units are 5.16 times more likely to undergo an actual restoration event during the observation window than non-selected candidates, and thus exhibit a stronger tendency toward cultivated land reconversion.
Table 6.
Validation results for the transfer-in side during the observation period.
Building on these results, the net stability gain coefficient is 0.0575 per km2 of transfer-in–transfer-out implementation during the observation period. At an implementation scale of 160.47 km2, the scheme is expected to yield a net increase of 9.23 km2 in stable cultivated land area. Overall, this validation indicates that the optimization scheme delivers improvements not only in indicator performance but also in observed land-use evolution, effectively targeting cultivated land that is more prone to conversion-out and candidate areas that are more likely to reconvert to cultivated land. These findings provide empirical support for the scheme’s feasibility and policy relevance.
5. Discussion
5.1. Advantages of Cultivated Land Layout Optimization Incorporating a Resilience Perspective
In response to non-grain conversion of the agricultural production structure under agricultural restructuring, this study develops a cultivated land use resilience led spatial optimization framework. Cultivated land use resilience is represented by resistance and reconversion capacity and embedded in an inflow and outflow strategy to identify outflow cultivated land and construct a resilience led, synergistic multi-objective optimization model for planning-scale cultivated land protection and remediation. A key step is to delineate the boundary between suitability and stable use. Much of the cultivated land layout optimization literature prioritizes suitability, commonly defined as cultivation capability under conventional production conditions and the match between parcels and their natural and production settings [116,117]. In this framework, such suitability is primarily captured by Intrinsic disturbance tolerance, reflecting a parcel’s inherent capacity to remain in cultivated land use given its biophysical constraints. Under non-grain conversion disturbance, however, use stability is not governed by intrinsic capacity alone, but also by external exposure to non-grain pressures and the ability to reconvert after transfer out. Introducing resilience theory makes these risk-relevant mechanisms explicit, shifting attention from where cultivation is suitable to where cultivated land use is more likely to remain stable under non-grain pressure and to reconvert and persist after disturbance, rather than allowing stability to be obscured within an aggregated suitability score. More importantly, instead of optimizing first and assessing resilience ex post [21], resilience is incorporated directly into the decision process, so that spatial optimization is jointly constrained by suitability and stability.
The observed increase in minimum resilience should not be interpreted as a physical retrofitting of the weakest parcels. Instead, it reflects a reduction in tail risk within the cultivated land network under the coupled inflow and outflow logic, including the preventive withdrawal of high-risk units. By excluding parcels most vulnerable to non-grain conversion and least likely to be maintained over the long term, while prioritizing inflow candidates with higher reversibility and feasibility, the low-end tail of the resilience distribution is lifted. In risk terms, this uplift compresses risk exposure among extremely fragile units, reduces the likelihood of clustered transfer out under non-grain pressure, and lowers systemic instability driven by a weakest-link effect. It also helps steer limited protection and remediation resources toward spatial units that are more maintainable and more capable of reconversion after disturbance, thereby improving the marginal efficiency of governance inputs. Using raster pixels as the analytical unit does not imply pixel-level relocation in implementation. Rather, it enables multi-source resilience and constraint information to be integrated on a standardized spatial unit, captures continuous spatial heterogeneity, and outputs a planning-ready configuration of inflow and outflow zones that provides directional guidance for decision-making. For on-the-ground delivery, inflow zones should be aggregated to project or parcel units and re-verified against parcel geometry [118], property rights [119], and stakeholder preferences [120]. Given the substantial costs associated with land-use adjustment, the optimized results should be interpreted as a planning-oriented basis for screening and zoning. They are intended to identify more implementable inflow and outflow areas by jointly considering exposure, reversibility, and feasibility constraints, thereby reducing iterative revisions and the risk of resource losses during on-the-ground delivery. Physical feasibility is further strengthened through ex ante screening of the candidate set, excluding evidently non-implementable conditions such as steep slopes and relevant regulatory constraints, thereby narrowing the solution space to implementable options. Validation using the observation window shows that selected inflow candidates exhibit higher realized restoration incidence than unselected candidates, indicating that the scheme captures empirically meaningful restoration signals and can inform cultivated land layout optimization decisions.
5.2. Policy Implications
Spatial mismatch in the distribution of cultivated land weakens use stability, increases protection costs, and poses risks to food security. Based on the findings, the following policy implications are proposed.
- (1)
- Sustain the transfer-in–transfer-out logic in future cultivated land layout optimization
Given limited resources and regulatory capacity, it is difficult to apply equally intensive construction, supervision, and subsidy support across all cultivated land. The transfer-in–transfer-out approach therefore recommends concentrating policy resources, engineering investment, and institutional protection in transfer-in zones, while treating transfer-out zones as areas with greater land-use flexibility where differentiated regulation and structural adjustment are more appropriate, thereby improving overall input–output efficiency. This emphasis on targeted protection and differentiated measures is grounded in food-security objectives that require a stable cultivated land base. When cultivated land uses shift frequently, production organization and governance inputs often need repeated adjustment, limiting the effectiveness of existing consolidation and infrastructure and increasing subsequent management burdens and resource consumption. In this sense, “stability” does not imply freezing land use everywhere. Rather, it prioritizes stable cultivation in areas with stronger supporting conditions to consolidate the foundation of grain supply, while identifying marginal areas or zones under stronger non-grain pressure as transfer-out zones where more flexible restructuring can be accommodated, thereby enabling spatial coordination between the food-security baseline and local socioeconomic benefits. This approach has been widely adopted in cultivated land layout optimization and is regarded as conducive to optimizing spatial patterns while safeguarding food security [28,121,122]. In addition, the transfer-in–transfer-out area balance facilitates alignment with permanent basic farmland planning, territorial spatial planning, and land-use regulation, and has been applied in practices such as contiguous consolidation of cultivated land [123] and cultivated land–forestland replacement [124], indicating strong operational feasibility.
- (2)
- Sustaining long-term balance under the cultivated land balance policy (CLBP) hinges on whether supplementary land can be stably maintained in cultivated land use for farming
The 2024 reform of the CLBP brings all cultivated land occupation into unified management and prioritizes restoring high-quality cultivated land, with newly reclaimed cultivated land as a complement [125]. As reserve resources tighten [126], restorable land is becoming a key source of supplementation. However, the literature consistently documents that supplementary cultivated land is often of low quality, poorly serviced, and unstable in subsequent use [127,128,129,130], reinforcing the shift from “quantity balance” toward coordinated quantity-quality-ecology and closer attention to policy cost-effectiveness [61]. Accordingly, supplementary site selection should be constrained by both suitability and long-term stability. Priority should be given to parcels with sound natural conditions, low external exposure, and a higher likelihood of maintaining cultivated land use under disturbance. Where exposure is higher but suitability remains acceptable, conversion risk should be reduced through differentiated land-use regulation, benefit compensation, and consolidation-based improvement before inclusion as supplementary sources. Only by moving from “supplementing enough” to “supplementing stably” can the CLBP support stable production and supply rather than an area-accounting balance.
- (3)
- Advance restorable land transfer-in through multi-objective synergy
Restorable land types such as orchards, woodland, and grassland constitute important spatial sources for future cultivated land supplementation, while also providing income opportunities, ecological conservation, and landscape recreation. The literature consistently indicates widespread trade-offs and synergies across these functions, and warns that single-objective decision making can readily trigger functional imbalance [131,132]. Accordingly, restorable land transfer-in should not be judged solely by reclaimability or compensation sufficiency. Instead, it should simultaneously incorporate cultivated land use resilience, ecological constraints, and compactness requirements, supported by stronger coordination among territorial spatial planning, ecological protection red lines, and rural industrial development planning. These multi-objective trade-offs should be front-loaded into parcel screening and scheme justification to support high-quality cultivated land expansion and long-term sustainable use.
- (4)
- Regions worldwide facing unstable cultivated land use may adopt locally tailored conservation and optimization strategies guided by cultivated land use resilience
Although this study is grounded in China’s hilly and mountainous areas, its core implication is transferable. Stable cultivated land use can be treated as a spatial governance issue jointly constrained by resistance and reconversion capacity. European Union and European research suggest that abandonment risk often reflects limited farm economic viability, regional development disadvantages, and the institutional context, implying a need for targeted regional support and structural adaptation rather than uniform investment [133,134]. Evidence from Japan likewise shows that land transfer and consolidation that concentrate cultivated land in core operating entities can reduce instability associated with labor aging and marginal land withdrawal [135,136]. The land sparing and land sharing framework further emphasizes strategic spatial organization to enable interpretable trade-offs between production and ecological objectives [137,138]. These insights are consistent with the governance logic advanced here, including transfer-in and transfer-out micro-optimization, concentrated allocation of limited resources, and multi-objective coordination. Accordingly, regions facing marginalization, abandonment, or land-use conversion pressure can use cultivated land resilience assessment to delineate zones for priority protection of core cultivated land and flexible governance of high-risk marginal cultivated land. Long-term subsidies, stewardship, and infrastructure investment should be linked to spatial risk differences to avoid equalized allocation and improve cost-effectiveness. Limited governance capacity should be focused on core cultivated land with high resistance and reconversion potential to sustain the continuity of agricultural land.
5.3. Limitations and Outlook
Under disturbance from the non-grain conversion of the agricultural production structure, this study develops an assessment of cultivated land use resilience and a spatial optimization framework based on inflow and outflow adjustment. It provides interpretable spatial decision support for cultivated land conservation and land consolidation at the planning scale and helps address a methodological gap. The analysis relies on a single baseline year in 2019, combining the observed land use configuration, socioeconomic and locational variables, and assumptions about the prevailing policy setting. It estimates transfer out risk and reconversion potential under those conditions and derives a static optimized configuration. The approach is informative for spatial screening, yet it does not represent the temporal evolution of non-grain conversion pressure and profit driven incentives that can reshape risk and reconversion capacity. Future changes in climate conditions or market signals may also redistribute external exposure and reconversion feasibility, weakening the stability of the optimized pattern and its applicability across periods. In addition, the framework focuses on parcel attributes and socioeconomic drivers and excludes flood and drought scenarios as well as alternative climate change pathways. This limits the ability to assess potential drift in the spatial pattern of cultivated land use resilience under different climate and development futures. The results should therefore be interpreted as a context bound preferred option for planning decisions under a specific disturbance setting and constraint set, rather than a universal forecast under all external shocks.
Future work can overcome these limitations by adopting dynamic designs. Yield or revenue time series and actor behavior data [139], together with multi period land use and land cover data and multi date remote sensing, can be used to trace long run trajectories of key variables such as built up expansion, cultivation intensity, and accessibility improvements [140,141,142]. This would allow resistance and reconversion capacity to be updated through time. Scenario analysis [143] or system dynamics simulations [144] can then be integrated with the current machine learning framework to project cultivated land use resilience under alternative climate and development pathways, generate time varying preferred configurations, and better evaluate stability effects and risk reduction performance in changing environments.
6. Conclusions
This study seeks to enhance cultivated land use resilience and strengthen the potential for stable cultivated land use. Using 2019 data, we assessed cultivated land use resilience for cultivated land and candidate restoration land classes within an outflow and inflow framework, identified critical cultivated land for outflow and candidate restoration land classes for inflow, and derived an optimized configuration under planning period constraints using particle swarm optimization. The configuration was then validated using an observation window from 2019 to 2024. The main findings are as follows.
- (1)
- The outflow of critical resilience cultivated land is substantial and concentrates along hilly fringes. In Meizhou, 160.47 km2 of cultivated land was designated for outflow, accounting for 13.71 percent of the total, with pronounced county level heterogeneity. Spatially, outflow parcels cluster near the margins of reserved cultivated land and within fragmented patches. The outflow structure is dominated by rigid constraints, with cultivated land within the ecological conservation redline accounting for the largest share, while low resilience deficits further shape site selection. The mean cultivated land use resilience is 71.85, and low resilience outflow parcels are primarily limited by insufficient reconversion capacity, exhibiting a core to fringe pattern.
- (2)
- Candidate restoration land classes provide an ample pool for inflow, yet their quality is highly differentiated. They total 431.98 km2, with a mean cultivated land use resilience of 61.96, and medium resilience constitutes 42.08 percent, indicating substantial selection flexibility. Resilience is higher in the west and lower in the east, and a stable regional gradient is observed between resilience and ecological cost. Integrated ecosystem service importance ranges from 8.24 to 81.98 with a clear south to north contrast, and the comparatively important class associated with lower ecological cost accounts for 53.38 percent. Together, these patterns indicate that inflow prioritization is constrained jointly by resilience and regionally heterogeneous ecological cost.
- (3)
- Under area balance requirements and resilience-oriented constraints with coordinated ecological and morphological objectives, the PSO inflow solution forms a clustered, corridor-like pattern with clear county level differences. Using the weight set of 0.50, 0.25, and 0.25, inflow concentrates in Meixian and Xingning. The optimized pattern extends along a northeast to southwest axis, remains highly adjacent to reserved cultivated land, and strengthens contiguity and compactness through block and strip shaped aggregation.
- (4)
- The optimized configuration improves resilience distribution and is corroborated by observed land use evolution, supporting the validity of identifying parcels that are more prone to transfer out and more likely to be restored. The mean and minimum cultivated land use resilience rise by 1.72% and 15.16%, respectively, shifting the distribution upward and lifting the low resilience tail. Validation yields a transfer out incidence ratio of 1.93 for outflow parcels and a restoration incidence ratio of 5.16 for inflow parcels. At an adjustment scale of 160.47 km2, the expected net gain in stable cultivated land area is 9.23 km2, providing direct evidence of feasibility and policy relevance.
Author Contributions
Z.Q.: Writing—review & editing, Writing—original draft, Software, Methodology, Conceptualization. L.Z.: Writing—review & editing, Writing—original draft, Software, Data curation, Conceptualization. G.L.: Writing—review & editing, Writing—original draft, Supervision, Funding acquisition, Conceptualization. H.W.: Writing—review & editing. G.C.: Writing—review & editing. D.L.: Writing—review & editing. All authors have read and agreed to the published version of the manuscript.
Funding
This work was supported by the National Social Science Fund of China (No. 23CGL064) and the Science and Technology Project of the Department of Natural Resources of Guangdong Province (No. GDZRZYKJ2025008).
Data Availability Statement
The data obtained by the author from the natural resources department is not allowed to be shared, but other data can be requested from the corresponding author.
Conflicts of Interest
The authors declare that they have no known competing financial interests or personal relationships that could have appeared to influence the work reported in this paper.
References
- Griggs, D.; Stafford-Smith, M.; Gaffney, O.; Rockström, J.; Öhman, M.C.; Shyamsundar, P.; Steffen, W.; Glaser, G.; Kanie, N.; Noble, I. Sustainable Development Goals for People and Planet. Nature 2013, 495, 305–307. [Google Scholar] [CrossRef] [Scilit] [PubMed]
- FAO; IFAD; UNICEF; WFP; WHO. The State of Food Security and Nutrition in the World 2025; FAO: Rome, Italy, 2025. [Google Scholar]
- Zhou, J.; Fu, M. Degree of Non-Grain Production of Cultivated Land and Its Impact on Grain Production in China: Analysis of 2481 County-Level Units. Land Use Policy 2025, 155, 107586. [Google Scholar] [CrossRef] [Scilit]
- Long, W.; Meng, T.; Tian, X.; Fan, S. China’s Food Security and Food System Governance: Recent Developments and Global Implications. Food Policy 2025, 137, 103000. [Google Scholar] [CrossRef] [Scilit]
- Zhou, Y.; Li, X.; Liu, Y. Cultivated Land Protection and Rational Use in China. Land Use Policy 2021, 106, 105454. [Google Scholar] [CrossRef] [Scilit]
- Niu, W.; Wang, H.; Luo, L.; Shi, Y.; Sui, Y.; Wu, L.; Zhang, B.; Yu, Q. Spatiotemporal Impact of Cultivated Land Use Transition on Grain Production: Perspective of Interaction between Dominant and Recessive Transitions. Environ. Impact Assess. Rev. 2026, 117, 108170. [Google Scholar] [CrossRef] [Scilit]
- Xie, Y.; Spawn-Lee, S.A.; Radeloff, V.C.; Yin, H.; Robertson, G.P.; Lark, T.J. Cropland Abandonment between 1986 and 2018 across the United States: Spatiotemporal Patterns and Current Land Uses. Environ. Res. Lett. 2024, 19, 044009. [Google Scholar] [CrossRef] [Scilit]
- Mejlumyan, D.; Maru, T.; Kusadokoro, M.; Urutyan, V.; Yeghiazaryan, G.; Kawabata, Y. Understanding Farmers’ Intentions to Abandon Farmland in Mountainous Regions of Armenia. J. Environ. Manag. 2025, 391, 126573. [Google Scholar] [CrossRef] [Scilit]
- Araza, A.B.; Gagarin, W.; Corales, M.C.; Osorio, C.P.; Mendoza, M.D.; Ancog, R. Land-Use Conversion from Agricultural Production Areas to Built-up Areas in the Philippines for Decades 2000–2020: Spatial Analysis and Policy Implications. Land Use Policy 2026, 162, 107874. [Google Scholar] [CrossRef] [Scilit]
- Subedi, Y.R.; Kristiansen, P.; Cacho, O. Drivers and Consequences of Agricultural Land Abandonment and Its Reutilisation Pathways: A Systematic Review. Environ. Dev. 2022, 42, 100681. [Google Scholar] [CrossRef] [Scilit]
- Harahap, T.; Mardiana, S.; Harahap, G. Analysis of Factors Influencing the Conversion of Paddy Fields (Oryza Sativa) to Oil Palm (Elaeis Guineensis Jacq) in Padang Lawas Regency. J. Agri Socio Econ. Bus. 2025, 7, 181–192. [Google Scholar] [CrossRef] [Scilit]
- Su, G.; Okahashi, H.; Chen, L. Spatial Pattern of Farmland Abandonment in Japan: Identification and Determinants. Sustainability 2018, 10, 3676. [Google Scholar] [CrossRef] [Scilit]
- Kwon, C.; Park, J.; Jang, S.; Shin, H.; Song, I. Analysis of Land Cover Change from Paddy to Upland for the Reservoir Irrigation Districts. J. Korean Soc. Agric. Eng. 2021, 63, 27–37. [Google Scholar] [CrossRef]
- Han, J.; Xu, X.; Tan, M. China’s Urban Vertical Growth Substantially Influences Global Food Security. Commun. Earth Environ. 2025, 6, 1056. [Google Scholar] [CrossRef] [Scilit]
- Wu, Y.; Shan, L.; Guo, Z.; Peng, Y. Cultivated Land Protection Policies in China Facing 2030: Dynamic Balance System versus Basic Farmland Zoning. Habitat Int. 2017, 69, 126–138. [Google Scholar] [CrossRef] [Scilit]
- Liu, J.; Wang, Y.; Jiang, H.; Xu, P.; Zhao, J. Identifying the key regions of potential arable land restoration from the perspective of in-out balance. Trans. Chin. Soc. Agric. Eng. 2023, 39, 216–225. [Google Scholar]
- Zhao, L.; Chen, L.; Xiao, Y.; Cheng, Y.; Nie, J.; Wang, H.; Liu, G. Optimization of the spatial layout of farmland from the perspective of multi-scale administrative balance. Trans. Chin. Soc. Agric. Eng. 2024, 40, 319–329. [Google Scholar]
- Chen, M.; Yan, Z. A New Policy of Balancing the Occupation and Replenishment of Arable Land: Internal Logic and Implementation Pathways. J. Jishou Univ. (Soc. Sci.) 2025, 46, 9–16. [Google Scholar] [CrossRef]
- Han, S.; Guo, G.; Shi, Y.; Cui, J. Optimization of the spatial layout of arable land protection using “Three Lines” delineation of territorial spatial planning and spatial autocorrelation attributes of arable land quality. Trans. Chin. Soc. Agric. Eng. 2022, 38, 237–248. [Google Scholar]
- Liu, Y.; Zhang, F.; Wang, X.; Tan, M.; Li, X. Farmland Abandonment in Pakistan: Patterns, Influencing Factors and Cascading Effects on Food Production. J. Clean. Prod. 2025, 535, 147127. [Google Scholar] [CrossRef] [Scilit]
- Chen, H.; Xiao, W.; Tan, Y.; Meng, F.; Xiong, W. An Examination of the Layout Optimization of Forest and Farmland and Its Impact on System Resilience: Evidence from Yongkang City, Zhejiang Province. China Land Sci. 2024, 38, 124–134. [Google Scholar]
- Xinhua Net Main Data Results of the Third National Land Survey Released. Xinhuanet. Available online: https://www.news.cn/fortune/2021-08/26/c_1127797196.htm (accessed on 26 December 2025).
- Gong, Y.; Li, F.; Wang, L.; Jiang, P.; Huang, Q.; Li, M. Studies on Spatial Optimization Allocation of Cultivated Land—Taking Xinbei District, Changzhou City as the Example. Res. Soil. Water Conserv. 2016, 23, 199–205. [Google Scholar] [CrossRef]
- Weng, R.; Jin, X.; Zhang, X.; Han, B.; Gu, Z.; Zhou, Y. Delimitating permanent prime farmland reserve areas on the perspective of suitability-cluster-stability. Trans. Chin. Soc. Agric. Eng. 2022, 38, 269–278. [Google Scholar]
- Liang, K.; Jin, X.; Wang, S.; Ying, S.; Qi, Z.; Zhou, Y. Control of Balancing Cultivated Land Conversion by Integrating “Homogeneous Equivalence” and “Loss-Supplement Balance”: Methodology and Empirical Study. China Land Sci. 2023, 37, 77–88. [Google Scholar]
- Zhang, Y.; Lin, J.; Huang, Y.; Yuan, H.; Feng, G.; Zhang, P. Spatial analysis and coordinated layout optimization of farmland-orchard mismatch using spatial decision modeling. Trans. Chin. Soc. Agric. Eng. 2024, 40, 330–338. [Google Scholar]
- Luo, Q.; Zhang, W.; Shao, J.; Guo, Y. Optimization of permanent basic farmland delineation at county scale in Wuling Mountain area. Chin. J. Agric. Resour. Reg. Plan. 2021, 42, 48–57. [Google Scholar]
- Song, Y.; Lu, Y.; Liu, T.; Li, H.; Yue, Z.; Liu, H.; Gao, T. Variation of Vegetation Fractional Coverage and Its Relationship with Climate in a Desert Steppe: Optimization of Farmland Layout in a Farming–Pastoral Ecotone Using the Ecological Suitability Index. Ecol. Eng. 2020, 150, 105834. [Google Scholar] [CrossRef] [Scilit]
- Sun, Q.; Wu, M.; Du, P.; Qi, W.; Yu, X. Spatial Layout Optimization and Simulation of Cultivated Land Based on the Life Community Theory in a Mountainous and Hilly Area of China. Sustainability 2022, 14, 3821. [Google Scholar] [CrossRef] [Scilit]
- Wang, Y.; Liu, Q.; Ou, M. Optimization of prime farmland layout on basis of geological environment suitability. Trans. Chin. Soc. Agric. Eng. 2019, 35, 252–260. [Google Scholar]
- Ke, X.; Ma, C. Interregional Farmland Layout Optimization on the Constraint of Natural Resources and Social-Economical Condition—A Case Study of Wuhan City Circle. Econ. Geogr. 2013, 33, 136–141, 148. [Google Scholar] [CrossRef]
- Wang, Y.; Li, Y.; Shao, J.; Li, Y.; Yang, H. Optimizing theory and case studies of cultivated slope land in the center of three gorges reservoir area based on patch-scale land evaluation. Acta Ecol. Sin. 2014, 34, 3245–3256. [Google Scholar] [CrossRef] [Scilit]
- Zhao, Y.; Luo, Z.; Cao, L.; Zhong, S.; Zhao, J. Layout optimization of regional urban development and agricultural production based on spatial decision-making: A case study of Linchuan district in Jiangxi province. J. Nat. Resour. 2019, 34, 526–538. [Google Scholar] [CrossRef] [Scilit]
- Chen, L.; Zhao, H.; Song, G.; Liu, Y. Optimization of Cultivated Land Pattern for Achieving Cultivated Land System Security: A Case Study in Heilongjiang Province, China. Land Use Policy 2021, 108, 105589. [Google Scholar] [CrossRef] [Scilit]
- Li, C.; Wang, X.; Ji, Z.; Li, L.; Guan, X. Optimizing the Use of Cultivated Land in China’s Main Grain-Producing Areas from the Dual Perspective of Ecological Security and Leading-Function Zoning. Int. J. Environ. Res. Public Health 2022, 19, 13630. [Google Scholar] [CrossRef] [Scilit]
- Guan, X.; Zhang, F.; Guo, L.; Zhao, T. A Suitability Evaluation of Cultivated Land in Beijing for Multi-Purposes Use and Its Spatio-Temporal Investigation. Resour. Sci. 2010, 32, 580–587. [Google Scholar]
- Guo, G.; Han, X. Spatial layout optimization of basic farmland considering food security and cultivated land quality at county scale. Trans. Chin. Soc. Agric. Eng. 2021, 37, 252–260. [Google Scholar]
- Liang, X.; Wang, L.; Li, C.; Cai, Y.; Ren, S.; Ke, C. Research on the rapid optimization of the layout of permanent basic farmland based on quantity, quality, and ecology. J. Agric. Resour. Environ. 2021, 38, 946–956. [Google Scholar] [CrossRef]
- Dang, Y.; Li, C.; Xie, Z.; Kong, X.; Zhang, F. Research on the Reasons for Farmland Uphill Abandoned and the Path for Space Optimization under the System of Requisition⁃compensation Balance: A Case Study of Wannian County in Jiangxi Province, China. Resour. Environ. Yangtze Basin 2022, 31, 2756–2767. [Google Scholar]
- Chen, F.; Jiang, F.; Sun, J.; Guo, W.; Ma, J.; Zhu, X. Logic and Innovative Practice of Cultivated Land Protection Transformation in the Context of Large-scale Balancing Cultivated Land Occupation and Reclamation Reform. China Land Sci. 2024, 38, 12–24. [Google Scholar]
- Liang, K.; Jin, X.; Wang, S.; Liang, X.; Han, B.; Zhou, Y. Multi-Scenario Comparisons to Identify the Spatial Distribution, Land Type, and Effectiveness of Cultivated Land Restoration in the Main Grain-Producing Area. Habitat Int. 2024, 154, 103211. [Google Scholar] [CrossRef] [Scilit]
- Guo, D.; Luo, S.; Luo, Z.; Tong, J. Optimizing the layout in farmland orchard mismatch areas in Southeast Jiangxi using identification-screening-replacement logics. Trans. Chin. Soc. Agric. Eng. 2025, 41, 283–293. [Google Scholar]
- Ke, X.; Deng, X.; Liu, C. Interregional Farmland Layout Optimization Model Based on the Partition Asynchronous Cellular Automata: A Case Study of the Wuhan City Circle. Prog. Geogr. 2010, 29, 1442–1450. [Google Scholar]
- Ye, Y.; Sun, K.; Kuang, L.; Zhao, X.; Guo, X. Spatial layout optimization of urban space and agricultural space based on spatial decision-making. Trans. Chin. Soc. Agric. Eng. 2017, 33, 256–266. [Google Scholar]
- Wang, L.; Zheng, W.; Tang, L.; Zhang, S.; Liu, Y.; Ke, X. Spatial Optimization of Urban Land and Cropland Based on Land Production Capacity to Balance Cropland Protection and Ecological Conservation. J. Environ. Manag. 2021, 285, 112054. [Google Scholar] [CrossRef] [Scilit]
- Song, G.; Zhang, H. Cultivated Land Use Layout Adjustment Based on Crop Planting Suitability: A Case Study of Typical Counties in Northeast China. Land 2021, 10, 107. [Google Scholar] [CrossRef] [Scilit]
- Liu, Q.; Niu, J.; Wood, J.D.; Kang, S. Spatial Optimization of Cropping Pattern in the Upper-Middle Reaches of the Heihe River Basin, Northwest China. Agric. Water Manag. 2022, 264, 107479. [Google Scholar] [CrossRef] [Scilit]
- Huang, B.; Huang, Q.; Yang, Y.; Zheng, J.; Chen, Y. Optimizing cultivated land layout using cultivability evaluation and multi-objective trade-offs. Trans. Chin. Soc. Agric. Eng. 2024, 40, 240–249. [Google Scholar]
- Wang, H.; Chen, M.; Cai, E.; Liu, D.; Chen, X. Permanent Basic Farmland Delineation Model Based on Multi-objective Particle Swarm Optimization Algorithm. Trans. Chin. Soc. Agric. Mach. 2021, 52, 138–146+171. [Google Scholar]
- Tan, Y.; Wu, C.; Wang, Q.; Zhou, L.; Yan, D. The Change of Cultivated Land and Ecological Environment Effects Driven by the Policy of Dynamic Equilibrium of the Total Cultivated Land. J. Nat. Resour. 2005, 20, 727–734. [Google Scholar]
- Wu, J.; Wang, H.; Wang, C.; Huang, X.; Wei, J.; Wang, Z.; Zhang, C.; Chen, B.; Yiming, Y.; Lei, C.; et al. Zoning and Spatial Resilience: Land Use and Food Security in the Ili River Valley, China. Land Use Policy 2025, 157, 107657. [Google Scholar] [CrossRef] [Scilit]
- Marchese, D.; Reynolds, E.; Bates, M.E.; Morgan, H.; Clark, S.S.; Linkov, I. Resilience and Sustainability: Similarities and Differences in Environmental Management Applications. Sci. Total Environ. 2018, 613–614, 1275–1283. [Google Scholar] [CrossRef] [Scilit]
- Yang, S.; Song, S.; Li, F.; Yu, G.; He, G.; Cui, H.; Wang, R.; Sun, B.; Du, D.; Chen, G.; et al. Evaluating Farmland Ecosystem Resilience and Its Obstacle Factors in Ethiopia. Ecol. Indic. 2023, 146, 109900. [Google Scholar] [CrossRef] [Scilit]
- Meerow, S.; Newell, J.P.; Stults, M. Defining Urban Resilience: A Review. Landsc. Urban Plan. 2016, 147, 38–49. [Google Scholar] [CrossRef] [Scilit]
- Sharifi, A. Resilience of Urban Social-Ecological-Technological Systems (SETS): A Review. Sustain. Cities Soc. 2023, 99, 104910. [Google Scholar] [CrossRef] [Scilit]
- Walker, B.; Holling, C.S.; Carpenter, S.R.; Kinzig, A. Resilience, Adaptability and Transformability in Social-Ecological Systems. Ecol. Soc. 2004, 9, 5. [Google Scholar] [CrossRef] [Scilit]
- Folke, C. Resilience: The Emergence of a Perspective for Social–Ecological Systems Analyses. Glob. Environ. Change 2006, 16, 253–267. [Google Scholar] [CrossRef] [Scilit]
- Folke, C.; Carpenter, S.R.; Walker, B.; Scheffer, M.; Chapin, T.; Rockström, J. Resilience Thinking: Integrating Resilience, Adaptability and Transformability. Ecol. Soc. 2010, 15, 20. [Google Scholar] [CrossRef] [Scilit]
- Jiren, T.S.; Dorresteijn, I.; Schultner, J.; Fischer, J. The Governance of Land Use Strategies: Institutional and Social Dimensions of Land Sparing and Land Sharing. Conserv. Lett. 2018, 11, e12429. [Google Scholar] [CrossRef] [Scilit]
- Yan, M.; Yang, B.; Sheng, S.; Fan, X.; Li, X.; Lu, X. Evaluation of Cropland System Resilience to Climate Change at Municipal Scale Through Robustness, Adaptability, and Transformability: A Case Study of Hubei Province, China. Front. Ecol. Evol. 2022, 10, 943265. [Google Scholar] [CrossRef] [Scilit]
- Zhao, L.; Qiao, Z.; Cheng, Y.; Chen, G.; Wang, H.; Liu, G. Identification of Cost-Effective Spatial Priorities for Cultivated Land Supplementation Using an Integrated Framework. Habitat Int. 2026, 167, 103630. [Google Scholar] [CrossRef] [Scilit]
- Zhang, H.; Song, W.; Zhang, W.; Li, X.; Liu, J.; Li, J. Analysis of Spatial Differentiation Characteristics and Influencing Factors of Non-grain Cultivated Land in Shandong Province. China Land Sci. 2021, 35, 94–103. [Google Scholar]
- Cheng, X.; Chen, M.; Lai, Z.; Xiao, S. Spatial differentiation pattern and correlation factors of “non-grain” cultivated land in mountainous counties. Trans. Chin. Soc. Agric. Eng. 2023, 39, 203–211. [Google Scholar]
- Yang, X.; Jin, X.; Jia, P.; Fan, Y.; Gu, Z.; Zhou, Y. Spatial-temporal variation and driving factors of cropland conversion to forest or fruit production in Hainan Province during 2000–2020. Trans. Chin. Soc. Agric. Eng. 2022, 38, 233–240. [Google Scholar]
- Miao, X.; Li, Z.; Wang, M.; Mei, J.; Chen, J. Measurement of Cultivated Land Ecosystem Resilience in Black Soil Region of Northeast China under the Background of Cultivated Land Protection Policy in China: Case Study of Qiqihar City. J. Clean. Prod. 2024, 434, 140141. [Google Scholar] [CrossRef] [Scilit]
- Wang, H.; Ma, R.; Wang, J.; Zhang, H.; Zhou, W. Conserving Cropland Resilience Space in Alpine Agro-Pastoral Ecotones: A Quantitative Study of Qinghai Province. Agric. Syst. 2025, 223, 104211. [Google Scholar] [CrossRef] [Scilit]
- Li, L.; Pan, P.; Wang, Y.; Wang, X.; Wang, X.; Xiao, D.; Song, S. Research on the Cultivated Land Use System Resilience under a Safe and Just Space Framework. J. Environ. Manag. 2025, 380, 125006. [Google Scholar] [CrossRef] [Scilit] [PubMed]
- Zhang, C.; Wei, Z.; Shi, J.; Huang, Q.; Liu, F. Resilience-Based Zoning for Sustainable Cultivated Land Management: Integrating Landscape Morphology and Environmental Adaptability. J. Environ. Manag. 2025, 395, 127991. [Google Scholar] [CrossRef] [Scilit]
- Zhu, J.; Pan, Y.; Zhang, Y.; Qiu, L.; Xu, B.; Lan, D. Research on the Key Threshold of the Resilience of Cultivated Land System under Planting Changes. China Land Sci. 2022, 36, 49–58. [Google Scholar]
- Hong, G.; Liu, S.; Liu, W.; Wu, X. Nonlinear Trade-off Relationship and Critical Threshold between Ecosystem Services and Climate Resilience for Sustainable Urban Development. Sustain. Cities Soc. 2024, 103, 105253. [Google Scholar] [CrossRef] [Scilit]
- Paas, W.; Accatino, F.; Bijttebier, J.; Black, J.E.; Gavrilescu, C.; Krupin, V.; Manevska-Tasevska, G.; Ollendorf, F.; Peneva, M.; San Martin, C.; et al. Participatory Assessment of Critical Thresholds for Resilient and Sustainable European Farming Systems. J. Rural Stud. 2021, 88, 214–226. [Google Scholar] [CrossRef] [Scilit]
- Calafat-Marzal, C.; Piñeiro, V.; Roig-Tierno, N.; Sánchez-García, M. Demographic Challenges and Agricultural Abandonment: Solutions for Semi-Arid Winegrowing Regions. J. Rural Stud. 2023, 104, 103159. [Google Scholar] [CrossRef] [Scilit]
- Dhillon, R.; Das, S.; Shedekar, V.S.; Sharma, V. Assessing the Impact of Soil Water Deficit and Supplemental Irrigation Scenarios on Ohio’s Maize and Soybean Yields Using Machine Learning Models. Agric. Water Manag. 2025, 320, 109834. [Google Scholar] [CrossRef] [Scilit]
- Yu, H.; Zhao, Z.; Yang, Q. Drivers and Mechanisms of Cropland Abandonment in Typical Mountainous Areas of Southwestern China. Front. Sustain. Food Syst. 2025, 9, 1614067. [Google Scholar] [CrossRef] [Scilit]
- Everest, T.; Sungur, A.; Özcan, H. Determination of Agricultural Land Suitability with a Multiple-Criteria Decision-Making Method in Northwestern Turkey. Int. J. Environ. Sci. Technol. 2021, 18, 1073–1088. [Google Scholar] [CrossRef] [Scilit]
- Valtiala, J.; Niskanen, O.; Torvinen, M.; Riekkinen, K.; Suokannas, A. The Relationship between Agricultural Land Parcel Size and Cultivation Costs. Land Use Policy 2023, 131, 106728. [Google Scholar] [CrossRef] [Scilit]
- Eder, A. The Effect of Land Fragmentation on Risk and Technical Efficiency of Austrian Crop Farms. J. Agric. Econ. 2025, 76, 391–404. [Google Scholar] [CrossRef] [Scilit]
- Takayama, T.; Nakatani, T.; Senda, T.; Fujie, T. Less-Favoured-Area Payments, Farmland Abandonment and Farm Size: Evidence from Hilly and Mountainous Areas in Japan. Aust. J. Agric. Resour. Econ. 2021, 65, 658–678. [Google Scholar] [CrossRef] [Scilit]
- Xu, D.; Chen, M.; Li, R. How High-Standard Farmland Construction Can Affect Farmers’ Grain Cultivation Behavior: Evidence from Rural China. Habitat Int. 2025, 160, 103384. [Google Scholar] [CrossRef] [Scilit]
- van Berkum, S. How Urban Growth in the Global South Affects Agricultural Dynamics and Food Systems Outcomes in Rural Areas: A Review and Research Agenda. Sustainability 2023, 15, 2591. [Google Scholar] [CrossRef] [Scilit]
- Maharjan, A.; Kochhar, I.; Chitale, V.S.; Hussain, A.; Gioli, G. Understanding Rural Outmigration and Agricultural Land Use Change in the Gandaki Basin, Nepal. Appl. Geogr. 2020, 124, 102278. [Google Scholar] [CrossRef] [Scilit]
- Zhang, X.; Kong, Y.; Lv, Y.; Yao, F.; Cao, Y.; Shao, X.; Geng, Y.; Wang, L.; Wang, Y. Increased Topsoil Depth Required to Support Increased Grain Yield Production in High Density Maize. Field Crops Res. 2024, 308, 109282. [Google Scholar] [CrossRef] [Scilit]
- Eckhoff, K.D.; Reed, S.C.; Bradford, J.B.; Daly, N.C.; Griffen, K.; Reibold, R.; Lupardus, R.; Munson, S.M.; Sengsirirak, A.; Villarreal, M.L.; et al. Dryland Soil Recovery after Disturbance across Soil and Climate Gradients of the Colorado Plateau. Sci. Total Environ. 2024, 932, 172976. [Google Scholar] [CrossRef] [Scilit]
- Wojewodzic, T.; Janus, J.; Dacko, M.; Pijanowski, J.; Taszakowski, J. Measuring the Effectiveness of Land Consolidation: An Economic Approach Based on Selected Case Studies from Poland. Land Use Policy 2021, 100, 104888. [Google Scholar] [CrossRef] [Scilit]
- Kirmikil, M. Which Factors Are More Important in Land Consolidation Block Planning? An Analytic Hierarchy Process Approach for Prioritization. Sustainability 2025, 17, 2314. [Google Scholar] [CrossRef] [Scilit]
- Shu, B.; Zhang, H.; Li, Y.; Qu, Y.; Chen, L. Spatiotemporal Variation Analysis of Driving Forces of Urban Land Spatial Expansion Using Logistic Regression: A Case Study of Port Towns in Taicang City, China. Habitat Int. 2014, 43, 181–190. [Google Scholar] [CrossRef] [Scilit]
- Zhao, L.; Liu, G.; Xian, C.; Nie, J.; Xiao, Y.; Zhou, Z.; Li, X.; Wang, H. Simulation of Land Use Pattern Based on Land Ecological Security: A Case Study of Guangzhou, China. Int. J. Environ. Res. Public Health 2022, 19, 9281. [Google Scholar] [CrossRef] [Scilit]
- Li, S.; Ge, X.; Jin, G.; Lou, Z.; Yang, H. Flood Dynamic Monitoring and XGBoost-SHAP Based Risk Assessment: A Case Study of the 23·7 Extreme Rainstorm in BTH Region, China. Environ. Sustain. Indic. 2025, 28, 101020. [Google Scholar] [CrossRef] [Scilit]
- Schütz, M.; Schütz, A.; Bendix, J.; Thies, J.M.U.B. Evaluating Station, Satellite, & Combined Data for XGBoost-Based Visibility Forecast. Atmos. Res. 2026, 328, 108395. [Google Scholar] [CrossRef] [Scilit]
- Dong, J.; Chen, Y.; Yao, B.; Zhang, X.; Zeng, N. A Neural Network Boosting Regression Model Based on XGBoost. Appl. Soft Comput. 2022, 125, 109067. [Google Scholar] [CrossRef] [Scilit]
- Gianoli, A. Unlocking Patterns in Urban Land Use Efficiency: A Global Analysis Using XGBoost and Bayesian Networks. Land Use Policy 2026, 160, 107838. [Google Scholar] [CrossRef] [Scilit]
- Gao, S.; Ge, X.; Li, H.; Zhou, H. Analysis of Urban Vitality and Its Driving Factors in Zhengzhou’s Main Urban Area Based on Multi-Source Data and XGBoost. Ecol. Indic. 2025, 179, 114187. [Google Scholar] [CrossRef] [Scilit]
- Li, K.; Zhao, J.; Li, Y.; Lin, Y. Identifying Trade-Offs and Synergies among Land Use Functions Using an XGBoost-SHAP Model: A Case Study of Kunming, China. Ecol. Indic. 2025, 172, 113330. [Google Scholar] [CrossRef] [Scilit]
- Yang, G.; Fu, C.; Zuo, Q.; Shi, J.; Wu, X.; Qiao, X.; Ben-Gal, A. Multi-Objective Optimized Allocation of Arid Saline Farmlands and Irrigation Water Resources for Sustainable Agriculture. Agric. Water Manag. 2025, 321, 109929. [Google Scholar] [CrossRef] [Scilit]
- Li, J.; Liu, Y.; Yang, X.; Lu, M.; Song, Y. Spatial Variability of Soil Geochemical Elements Using a Novel Ecological Factor-Incorporated Interpretable Machine Learning Model in China’s Coastal Saline-Alkali Farmlands. Mar. Pollut. Bull. 2026, 222, 118628. [Google Scholar] [CrossRef] [Scilit] [PubMed]
- Barton, M.; Lennox, B. Model Stacking to Improve Prediction and Variable Importance Robustness for Soft Sensor Development. Digit. Chem. Eng. 2022, 3, 100034. [Google Scholar] [CrossRef] [Scilit]
- Altmann, A.; Toloşi, L.; Sander, O.; Lengauer, T. Permutation Importance: A Corrected Feature Importance Measure. Bioinformatics 2010, 26, 1340–1347. [Google Scholar] [CrossRef] [Scilit] [PubMed]
- Liu, J.; Zuo, Y.; Wang, N.; Yuan, F.; Zhu, X.; Zhang, L.; Zhang, J.; Sun, Y.; Guo, Z.; Guo, Y.; et al. Comparative Analysis of Two Machine Learning Algorithms in Predicting Site-Level Net Ecosystem Exchange in Major Biomes. Remote Sens. 2021, 13, 2242. [Google Scholar] [CrossRef] [Scilit]
- Marcoulides, K.M.; Raykov, T. Evaluation of Variance Inflation Factors in Regression Models Using Latent Variable Modeling Methods. Educ. Psychol. Meas. 2019, 79, 874–882. [Google Scholar] [CrossRef] [Scilit]
- Zhao, X.; Sun, W.; Zhang, S.; Yang, Y.; Yang, Y.; Lan, H.; Yu, T.; Li, X.; Xie, Y. How Can Ecosystem Services Trade-Offs/Synergies Help Select the Optimal Cultivated Land Restoration Pattern? A Study Based on Multi-Scenario Simulations. Appl. Geogr. 2025, 177, 103563. [Google Scholar] [CrossRef] [Scilit]
- He, C.; Zhang, D.; Huang, Q.; Zhao, Y. Assessing the Potential Impacts of Urban Expansion on Regional Carbon Storage by Linking the LUSD-Urban and InVEST Models. Environ. Model. Softw. 2016, 75, 44–58. [Google Scholar] [CrossRef] [Scilit]
- He, Y.; Tao, Z.; Liang, Y.; Ou, X.; Zhong, Q.; Wu, D.; Song, W. Spatiotemporal variations in vegetation and carbon storage of mountainous ecosystems in Northeastern Guangdong Province. Acta Sci. Nat. Univ. Sunyatseni 2024, 63, 1–11. [Google Scholar] [CrossRef]
- Wang, B.; Cheng, W. Effects of Land Use/Cover on Regional Habitat Quality under Different Geomorphic Types Based on InVEST Model. Remote Sens. 2022, 14, 1279. [Google Scholar] [CrossRef] [Scilit]
- Jiang, W.; Wu, J. Spatio-temporal evolution of habitat quality in Guangdong-Hong Kong-Macao Greater Bay Area based on regional GDP and population spatial distribution. Acta Ecol. Sin. 2021, 41, 1747–1757. [Google Scholar]
- Zheng, J.; Xie, B.; You, X. Spatio-temporal characteristics of habitat quality based on land-use changes in Guangdong Province. Acta Ecol. Sin. 2022, 42, 6997–7010. [Google Scholar]
- Zhu, X.; Qie, R.; Luo, C.; Zhang, W. Assessment and Driving Factors of Wetland Ecosystem Service Function in Northeast China Based on InVEST-PLUS Model. Water 2024, 16, 2153. [Google Scholar] [CrossRef] [Scilit]
- Wu, D.; Mo, J.; Zeng, L.; Zhou, P.; Xie, M.; Yuan, H. Ecosystem Services Scenario Simulation in Guangzhou Based on the FLUS-InVEST Model. Sci. Rep. 2025, 15, 14054. [Google Scholar] [CrossRef] [Scilit]
- Zhao, L.; Liu, G.; Lu, Z.; Xiao, Y.; Nie, J.; Yang, L.; Zhou, Z.; Chen, L.; Wang, H. A New Framework for Delineating Farmland Consolidation Priority Areas for Promoting Agricultural Mechanization in Hilly and Mountainous Areas. Comput. Electron. Agric. 2024, 218, 108681. [Google Scholar] [CrossRef] [Scilit]
- Yu, S.; Qi, J.; Zhang, X.; Pueppke, S.G.; Ou, W.; Liu, H.; Cai, X.; Ren, T. Land Use Policy Impacts on Effective Farmland Planting Area: A Case Study in Heilongjiang Province, China. Land Use Policy 2024, 138, 107027. [Google Scholar] [CrossRef] [Scilit]
- Liu, Y.; Liu, L.; Zhu, A.-X.; Lao, C.; Hu, G.; Hu, Y. Scenario Farmland Protection Zoning Based on Production Potential: A Case Study in China. Land Use Policy 2020, 95, 104581. [Google Scholar] [CrossRef] [Scilit]
- Ma, S.; He, J.; Yu, Y. Model of urban land-use spatial optimization based on particle swarm optimization algorithm. Trans. Chin. Soc. Agric. Eng. 2010, 26, 321–326. [Google Scholar]
- Liu, X.; Ou, J.; Li, X.; Ai, B. Combining System Dynamics and Hybrid Particle Swarm Optimization for Land Use Allocation. Ecol. Model. 2013, 257, 11–24. [Google Scholar] [CrossRef] [Scilit]
- Saha, S.; Saha, A.; Roy, B.; Sarkar, R.; Bhardwaj, D.; Kundu, B. Integrating the Particle Swarm Optimization (PSO) with Machine Learning Methods for Improving the Accuracy of the Landslide Susceptibility Model. Earth Sci. Inform. 2022, 15, 2637–2662. [Google Scholar] [CrossRef] [Scilit]
- Song, M.; An, M.; He, W.; Wu, Y. Research on Land Use Optimization Based on PSO-GA Model with the Goals of Increasing Economic Benefits and Ecosystem Services Value. Sustain. Cities Soc. 2025, 119, 106072. [Google Scholar] [CrossRef] [Scilit]
- Agresti, A. An Introduction to Categorical Data Analysis, 2nd ed.; John Wiley & Sons, Inc.: Hoboken, NJ, USA, 2007; ISBN 978-0-471-22618-5. [Google Scholar]
- AbdelRahman, M.A.E.; Saleh, A.M.; Arafat, S.M. Assessment of Land Suitability Using a Soil-Indicator-Based Approach in a Geomatics Environment. Sci. Rep. 2022, 12, 18113. [Google Scholar] [CrossRef] [Scilit]
- Bilas, G.; Karapetsas, N.; Gobin, A.; Mesdanitis, K.; Toth, G.; Hermann, T.; Wang, Y.; Luo, L.; Koutsos, T.M.; Moshou, D.; et al. Land Suitability Analysis as a Tool for Evaluating Soil-Improving Cropping Systems. Land 2022, 11, 2200. [Google Scholar] [CrossRef] [Scilit]
- Kwinta, A.; Gniadek, J. The Description of Parcel Geometry and Its Application in Terms of Land Consolidation Planning. Comput. Electron. Agric. 2017, 136, 117–124. [Google Scholar] [CrossRef] [Scilit]
- Hu, C.; Dong, J. Program Sustainability and Property Right Factors Influencing Farmers’ Self-Predicted Post-Program Land Investment Behavior—Evidence from Land Enrolled in the Sloping Land Conversion Program in China. Land Use Policy 2025, 158, 107752. [Google Scholar] [CrossRef] [Scilit]
- Gorgan, M.; Bavorova, M. How to Increase Landowners’ Participation in Land Consolidation: Evidence from North Macedonia. Land Use Policy 2022, 123, 106424. [Google Scholar] [CrossRef] [Scilit]
- Kong, X.; Jin, J.; Liu, Y.; Li, C.; Qin, J. Planning method of the prime farmland protection zone based on farmland utilization grade. Trans. Chin. Soc. Agric. Eng. 2008, 24, 46–51+2. [Google Scholar]
- Liu, Y.; Zou, W.; Wu, K.; Li, X.; Li, X.; Zhao, R. The Implementation Path for a Policy Balancing Cultivated Land Occupation and Reclamation Based on Land-Type Classification—A Case Study in Heilongjiang Province. Agriculture 2025, 15, 1105. [Google Scholar] [CrossRef] [Scilit]
- Wu, S.; Hu, Z.; Ren, X.; Zheng, W.; Liu, H.; Chen, S.; Luo, X.; Wu, C.; Fu, H.; Li, Y. Construction of cultivated land protection agglomeration area based on regional coordinated development: A case study of Zhuhai city, Guangdong province. J. Nat. Resour. 2025, 40, 3140–3163. [Google Scholar] [CrossRef] [Scilit]
- He, Y. Practices and Reflections on Zhejiang Province’s Approach to Reallocating Farmland from Mountainous Areas to Lowland Regions. China Land 2023, 10, 5–7. [Google Scholar] [CrossRef]
- Ministry of Natural Resources Notice of the Ministry of Natural Resources and the Ministry of Agriculture and Rural Affairs on Reforming and Improving the Management of Farmland Compensation Balance. Available online: https://www.gov.cn/zhengce/zhengceku/202410/content_6979292.htm (accessed on 26 December 2025).
- Tan, R.; Yun, W. Improvements and Innovations in China’s Farmland Requisition-Compensation Balance System. People’s Trib. 2024, 10, 71–76. [Google Scholar] [CrossRef]
- Chen, L.; Jiang, P.; Chen, W.; Li, M.; Wang, L.; Gong, Y.; Pian, Y.; Xia, N.; Duan, Y.; Huang, Q. Farmland Protection Policies and Rapid Urbanization in China: A Case Study for Changzhou City. Land Use Policy 2015, 48, 552–566. [Google Scholar] [CrossRef] [Scilit]
- Chen, H.; Tan, Y.; Xiao, W.; He, T.; Xu, S.; Meng, F.; Li, X.; Xiong, W. Assessment of Continuity and Efficiency of Complemented Cropland Use in China for the Past 20 Years: A Perspective of Cropland Abandonment. J. Clean. Prod. 2023, 388, 135987. [Google Scholar] [CrossRef] [Scilit]
- Qie, L.; Pu, L.; Tang, P.; Liu, R.; Huang, S.; Xu, F.; Zhong, T. Gains and Losses of Farmland Associated with Farmland Protection Policy and Urbanization in China: An Integrated Perspective Based on Goal Orientation. Land Use Policy 2023, 129, 106643. [Google Scholar] [CrossRef] [Scilit]
- Lu, D.; Wang, Z.; Li, X.; Zhou, Y. Evaluation of the Efficiency and Drivers of Complemented Cropland in Southwest China over the Past 30 Years from the Perspective of Cropland Abandonment. J. Environ. Manag. 2024, 351, 119909. [Google Scholar] [CrossRef] [Scilit]
- Cai, T.; Zhang, X.; Xia, F.; Lu, D. Function Evolution of Oasis Cultivated Land and Its Trade-Off and Synergy Relationship in Xinjiang, China. Land 2022, 11, 1399. [Google Scholar] [CrossRef] [Scilit]
- Liu, Y.; Wan, C.; Xu, G.; Chen, L.; Yang, C. Exploring the Relationship and Influencing Factors of Cultivated Land Multifunction in China from the Perspective of Trade-off/Synergy. Ecol. Indic. 2023, 149, 110171. [Google Scholar] [CrossRef] [Scilit]
- Perpiña Castillo, C.; Jacobs-Crisioni, C.; Diogo, V.; Lavalle, C. Modelling Agricultural Land Abandonment in a Fine Spatial Resolution Multi-Level Land-Use Model: An Application for the EU. Environ. Model. Softw. 2021, 136, 104946. [Google Scholar] [CrossRef] [Scilit] [PubMed]
- Fayet, C.M.J.; Reilly, K.H.; Van Ham, C.; Verburg, P.H. What Is the Future of Abandoned Agricultural Lands? A Systematic Review of Alternative Trajectories in Europe. Land Use Policy 2022, 112, 105833. [Google Scholar] [CrossRef] [Scilit]
- Shoyama, K.; Nishi, M.; Hashimoto, S.; Saito, O. Outcome-Based Assessment of the Payment for Mountain Agriculture: A Community-Based Approach to Countering Land Abandonment in Japan. Environ. Manag. 2021, 68, 353–365. [Google Scholar] [CrossRef] [Scilit]
- Gao, X.; Yasunaga, N.; Inoue, N. Pathways Influencing Bearers and Abandoned Farmlands through Farmland Intermediate Management Institutions: Using Prefectural Data in Japan. Asia-Pac. J. Reg. Sci. 2023, 7, 1261–1287. [Google Scholar] [CrossRef] [Scilit]
- Loconto, A.; Desquilbet, M.; Moreau, T.; Couvet, D.; Dorin, B. The Land Sparing—Land Sharing Controversy: Tracing the Politics of Knowledge. Land Use Policy 2020, 96, 103610. [Google Scholar] [CrossRef] [Scilit]
- Augustiny, E.; Frehner, A.; Green, A.; Mathys, A.; Rosa, F.; Pfister, S.; Muller, A. Empirical Evidence Supports Neither Land Sparing nor Land Sharing as the Main Strategy to Manage Agriculture–Biodiversity Tradeoffs. PNAS Nexus 2025, 4, pgaf251. [Google Scholar] [CrossRef] [Scilit]
- Luo, L.; Li, Y.; Ma, W.; Rong, J.; Wei, J.; Cui, Y.; Qu, T. Temporal–Spatial Dynamics and Collaborative Effects of Cropland Resilience in China. Land 2025, 14, 108. [Google Scholar] [CrossRef] [Scilit]
- Liu, L.; Xiao, X.; Qin, Y.; Wang, J.; Xu, X.; Hu, Y.; Qiao, Z. Mapping Cropping Intensity in China Using Time Series Landsat and Sentinel-2 Images and Google Earth Engine. Remote Sens. Environ. 2020, 239, 111624. [Google Scholar] [CrossRef] [Scilit]
- Slagter, B.; Fesenmyer, K.; Hethcoat, M.; Belair, E.; Ellis, P.; Kleinschroth, F.; Peña-Claros, M.; Herold, M.; Reiche, J. Monitoring Road Development in Congo Basin Forests with Multi-Sensor Satellite Imagery and Deep Learning. Remote Sens. Environ. 2024, 315, 114380. [Google Scholar] [CrossRef] [Scilit]
- Ren, H.; Huang, X.; Yang, J.; Zhou, G. Improving 30-Meter Global Impervious Surface Area (GISA) Mapping: New Method and Dataset. ISPRS J. Photogramm. Remote Sens. 2025, 220, 354–376. [Google Scholar] [CrossRef] [Scilit]
- Huan, Y.; Nijhuis, S.; Tillie, N. Optimizing Urban Agriculture for Long-Term Ecosystem Services: Integrating Scenario-Based Suitability Analysis and the Landscape Approach. J. Clean. Prod. 2025, 536, 147149. [Google Scholar] [CrossRef] [Scilit]
- Li, R.; Yuen, K.F.; Wang, Y.; Lu, Y. System Dynamics–Based Framework for Modeling and Assessing Smart City Resilience: A Case Study of Chengdu, China. Sustain. Cities Soc. 2026, 136, 107056. [Google Scholar] [CrossRef] [Scilit]
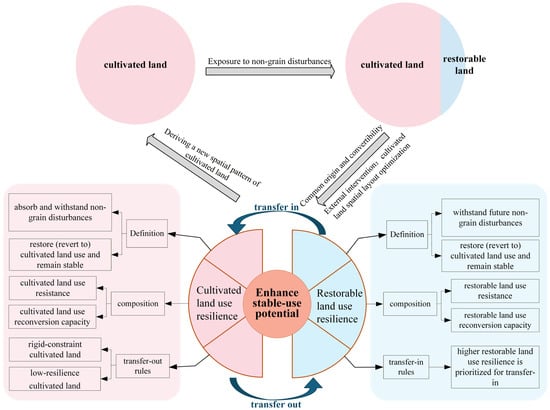
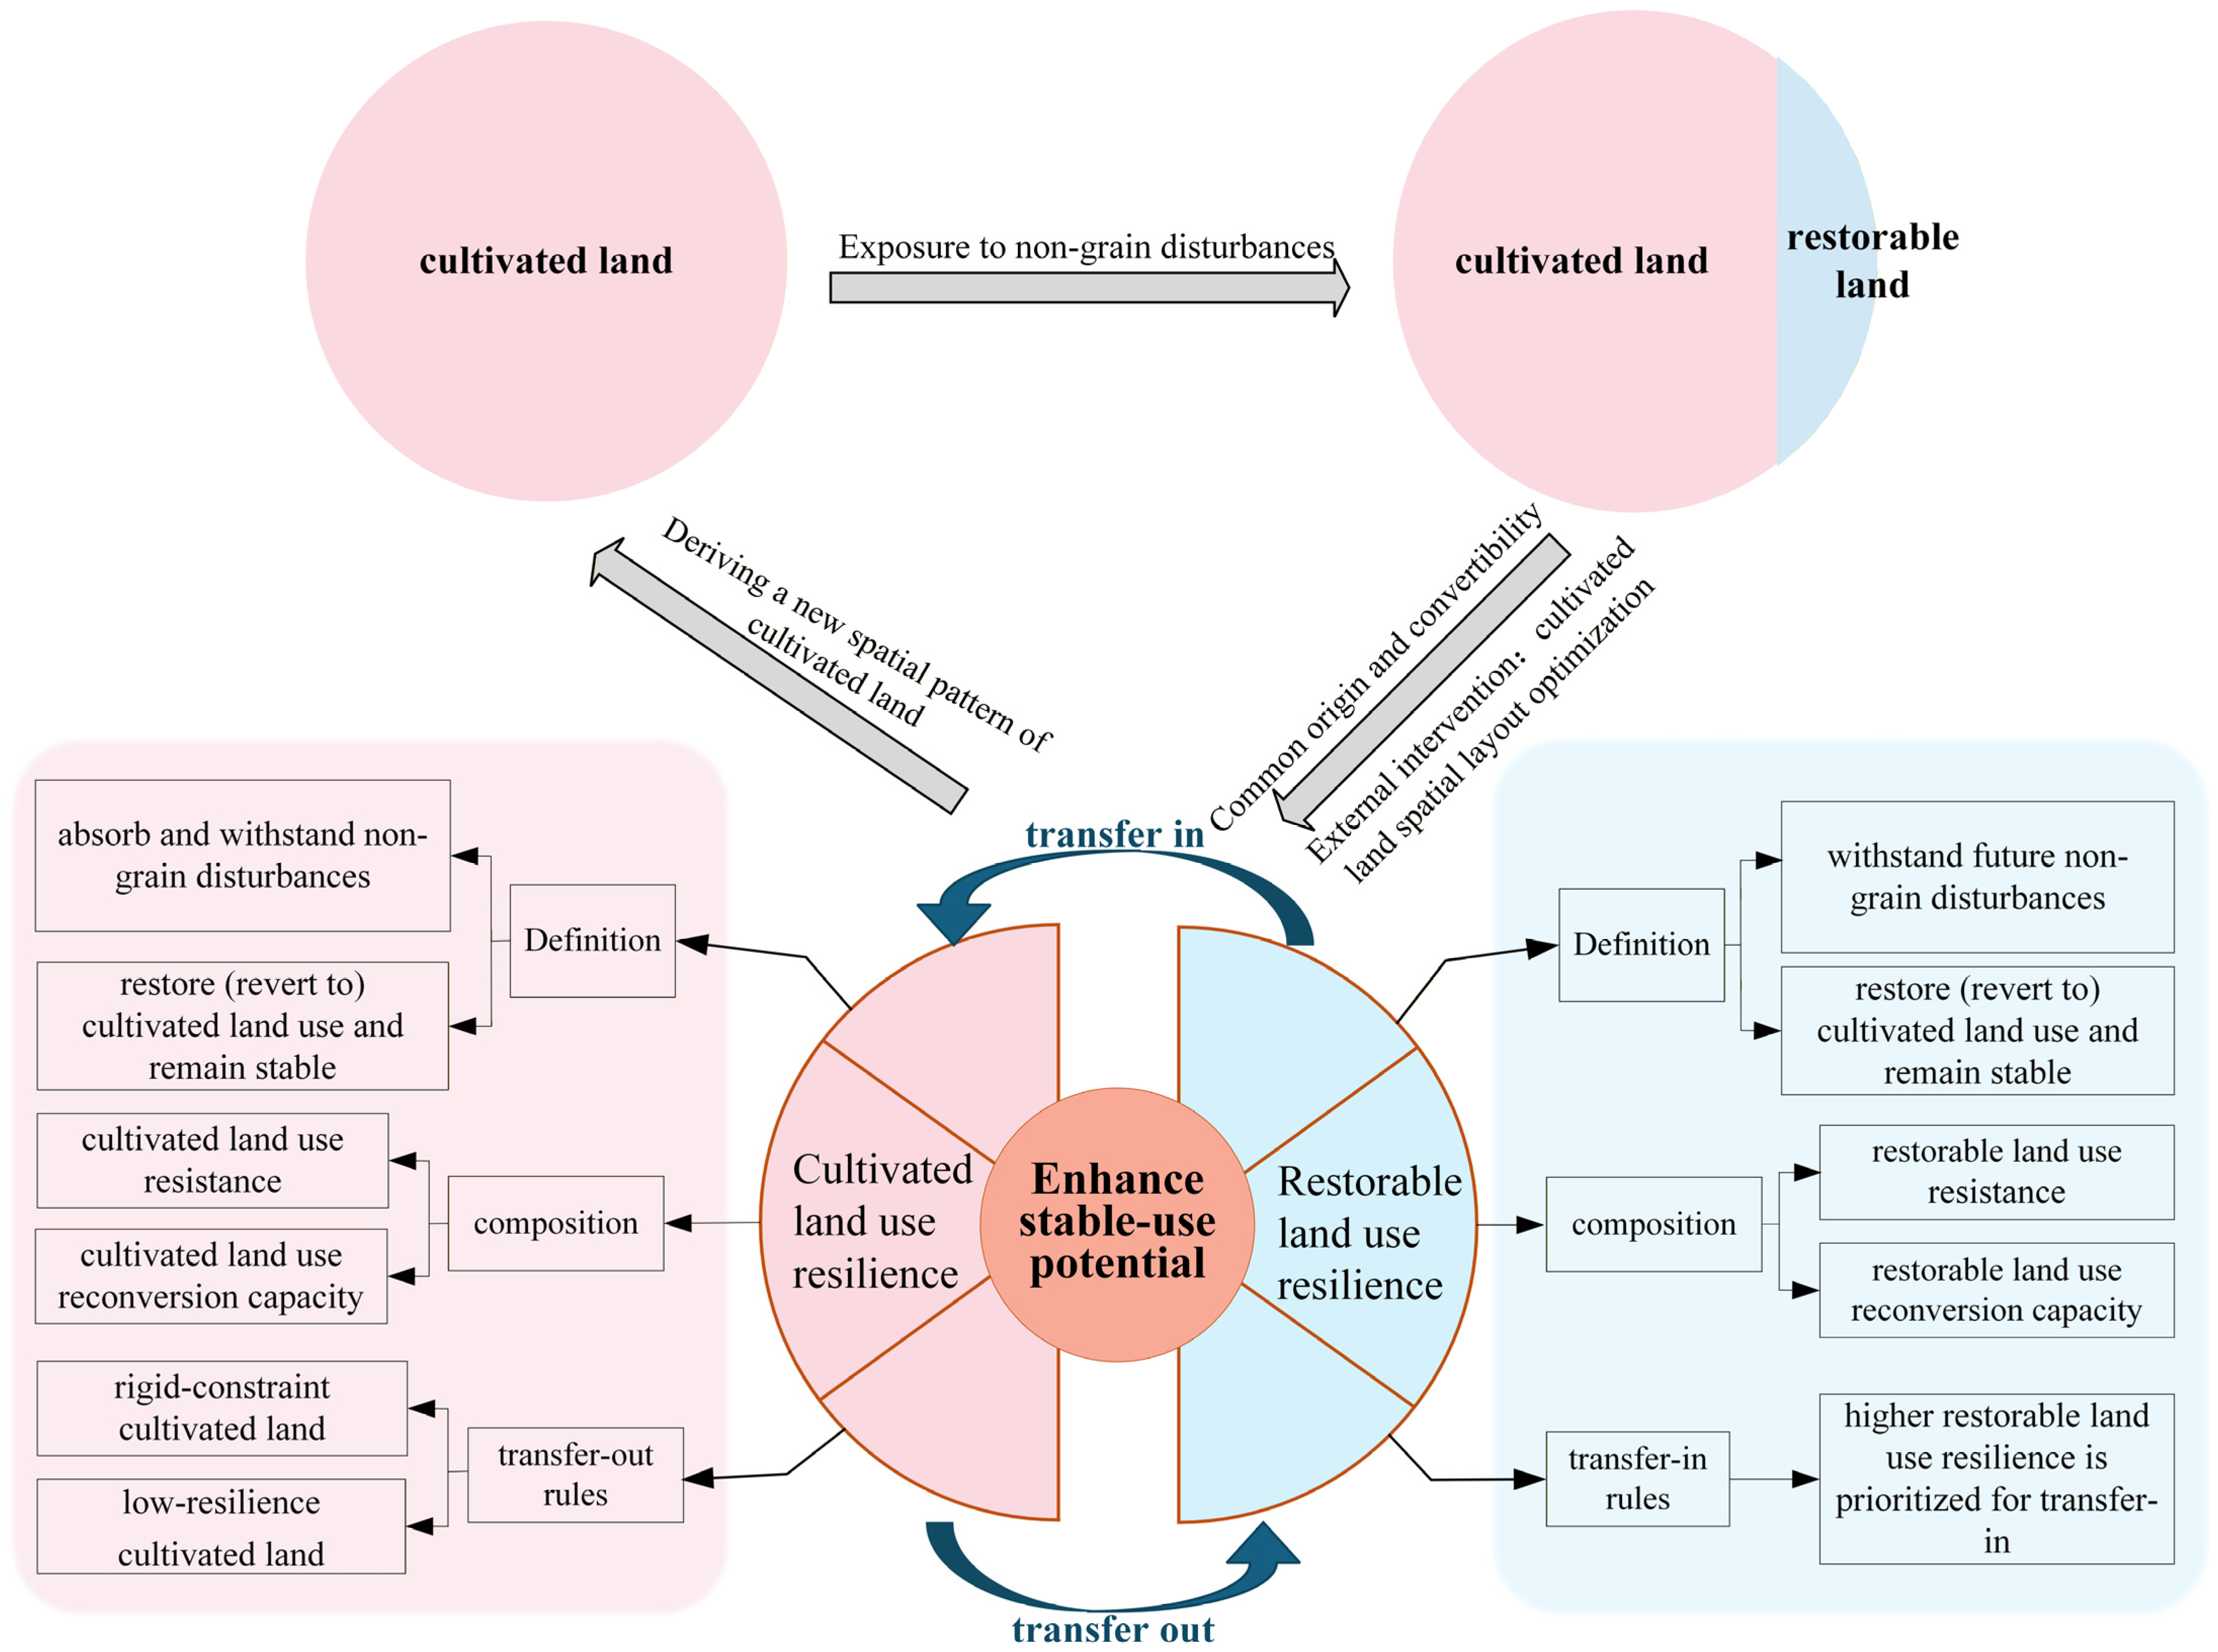
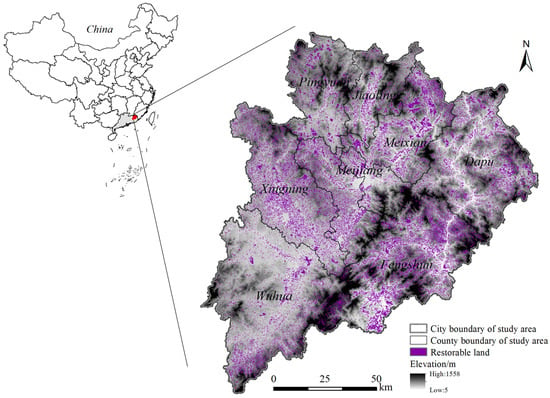
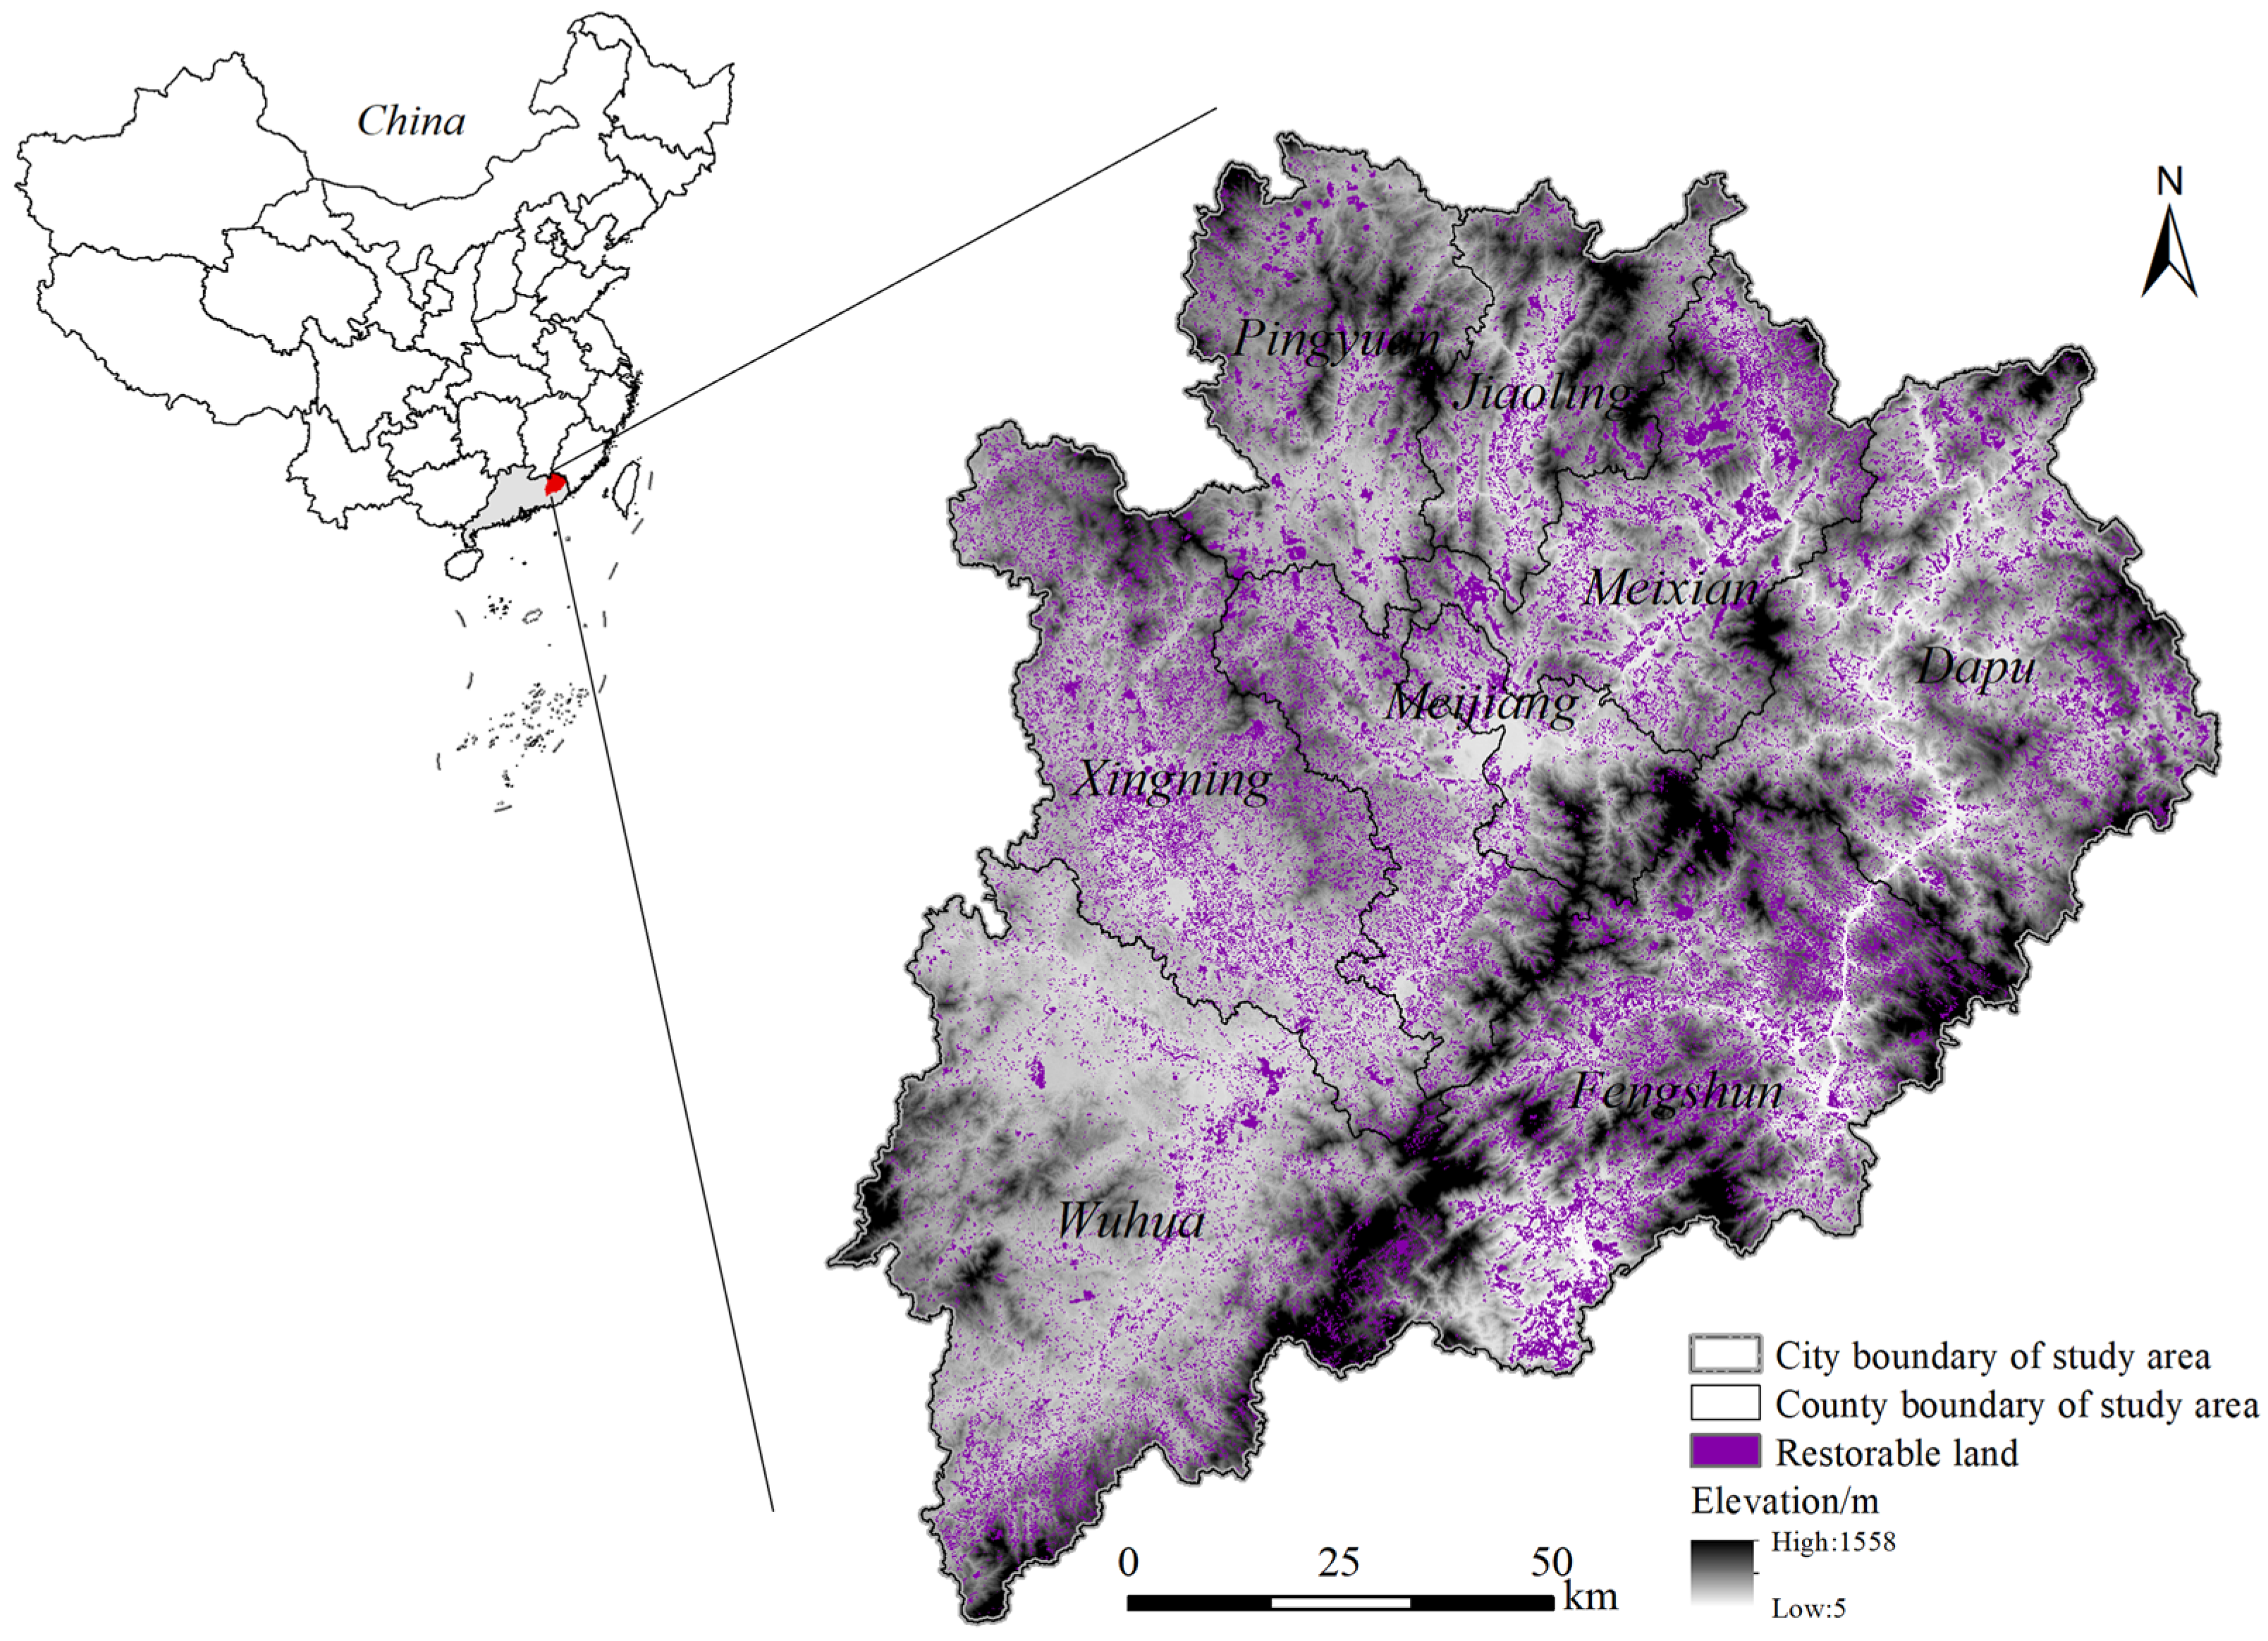
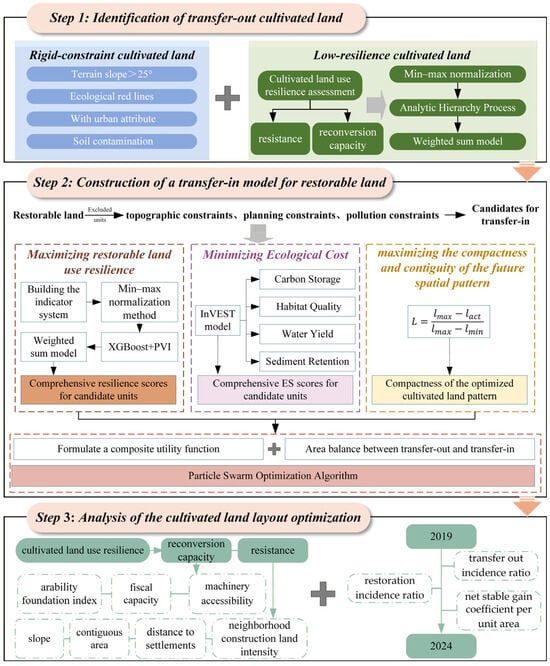
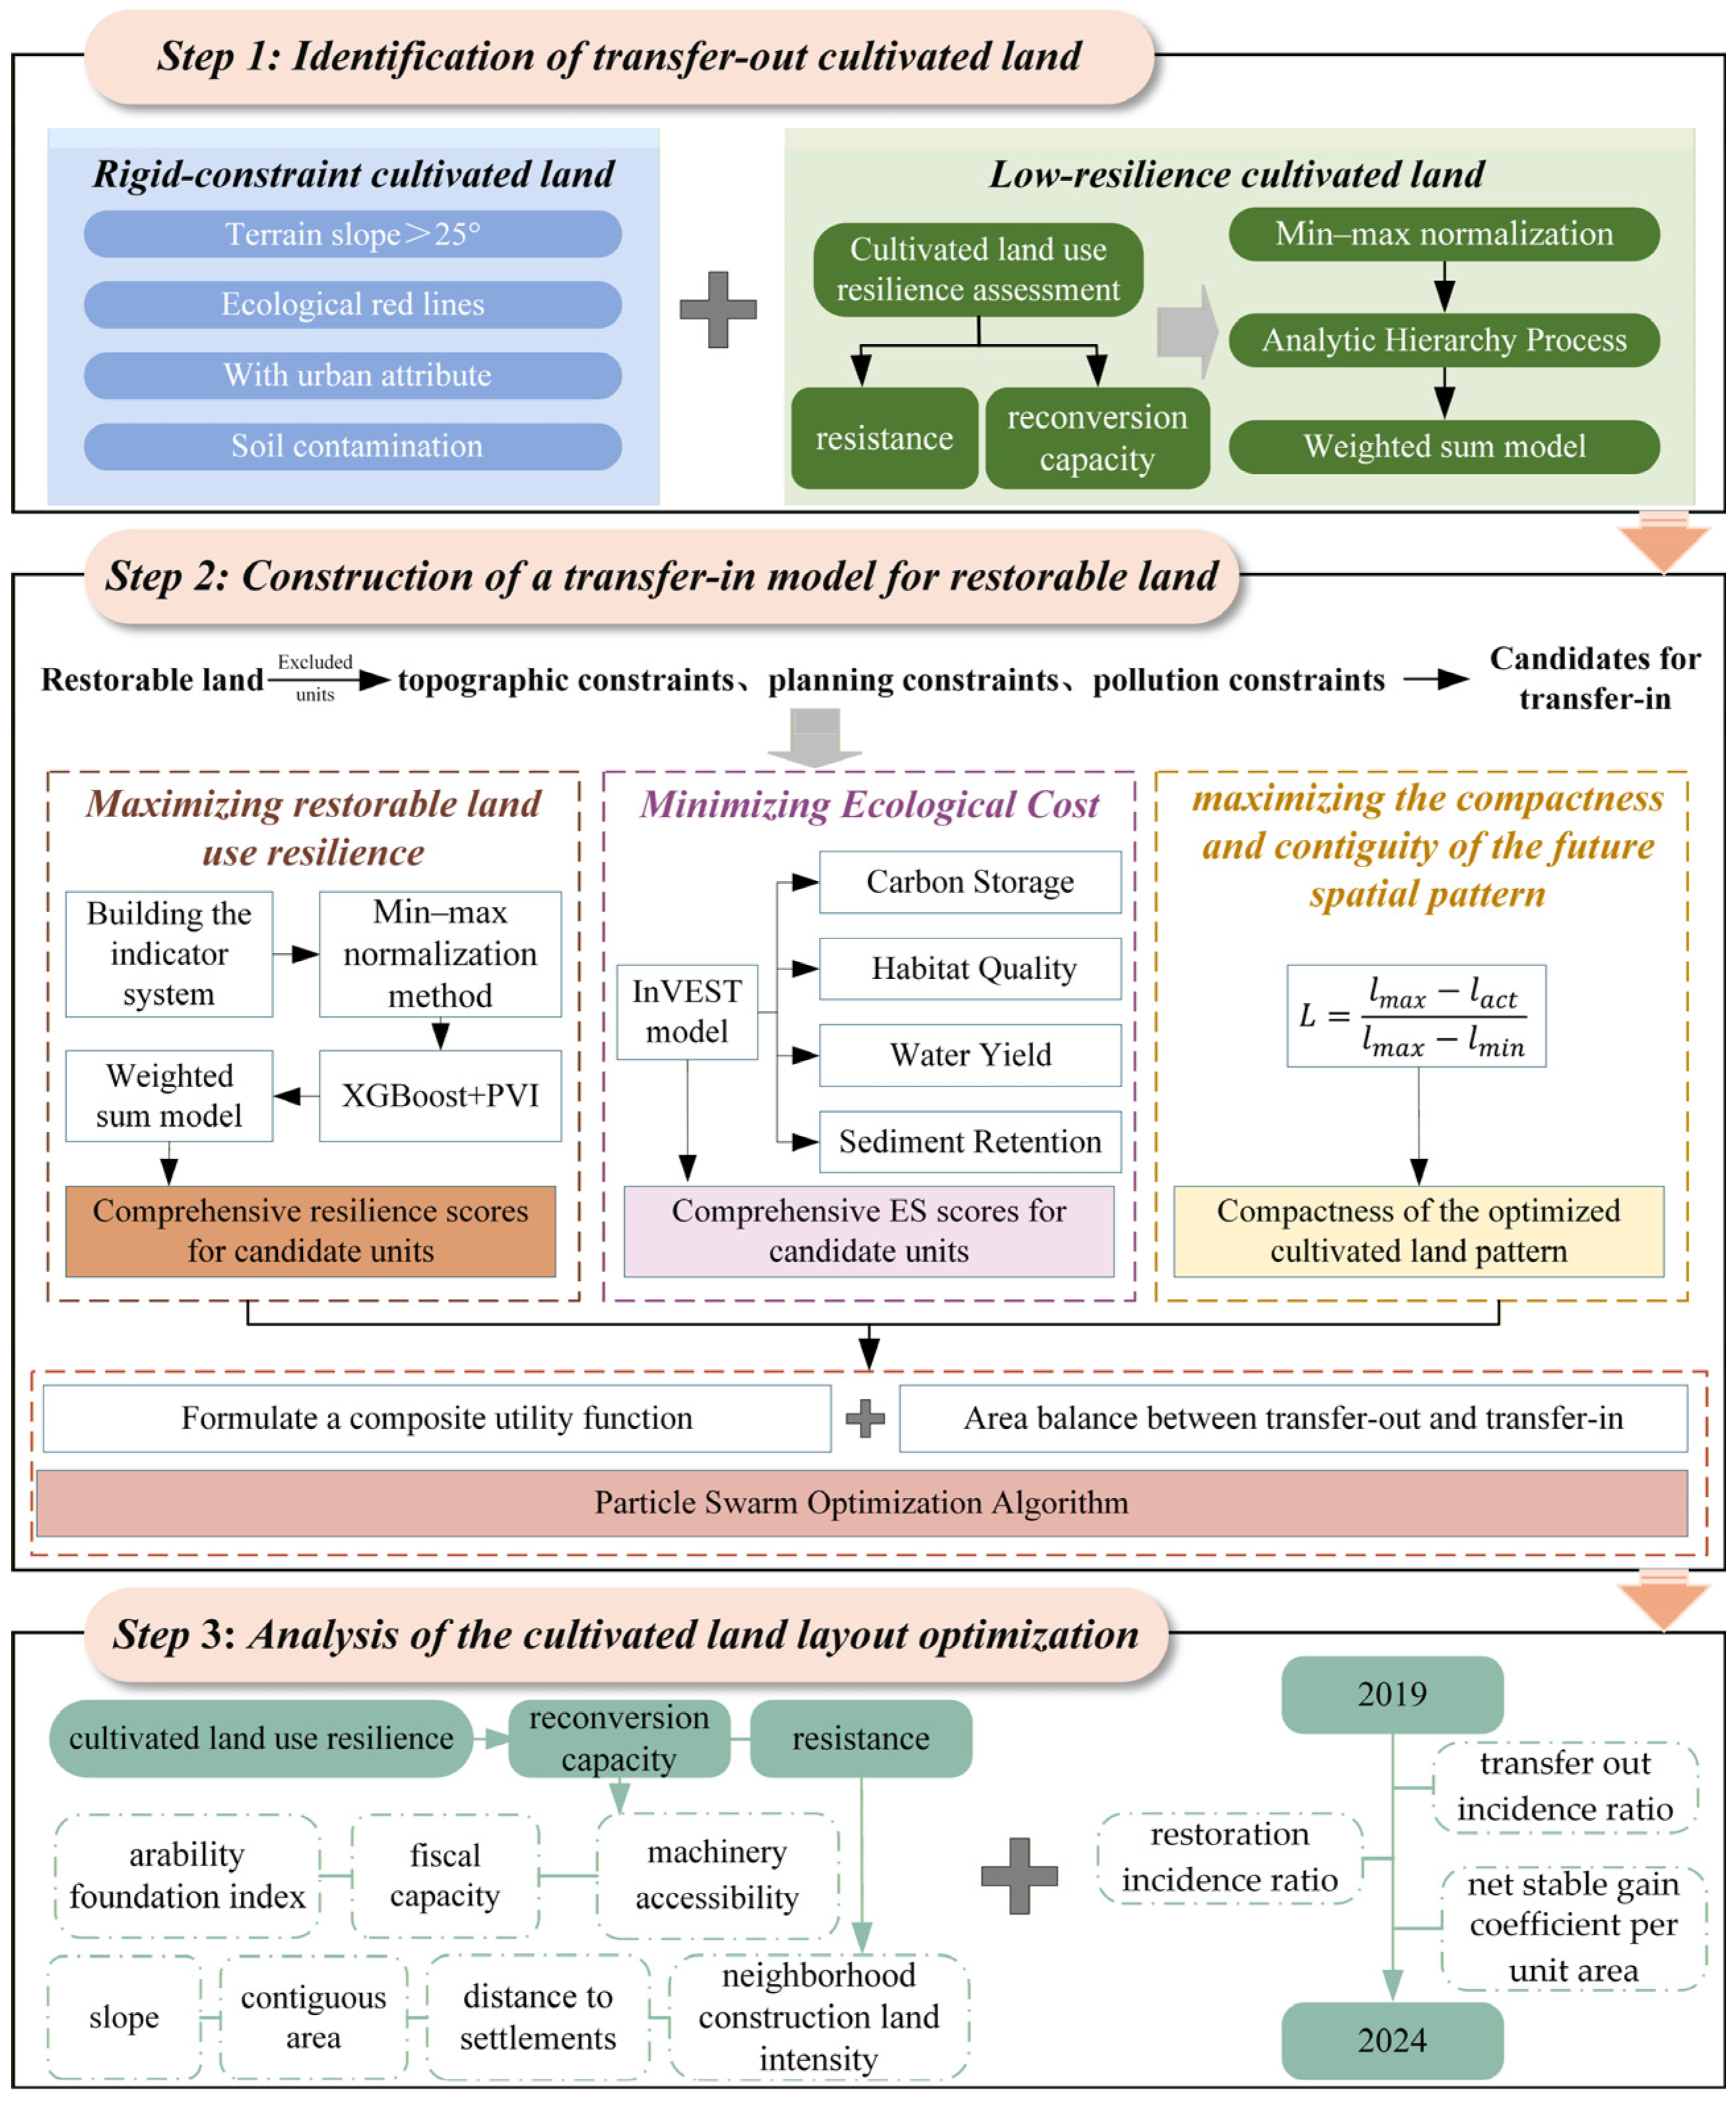
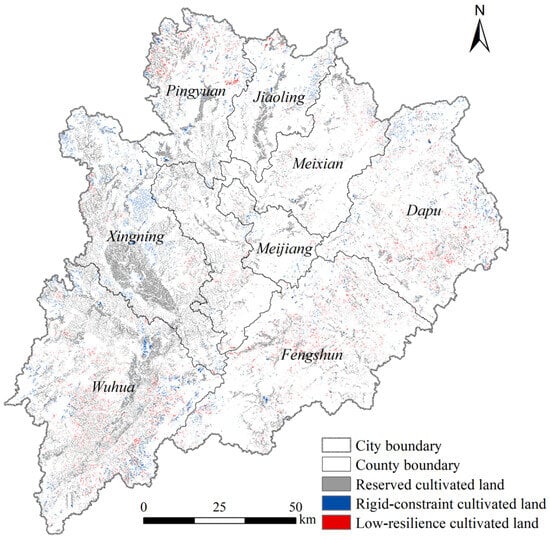
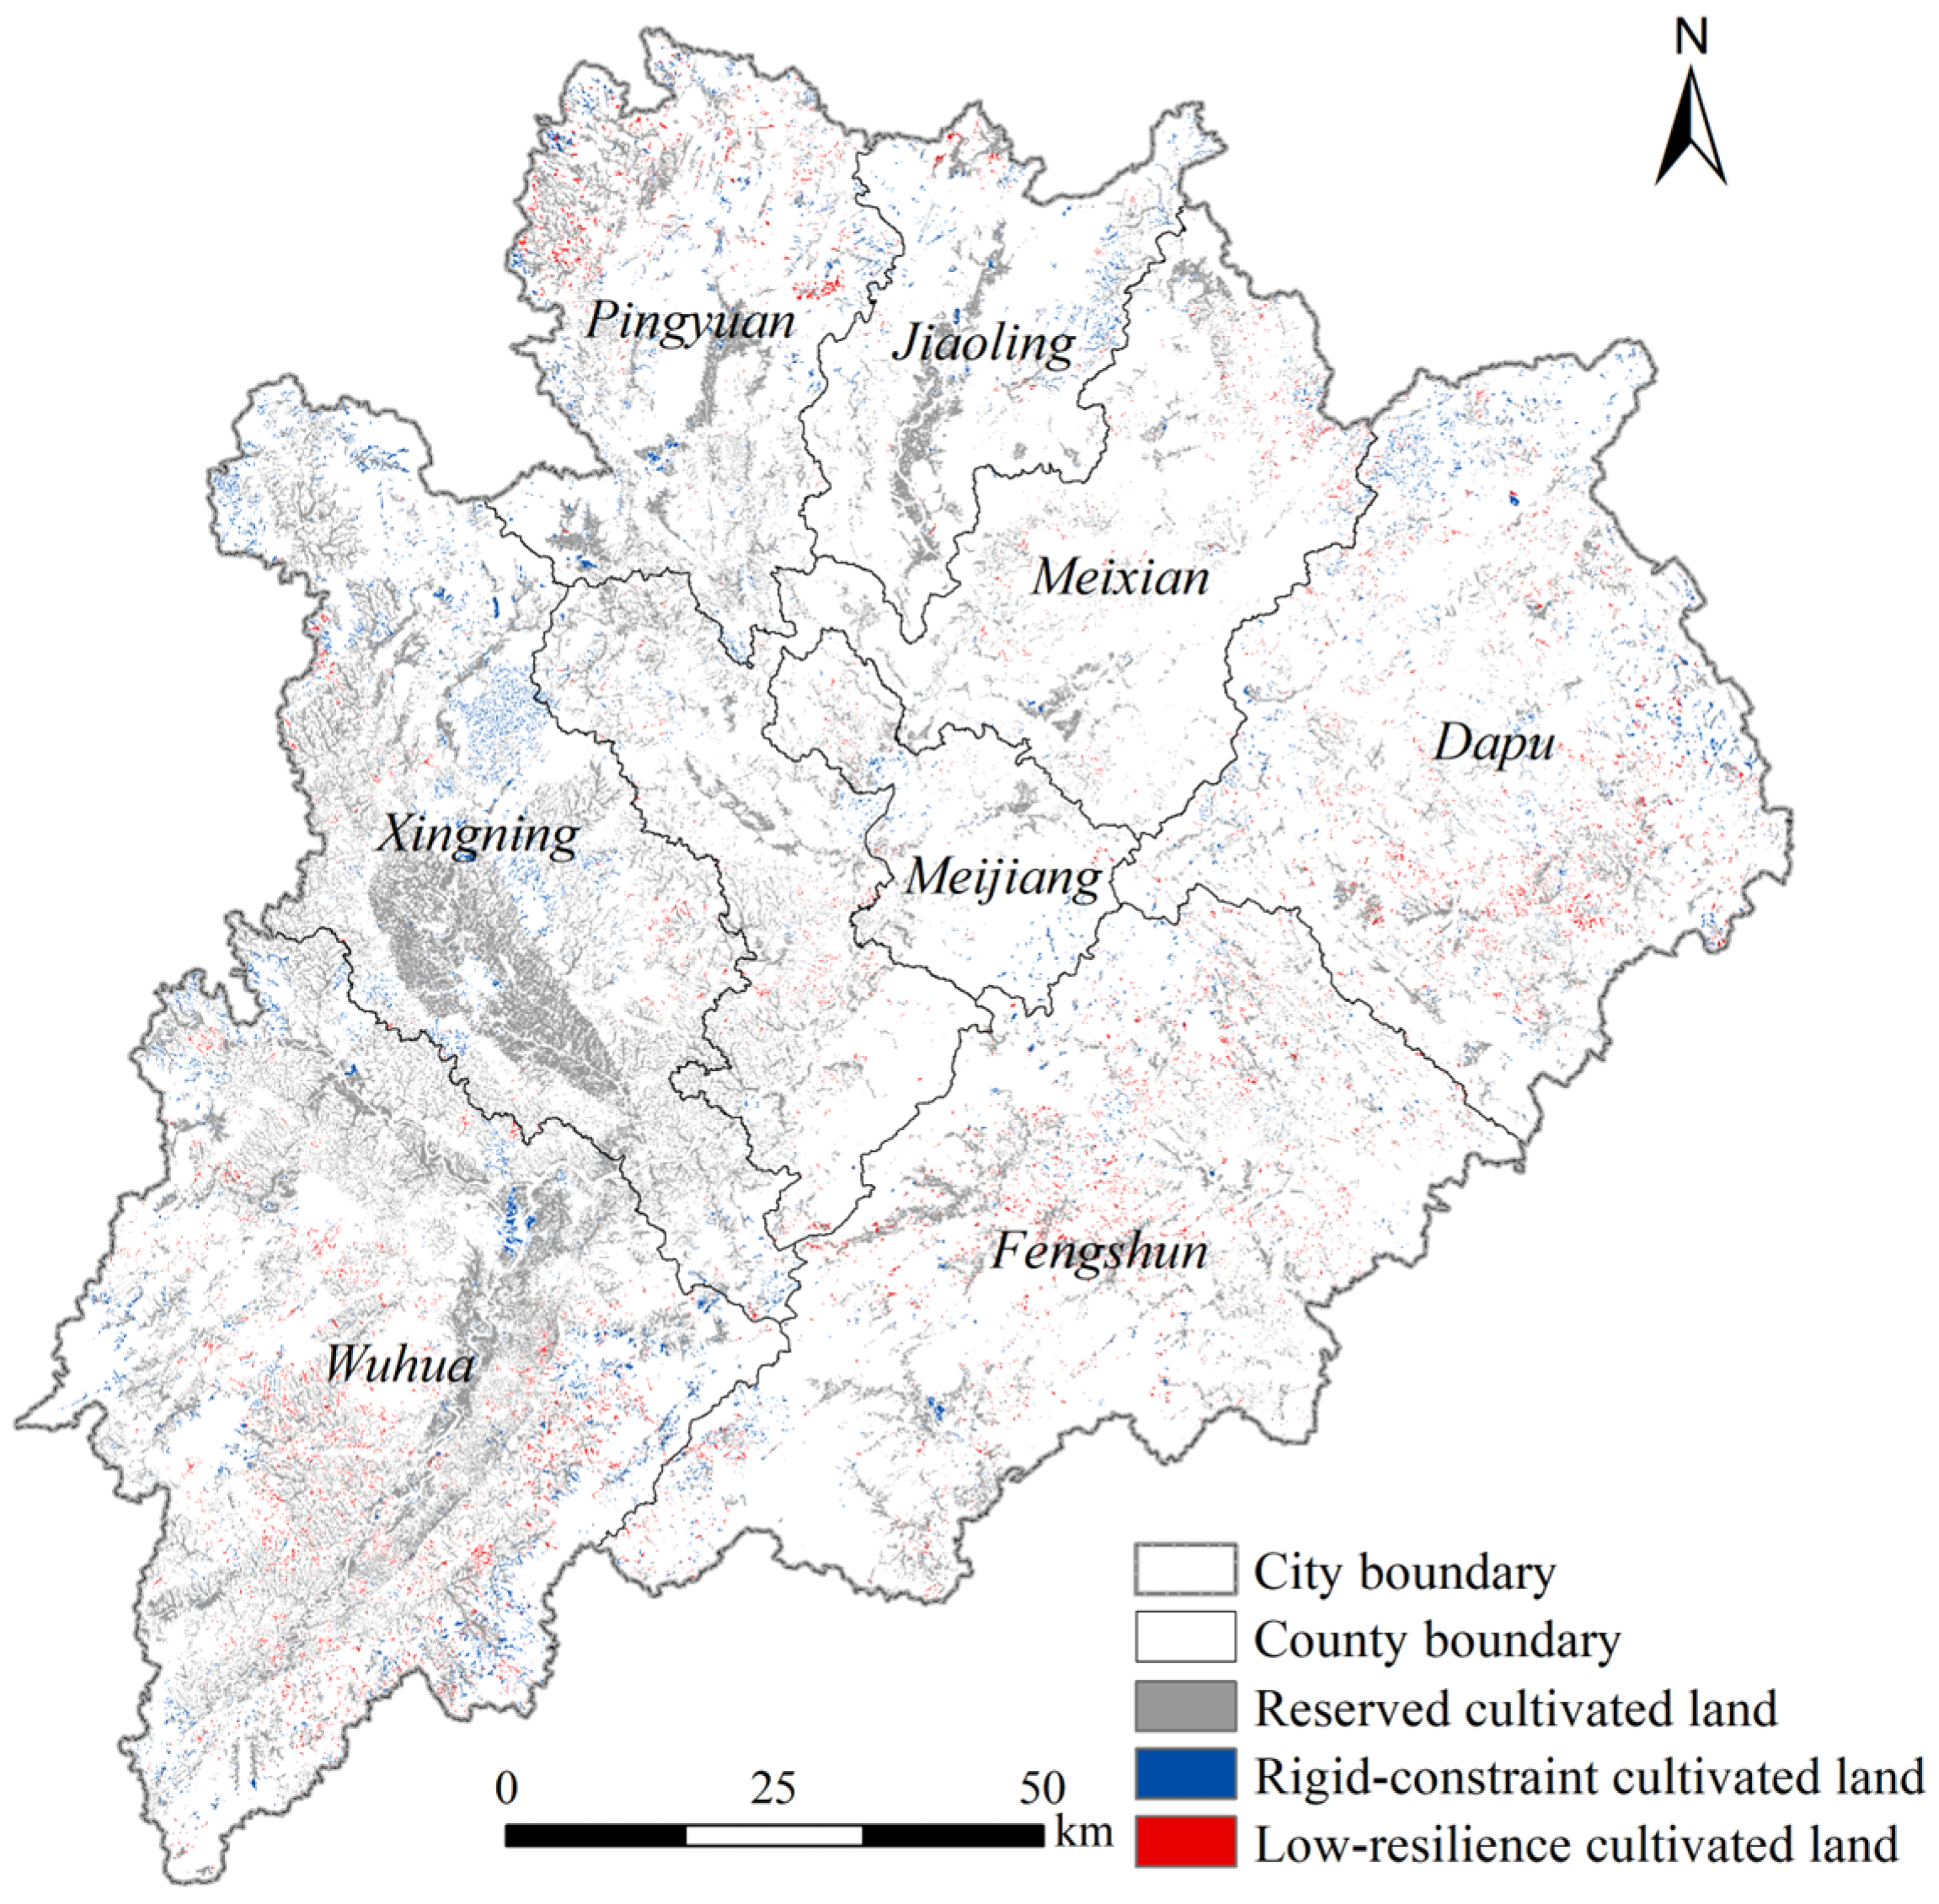
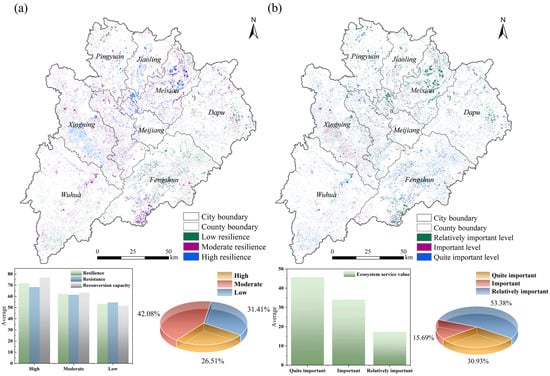
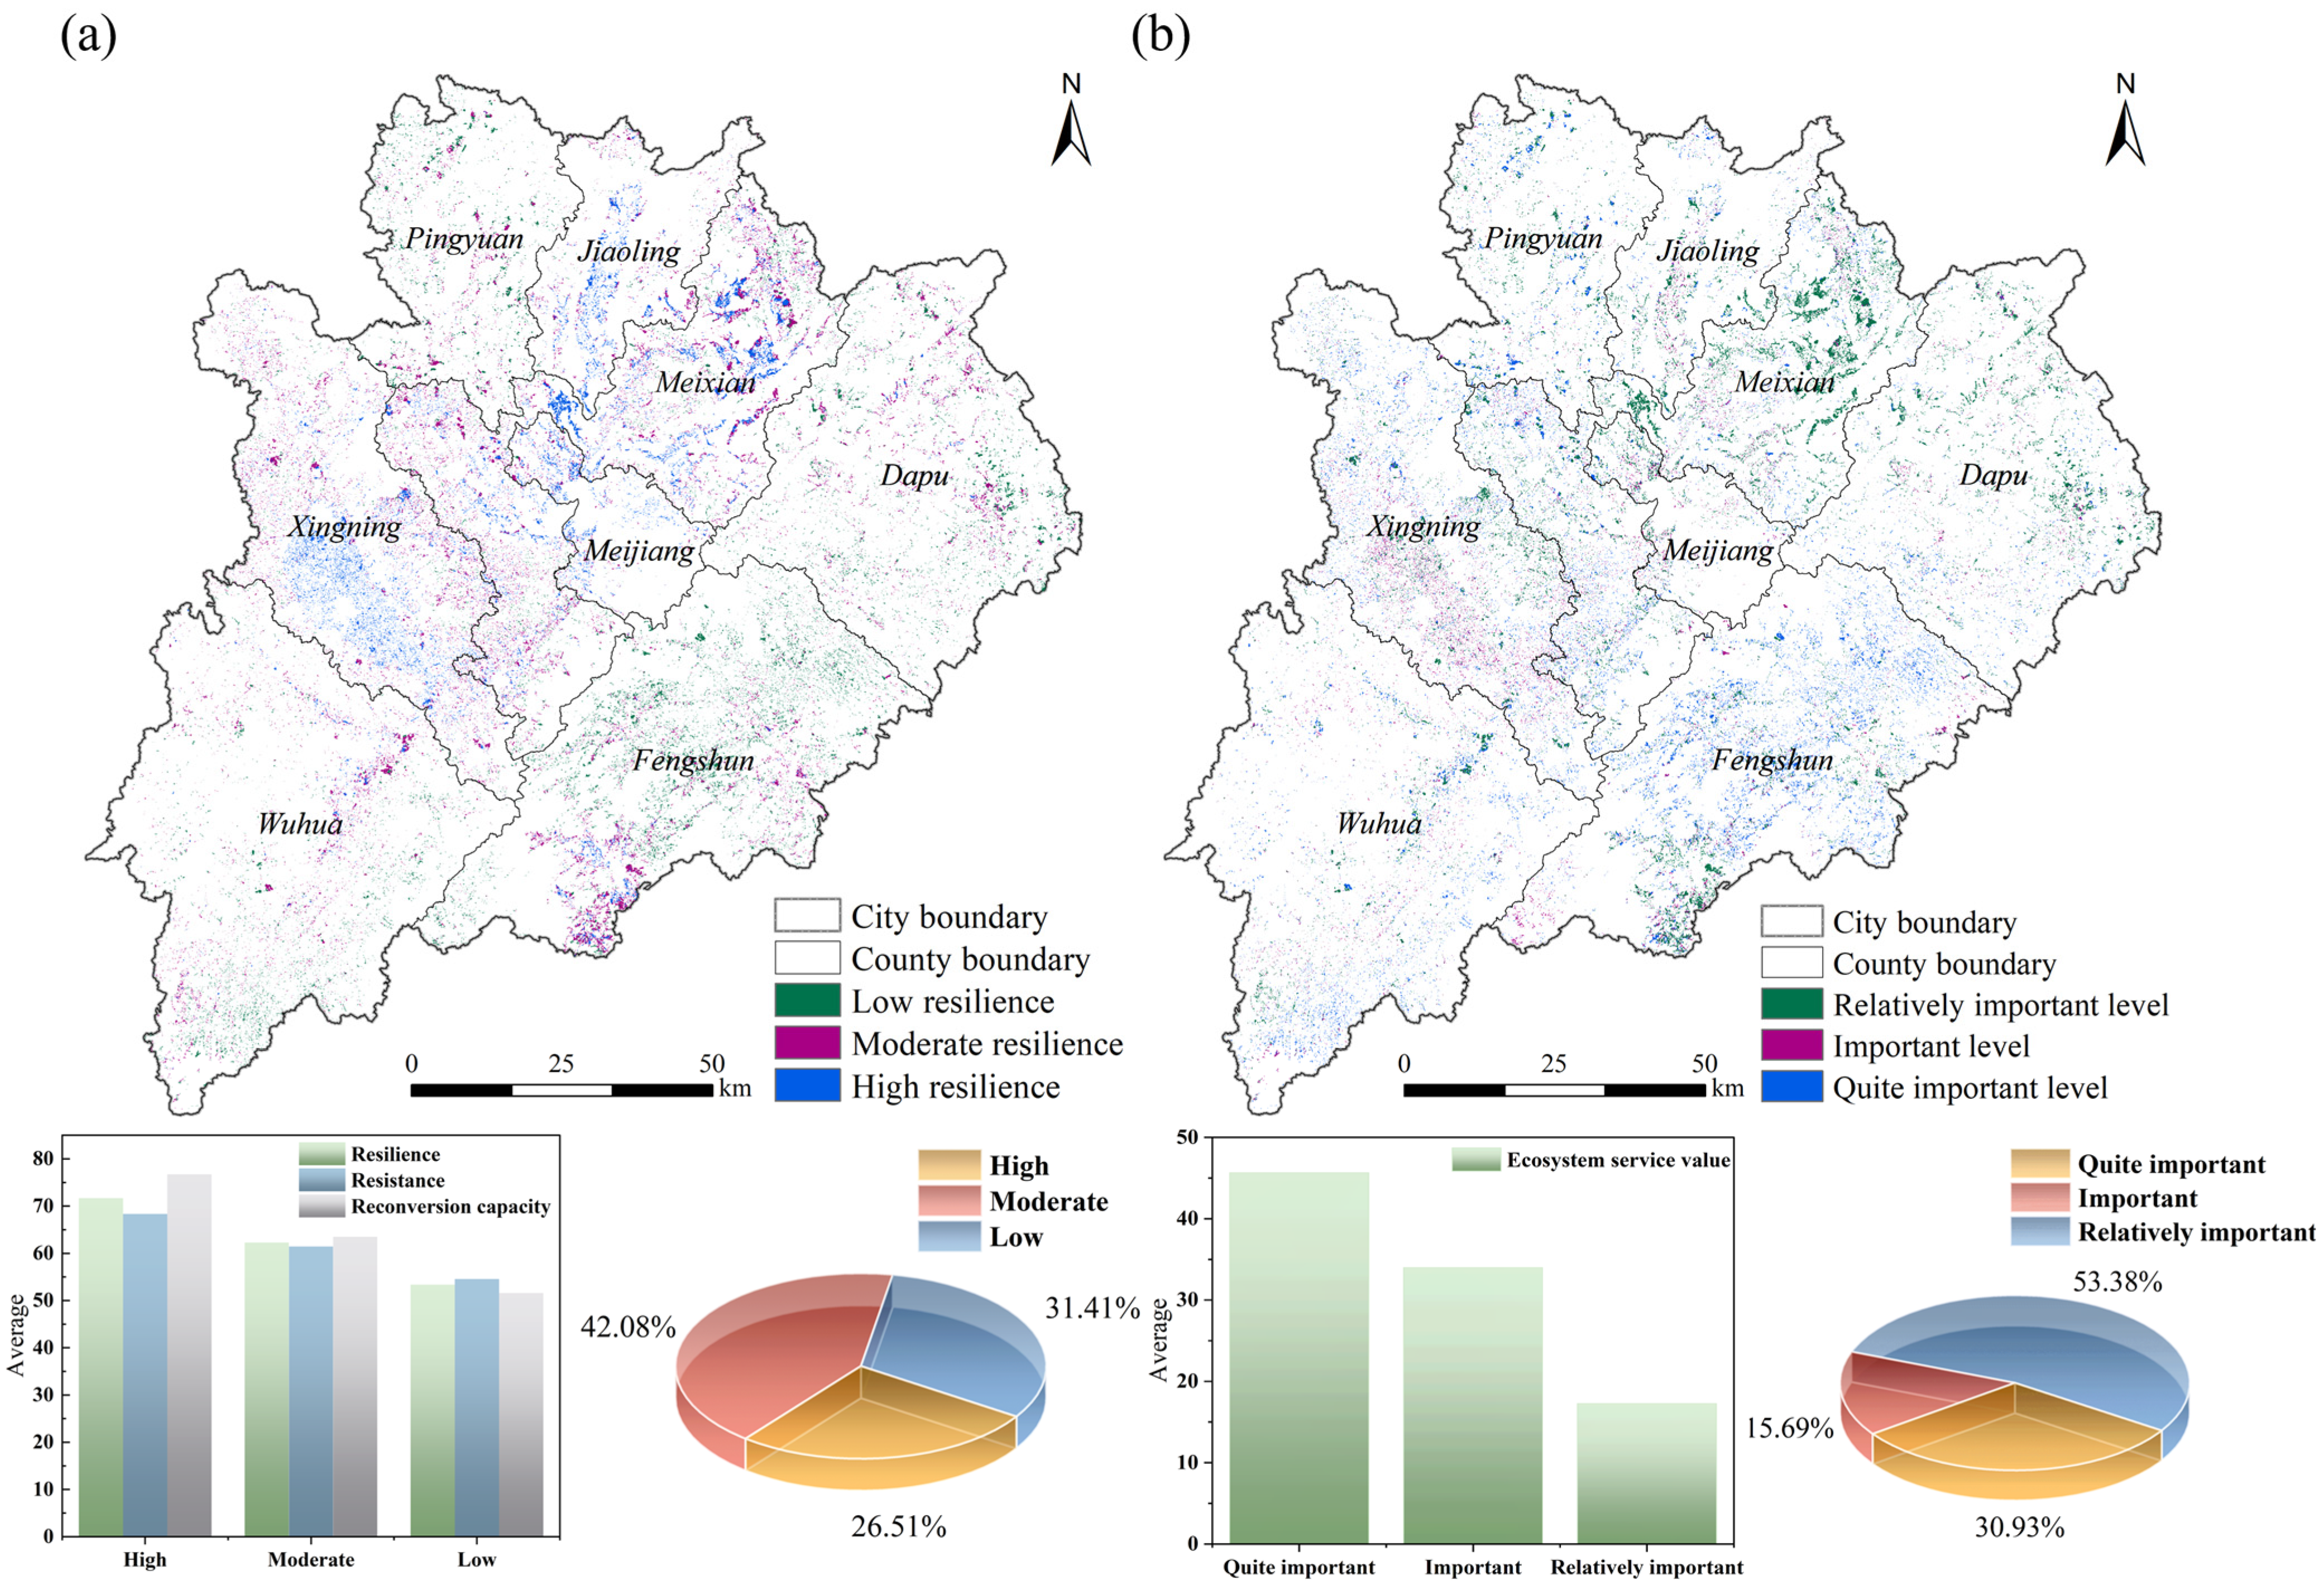
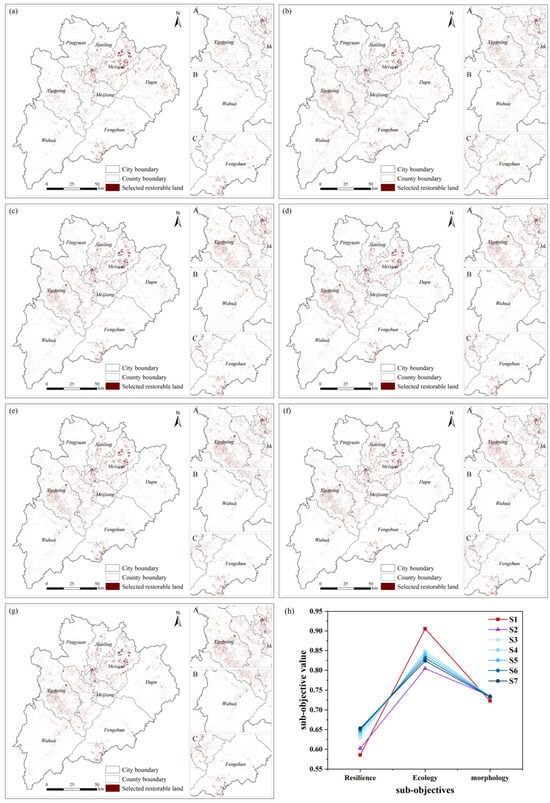
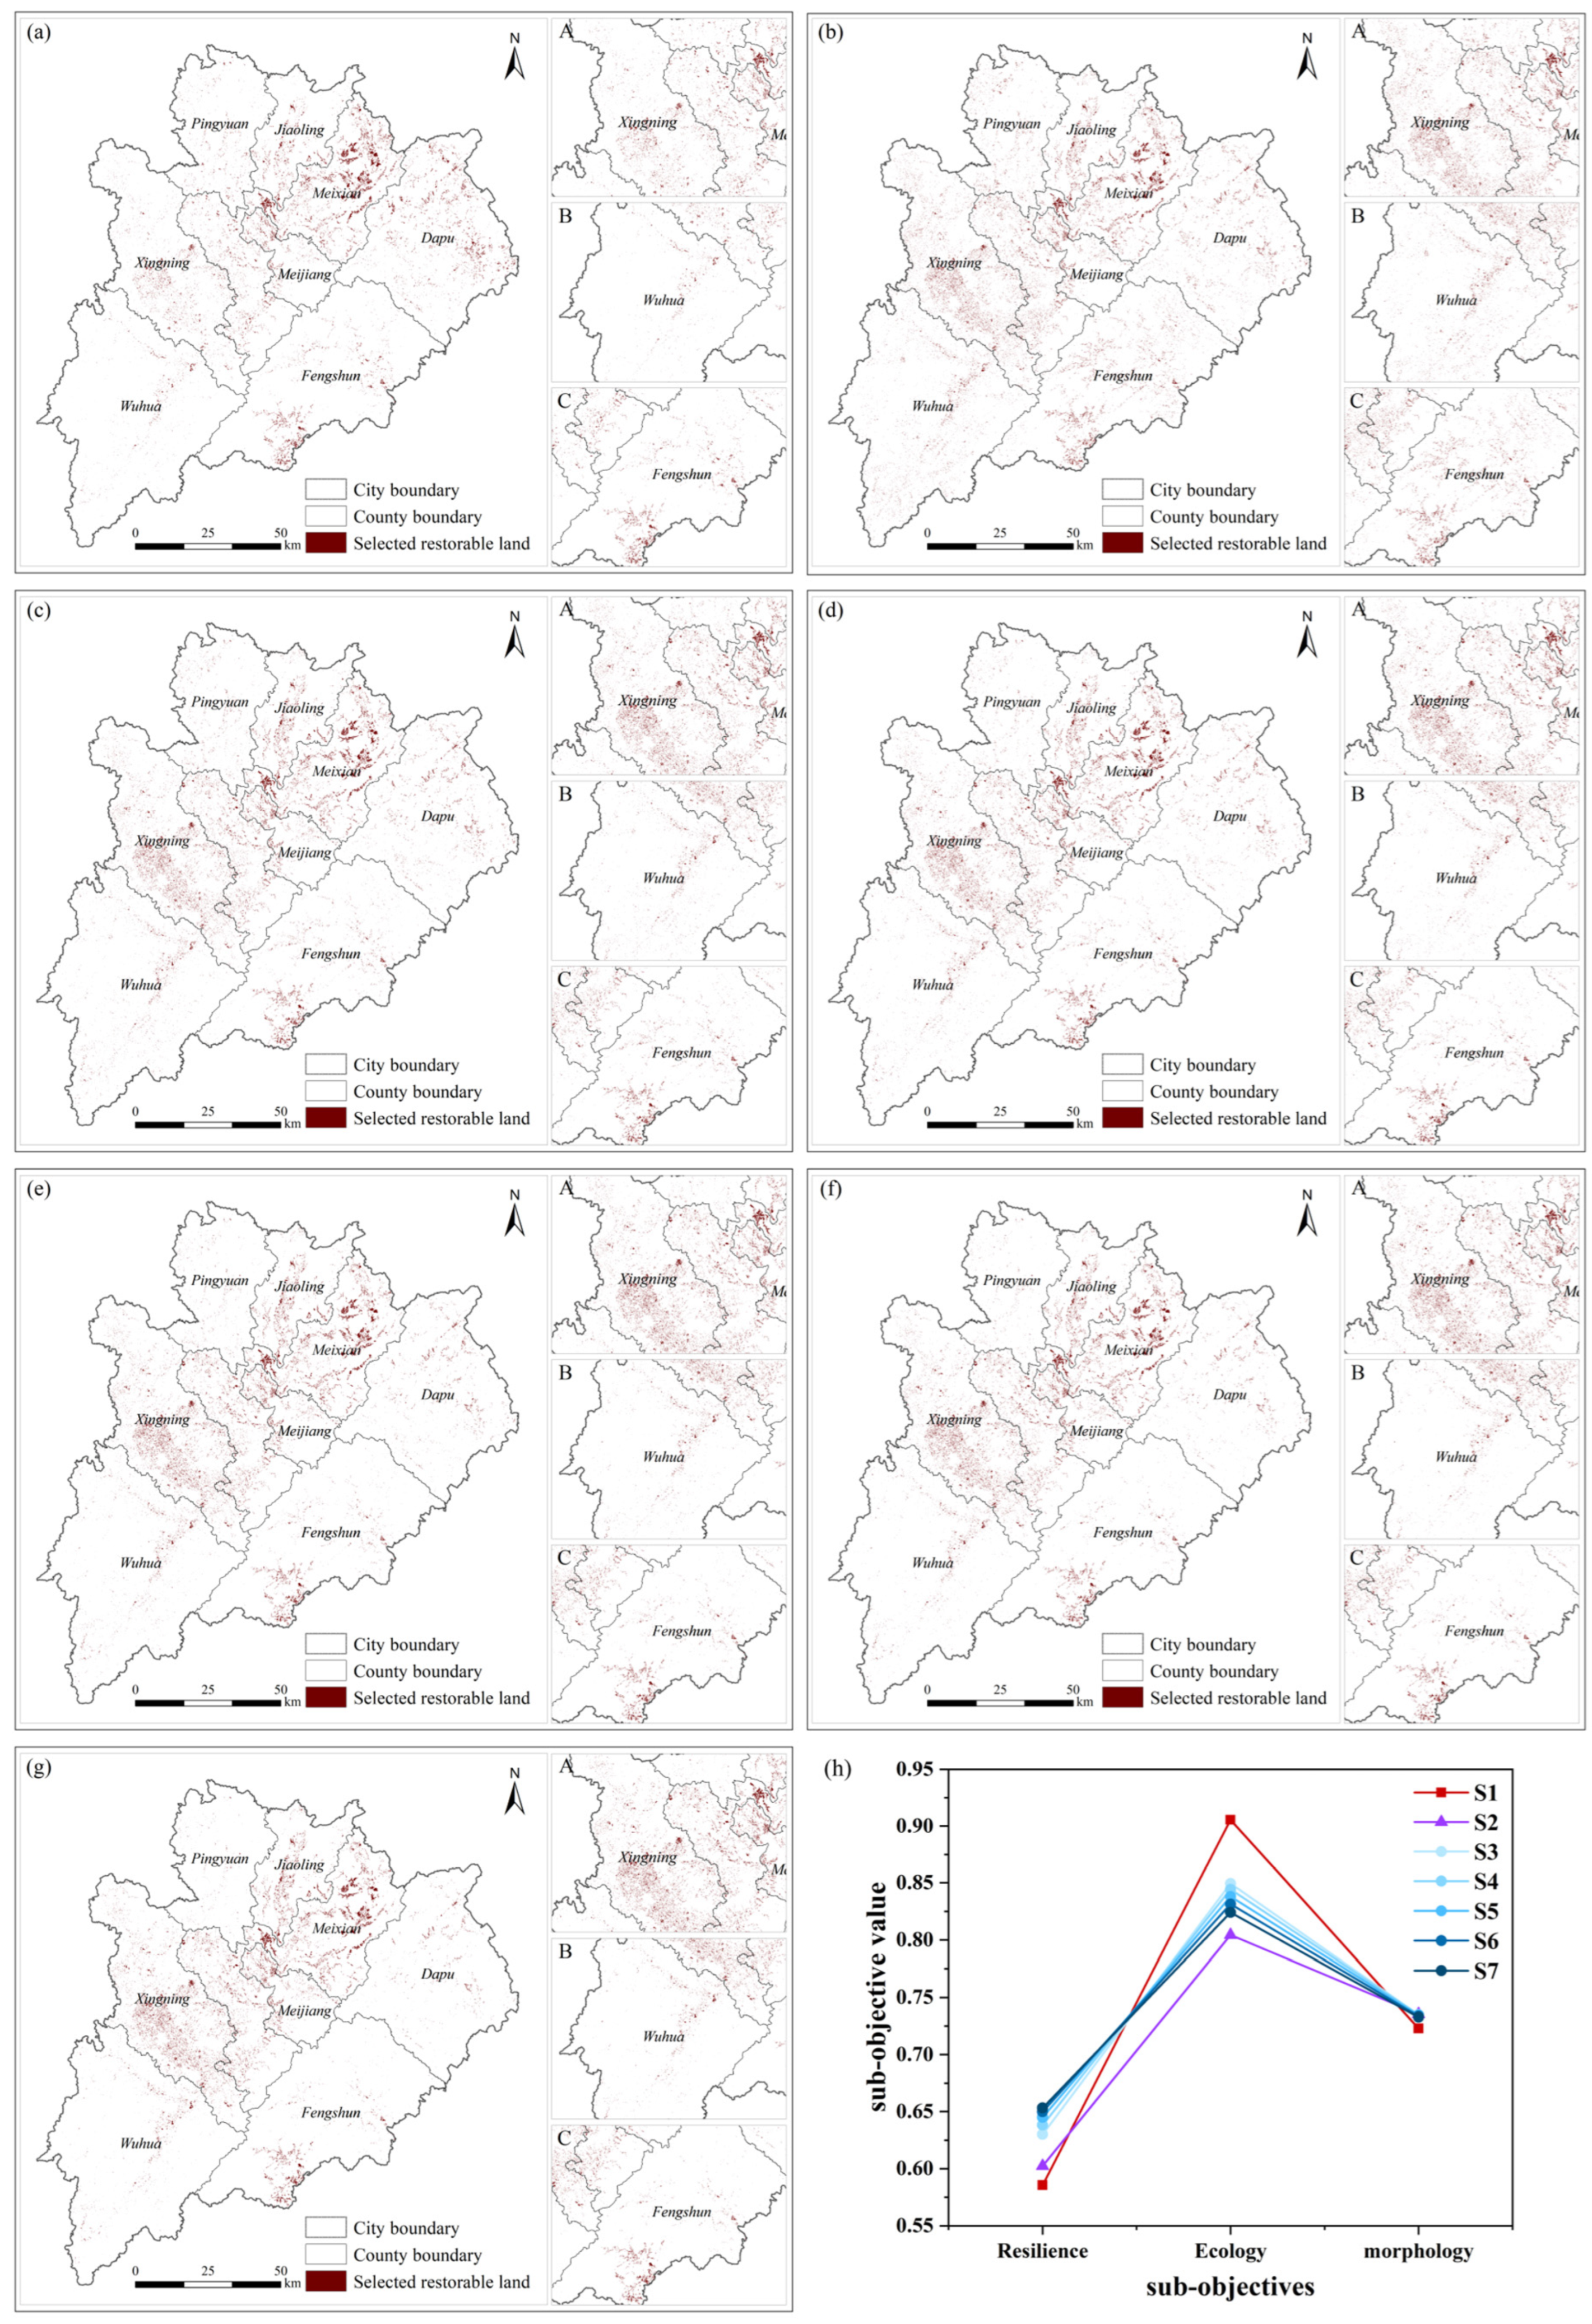
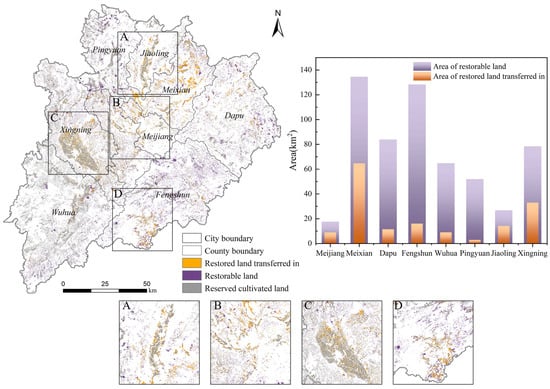
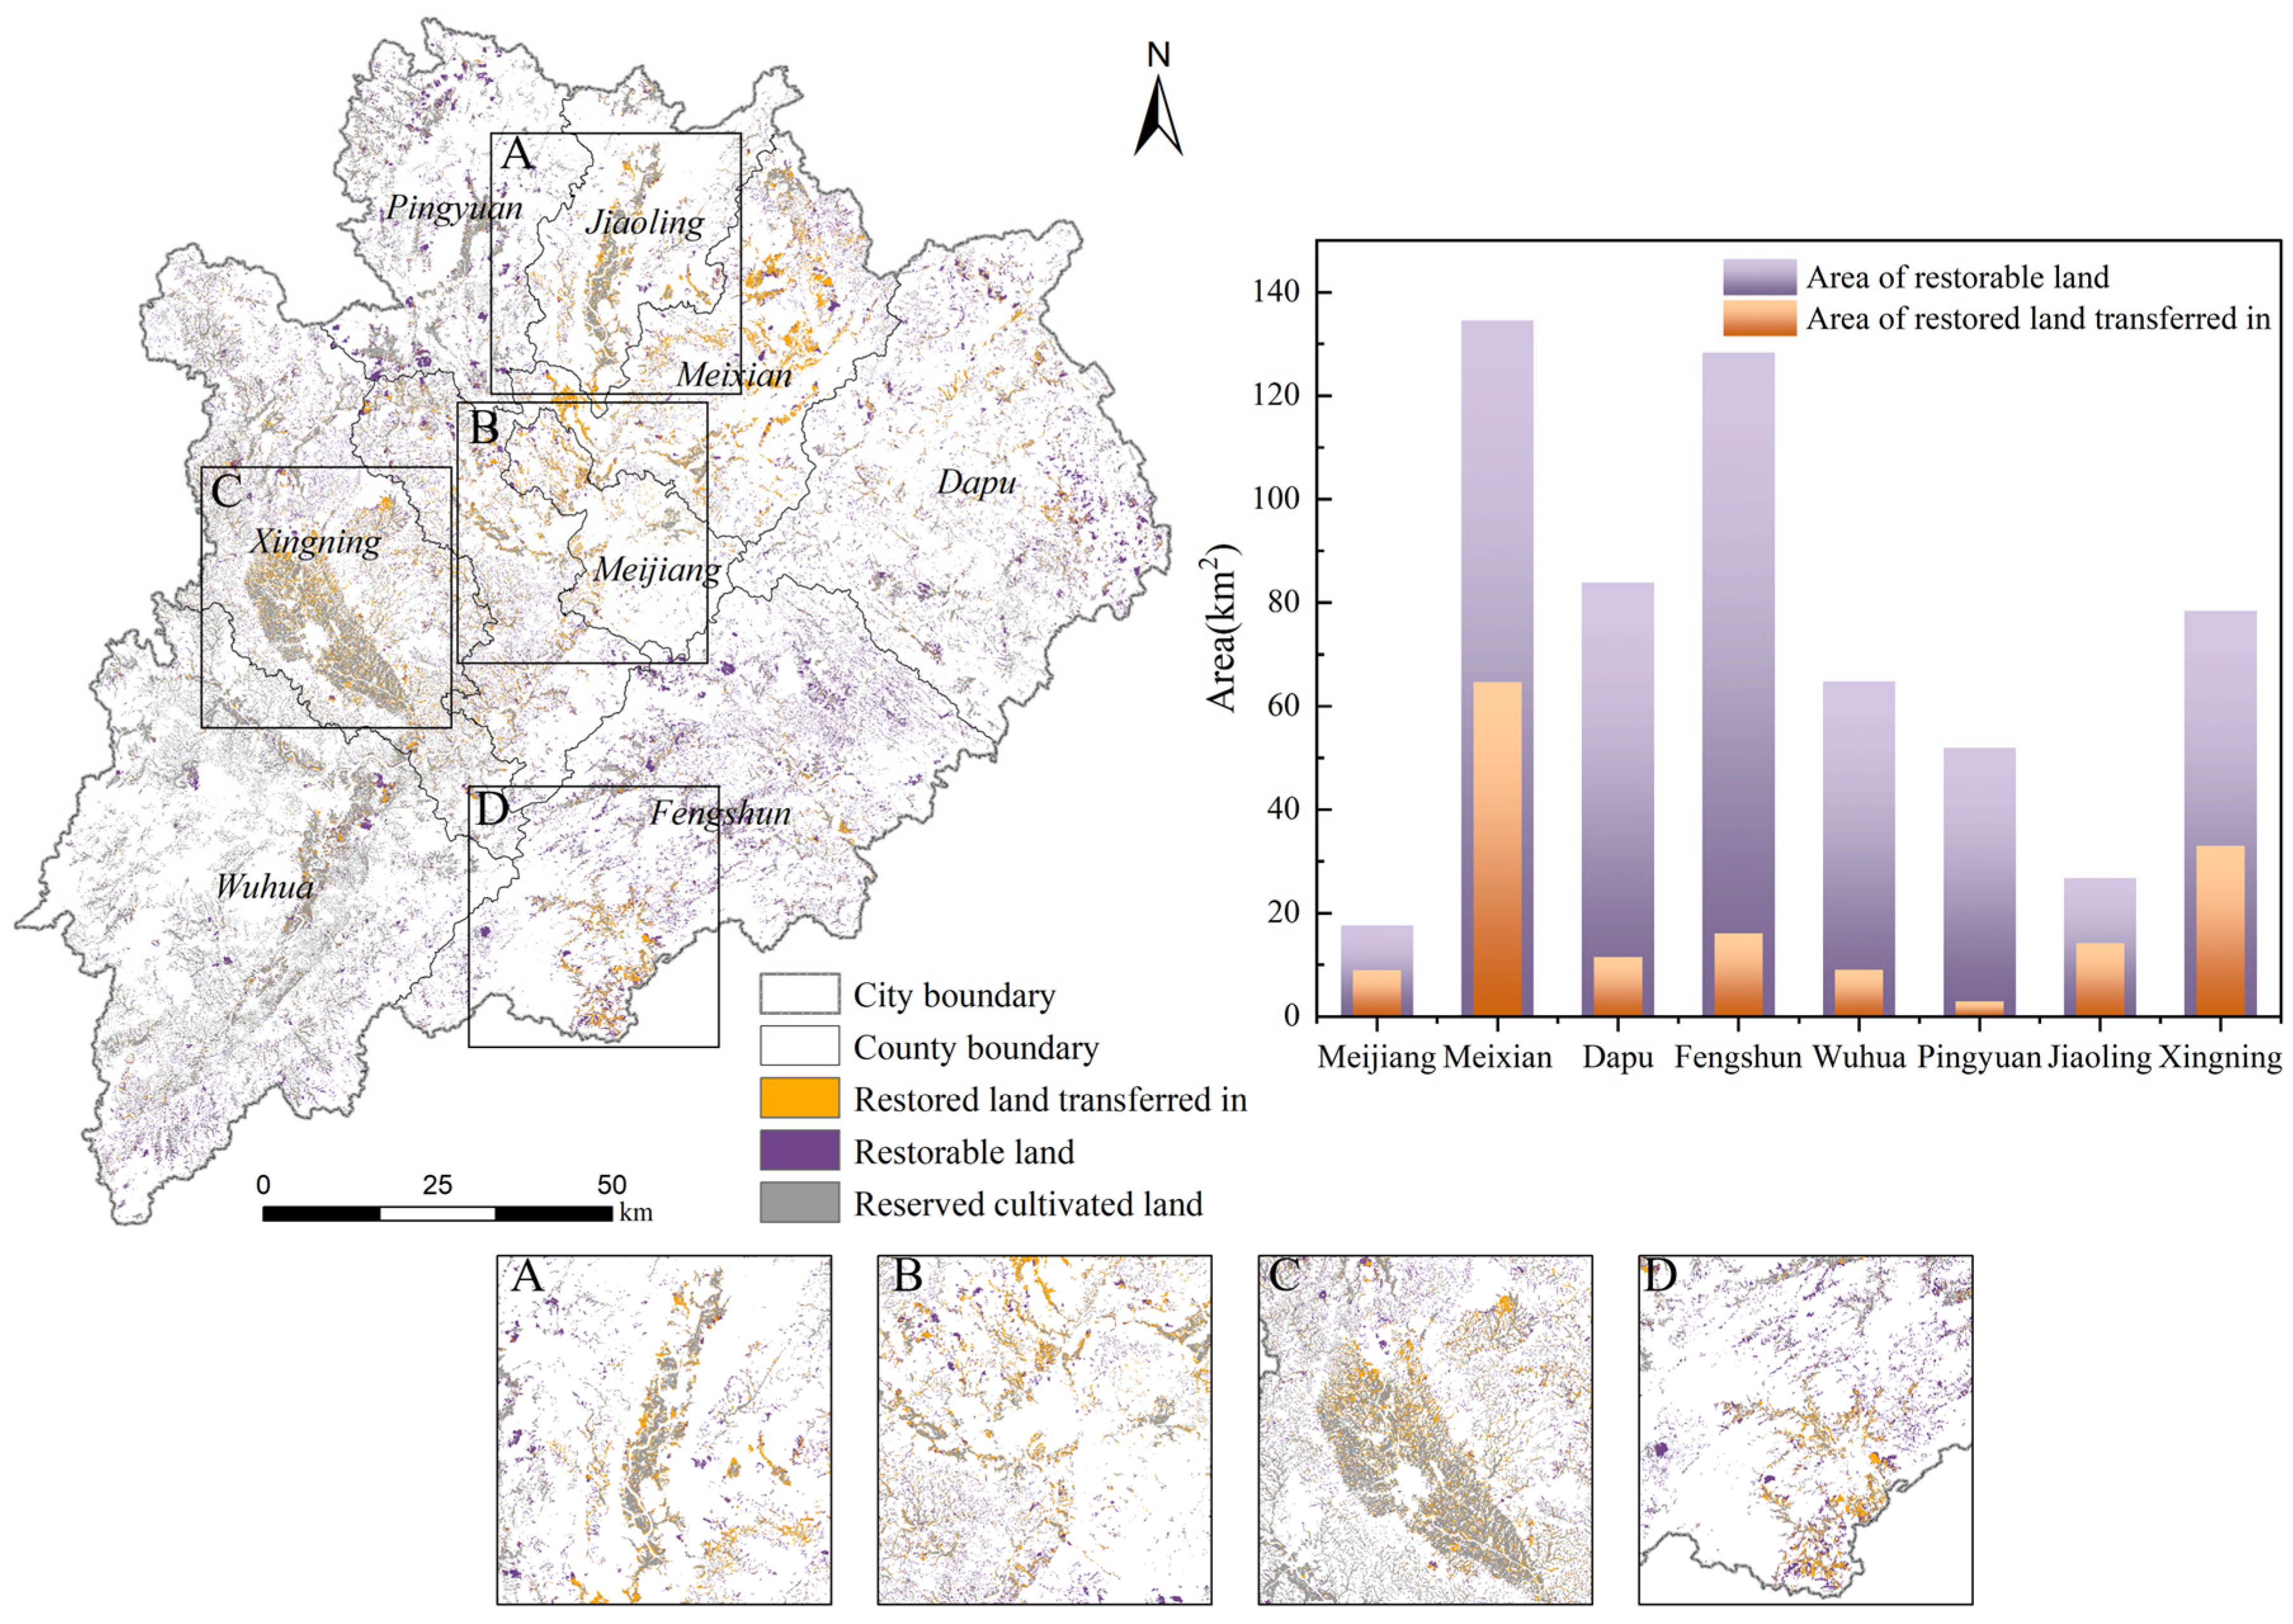
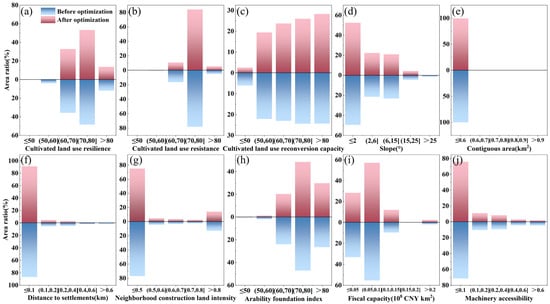
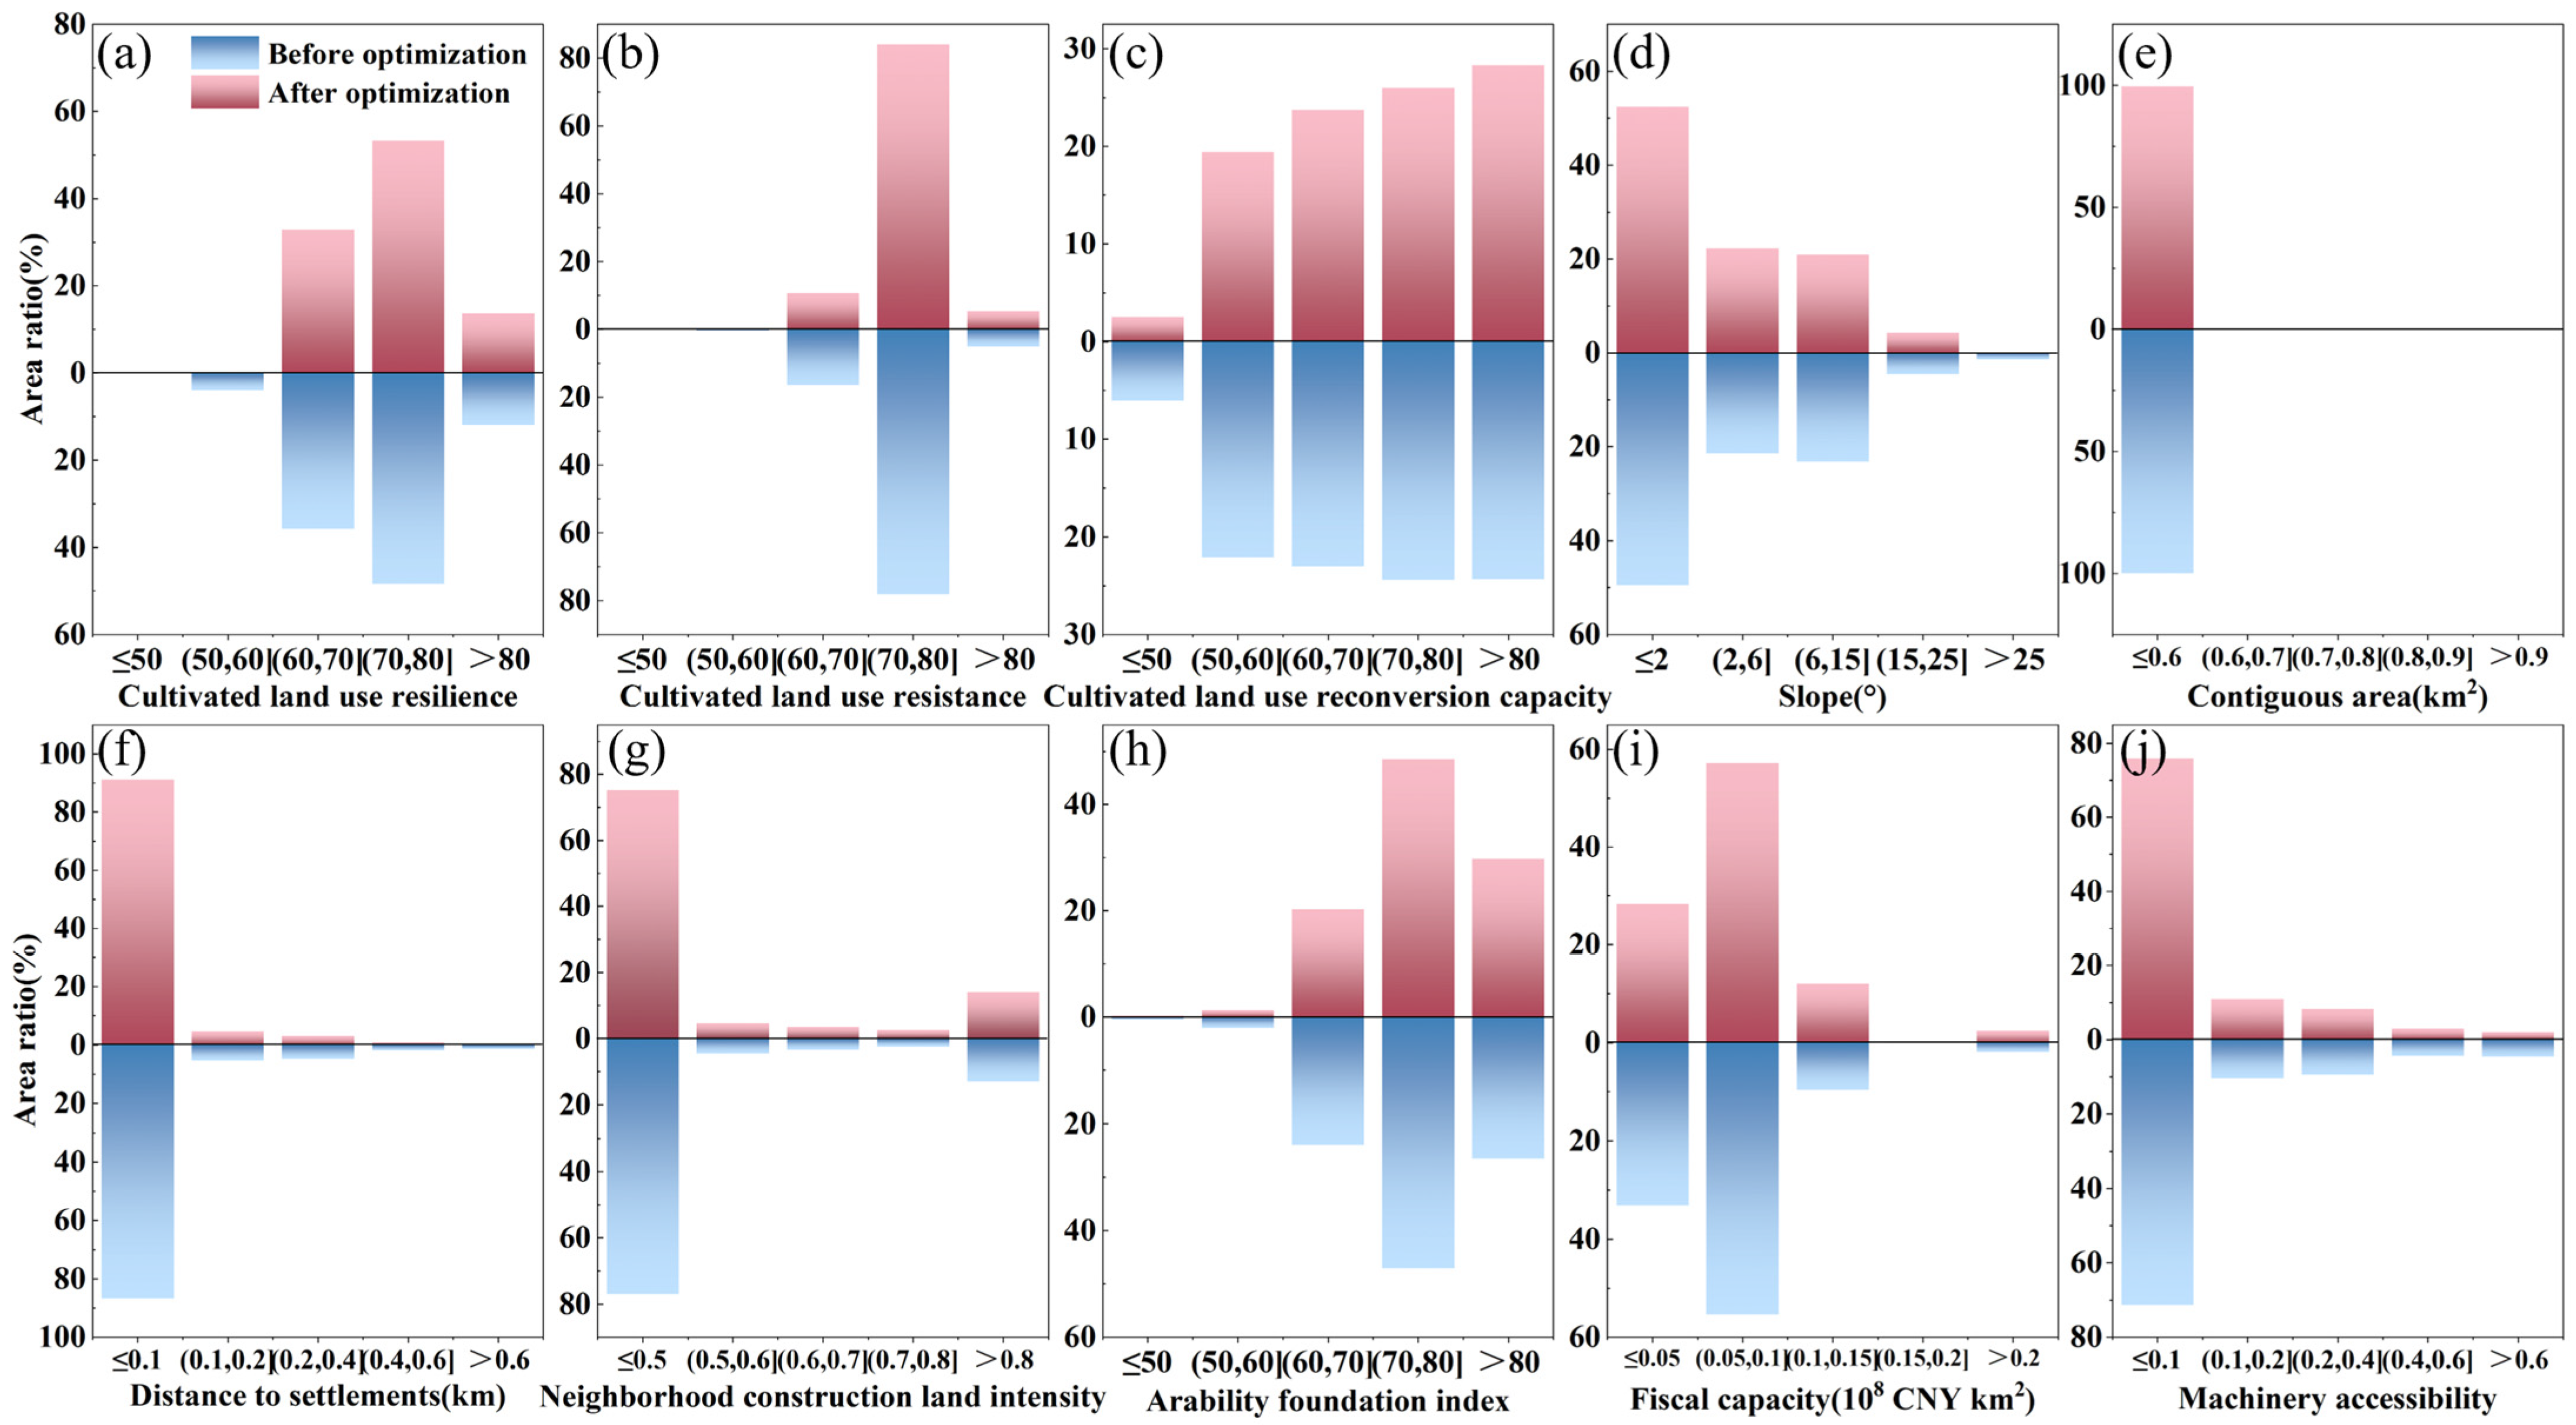

Disclaimer/Publisher’s Note: The statements, opinions and data contained in all publications are solely those of the individual author(s) and contributor(s) and not of MDPI and/or the editor(s). MDPI and/or the editor(s) disclaim responsibility for any injury to people or property resulting from any ideas, methods, instructions or products referred to in the content. |
© 2026 by the authors. Licensee MDPI, Basel, Switzerland. This article is an open access article distributed under the terms and conditions of the Creative Commons Attribution (CC BY) license.