


Abstract
Due to the complex physical properties of peanut threshed materials, existing cleaning equipment faces problems such as poor parameter adaptability, low separation accuracy for irregular impurities, and a prominent trade-off between cleaning efficiency and loss, which constrain the industrial application of peanut pickup combine harvesters. In this study, to address these issues, we designed a cleaning device that couples a positive–negative-pressure dual-airflow system with a vibrating screen, and conducted theoretical analysis and parameter design of its key components. Based on gas–solid two-phase flow theory, a numerical simulation model of the coupled positive–negative-pressure dual-airflow system and vibrating screen cleaning device was developed using the CFD–DEM coupling method. With the vibrating-screen vibration frequency, crossflow fan rotational speed, and impurity-suction fan rotational speed as experimental factors, response surface optimization of cleaning performance was carried out. Through multi-response optimization analysis in Design-Expert 13 software, the optimized parameter combination was determined after engineering rounding as follows: crossflow fan rotational speed of 2104 r/min, vibrating-screen vibration frequency of 6 Hz, and impurity-suction fan rotational speed of 1824 r/min. The experimental results showed that under these parameters, the actual impurity content rate of the prototype was 2.06% and the loss rate was 2.33%, and the regression model demonstrated high prediction accuracy and engineering reliability. This study reveals the cleaning and separation mechanism of peanut threshed materials under the coupled action of the vibrating screen and dual-airflow system, providing a theoretical basis for the parameter design and regulation of cleaning devices in peanut pickup combine harvesters.
1. Introduction
Peanut is an important oilseed and cash crop in China, and its harvesting has long relied on manual labor [1,2,3]. With the intensifying structural shortage of rural labor, developing efficient mechanized harvesting technology has become an inevitable trend [4,5]. A peanut combine harvester can complete multiple operations in a single pass, among which the cleaning device is a core component determining harvest quality and efficiency. The currently dominant air–screen coupled cleaning scheme has been widely applied and extensively studied in grain harvesting [6,7]. However, due to the special physical properties of peanut pods and plant mixtures, existing equipment faces the following bottlenecks under complex field conditions: with fixed parameters, it is difficult to match airflow velocity and screen frequency with the real-time dynamic changes in moisture content and impurity content, often leading to a dilemma between incomplete cleaning and seed splash loss; the separation accuracy for irregular impurities such as soil-adhered pods and stem-entangled small pods is insufficient, resulting in a relatively high impurity residue rate; the optimization space for screen hole design and vibration parameters is limited, and the contradiction between cleaning efficiency and pod loss is prominent, making it difficult to simultaneously achieve anti-blocking and loss reduction; and uneven material distribution and soil adhesion lead to weak overall adaptability. These technical bottlenecks not only increase users’ secondary cleaning costs and processing losses, but also fundamentally constrain the industrial application of peanut combine harvesters.
Scholars at home and abroad have conducted extensive research on crop cleaning. Mekonnen et al. [8] revealed the mechanism by which the fan airflow outlet structure affects cleaning performance through CFD simulation and bench tests. Badretdinov et al. [9] established a dynamic model of an air–screen cleaning system, clarified the key motion parameters of the screen body and the typical range of airflow velocity, and provided a parameter basis for gas–solid two-phase flow simulation. In China, Gao Lianxing et al. [10] proposed a composite cleaning scheme combining dual air suction inlets with a vibrating screen based on differences in the suspension characteristics of peanut mixtures, and determined the optimal working parameters through experiments. Wang Bing et al. [11] designed an overlapping spring-finger vibrating screen for a semi-feeding peanut combine harvester, and achieved simultaneous reductions in both impurity content and material loss through optimization. Yu Zhaoyang et al. [12] designed an air–screen composite cleaning mechanism, confirmed that fan rotational speed, screen amplitude, and frequency significantly affect cleaning performance, and effectively alleviated screen surface blockage and vine entanglement.
Although existing studies have made some progress in the field of peanut cleaning, core bottlenecks such as poor dynamic adaptability and insufficient separation accuracy for irregular impurities have not yet been overcome. In particular, there is still considerable room for improvement in the collaborative optimization of airflow organization.
To address the above bottlenecks, this paper focuses on the core of the cleaning device and proposes a new configuration of a positive–negative-pressure-collaborative-dual-airflow-system–vibrating-screen coupled cleaning device. The device is designed at the whole-machine level, with the screen structure, the positive- and negative-pressure fans, their spatial layout, and their operating parameters all designed as a coupled system, so as to overcome the functional limitations of traditional airflow fields: the positive-pressure airflow is delivered to the vibrating screen to disperse the material and convey impurities backward, while actively separating light impurities; the negative-pressure suction airflow is used to assist impurity removal, thereby achieving active diversion and precise removal of impurities from the airflow source. This paper first describes the overall structural design concept and collaborative working mechanism of the device, and then adopts the CFD–DEM coupling method [13,14] to carry out systematic simulation analysis and multi-objective optimization of the core structural parameters of the dual-airflow system and the internal flow field characteristics. Finally, field experiments are conducted to verify the rationality of the design principle and its performance potential. This study aims to develop a new generation of peanut cleaning devices with high efficiency, low loss, and strong adaptability, thereby providing support for high-quality cleaning operations of peanut pickup harvesters.
2. Materials and Methods
2.1. Structure and Working Principle of the Cleaning Device
2.1.1. Overall Layout
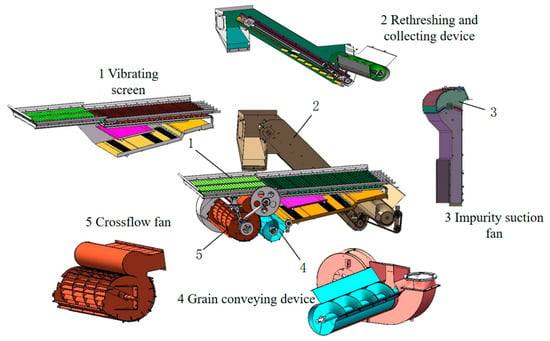
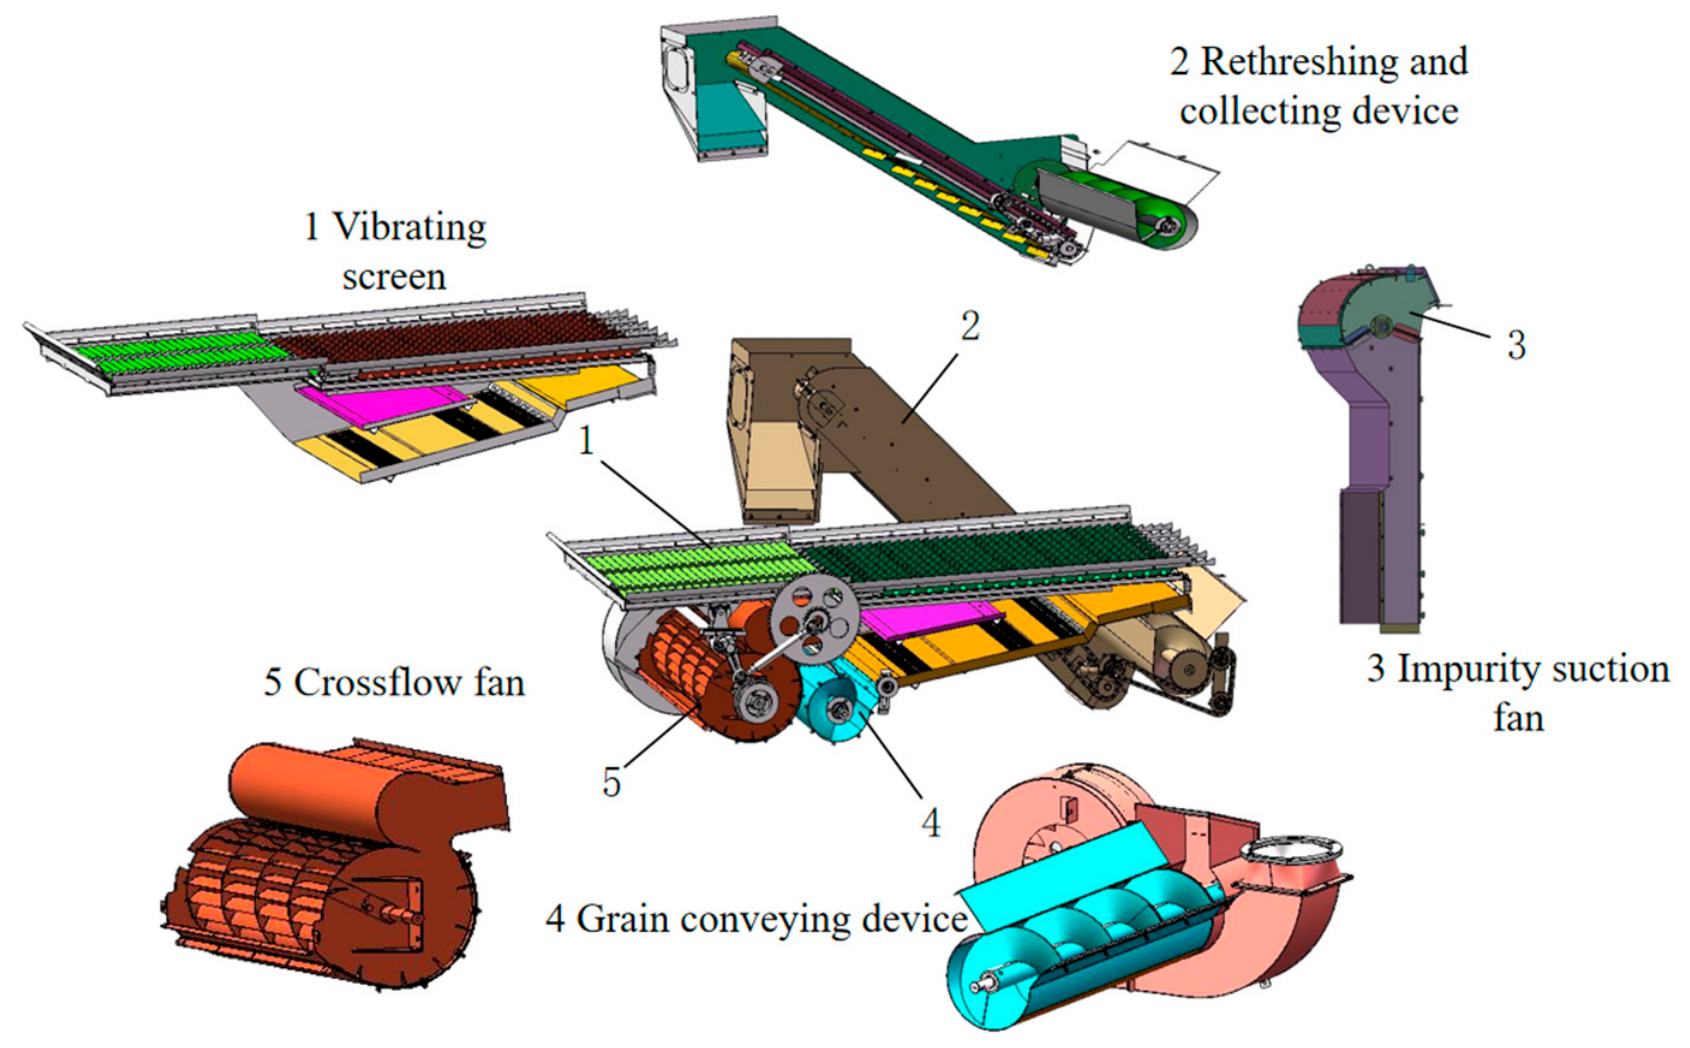
The cleaning device is a core component of the peanut pickup combine harvester, and its overall layout and connection relationships are shown in Figure 1. During operation, the pod–vine mixture harvested by the header enters the cleaning system through the threshing device, where pod–impurity separation is completed under the collaborative action of positive-pressure blowing and negative-pressure suction. The cleaned pods are conveyed to the pod collection tank by an auger, while impurities are discharged into the grass collection box, and un-cleaned materials enter the re-threshing device for secondary cleaning.
Figure 1.
Overall structure of peanut cleaning device coupled with positive–negative-pressure dual-airflow system and vibrating screen.
2.1.2. Device Structure and Working Mechanism
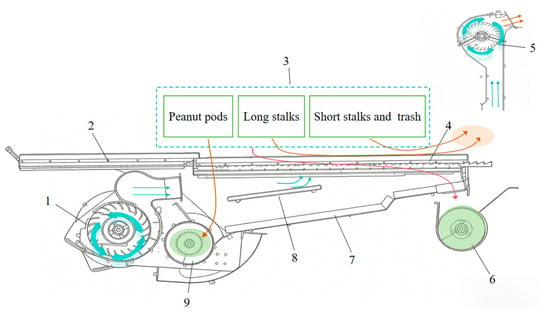
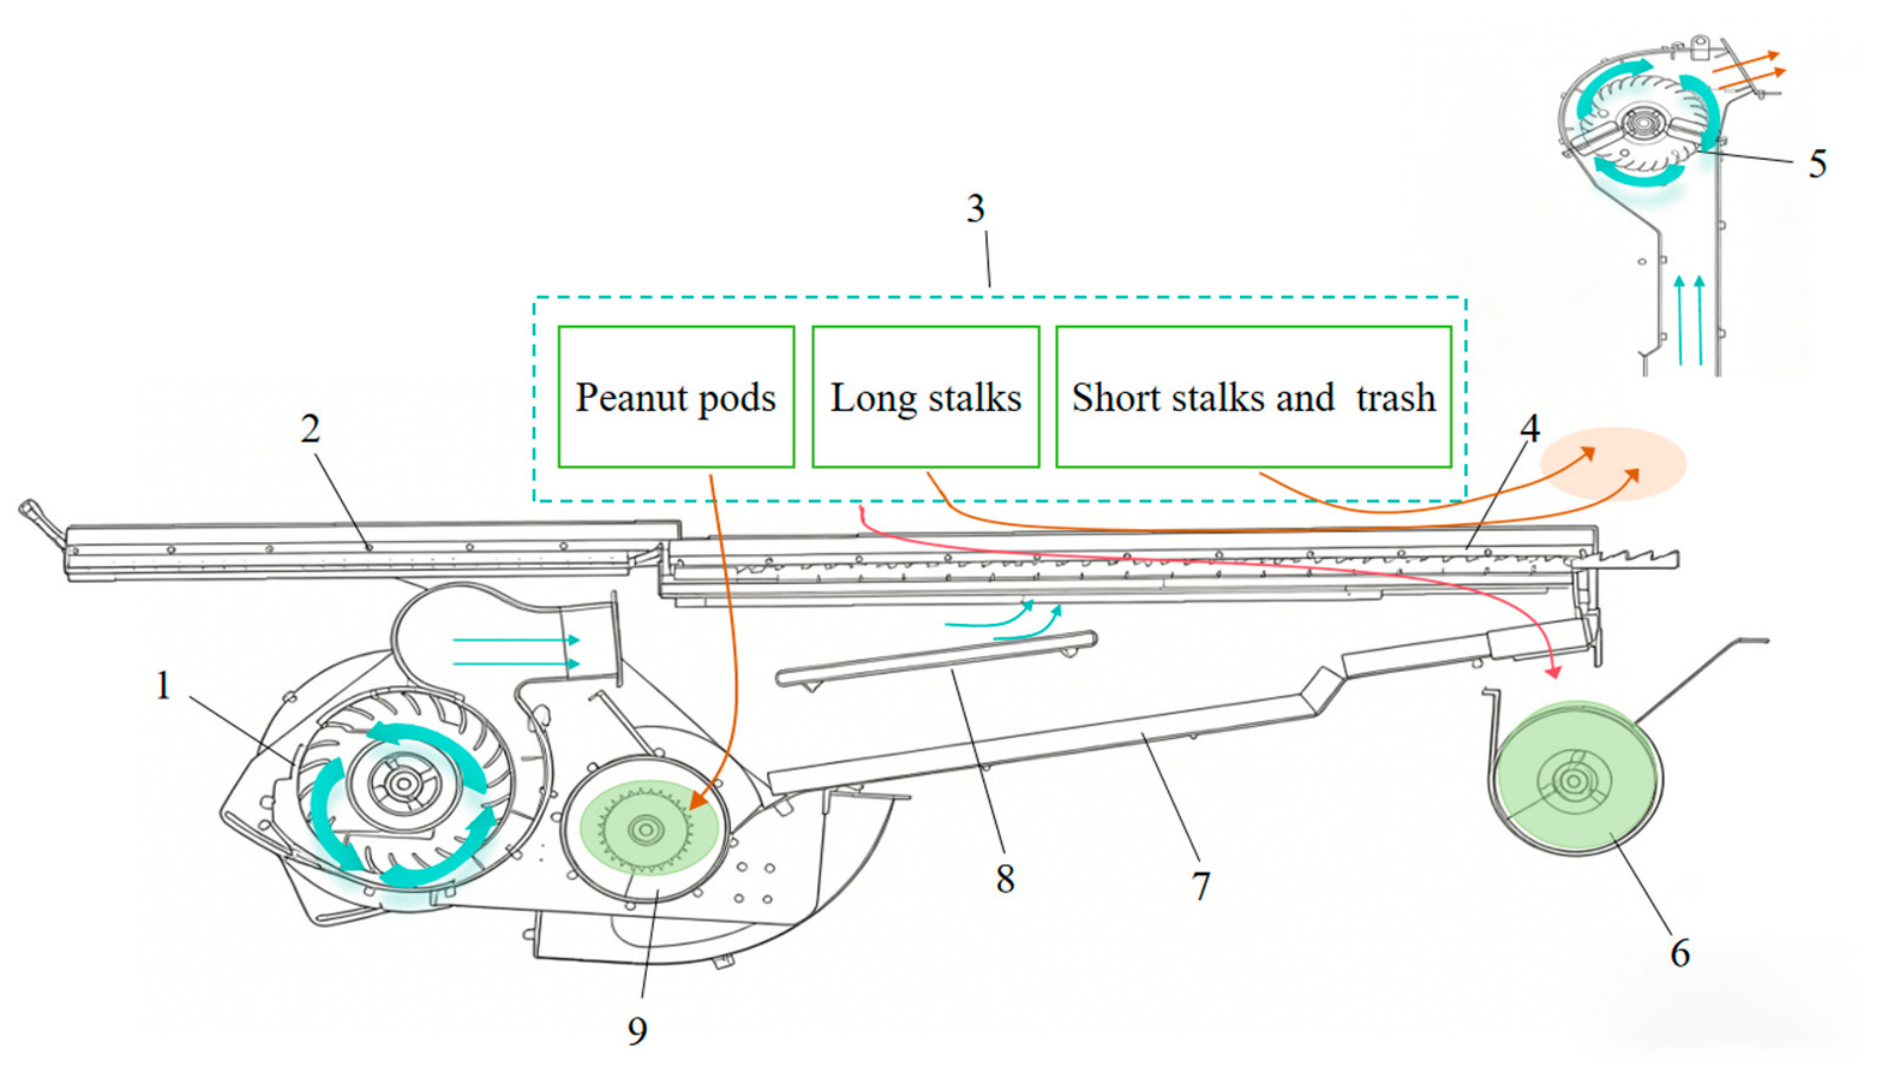
Based on the principle of positive–negative-pressure collaborative cleaning, a dual-airflow-system–vibrating-screen coupled cleaning structure was designed. The developed cleaning device consists of a crossflow fan, a vibrating screen, and an impurity-suction fan, which are arranged in an orderly manner to form a dual-airflow winnowing system. As shown in Figure 2, the vibrating screen is provided with a vibrating plate and a vibrating toothed surface arranged sequentially along the material conveying direction, and the upper screen surface is rigidly connected through a connecting rod and performs high-frequency reciprocating motion under the drive of the driving mechanism. A crossflow fan is horizontally installed at the lower left of the screen surface, and the airflow is precisely guided to the screen surface through a lower air guide plate. An impurity-suction duct is arranged at the tail, with negative pressure provided by an independent fan.
Figure 2.
Working process and principle of peanut cleaning device coupled with positive–negative dual-airflow system and vibrating screen. 1. Crossflow fan; 2. jigging plate; 3. threshed mixture; 4. vibrating screen; 5. impurity-suction fan; 6. re-threshing and collecting device; 7. lower screen; 8. air guide plate; 9. grain conveying auger.
During cleaning operation, the material first enters the vibrating plate region, where it is rapidly thinned under high-frequency vibration and then smoothly conveyed to the vibrating toothed region. The vibrating teeth efficiently comb the pods and impurities such as vines and straw, promoting stratification between pods and impurities, and the pods preferentially fall through the screen holes. In this process, the crossflow fan is activated, and the airflow is guided by the air guide plate to pass upward through the screen holes. Taking advantage of the differences in aerodynamic characteristics between peanut pods and impurities, light impurities such as stems and broken leaves are thrown and separated toward the upper right under the combined action of airflow thrust and their own gravity, while the remaining pods smoothly pass through the screen. This not only efficiently removes floating soil and broken leaves from the material layer, but also assists pod falling, effectively reducing screen surface blockage. The material is continuously conveyed backward to the tail of the vibrating screen, where residual impurities such as long straw that have not been removed are precisely adsorbed by the negative pressure generated by the impurity-suction fan, discharged through the impurity-suction duct, and dropped into the grass collection box. In addition, un-cleaned threshed materials fall into the re-threshing device and are returned to the front of the cleaning chamber for re-cleaning, while the residues that fall downward together with peanut pods enter the lower screen for further cleaning, thereby achieving thorough separation and reducing loss. During this process, the reciprocating vibration of the vibrating screen, the downward air supply of the crossflow fan, and the negative-pressure adsorption at the tail of the impurity-suction fan work in coordination to form a three-dimensional cleaning dynamic field with positive–negative pressure collaboration. Finally, the cleaned pods fall through the screen holes into the conveying auger below and are transported by the auger to the pod collection tank, completing the entire cleaning process.
2.2. Design and Analysis of Key Components
2.2.1. Structural Design of the Cleaning Screen
Dimensional Design of the Cleaning Screen
The dimensions of the vibrating toothed surface of the cleaning device directly affect the feed rate and separation performance, and are key to ensuring efficient and smooth operation of the screen surface. According to the Agricultural Machinery Design Manual, the screen surface dimensions and feed rate satisfy the following condition [15]:
where L1 is the length of the vibrating screen (mm); B1 is the width of the cleaning screen surface (mm); qs is the rated load capacity of the screen surface (kg/(s·m2)); Q is the maximum feed rate of the cleaner per second (kg/s); δs is the mass proportion of peanut impurities in all threshed materials; and k is the operating performance coefficient of the cleaning device.
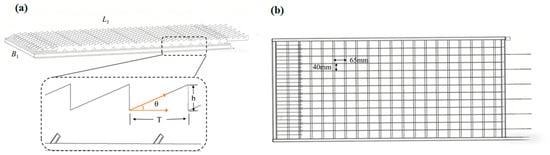
Considering the material dropping distribution of peanut threshed materials and the installation space of the whole machine, the screen surface width B1 was taken as 860 mm and the length L1 as 1500 mm. According to the basic dimensions of the threshed material particles, the screen holes of the vibrating toothed surface were determined to be square holes of 40 mm × 65 mm. This screen hole size not only ensures that pods can smoothly pass through the screen, but also effectively intercepts impurities such as long straw, thereby creating favorable conditions for subsequent winnowing.
In addition, the toothed structure adopted on the screen surface works in coordination with the vibration of the vibrating plate, enhancing the material throwing effect, preventing pods and stems from accumulating in clumps, and promoting the effective dispersion and separation of different components.
As shown in Figure 3, the vibrating teeth adopt a triangular tooth profile, whose regular contour can reduce material jamming and enhance the dispersion effect. The tooth height h was set to 15 mm. This height can not only generate sufficient stirring force on the material to promote its orderly movement along the screen surface, but also avoid pod compression damage caused by an excessively large tooth height. The tooth spacing T was selected as 40 mm, which precisely matches the average dimensions of peanut pods (length 35–45 mm, width 15–20 mm), thereby preventing pods from jamming in the tooth gaps. The installation angle θ was designed to be 20° relative to the movement direction of the vibrating plate. This angle works in coordination with the vibration rhythm of the vibrating plate, enhancing the material throwing amplitude and promoting efficient stratification and separation of pods and impurities.
Figure 3.
Schematic diagram of structure and parameters of vibrating toothed screen for cleaning device. (a) Triangular-tooth cleaning sieve and tooth unit parameters. (b) Grid sieve dimension diagram.
Design of Key Parameters of the Cleaning Screen
In the cleaning process of a peanut combine harvester, the vibrating screen and fan together constitute an air–screen coupled cleaning system, and its performance depends essentially on the matching optimization of vibration parameters and airflow parameters. Existing studies have clarified the mechanism of air–screen coupling and analyzed the regulation of airflow on the motion of material particles. Based on the system coupling mechanism, the key vibration parameters that balance high cleaning efficiency and low damage to peanut pods are derived. The cleaning screen performs an inclined linear reciprocating motion, and the driving mechanism is an eccentric wheel mechanism.
To describe the mechanical critical condition for peanut pods to jump and detach from the screen surface under the combined air–screen field, a single-particle dynamic model of the screen surface was established [16]. Taking a peanut pod of mass m on the screen surface as the research object, the force analysis in the direction perpendicular to the screen surface was carried out, and the resultant force is expressed as:
where Fy is the resultant force on the particle perpendicular to the screen surface (N); FN is the supporting force of the screen surface on the material (N); mgcosα is the component of gravitational acceleration g perpendicular to the screen surface (N); α is the inclination angle of the vibrating screen surface (°); and Fair is the vertical force of the airflow on the material (N).
Fy = FN − mgcosα + Fair
By Newton’s second law, then:
where ay is the acceleration of the peanut pod perpendicular to the screen surface (m·s−2).
FN − mgcosα + Fair = may
The screen surface performs simple harmonic vibration, and its vibration displacement and vibration acceleration satisfy:
where s is the vibration displacement of the screen surface (m); A is the screen amplitude (mm); ω is the vibration angular frequency of the screen surface (rad·s−1); t is time (s); and as is the vibration acceleration of the screen surface itself (m·s−2).
Decomposing to the y direction perpendicular to the screen surface, the vertical acceleration component of the screen surface and the contact acceleration of the particle satisfy:
where asy is the component of the screen vibration acceleration perpendicular to the screen surface (m·s−2); and β is the angle between the excitation direction and the screen surface (°).
Substituting the above relations into the equation of motion:
FN − mgcosα + Fair = −m[Aω2sin(ωt)sinβ]
The critical criterion for the initiation of throwing motion is the instantaneous separation of the material from the screen surface, at which point there is no pressure between the material and the screen surface, that is, the supporting force FN = 0. Let this critical moment be tc, then:
where tc is the critical moment when the peanut pod jumps and detaches from the screen surface (s).
mgcosα − Fair = mAω2sin(ωtc)sinβ
To quantify the effect of airflow on material jumping, an airflow field factor Kair is defined to characterize the ratio of the vertical airflow force to the vertical component of gravity on the screen surface:
where Fair is the airflow field factor (dimensionless).
Substituting into the critical condition Equation (7) and rearranging gives:
For this equation to have a physical solution, that is, for a moment tc to exist at which throwing occurs, the coefficient term must satisfy:
Referring to classical vibrating screening theory, a dimensionless throwing index D is defined to characterize the excitation intensity of the screen surface. Thus, the throwing index D is:
where D is the throwing index (dimensionless); and f is the vibration frequency of the screen surface (Hz).
Substituting the throwing index D into the critical condition (9), the final critical jumping condition can be simplified as:
D.sin(ωtc) = 1 − Kair
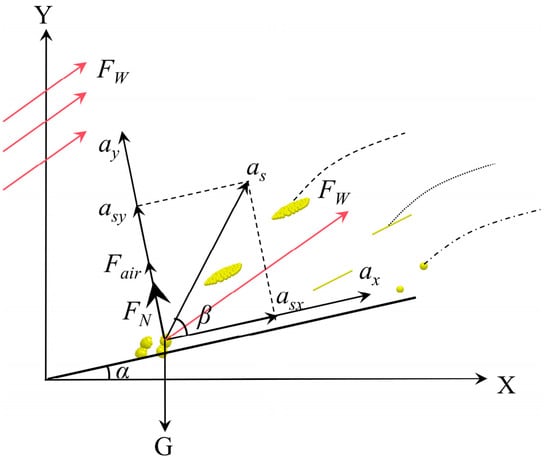
As shown in Figure 4,the above model reveals the synergistic mechanism between the airflow field and vibration: when an upward airflow field exists, i.e., Kair > 0, then 1 − Kair < 1 in Equation (12). This indicates that the throwing index D required to reach the critical throwing state can be correspondingly reduced. In other words, the airflow field undertakes part of the material lifting effect, allowing the vibration system to operate at a lower intensity, which provides a theoretical basis for designing a low-damage cleaning scheme.
Figure 4.
Force analysis of peanut pod under the action of vibrating screen and fan. Note: X, Y are global rectangular coordinate axes (unitless); α is inclination angle of vibrating sieve surface (°); β is angle between sieve excitation acceleration and sieve surface (°); G is gravity of peanut pod particle (N); FN is normal support force of sieve to particle (N); Fair is vertical component force of airflow on particle (N); FW is total aerodynamic force of cleaning air flow (N); as is total excitation acceleration of sieve (m·s−2); asx and asy are X-direction and Y-direction components of sieve excitation acceleration (m·s−2); and ax and ay are X-direction and Y-direction movement acceleration of peanut pod particle (m·s−2).
On the premise of ensuring the pod cleanliness rate, the cleaning loss rate must be controlled within a reasonable range, which requires the parameter design to balance efficiency and gentle handling. To extend the effective sorting time of the material on the screen surface, the screen surface inclination angle was determined as α = 4°. Considering both airflow field assistance and low-damage requirements, the target working range of the throwing index D was set to 1.5–2.3. The lower limit of this range ensures gentle handling under optimal working conditions, while the upper limit reserves sufficient cleaning intensity for complex conditions such as high impurity content and high humidity. To overcome the conveying resistance caused by the upturned structure at the screen tail and prevent material accumulation, the conveying force component parallel to the screen surface needs to be strengthened. Through comparison, the vibration direction angle was selected as β = 25°, which can provide stronger conveying capacity while ensuring the necessary throwing effect. With reference to industry standards and structural dynamics analysis, the amplitude was fixed at A = 30 mm. This value achieves a good balance between providing sufficient excitation and ensuring equipment durability.
Substituting the determined fixed parameters A = 30 mm, β = 25°, α = 4°, and g = 9.8 m/s2 into the throwing index formula, and in order to strictly satisfy the throwing index theory, the theoretical calculation range of the vibration frequency f is 5.41–6.70 Hz. After engineering rounding of the theoretical vibration frequency range to both sides, the final optional vibration frequencies were determined as three discrete levels: 5 Hz, 6 Hz, and 7 Hz.
2.2.2. Structural Design of the Crossflow Fan
After peanut pods are threshed by the pod-picking cylinder, the material contains a large amount of stems and light impurities, which need to be separated by winnowing. The crossflow fan has obvious advantages in cleaning devices because it can provide a uniform and wide air curtain. However, traditional fans have the problem of airflow velocity mismatch, which can easily cause pod loss or inadequate cleanliness. Therefore, it is necessary to design a crossflow fan that precisely matches the suspension characteristics of peanut pods.
Suspension velocity is the fundamental basis for fan design. Experimental results in the existing literature [17] show that the suspension velocity of peanut pods ranges from 9.2 to 13.4 m/s, while that of light impurities such as stems is approximately 4–6 m/s. The fan outlet airflow velocity should ensure effective dispersion of the material layer and convey light stems backward to the impurity-suction duct at the tail. Although peanut pods may be temporarily lifted, they can still fall back onto the screen surface under gravity and complete the process of passing through the screen.
Selection of Structural Parameters
To meet the requirements of airflow uniformity and airflow velocity range for peanut pod winnowing, and in combination with the overall structural layout and air volume demand of the machine, the core structural parameters of the crossflow fan were designed. Chen Ni et al. [18] provided a systematic design method and parameter optimization process in the design of a cleaning fan for a semi-feeding combine harvester, which provided a theoretical basis for the parameter selection in this paper. The main design values are summarized in Table 1.
Table 1.
Core structural parameters of crossflow fan.
This structure achieves an optimal balance among providing sufficient airflow velocity, preventing overload, and ensuring structural strength, making it more suitable for the working conditions of agricultural machinery.
Aerodynamic Modeling and Speed Determination
To establish the quantitative relationship between the fan outlet airflow velocity and the impeller rotational speed, an aerodynamic characteristic model of the crossflow fan was constructed, in which the outlet airflow velocity is expressed as the product of the impeller circumferential velocity and a comprehensive flow coefficient, and the comprehensive flow coefficient is jointly determined by the blade slip effect and the volute structural characteristics. According to the research of Montazerin et al. [19], the following aerodynamic model was established:
where v is the fan outlet airflow velocity (m/s); U is the impeller circumferential velocity (m/s); Φ is the comprehensive flow coefficient, jointly characterized by the slip coefficient λ and the volute flow coefficient ξ; λ is the slip coefficient; Z is the number of blades; γ is the blade angle (°); ξ is the volute flow coefficient; ξbase is the base flow coefficient; Cδ is the clearance reduction coefficient, used to correct the leakage loss caused by the clearance δ; Dm is the impeller mean diameter (mm); and N is the rotational speed of the crossflow fan (r/min).
In the aerodynamic characteristic analysis of the crossflow fan, λ is solved according to the slip theory formula, and the determination of ξ needs to account for the leakage loss effect of the volute clearance δ. Radial blades were adopted in the design (γ = 90°). For a volute with a smooth flow channel, the base flow coefficient was taken as ξbase = 0.65. Considering the significant leakage loss caused by the volute clearance δ = 10 mm in this design, the clearance reduction coefficient was taken as Cδ = 0.9 based on engineering experience to complete the correction of ξ. Based on the above aerodynamic model and key performance coefficients, a quantitative correlation between the outlet airflow velocity and the impeller rotational speed was established. After substituting the calculation formula for the impeller circumferential velocity, the theoretical rotational speed range of the fan was derived as 1741–2321 r/min in order to meet the airflow velocity range required by the cleaning process. Considering the convenience of engineering operation and the stability of equipment operation, the optimal working range of the fan was finally determined as 1800–2200 r/min.
2.2.3. Impurity-Suction Fan Structural Design
The impurity-suction fan was designed with the required air volume and total pressure of the cleaning system as design inputs to determine its structural parameters and rated rotational speed. In combination with the layout of the vibrating screen, the suction inlet dimensions were taken as 0.85 m × 0.17 m, with an area of Ain = 0.145 m2. The total length of the air duct is 1.5 m, which is used to convey the sucked impurities to the grass collection box.
The role of the impurity-suction fan is to establish a stable negative-pressure field at the suction inlet, so that the stems obtain an airflow velocity higher than their suspension velocity to achieve stable suction and conveyance. Therefore, the reference airflow velocity in the impurity-suction region must be higher than the suspension velocity of the stems. Considering complex field conditions such as uneven moisture content and mutual entanglement of stems, a safety factor was introduced, and the reference target airflow velocity was preliminarily set as vs1 = 9.0 m/s. There is an installation spacing between the fan suction inlet and the vibrating screen surface, and the airflow undergoes free diffusion after being ejected from the slit, resulting in attenuation of the airflow velocity at the screen surface position. To ensure that the effective airflow velocity at the screen surface meets the material suspension requirement, attenuation correction of the designed suction inlet airflow velocity is required. A rectangular slit jet model was used to estimate the velocity attenuation, and a safety margin was reserved. Finally, the corrected design airflow velocity at the suction inlet was determined as vs2 = 18.0 m/s.
At the same time, to compensate for system air leakage, kl = 1.1 was taken based on engineering experience. Based on the continuity equation, the calculation formula and result of the designed air volume required by the system are as follows:
where Qf is the required design air volume of the fan (m3·h−1); Ain is the effective area of the impurity-suction inlet (m2); vs2 is the corrected design airflow velocity at the impurity-suction inlet (m·s−1); kl is the system air leakage coefficient (dimensionless); ρa is the air density under standard conditions, with ρa taken as 1.2 kg·m−3; and Pd is the airflow dynamic pressure at the impurity-suction inlet, which provides kinetic energy for the suspension and conveyance of materials (Pa).
In summary, based on the structural parameters of the impurity-suction inlet and the working condition correction coefficients, the design air volume of the impurity-suction fan was calculated as Qf = 10,300 m3/h, and the airflow dynamic pressure at the impurity-suction inlet was Pd = 194.4 Pa.
where ΔPf is the frictional resistance loss (Pa); § is the frictional resistance coefficient, which is taken as § = 0.018 based on the actual air duct surface roughness and flow state; S is the total length of the air duct (m); Dh is the hydraulic diameter (m); ΔPm,i is the i-th local resistance loss (Pa); and ξi is the i-th local resistance coefficient. The system contains multiple local resistance components such as the impurity-suction inlet, elbows, and separator inlet, which interact with one another. To simplify the calculation while retaining a design margin, the comprehensive value method was adopted with ξi = 0.85, covering the comprehensive loss effects of airflow contraction, turning, and expansion. is the total static pressure loss of the system (Pa); W is the width of the impurity-suction duct (m); and H is the length of the impurity-suction duct (m).
Substituting the parameters into the formula set for calculation:
During the process in which the airflow flows from the impurity-suction inlet through the entire system until it is discharged, pressure losses are generated due to various factors such as friction and eddy currents, and these losses need to be overcome by the static pressure of the fan. The total system resistance consists of two main parts: frictional resistance and local resistance. Frictional resistance originates from the continuous friction between the airflow and the pipe wall, while local resistance occurs at locations where the shape of the airflow channel changes abruptly. The detailed calculation model is as follows [20]:
The total pressure of the fan represents the total mechanical energy output by the fan to the airflow, and it must simultaneously satisfy the dynamic pressure demand at the impurity-suction inlet and the static pressure loss of the airflow in the duct. Considering the deviation between theoretical calculation and actual working conditions, a pressure margin coefficient was introduced to ensure stable operation of the system.
where Pt is the design total pressure required by the fan (Pa); and ηmargin is the pressure design margin coefficient (dimensionless), taken as ηmargin = 10%.
Substituting the calculation parameters obtained above into Equation (17), the design total pressure of the fan is obtained as:
Pt = 1296 Pa
After clarifying the aerodynamic requirements of the system, the aerodynamic design of the impurity-suction fan needs to be carried out. The relationship between the fan rotational speed n, the impeller outer diameter D2, and the total pressure coefficient ψ can be expressed as follows:
where n is the working rotational speed of the impurity-suction fan (r·min−1); D2 is the impeller outer diameter (m); and ψ is the total pressure coefficient (dimensionless). The total pressure coefficient corresponding to the high-efficiency region generally ranges from ψ = 0.35 to 0.50, and ψ = 0.4 was adopted; ρ is the air density, taken as 1.2 kg·m−3.
Based on the overall structural layout and spatial constraints of the machine, the impeller outer diameter was determined as D2 = 0.6 m. This dimension can satisfy the performance requirements while matching well with other components of the harvester. The rotational speed of the impurity-suction fan was obtained from Equation (19). To balance operating efficiency, noise control, and mechanical service life, the target rotational speed range was set as 1600–2000 r/min.
3. Results and Discussion
3.1. Numerical Simulation Analysis of the Working Process
To verify the structural rationality of the cleaning device and analyze the indoor airflow distribution and material motion, a flow field model was established based on CFD, and a coupling framework with EDEM was constructed to reveal the motion laws and separation mechanism of peanut mixture materials in gas–solid two-phase flow [21], thereby providing a basis for the optimization of structural parameters.
3.1.1. Numerical Simulation and Experimental Comparative Analysis of the Airflow Field in the Cleaning Chamber
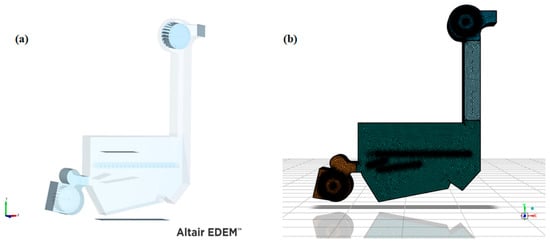
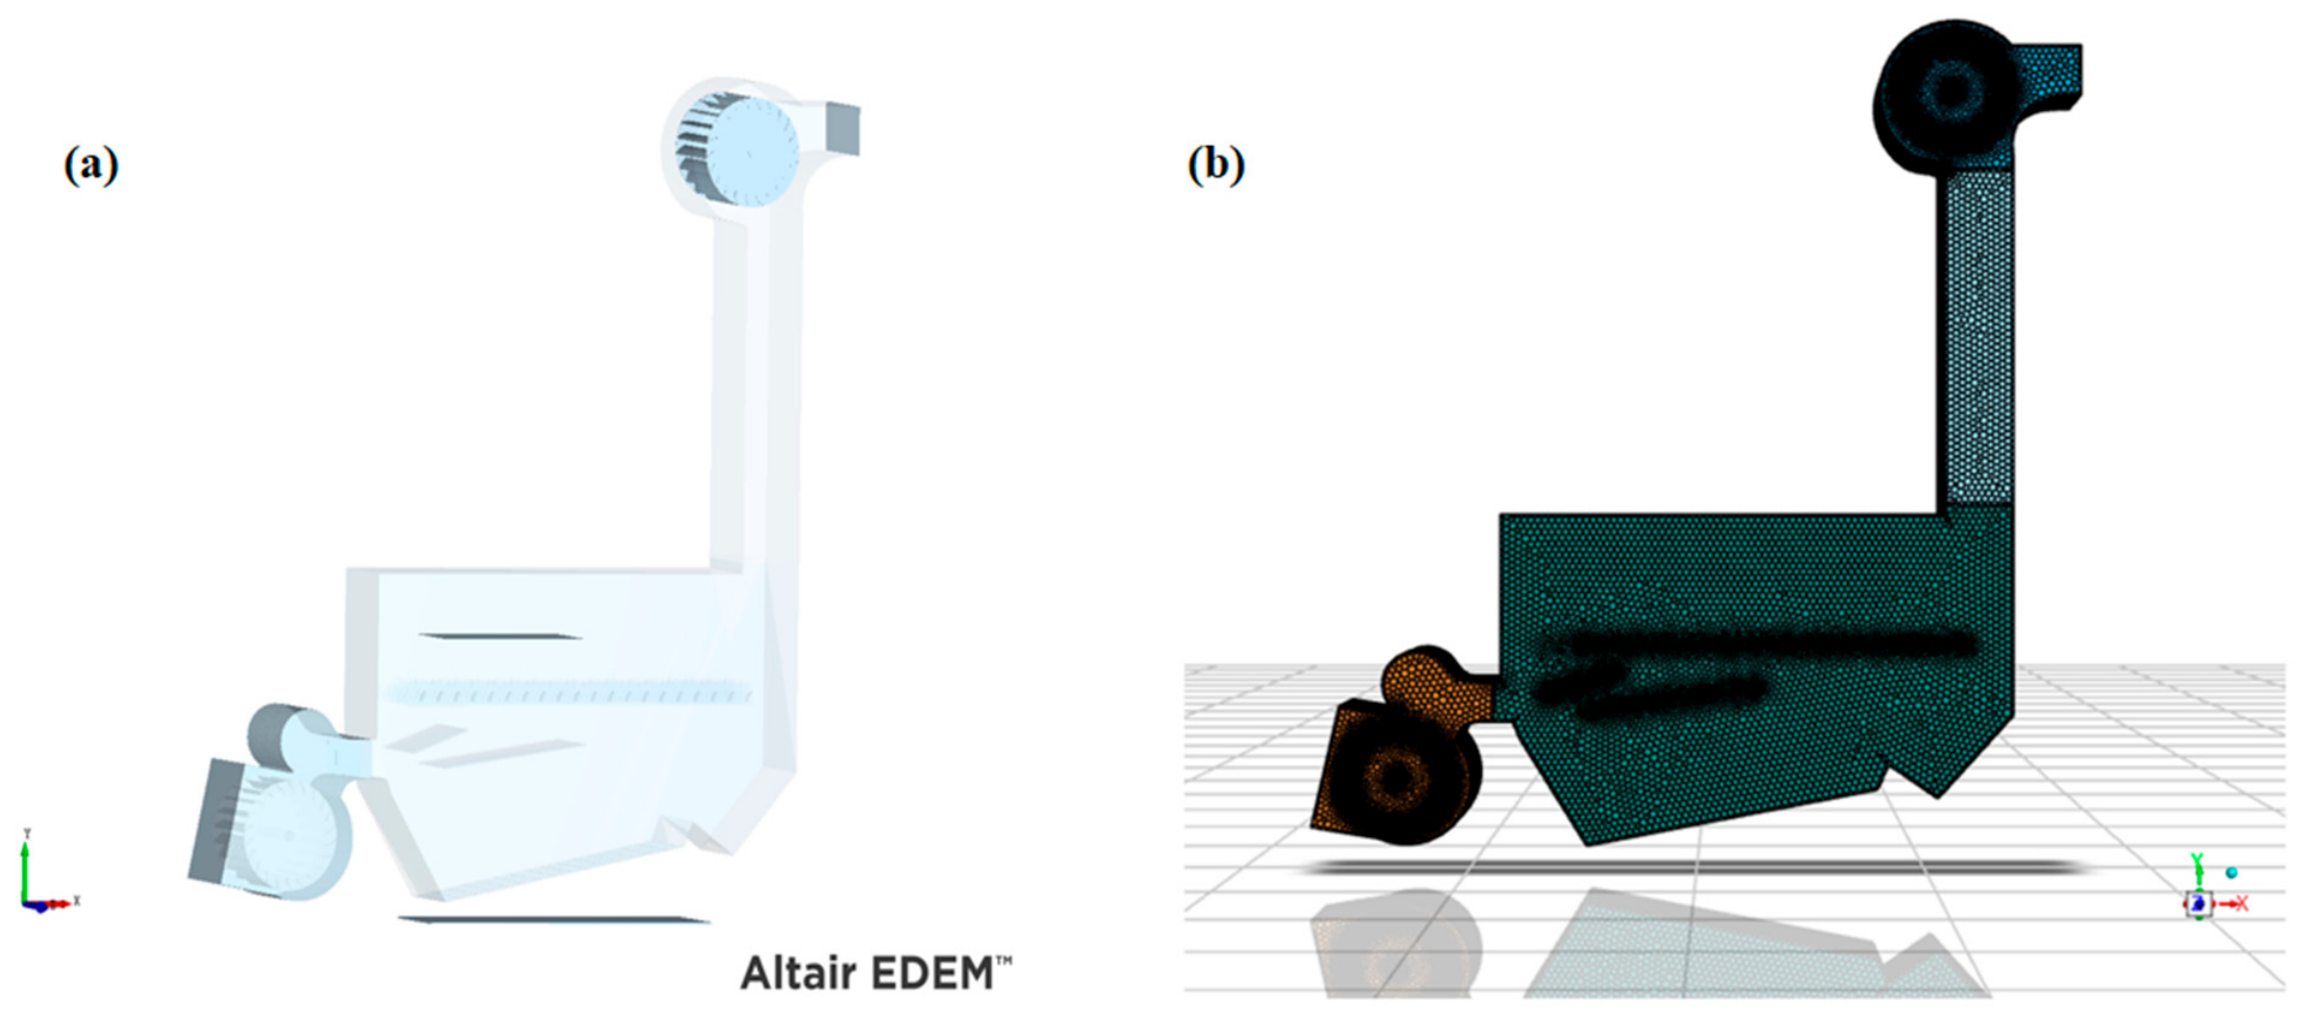
As shown in Figure 5, a geometric model was established and simplified according to the actual dimensions of the cleaning device. The computational domain was discretized using an unstructured mesh, with local refinement applied in the near-wall region, screen surface, and airflow turning region [22,23]. Taking advantage of geometric symmetry, half of the width direction was selected as the computational domain. The fan region was solved using a sliding mesh in a transient manner, and the mesh quantity was determined after mesh- and time-step-independence verification. A pressure-based transient solver was adopted, the realizable k−ε model was selected as the turbulence model, and air was set as an incompressible ideal gas [24]. The fan outlet was set as a pressure inlet, the impurity-suction outlet was set as a pressure outlet, and the no-slip condition was applied to the walls. The residual convergence criterion was set to 10−4.
Figure 5.
Simulation model of cleaning device. (a) EDEM simulation model. (b) FLUENT fluid domain mesh model.
3.1.2. Determination of Coupling Simulation Parameters
On the basis of verifying the rationality of the airflow distribution in the dual-air-duct system, the CFD–DEM coupling method was used to simulate and analyze the material motion in the cleaning device [25,26]. Peanut threshed materials mainly include pods, long stems, small stems, broken leaves, soil impurities, and pod stalks. To balance computational efficiency and accuracy, the motion migration and discrete behavior of four types of materials, namely pods, stems, broken leaves, and soil impurities, were mainly analyzed.
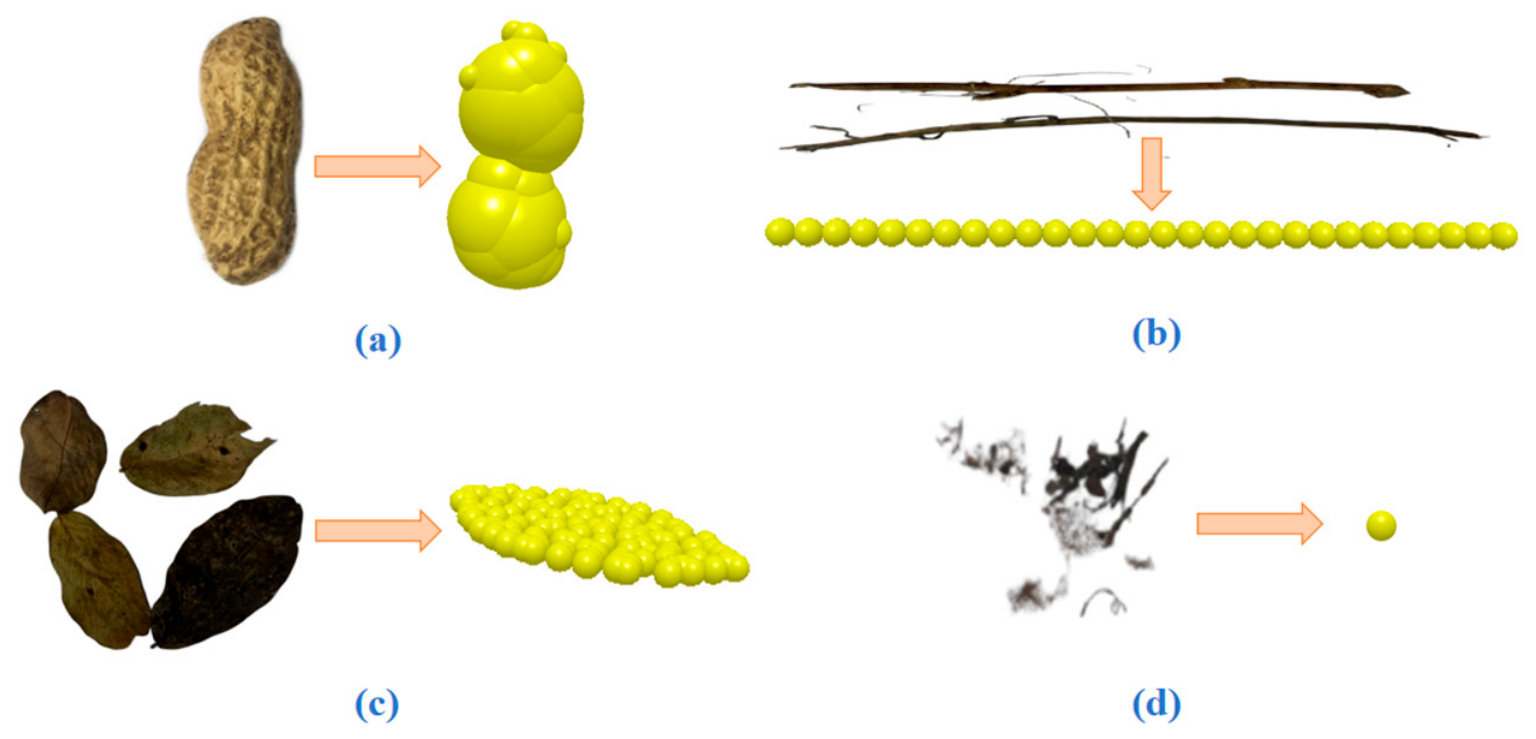
The tested variety was “Baisha-3”. At the harvest stage, the average moisture content was measured as 16.88–17.32% for pods and 20.05–21.11% for stems. Twenty pods, ten long stems, and ten short stems were selected to measure their geometric dimensions, and the average values were taken as input parameters for discrete element modeling. Based on the measured dimensions (Table 2), a three-axis ellipsoid geometric model of the pod was established in SolidWorks 2020 and imported into EDEM to be generated by particle filling. A rigid model combining peanut pods and stem sphere clusters was constructed; soil particles were represented as single spheres, and leaves were represented as multi-sphere combined thin sheets.
Table 2.
Size parameters of peanut threshed materials (unit: mm).
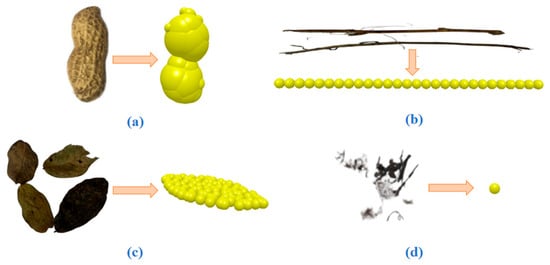
The comparison between the simulated particle models of various threshed materials and the morphology of real materials is shown in Figure 6.
Figure 6.
DEM modeling comparison of peanut threshed materials. (a) DEM particle model of peanut pod. (b) DEM particle model of stalk. (c) DEM particle model of peanut leaf. (d) DEM particle model of soil impurity.
The intrinsic and contact parameters of the materials were calibrated according to the moisture content range and preliminary tests. The Hertz–Mindlin (no-slip) contact model was used in the discrete element module to characterize the contact mechanics between particles and between particles and boundaries, so as to reproduce the collision, bouncing, sliding, transport, and separation of the threshed mixture components. The material proportions in the particle factory were determined according to the measured mass percentages of the sampled mixture (Table 3), and the physical properties and contact parameters of each component are listed in Table 4 and Table 5, respectively. The gas–solid coupling simulation was performed on the EDEM and Fluent platforms using a two-way Eulerian–Lagrangian scheme, with the SST k−ω model for gas-phase turbulence and the Gidaspow drag model for the particle phase. Unstructured meshes with local refinement on the screen surface were used, with a total of 3,065,157 cells and a wall y+ range of 1.2 × 10⁻⁴–115.7. The DEM time step was set to 16.58% of the Rayleigh critical time step (1.5 × 10⁻⁷ s), while the CFD time step and the coupling interval were both 0.001 s; this CFD time step was determined through a selection procedure, and the mesh- and time-step-independence verification confirmed that the above settings meet the required accuracy. The coupling simulation was considered converged when the residuals of all governing equations fell below 10−4, and the total simulation time was 6 s.
Table 3.
Mass proportion of each component in peanut threshed mixtures.
Table 4.
Basic physical parameters of materials [27].
Table 5.
Contact interaction parameters of materials [15].
To ensure the reliability of the simulation results, the discrete element model and the fluid simulation model were validated by angle-of-repose tests and air velocity measurements, respectively. In the angle-of-repose tests, two materials, peanut pods and stems, were tested. For peanut pods, the experimental angle of repose was 32.5°, while the simulated value was 34.1°, with a relative error of 4.9%. For stems, the experimental angle of repose was 28.7°, while the simulated value was 30.2°, with a relative error of 5.2%. The relative errors for both materials were around 5%, indicating that the contact parameters used in the discrete element model can reasonably reproduce the piling characteristics of peanut pods and stems. The initial ranges of the particle contact parameters were determined with reference to existing calibration studies on peanut pods [28], and the selected parameters were further validated through the angle-of-repose tests. Among the contact parameters, the static friction coefficient and rolling friction coefficient had the most significant influence on the piling morphology, while the restitution coefficient had a relatively minor effect. After calibration, the relative errors between the simulated and experimental angles of repose were controlled within about 5%. In the air velocity measurements, the air velocities at 27 different points under the same working conditions were compared. The average relative error between the measured and simulated results was 6.2%, and the maximum relative error was 11.8%. The maximum error occurred in the region with higher particle concentration, which may be attributed to the approximation of the drag model. The overall error is within an acceptable range for engineering purposes, indicating that the fluid simulation model can accurately predict the flow field distribution of the system. The above results demonstrate that the CFD–DEM coupling model is reliable in both the particle phase and the fluid phase, and can be used for subsequent simulation analysis.
The simulation set the total input mass according to the measured mass proportion of each component. Combined with the single-particle geometric and density parameters, the software automatically calculated and generated the corresponding number of particles, with the total mass and the mass proportion of each component as the control conditions.
3.1.3. Single-Factor Coupling Simulation Experiment
Based on the above CFD–DEM coupling model, single-factor simulation analysis was carried out with pod loss rate (Y1) and impurity content rate (Y2) as indicators to investigate the effects of three factors, namely the crossflow fan rotational speed, vibration frequency, and impurity-suction fan rotational speed, on cleaning performance. Five levels were set for each factor. In the single-factor analysis, the other two factors were fixed at their middle levels, and only the value of the target factor was changed, so as to determine the preferable value range of each factor and provide a basis for multi-factor optimization.
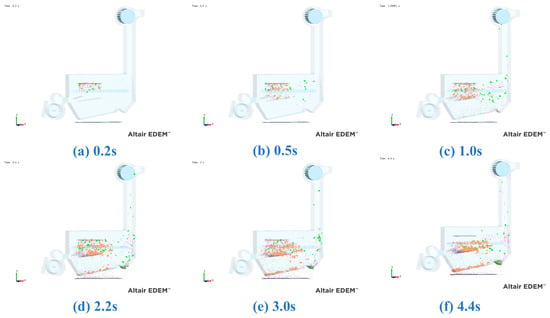
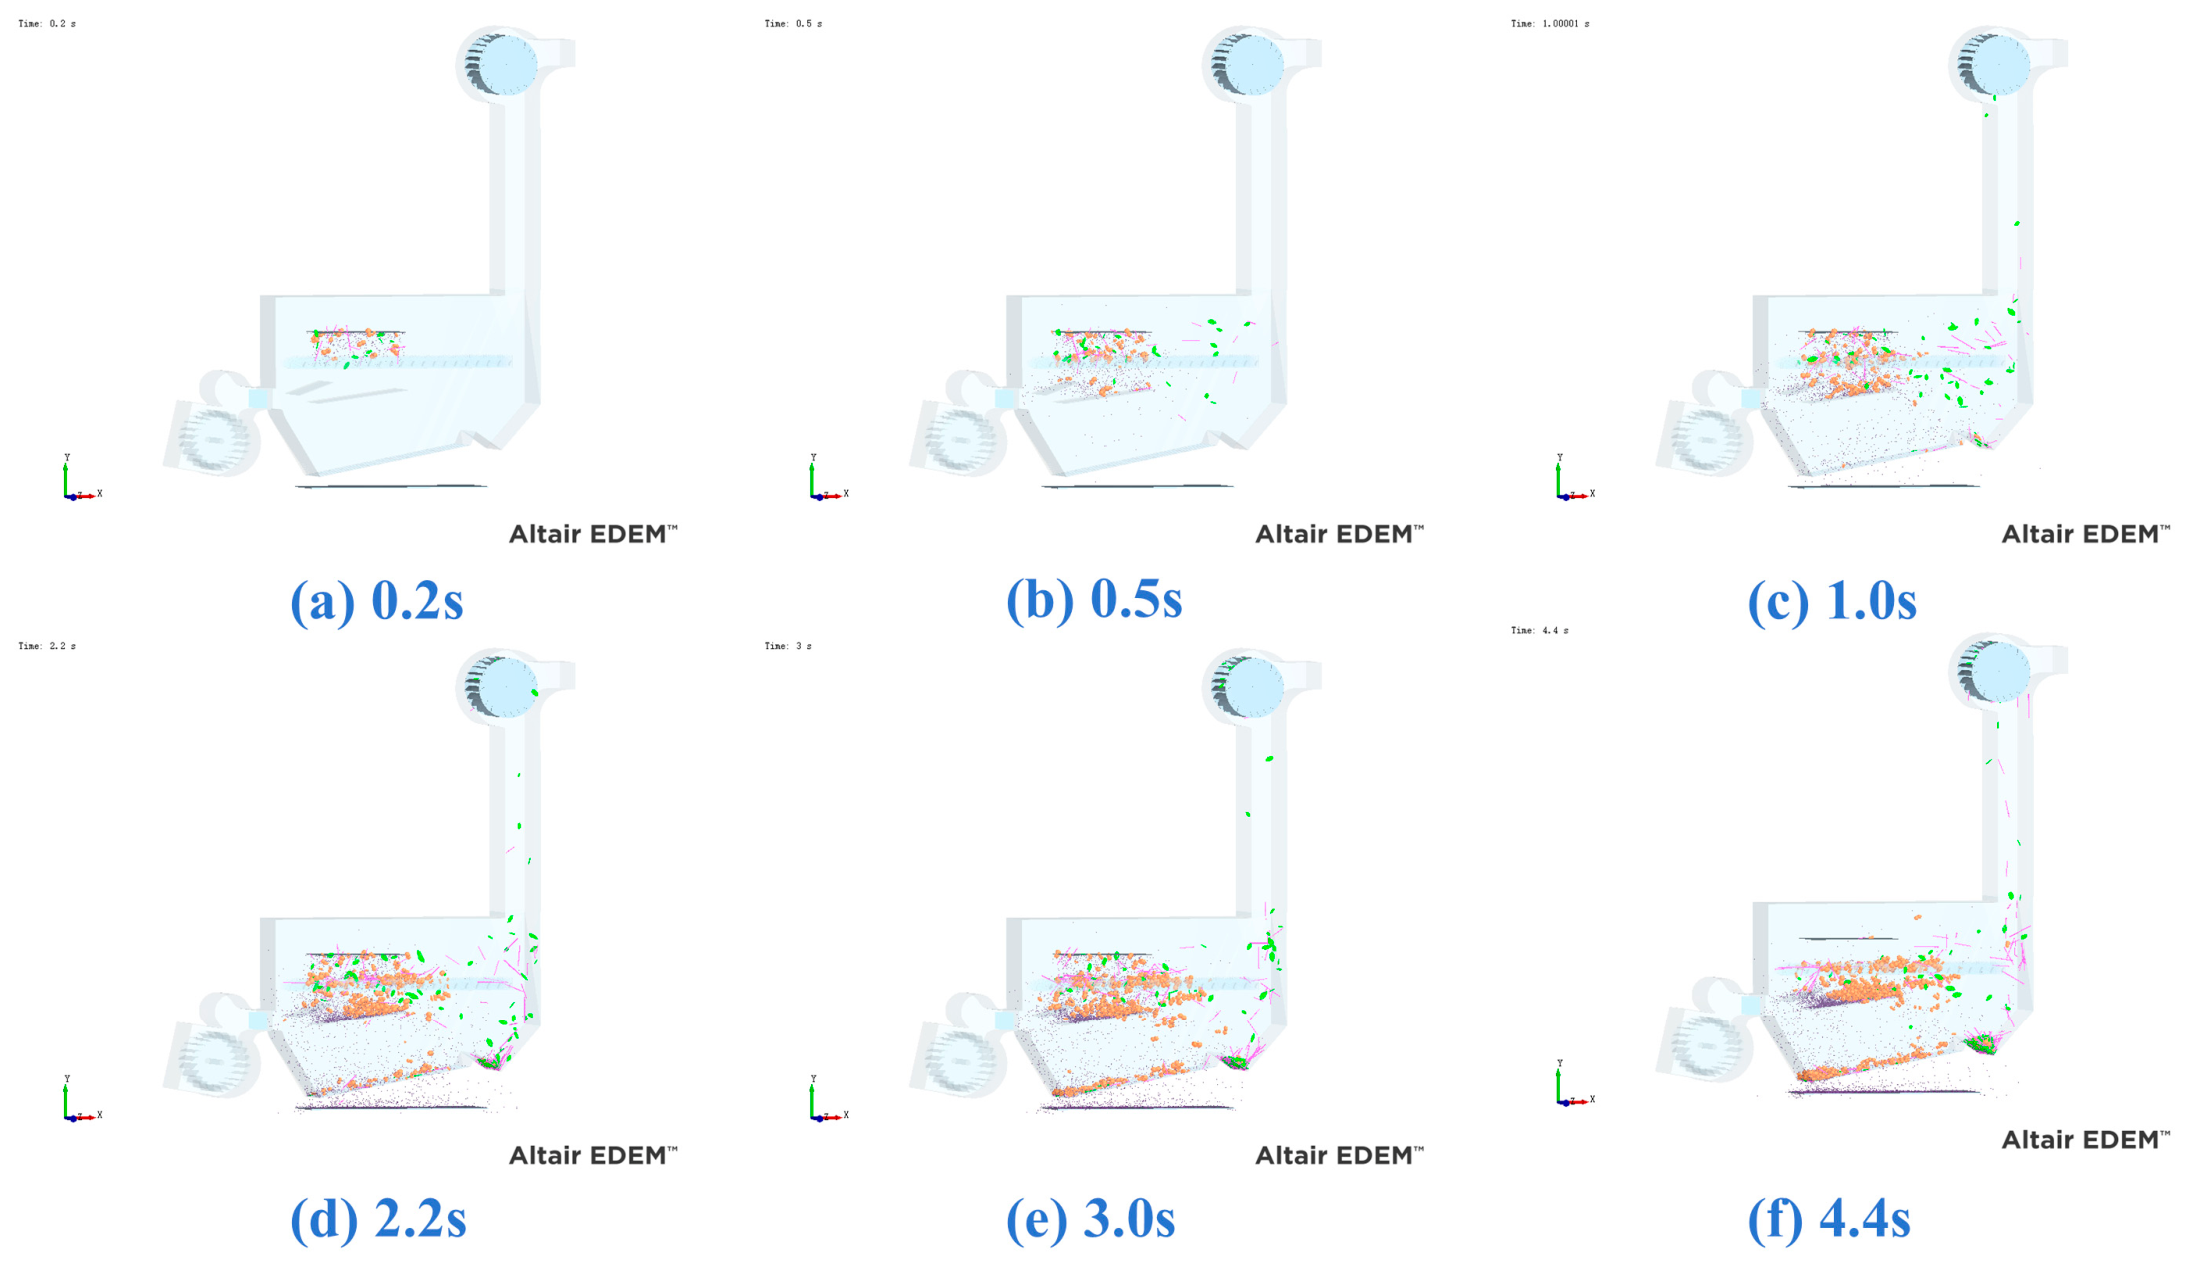
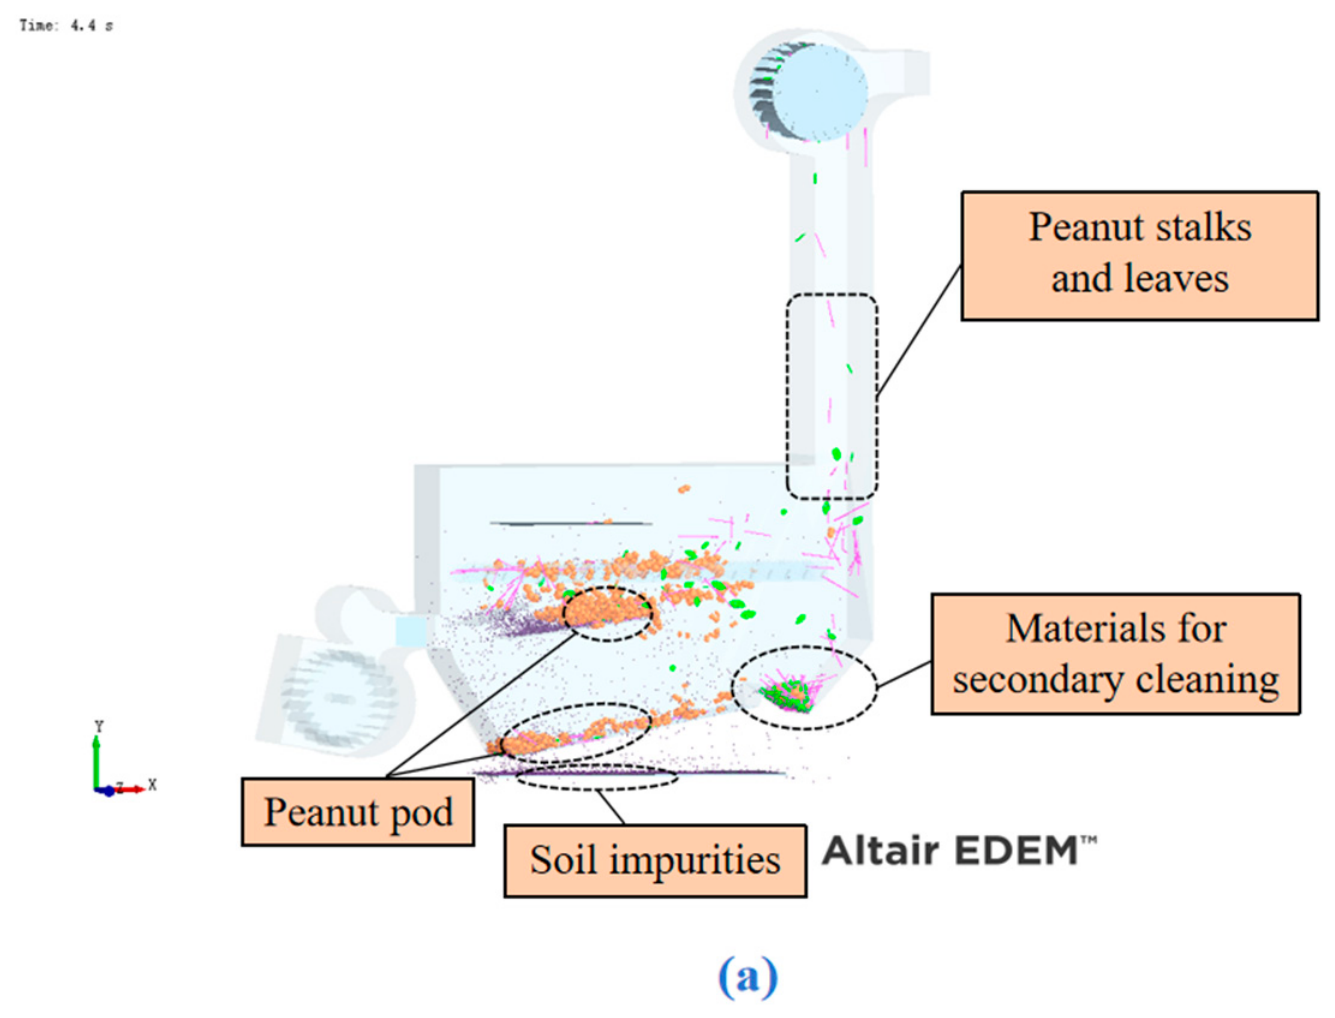
Taking the working condition of a crossflow fan rotational speed of 1900 r/min, a vibration frequency of 6 Hz, and an impurity-suction fan rotational speed of 1600 r/min as an example, the dynamic simulation process is shown in Figure 7. At 0.2 s after the simulation started, the material began to fall freely under gravity. At 0.5 s, the peanut leaves and stems exhibited obvious backward drift under the action of the airflow–vibrating-screen. At 1.0 s, the peanut pods had achieved significant separation from the stems and leaves, and some light impurities were effectively sucked away by the impurity-suction fan. At 2.2 s, some peanut pods fell into the collection region, and the leaves and soil impurities falling with them entered the lower screen for cleaning. At 3.0 s, most of the soil impurities had been removed by the lower screen, the cleaning process operated stably, the peanut pods fell smoothly, and the stems and broken leaves were sucked away; the peanut pods, stems, and leaves that had not been cleaned in time fell into the secondary cleaning auger region and were returned to the front part of the cleaning chamber. By 4.4 s, all mechanisms of the entire system operated in coordination, and the cleaning operation proceeded in an orderly manner according to the designed process.
Figure 7.
Simulation process. (a) t = 0.2 s; (b) t = 0.5 s; (c) t = 1.0 s; (d) t = 2.2 s; (e) t = 3.0 s; (f) t = 4.4 s.
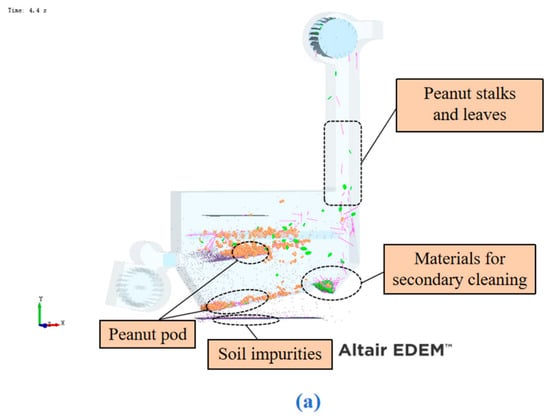
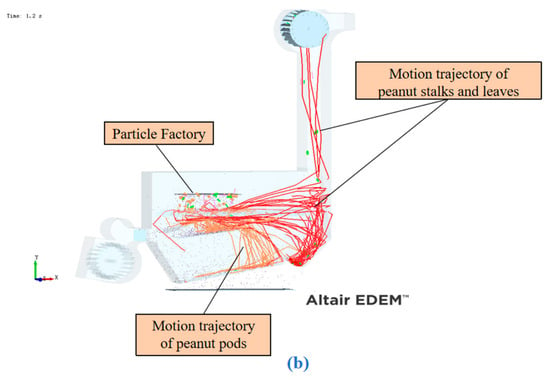
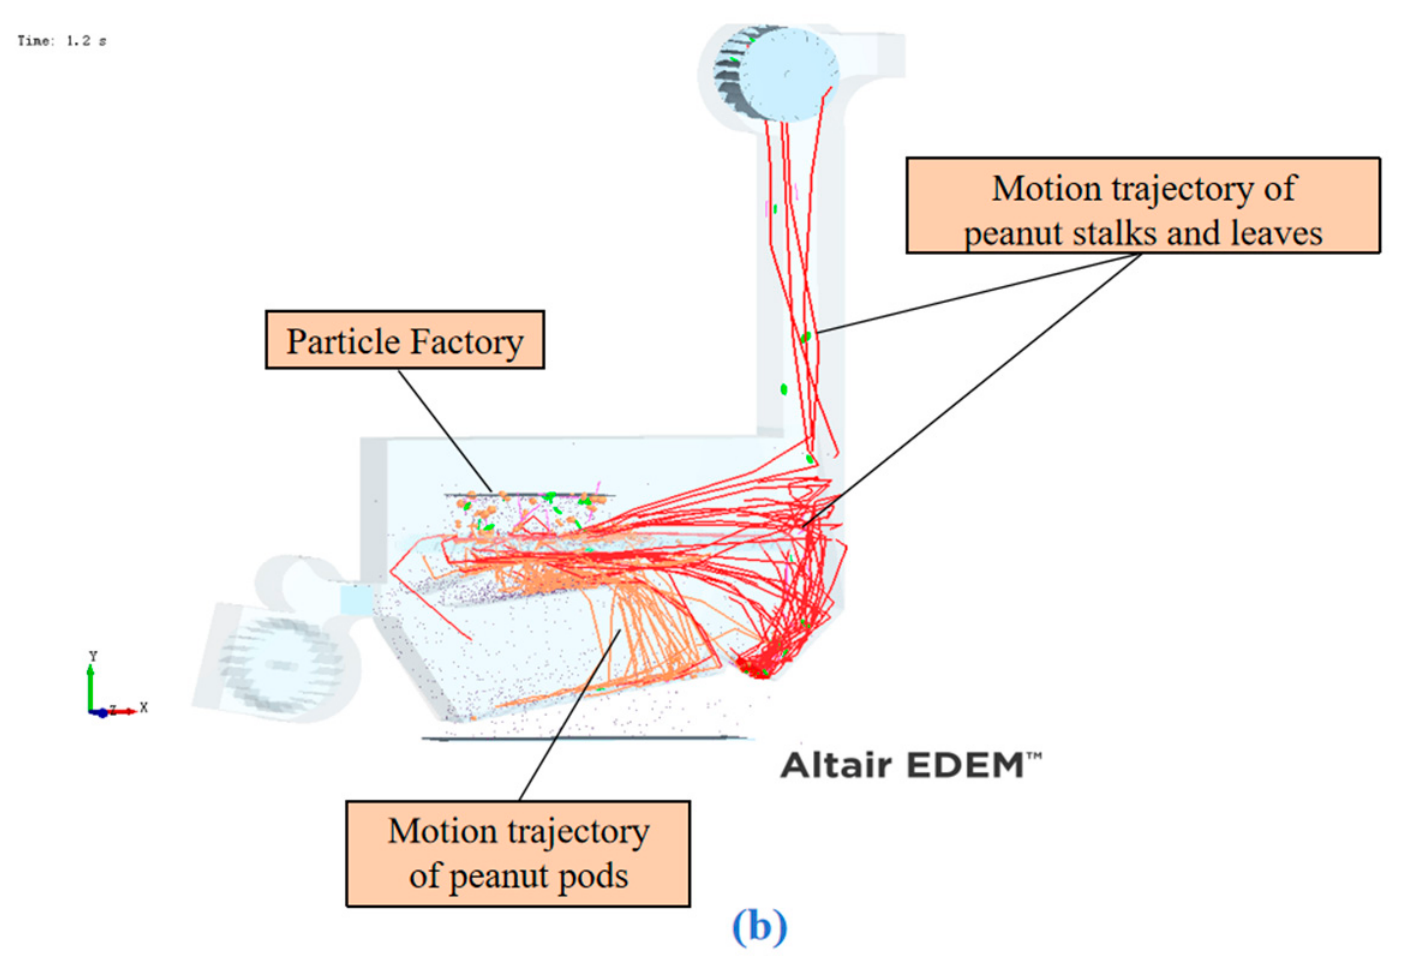
A stable transient at 4.4 s was selected for analysis of the material sorting state. The material distribution and particle trajectories are shown in Figure 8. In Figure 8a, pods accumulate in the discharge region below the screen body, soil impurities fall through the screen, light stems and leaves migrate upward under the action of the impurity-suction airflow, and un-sorted materials fall into the secondary cleaning region for return screening. In the trajectory diagram in Figure 8b, the red trajectories (light impurities such as stems and leaves) are removed upward under the traction of the airflow, while the orange trajectories (pods) are conveyed in order along the screen surface toward the discharge end, clearly revealing the separation mechanism of threshed materials under the synergistic action of airflow and vibration.
Figure 8.
Annotation of key regions in the cleaning operation and particle motion trajectories: (a) material distribution; (b) particle trajectories.
Among them, the impurity content rate (Y1) is the percentage of the mass of impurities such as short stems that fall through the screen holes into the collection device relative to the total mass of the collected material, and it is calculated according to Equation (20). The loss rate (Y2) is the percentage of the mass of peanut pods sucked away by the tail impurity-suction fan relative to the total input mass of peanut pods, and it is calculated according to Equation (21) [29].
Effect of Crossflow Fan Rotational Speed on Impurity Content Rate (Y1) and Loss Rate (Y2)
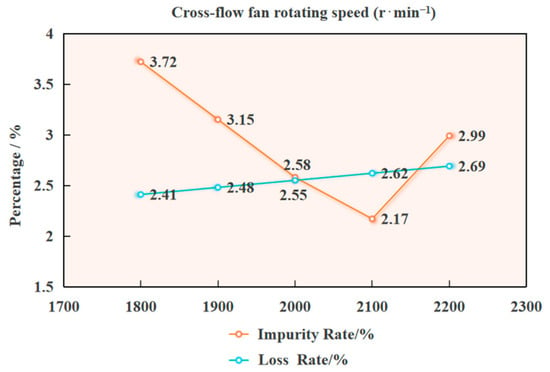
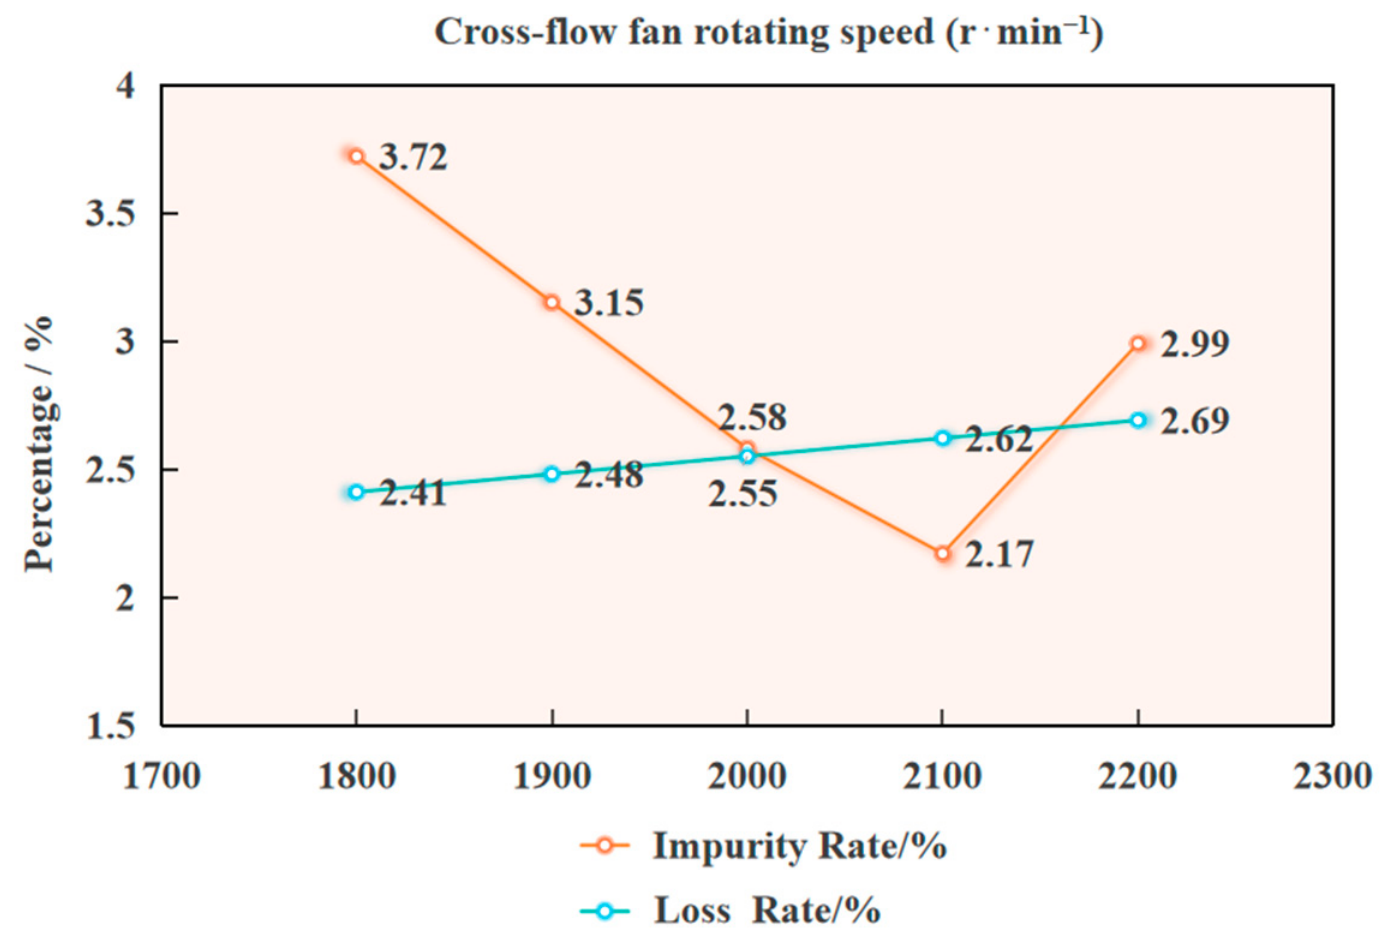
With the vibration frequency fixed at 6 Hz and the impurity-suction fan rotational speed fixed at 1800 r/min, the effects of the crossflow fan rotational speed in the range of 1800–2200 r/min on the impurity content rate Y1 and the loss rate Y2 were analyzed. The results show that with the increase in the crossflow fan rotational speed, the impurity content rate exhibits a nonlinear trend of first decreasing and then increasing, while the loss rate continuously increases slowly. There exists an optimal rotational speed range that balances low impurity content and low loss.
As shown in Figure 9, when the crossflow fan rotational speed is relatively low (1800 r/min), the airflow disturbance is insufficient, the material accumulates densely, and the stratification effect is poor, resulting in a relatively high impurity content rate and a relatively low loss rate. When the rotational speed increases to 1900–2000 r/min, the material looseness improves and stratification becomes sufficient, so the impurity content rate decreases significantly, reaching its minimum at 2000 r/min, while the loss rate remains within a reasonable range, achieving a good balance between the two indicators. When the rotational speed increases to 2100–2200 r/min, the excessively strong airflow causes the material to become airborne and disordered, and the impurity content rate rises again. At the same time, peanut pods are entrained and carried away, the loss rate continues to increase, and the cleaning performance deteriorates. In summary, an excessively low rotational speed leads to a high impurity content rate, while an excessively high rotational speed increases the loss rate. Therefore, 1950–2150 r/min is the preferable working parameter range under this working condition.
Figure 9.
Effects of crossflow fan rotating speed on cleaning performance.
Effect of Suction Fan Rotational Speed on Impurity Content Rate (Y1) and Loss Rate (Y2)
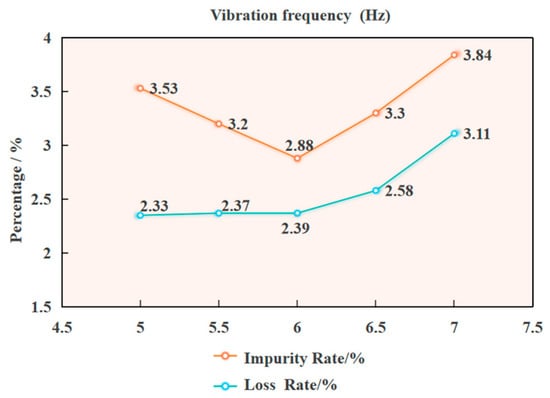
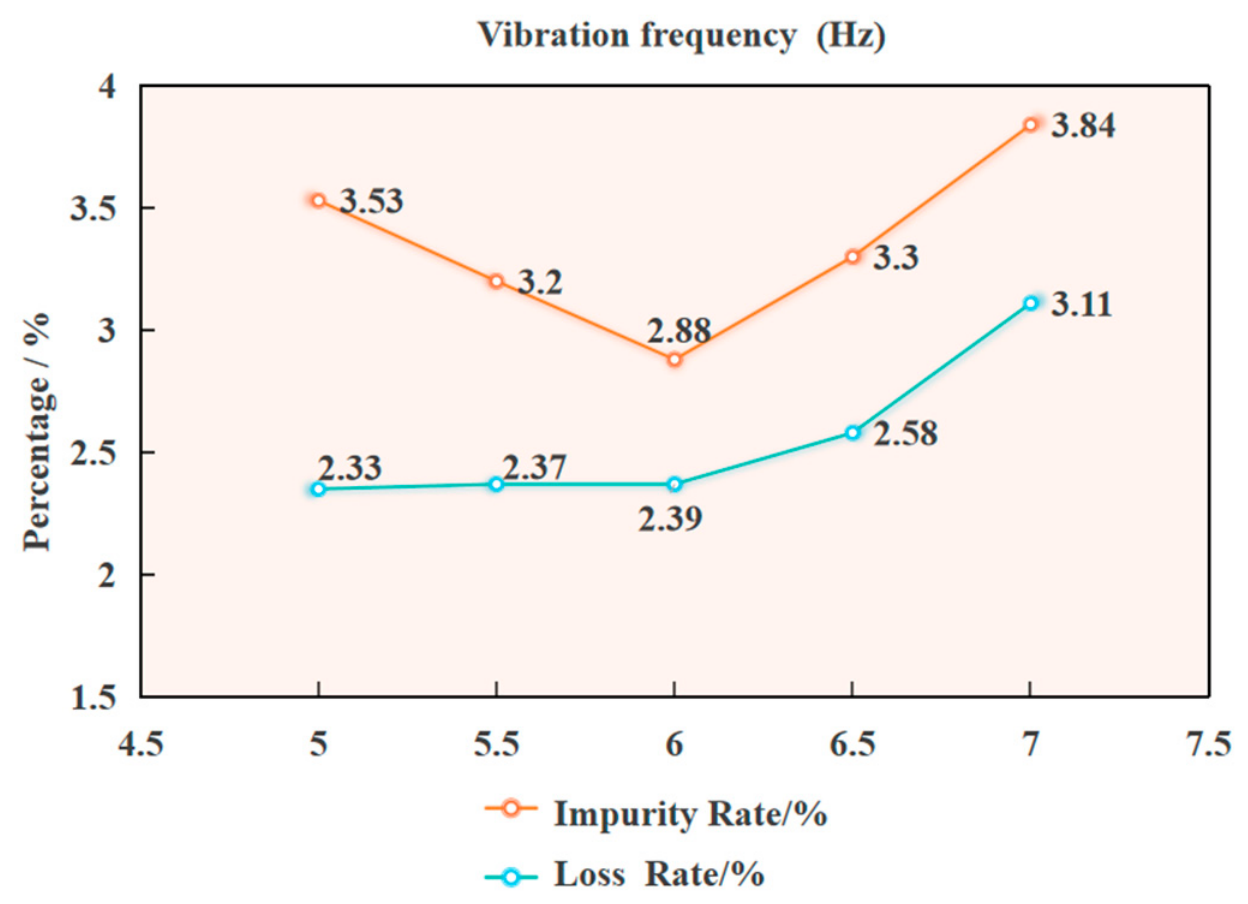
With the crossflow fan rotational speed fixed at 2000 r/min and the impurity-suction fan rotational speed fixed at 1800 r/min, the effect of vibration frequency in the range of 5.0–7.0 Hz on cleaning performance was investigated, as shown in Figure 10. The results show that with the increase in vibration frequency, the impurity content rate first decreases and then increases, while the loss rate remains stable at first and then increases significantly.
Figure 10.
Effects of vibration frequency on cleaning performance.
As shown in Figure 10, at a vibration frequency of 5.0 Hz, the screen surface vibration is weak, the material accumulates densely, and stratification is poor. As a result, stem impurities are difficult to remove by the airflow, leading to a relatively high impurity content rate and a relatively low loss rate. When the vibration frequency increases to 6.0 Hz, the material becomes loose and uniform, and stratification is sufficient. The impurity content rate drops to its minimum, the loss rate remains stable, and the cleaning performance is optimal. When the vibration frequency increases to 6.5–7.0 Hz, the material churns violently and the material layer becomes disordered, causing the impurity content rate to rise again. At the same time, a large number of peanut pods are thrown upward, the loss rate increases, and the cleaning performance deteriorates. In summary, an excessively low vibration frequency leads to a high impurity content rate, while an excessively high vibration frequency increases the loss rate. Therefore, 5.5–6.5 Hz is the preferable parameter range.
Effect of Vibration Frequency on Impurity Content Rate (Y1) and Loss Rate (Y2)
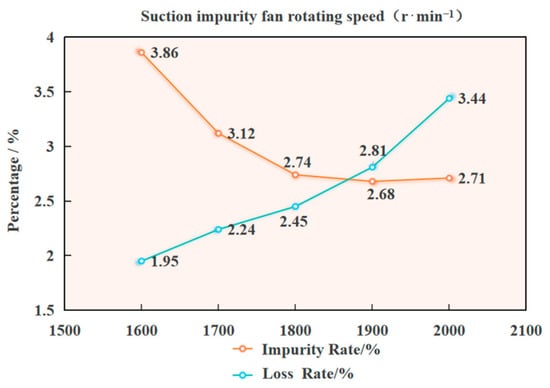
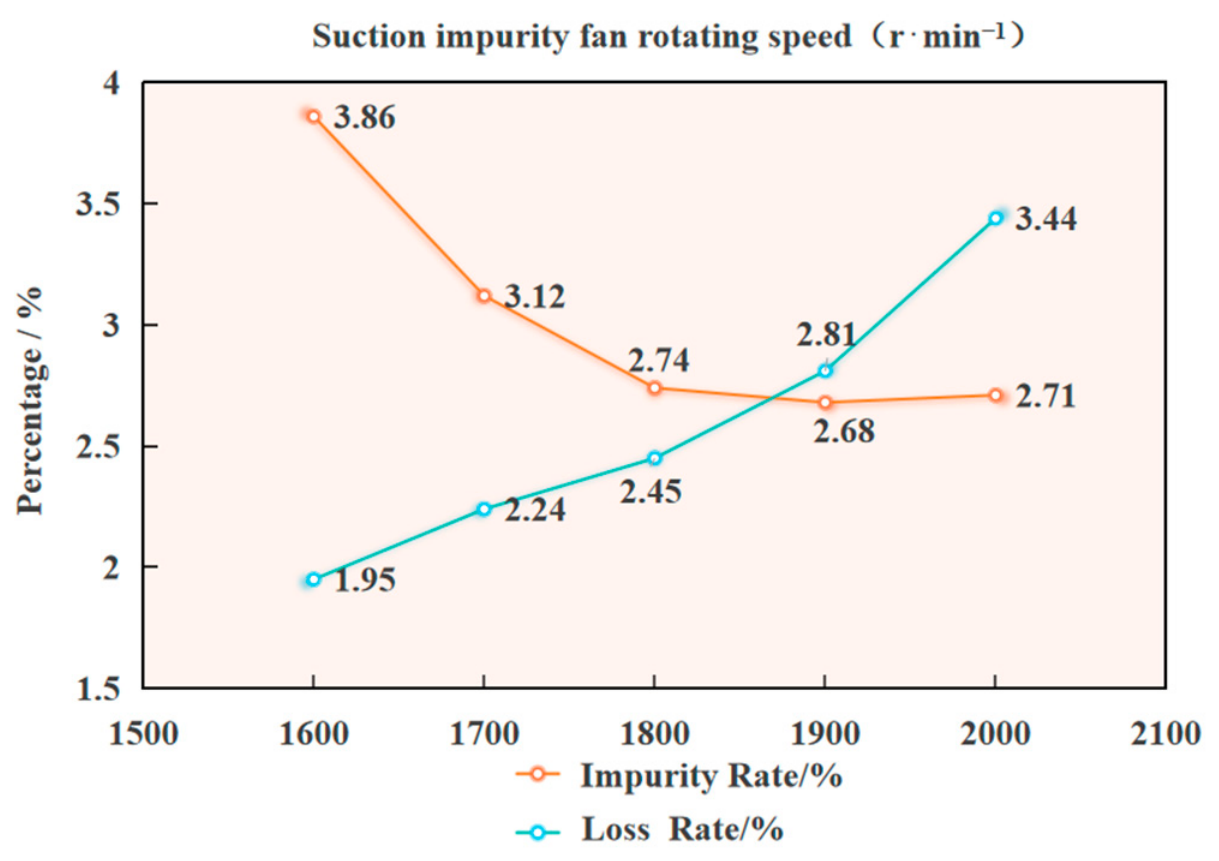
With the crossflow fan rotational speed fixed at 2000 r/min and the vibration frequency fixed at 6.0 Hz, the effect of the impurity-suction fan rotational speed in the range of 1600–2000 r/min on cleaning performance was analyzed, as shown in Figure 11. With the increase in rotational speed, the impurity content rate first decreases and then rises slightly, while the loss rate continuously increases in an approximately linear manner.
Figure 11.
Effects of suction impurity fan rotating speed on cleaning performance.
As shown in Figure 11, at a rotational speed of 1600 r/min, the suction force is insufficient, the stems cannot be removed thoroughly, the impurity content rate is relatively high, and the loss rate is relatively low. When the rotational speed increases to 1800 r/min, the suction force is moderate, the stems are efficiently removed, the impurity content rate drops to its minimum, and the loss rate remains moderate, giving the best cleaning performance. When the rotational speed increases to 1900–2000 r/min, impurities have already been largely removed, and the decrease in the impurity content rate slows down; however, the excessively strong suction force draws peanut pods into the impurity-suction duct, causing the loss rate to continuously increase and the cleaning effect to deteriorate. In summary, an excessively low rotational speed leads to a high impurity content rate, while an excessively high rotational speed increases the loss rate. Therefore, 1800–1900 r/min is the preferable rotational speed range.
3.1.4. Box–Behnken Regression Design Experiment
Experimental Scheme and Results
To simultaneously optimize the impurity content rate (Y1) and the loss rate (Y2), and to analyze the effects and interactions of the three parameters, namely the crossflow fan rotational speed A, vibration frequency B, and impurity-suction fan rotational speed C, a three-factor, three-level Box–Behnken response surface design was adopted. Based on preliminary simulations and pre-experiments, the range of each factor was determined and a level coding table was established. A total of 17 experimental schemes were formulated and randomly conducted to eliminate systematic errors [30]. The factor coding is shown in Table 6.
Table 6.
Factor levels.
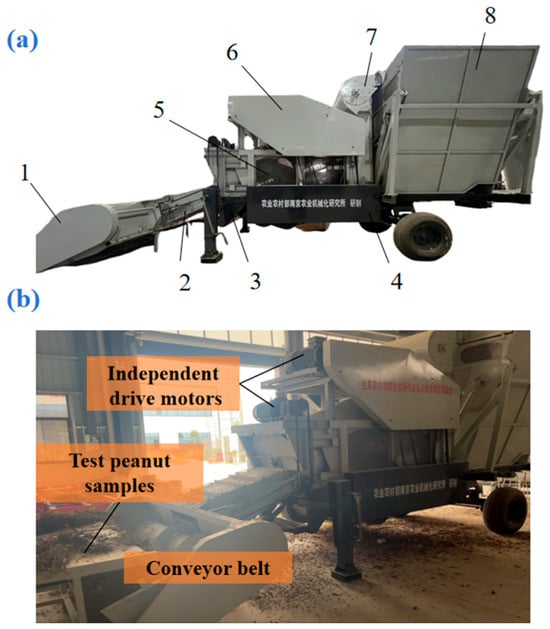
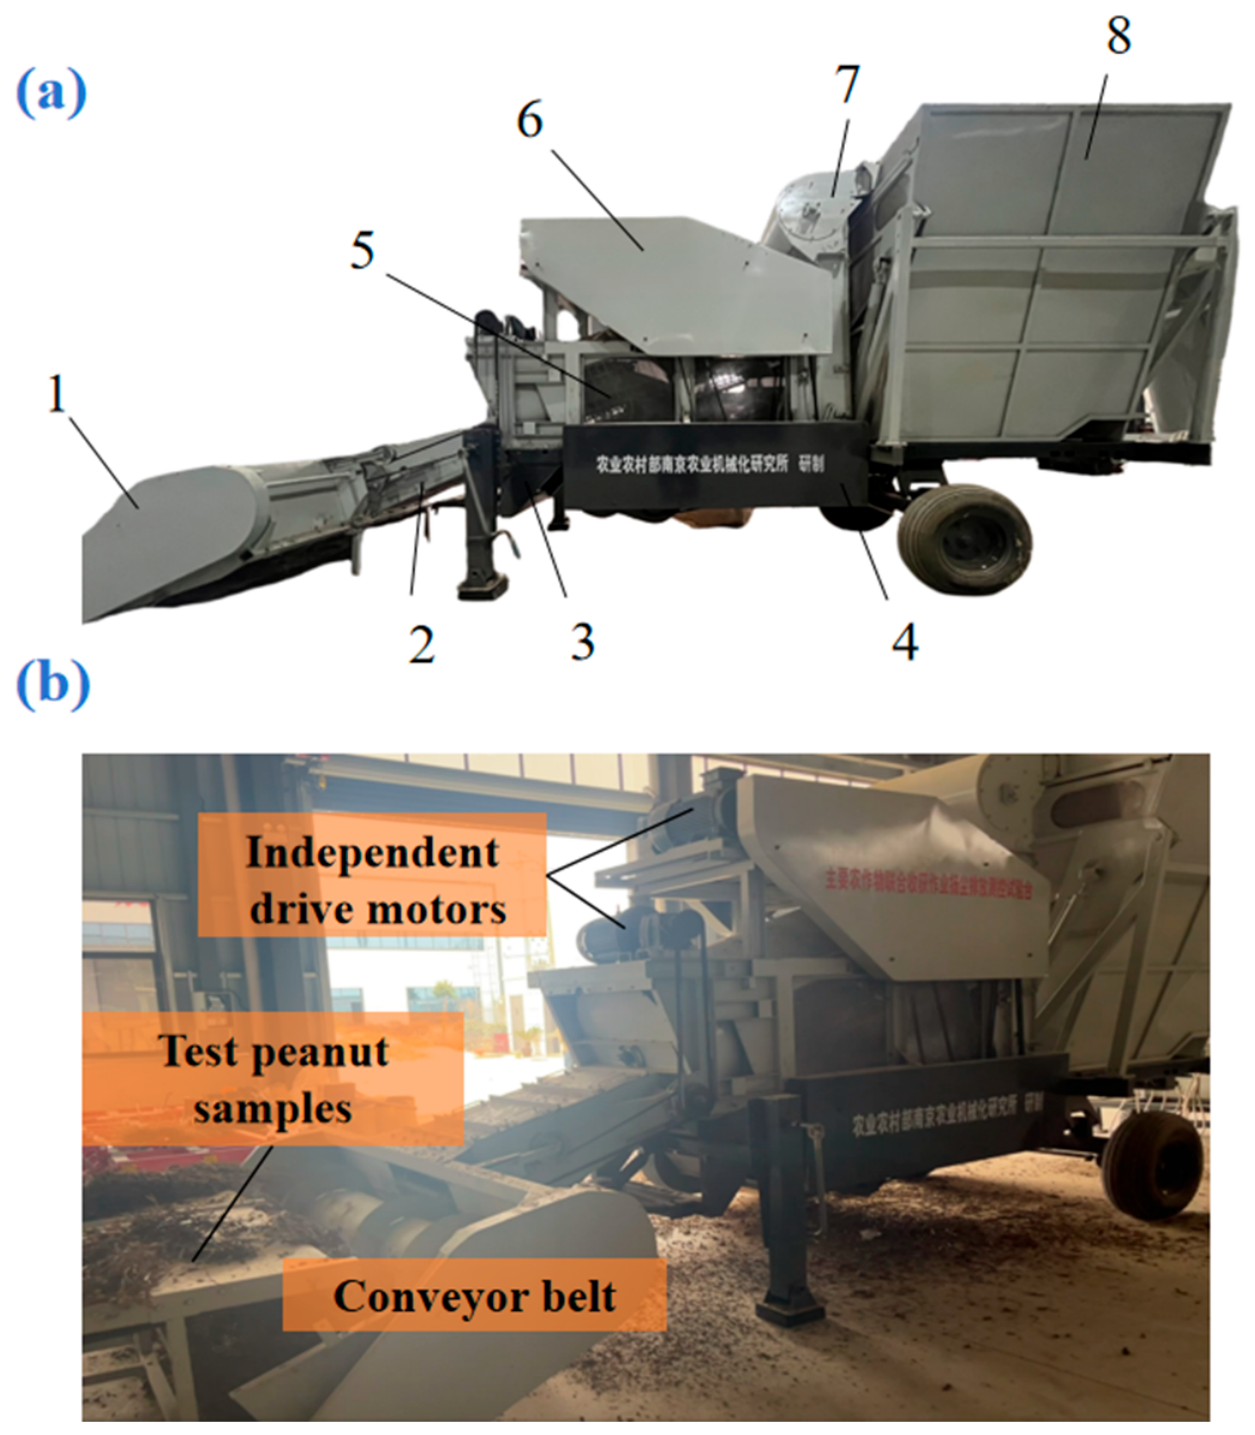
The self-developed cleaning device was installed on an axial-flow pickup harvester to form a self-propelled harvesting test bench, as shown in Figure 12a. Each moving part was independently driven by a motor, allowing flexible adjustment of the working parameters. The test material was Baisha-3, with a moisture content of about 20%, and it was fed at a constant rate by a conveyor belt. The crossflow fan rotational speed (A), vibration frequency (B), and impurity-suction fan rotational speed (C) were controlled by adjusting the motor frequency. After each set of parameters had been run stably, samples were taken from the grain outlet and the impurity discharge outlet to measure the impurity content rate and loss rate. Each set of tests was repeated three times, and the average value was taken. The test sequence was carried out according to the principle of randomization to eliminate systematic errors. The experimental scheme and results are shown in Table 7, where A, B, and C are coded values. The experiments were carried out in September 2025. Data processing was performed from October to November 2025.The results are shown in Table 7.
Figure 12.
Test bench and test site of peanut cleaning device. (a) Structural composition of cleaning device test bench. 1. Header; 2. transition conveyor; 3. crossflow fan; 4. secondary cleaning auger; 5. peanut picking drum; 6. fruit collecting box; 7. impurity-suction fan; 8. straw collecting box. (b) Operation site of peanut cleaning test.
Table 7.
Test scheme and test results.
Establishment of Regression Model and Analysis of Variance
Using Design-Expert, multiple-regression fitting analysis was performed on the experimental results [31] (see Table 8 and Table 9), and the regression equations between the crossflow fan rotational speed A, vibration frequency B, impurity-suction fan rotational speed C, and the impurity content rate Y1 and loss rate Y2 were established as follows:
Y1 = 1.608 − 0.46125A + 0.15B − 0.25375C − 0.0875AB + 0.12AC + 0.0925BC + 0.916A2 + 1.0135B2 + 0.951C2
Y2 = 2.52 + 0.04875A + 0.095B + 0.43625C −0.0575AB−0.09AC + 0.0675BC − 0.2575A2 + 0.075B2 − 0.0625C2
Table 8.
Analysis-of-variance results of impurity content.
Table 9.
Analysis-of-variance results of loss rate.
The analysis-of-variance results for the impurity content rate and loss rate show that the regression models of both response indicators have extremely significant explanatory power (impurity content rate model: F = 388.31, p < 0.0001; loss rate model: F = 80.92, p < 0.0001), and both models fit well (the p-values of the lack-of-fit terms are 0.9131 and 0.4821, respectively, both greater than 0.05, indicating no significant lack of fit). In terms of specific influencing factors: for the main effects, A, B, and C all show significant effects on both the impurity content rate and the loss rate. For the quadratic terms, A2, B2, and C2 all show significant effects on the two indicators (p < 0.05); their effects on the impurity content rate reach an extremely significant level (p < 0.01).
In addition, the overall evaluation metrics of the regression models for impurity content rate and loss rate are listed in Table 10. For the impurity content rate model, the R2 was 0.9980, the adjusted R2 (R2adj) was 0.9954, the predicted R2 (R2pred) was 0.9937, the coefficient of variation (C.V.%) was 2.25%, and the adequate precision was 52.8074. For the loss rate model, the R2 was 0.9905, R2adj was 0.9782, R2pred was 0.9265, C.V.% was 2.18%, and the adequate precision was 37.5235. For both models, the differences between R2pred and R2adj were less than 0.2, and the adequate precision values were well above 4, indicating that the models have high fitting accuracy and good predictive capability. Based on these models, the interaction effects of the factors on the cleaning performance were further analyzed.
Table 10.
Evaluation metrics of the regression models.
Interaction Analysis
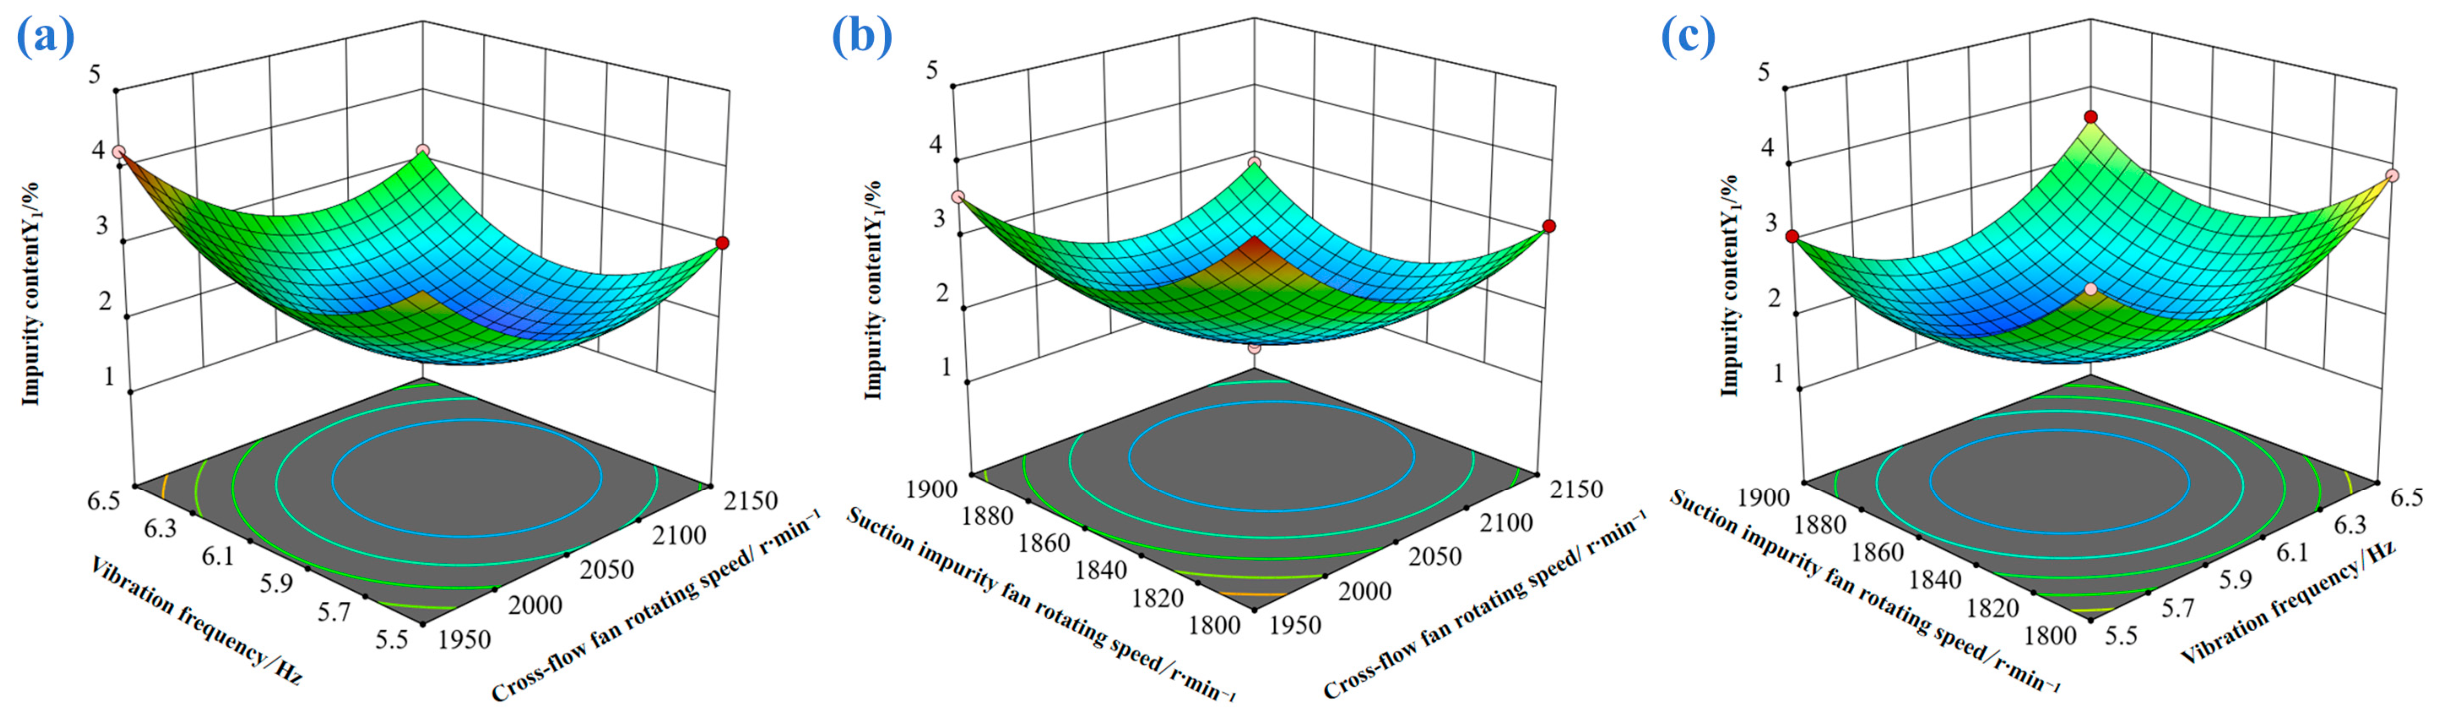
On the basis of clarifying that the main effects of each factor are significant, in order to further investigate the interactions among factors and their optimal combination for the response values of impurity content rate and loss rate, response surface analysis was adopted for in-depth analysis [32]. A response surface model was constructed with the aid of Design-Expert, as shown in Figure 12 and Figure 13.
Figure 13.
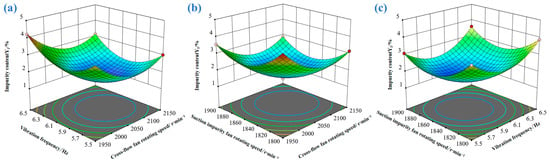
Effects of interaction of various factors on impurity content. (a) Vibration frequency vs. cross-flow fan rotating speed; (b) Suction impurity fan rotating speed vs. cross-flow fan rotating speed; (c) Suction impurity fan rotating speed vs. vibration frequency.
Figure 13a shows that the impurity content rate first decreases rapidly and then increases rapidly with the increase in the impurity-suction fan rotational speed, and first decreases and then increases slowly with the increase in vibration frequency. Figure 13b shows that the impurity content rate first decreases rapidly and then increases rapidly with the increase in the crossflow fan rotational speed, and first decreases and then increases with the increase in the impurity-suction fan rotational speed. Figure 13c shows that the impurity content rate first decreases rapidly and then increases with the increase in the crossflow fan rotational speed, and first decreases and then increases slowly with the increase in vibration frequency.
Combined with the regression model diagnosis and ANOVA results in Table 8, the regression model for impurity content is highly significant (p < 0.0001), and the lack-of-fit term is insignificant (p = 0.9131 > 0.05), indicating good model fitting. The test of interaction effects shows that the AB and BC interactions are significant (p < 0.05), while the AC interaction is highly significant (p = 0.0088). These interaction effects jointly determine the variation patterns of the response surfaces in Figure 12.
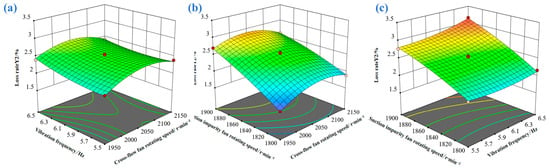
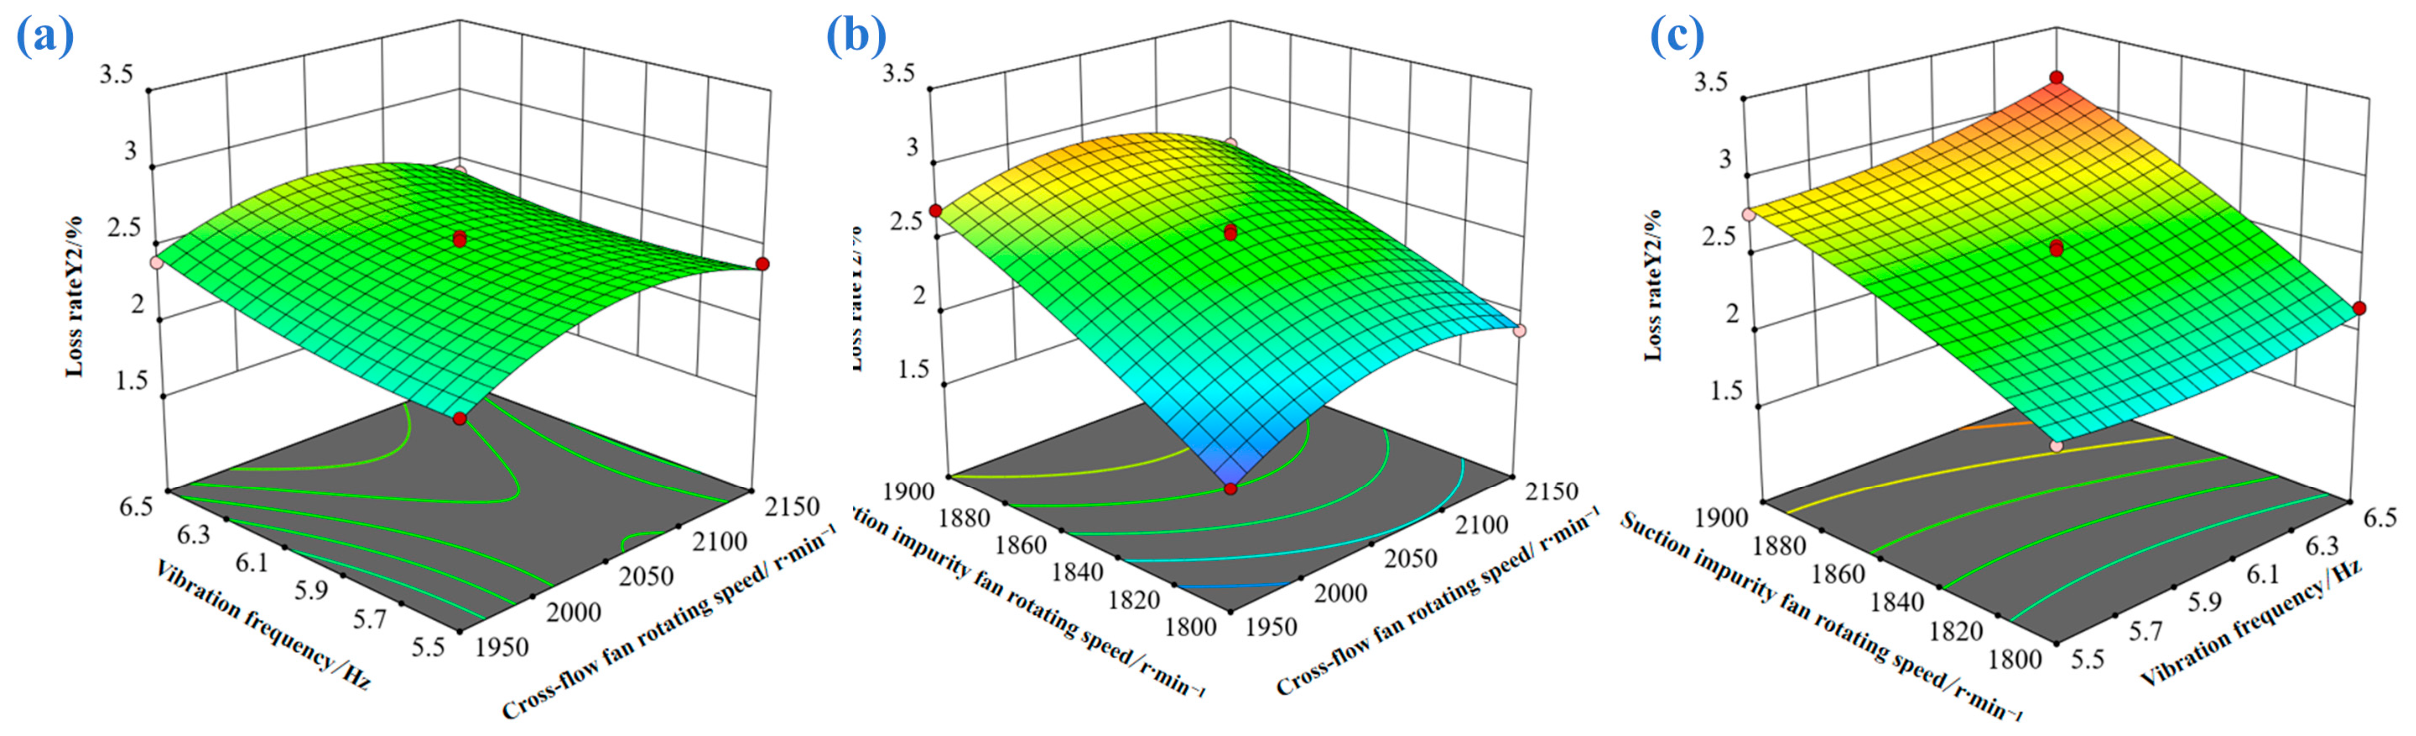
Figure 14a shows that the loss rate exhibits a continuously increasing trend with the increase in the impurity-suction fan rotational speed, and also shows an obvious upward trend with the increase in vibration frequency; under the synergistic action of the two, the increase in the loss rate is more significant. Figure 14b shows that the loss rate first decreases rapidly and then increases slowly with the increase in the crossflow fan rotational speed, and shows a continuously decreasing trend with the increase in the impurity-suction fan rotational speed. Figure 14c shows that the loss rate first decreases rapidly and then increases slowly with the increase in the crossflow fan rotational speed, and first decreases slowly and then increases slightly with the increase in vibration frequency, with a relatively gentle overall range of variation.
Figure 14.
Effects of interaction of various factors on loss rate. (a) Vibration frequency vs. cross-flow fan rotating speed; (b) Suction impurity fan rotating speed vs. cross-flow fan rotating speed; (c) Suction impurity fan rotating speed vs. vibration frequency.
Combined with the regression model diagnosis and ANOVA results in Table 9, the regression model for loss rate is highly significant (p < 0.0001), and the lack-of-fit term is insignificant (p = 0.4821 > 0.05), indicating good model fitting. The test of interaction effects shows that the AC and BC interactions are significant (p < 0.05), among which the AC interaction is highly significant (p = 0.0108), while the AB interaction is not significant (p = 0.0640 > 0.05). These interaction effects jointly determine the variation patterns of the response surfaces of loss rate.
Coupling Optimization of Airflow Field Parameters for the Dual-Airflow System
On the basis of revealing the nonlinear interactive effects of the three factors on the impurity content rate and loss rate, the optimal operating range was determined through multi-objective optimization. By integrating the response surface characteristics and taking into account the constraints of minimizing the impurity content rate and keeping the loss rate controllable, a coordinated parameter regulation strategy was established to define a stable working domain with high efficiency and low consumption:
In the desirability function setup, both the impurity content rate and loss rate were set as minimization objectives. Regarding the trade-off, equal weights (1:1) were assigned to the two indicators to balance cleaning quality and yield loss, avoiding a significant increase in pod loss while pursuing an extremely low impurity content, and the optimal parameter combination was ultimately determined by maximizing the overall desirability. Based on the multi-response optimization in Design-Expert, a global optimal solution balancing low impurity content and low loss was obtained: a crossflow fan speed of 2103.98 r/min, a vibration frequency of 5.97 Hz, and a suction fan speed of 1824.17 r/min, with predicted impurity content rate of 1.98% and loss rate of 2.25%. Considering the adjustment precision and process stability of the equipment, these values were rounded to 2104 r/min, 6 Hz, and 1824 r/min. This combination offers good engineering feasibility and robustness and can serve as the recommended configuration.
3.2. Verification Experiment
To verify the structural rationality of the prototype and the effectiveness of the parameter optimization results, verification experiments were carried out with the impurity content rate and loss rate as indicators. The actual cleaning performance under the optimized parameters was compared with the model-predicted values to evaluate the engineering feasibility and robustness of the prototype design and parameter configuration.
3.2.1. Experimental Materials and Methods
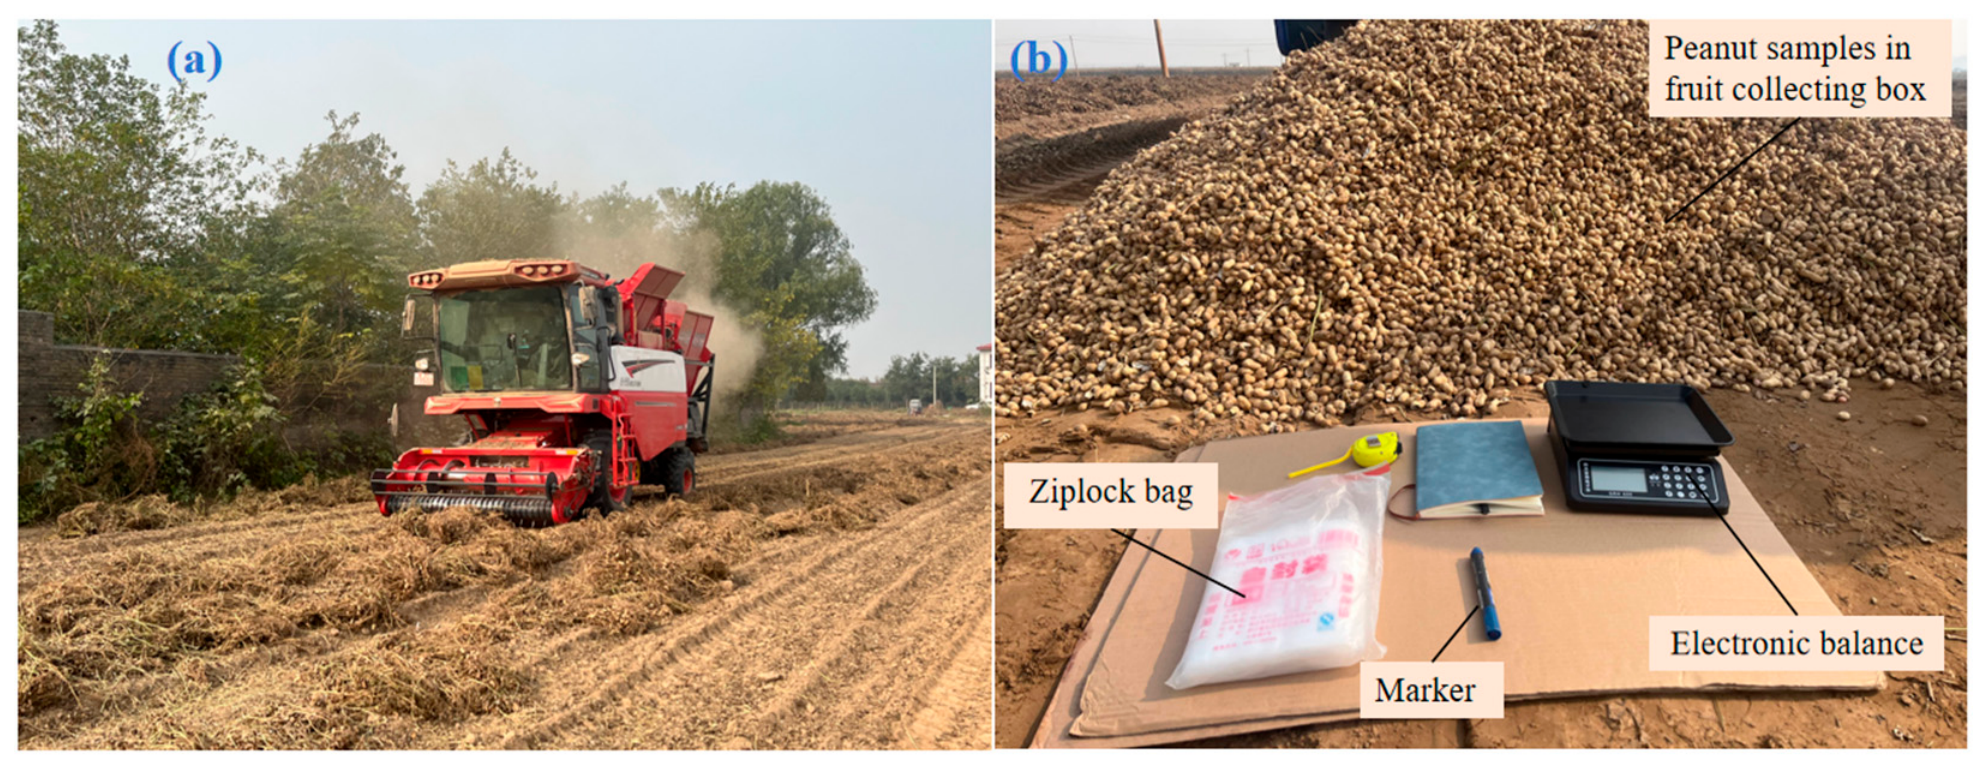
As shown in Figure 15, the verification experiments were conducted at the experimental base in Gaocun Township, Xingyang City, Henan Province. The tested variety was “Baisha-3”, which was naturally sun-dried for 6 days after vine turning. The experimental field had an area of 500 m2 (10 m × 50 m), with loam soil. The self-developed cleaning test prototype was used, and the parameters were set according to the multi-response optimization results. With the impurity content rate and loss rate as indicators, repeated sampling and weighing were carried out to verify the actual working performance and the reliability of the model prediction.
Figure 15.
Field test and sample detection of peanut harvesting prototype. (a) Field operation test of peanut harvesting prototype. (b) Weighing and data statistics of field test samples.
3.2.2. Experimental Results and Analysis
The experimental results are shown in Table 11. Under the optimized parameters, the actual impurity content rate of the prototype was 2.06%, and the loss rate was 2.33%. The regression model showed high prediction accuracy and engineering reliability. Under this parameter combination, the cleaning system operated smoothly, and the synergistic effects of airflow, vibration, and suction were significant. Pod cleanliness was improved and entrainment loss was effectively controlled, verifying the effectiveness and robustness of the optimized range. The actual impurity content rate and loss rate were both higher than the predicted values, mainly due to the complex field environment: uneven field surface, fluctuations in feed rate, and the relatively strong pod stalk toughness of “Baisha-3”, which led to poorer impurity separation and a higher loss rate.
Table 11.
Results of verification experiments.
Compared with the traditional single-air-duct winnowing system, the optimized positive–negative-pressure collaborative dual-airflow cleaning device showed significant reductions in both the impurity content rate and the loss rate (Table 12). According to NY/T 502-2016 Operation Quality of Peanut Harvesters and the technical guidance for loss reduction [33,34], under the optimized parameters, the actual impurity content rate was 2.06% and the loss rate was 2.33%, which were 2.94 and 2.67 percentage points lower than the standard, respectively. Both indicators were significantly better than the current standard and the guidance, verifying the effectiveness of the device in full-feed peanut combine harvesting. Compared with the commonly adopted parameters of the single-duct fan and single-layer vibrating-screen air separation system used in peanut picking harvesters under identical harvesting conditions, the optimized device reduces the impurity content by 0.21 percentage points and the pod loss rate by 0.61 percentage points, which verifies the effectiveness of the positive–negative-pressure cooperative dual-air-channel structure in whole-feed peanut combine harvesting.
Table 12.
Comparison of cleaning performance.
4. Conclusions
(1) A peanut cleaning system of positive–negative-pressure collaborative dual-airflow coupled with vibrating screening was designed. Through theoretical analysis, the influence mechanisms of the three parameters, namely the crossflow fan rotational speed, vibration frequency, and impurity-suction fan rotational speed, on cleaning performance were clarified. A CFD–DEM coupling simulation model was established, revealing the effects of each parameter and their interactions on the impurity content rate and loss rate.
(2) A quadratic regression prediction model for the impurity content rate and loss rate was constructed using the response surface method. Through multi-objective optimization, the optimal parameter combination was determined as follows: a crossflow fan rotational speed of 2104 r/min, a vibration frequency of 6 Hz, and an impurity-suction fan rotational speed of 1824 r/min, with predicted impurity content rate of 1.98% and loss rate of 2.25%, showing significant advantages over the traditional single-air-duct system.
(3) Field verification experiments showed that the optimized system operated stably, with an actual impurity content rate of 2.06% and a loss rate of 2.33%, which were consistent with the predicted trends. Compared with the national standard, these values were reduced by 2.94 and 2.67 percentage points, respectively. Under identical harvesting conditions, the optimized device reduces the impurity content and pod loss rate by 0.21 and 0.61 percentage points, respectively, compared with the conventional single-duct and single-layer vibrating-screen cleaning scheme for peanut pickers. This verifies the reliability of the theoretical analysis, coupled simulation, and parameter optimization methods, as well as the practical value of the system in improving cleaning quality and operational efficiency. It should be noted that the above results were obtained under a single variety and a single field condition. While these results provide useful evidence for the performance of the device, further verification under a wider range of varieties and field conditions would be helpful to confirm its broader adaptability.
Author Contributions
Conceptualization, P.C., F.W. and C.Z.; methodology, P.C., Z.Y. and H.Y.; software, P.C. and C.Z.; validation, Z.Y., F.G. and F.W.; formal analysis, P.C., H.Y. and C.Z.; investigation, P.C. and F.G.; resources, F.W.; data curation, P.C. and Z.Y.; writing—original draft preparation, P.C.; writing—review and editing, P.C., H.Y., F.G. and F.W.; visualization, P.C. and C.Z.; supervision, F.W.; project administration, F.W.; funding acquisition, F.W. All authors have read and agreed to the published version of the manuscript.
Funding
This research was funded by the Key R&D Program of Henan Province (251111113100), Natural Science Foundation of Jiangsu Province (BK20241739), Agricultural Science and Technology Innovation Program of Chinese Academy of Agricultural Sciences (ASTIP), and China Agriculture Research System (CARS-13).
Institutional Review Board Statement
Not applicable.
Data Availability Statement
The original contributions presented in this study are included in the article. Further inquiries can be directed to the corresponding author.
Conflicts of Interest
The authors declare no conflicts of interest.
References
- Shen, H.Y.; Luo, W.W.; Wu, F.; Gu, F.W.; Yang, H.G.; Hu, Z.C. Research Progress on Mechanized Harvesting Equipment and Technology for Peanuts. Trans. Chin. Soc. Agric. Mach. 2024, 55, 21–38. [Google Scholar]
- Zhang, M.E.; Wang, C.Y.; Song, Y.L.; Sun, S.; Wu, D.R.; Liu, R.H. Risk Assessment of Drought and Waterlogging Disasters during Growth Period of Summer Peanuts in Henan Province. Trans. Chin. Soc. Agric. Eng. 2022, 38, 158–168. [Google Scholar]
- National Bureau of Statistics. Available online: https://data.stats.gov.cn/ (accessed on 10 September 2026).
- Wang, S.Y.; Hu, Z.C.; Chen, Y.Q.; Wu, H.C.; Wang, Y.W.; Wu, F.W. Integration of Agricultural Machinery and Agronomy for Mechanised Peanut Production Using the Vine for Animal Feed. Biosyst. Eng. 2022, 188, 137–151. [Google Scholar] [CrossRef] [Scilit]
- Gao, L.X.; Liang, G.P.; Cai, Y.L.; Feng, W.Z.; Yang, Y.Z.; Liu, J.; Yang, J.G. Development of Shovel-Tooth Double Combined Roller Peanut Pickup Device. Trans. Chin. Soc. Agric. Eng. 2024, 40, 13–22. [Google Scholar]
- Wang, F.R.; Li, B.; Zhu, R.G.; Wang, S.G.; Liu, Y.; Gao, X.L.; Yang, X.Y. Design and Test of Air-Screen Cleaning Device for Cumin Thresher. Trans. Chin. Soc. Agric. Eng. 2024, 40, 39–50. [Google Scholar]
- Yang, Z.L.; Wang, L.J.; Zhang, Y.Y.; Wang, S.G.; Liu, Y.; Gao, X.L.; Yang, X.Y. Enhancing Maize Grain Cleaning before Storage Using a Multi-Dovetail Shape and Planar Combined Sieve: CFD-DEM Simulation and Experimental Validation. Biosyst. Eng. 2025, 258, 87–102. [Google Scholar]
- Mekonnen, G.G.; De Baerdemaeker, J.; Baelmans, M. Effect of a cross-flow opening on the performance of a centrifugal fan in a combine harvester: Computational and experimental study. Biosyst. Eng. 2010, 105, 247–256. [Google Scholar] [CrossRef] [Scilit]
- Badretdinov, I.; Mudarisov, S.; Lukmanov, R.; Permyakov, V.; Ibragimov, R.; Nasyrov, R. Mathematical modeling and research of the work of the grain combine harvester cleaning system. Comput. Electron. Agric. 2019, 165, 104966. [Google Scholar] [CrossRef] [Scilit]
- Gao, L.X.; Li, X.Q.; Guan, M.; Cheng, J.; Zhang, X.D.; Liu, Z.X. Design and Test on Cleaning Device of Peanut Pods with Double Air-Suction Inlets with Vibration Screen. Trans. Chin. Soc. Agric. Mach. 2015, 46, 110–117. [Google Scholar]
- Wang, B.; Hu, Z.C.; Peng, B.L.; Zhang, Y.H.; Gu, F.W.; Shi, L.L.; Gao, X.M. Optimization of Structural and Operating Parameters of Flicker Screen for Half-Feed Four-Row Peanut Combine Harvester. Trans. Chin. Soc. Agric. Eng. 2017, 33, 20–28. [Google Scholar]
- Yu, Z.Y.; Hu, Z.C.; Cao, M.Z.; Wang, S.Y.; Zhang, P.; Peng, B.L. Design of Cleaning Device of Tangential Flow and Whole-Feed Peanut Combine Harvester. Trans. Chin. Soc. Agric. Eng. 2019, 35, 29–37. [Google Scholar]
- Chen, S. Cleaning Simulation and Key Parameter Optimization of Wheat Harvester Based on CFD-DEM. Master’s Thesis, University of Jinan, Jinan, China, 2021. [Google Scholar]
- Zhang, M.L.; Huang, Z.S.; Jiang, Y.C.; Qian, C.; Wang, Z.M. Design and Test of Seed Reducer for Air-Fed Rice-Wheat High-Speed Seeder Based on CFD-DEM. Trans. Chin. Soc. Agric. Mach. 2025, 56, 201–210. [Google Scholar]
- Chinese Academy of Agricultural Mechanization Sciences. Agricultural Machinery Design Handbook; China Agricultural Science and Technology Press: Beijing, China, 2007. [Google Scholar]
- Zhao, J.; Ren, Z.T.; Chen, H.K.; Jiang, Y.C.; Qian, C.; Wang, Z.M. Design and Test of Segmental Vibrating Screen for Notoginseng Seed Classifier. J. Chin. Agric. Mechan. 2025, 46, 186–193. [Google Scholar]
- Wang, B.K.; Yu, Z.Y.; Hu, Z.C.; Cao, M.Z.; Zhang, P.; Wang, B. Numerical Simulation and Experiment of Flow Field in Three Air Systems of Air Separation System of Peanut Pickup Harvester. Trans. Chin. Soc. Agric. Mach. 2021, 52, 103–114. [Google Scholar]
- Chen, N.; Tian, L.Q.; Zhang, Z.Z.; Li, L.; Wang, Z.M.; Chen, D.J. Design and Test of Double Conical Centrifugal Cleaning Fan for Half-Feed Combine Harvester. Trans. Chin. Soc. Agric. Mach. 2022, 53, 193–202. [Google Scholar]
- Montazerin, N.; Akbari, G.; Mahmoodi, M. Developments in Turbomachinery Flow: Forward Curved Centrifugal Fans; Woodhead Publishing: Oxford, UK, 2015. [Google Scholar]
- Shi, G.K.; Li, J.B.; Ding, L.P.; Kan, Z. Design and Experiment of Inertia Pneumatic Type Cleaner System of Jujube Fruit. Trans. Chin. Soc. Agric. Mach. 2022, 53, 167–176. [Google Scholar]
- Feng, X.; Gao, Y.P.; Wang, L.J.; Jiang, C.Z.; Huang, W.Y.; Wang, S.H. Investigation of the Gas-Solid Two-Phase Motion in the Cleaning Device with Imitating the Pigeon Feather Sieve Based on the CFD-DEM Method. Biosyst. Eng. 2025, 257, 104233. [Google Scholar] [CrossRef] [Scilit]
- Wang, J.W.; Zhu, J.H.; Xu, Y.N.; Chen, Z.; Li, Y.; Liu, H. Study on Flow Field Characteristics in a Stabilised Airflow Region within a Rice Plot Air-Blowing Cleaning Header Based on CFD Simulation. Comput. Electron. Agric. 2025, 230, 109894. [Google Scholar] [CrossRef] [Scilit]
- Wang, H.Y.; Sun, Y.H.; Lei, Y.Q.; Wang, L.J. CFD Simulation of Winter and Summer Thermal Environment and Optimization of Cage Structure in Angora Rabbit Breeding Houses. Trans. Chin. Soc. Agric. Mach. 2026, 57, 361–373. [Google Scholar]
- Chen, P.; Yang, H.; Zhao, C.; Pei, J.Y.; Gu, F.W.; Wang, Y.R.; Yu, Z.Y.; Wu, F. Current Status and Future Prospects of Simulation Technology in Cleaning Systems for Crop Harvesters. Agriculture 2026, 16, 446. [Google Scholar] [CrossRef] [Scilit]
- Ge, S.J.; Li, S.L.; Pang, C.; Zhan, Y.; Zheng, W.C.; Li, X.S.; Li, B.M.; Zhang, Z.; Cui, W.H. Numerical Simulation and Optimization of Summer Thermal Environment in Sow House with Tunnel Precision Ventilation. Trans. Chin. Soc. Agric. Eng. 2025, 41, 231–239. [Google Scholar]
- Pokharel, A.; Akkerman, V.; Celik, I.B.; Axelbaum, R.L.; Islas, A.; Yang, Z. Impact of Particle Loading and Phase Coupling on Gas-Solid Flow Dynamics: A Case Study of a Two-Phase, Gas-Solid Flow in an Annular Pipe. Phys. Fluids 2021, 33, 073308. [Google Scholar] [CrossRef] [Scilit]
- Qin, M.; Jin, Y.; Luo, W.; Wu, F.; Shi, L.L.; Gu, F.W.; Cao, M.Z.; Hu, Z.C. Measurement and CFD-DEM Simulation of Suspension Velocity of Peanut and Clay-Heavy Soil at Harvest Time. Agronomy 2023, 13, 1735. [Google Scholar] [CrossRef] [Scilit]
- Xu, X.W.; Wei, H.; Yan, J.C.; Bao, G.C.; Du, Y.J.; Xie, H.X. Parameter Calibration of Discrete Element Simulation Parameters for Peanut Pods. J. Chin. Agric. Mech. 2022, 43, 81–89. [Google Scholar]
- GB/T 8097-2025; Harvesting Machinery—Combine Harvesters—Test Procedure and Performance Evaluation. China Standards Press: Beijing, China, 2025.
- Wang, F.; Alimu, M.; Zhang, J.S.; Li, Q.X.; Xu, L.M. Design and Experiment of Pre-screening Cleaning Device for Combined Screen Surface of Corn Grain Harvester. Trans. Chin. Soc. Agric. Mach. 2024, 55, 135–147,166. [Google Scholar]
- Ling, J.; Gu, M.; Luo, W.; Shen, H.Y.; Hu, Z.C.; Gu, F.W.; Wu, F.; Zhang, P.; Xu, H.B. Simulation Analysis and Test of a Cleaning Device for a Fresh-Peanut-Picking Combine Harvester Based on Computational Fluid Dynamics–Discrete Element Method Coupling. Agriculture 2024, 14, 1594. [Google Scholar] [CrossRef] [Scilit]
- Zarastvand, M.R.; Abdoli, E.; Talebitooti, R. A lattice metamaterial-based sandwich cylindrical system for numerical simulation approach of vibroacoustic transmission considering triply periodic minimal surface. Appl. Math. Mech.-Engl. Ed. 2025, 46, 2035–2054. [Google Scholar] [CrossRef] [Scilit]
- NY/T 502-2016; Peanut Harvesters—Operating Quality. China Standards Press: Beijing, China, 2016.
- NY/T 2204-2012; Peanut Harvesting Machinery—Technical Specification for Quality Evaluation. China Standards Press: Beijing, China, 2012.

Disclaimer/Publisher’s Note: The statements, opinions and data contained in all publications are solely those of the individual author(s) and contributor(s) and not of MDPI and/or the editor(s). MDPI and/or the editor(s) disclaim responsibility for any injury to people or property resulting from any ideas, methods, instructions or products referred to in the content. |
© 2026 by the authors. Licensee MDPI, Basel, Switzerland. This article is an open access article distributed under the terms and conditions of the Creative Commons Attribution (CC BY) license.