


Abstract
Soil-moisture deficits affect irrigation management in arid irrigated systems, yet their short-term persistence and uncertainty are difficult to quantify at the field scale. This study developed a spatially explicit probabilistic framework combining high-resolution root-zone soil-moisture estimation with Copula-based dependence modeling to quantify relative soil-moisture-deficit persistence in the Daheyanzi Irrigation District, Xinjiang, China. Using Google Earth Engine, the Enhanced Spatial and Temporal Adaptive Reflectance Fusion Model generated daily vegetation-index and land-surface-temperature products at 30 m resolution, while a Random Forest model estimated daily 0–40 cm soil moisture. A percentile-based relative soil-moisture-deficit index (RSDI) was constructed, and four Copula models were evaluated. The Frank Copula provided the best statistical fit. Kendall’s τ decreased from 0.505 at a 1-day lead to 0.085 at a 7-day lead, indicating that persistence information was concentrated mainly within 1–3 days. When current RSDI exceeded 0.80, the probabilities of future RSDI exceeding 0.90 were 28.0% and 19.0% at 1- and 3-day leads, respectively. Rolling-window validation showed the clearest predictive advantage at 1 day, with improved discrimination at 3 days. The framework provides spatially explicit deficit probabilities to support irrigation-need assessment and field prioritization when short-term irrigation-water availability is limited.
1. Introduction
Climate change has increased the frequency and severity of drought events, posing substantial challenges to agricultural production and irrigation management, particularly in arid and semi-arid regions. Limited soil-water availability can constrain crop growth and complicate irrigation decision-making and water-resource management. Agricultural drought can directly reduce crop productivity by limiting soil-water availability and consequently affect irrigation decision-making and water-resource management [1,2].
Therefore, accurate monitoring of root-zone soil-moisture conditions and reliable short-term assessment of their persistence are essential for improving irrigation management and supporting efficient water use in water-limited agricultural systems.
Conventional agricultural drought monitoring approaches mainly rely on deterministic indicators, such as precipitation anomalies, vegetation indices, and soil-moisture thresholds. Although these methods are effective for identifying existing drought conditions, they generally provide categorical drought information and have limited capability to quantify the uncertainty associated with future drought evolution [3,4]. Consequently, deterministic drought assessments may not fully satisfy the requirements of risk-based irrigation management [5]. Probabilistic drought forecasting approaches can provide quantitative estimates of future drought occurrence likelihood and improve decision-making under uncertain conditions [6]. However, short-term forecasting of root-zone soil-moisture deficits remains challenging in irrigation districts because soil-moisture dynamics are jointly influenced by atmospheric forcing, crop water consumption, and human irrigation activities [7].
Remote-sensing technology provides an effective approach for large-scale agricultural drought monitoring by capturing spatial variations in vegetation conditions, land surface temperature, and soil-moisture-related information. Multi-source satellite datasets, including Landsat, Moderate Resolution Imaging Spectroradiometer (MODIS), Harmonized Landsat and Sentinel-2 (HLS), and Soil Moisture Active Passive (SMAP) soil-moisture products have been widely applied in agricultural water management studies [4,8,9]. However, differences in spatial and temporal resolutions among remote-sensing products limit their direct application for field-scale drought monitoring [10]. Spatial-temporal fusion methods, such as the Enhanced Spatial and Temporal Adaptive Reflectance Fusion Model (ESTARFM), can integrate the spatial information of high-resolution imagery with the temporal continuity of coarse-resolution products, providing high-resolution and temporally continuous remote-sensing variables [11]. Specifically, ESTARFM identifies spectrally similar neighboring pixels within a local search window and assigns weights to them based on their spatial and spectral distances. By calculating the conversion coefficients between coarse- and fine-resolution pixels, ESTARFM captures temporal changes and ultimately generates the fine-resolution prediction at the target date. This mechanism enables ESTARFM to combine the spatial details of high-resolution imagery with the frequent temporal observations of coarse-resolution products. Furthermore, to address the issue of data gaps caused by cloud contamination, recent studies have integrated gap-filling algorithms with ESTARFM to implement a “filling-then-fusion” strategy. This strategy maximizes the utilization of partially cloudy images and reduces uncertainties caused by long temporal intervals between reference images [12]. These fusion strategies have been widely adopted to generate 30 m input variables for subsequent machine-learning-based soil-moisture estimation in irrigated agricultural systems. Furthermore, the combination of multi-source remote-sensing data and machine learning algorithms has demonstrated great potential for improving soil-moisture estimation accuracy at agricultural field scales [13,14].
Compared with deterministic drought indices, probabilistic models can characterize drought uncertainty and estimate the probability of future drought occurrence [15]. Copula functions provide a flexible framework for constructing multivariate joint distributions without requiring specific assumptions regarding marginal distributions and can effectively describe nonlinear dependence structures and tail dependence between variables [16]. Therefore, Copula-based methods have been widely applied in drought frequency analysis, drought propagation assessment, and agricultural drought risk evaluation [17,18,19].
However, most existing Copula-based studies on agricultural drought have focused on natural river basins or rainfed agricultural systems, where soil-moisture depletion is mainly controlled by meteorological forcing rather than irrigation management. In strongly regulated irrigation districts, irrigation activities can interrupt natural soil-moisture depletion and substantially alter short-term soil-moisture dynamics [20,21], introducing additional uncertainty into short-term deficit persistence. Consequently, the temporal dependence between current and future relative soil-moisture-deficit conditions under intensive irrigation management remains insufficiently understood.
To provide a rigorous benchmark for the proposed Copula-based probabilistic forecasting framework, three representative baseline models were included for comparison: logistic regression (LR), first-order Markov chain (MC), and climatological probability (CP). LR has been widely used for calibrated event-probability forecasting in hydrometeorological applications [22], MC models provide a state-transition-based framework for probabilistic drought forecasting [23], and CP is commonly adopted as a reference or no-skill forecast in probabilistic forecast verification [24]. These models represent different levels of complexity and assumptions, thereby allowing the added value of the Copula-based dependence modeling approach to be evaluated more objectively.
Accordingly, this study aims to develop and evaluate a short-term probabilistic framework for forecasting the persistence and threshold exceedance of the relative soil-moisture-deficit index (RSDI) in the Daheyanzi Irrigation District by integrating multi-source remote-sensing, machine-learning-based root-zone soil-moisture estimation, and Copula-based statistical dependence modeling. Here, short-term refers to 1–7-day lead times, and the forecast target is RSDI persistence rather than crop water stress or yield loss. The 1–7-day forecast horizon was selected to characterize the short-term persistence of root-zone soil-moisture deficits at timescales relevant to near-term irrigation management, while allowing the decay of predictive dependence with increasing lead time to be evaluated. Specifically, the study seeks to: (1) generate daily 0–40 cm soil-moisture estimates at a spatial resolution of 30 m using multi-source remote sensing data and a Random Forest (RF) model; (2) construct the RSDI based on 0–40 cm root-zone soil moisture and characterize the temporal dependence between current and future RSDI values at 1-, 3-, 5-, and 7-day lead times using candidate Copula functions; and (3) evaluate out-of-sample probabilistic forecast performance against logistic regression (LR), a first-order Markov chain (MC), and climatological probability (CP) benchmarks under a rolling-window framework, and map the spatial distribution of RSDI-exceedance probabilities for specified thresholds. The proposed framework is intended to provide spatially explicit RSDI persistence probabilities to support short-term irrigation-need screening and field prioritization when irrigation-water availability is limited.
2. Materials and Methods
2.1. Study Area
The Daheyanzi Irrigation District (81°45′–82°33′ E, 44°14′–44°40′ N) is located in Daheyanzi Town, Xinjiang, China. The region has a typical temperate arid continental climate characterized by low precipitation and high evaporative demand, with a mean annual precipitation of approximately 99.7 mm and a mean annual evaporation of approximately 1626 mm [25]. The irrigation district covers approximately 147 km2. Cotton and maize are the dominant crops, with smaller areas planted with alfalfa, grapes, and goji berries, as well as shelterbelts.
Agricultural production in the study area depends strongly on irrigation. Irrigation water is supplied primarily by the Daheyanzi River and supplemented by groundwater [25]. Under these strongly managed conditions, growing-season root-zone soil moisture is jointly controlled by irrigation inputs, evapotranspiration, crop water uptake, and meteorological conditions. Consequently, low soil moisture in this district primarily reflects the depletion between irrigation events rather than a precipitation-driven agricultural drought. This study therefore focuses on the short-term persistence of root-zone relative soil-moisture deficits as an indicator of potential near-term irrigation need and as a basis for prioritizing fields when irrigation-water availability is limited.
Soil data were obtained from the Harmonized World Soil Database (HWSD v2.0) [26]. Under the WRB 2022 classification, the study area is dominated by Phaeozems and Gypsisols, along with minor occurrences of Solonchaks and Anthrosols. Field observations indicated predominantly sandy loam textures with variable coarse-fragment contents. These relatively coarse soils facilitate rapid infiltration and limit water-holding capacity, which accelerates the inter-irrigation moisture depletion.
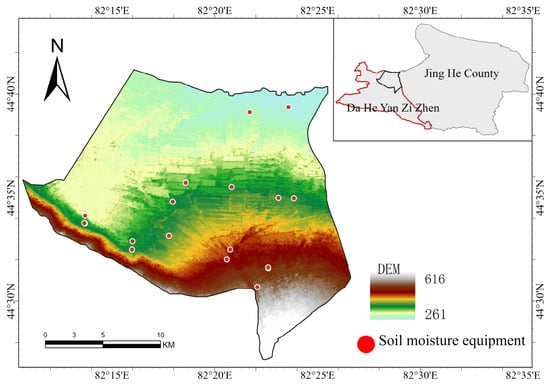
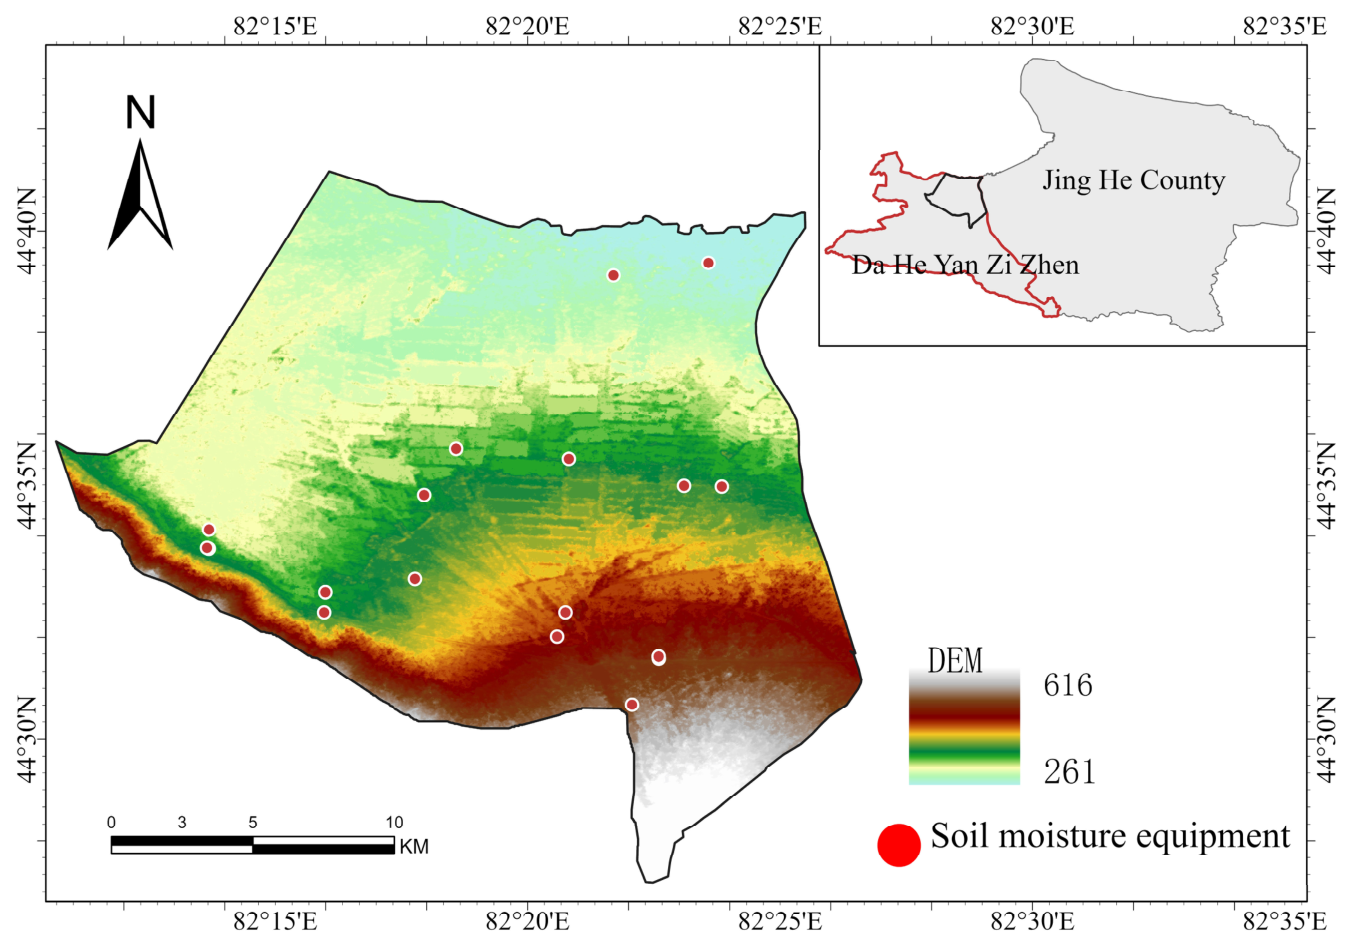
Sixteen soil-moisture monitoring stations (five probe-type and eleven tube-type) recorded volumetric soil moisture at hourly intervals across four depths (0–10 to 30–40 cm) from May to September in both 2024 and 2025 (Figure 1). The five probe-type sensors were self-developed by the Xinjiang Institute of Water Resources and Hydropower Research (Urumqi, China), and the eleven tube-type sensors were manufactured by Insentek Technology Co., Ltd. (Hangzhou, China). The raw sensor outputs were validated against oven-drying measurements at six stations, showing good agreement in the 0–30 cm layers but larger discrepancies at 40 cm. Accordingly, all subsequent analyses used the original factory-calibrated sensor data without further site-specific corrections, with oven-drying data serving solely as independent validation. The schematic of the study area and smart soil monitoring points (Figure 1) was prepared using ArcGIS Pro (version 3.0, Esri, Redlands, CA, USA).
Figure 1.
Schematic of the study area and smart soil monitoring points.
2.2. Data Collection and Experimental Design
All remote sensing and reanalysis datasets used in this study were obtained through the Google Earth Engine (GEE) platform, including Moderate Resolution Imaging Spectroradiometer (MODIS) [27,28], Landsat [29], Harmonized Landsat and Sentinel-2 (HLS), ERA5-Land [30], the Global Land Data Assimilation System (GLDAS) [31], and Soil Moisture Active Passive (SMAP) Level-4 soil-moisture products. Vegetation and surface condition variables were derived through satellite band calculations, including the normalized difference vegetation index (NDVI), enhanced vegetation index (EVI), land surface water index (LSWI), and modified soil-adjusted vegetation index (MSAVI). Leaf area index (LAI) was estimated from EVI [32]. Land surface temperature (LST) was obtained from MOD11A1 and Landsat 8/9 products [33], and ERA5-Land reanalysis data were used to assist in reconstructing missing LST values. GLDAS and SMAP L4 soil-moisture products were used as background soil moisture predictors.
The spatial and temporal resolutions, product versions, and primary data sources are summarized in Table 1.
Table 1.
Datasets used in this study.
To harmonize the spatial and temporal resolutions of the multi-source satellite products, the Enhanced Spatial and Temporal Adaptive Reflectance Fusion Model (ESTARFM) was applied to generate daily remote-sensing predictors at a spatial resolution of 30 m. The ESTARFM prediction can be expressed as:
where L and M denote the fine- and coarse-resolution images, respectively; (k = m, n) represents the two reference dates adjacent to the prediction date ; N is the number of spectrally similar pixels within the search window; is the weight assigned to the similar pixel; and is the conversion coefficient between the fine- and coarse-resolution data. Predictions obtained from the two reference dates are subsequently combined to estimate the fine-resolution image at .
Specifically, HLS- and MODIS-derived vegetation indices, including NDVI, EVI, LAI, LSWI, and MSAVI, were fused using ESTARFM to generate daily vegetation-index products at 30 m resolution. For LST, missing MOD11A1 observations were first reconstructed using multi-temporal MODIS data and ERA5-Land skin temperature, after which the reconstructed MOD11A1 products were fused with Landsat 8/9 LST using ESTARFM to generate daily 30 m LST products.
For the soil-moisture retrieval dataset, the ground-measured volumetric soil-water content at each layer was used as the model label. The input features for the Random Forest model consisted of NDVI, EVI, LSWI, MSAVI, LAI, and LST, as well as GLDAS and SMAP L4 soil-moisture background products, all matched by the same date and spatial location. The Random Forest model, Copula analysis, and scientific figure generation were implemented in Python (version 3.9) using PyCharm Community Edition (version 2022.1.4). The output variables were the volumetric soil-water contents at four depths: 0–10, 10–20, 20–30, and 30–40 cm. Based on the matched variables, a total of 2528 valid samples were obtained. These samples were randomly divided into a training set and a held-out test set at a ratio of 4:1, with 80% used for model training and hyperparameter optimization, and the remaining 20% reserved for accuracy validation. During training, a random search combined with 5-fold cross-validation was employed for hyperparameter tuning. After retrieving soil moisture for each layer, a daily 0–40 cm soil-moisture dataset at a spatial resolution of 30 m was derived by thickness-weighted averaging across the layers [34]. Model performance was evaluated using the mean absolute error (MAE), root mean square error (RMSE), and coefficient of determination (R2) [35].
2.3. Analytical Methods
2.3.1. Construction of the Relative Soil-Moisture-Deficit Index
To account for differences in local soil-moisture conditions and seasonal variability, a relative soil-moisture-deficit index (RSDI) was constructed from daily root-zone soil moisture (RZSM) at a depth of 0–40 cm. Observations were initially grouped by monitoring station, year, and crop growth stage. Within each reference group , the normalized rank of each valid soil-moisture observation was calculated as
where is the average ascending rank of the RZSM observation at time within group , and is the number of valid RZSM observations in that group. Average ranks were used to handle tied soil-moisture values. The RSDI was then calculated as
where denotes the reference group to which the observation at time belongs, and denotes the corresponding RSDI. Higher RSDI values indicate drier soil-moisture conditions relative to the corresponding reference distribution.
To ensure sufficient observations for estimating the reference distribution, a minimum of 20 valid samples was required for each group. When a station–year–growth-stage group contained fewer than 20 valid observations, a broader reference group was used, first at the station–year level and then at the station level, provided that the broader group contained sufficient valid observations.
Three percentile-based thresholds, , , and , were used to characterize increasingly pronounced relative soil-moisture deficits. These thresholds approximately correspond to the driest 20%, 10%, and 5% of soil-moisture conditions within the corresponding reference distribution, respectively. Accordingly, was defined as a mild-or-greater relative soil-moisture deficit, as a moderate-or-greater deficit, and as a severe deficit.
Based on the RSDI, paired observations were constructed for forecast lead times of 1, 3, 5, and 7 days. These pairs were subsequently used for Copula-based joint distribution modeling and conditional-probability estimation of future relative soil-moisture-deficit exceedance.
In this retrospective analysis, RSDI reference distributions were estimated from the corresponding station–year–growth-stage groups. For prospective forecasting, the reference distributions should instead be established from historical observations available before the forecast period and kept fixed during forecasting.
2.3.2. Copula-Based Joint Distribution Model
For each forecast lead time h (1, 3, 5, or 7 days), paired RSDI observations were used to model the dependence between current and future relative soil-moisture-deficit states. Let and denote the marginal cumulative distribution functions of and , respectively. The corresponding probability-scale variables are defined as:
According to Sklar’s theorem, the joint cumulative distribution function can be expressed as
where denotes the Copula function for lead time , and represents its dependence parameter or parameter vector. For a current relative soil-moisture-deficit threshold and a future threshold , the corresponding probability-scale thresholds are and . The conditional probability that the future RSDI exceeds , given that the current RSDI exceeds , is calculated as:
This formulation quantifies the probability that a relative soil-moisture deficit persists or reaches a specified threshold at a future lead time, conditional on the current RSDI exceeding the selected threshold.
2.3.3. Copula Model Fitting and Selection
To identify the most suitable Copula function for describing the dependence relationship between current and future relative soil-moisture-deficit states, four commonly used Copula families, including Gaussian, Student’s t, Frank, and Gumbel Copulas, were fitted and compared [36]. For each lead time of 1, 3, 5, and 7 days, the Copula models were fitted to the transformed pseudo-observations , which were derived from the paired RSDI series described in Section 2.3.2.
The parameters of each Copula model were estimated using the maximum likelihood method. The log-likelihood function was defined as:
where denotes the parameter or parameter vector of the Copula model at lead time , is its Copula density function, and represent the transformed pseudo-observations; and represents the sample size.
To evaluate the fitting performance of different Copula models for the joint distribution of current and future RSDI, the Akaike information criterion (AIC), Bayesian information criterion (BIC), and Cramer–von Mises (CVM) statistic were used for comprehensive evaluation.
where represents the maximized log-likelihood of the model; represents the number of model parameters; and represents the sample size.
The AIC and BIC consider both model fitting performance and model complexity, with lower values indicating a better balance between goodness of fit and model complexity. The CVM statistic measures the discrepancy between the fitted Copula distribution and the empirical joint distribution, with smaller values indicating better agreement.
For each lead time, the optimal Copula family was selected by jointly considering AIC, BIC, and CVM. Kendall’s τ was further used to quantify the statistical dependence between current and future RSDI values. Larger absolute values of Kendall’s τ indicate stronger dependence, while positive values indicate that relatively drier current soil-moisture conditions tend to be associated with relatively drier future conditions.
2.3.4. Rolling-Window Validation and Benchmark Models
To evaluate the out-of-sample forecasting performance of the proposed Copula-based probabilistic model, a rolling-window validation strategy was adopted. For each forecast origin and lead time , historical pairs of relative soil-moisture-deficit states from the preceding 60 days were used for model training. To avoid using future outcome information, any historical pair whose future outcome had not yet occurred by the forecast origin was excluded from the training window. The fitted model was then used to predict the probability that the future RSDI, , would exceed a specified relative soil-moisture-deficit threshold , conditional on the current RSDI, , exceeding the current threshold . This procedure was repeated for lead times of 1, 3, 5, and 7 days.
Three benchmark models were used to evaluate the added value of the Copula-based framework. Logistic regression used the configured predictor variables to predict the binary future relative soil-moisture-deficit event . The first-order Markov-chain model discretized the RSDI into four mutually exclusive states: non-deficit , mild relative deficit , moderate relative deficit , and severe relative deficit . Transition probabilities between these states were estimated within each rolling training window. The climatological probability benchmark was defined as the historical frequency of the target event within the same training window. All benchmark models used the same rolling-window setting, forecast lead times, and relative soil-moisture-deficit event definitions as the Copula model.
2.4. Model Performance Evaluation Metrics
The probabilistic forecasting performance of the Copula model and benchmark models was evaluated using the Brier score, precision-recall area under the curve (PR-AUC), and reliability diagram. For each forecast origin , lead time , and target relative soil-moisture-deficit threshold , the observed relative soil-moisture-deficit event was defined as:
where indicates that the future RSDI exceeded the target relative soil-moisture-deficit threshold.
The Brier score was used to measure the overall accuracy of probabilistic forecasts:
where is the number of valid forecast samples. A lower Brier score indicates a smaller difference between the predicted probabilities and the observed binary relative soil-moisture-deficit events, and therefore better probabilistic forecasting performance.
Because relative soil-moisture-deficit events at higher RSDI thresholds are relatively rare, PR-AUC was used to evaluate the ability of each model to distinguish relative soil-moisture-deficit events from non-events under imbalanced-event conditions. Precision and recall were calculated as:
where TP, FP, and FN represent true positives, false positives, and false negatives, respectively. PR-AUC was calculated as the area under the precision-recall curve obtained by varying the probability threshold. A higher PR-AUC indicates better discrimination of relative soil-moisture-deficit events. Event prevalence was also used as the no-skill reference level for interpreting PR-AUC.
3. Results
3.1. Validation of Soil-Moisture Retrieval
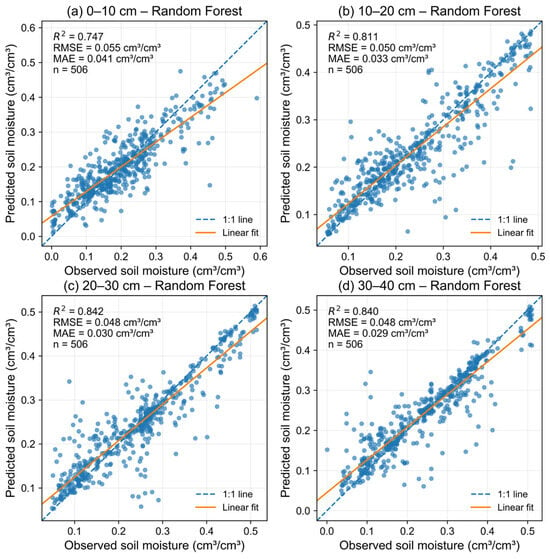
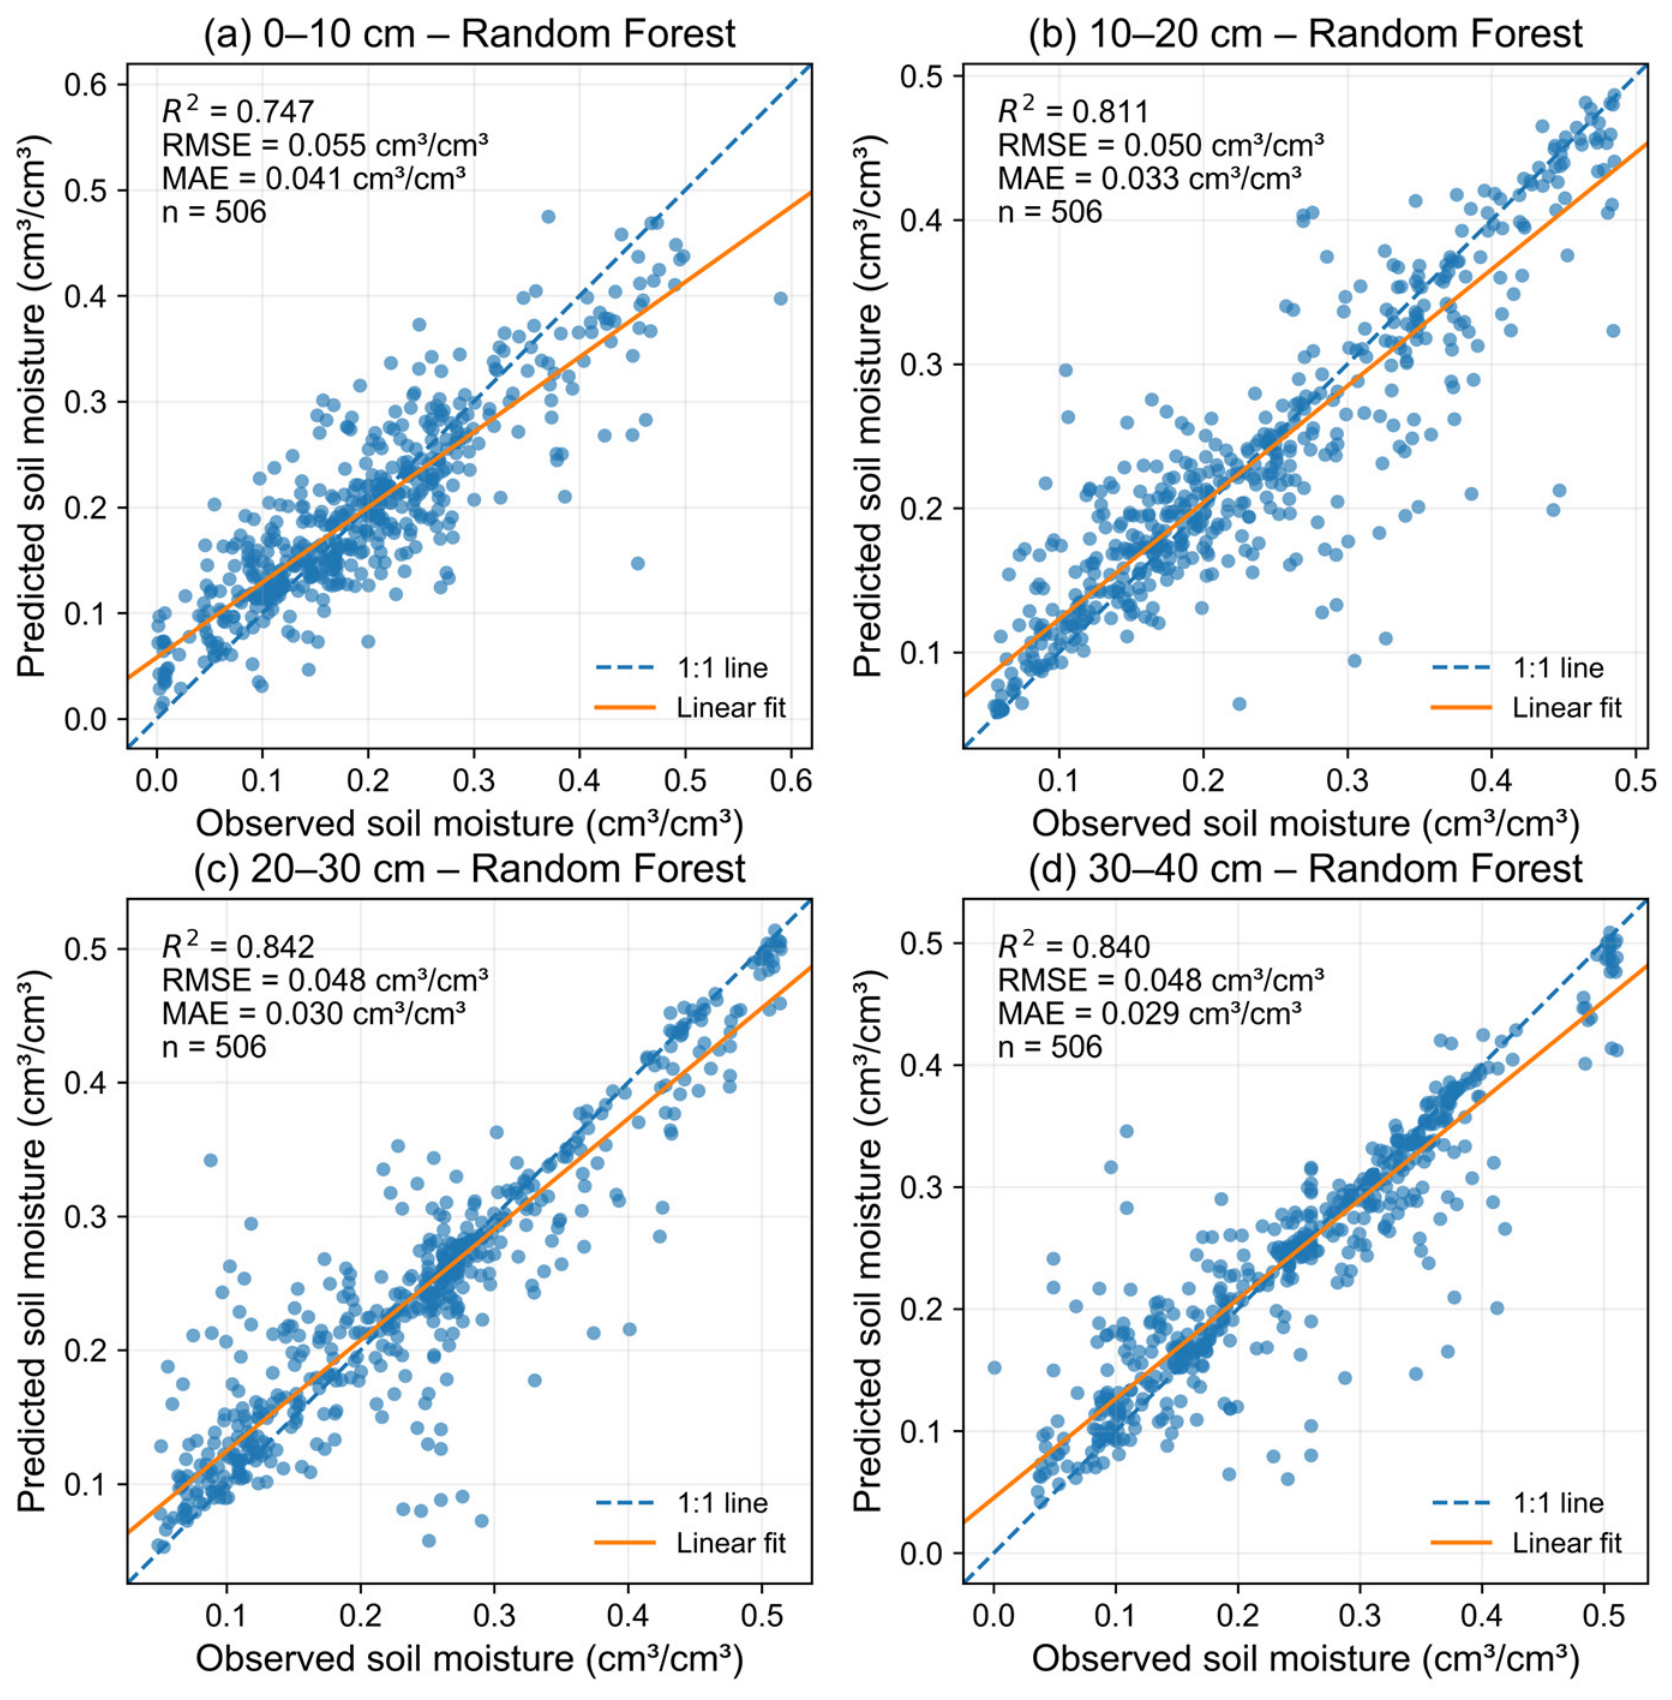
The performance of the Random Forest (RF) models for soil-moisture estimation is shown in Figure 2. The models achieved satisfactory accuracy across all four layers, with coefficients of determination (R2) of 0.747, 0.811, 0.842, and 0.840, and RMSE values of 0.055, 0.050, 0.048, and 0.048 cm3 cm−3 for the 0–10, 10–20, 20–30, and 30–40 cm layers, respectively. Notably, the deeper layers (20–40 cm) exhibited higher R2 values and lower errors than the surface layer (0–10 cm). This pattern may partly reflect the greater temporal variability of surface soil moisture under short-term atmospheric forcing and irrigation cycles, whereas deeper soil moisture may exhibit greater temporal stability.
Figure 2.
Scatter plots of observed versus RF-predicted volumetric soil moisture for the (a) 0–10 cm, (b) 10–20 cm, (c) 20–30 cm, and (d) 30–40 cm soil layers.
Soil texture dictates the spatial heterogeneity of soil-moisture dynamics. In our study area, the prevailing sandy loam and coarse fragments accelerate infiltration and limit water retention, adding uncertainty to surface moisture retrieval. Although this study did not isolate the independent effects of soil properties, future research should validate these findings across different soil types. Overall, the RF model provides a solid foundation for the subsequent RSDI and Copula analyses, though the higher surface-layer errors warrant cautious interpretation.
3.2. Short-Term Probabilistic Forecasting of Relative Soil-Moisture-Deficit Persistence Based on Copula Models
3.2.1. Selection of Optimal Copula Model
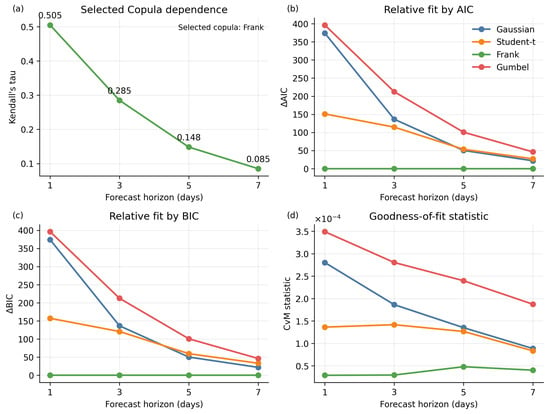
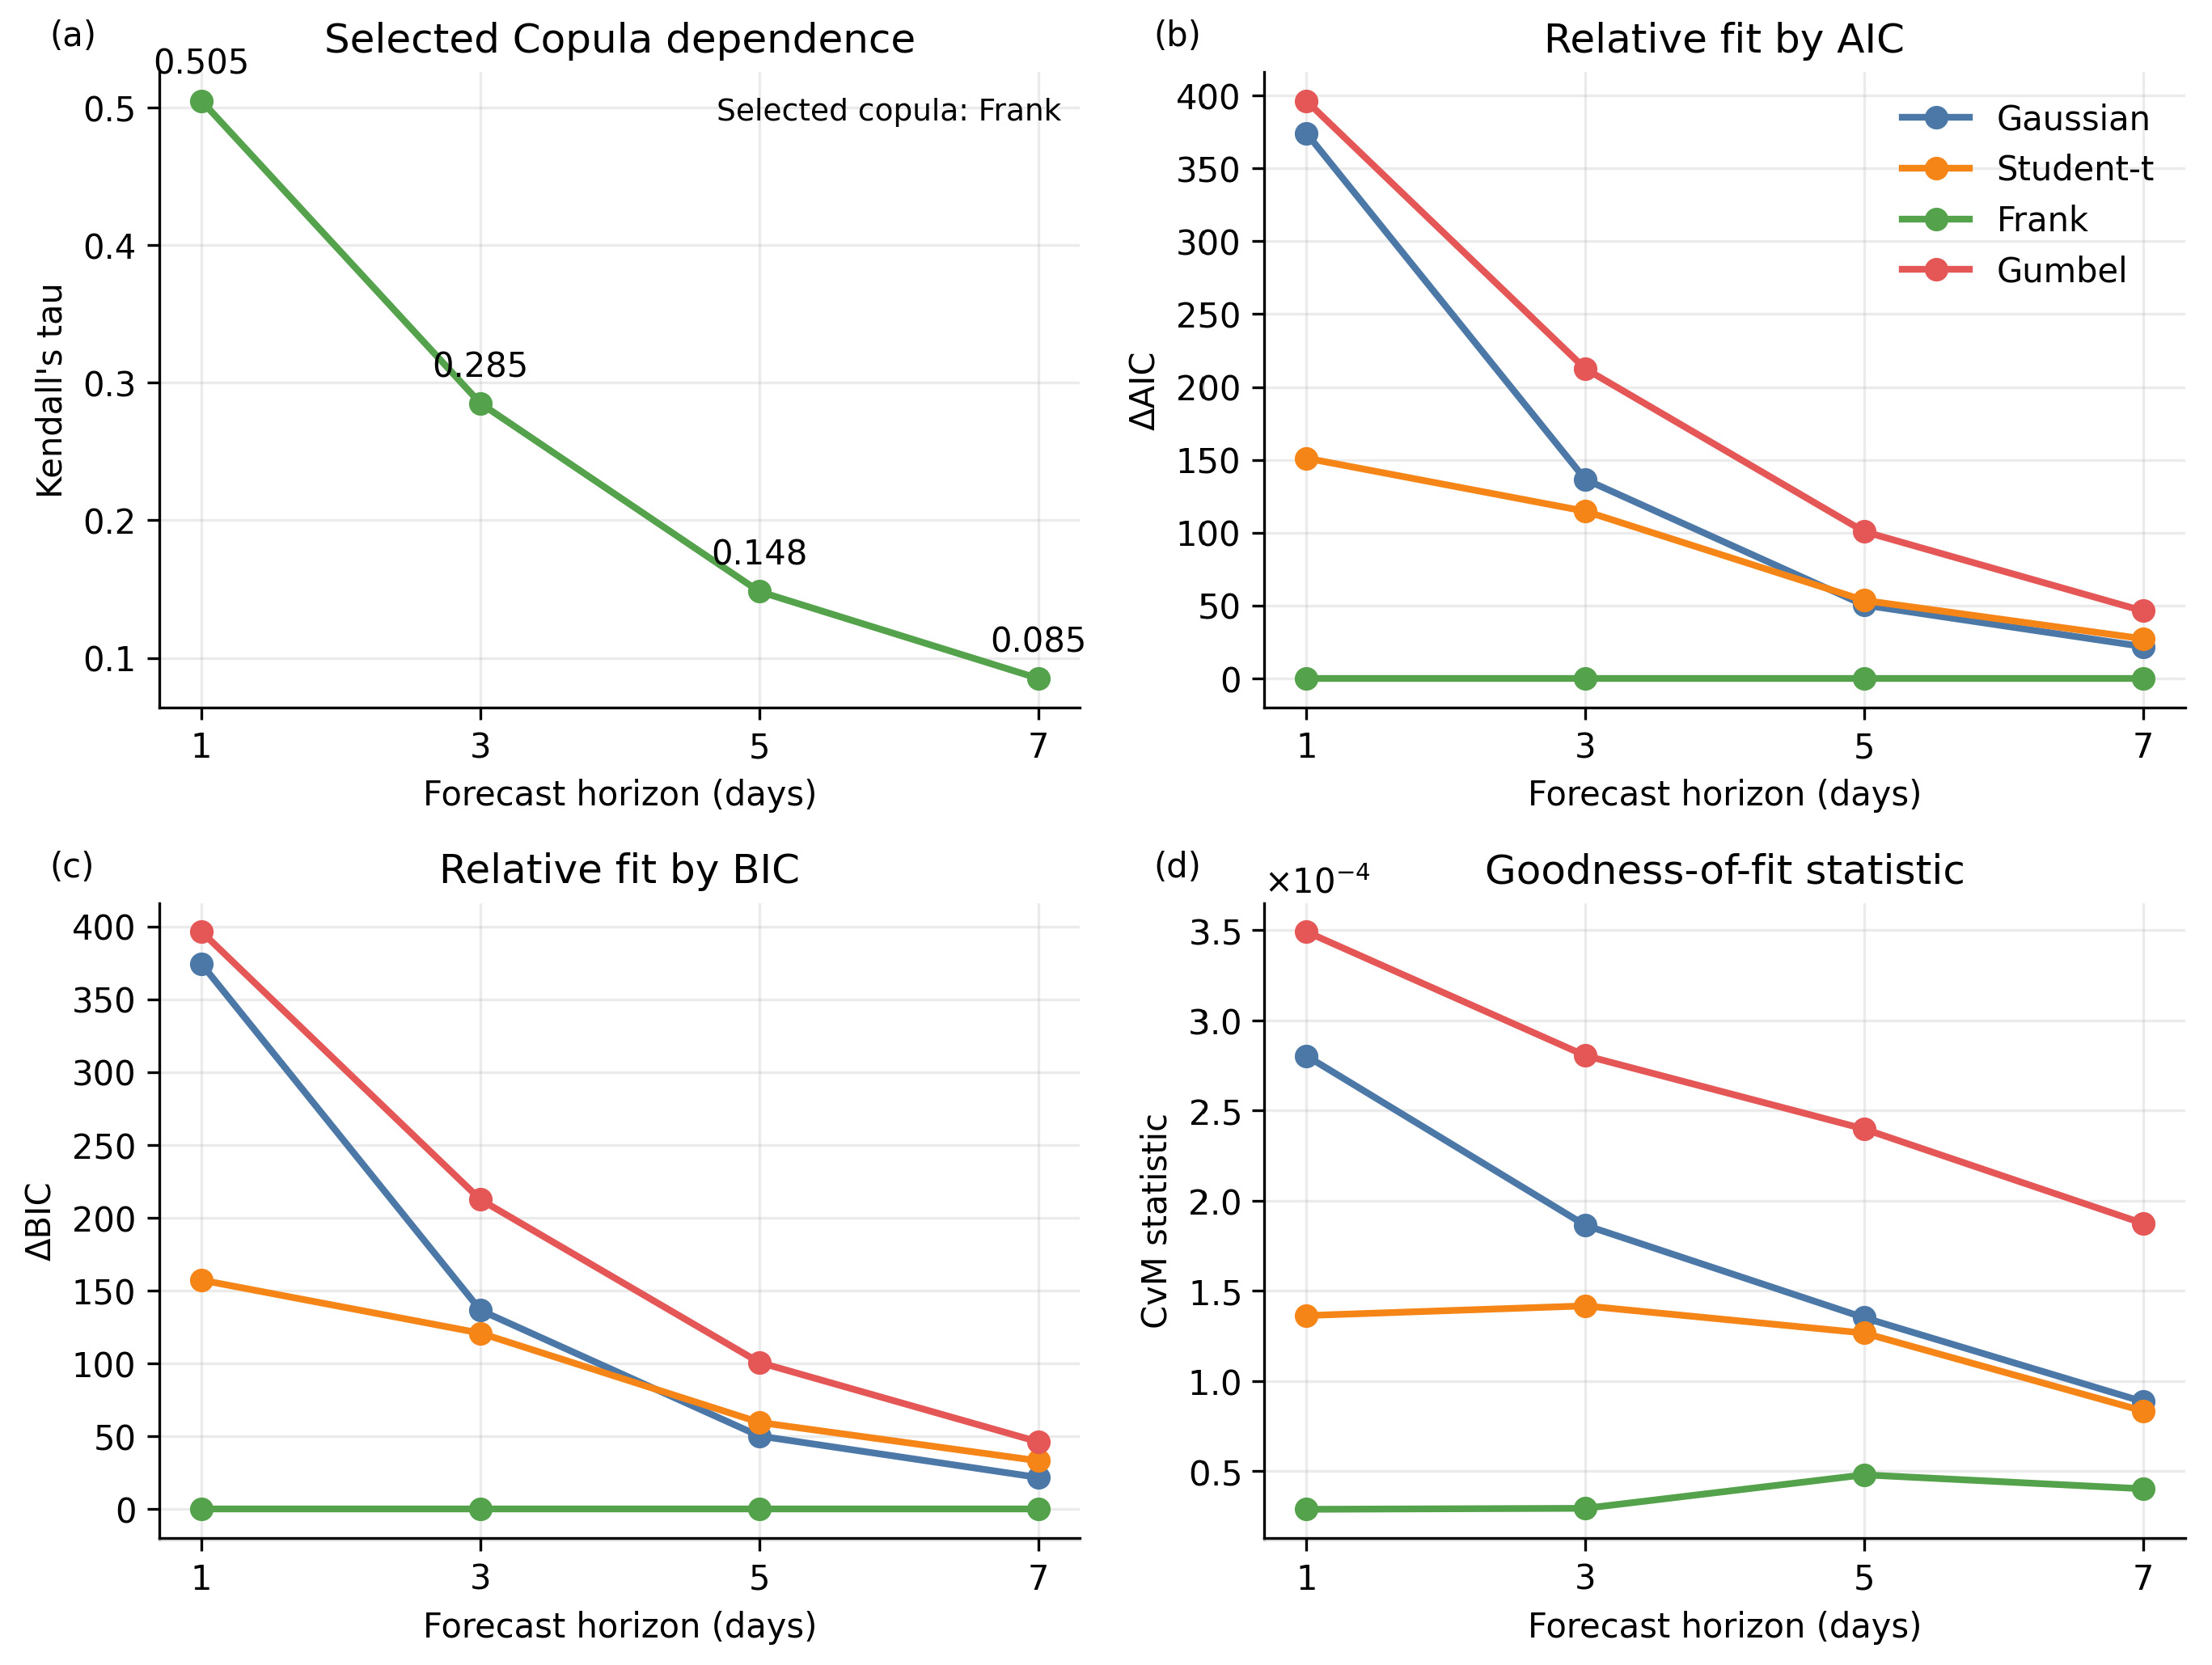
The fitting performance of four Copula models (Gaussian, Student’s t, Frank, and Gumbel) was evaluated at 1-, 3-, 5-, and 7-day forecast horizons using AIC, BIC, and the Cramér–von Mises (CVM) goodness-of-fit statistic (Figure 3). Clear differences were observed among the candidate Copula functions. Across all horizons, the Frank Copula yielded the lowest AIC, BIC, and CVM values. The highly consistent rankings from AIC and BIC can be partly attributed to the similar model complexity among the candidates; thus, the rankings were primarily associated with differences in goodness of fit rather than complexity penalties. The consistently lowest CVM values further supported the selection of the Frank Copula.
Figure 3.
Fitting performance evaluation of four Copula models: (a) Kendall’s τ rank correlation coefficient; (b) Akaike information criterion (AIC); (c) Bayesian information criterion (BIC); and (d) Cramer–von Mises (CVM) goodness-of-fit statistic.
The Frank Copula effectively captured the positive dependence between current and future RSDI values. Its symmetric dependence structure, without upper- or lower-tail dependence, was suitable for representing the dependence pattern observed in the present dataset. However, its superior performance indicates the best statistical fit among the tested models rather than implying that the underlying physical process strictly follows the Frank Copula. Therefore, it was adopted for subsequent conditional RSDI exceedance-probability estimation.
The statistical dependence weakened markedly with increasing forecast horizon. Kendall’s τ decreased from 0.505 at 1 day to 0.285, 0.148, and 0.085 at 3, 5, and 7 days, respectively. This rapid decay indicates that antecedent root-zone soil-moisture conditions provide useful persistence information primarily within a 1–3-day window, beyond which their statistical association with future conditions diminishes substantially.
3.2.2. Frank Copula-Based Conditional RSDI-Exceedance Probabilities
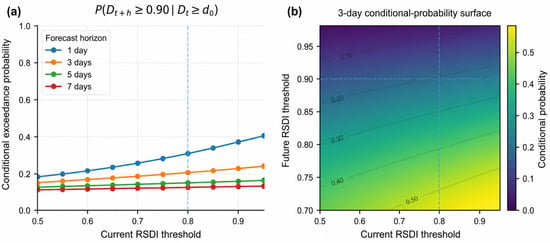
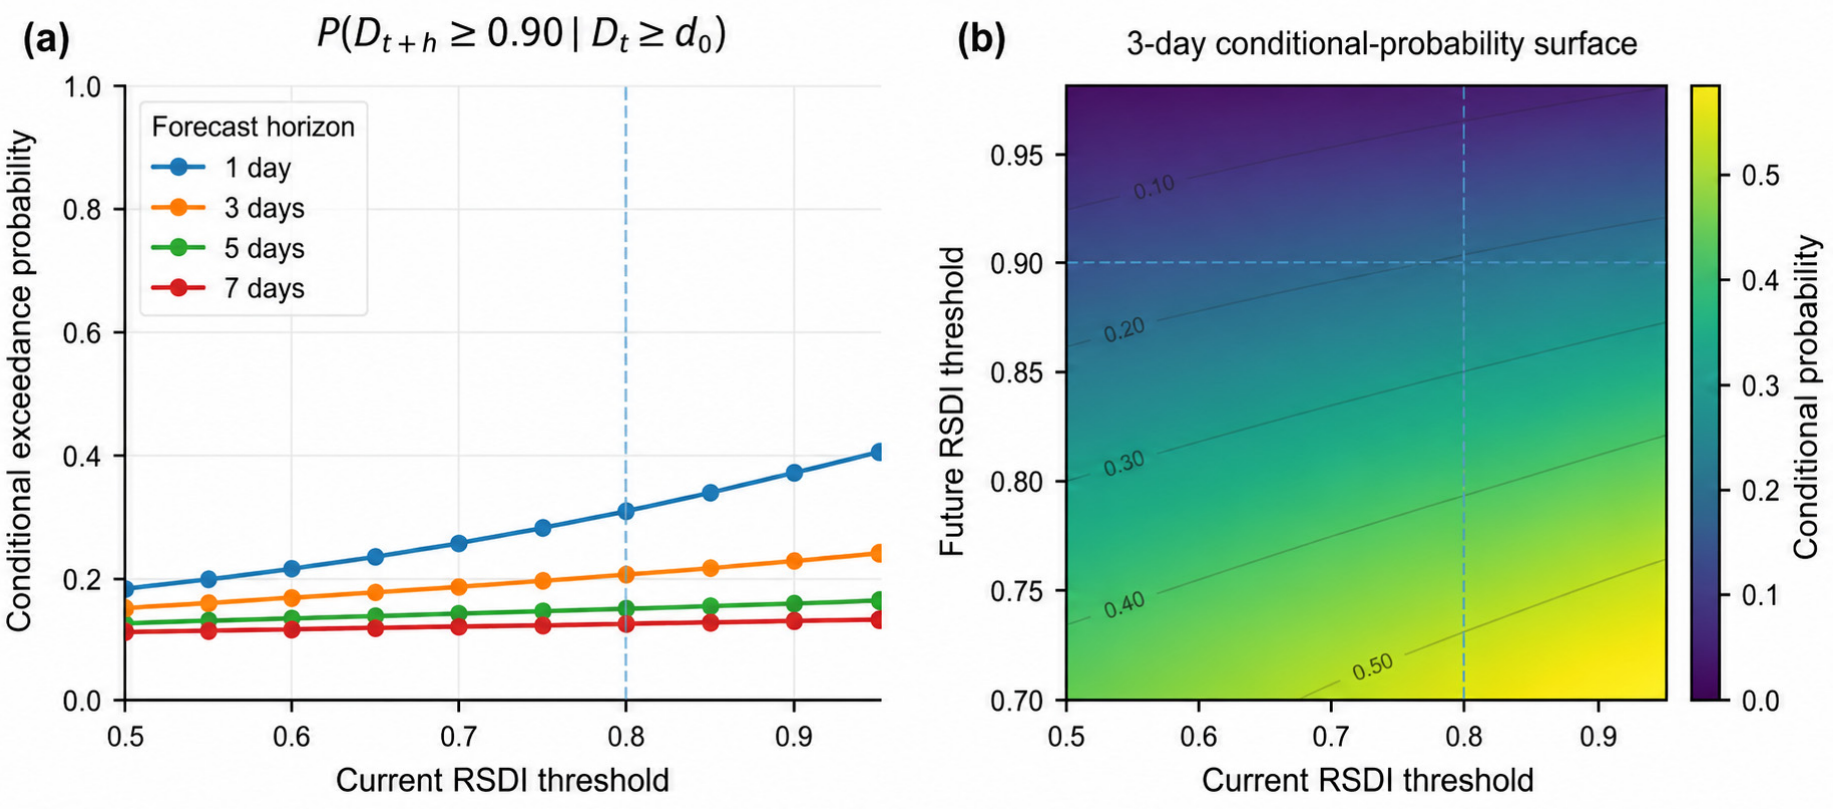
The conditional probabilities of future RSDI exceedance under different current RSDI conditions are presented in Figure 4. Overall, the probability of future RSDI exceeding the specified threshold increased with the current RSDI threshold, indicating stronger persistence of relative soil-moisture deficits under drier initial conditions. This relationship was most pronounced at short lead times, consistent with the stronger short-term dependence identified by Kendall’s τ.
Figure 4.
Conditional RSDI-exceedance probabilities estimated using the optimal Frank Copula model: (a) Conditional probability of future RSDI exceeding 0.90 under different current RSDI thresholds and forecast lead times; (b) conditional-probability response surface as a function of the current RSDI threshold and future RSDI threshold for the 3-day lead time. The vertical dashed line indicates the current RSDI threshold d0 = 0.80, while the horizontal dashed line in panel (b) indicates the future RSDI threshold dh = 0.90.
The conditional-probability surface further illustrates the joint effects of the current and future RSDI thresholds. For a fixed future threshold, the conditional probability increased as the current threshold increased. In contrast, for a fixed current threshold, the conditional probability decreased as the future threshold increased because higher RSDI thresholds represent more extreme and less frequent relative soil-moisture-deficit conditions.
When the current RSDI exceeded 0.80, the conditional probabilities of the future RSDI exceeding 0.90 were 28.0% and 19.0% at the 1- and 3-day lead times, respectively. These results are consistent with the decline in statistical dependence with increasing lead time and indicate that current root-zone soil-moisture conditions provide the strongest persistence information within the 1–3-day forecast window.
3.2.3. Model Validation
The out-of-sample predictive performance of the Frank Copula model was evaluated using a rolling-window validation strategy with a 60-day training window. For each forecast origin t, historical observations available within the training window were used to generate probabilistic forecasts for lead times of 1, 3, 5, and 7 days. The Frank Copula model was compared with logistic regression (LR), a first-order Markov chain (MC), and climatological probability (CP) using the Brier score, the area under the precision-recall curve (PR-AUC), and reliability diagrams.
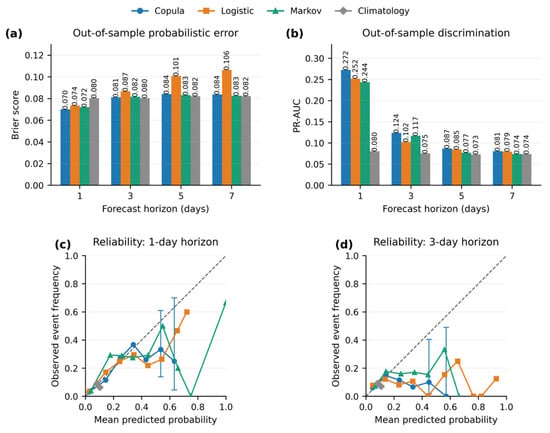
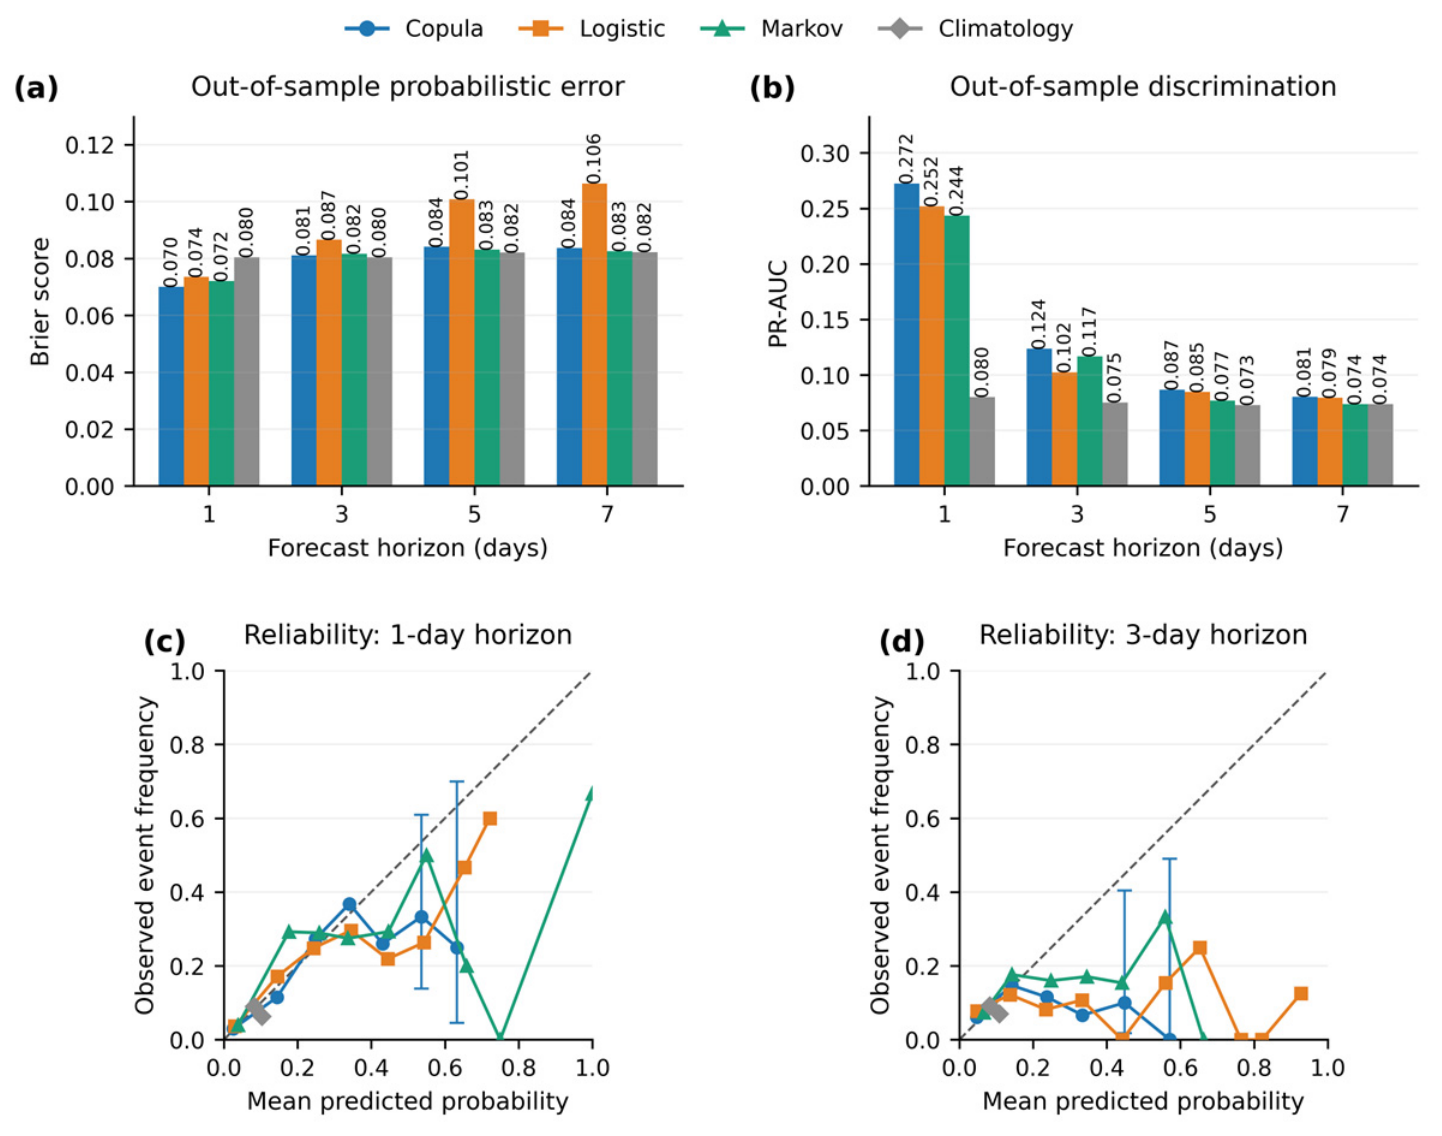
As shown in Figure 5, the Frank Copula achieved the lowest Brier score at the 1-day lead, with a value of 0.070, compared with 0.074 for LR, 0.072 for MC, and 0.080 for CP. At longer forecast horizons, its advantage in probabilistic accuracy diminished.
Figure 5.
Out-of-sample validation of probabilistic RSDI-exceedance forecasting models: (a) Brier scores for the Copula, logistic regression (LR), Markov chain (MC), and climatological probability (CP) models across 1-, 3-, 5-, and 7-day forecast horizons; (b) PR-AUC for the same models and forecast horizons; (c) reliability diagram for the 1-day forecast horizon; and (d) reliability diagram for the 3-day forecast horizon. The dashed diagonal lines in panels (c,d) indicate perfect calibration, where the observed event frequency equals the mean predicted probability.
In terms of event discrimination, the Copula model achieved a PR-AUC of 0.124 at the 3-day lead, compared with 0.102 for LR, 0.117 for MC, and 0.075 for CP. The absolute PR-AUC remained modest, indicating that identifying relatively infrequent RSDI-exceedance events remained challenging.
The reliability diagrams showed substantial sampling uncertainty in sparsely populated high-probability bins. The corresponding sample sizes, observed event frequencies, and Wilson 95% confidence intervals are summarized in Table 2.
Table 2.
Wilson 95% confidence intervals for high-probability forecast bins.ilson.
3.2.4. Spatial Distribution of Future Relative Soil-Moisture-Deficit Probability
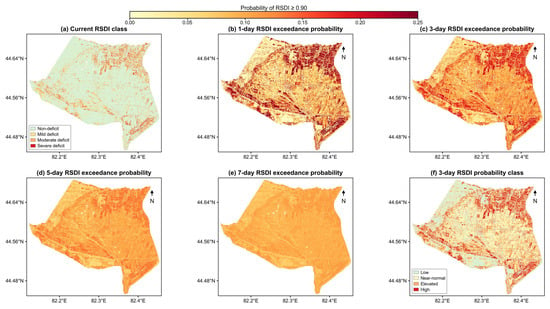
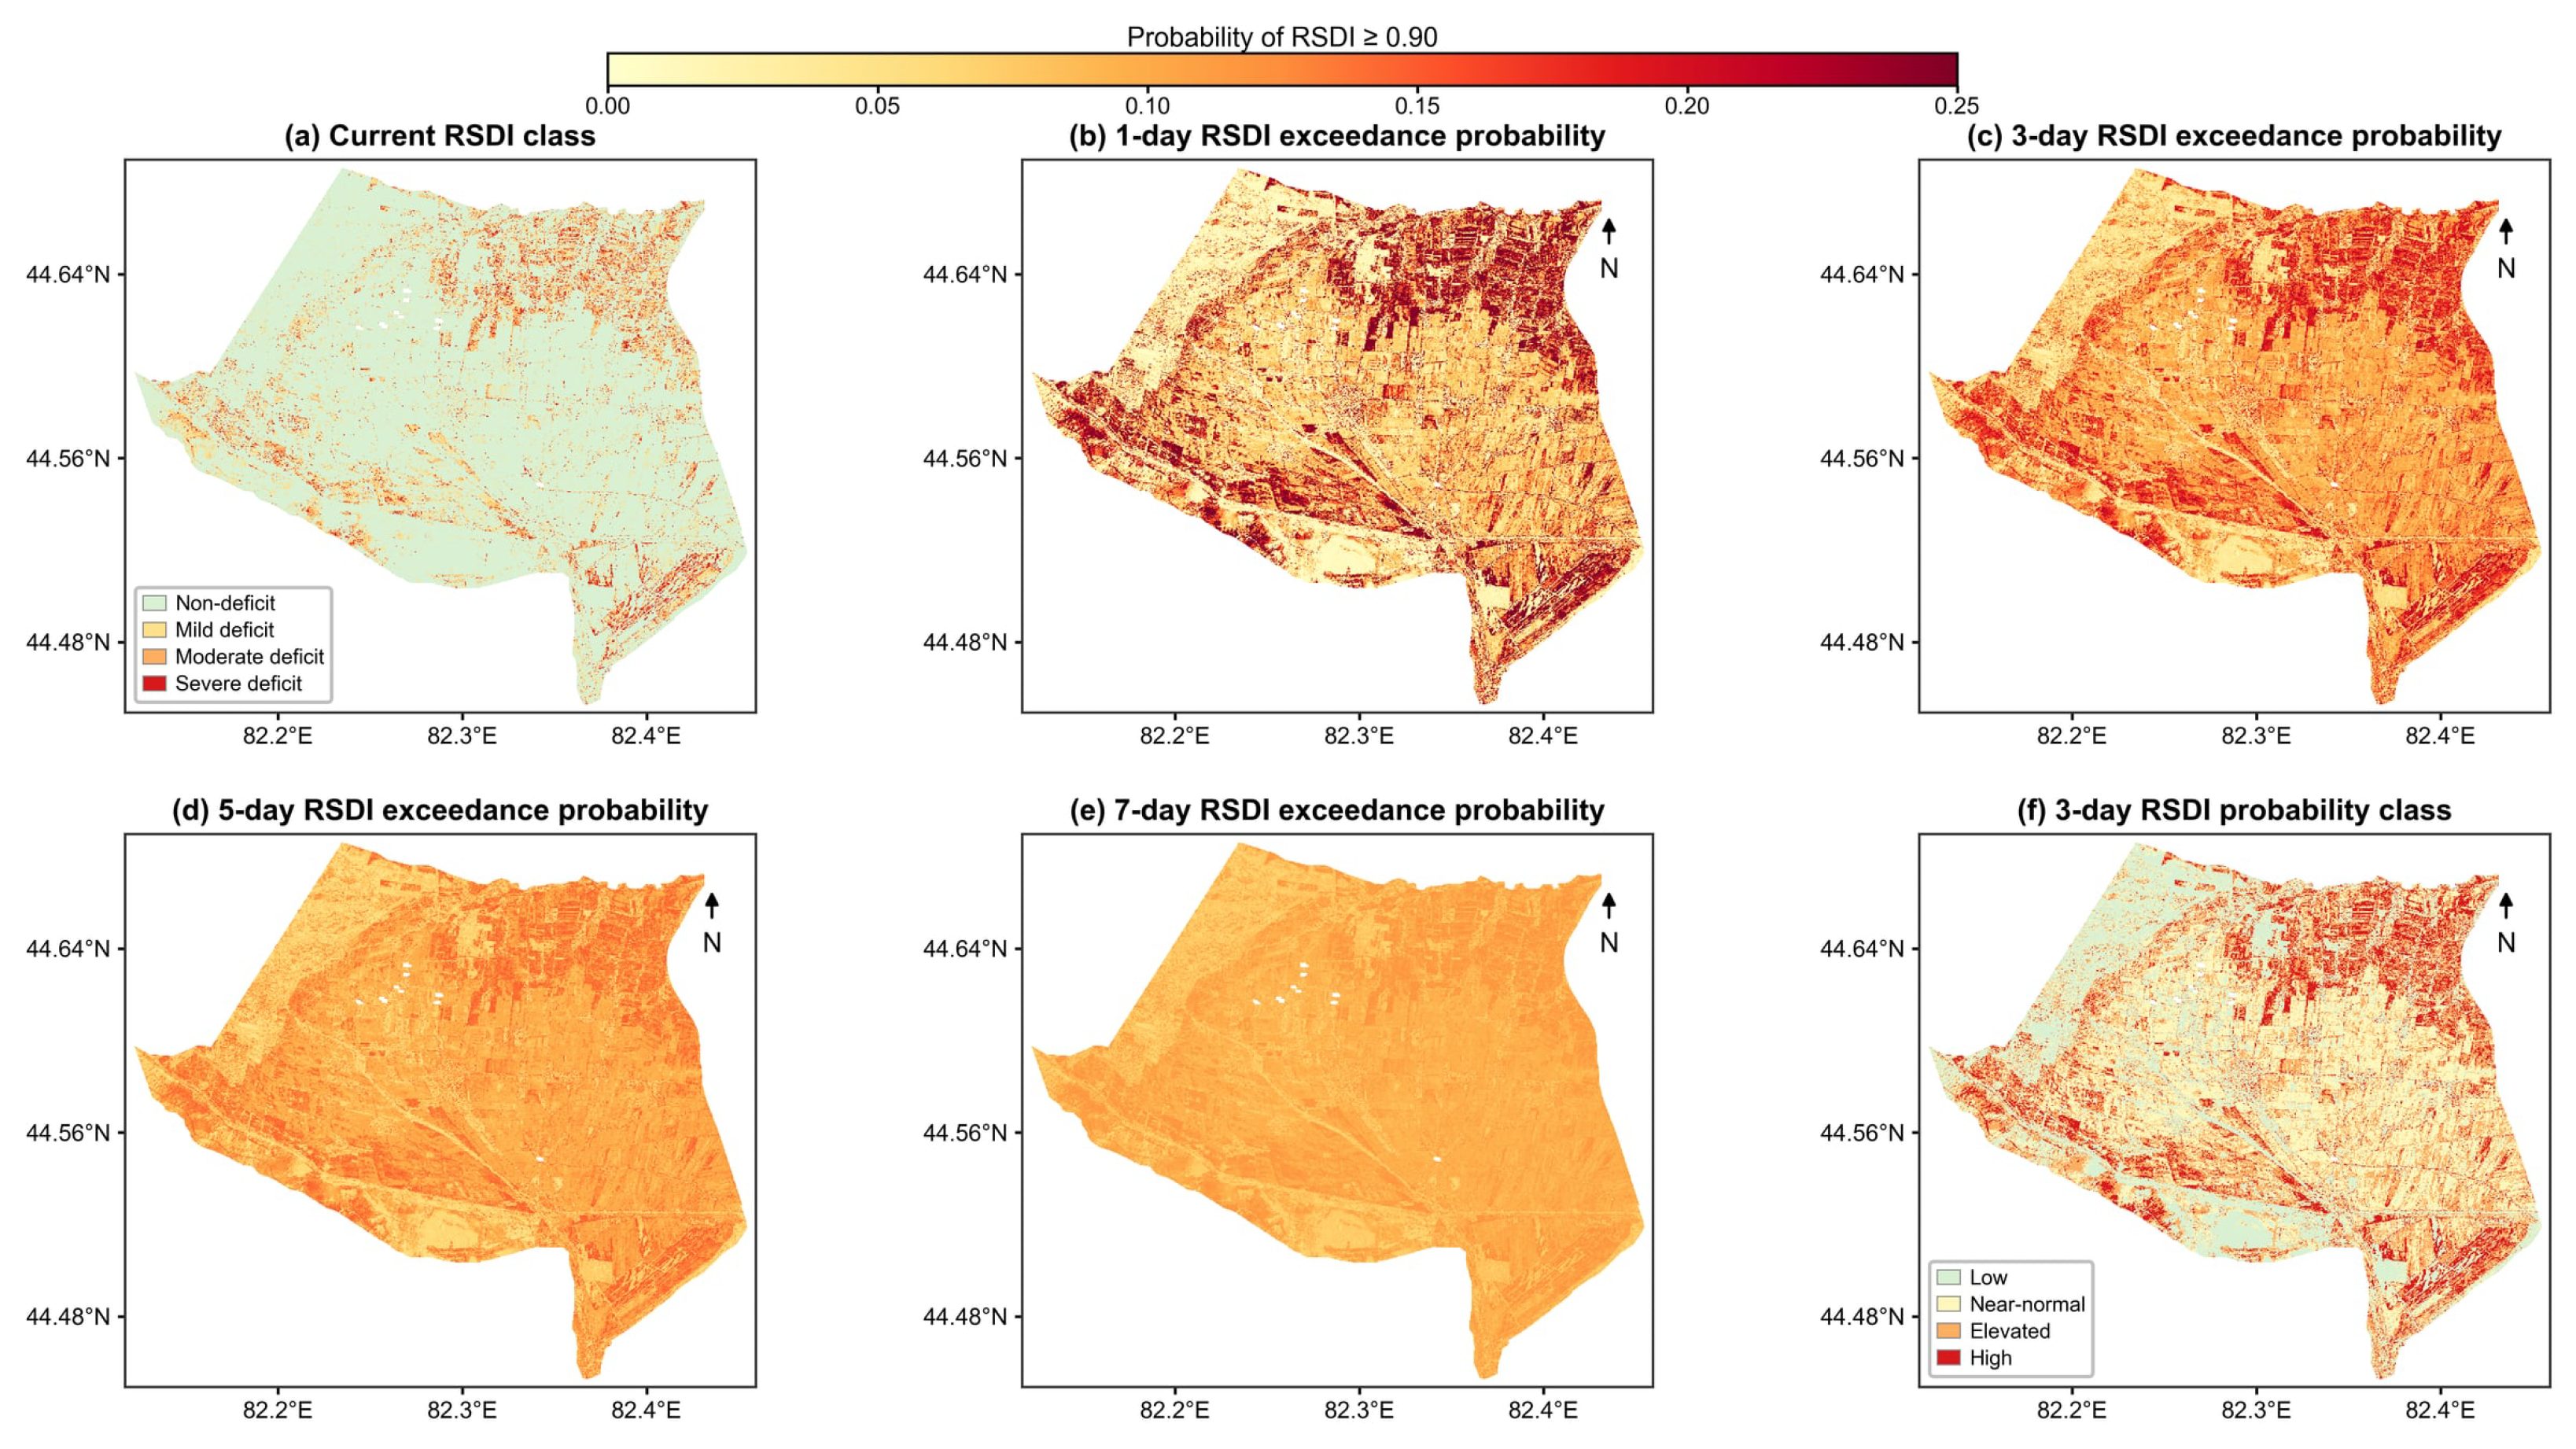
Figure 6 shows the spatial distribution of conditional RSDI-exceedance probabilities at 1-, 3-, 5-, and 7-day lead times, using 7 June 2024 as the forecast origin. These lead times correspond to 8, 10, 12, and 14 June 2024, respectively. The baseline condition represents the 30 m daily RSDI derived from 0 to 40 cm soil moisture. The maps show the conditional probability of future RSDI reaching or exceeding 0.90, corresponding approximately to the driest 10% of the pixel-specific reference distribution.
Figure 6.
Spatial distribution of conditional RSDI-exceedance probabilities using 7 June 2024 as the forecast origin: (a) Current RSDI class on 7 June 2024; (b) 1-day-ahead probability of RSDI ≥ 0.90 for 8 June 2024; (c) 3-day-ahead probability for 10 June 2024; (d) 5-day-ahead probability for 12 June 2024; (e) 7-day-ahead probability for 14 June 2024; and (f) 3-day-ahead exceedance-probability class for 10 June 2024.
The current RSDI shows clear spatial heterogeneity, with the most pronounced relative soil-moisture deficits concentrated in the southern, southwestern, and northwestern parts of the district. The 1-day forecast largely retains this spatial pattern, indicating strong short-term persistence.
At the 3- and 5-day lead times, high-probability areas become more extensive and continuous, while localized spatial contrasts gradually decrease. By the 7-day lead, the probability distribution is smoother and spatial differences are less pronounced. This pattern is consistent with the decrease in Kendall’s τ with increasing forecast horizon.
The 3-day probability-class map shows that high-probability areas generally coincide with areas of high current RSDI, although the spatial patterns are not identical. This indicates spatial variation in the persistence of relative soil-moisture deficits across the district.
4. Discussion
The RF-based retrieval achieved satisfactory accuracy across all four soil layers (R2 = 0.747–0.842), confirming the feasibility of integrating multi-source remote sensing and reanalysis to generate daily 30 m root-zone soil-moisture data. By coupling this high-resolution retrieval with probabilistic dependence modeling, the present study extends previous data-fusion approaches from soil-moisture estimation toward the characterization of short-term relative soil-moisture-deficit persistence.
An important distinction from most Copula-based drought studies, which have focused primarily on natural river basins or rainfed systems, is the strongly irrigation-regulated nature of the Daheyanzi Irrigation District. In this setting, root-zone soil moisture is jointly influenced by irrigation inputs, evapotranspiration, crop water uptake, and meteorological forcing. Consequently, a high RSDI should be interpreted as a relatively dry root-zone condition within the local reference distribution rather than as direct evidence of agricultural drought, crop water stress, or yield loss. Operationally, a high RSDI indicates a potential near-term irrigation need. When irrigation-water availability is limited, the spatial distribution and short-term persistence of high RSDI values can help identify fields that may warrant higher irrigation priority.
The rapid decay of Kendall’s τ from 0.505 at the 1-day lead to 0.085 at the 7-day lead indicates that antecedent root-zone soil moisture provides useful persistence information mainly within a 1–3-day window. This decline may partly reflect the interruption of soil-moisture depletion by irrigation events. The Frank Copula provided the best statistical fit among the candidate models and, because it does not impose strong upper- or lower-tail dependence, was consistent with the observed dependence structure. However, the framework remains purely statistical. The Frank Copula provides a statistical representation of the observed dependence structure rather than a mechanistic description of root-zone soil-water processes.
The operational value of the forecasts is therefore concentrated mainly within the 1–3-day horizon, when antecedent soil-moisture conditions retain the strongest predictive information. At these lead times, the probability maps can help identify fields where relatively severe root-zone soil-moisture deficits are likely to persist, providing useful information for near-term irrigation prioritization. The substantially weaker dependence and predictive skill at 5–7 days indicate greater forecast uncertainty at longer lead times.
Rolling-window validation further confirmed that model skill was concentrated at short lead times. The Copula model showed its clearest advantage at the 1-day lead and improved event discrimination at 3 days, whereas its advantage diminished at 5–7 days. The sharp decline in the Markov-chain reliability curves at high forecast probabilities likely reflects the combined effects of sampling instability and discrete state transitions within the 60-day rolling windows. Accordingly, individual high-probability forecasts, especially at longer lead times, should be interpreted cautiously.
Several limitations should be acknowledged. First, the analysis relies on only two growing seasons (2024 and 2025) and a 60-day rolling window, resulting in relatively small samples for rare high-RSDI events and greater uncertainty at longer lead times. Although Wilson confidence intervals quantify sampling uncertainty in the reliability bins, they do not fully capture uncertainty in the fitted Copula parameters. Second, the current forecasting framework relies primarily on antecedent soil-moisture conditions and does not explicitly incorporate external drivers such as future meteorological conditions, irrigation inputs, or crop water demand, which may contribute to the reduced forecasting skill at longer lead times. Additionally, because the RSDI thresholds are percentile-based, they guarantee a fixed proportion of dry samples regardless of actual wetness, which inherently limits the achievable PR-AUC. A rigorous comparison against absolute soil-moisture or crop-stress thresholds would require independent crop-specific observations, which were not available in this study. Finally, operational implementation would require RSDI reference distributions established independently from historical observations before the forecast period.
5. Conclusions
This study developed a spatially explicit probabilistic framework to assess the short-term persistence of relative root-zone soil-moisture deficits in the Daheyanzi Irrigation District. The framework combines multi-source remote sensing, RF-based soil-moisture retrieval, and Copula-based dependence analysis. The RF models produced daily 0–40 cm soil-moisture estimates at 30 m resolution, with R2 values ranging from 0.747 to 0.842 across the four soil layers.
Among the four Copula families tested, the Frank Copula gave the best statistical fit. The dependence between current and future RSDI conditions weakened quickly with lead time, as Kendall’s τ declined from 0.505 at 1 day to 0.085 at 7 days. When the current RSDI was above 0.80, the probability that future RSDI exceeded 0.90 was 28.0% at 1 day and 19.0% at 3 days. The rolling-window results also showed that most of the useful persistence information was concentrated within the first 1–3 days, while the advantage of the Copula model became much smaller at 5–7 days.
These results show that the framework is better suited to describing short-term persistence of relative soil-moisture deficits than to forecasting agricultural drought, crop water stress, or yield loss directly. In irrigation-dominated areas, the 30 m probability maps can help identify fields where relatively dry root-zone conditions are likely to continue over the next few days and can therefore support irrigation-need screening and prioritization.
Several limitations should nevertheless be considered. The present analysis was based on only two growing seasons and did not explicitly incorporate meteorological forecasts, crop water demand, or scheduled irrigation information, which may limit forecast robustness, particularly at longer lead times. Future research should evaluate the framework using longer multi-year datasets and independent irrigation districts, establish prospective RSDI reference distributions, and integrate weather-forecast ensembles, crop-specific water requirements, and irrigation-supply information to improve operational forecasting and irrigation decision support.
Author Contributions
Conceptualization, Z.M. and C.Y.; methodology, software, formal analysis, data curation, visualization, and writing—original draft preparation, Z.M.; validation, Z.M. and C.Y.; investigation, Z.M., D.C. and Q.S.; resources, C.Y., D.C. and Q.S.; writing—review and editing, D.C.; supervision, project administration, and funding acquisition, C.Y. All authors have read and agreed to the published version of the manuscript.
Funding
This research was funded by the Xinjiang Uygur Autonomous Region Major Science and Technology Special Projects (grant number 2022A02003-5).
Data Availability Statement
Detailed dataset abbreviations, product versions, and access links are provided in Appendix A Table A1. Ground-based soil-moisture observations and processed datasets generated during this study are available from the corresponding author upon reasonable request.
Acknowledgments
During the preparation of this manuscript, the authors used DeepSeek and ChatGPT (OpenAI) to assist with Chinese-to-English translation, improve the language and readability of the manuscript, and revise or rephrase portions of the translated text. The authors have reviewed and edited the output and take full responsibility for the content of this publication.
Conflicts of Interest
The authors declare no conflicts of interest.
Abbreviations
| Abbreviation | Full name |
| AIC | Akaike Information Criterion |
| BIC | Bayesian Information Criterion |
| CP | Climatological Probability |
| CVM | Cramér–von Mises |
| DEM | Digital Elevation Model |
| ESTARFM | Enhanced Spatial and Temporal Adaptive Reflectance Fusion Model |
| EVI | Enhanced Vegetation Index |
| GEE | Google Earth Engine |
| GLDAS | Global Land Data Assimilation System |
| HLS | Harmonized Landsat and Sentinel-2 |
| HWSD | Harmonized World Soil Database |
| LAI | Leaf Area Index |
| LR | Logistic Regression |
| LSWI | Land Surface Water Index |
| LST | Land Surface Temperature |
| MAE | Mean Absolute Error |
| MC | Markov Chain |
| MODIS | Moderate Resolution Imaging Spectroradiometer |
| MSAVI | Modified Soil-Adjusted Vegetation Index |
| NDVI | Normalized Difference Vegetation Index |
| PR-AUC | Area Under the Precision–Recall Curve |
| RF | Random Forest |
| R2 | Coefficient of Determination |
| RMSE | Root Mean Square Error |
| RSDI | Relative Soil-Moisture-Deficit Index |
| RZSM | Root-Zone Soil Moisture |
| SMAP | Soil-Moisture Active Passive |
| WRB | World Reference Base for Soil Resources |
Appendix A
Table A1.
Datasets used in this study and their access information.
References
- Vicente-Serrano, S.M.; Peña-Angulo, D.; Beguería, S.; Domínguez-Castro, F.; Tomás-Burguera, M.; Noguera, I.; Gimeno-Sotelo, L.; El Kenawy, A. Global Drought Trends and Future Projections. Philos. Trans. R. Soc. Math. Phys. Eng. Sci. 2022, 380, 20210285. [Google Scholar] [CrossRef] [Scilit] [PubMed]
- Kannenberg, S.A.; Anderegg, W.R.L.; Barnes, M.L.; Dannenberg, M.P.; Knapp, A.K. Dominant Role of Soil Moisture in Mediating Carbon and Water Fluxes in Dryland Ecosystems. Nat. Geosci. 2024, 17, 38–43. [Google Scholar] [CrossRef] [Scilit]
- Xu, Y.; Zhang, X.; Hao, Z.; Singh, V.P.; Hao, F. Characterization of Agricultural Drought Propagation over China Based on Bivariate Probabilistic Quantification. J. Hydrol. 2021, 598, 126194. [Google Scholar] [CrossRef] [Scilit]
- Claverie, M.; Ju, J.; Masek, J.G.; Dungan, J.L.; Vermote, E.F.; Roger, J.-C.; Skakun, S.V.; Justice, C. The Harmonized Landsat and Sentinel-2 Surface Reflectance Data Set. Remote Sens. Environ. 2018, 219, 145–161. [Google Scholar] [CrossRef] [Scilit]
- Tarraf, B.; Brun, F.; Raynaud, L.; Roux, S.; Zhang, Y.; Davadan, L.; Deudon, O. Assessing the Impact of Weather Forecast Uncertainties in Crop Water Stress Model Predictions. Agric. For. Meteorol. 2024, 349, 109934. [Google Scholar] [CrossRef] [Scilit]
- Wen, Y.; Fei, Y.; Fan, Y.; Yang, A.; Wang, B.; Gao, P.; Scott, D. Development of a Probabilistic Agricultural Drought Forecasting (PADF) Framework under Climate Change. Agric. For. Meteorol. 2024, 350, 109965. [Google Scholar] [CrossRef] [Scilit]
- Paolini, G.; Escorihuela, M.J.; Bellvert, J.; Merlin, O.; Pellarin, T. PrISM at Operational Scale: Monitoring Irrigation District Water Use during Droughts. Remote Sens. 2024, 16, 1116. [Google Scholar] [CrossRef] [Scilit]
- Reichle, R.H.; Liu, Q.; Koster, R.D.; Crow, W.T.; De Lannoy, G.J.M.; Kimball, J.S.; Ardizzone, J.V.; Bosch, D.; Colliander, A.; Cosh, M.; et al. Version 4 of the SMAP Level-4 Soil Moisture Algorithm and Data Product. J. Adv. Model. Earth Syst. 2019, 11, 3106–3130. [Google Scholar] [CrossRef] [Scilit]
- Gorelick, N.; Hancher, M.; Dixon, M.; Ilyushchenko, S.; Thau, D.; Moore, R. Google Earth Engine: Planetary-Scale Geospatial Analysis for Everyone. Remote Sens. Environ. 2017, 202, 18–27. [Google Scholar] [CrossRef] [Scilit]
- Li, M.; Wang, P.; Tansey, K.; Sun, Y.; Guo, F.; Zhou, J. Improved Field-Scale Drought Monitoring Using MODIS and Sentinel-2 Data for Vegetation Temperature Condition Index Generation through a Fusion Framework. Comput. Electron. Agric. 2025, 234, 110256. [Google Scholar] [CrossRef] [Scilit]
- Zhu, X.; Chen, J.; Gao, F.; Chen, X.; Masek, J.G. An Enhanced Spatial and Temporal Adaptive Reflectance Fusion Model for Complex Heterogeneous Regions. Remote Sens. Environ. 2010, 114, 2610–2623. [Google Scholar] [CrossRef] [Scilit]
- Li, S.; Han, Y.; Li, C.; Wang, J. A Novel Framework for Multi-Layer Soil Moisture Estimation with High Spatio-Temporal Resolution Based on Data Fusion and Automated Machine Learning. Agric. Water Manag. 2024, 306, 109173. [Google Scholar] [CrossRef] [Scilit]
- Abowarda, A.S.; Bai, L.; Zhang, C.; Long, D.; Li, X.; Huang, Q.; Sun, Z. Generating Surface Soil Moisture at 30 m Spatial Resolution Using Both Data Fusion and Machine Learning toward Better Water Resources Management at the Field Scale. Remote Sens. Environ. 2021, 255, 112301. [Google Scholar] [CrossRef] [Scilit]
- Babaeian, E.; Paheding, S.; Siddique, N.; Devabhaktuni, V.K.; Tuller, M. Estimation of Root Zone Soil Moisture from Ground and Remotely Sensed Soil Information with Multisensor Data Fusion and Automated Machine Learning. Remote Sens. Environ. 2021, 260, 112434. [Google Scholar] [CrossRef] [Scilit]
- Yan, H.; Moradkhani, H.; Zarekarizi, M. A Probabilistic Drought Forecasting Framework: A Combined Dynamical and Statistical Approach. J. Hydrol. 2017, 548, 291–304. [Google Scholar] [CrossRef] [Scilit]
- Genest, C.; Favre, A.-C. Everything You Always Wanted to Know about Copula Modeling but Were Afraid to Ask. J. Hydrol. Eng. 2007, 12, 347–368. [Google Scholar] [CrossRef] [Scilit]
- Ribeiro, A.F.S.; Russo, A.; Gouveia, C.M.; Páscoa, P. Copula-Based Agricultural Drought Risk of Rainfed Cropping Systems. Agric. Water Manag. 2019, 223, 105689. [Google Scholar] [CrossRef] [Scilit]
- Wu, R.; Zhang, J.; Bao, Y.; Guo, E. Run Theory and Copula-Based Drought Risk Analysis for Songnen Grassland in Northeastern China. Sustainability 2019, 11, 6032. [Google Scholar] [CrossRef] [Scilit]
- Lei, H.; Yu, J.; Pan, H.; Li, J.; Leghari, S.J.; Shang, C.; Xiao, Z.; Jin, C.; Shi, L. A New Agricultural Drought Disaster Risk Assessment Framework: Coupled a Copula Function to Select Return Periods and the Jensen Model to Calculate Yield Loss. Sustainability 2023, 15, 3786. [Google Scholar] [CrossRef] [Scilit]
- Zhao, P.; Lü, H.; Fu, G.; Zhu, Y.; Su, J.; Wang, J. Uncertainty of Hydrological Drought Characteristics with Copula Functions and Probability Distributions: A Case Study of Weihe River, China. Water 2017, 9, 334. [Google Scholar] [CrossRef] [Scilit]
- Hao, Z.; Singh, V.P.; Xia, Y. Seasonal Drought Prediction: Advances, Challenges, and Future Prospects. Rev. Geophys. 2018, 56, 108–141. [Google Scholar] [CrossRef] [Scilit]
- Wilks, D.S. Extending Logistic Regression to Provide Full-Probability-Distribution MOS Forecasts. Meteorol. Appl. 2009, 16, 361–368. [Google Scholar] [CrossRef] [Scilit]
- Avilés, A.; Célleri, R.; Solera, A.; Paredes, J. Probabilistic Forecasting of Drought Events Using Markov Chain- and Bayesian Network-Based Models: A Case Study of an Andean Regulated River Basin. Water 2016, 8, 37. [Google Scholar] [CrossRef] [Scilit]
- Rivoire, P.; Martius, O.; Naveau, P.; Tuel, A. Assessment of Subseasonal-to-Seasonal (S2S) Ensemble Extreme Precipitation Forecast Skill over Europe. Nat. Hazards Earth Syst. Sci. 2023, 23, 2857–2871. [Google Scholar] [CrossRef] [Scilit]
- Li, J.; Yue, C.; Zhang, S. A Two-Level Optimal Water Allocation Model for Canal-Drip Irrigation Systems Based on Decomposition–Coordination Theory. Sustainability 2026, 18, 3217. [Google Scholar] [CrossRef] [Scilit]
- FAO; International Institute for Applied Systems Analysis (IIASA). Harmonized World Soil Database Version 2.0; FAO: Rome, Italy, 2023.
- Wan, Z.; Hook, S.; Hulley, G. MODIS/Terra Land Surface Temperature/Emissivity Daily L3 Global 1km SIN Grid V061; Land Processes DAAC: Sioux Falls, SD, USA, 2021. [Google Scholar]
- Vermote, E.; Wolfe, R. MODIS/Terra Surface Reflectance Daily L2G Global 1 km and 500 m SIN Grid V061; Land Processes DAAC: Sioux Falls, SD, USA, 2021.
- Earth Resources Observation And Science (Eros) Center. Landsat 8-9 Operational Land Imager/Thermal Infrared Sensor Level-2, Collection 2; USGS EROS Center: Sioux Falls, SD, USA, 2013.
- Muñoz-Sabater, J.; Dutra, E.; Agustí-Panareda, A.; Albergel, C.; Arduini, G.; Balsamo, G.; Boussetta, S.; Choulga, M.; Harrigan, S.; Hersbach, H.; et al. ERA5-Land: A State-of-the-Art Global Reanalysis Dataset for Land Applications. Earth Syst. Sci. Data 2021, 13, 4349–4383. [Google Scholar] [CrossRef] [Scilit]
- Beaudoing, H.; Rodell, M.; Hydrological Sciences Laboratory (HSL). GLDAS Noah Land Surface Model L4 3 Hourly 0.25 × 0.25 Degree, Version 2.1; Goddard Earth Sciences Data and Information Services Center: Greenbelt, MD, USA, 2020.
- Liu, J.; Pattey, E.; Jégo, G. Assessment of Vegetation Indices for Regional Crop Green LAI Estimation from Landsat Images over Multiple Growing Seasons. Remote Sens. Environ. 2012, 123, 347–358. [Google Scholar] [CrossRef] [Scilit]
- Li, X.-J.; Wu, H.; Li, Z.-L.; Sobrino, J.A.; Zhang, X.-X.; Cheng, Y.-L. A Novel Correlation-Hypothesis Based Single Channel Method for Land Surface Temperature Retrieval with Reduced Atmospheric Dependency. Remote Sens. Environ. 2025, 327, 114817. [Google Scholar] [CrossRef] [Scilit]
- Chen, L.; Hu, B.; Sun, J.; Xu, Y.J.; Zhang, G.; Ma, H.; Ren, J. Using Remote Sensing and Machine Learning to Generate 100-Cm Soil Moisture at 30-m Resolution for the Black Soil Region of China: Implication for Agricultural Water Management. Agric. Water Manag. 2025, 309, 109353. [Google Scholar] [CrossRef] [Scilit]
- Lamichhane, M.; Mehan, S.; Mankin, K.R. Soil Moisture Prediction Using Remote Sensing and Machine Learning Algorithms: A Review on Progress, Challenges, and Opportunities. Remote Sens. 2025, 17, 2397. [Google Scholar] [CrossRef] [Scilit]
- Zhao, Q.; Zhang, X.; Li, C.; Xu, Y.; Fei, J. Compound Ecological Drought Assessment of China Using a Copula-Based Drought Index. Ecol. Indic. 2024, 164, 112141. [Google Scholar] [CrossRef] [Scilit]

Disclaimer/Publisher’s Note: The statements, opinions and data contained in all publications are solely those of the individual author(s) and contributor(s) and not of MDPI and/or the editor(s). MDPI and/or the editor(s) disclaim responsibility for any injury to people or property resulting from any ideas, methods, instructions or products referred to in the content. |
© 2026 by the authors. Licensee MDPI, Basel, Switzerland. This article is an open access article distributed under the terms and conditions of the Creative Commons Attribution (CC BY) license.