


Abstract
Agrivoltaics provides a potential pathway to integrate crop cultivation with solar power generation in arid and semi-arid regions, but wheat responses to the heterogeneous microenvironment within photovoltaic arrays remain unclear. A field experiment was performed in the semi-arid region during 2024 and 2025 to evaluate the effects of agrivoltaic systems equipped with integrated water–fertilizer management on wheat growth and yield. Conventional open-field cultivation without photovoltaic panels or water–fertilizer management was used as the control (Open). Within the photovoltaic arrays, two planting positions were compared: the unshaded area between panel arrays (Gap) and the shaded area beneath panels (Under). Averaged across two years, grain yield was 88.6% and 40.9% greater in the Gap and Under treatments, respectively, than in the Open treatment. The Gap treatment showed the greatest root development, with root length and surface area increasing by 27.0% and 17.9% on average, respectively. The microenvironment within photovoltaic panels and water–fertilizer supply promoted yield formation of wheat in the Gap treatment, contributing to increases in spike number, grains per spike, and 1000-grain weight by 17.6%, 53.1%, and 39.0%, respectively. Despite shading in the Under treatment, water–fertilizer coupling in agrivoltaics improved soil moisture, organic carbon, and available nutrients, supporting biomass accumulation and yield formation. Despite additional water–fertilizer supply costs, the agrivoltaic system increased net revenue by 3017 CNY ha−1 compared with the conventional system. Moreover, in the drier year, the smaller yield reduction under agrivoltaic systems indicated a climate-buffering potential. These findings suggest that integrating agrivoltaics with water–fertilizer management could enhance wheat productivity in semi-arid sandy regions.
1. Introduction
The worldwide shift toward low-carbon energy systems has promoted the rapid expansion of conventional photovoltaic power stations, which require extensive land areas and consequently intensify competition with agricultural production and ecological conservation. Agrivoltaics, the co-location of solar energy generation and crop cultivation, has been proposed as a promising solution to reduce land-use conflicts [1]. By coupling renewable energy generation with crop production, agrivoltaics not only optimizes land-use efficiency and diversifies farm revenue [2,3], but also provides substantial benefits for greenhouse gas mitigation and climate adaptation [4,5]. Consequently, agrivoltaics is increasingly recognized as a multifunctional approach for promoting clean energy production, food security, and global climate resilience.
In agrivoltaic systems, photovoltaic panel arrays alter near-surface microenvironments, affecting wind speed, radiation distribution, temperature, and humidity [6,7,8,9]. As physical barriers, photovoltaic panel arrays could reduce wind speeds by 27.6–42.3% [9]. This wind-buffering effect mitigates wind erosion and mechanical damage to plants [10], thereby supporting land productivity in arid and semi-arid sandy regions. Meanwhile, photovoltaic arrays create strong spatial differences in solar radiation, leading to spatial variation in hydrothermal conditions within the array. Beneath the photovoltaic panels, shading significantly reduces radiation interception, which reduces canopy temperatures by 1–4 °C, alleviates vapor pressure deficit (VPD) stress, and decreases cumulative evaporation by 19–33%, thereby enhancing soil moisture by 15–25% [11,12]. In contrast, the unshaded inter-row spaces between photovoltaic panels possibly experience localized warming due to heat dissipation from the panels, resulting in a photovoltaic heat island effect, depending on array configurations and regional climates [13].
Microclimatic shifts indirectly influence soil processes and nutrient cycling in agrivoltaic systems. The optimized microenvironments within photovoltaic arrays, such as improved moisture, buffered temperatures, and reduced evapotranspiration, promote plant growth, litter inputs, and microbial activity, thus accelerating soil organic carbon (SOC) accumulation and the mineralization of essential nutrients [14,15,16,17]. For instance, photovoltaics in the arid areas of Northwest China has significantly increased vegetation cover, promoted SOC accumulation, and enhanced ecosystem carbon sequestration [15]. However, soil responses within photovoltaic arrays remain spatially heterogeneous. Carvalho et al. reported that soil organic carbon (SOC) and particulate organic matter were 9.0% and 29.1% lower beneath the panels than in the inter-row spaces, respectively [16]. In contrast, Zhou et al. found significantly higher mineral nitrogen and available phosphorus beneath the panels [17].
Photovoltaic-induced microenvironmental changes further affect crop growth, yield formation, and yield stability. Within photovoltaic arrays, distinct spatial heterogeneity emerges between shaded under-panel areas (reduced light but improved moisture) and unshaded inter-row spaces between PV panels (higher radiation and redistributed rainfall). This heterogeneity drives position-specific crop adaptations. Beneath the panels, reduced light often triggers typical shade-avoidance responses, such as stem elongation and expanded leaf area [18]. While these morphological adjustments enhance light capture, they can redirect assimilates away from reproductive organs toward vegetative growth, potentially compromising grain yield [19,20]. Despite this light-induced yield loss, moderate shading under high-temperature and water-deficit conditions can alleviate heat and drought stress, reduce transpiration demand, and improve water-use efficiency, thereby helping to stabilize yields [21,22]. For instance, a mere 19% decrease in durum wheat yield was reported despite a 57% reduction in irradiance, suggesting that improved hydrothermal conditions partially offset the light deficit [22]. This buffering effect is especially evident in water-limited regions. In the semi-arid western U.S., photovoltaic shading mitigated heat and water stress, increasing soybean yield by 6% and limiting maize yield loss to 12%, whereas the humid and more light-limited eastern U.S. experienced greater yield reductions (16% and 24% reductions in soybean and maize yields) [23]. Similarly, in arid/semi-arid regions of China, photovoltaic-induced microclimates increased the biomass of soybean, alfalfa, and parsnip by 26.7% to 48.3% [9]. Furthermore, satellite-based studies in arid regions of China reveal that PV-induced soil moisture conservation drives significant phenological shifts, advancing the beginning of growing season by 13.7 days and extending its length by 16.3 days [24]. Therefore, crop growth and yield in agrivoltaic systems largely depend on the balance between water conservation and shading-induced light limitation: enhanced moisture benefits crops in water-limited environments, whereas reduced radiation acts as the primary constraint in light-limited environments.
As agrivoltaic systems expand rapidly, active management practices, such as targeted irrigation and fertilization, are increasingly essential to sustain agriculture and prevent ecological degradation, particularly in fragile environments [25,26]. The Horqin Sandy Land in northern China is a typical semi-arid sandy region, where severe desertification and nutrient depletion severely constrain agricultural productivity [27]. Meanwhile, as a vital part of the ecological security barrier in northern China, this region is under increasing pressure to reconcile desertification control with agricultural sustainability.
In this region, combining agrivoltaic systems with integrated water and fertilizer management offers a promising strategy, coupling photovoltaic-induced microclimatic buffering with precise resource supply. Wheat, a major staple crop in this region, is potentially cultivated in agrivoltaic systems due to its strong environmental adaptability and drought tolerance. Although agrivoltaics could theoretically alleviate these stresses, it remains unclear how the distinct microenvironments within photovoltaic arrays differentially affect wheat growth and yield. Furthermore, the underlying mechanisms connecting spatial variations in light, water, and nutrients to plant morpho-physiological responses remain poorly understood.
In this study, a 2-year (2024–2025) field trial was performed in a semi-arid sandy cropland in the Horqin region of northern China. The specific objectives were to (1) evaluate the effects of agrivoltaic systems equipped with water–fertilizer integration on light radiation, soil water and nutrient availability, as well as wheat growth and yield; and (2) examine how photovoltaic array-induced heterogeneity regulates wheat photosynthetic traits, root morphology, grain filling and yield formation.
2. Materials and Methods
2.1. Study Site, Climate and Soil Description
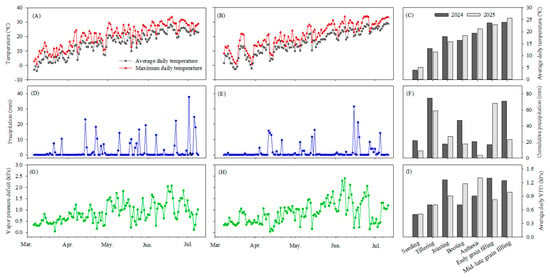
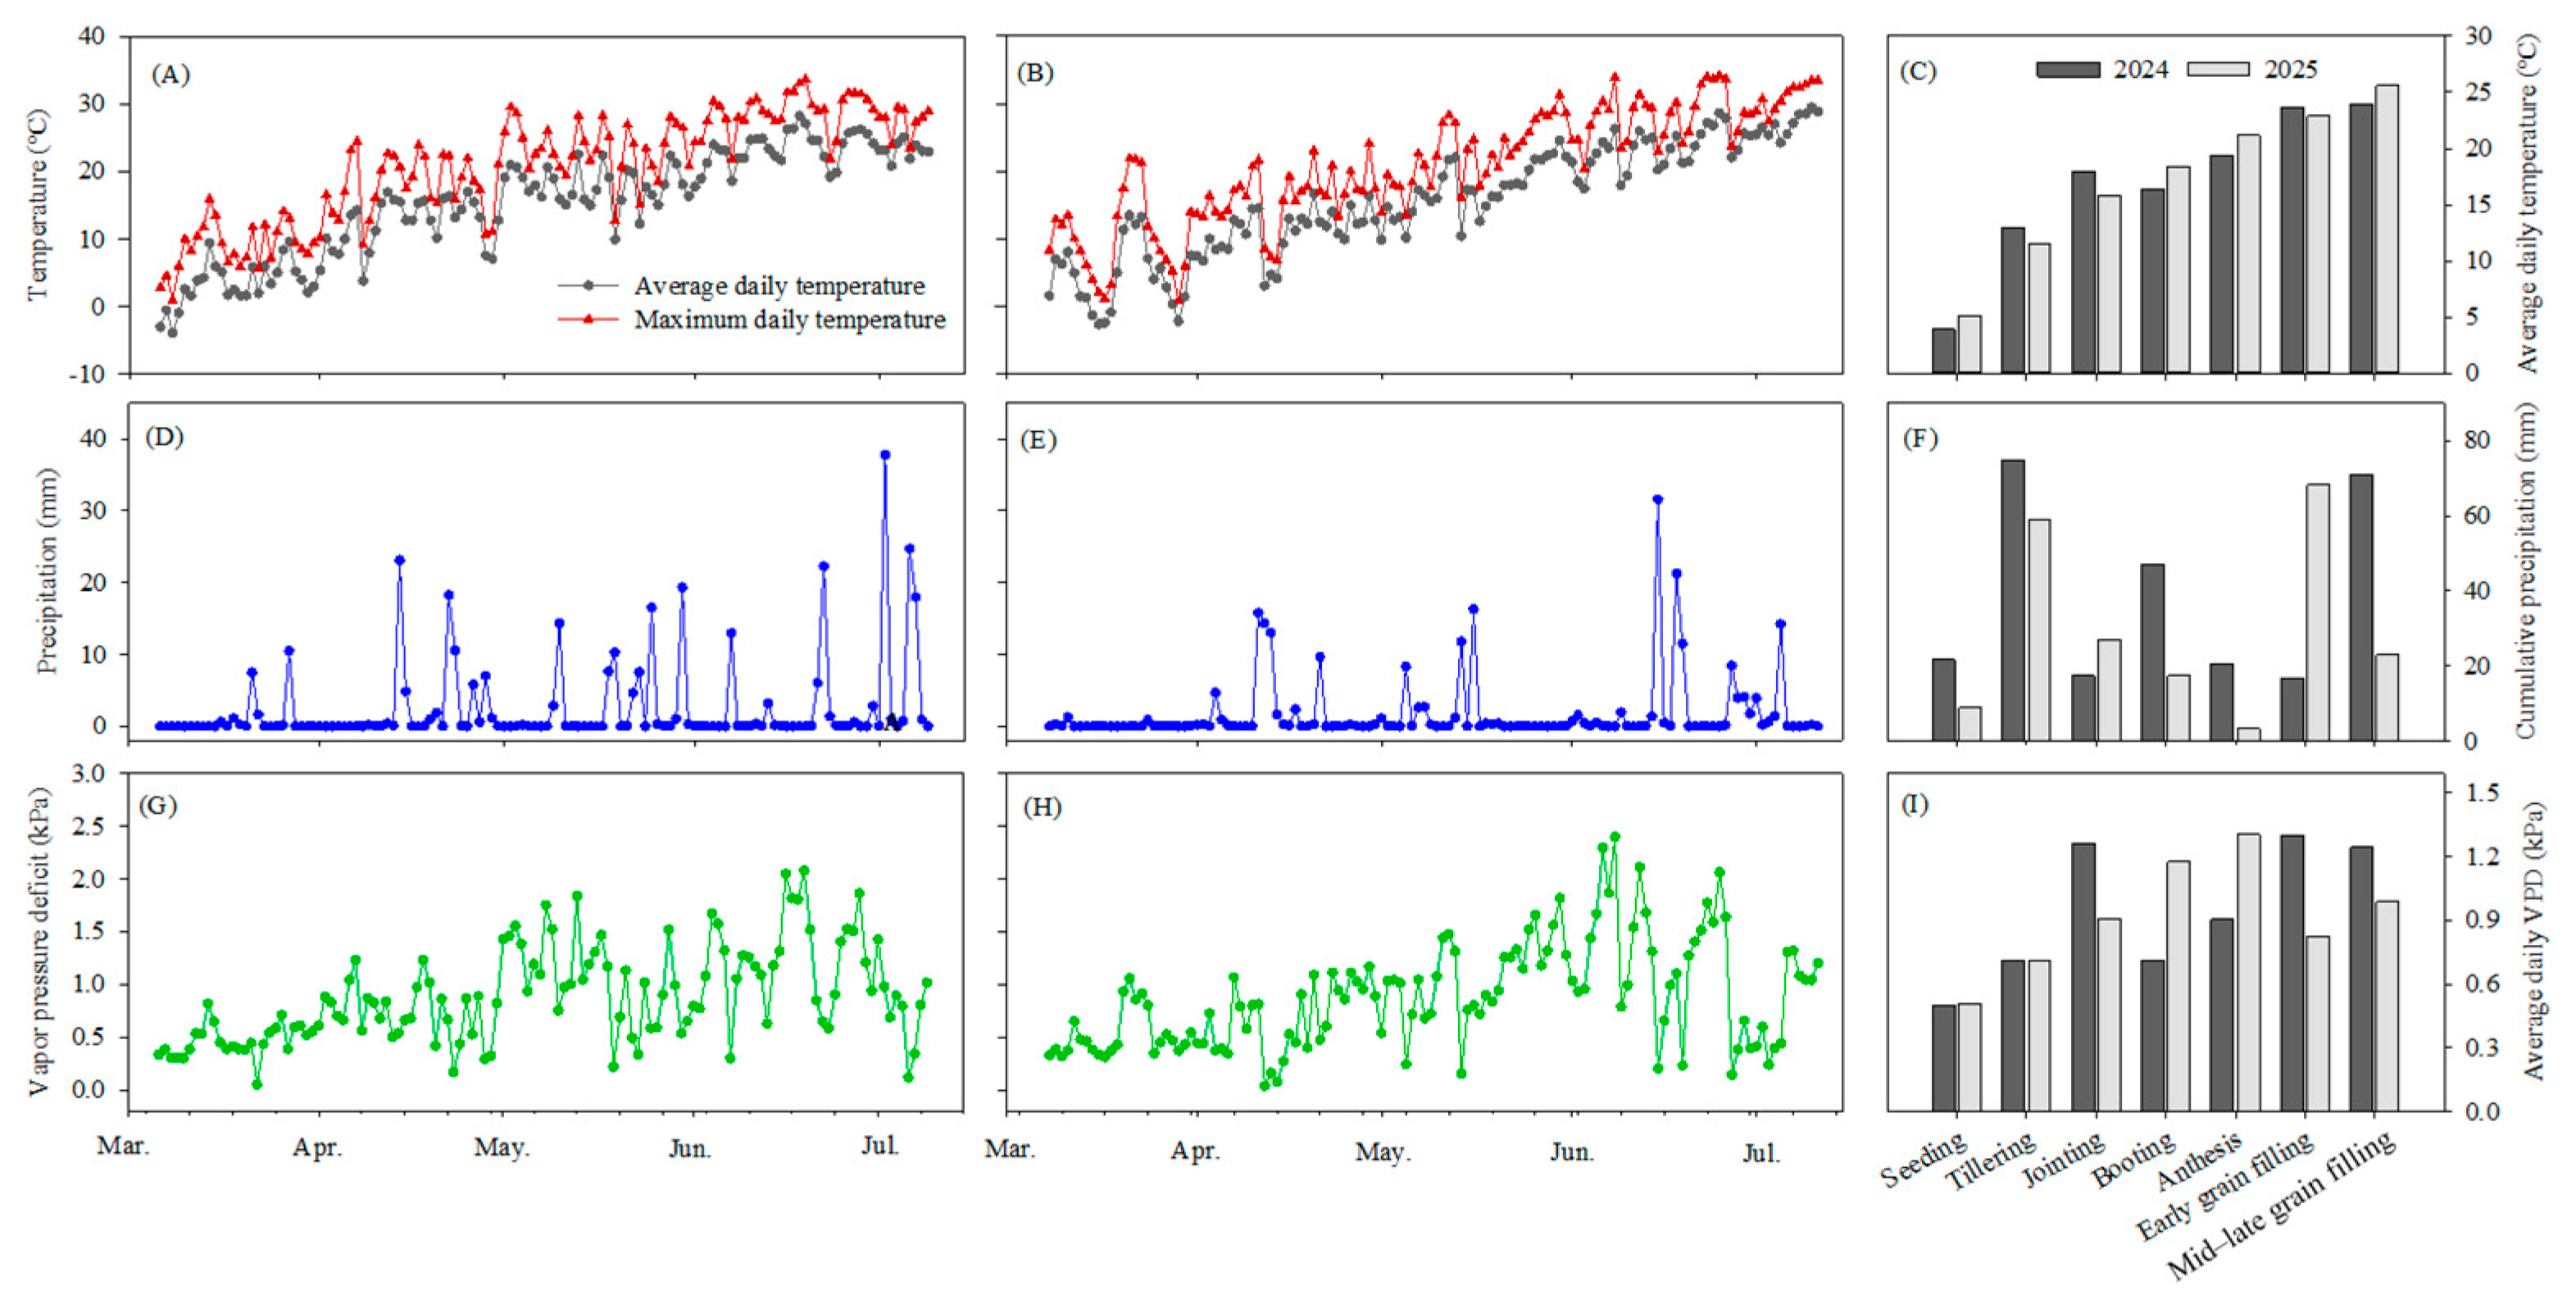
The field trial was performed during 2024–2025 in Fengjia Town (42°34′ N, 122°30′ E), Zhangwu County, Liaoning province, China. Located at the southern edge of the Horqin Sandy Land, the study site is a representative semi-arid aeolian sandy region. Meteorological data including daily temperature, precipitation, and vapor pressure deficit (VPD) across the wheat growing season of 2024–2025 are shown in Figure 1. The total precipitation was 270 mm and 206 mm, respectively, during the growing season of 2024 and 2025. In 2024, a heatwave–drought event occurred approximately at Day 14 after anthesis (DAA14) and lasted for 5 days, with an average daily maximum temperature of 32.0 °C, a mean daily VPD of 1.85 kPa, and no rainfall. The soil at the study site has a sandy loam texture and is classified as an Arenosol. The surface soil 0–20 cm layer contained an organic carbon content of 5.32 g kg–1, total nitrogen (N) of 0.47 g kg−1, total phosphorus (P) of 0.35 g kg−1, and total potassium (K) of 18.9 g kg−1. Available N, P, and K were 45.1, 20.6, and 51.3 mg kg–1, respectively. Soil pH was 6.02.
Figure 1.
Meteorological data including daily temperature (A,B), precipitation (D,E), and vapor pressure deficit (G,H) in Zhangwu County, Fuxin City, China, during the wheat growing season of 2024 (A,D,G) and 2025 (BF,H). Average temperature (C), cumulative precipitation (F), and average vapor pressure deficit (I) at the different growth stages in 2024 and 2025.
2.2. Experimental Design
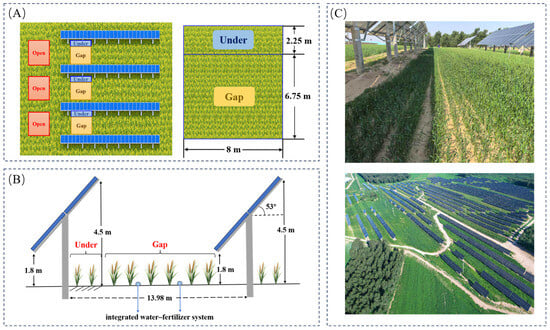
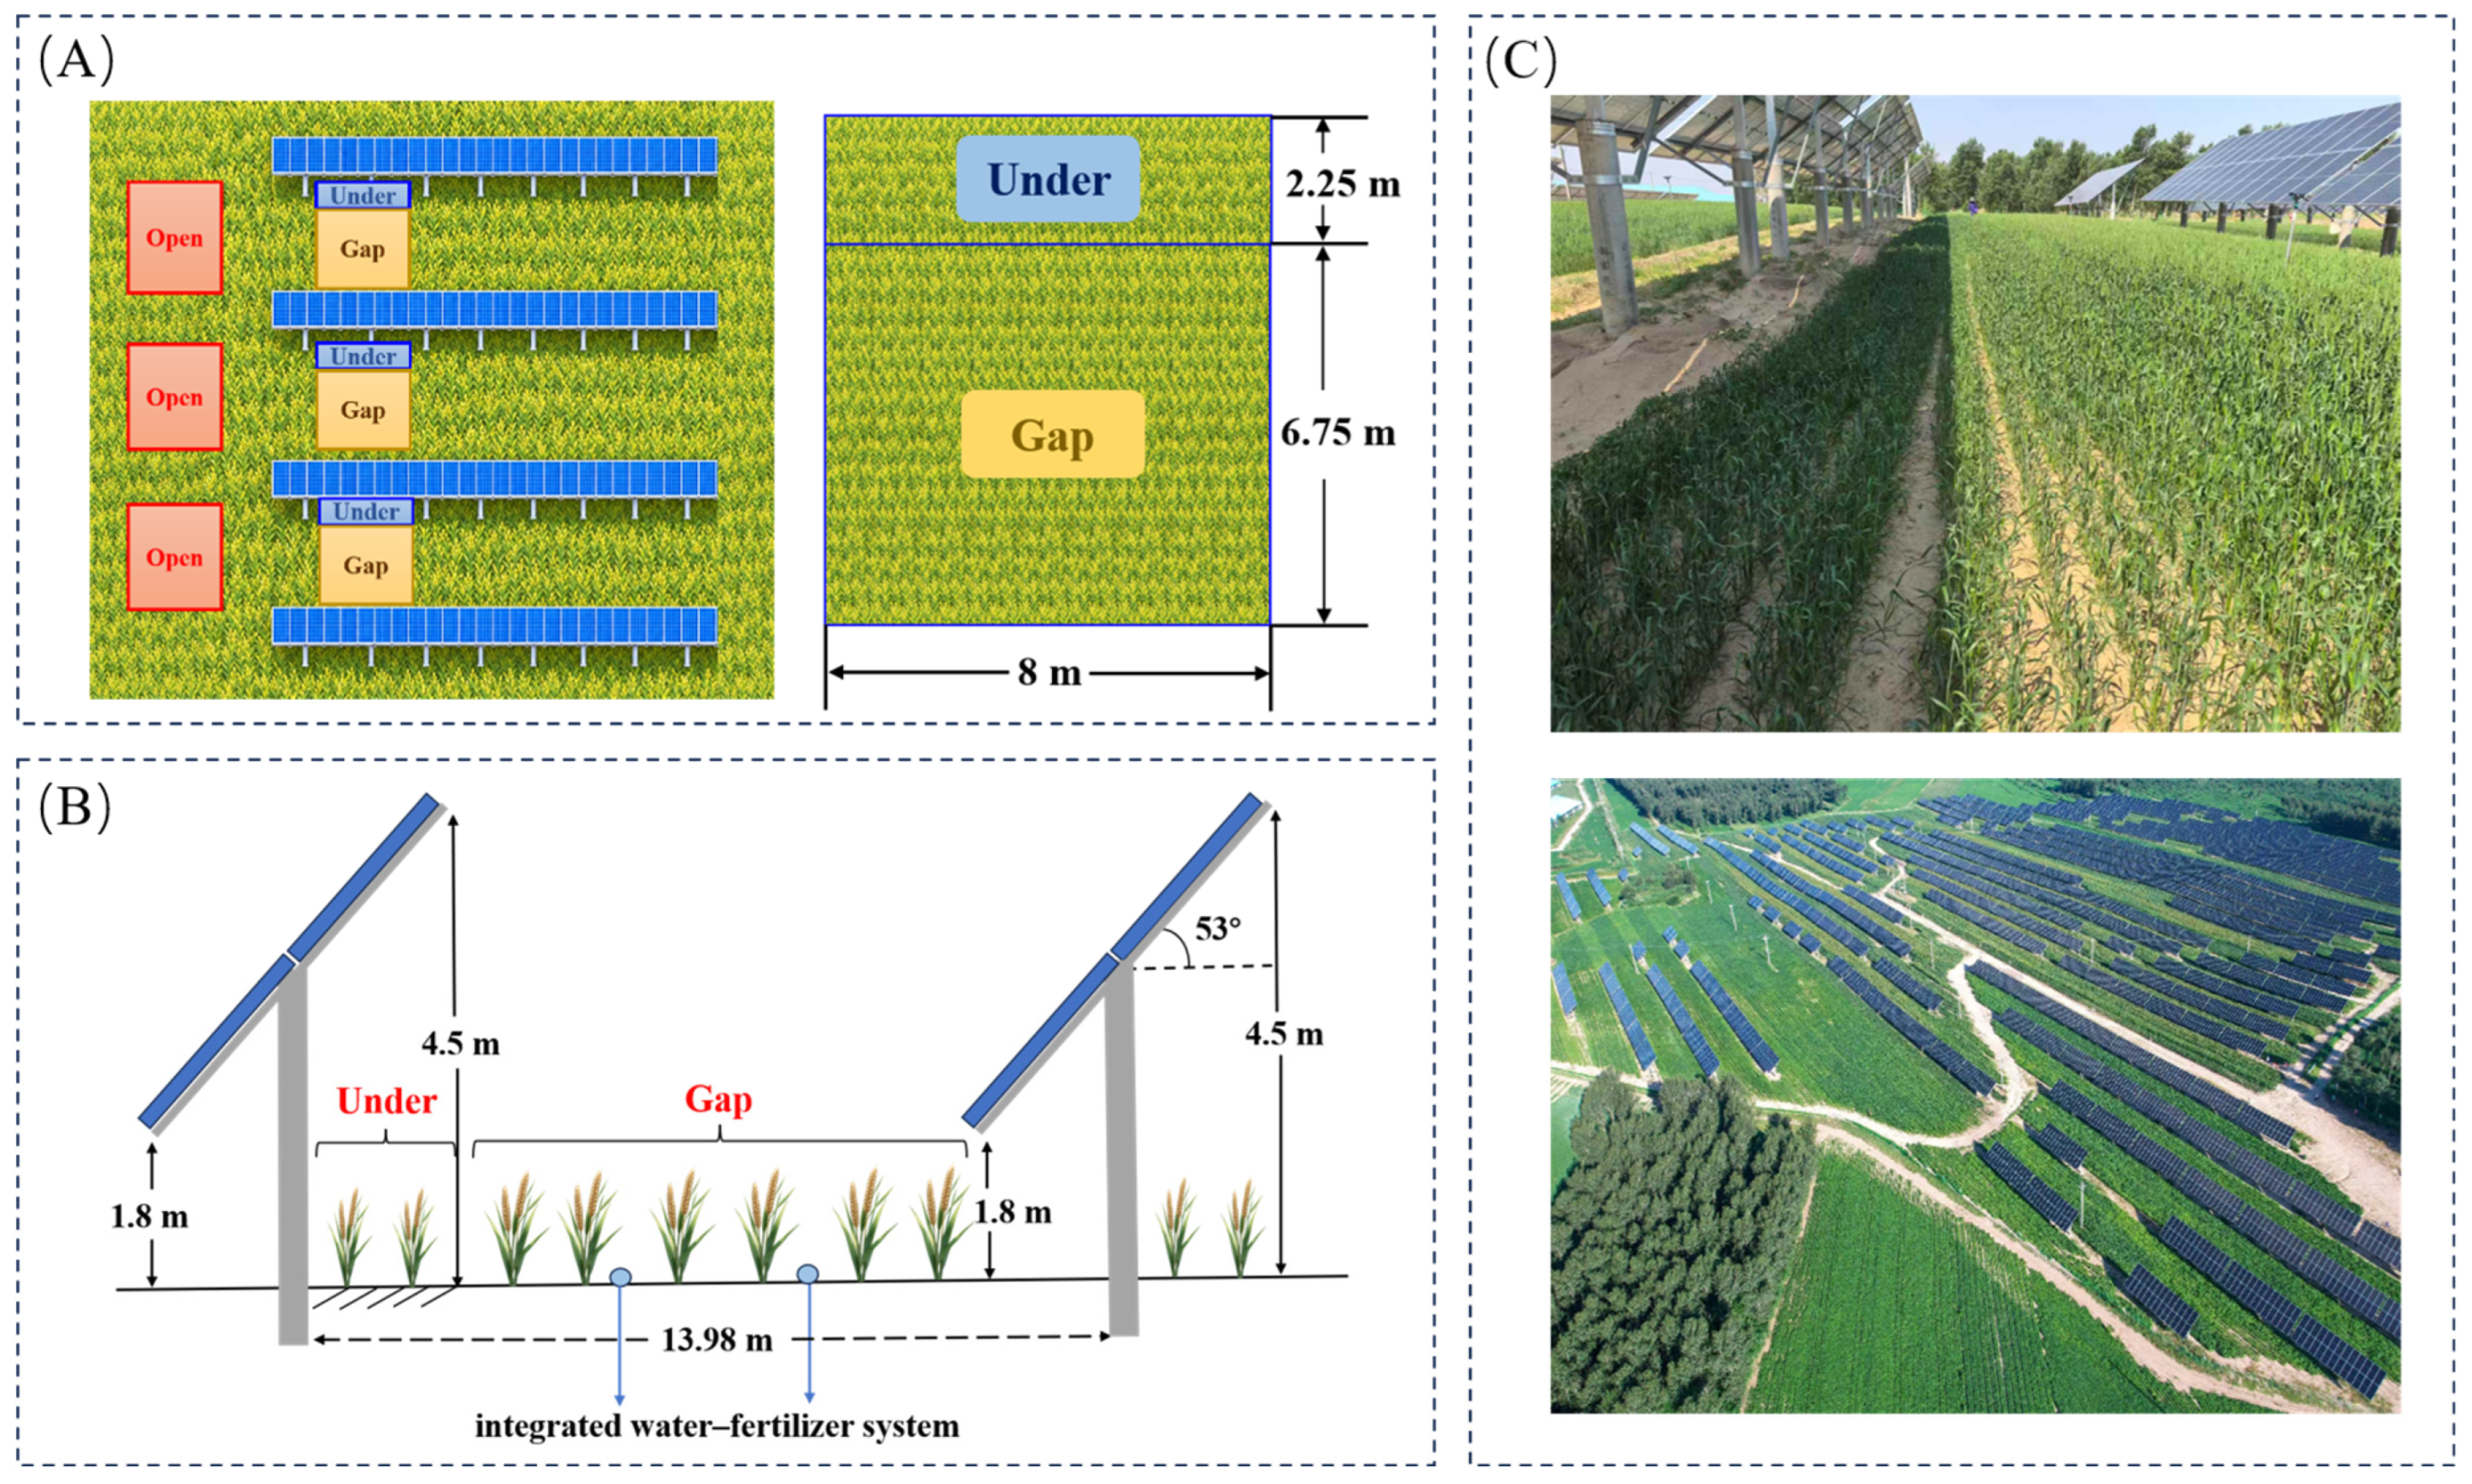
The experiment was designed as three treatments with three replications: (1) an open-field conventional cropping control (Open); (2) a fully shaded area beneath photovoltaic panels in the agrivoltaic system (Under); and (3) an unshaded area between photovoltaic panels in the agrivoltaic system (Gap). The Open treatment represented a conventional open-field system without photovoltaic arrays or integrated water–fertilizer supply, typically experiencing severe water stress, wind-driven sand erosion, and nutrient depletion. In contrast, the Gap and Under treatments were located within the agrivoltaic system, which was equipped with integrated irrigation and fertilization facilities. Each plot was 72 m2 (9 m by 8 m). The Open plots were outside the PV array, on the eastern side of the PV field. Specifically, three Open control plots were placed approximately 10 m away from the nearest photovoltaic panels. This distance was selected to ensure that the Open plots were not affected by panel shading, while remaining close enough to the PV treatments to maintain comparable soil conditions and site history as much as possible. The layout of plots and photovoltaic panel arrays is shown in Figure 2. The field experiment was conducted in a fixed agrivoltaic system consisting of southward-inclined photovoltaic arrays. The photovoltaic modules were arranged along an east–west orientation with a fixed tilt angle of 53°. The panel height was 1.8 m at the lower edge and 4.5 m at the upper edge, and the distance between adjacent panels was 13.98 m. Each photovoltaic module had a rated power output of 540 Wp, and 26 modules were connected to form one array string. The modules were installed in a double-row configuration, with a horizontal projected length of 14.7 m and a width of 3.5 m for each double-row array.
Figure 2.
Schematic diagram of plot layout and photovoltaic panels: (A) the Under and Gap treatments accounted for 25% and 75% of the total plot area, and the Open plots were outside the photovoltaic panel array, approximately 10 m away from the nearest PV panels; (B) photovoltaic panels in the agrivoltaic system; (C) an integrated system combining agrivoltaics and integrated water–fertilizer management in Zhangwu County, China.
Spring wheat (cultivar Liaochun 18) was sown on 6 March 2024 and 8 March 2025 and harvested on 9 July 2024 and 11 July 2025. The planting density was 5,700,000 plants ha−1 in both years. Basal fertilizer was applied uniformly to all the treatments at sowing, with 600 kg ha−1 of compound inorganic fertilizer (N:P2O5:K2O = 16:16:16) and 4500 kg ha−1 of organic fertilizer. In the agrivoltaics system (Under and Gap), subsurface drip irrigation was used to apply topdressing at the jointing and booting stages; micro-sprinkler irrigation was applied five times to supplement soil water, delivering a total irrigation amount of 450–600 m3 ha−1 depending on soil moisture conditions. The topdressing fertilizer consisted of an amino acid water-soluble fertilizer (active amino acid ≥ 100 g L−1; 12 m3 ha−1) mixed with N, P, and K soluble fertilizers (N:P2O5:K2O = 28:12:10; 225 m3 ha−1). Foliar fertilizer, a microbial water-soluble preparation (Nanjing Agricultural University, China), was sprayed once during the grain-filling period. The Open treatment was rain-fed and received no irrigation or topdressing. However, all other field operations, including basal fertilization, sowing, foliar fertilization, unmanned aerial vehicle (UAV)-assisted weeding, and pest and disease control, were consistent across all three treatments.
2.3. Measurement of Photosynthetically Active Radiation (PAR) and Photosynthesis
Photosynthetically active radiation (PAR) above the wheat canopy was determined between 09:30 and 11:30 am on clear days during the heading stage in 2024 and 2025. Measurements were performed using an AccuPAR LP-80 ceptometer (Decagon Devices, Pullman, WA, USA), following the method described by [28]. To clarify the spatial arrangement of measurements, the sampling ridges were selected separately within the Under and Gap areas. The Under area contained 15 ridges, and PAR measurements were conducted on the 4th, 8th, and 12th ridges. The Gap area consisted of 45 ridges, and PAR measurements were conducted on the 9th, 18th, 27th, and 36th ridges. On each selected ridge, PAR was recorded at five representative positions, with three replicates for each measurement to ensure accuracy.
The photosynthetic parameters of wheat, including net photosynthetic rate (Pn), stomatal conductance (Gs), intercellular CO2 concentration (Ci), and transpiration rate (Tr), were determined using an LI-6400 portable photosynthesis system (LI-COR Biosciences, Lincoln, NE, USA). Measurements were conducted on clear days at the heading stage between 09:30 and 11:30 in both years. Gas-exchange measurements were conducted at the same corresponding ridge positions as the PAR measurements to ensure spatial consistency between the light environment and photosynthetic measurements. On each selected ridge, the uppermost fully expanded leaves, namely flag leaves, of five representative plants were selected for measurement. To accurately reflect actual field environments created by the photovoltaic panels, the chamber conditions (i.e., reference CO2 concentration, air temperature, and relative humidity) were set to track ambient conditions rather than being artificially standardized. This approach was adopted to evaluate in situ photosynthetic performance under actual field conditions. Specifically, measurements reflected the natural light environment in the Open plots and the microenvironmental conditions in the Under and Gap plots rather than photosynthetic capacity under a standardized light environment. The airflow rate was maintained constant based on the manufacturer’s operating protocol to ensure stable gas–exchange readings. All measurements were taken under clear skies within a fixed time interval to reduce diurnal effects and maintain comparability across treatments.
2.4. Measurement of Soil Water and Nutrient Contents
Soil was sampled from the 0–20 cm cultivated layer per plot using a soil auger each week during the growing season, with five replicates per plot. Soil water content was measured gravimetrically after oven-drying samples at 105 °C until constant mass.
At harvest, five subsamples from the 0–20 cm soil layer were taken per plot and mixed to form one composite sample. The composite samples were air-dried and passed through a 2 mm sieve. Soil pH was determined in a 1:5 (v/v) soil-to-0.01 M CaCl2 suspension using a pH electrode after 1 h of shaking. Soil organic carbon (SOC) was quantified by a TOC analyzer (Elementarvario TOC cube, Langenselbold, Germany). Total nitrogen (TN) was analyzed via the Kjeldahl method. Total phosphorus (TP) was determined using the molybdenum-antimony colorimetric method, and total potassium (TK) was measured by a flame atomic absorption spectrophotometer (240AA, Agilent, Santa Clara, CA, USA). Alkali-hydrolyzable nitrogen (AN) was determined using the alkaline hydrolysis diffusion method. Available phosphorus (AP) was extracted with 0.5 M NaHCO3 and measured by the molybdenum-antimony colorimetric method, whereas available potassium (AK) was extracted with neutral 1 M NH4OAc and determined by flame photometry. Soil samples were analyzed following the procedures described by Bao [29].
2.5. Measurement of Root Characteristics and Plant Height
Root samples were collected at the heading stage using the monolith method, following Huang et al. [28]. Four root monoliths were excavated from each plot. In the laboratory, roots were carefully washed with tap water, and attached soil particles were brushed away. Cleaned roots were digitized with a root scanner (LAD2400, Sintek, Shanghai, China), followed by image analysis using WinRHIZO v2.0 software (Sintek) to determine total root length, average diameter, surface area, and number of root tips.
Plant height was measured at 14-day intervals starting 45 days after sowing until harvest in both years. In each plot, five plants were randomly chosen, and their height was recorded as the distance from the soil surface to the tip of the highest fully expanded leaf.
2.6. Measurement of Aboveground Biomass and Grain-Filling Dynamics
In both years, aboveground wheat samples were collected weekly starting 83 days after sowing (booting stage) until maturity. Thirty aboveground plant samples were randomly selected per plot at each sampling date. The samples were oven-dried at 105 °C for 1 h and then further dried at 75 °C for 72 h to a constant weight before weighing. To determine the grain-filling dynamics, grains were separated from the wheat spikelets, weighed, and converted to thousand-grain weight. Dynamic recording of thousand-grain weight began at 97 days after sowing (corresponding to 14 days after anthesis).
2.7. Measurement of Yield and Yield Components
To determine final grain yield, three subsampling areas (4 m2 each) were randomly selected per plot, and all plants were manually harvested at maturity. Grain samples were sun-dried to a moisture content of 14% before being weighed. For yield components, 60 plants were randomly selected per plot to determine effective spike number, grains per spike, and 1000-grian weight.
2.8. Calculations
Instantaneous leaf water use efficiency (WUE) was estimated as net photosynthetic rate (Pn) divided by transpiration rate (Tr). The equation was as follows:
instantaneous leaf WUE = Pn/Tr
The grain-filling rate of wheat was calculated as the increase in 1000-grain weight per day. The equation was as follows:
where and represent 1000-grain weight at t1 and t2 days after anthesis, respectively.
Considering the land area occupied by photovoltaic infrastructure and the spatial proportions of the Gap and Under areas, wheat yield in the agrivoltaic system was calculated as the weighted average yield of the cultivated area. In practical production, photovoltaic infrastructure occupied 20% of the land area, whereas the remaining 80% was used for crop cultivation. Within the cultivated area, the Gap and Under areas accounted for 75% and 25%, respectively. Therefore, the actual grain yield of wheat in the agrivoltaic system was calculated as follows:
where Grain yieldAPV represents the actual wheat grain yield in the agrivoltaic system, and YGap and YGap represent the wheat grain yield in the Gap and Under areas, respectively.
Grain yieldAPV = (0.75)×YGap + (0.25 × YUnder) × 0.8
2.9. Statistical Analysis
Normality was evaluated using the Shapiro–Wilk test before analysis of variance. A two-way ANOVA was performed to test the effects of year, treatment, and their interaction on PAR above the wheat canopy, photosynthesis parameters (Pn, Gs, Ci, and Tr), instantaneous leaf WUE, soil nutrients, root morphological traits, grain yield, and yield components. The p-values from the two-way ANOVA are presented in Table 1. For variables without a significant year × treatment interaction effect, only the main effects were compared. When significant interaction effects were observed, treatment comparisons were performed separately for each year. When ANOVA indicated significant treatment effects, means were compared using Tukey’s honestly significant difference (HSD) test at p < 0.05. All statistical analyses were conducted with SPSS 25.0 software (IBM Corp., Armonk, NY, USA).
Table 1.
Analysis of variance for the effects of treatment (T), year (Y), and their interactions on photosynthesis, soil nutrients, and root morphological traits of wheat.
3. Results
3.1. Photosynthetically Active Radiation (PAR) and Photosynthetic Parameters
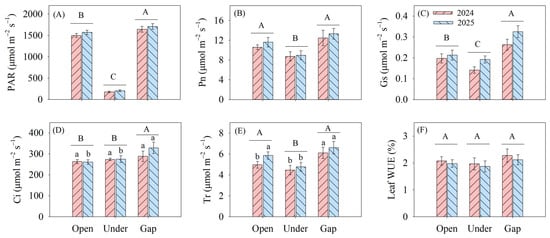
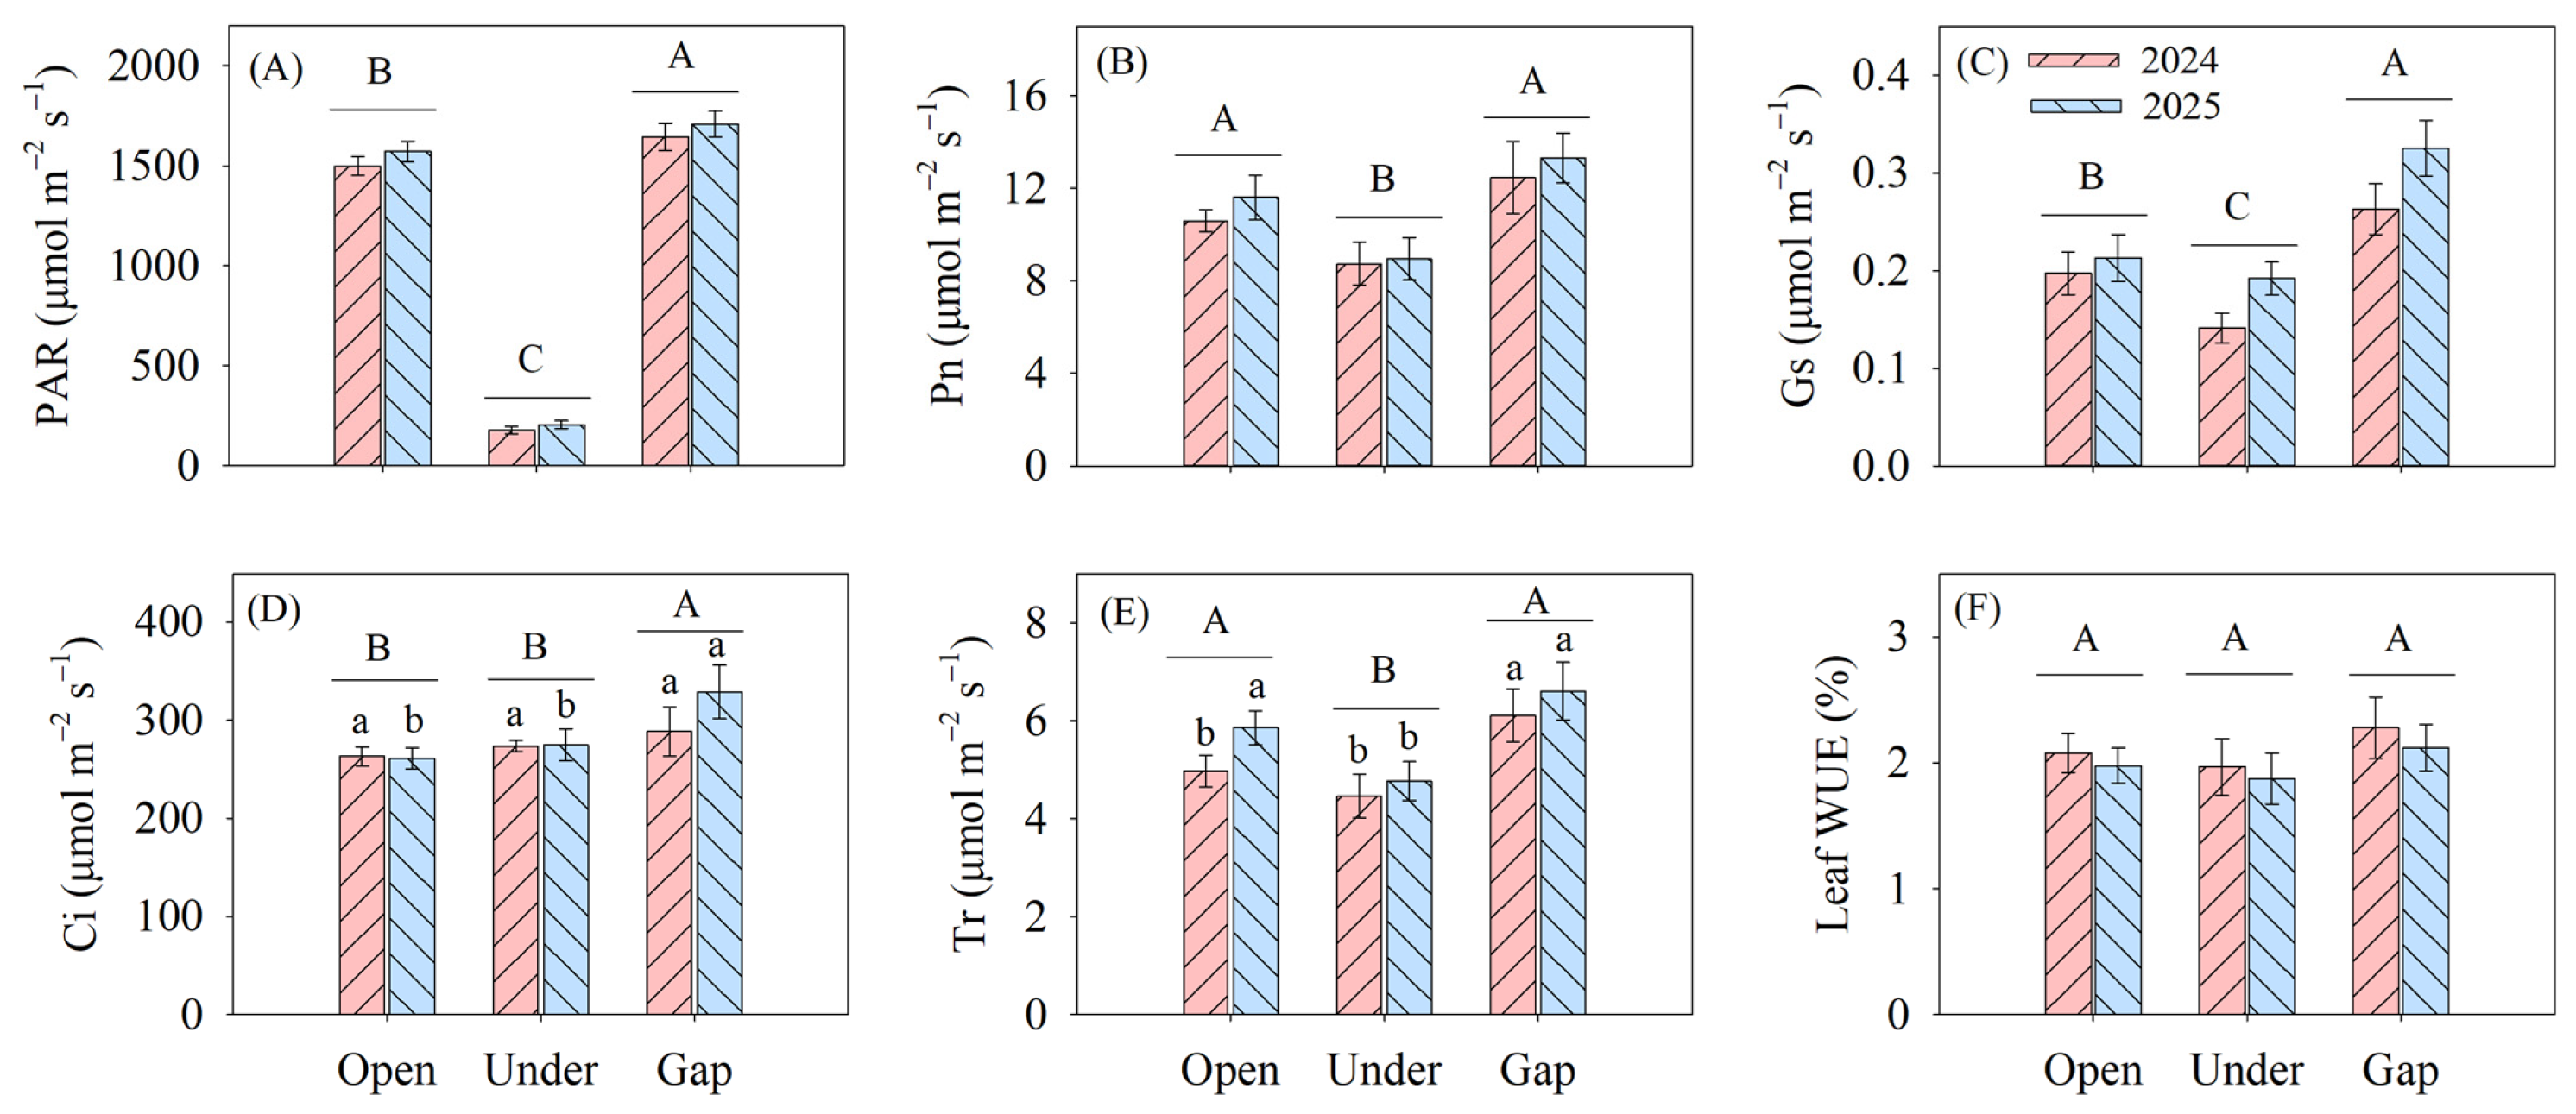
The PAR and photosynthetic parameters presented in this study represent instantaneous measurements. The main effects of treatment had a significant effect on PAR above the wheat canopy and photosynthetic parameters (Table 1). Specifically, averaged across the heading stage of 2024 and 2025, the PAR in the Gap plot was 9.27% higher than that in the Open plot, while the PAR in the shaded Under plot was 87.5% lower than that in the Open plot (Figure 3). Meanwhile, the Pn, Gs, Ci, and Tᵣ of wheat in the Gap plot showed an increasing trend relative to the Open treatment, with a significant increase in Gs and Ci by 42.9% and 17.8%, respectively. The Pn, Gs, and Tr of wheat in the Under plot were 20.2%, 19.2%, and 14.5% lower than those in the Open plot; however, the Ci did not differ between the Under and the Open plots. The instantaneous leaf WUE did not differ among the treatments.
Figure 3.
Photosynthetically active radiation (PAR) (A) above the canopy; net photosynthesis rate (Pn) (B); stomatal conductance (Gs) (C); intercellular CO2 concentration (Ci) (D); transpiration rate (Tr) (E); instantaneous leaf water-use efficiency (WUE) (F) of wheat with conventional open-field cultivation and agrivoltaic system in 2024 and 2025. Open, conventional open-field cultivation without photovoltaic arrays or water–fertilizer integration; Under, the shaded area beneath photovoltaic panels; Gap, the unshaded area between photovoltaic panels. Bars represent the standard error. Uppercase letters denote significant main effects among all the treatments (p < 0.05), and lowercase letters denote significant differences among different treatments within the same year (p < 0.05).
3.2. Soil Water and Nutrient Content
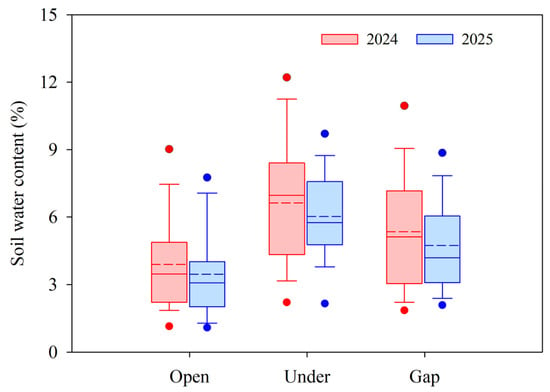
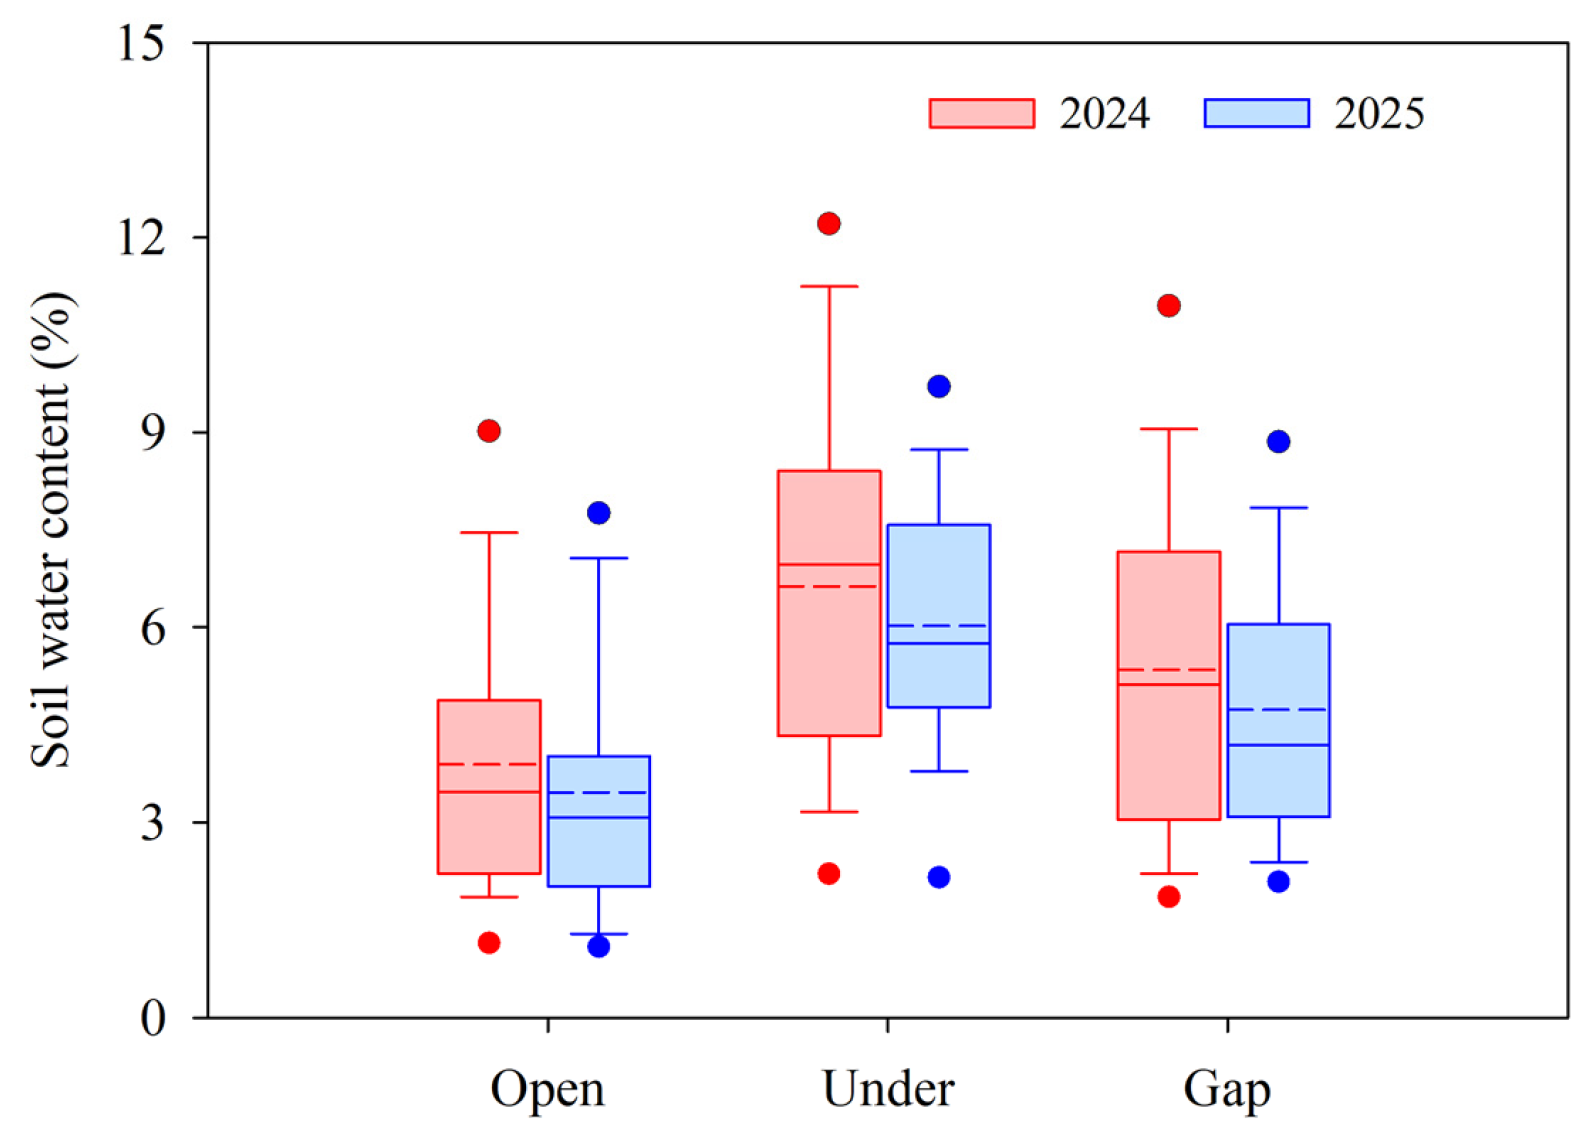
A relatively high soil water content with the agrivoltaic system was observed, with the highest content in the shaded Under plot (6.33%), followed by the Gap plot (4.85%) and the lowest in the Open treatment (3.51%) throughout the whole growth period of the two years (Figure 4). Averaged through the entire growing season in 2024, the soil water content was 4.97% in the Gap plot and 6.63% in the Under plot, respectively, which were 27.7% and 70.3% greater than the 3.89% of the Open plot. Similarly, in 2025, on average, a 51.8% and 93.3% increase in soil water content was observed in the Gap and Under plots compared to the control in the Open plot.
Figure 4.
Soil moisture in wheat fields with conventional open-field cultivation and agrivoltaic systems during the growth season of 2024 and 2025. Open, local conventional open-field cultivation without photovoltaic arrays or water–fertilizer integration; Under, the shaded area beneath photovoltaic panels; Gap, the unshaded area between photovoltaic panels. In each boxplot, solid and dashed lines indicate median and mean values, respectively. Upper and lower edges of the box represent the 75th and 25th percentiles, respectively. Whiskers indicate the 95th and 5th percentiles, and values above the 99.5th or below the 0.5th percentile are shown as individual outliers.
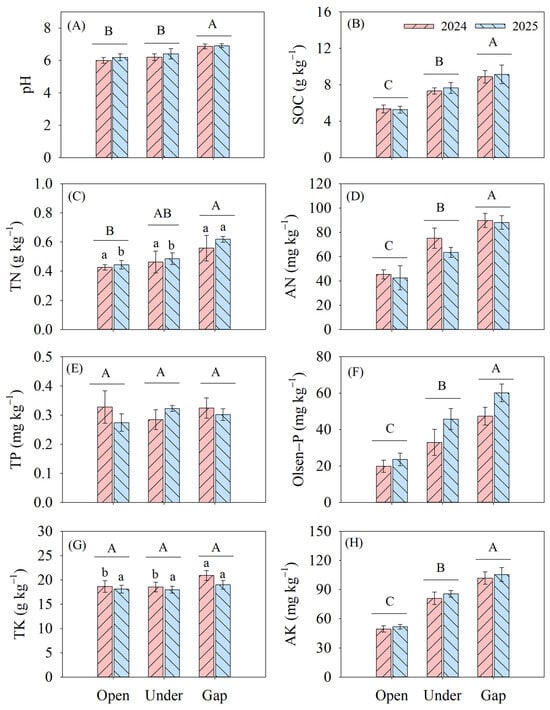
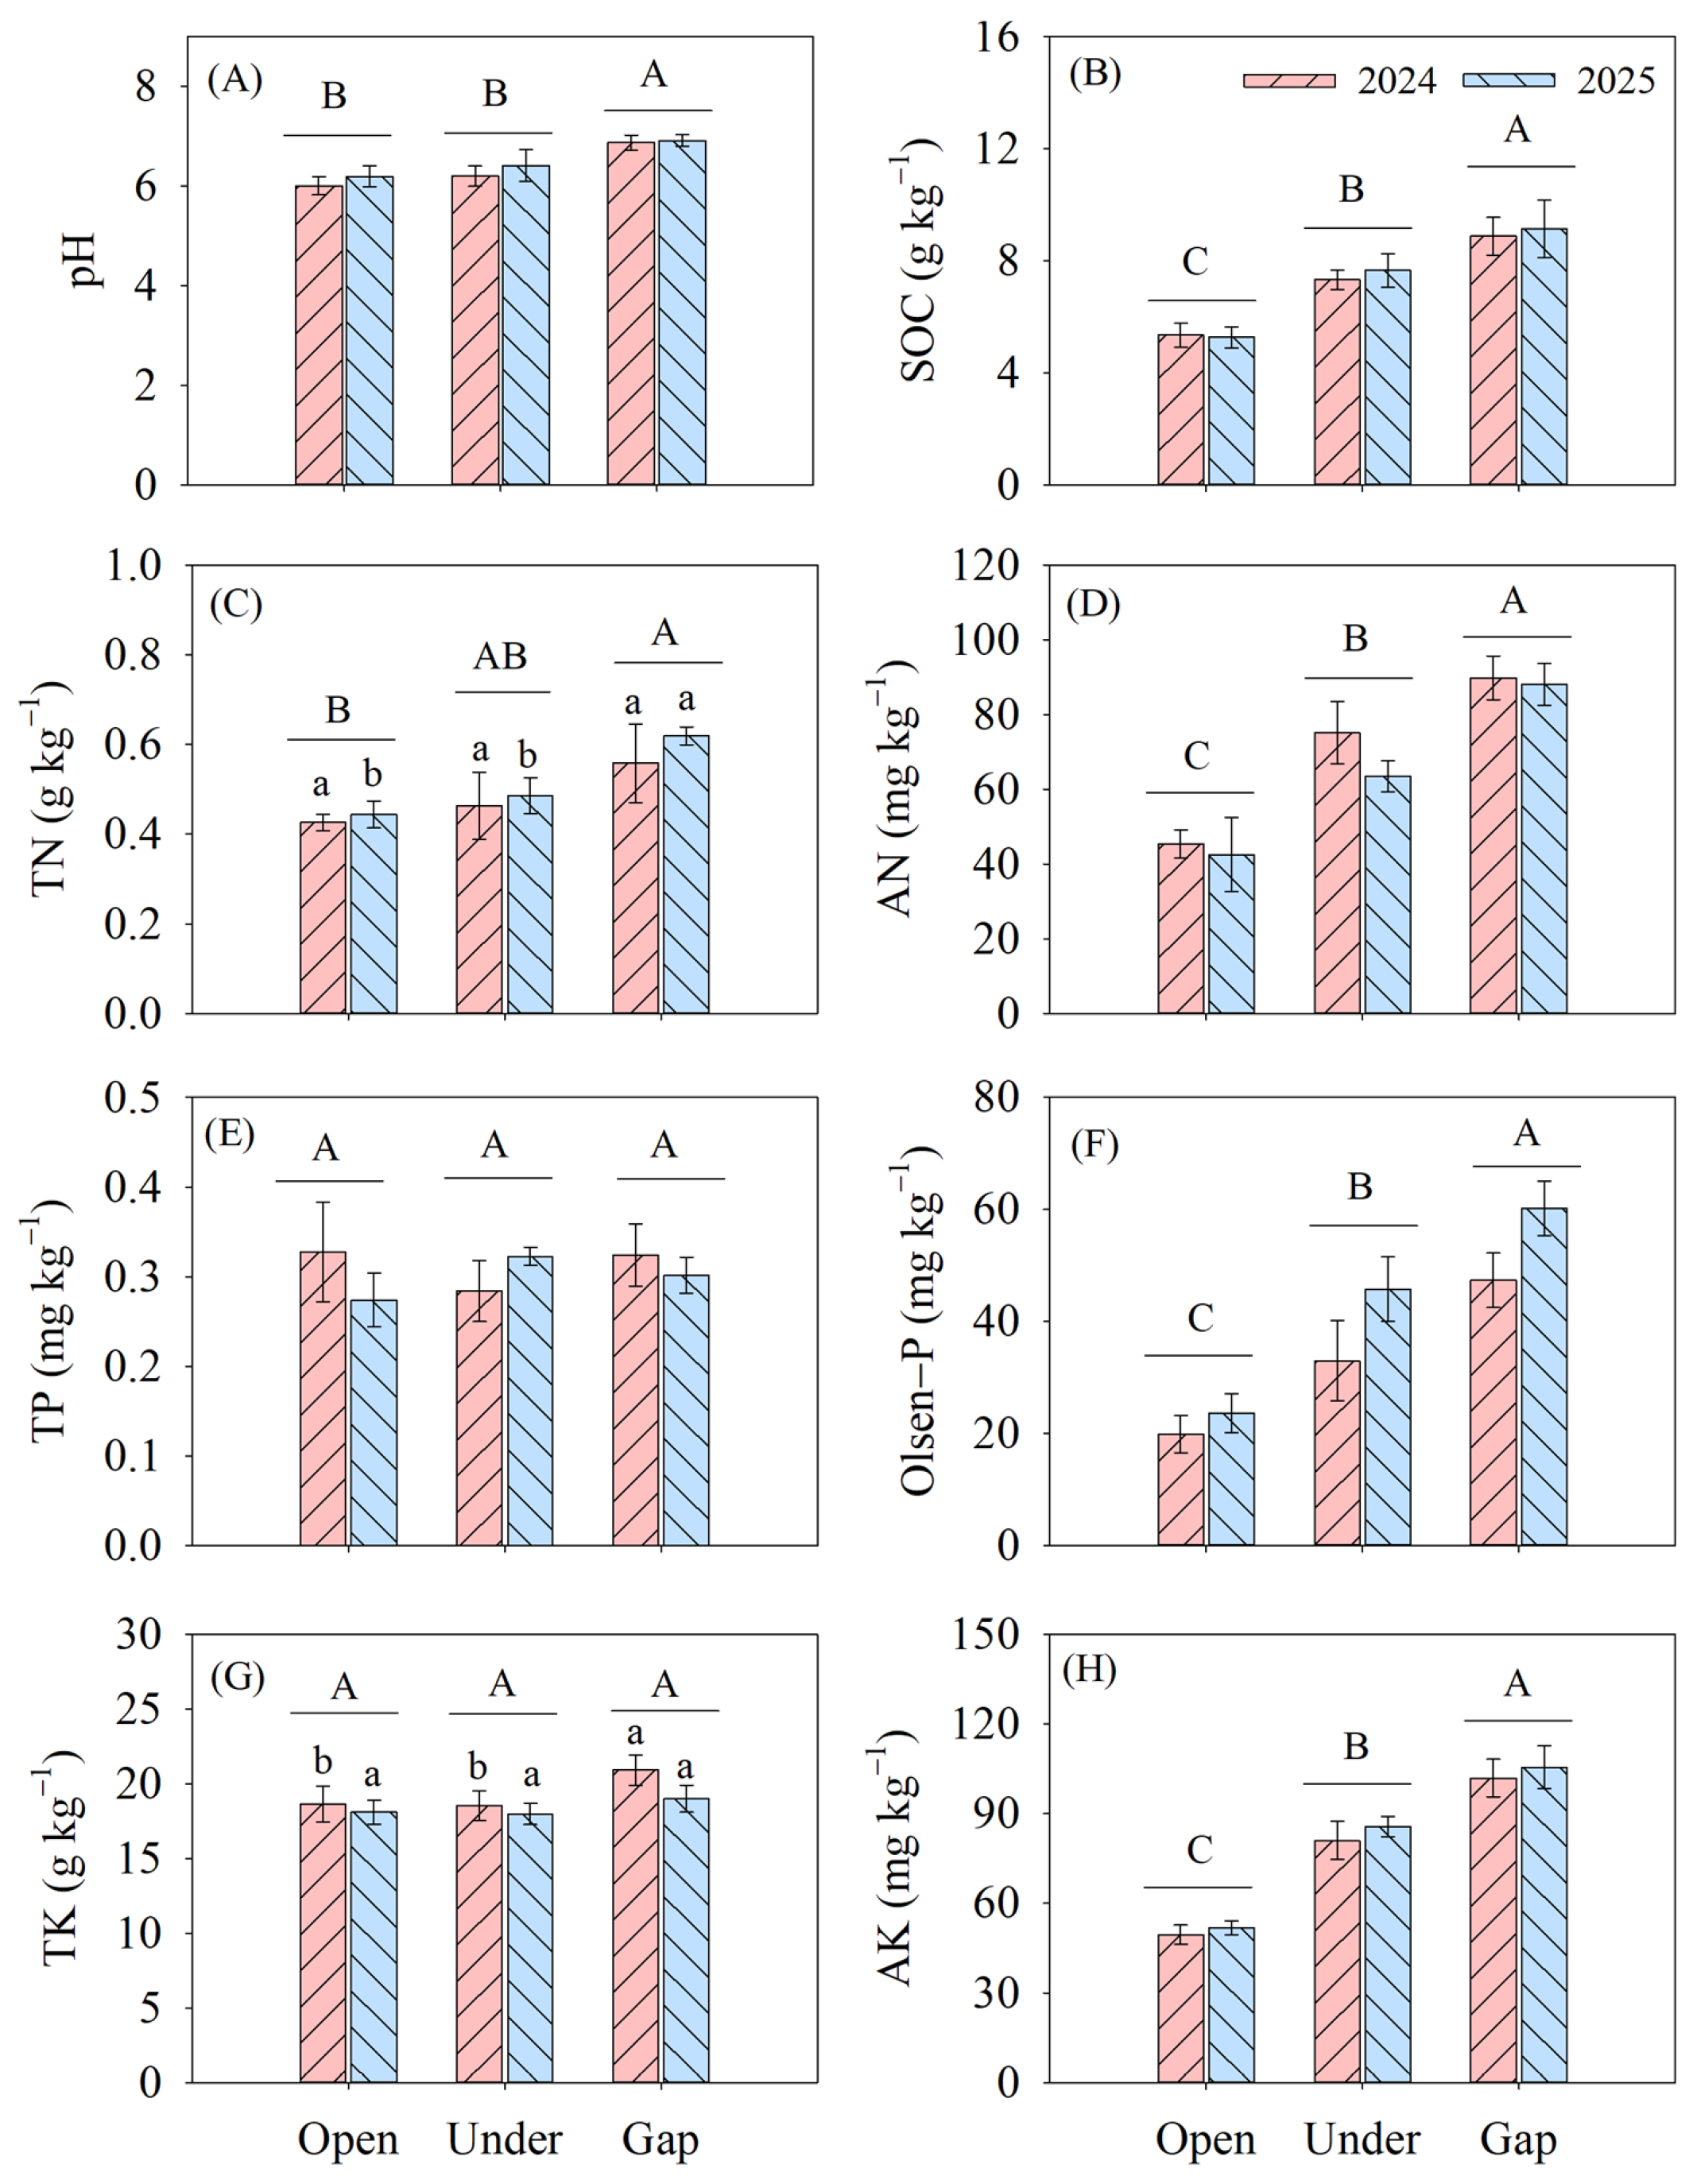
A more favorable soil nutrient environment was observed in the agrivoltaic system (Figure 5). The highest soil total nitrogen was observed in the Gap plot, while soil total phosphorus and potassium did not differ among the treatments. In comparison, soil organic matter and available nutrients were significantly increased in the photovoltaic arrays. Compared with the Open treatment, the contents of soil organic matter, available nitrogen, phosphorus and potassium were increased by 69.8%, 1.03-fold, 1.47-fold, and 1.05-fold in the Gap treatment, respectively, and by 41.2%, 57.5%, 79.9%, and 64.4% in the Under treatment.
Figure 5.
Soil pH (A), organic carbon (B), and nutrients, including (C) total nitrogen, (D) available nitrogen, (E) total phosphorus, (F) Olsen-P, (G) total potassium, and (H) available potassium, in wheat fields with conventional open-field cultivation and agrivoltaic systems in 2024 and 2025. Open, local conventional open-field cultivation without photovoltaic arrays or water–fertilizer integration; Under, the shaded area beneath photovoltaic panels; Gap, the unshaded area between photovoltaic panels. Bars represent the standard error. Uppercase letters denote significant main effects among all the treatments (p < 0.05), and lowercase letters denote significant differences among different treatments within the same year (p < 0.05).
3.3. Root Morphology
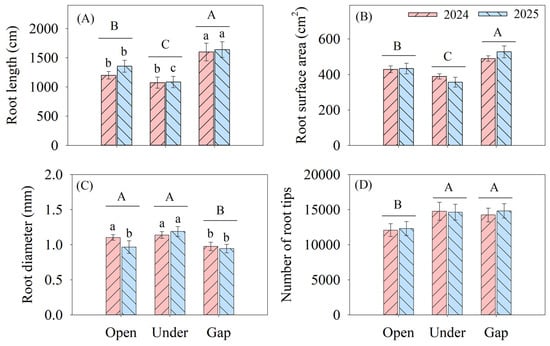
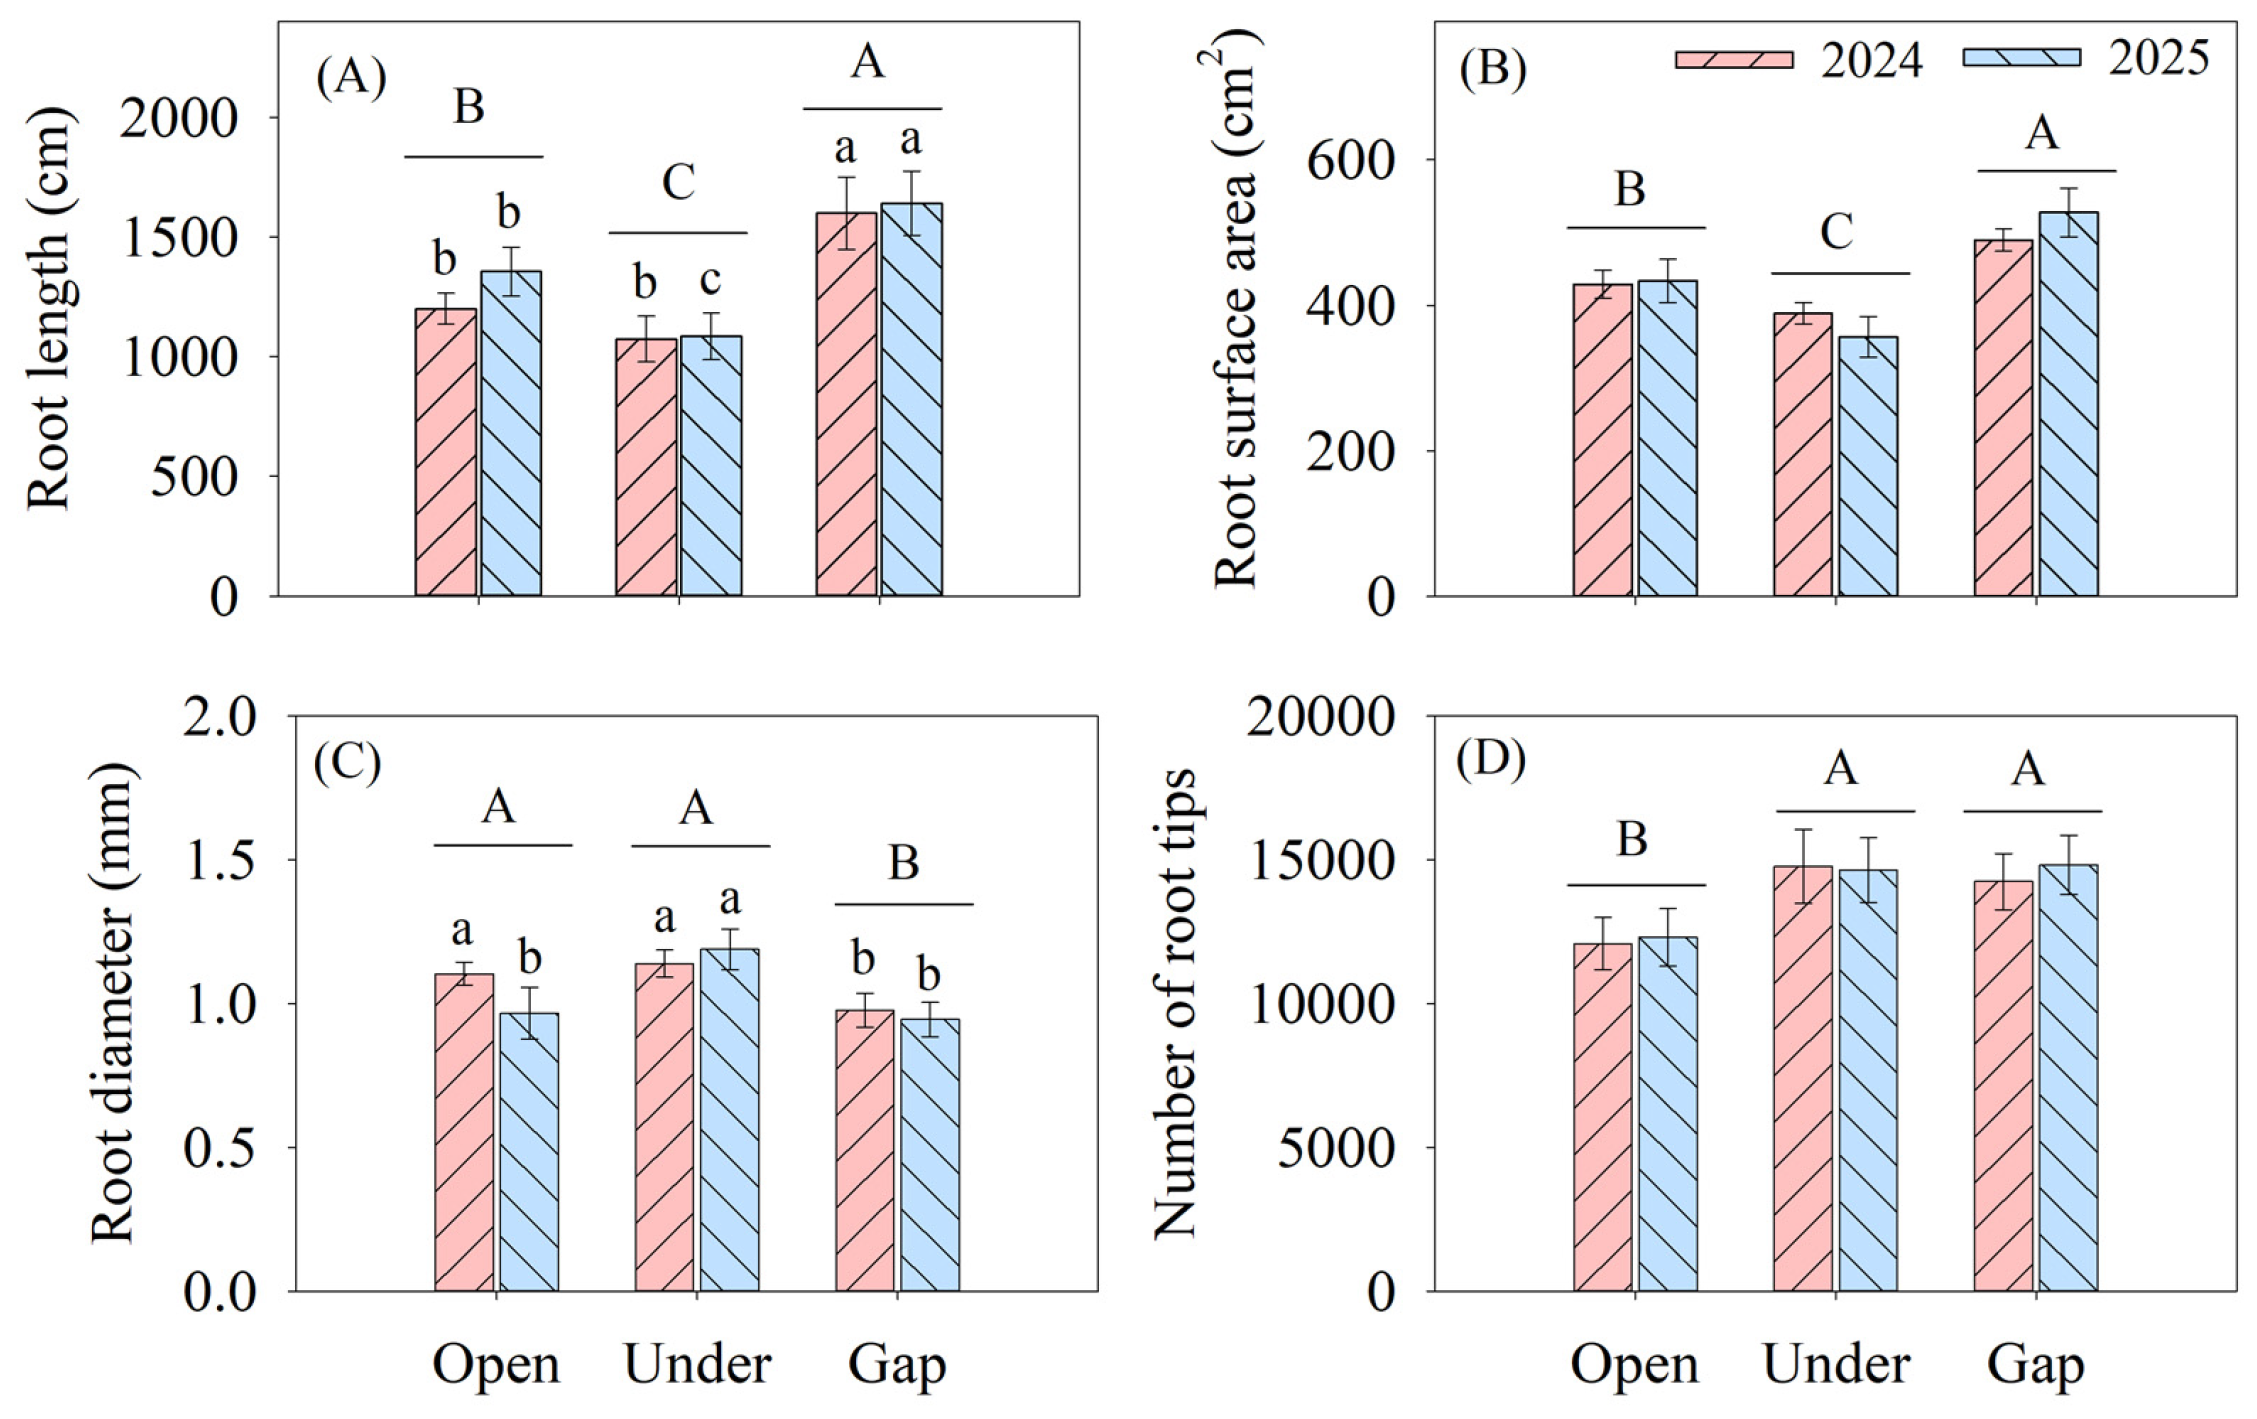
With the agrivoltaic system, the wheat root growth was significantly enhanced in the Gap treatment but was inhibited in the Under treatment at the heading stage (Figure 6). Compared with the Open treatment, an average 27.0% and 17.9% increase occurred in the root length and surface area of wheat grown in the Gap plot between photovoltaic panel arrays, while an average 15.3% and 13.5% reduction occurred in the Under plot beneath photovoltaic panels. Conversely, the root diameter became thinner in the Gap plot but showed an increasing trend in the Under plot. The root diameter was 7.20% lower in the Gap plot than in the Open plot. Despite thinner root diameters, more root tips were observed in the Gap treatment, 20.7% greater than in the Open treatment. Also, 19.2% more root tips were reported in the Under treatment than in the Open treatment.
Figure 6.
Root length (A), surface area (B), diameter (C), and number of root tips (D) of wheat at the heading stage under conventional open-field cultivation and agrivoltaic systems in 2024 and 2025. Open, local conventional open-field cultivation without photovoltaic arrays or water–fertilizer integration; Under, the shaded area beneath photovoltaic panels; Gap, the unshaded area between photovoltaic panels. Bars represent the standard error. Uppercase letters denote significant main effects among all the treatments (p < 0.05), and lowercase letters denote significant differences among different treatments within the same year (p < 0.05).
3.4. Plant Height
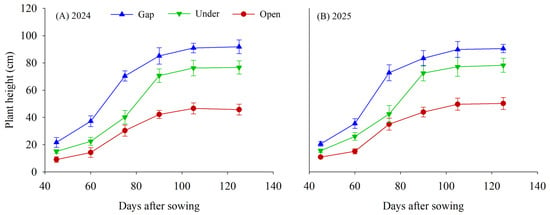
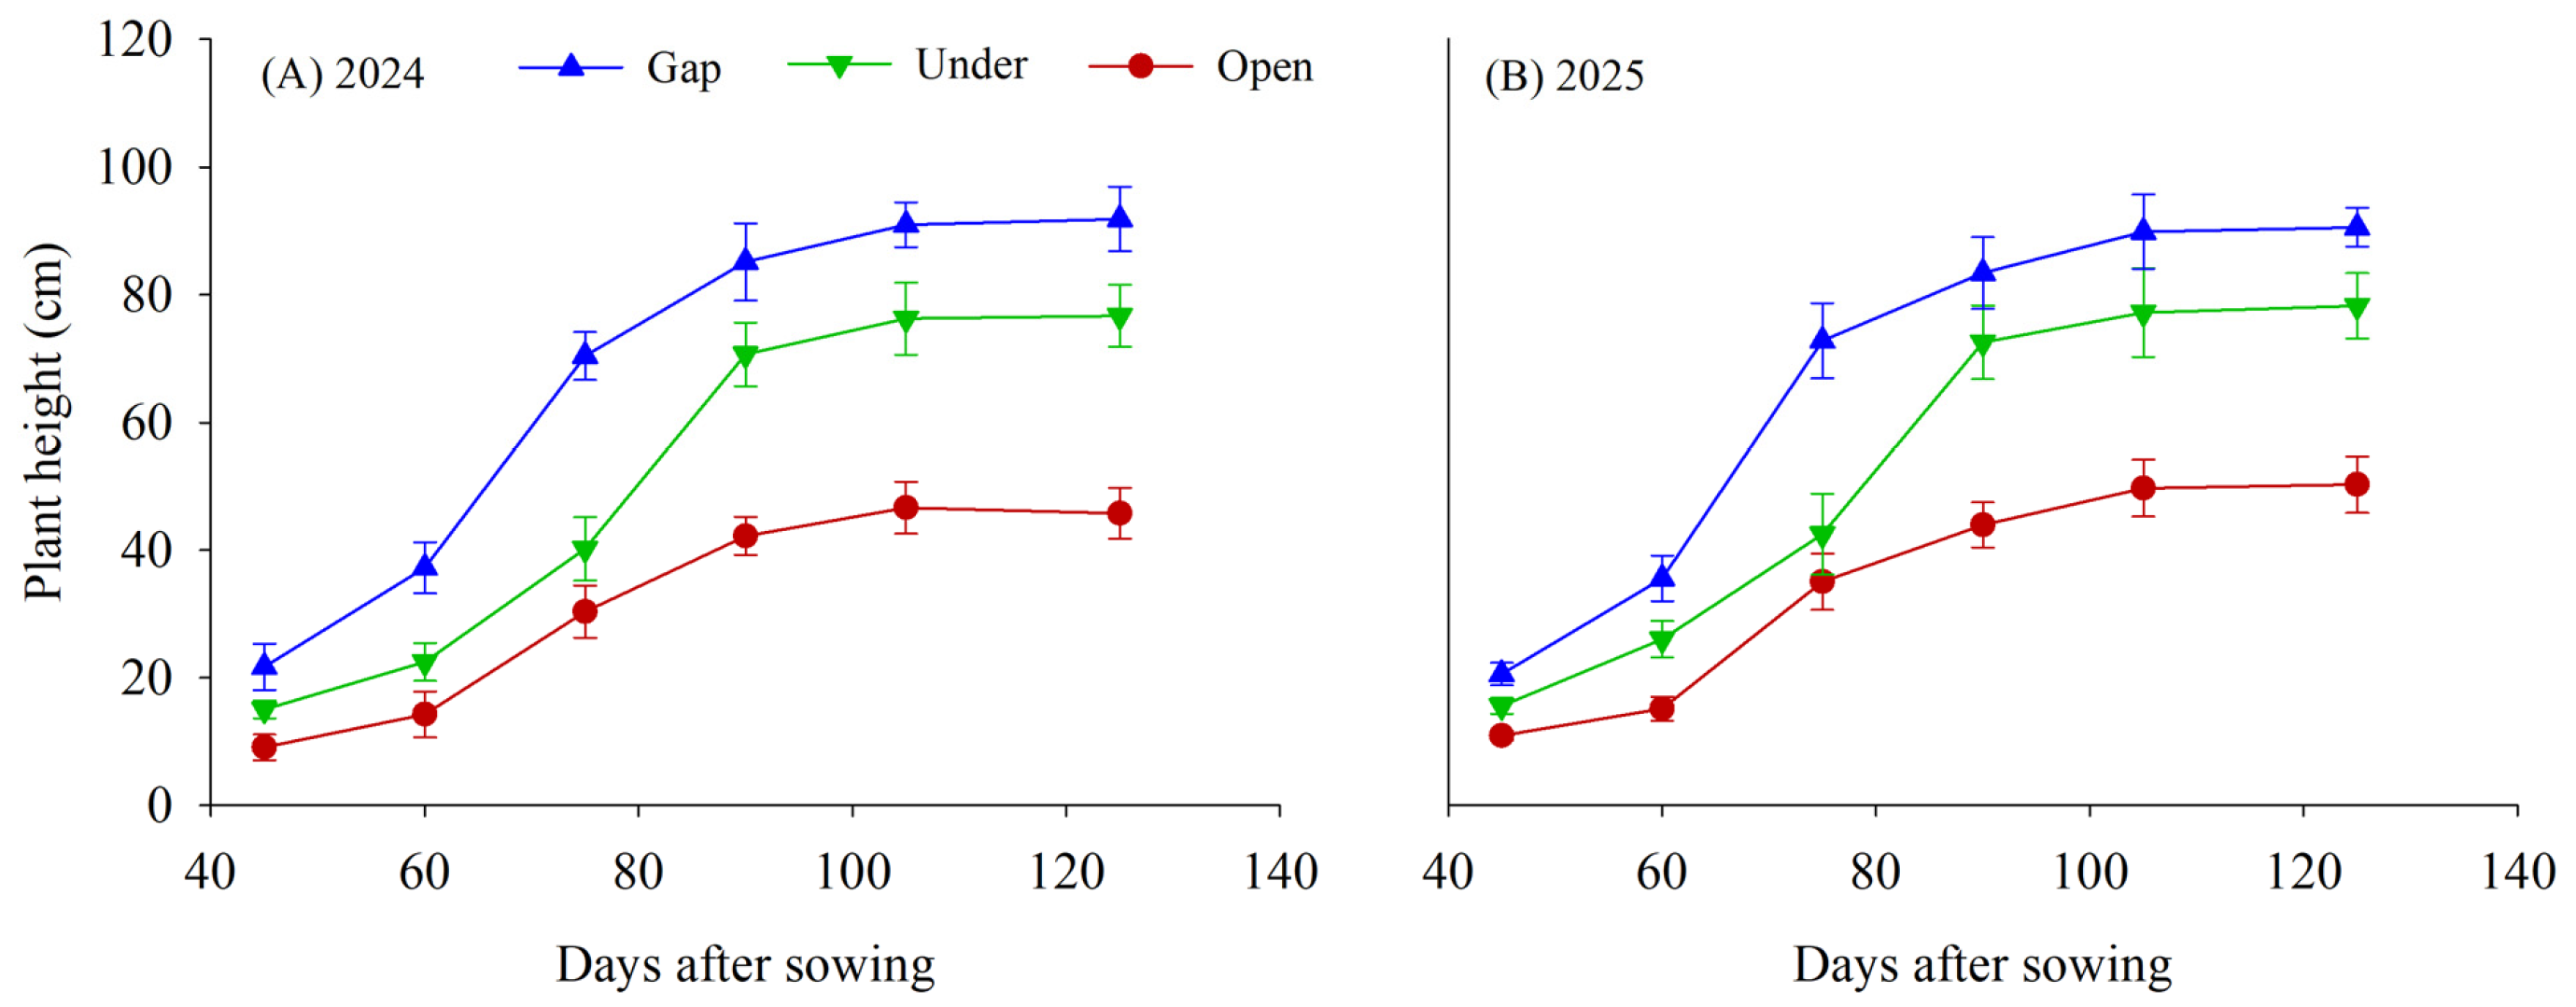
Across the growth period of the two years, the plant heights of wheat increased when grown in the photovoltaic panel arrays compared to the Open treatment (Figure 7). The heights of wheat plants exhibited a rapid rise at 60–90 days after sowing (DAS), and at this rapid growth stage, the difference in plant heights also widened between the agrivoltaic system and open-field cropping. The difference in plant heights between the Under and Open treatments was 9.55 cm at DAS 60, rapidly increasing to 28.6 cm at DAS 90 and reaching 29.5 cm at maturity; this difference was greater when grown in the Gap plot, from 20.7 cm at DAS 60 to 41.2 cm at DAS 90, and reaching 43.2 cm at maturity. The final plant heights were 91.9 cm in the Gap and 76.7 cm in the Under plots, respectively, which were 1.01-fold and 67.6% higher than the 45.8 cm of the Open plot in 2024. An increase in plant height was also observed in 2025, when wheat grew to 90.5 cm and 78.2 cm, 80.1% and 55.7% greater than 50.3 cm in the Open plot. Also, on average, 17.8% higher plant heights were reported in the Gap plot compared to the Under plot.
Figure 7.
Dynamic changes of wheat plant height under conventional open-field cultivation and agrivoltaic systems in 2024 and 2025. Open, local conventional open-field cultivation without photovoltaic arrays or water–fertilizer integration; Under, the shaded area beneath photovoltaic panels; Gap, the unshaded area between photovoltaic panels. Bars represent the standard error.
3.5. Above-Ground Biomass
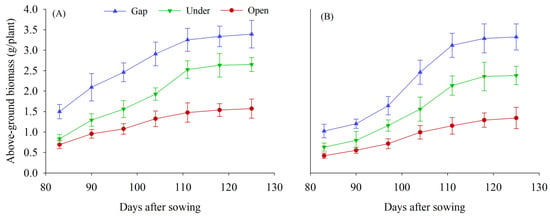
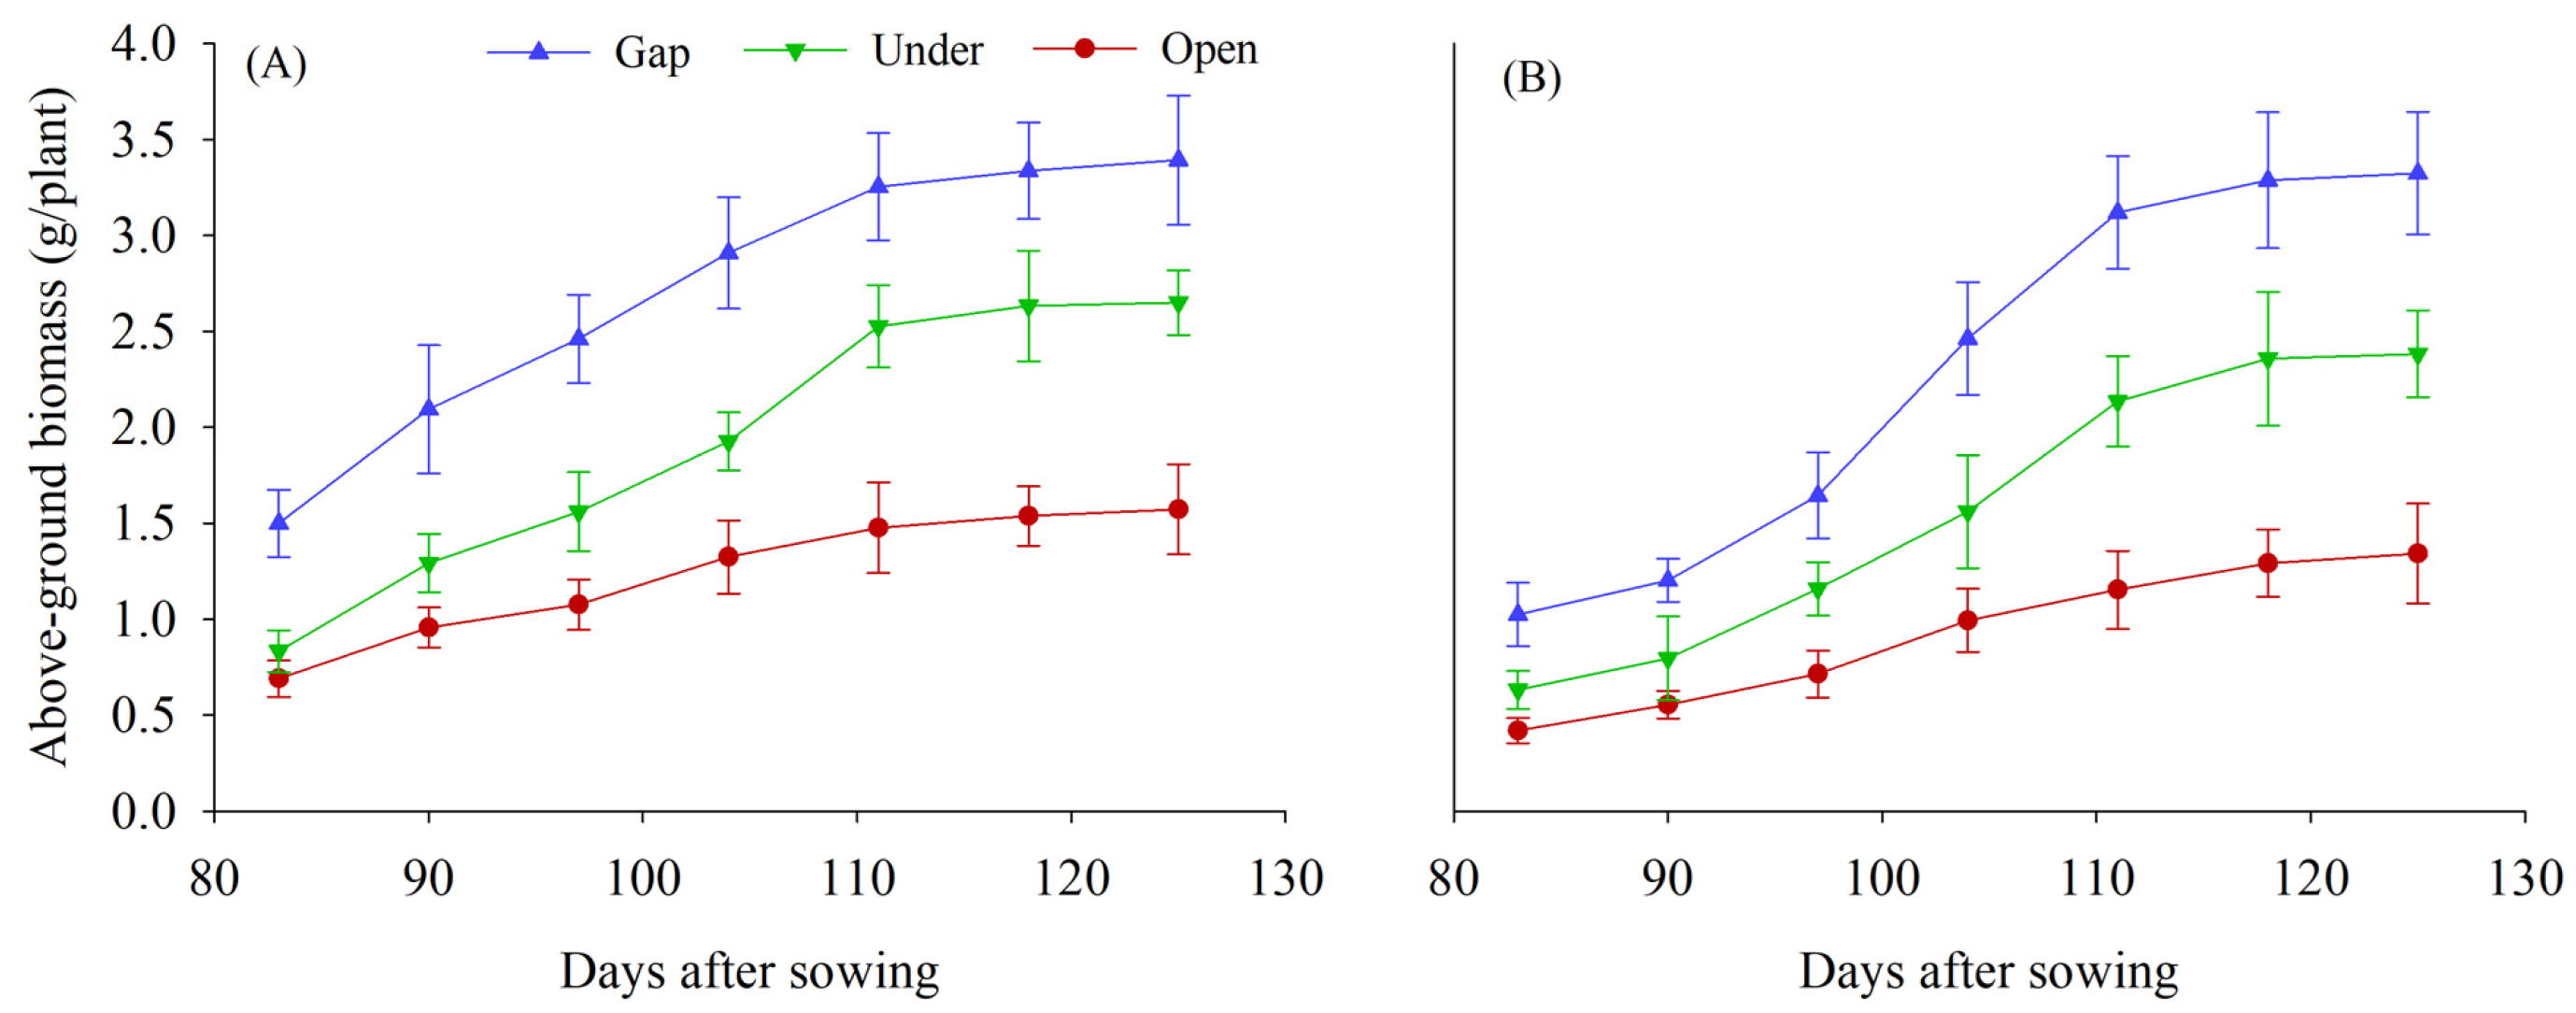
Within the photovoltaic panel arrays, the wheat above-ground biomasses in the Gap and Under plots were both increased across the anthesis and grain-filling period of the two years (Figure 8). Before the grain-filling stage, the aboveground biomass of wheat grown in the Open plot was 28.2% less than the Under plot and 54.1% lower than the Gap plot, as averaged across the two years. The biomass gap between the agrivoltaic system and open-field conventional cropping gradually widened during the grain filling, until at maturity, wheat grown in the Gap and Under treatments accumulated aboveground biomass of 3.39 g/plant and 2.65 g/plant, which were 1.16-fold and 68.5% greater than the 1.57 g/plant of the Open treatment, respectively, in 2024. Although the final aboveground biomass decreased in 2025, a greater difference was observed between these two cropping patterns, i.e., 2.91 g/plant (Gap) and 2.09 g/plant (Under)—values 1.48-fold and 77.5% greater than the Open value of 1.18 g/plant, with the increase in 2025 being on average 1.20-fold greater than 2024.
Figure 8.
Above-ground biomass of wheat under conventional open-field cultivation and agrivoltaic systems during the anthesis and grain-filling period of 2024 (A) and 2025 (B). Open, local conventional open-field cultivation without photovoltaic arrays or water–fertilizer integration; Under, the shaded area beneath photovoltaic arrays; Gap, the unshaded area between photovoltaic panels. Bars represent the standard error.
3.6. The 1000-Grain Weight During the Filling Process
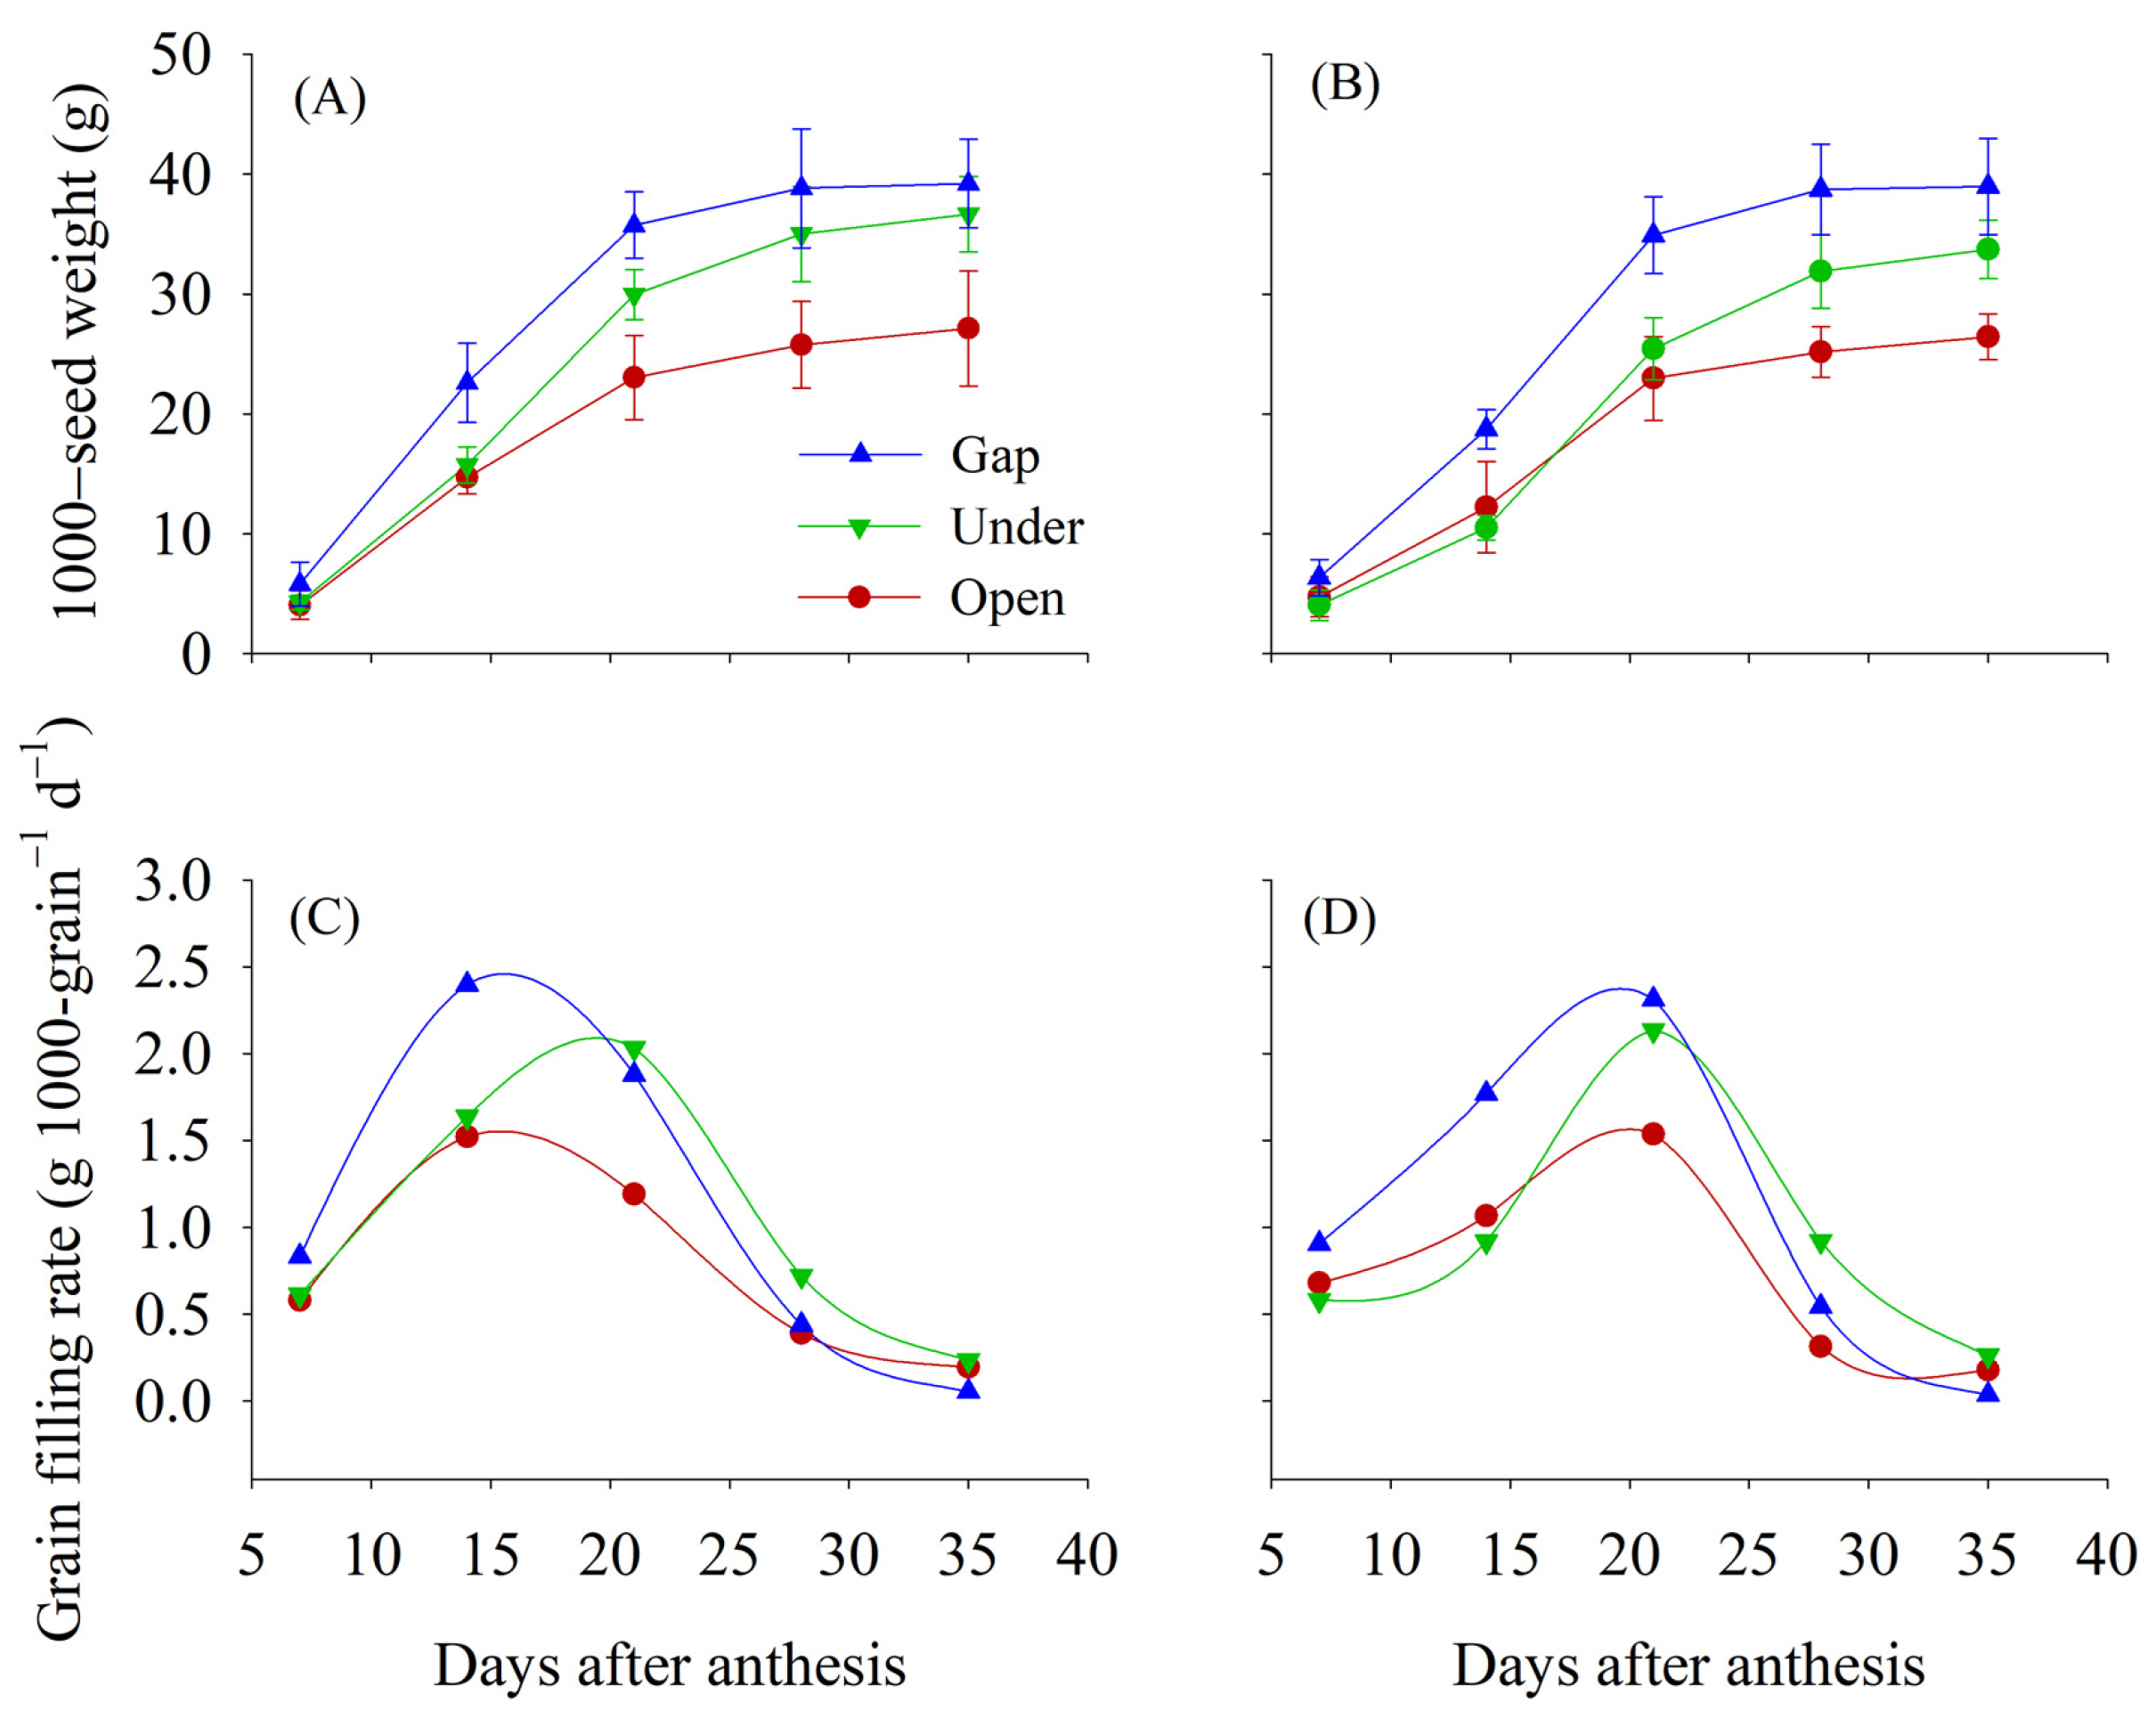
The wheat planted in the agrivoltaic system saw increased 1000-grain weight in both 2024 and 2025 (Figure 9). At Day 7 after anthesis, the 1000-grain weight of wheat did not differ between the agrivoltaic system and open-field conventional cropping, and up until the mid-grain filling stage (DAA 21 or 28), the 1000-grain weight of wheat in the Under plot was significantly enhanced by 31.0% compared with the Open plot. A greater increase in the 1000-grain weight occurred in the Gap plot—on average, 51.3% greater than in the Open plot from DAA 14 to the maturity. The wheat grain filled 28.3–60.9% more in the Gap plot than the Under plot before DAA28, but after this point, the wheat in the Under plot saw accelerated grain filling, with no significant difference between the two years.
Figure 9.
Thousand-grain weight of wheat (A,B) and grain-filling rate (C,D) when grown under conventional open-field cultivation and agrivoltaic systems during the grain-filling stage in 2024 (A,C) and 2025 (B,D). Open, local conventional open-field cultivation without photovoltaic arrays or water–fertilizer integration; Under, the shaded area beneath photovoltaic panels; Gap, the unshaded area between photovoltaic panels. Bars represent the standard error.
With the photovoltaic pattern, the rate of grain filling in wheat is overall higher than that in the conventional Open system. Although the rate of grain filling in the Under treatment is lower than that in the Gap treatment in the early stage of filling, in the mid-later stage, there is a catching-up trend of grain filling in the Under treatment. For example, the rate of grain filling at DAA 7–14 was higher in the Gap treatment (0.83–2.40 mg d−1) than in the Under treatment (0.61–1.64 mg d−1); however, after DAA 28, the wheat in the Under treatment saw accelerated grain filling, with a higher filling rate in the Under treatment (0.24–0.92 mg d−1) than in the Gap treatment (0.06–0.54 mg d−1). Additionally, the time at which the peak of the grain filling rate occurs also varies among the treatments, stages and years. In 2024, the grain filling rate reached the peak at DAA 14 both in the Open plot (1.52 g d−1) and Gap plot (2.40 g d−1), while for the Under plot wheat, the peak rate occurred later, reaching its maximum of 2.03 g d−1 at DAA 21. In comparison, in 2025, the grain filling rate peaked at DAA 21 regardless of agrivoltaic system or open-field conventional cropping, with 1.54, 2.13, 2.31 g d−1 in the Open, Under and Gap plots.
3.7. Yield and Yield Components
Wheat grain yield was significantly enhanced with the agrivoltaic system (Table 2). In 2024, the grain yield was 6045 kg ha–1 (Gap) and 4612 kg ha–1 (Under)—values 72.8% and 31.8% greater than the Open value of 3499 kg ha–1. A greater gap in grain yield was observed between the agrivoltaic system and open-field conventional cropping in 2025, i.e., 5386 kg ha–1 (Gap) and 3928 kg ha–1 (Under)—values 1.10-fold and 53.3% more than the Open value of 2563 kg ha–1. In addition, within the photovoltaic panel arrays, the grain yield was 5716 kg ha–1 in the Gap plot, 33.8% greater than the Under value of 4270 kg ha–1. Given that the Under and Gap treatments accounted for 25% and 75% of the total plot area, respectively, wheat yields in the agrivoltaic system were calculated using an area-weighted conversion method. The area-weighted yields were 5687 kg ha−1 in 2024 and 5022 kg ha−1 in 2025, representing significant increases of 64.9% and 95.9% compared with the Open treatment, respectively.
Table 2.
Wheat yield and yield components under conventional open-field cultivation and agrivoltaic systems in 2024 and 2025.
Planting in the agrivoltaic system also positively affected wheat yield components (Table 2). Averaged across years, the wheat spike number with the agrivoltaic system was 15.0% (Under) and 17.6% (Gap) more than that in the Open plot. Similarly, on average, 26.5% and 39.0% increases in the 1000-grain weight were observed in the Under and Gap plots. In 2024, the grains-per-spike measure in the Gap plot was 34.7, 36.8% higher than 25.3 in the Open plot, while it did not differ between the Under and Open treatments. In 2025, grains per spike in the Gap and Under treatments comprised 32.4 and 25.1, which was 35.6% and 75.4% greater than the 18.5 of the Open plot. The wheat grown in the Gap treatment had the most grains per spike, with 20.4% and 53.1% more than Under and Open treatments.
3.8. Economic Benefits
Agrivoltaics coupled with water–fertilizer integration improved the economic performance of wheat production (Table 3). In practical production, photovoltaic infrastructure occupied 20% of the total land area, leaving 80% available for crop cultivation. Based on the proportion, the land-area-adjusted wheat grain yields were 4549 kg ha−1 in 2024 and 4017 kg ha−1 in 2025 in the agrivoltaic system, with an average increase of 41.3% compared with the open-field conventional system. The production costs considered in the economic analysis included mechanical operations, seeds, fertilizers, water–fertilizer integration facilities, water pumping, and manual labor. A one-time investment of 450 CNY ha−1 was required for water–fertilizer integration facilities, with an annual amortized cost of 225 CNY ha−1, assuming a two-year service life. Although water–fertilizer coupling in agrivoltaics involved additional expenditures for irrigation and top-dressing, the increase in yield-derived income offset these extra costs. Accordingly, net economic revenue for the agrivoltaic system was 7660 CNY ha−1 (2024) and 4566 CNY ha−1 (2025), which were 50.0% and 3.20-fold higher than those of the open-field control, respectively.
Table 3.
Economic benefits of the agrivoltaics combined with water–fertilizer integration during 2024 and 2025.
4. Discussion
4.1. Yield Enhancement in Agrivoltaics Combined with Water–Fertilizer Management
The study region represents degraded cropland with water and nutrient deficiencies, frequent drought, and wind–sand erosion, which jointly constrain crop production and yield stability. This study showed that establishing an agrivoltaic system combined with water–fertilizer supply significantly improved wheat yield in this region. This yield advantage was possibly associated with improved microenvironment conditions, resulting from the combined effects of photovoltaic arrays and coordinated water–fertilizer supply.
The Open treatment remained exposed to multiple limiting factors, including water deficit, poor soil fertility, and wind–sand disturbance, whereas the photovoltaic panels (at 53° inclination) acted as physical barriers that can reduce wind speed and soil wind erosion while maintaining adequate light availability. Meanwhile, water–fertilizer coupling in the agrivoltaic system improved soil water and nutrient availability, alleviating their limitations on wheat growth in degraded cropland. The higher water, SOC and available nutrients observed within the photovoltaic array, relative to the Open treatment, provided more favorable conditions for wheat growth and yield formation. Compared with open-field cropping, wheat in the Gap plot showed significant increases in effective spike number, grains per spike, and thousand-grain weight by 17.6%, 53.1%, and 39.0%, respectively. Although wheat in the Under plot experienced radiation limitation, favorable soil moisture and nutrient conditions partly offset this constraint, resulting in a 15.0% higher effective spike number than in the Open plot. Also, 1000-grain weight increased by 26.5% in the Under plot, suggesting improved grain filling, probably associated with a potential buffering effect of panel shading against heat and drought stress during the grain-filling period [30,31]. This is consistent with the yield benefits observed in soybean under agrivoltaic systems [32]. Broader evidence also suggests that agrivoltaics can improve soil water conservation, alleviate aeolian erosion risk and enhance microclimatic buffering in arid and semi-arid regions [33,34]. These findings suggest that integrating agrivoltaics with water–fertilizer supply can improve the productivity by optimizing microenvironment conditions.
A comparison of cultivation years revealed that wheat grain yield was 16.1% lower in 2025 than 2024, coinciding with a 23.7% reduction in growing-season precipitation from 270 mm in 2024 to 206 mm in 2025. The yield reduction was smaller in the agrivoltaic system than in the Open treatment (12.9% vs. 26.7%), and a similar trend was observed for effective spike number (1.71% vs. 5.38%) and grains per spike (7.86% vs. 27.0%). These differences were possibly associated with reduced precipitation during key stages of yield formation in 2025, as precipitation from seedling to jointing and from booting to anthesis decreased by 29.7% and 69.5%, respectively, compared with 2024. In the rainfed Open treatment, limited rainfall, high radiation, strong winds, and sandy soils with low water-holding capacity probably accelerated soil water depletion, restricting spike formation and impairing grain set. In contrast, the agrivoltaic system, together with water–fertilizer synergy, partly alleviated water and nutrient limitations during critical growth stages. Grain-filling dynamics also differed between years: in 2024, the grain-filling rate peaked at DAA 14 in the Open and Gap treatments and at DAA 21 in the Under treatment, whereas in 2025 it occurred at DAA 21 across all treatments. This difference was likely related to a potential buffering effect of panel shading against a heatwave–drought event occurring around DAA 14 in 2024. Under such conditions, compared with the more exposed Open and Gap treatments, panel shading in the Under plot may have partly alleviated heat and water stress, potentially creating conditions conducive to delaying leaf senescence and prolonging the active grain-filling period [31]. This could partly explain the delayed peak grain-filling rate at DAA 21 and the relatively higher filling rates during the later stage in the Under treatment. These results suggest that agrivoltaic systems with integrated water–fertilizer management have the potential to buffer climate stress and improve wheat performance under increasingly frequent and intense extreme events.
4.2. Wheat Growth Adaptation to Spatial Heterogeneity Within Photovoltaic Arrays
Within the photovoltaic panel array, spatial heterogeneity occurred between the Gap and Under zones in radiation, soil moisture, and nutrient availability. The Gap plot represented an optimized environment, with sufficient radiation and nutrient availability, whereas the Under plot exhibited a trade-off microenvironment with sufficient moisture but limited radiation. The microenvironmental heterogeneity further influenced wheat physiological adaptation.
Root morphology differed significantly between the Under and Gap treatments. Wheat in the Gap plot developed longer roots with a greater surface area and smaller diameter. This slender architecture indicates enhanced root elongation and fine root proliferation, which increases root–soil contact for efficient water and nutrient acquisition. In contrast, wheat in the Under treatment exhibited shorter roots with a smaller surface area and larger diameter, suggesting inhibited root elongation and absorptive surface development. This restriction may result from lower soil nutrient availability and limited carbon allocation to roots under panel shading [35]. It probably represented a root morphological adjustment to the low-light but relatively high-moisture conditions beneath the photovoltaic panels. Overall, wheat grown in the Gap plot developed a slender and highly absorptive root system, whereas wheat in the Under plot formed a short-branched architecture with restricted spatial exploration.
Wheat plant height in the Under plot was consistently lower than that in the Gap plot throughout the growth period, resulting in an average decrease of 15.1% in final plant height at maturity. The reduced stem elongation was possibly associated with insufficient assimilate accumulation under panel shading. In contrast, soybean plants under the same agrivoltaic system were 5.44% taller in the Under than in the Gap plot [32], indicating a typical shade-avoidance response [18]. These contrasting responses imply that crop height under panel shading depends on the balance between shade-avoidance signaling and carbon limitation. For soybean, reduced light intensity beneath the panels possibly triggered phytochrome-mediated hormonal regulation, involving auxin and gibberellin, thus promoting internode elongation and improving light capture [36,37]. For wheat, however, carbon limitation appeared to dominate under shading. As an erect cereal crop with limited shade-induced height compensation, wheat under carbon limitation experienced reduced photosynthesis and assimilate supply, which probably constrained cell division and elongation in developing internodes [38].
Differences in grain-filling dynamics were also observed between the Gap and Under treatments. During the early-filling stage (before DAA21), wheat in the Gap plot showed a higher grain-filling rate than that in the Under plot. After DAA 21, however, the grain-filling rate of wheat in the Under treatment gradually caught up with and eventually exceeded that of wheat in the Gap treatment. This reversal was probably due to shading beneath the panels moderating the thermal and water environment during the middle to late grain-filling period, potentially creating conditions favorable for maintaining leaf photosynthetic activity and plant water status [21]. Overall, greater light availability in the Gap treatment may have favored early grain filling; the later increase in grain-filling rate in the Under was possibly associated with shading-related buffering effects.
4.3. Advantages of Agrivoltaics Coupled with Water–Fertilizer Integration in a Semi-Arid Sandy Region
The study area is situated along the southern margin of the Horqin region, where poor soil fertility, severe wind erosion, and desertification strongly constrain agricultural productivity and ecological stability. Against this background, the public-welfare agrivoltaic base in Zhangwu County, covering an area of over 1000 mu, was constructed to reconcile sand fixation with agricultural production. It was equipped with complete irrigation infrastructure, including drip irrigation, a micro-sprinkler system, and groundwater extraction facilities (approximately one well per 200 mu). Such facilities eliminated extra costs for water purchase and transportation and improved water-nutrient efficiency, which is critical for sustaining crop production and mitigating ecological degradation in this fragile semi-arid sandy environment. Pumping electricity constituted the dominant water-related cost; under local agricultural-power tariffs, the pumping expense (8–10 kWh mu−1 at 0.5 CNY kWH−1) is relatively low and acceptable for local farmers. Accordingly, the agrivoltaic system with drip-fertigation demonstrates viable economic potential for regional deployment. The economic analysis showed that net revenue for our agrivoltaic system was 3017 CNY ha−1 compared with the conventional system. These results suggest that, under the local infrastructure and management conditions, the extra inputs for the agrivoltaics coupled with water–fertilizer management are economically offset by gains in crop revenue.
The improvement in field-scale water productivity further demonstrated the application advantages of the integrated agrivoltaic–drip fertigation system. The grain yield per unit of total water input for Open, Under, and Gap treatments was 1.29, 1.27, and 1.67 kg m−3 in 2024, and 1.24, 1.25, and 1.72 kg m−3 in 2025, respectively. The higher water productivity observed in the Gap treatment indicated that the optimized supply of water and nutrients within photovoltaic panels enhanced the synergistic benefits of crop production and field water-resource use. After area-weighting the Under and Gap zones, the agrivoltaic system achieved a two-year average grain yield per unit of total water input of 1.59 kg m−3, exceeding that of the conventional rain-fed open field system (1.27 kg m−3). These results suggested that this coupled system represents an effective water-saving strategy and that agrivoltaics combined with optimized water–fertilizer supplementation could improve field water utilization in semi-arid regions.
In the semi-arid sandy region of Zhangwu, the agrivoltaic model coupled with water–fertilizer integration can simultaneously contribute to clean energy production, increased agricultural income, and ecological restoration. The integrated system combining photovoltaic panels with integrated water–fertilizer management provides a feasible solution for the large-scale promotion of muti-purpose land use that balances ecological restoration, grain production, and new-energy development.
5. Conclusions
This study provides field evidence that agrivoltaics coupled with water–fertilizer integration systems can enhance wheat productivity in the semi-arid Horqin Sandy Land. The wheat yield enhancement was driven by the combined influence of spatially heterogeneous microenvironmental regulation and integrated water–fertilizer management under agrivoltaic systems. Water–fertilizer coupling in agrivoltaics improved soil water, organic carbon and available nutrients, promoting root development and yield formation. The agrivoltaic system showed favorable economic benefits and climate-buffering potential, representing a promising strategy for simultaneously supporting grain production, solar energy development, and climate-resilient agriculture in arid and semi-arid sandy regions. Nevertheless, these conclusions are based on a two-year, single-site experiment, and the effects of microenvironmental regulation within photovoltaic panels arrays could not be fully distinguished from those of integrated water–fertilizer management. Future studies should conduct multi-site and multi-year experiments with management-balanced controls, continuous microclimate measurements, and cultivar comparisons to evaluate agrivoltaic systems benefits.
Author Contributions
Conceptualization, J.X. and X.Z.; methodology, J.X., Y.H., X.S., J.W., and Z.L.; software, J.X., Y.H., X.S., M.T., and Y.J.; validation, J.X., Y.H., X.S., J.W., and M.T.; formal analysis, J.X., Y.H., X.S., J.W., M.T., and Y.J.; investigation, J.X., Y.H., X.S., J.W., M.T., Z.L., Y.J., and T.L.; resources, J.X., J.W., T.L., and X.Z.; data curation, J.X., Y.H., and X.S.; writing—original draft preparation, J.X.; writing—review and editing, Z.L. and X.Z.; visualization, J.X., Y.H., and X.S.; supervision, X.Z.; project administration, L.G. and L.F.; funding acquisition, J.X., L.G., L.F., and X.Z. All authors have read and agreed to the published version of the manuscript.
Funding
This research was supported by the National Key R&D Program of China (2023YFD1500900; 2023YFD1500705) and the Fundamental Research Funds for Liaoning Academy of Agricultural Sciences (2025MS1715; 2021HQ1908).
Data Availability Statement
The data presented in this study are available on request from the corresponding author due to privacy.
Conflicts of Interest
Author Jiaji Wang was employed by Zhangwu Hongtai Agriculture and Animal Husbandry Technology Co., Ltd. The remaining authors declare that the research was conducted in the absence of any commercial or financial relationships that could be construed as a potential conflict of interest.
References
- Stid, J.T.; Shukla, S.; Kendall, A.D.; Anctil, A.; Hyndman, D.W.; Rapp, J.; Anex, R.P. Impacts of Agrisolar Co-Location on the Food–Energy–Water Nexus and Economic Security. Nat. Sustain. 2025, 8, 702–713. [Google Scholar] [CrossRef] [Scilit]
- Ghosh, A. Nexus between Agriculture and Photovoltaics (Agrivoltaics, Agriphotovoltaics) for Sustainable Development Goal: A Review. Sol. Energy 2023, 266, 112146. [Google Scholar] [CrossRef] [Scilit]
- Cuppari, R.I.; Higgins, C.W.; Characklis, G.W. Agrivoltaics and Weather Risk: A Diversification Strategy for Landowners. Appl. Energy 2021, 291, 116809. [Google Scholar] [CrossRef] [Scilit]
- Wang, L.; Qiu, T.; Zhang, M.; Cao, Q.; Qin, W.; Wang, S.; Wang, L.; Chen, D.; Wild, M. Carbon Emissions and Reduction Performance of Photovoltaic Systems in China. Renew. Sust. Energy Rev. 2024, 200, 114603. [Google Scholar] [CrossRef] [Scilit]
- Tan, Y.; Liu, J.; Li, W.; Yin, J.; Chen, H.; Peng, Y.; Tan, J.; Wei, M. Agrivoltaics Development Progresses: From the Perspective of Photovoltaic Impact on Crops, Soil Ecology and Climate. Environ. Res. 2025, 266, 120540. [Google Scholar] [CrossRef] [Scilit] [PubMed]
- Grodsky, S.M.; Hernandez, R.R. Reduced Ecosystem Services of Desert Plants from Ground-Mounted Solar Energy Development. Nat. Sustain. 2020, 3, 1036–1043. [Google Scholar] [CrossRef] [Scilit]
- Wu, C.; Liu, H.; Yu, Y.; Zhao, W.; Liu, J.; Yu, H.; Yetemen, O. Ecohydrological Effects of Photovoltaic Solar Farms on Soil Microclimates and Moisture Regimes in Arid Northwest China: A Modeling Study. Sci. Total Environ. 2022, 802, 149946. [Google Scholar] [CrossRef] [Scilit] [PubMed]
- Liu, Y.; Zhang, R.Q.; Huang, Z.; Cheng, Z.; López-Vicente, M.; Ma, X.R.; Wu, G.L. Solar Photovoltaic Panels Significantly Promote Vegetation Recovery by Modifying the Soil Surface Microhabitats in an Arid Sandy Ecosystem. Land Degrad. Dev. 2019, 30, 2177–2186. [Google Scholar] [CrossRef] [Scilit]
- Sun, J.; Cui, W.; Wang, W.; Yang, X. The Microclimatic and Ecohydrological Effects of Photovoltaic Facilities in Arid/Semi-Arid Regions of China: An Integrated Modeling Study. J. Environ. Manag. 2025, 382, 125395. [Google Scholar] [CrossRef] [Scilit] [PubMed]
- Muir, R.; Kushwaha, P.; Barron-Gafford, G.A.; Babst-Kostecka, A. Enhancing Climate-Smart Crop Performance in Arid Agrivoltaics Systems: Effects of Photovoltaic Shading and Soil Amendments on Tepary Bean Growth, Yield, and Associated Soil Microbiome. Plant Soil 2026, 519, 1795–1819. [Google Scholar] [CrossRef] [Scilit]
- Ali Abaker Omer, A.; Li, M.; Zhang, F.; Hassaan, M.M.E.; El Kolaly, W.; Zhang, X.; Lan, H.; Liu, J.; Liu, W. Impacts of Agrivoltaic Systems on Microclimate, Water Use Efficiency, and Crop Yield: A Systematic Review. Renew. Sustain. Energy Rev. 2025, 221, 115930. [Google Scholar] [CrossRef] [Scilit]
- Ali Abaker Omer, A. Climate Change and the Water–Food–Energy Nexus: A Comprehensive Review of Sustainability Challenges and Innovations. Renew. Sustain. Energy Rev. 2026, 230, 116676. [Google Scholar] [CrossRef] [Scilit]
- Barron-Gafford, G.A.; Minor, R.L.; Allen, N.A.; Cronin, A.D.; Brooks, A.E.; Pavao-Zuckerman, M.A. The Photovoltaic Heat Island Effect: Larger Solar Power Plants Increase Local Temperatures. Sci. Rep. 2016, 6, 35070. [Google Scholar] [CrossRef] [Scilit] [PubMed]
- Moscatelli, M.C.; Marabottini, R.; Massaccesi, L.; Marinari, S. Soil Properties Changes after Seven Years of Ground Mounted Photovoltaic Panels in Central Italy Coastal Area. Geoderma Reg. 2022, 29, e00500. [Google Scholar] [CrossRef] [Scilit]
- Xu, Z.; Li, Y.; Qin, Y.; Bach, E. A Global Assessment of the Effects of Solar Farms on Albedo, Vegetation, and Land Surface Temperature Using Remote Sensing. Sol. Energy 2024, 268, 112198. [Google Scholar] [CrossRef] [Scilit]
- Carvalho, F.; Montag, H.; Bentley, L.; Šarlej, R.; Broyd, R.C.; Blaydes, H.; Cattin, M.; Burke, M.; Wallwork, A.; Ramanayaka, S.; et al. Plant and Soil Responses to Ground-Mounted Solar Panels in Temperate Agricultural Systems. Environ. Res. Lett. 2025, 20, 024003. [Google Scholar] [CrossRef] [Scilit]
- Zhou, M.; Wang, X. Influence of Photovoltaic Power Station Engineering on Soil and Vegetation: Taking the Gobi Desert Area in the Hexi Corridor of Gansu as an Example. Sci. Soil Water Conserv. 2019, 17, 132–138. (In Chinese) [Google Scholar]
- Marrou, H.; Wery, J.; Dufour, L.; Dupraz, C. Productivity and Radiation Use Efficiency of Lettuces Grown in the Partial Shade of Photovoltaic Panels. Eur. J. Agron. 2013, 44, 54–66. [Google Scholar] [CrossRef] [Scilit]
- Shafiq, I.; Hussain, S.; Hassan, B.; Raza, A.; Ahmad, I.; Asghar, M.A.; Wang, Z.; Tan, T.; Li, S.; Tan, X.; et al. Crop Responses and Management Strategies under Shade and Drought Stress. Photosynthetica 2021, 59, 664–682. [Google Scholar] [CrossRef] [Scilit]
- Wille, W.; Pipper, C.B.; Rosenqvist, E.; Andersen, S.B.; Weiner, J.; Jackson, M.B. Reducing Shade Avoidance Responses in a Cereal Crop. AoB Plants 2017, 9, plx039. [Google Scholar] [CrossRef] [Scilit] [PubMed]
- Barron-Gafford, G.A.; Pavao-Zuckerman, M.A.; Minor, R.L.; Sutter, L.F.; Barnett-Moreno, I.; Blackett, D.T.; Thompson, M.; Dimond, K.; Gerlak, A.K.; Nabhan, G.P.; et al. Agrivoltaics Provide Mutual Benefits across the Food–Energy–Water Nexus in Drylands. Nat. Sustain. 2019, 2, 848–855. [Google Scholar] [CrossRef] [Scilit]
- Dupraz, C.; Marrou, H.; Talbot, G.; Dufour, L.; Nogier, A.; Ferard, Y. Combining Solar Photovoltaic Panels and Food Crops for Optimising Land Use: Towards New Agrivoltaic Schemes. Renew. Energy 2011, 36, 2725–2732. [Google Scholar] [CrossRef] [Scilit]
- Jia, M.; Peng, B.; Guan, K.; Lawrence, D.M.; DeLucia, E.H.; Knapp, A.K.; Barron-Gafford, G.A.; Khanna, M.; Lombardozzi, D.L.; Sturchio, M.A.; et al. Climate-Driven Divergence in Biophysical and Economic Impacts of Agrivoltaics. Proc. Natl. Acad. Sci. USA 2026, 123, e2514380123. [Google Scholar] [CrossRef] [Scilit] [PubMed]
- Xia, Z.; Li, Y.; Guo, S.; Bao, E.; Yuan, B.; Chen, R.; Tang, P.; Yang, C.; Du, P. The Impact of Photovoltaic Plants on Dryland Vegetation Phenology Revealed by Time-Series Remote Sensing Images. Agric. For. Meteorol. 2025, 367, 110505. [Google Scholar] [CrossRef] [Scilit]
- Jiang, L.; Liu, Y.; Yang, L. Scenario-Based Simulation of Future Photovoltaic Land Expansion in China: Balancing Energy Demands and Ecological Conservation. Environ. Impact Assess. Rev. 2026, 117, 108203. [Google Scholar] [CrossRef] [Scilit]
- Mohammed Wazed, S.; Hughes, B.R.; O’Connor, D.; Kaiser Calautit, J. A Review of Sustainable Solar Irrigation Systems for Sub-Saharan Africa. Renew. Sust. Energy Rev. 2018, 81, 1206–1225. [Google Scholar] [CrossRef] [Scilit]
- Li, Y.; Zhou, X.; Brandle, J.R.; Zhang, T.; Chen, Y.; Han, J. Temporal Progress in Improving Carbon and Nitrogen Storage by Grazing Exclosure Practice in a Degraded Land Area of China’s Horqin Sandy Grassland. Agric. Ecosyst. Environ. 2012, 159, 55–61. [Google Scholar] [CrossRef] [Scilit]
- Huang, B.; Zou, X.; Xu, H.; Xu, J.; Liu, H.; Sun, W.; Gong, L.; Niu, S.; Feng, L.; Yang, N.; et al. Seedling Defoliation of Cereal Crops Increases Peanut Growth and Yield in an Intercropping System. Crop J. 2022, 10, 418–425. [Google Scholar] [CrossRef] [Scilit]
- Bao, S. Soil Agrochemical Analysis; China Agriculture Press: Beijing, China, 2000. [Google Scholar]
- Ukwu, U.N.; Muller, O.; Meier-Grüll, M.; Uguru, M.I. Agrivoltaics Shading Enhanced the Microclimate, Photosynthesis, Growth and Yields of Vigna Radiata Genotypes in Tropical Nigeria. Sci. Rep. 2025, 15, 1190. [Google Scholar] [CrossRef] [Scilit] [PubMed]
- Farooq, M.; Bramley, H.; Palta, J.A.; Siddique, K.H.M. Heat Stress in Wheat During Reproductive and Grain-Filling Phases. Crit. Rev. Plant Sci. 2011, 30, 491–507. [Google Scholar] [CrossRef] [Scilit]
- Zou, X.; Xu, J.; Huang, Y.; Tian, M.; Liu, Z.; Li, T.; Wang, J.; Gong, L.; Feng, L. Agrivoltaics Combined with Integrated Water–Fertilizer Management Promotes Soybean Yield in a Semi-Arid Sandy Region. Life 2026, 16, 1062. [Google Scholar] [CrossRef] [Scilit] [PubMed]
- Gao, Y.; Yang, Q.; Chang, P.; Wang, C.; Wang, X.; Yu, M.; Liu, R.; Dilixiati, B.; Shi, Q.; Zhakypbek, Y. Assessment of the Spatiotemporal Patterns and Ecological Impacts of Photovoltaic Power Plants in Central Asia. Earth’s Future 2026, 14, e2025EF006335. [Google Scholar] [CrossRef] [Scilit]
- Yu, Y.; Chen, T.; Ma, S.; Tian, Y.; Li, Q.; Cai, Z.; Zhao, L.; Liu, X.; Xiao, J.; Shi, Y. Effects of Different Operation Years of Photovoltaic Power Stations on Vegetation and Soil Characteristics in Temperate Deserts. Agriculture 2025, 15, 2097. [Google Scholar] [CrossRef] [Scilit]
- Yang, H.; He, X.; Su, Y.; Wang, L.; Feng, L.; Pu, T.; Gong, W.; Li, J.; Yang, F.; Wang, X.; et al. Relay Strip Intercropping Enhances Soybean Rhizodeposition and Soil Carbon Sequestration through Light-Induced Compensatory Root Growth. Agric. Ecosyst. Environ. 2026, 396, 110000. [Google Scholar] [CrossRef] [Scilit]
- Casal, J.J. Photoreceptor Signaling Networks in Plant Responses to Shade. Annu. Rev. Plant Biol. 2013, 64, 403–427. [Google Scholar] [CrossRef] [Scilit] [PubMed]
- de Wit, M.; Galvão, V.C.; Fankhauser, C. Light-Mediated Hormonal Regulation of Plant Growth and Development. Annu. Rev. Plant Biol. 2016, 67, 513–537. [Google Scholar] [CrossRef] [Scilit] [PubMed]
- Mu, H.; Jiang, D.; Wollenweber, B.; Dai, T.; Jing, Q.; Cao, W. Long-Term Low Radiation Decreases Leaf Photosynthesis, Photochemical Efficiency and Grain Yield in Winter Wheat. J. Agron. Crop Sci. 2010, 196, 38–47. [Google Scholar] [CrossRef] [Scilit]

Disclaimer/Publisher’s Note: The statements, opinions and data contained in all publications are solely those of the individual author(s) and contributor(s) and not of MDPI and/or the editor(s). MDPI and/or the editor(s) disclaim responsibility for any injury to people or property resulting from any ideas, methods, instructions or products referred to in the content. |
© 2026 by the authors. Licensee MDPI, Basel, Switzerland. This article is an open access article distributed under the terms and conditions of the Creative Commons Attribution (CC BY) license.