


Abstract
Composting is a primary method for organic waste treatment, and ventilation is crucial for composting performance. The pipe design parameters influence ventilation efficiency, while the interactions between these parameters remain unclear. Conventional response surface methodology (RSM) is limited by discrete experimental points, potentially affecting optimization accuracy, whereas computational fluid dynamics (CFD) provides a spatially resolved analysis of airflow fields within the entire compost pile. Herein, this study combines RSM and CFD to exploit their complementary strengths for more reliable optimization. A 17-run Box–Behnken design (BBD) was conducted to evaluate compost maturity under different pipe design parameters, including pipe diameter (11, 12, 13 mm), adjacent orifice spacing increment (0.5, 0.75 and 1 cm) and orifice diameter (2, 2.5 and 3 mm). Meanwhile, CFD simulations were performed to quantitatively evaluate the effects of different design parameters on airflow distribution characteristics. An experimental validation was additionally conducted under the optimal configuration. Results indicated that the optimized design parameters reduced the coefficient of air speed variation (CASV) by 55.37%. Pipe diameter, adjacent orifice spacing and orifice diameter had significant effects on germination index and humus (p < 0.01), whereas the significance of the interaction terms differed among response variables. The influence ranking on germination index and humus was as follows: pipe diameter > adjacent orifice spacing > orifice diameter. To achieve maximum composting effectiveness, the optimal pipe design parameters were determined as an adjacent orifice spacing increment of 0.78 cm, an orifice diameter of 2.83 mm, and a pipe diameter of 12.71 mm. Relative to the 17 BBD experimental runs, these optimal parameters resulted in maximum observed improvements of 18.66 percentage points in final GI and 63.36 g/kg in final HS, while the humic acid-to-fulvic acid ratio increased by 1.27. This study provides a theoretical basis for optimizing compost ventilation pipe design and improving composting performance in aerobic composting systems.
1. Introduction
With rapid global growth in animal production, annual livestock and poultry manure output has reached approximately 6.3 billion tons [1]. Equipment-assisted composting is a main manure treatment approach [2], valued for high efficiency and broad applicability, and is widely used in agricultural waste management [3].
Ventilation parameters play a critical role in composting effectiveness, and their optimization is essential for uniform airflow distribution within the pile. Of these parameters, orifice spacing has received the most attention. Raphe et al. [4] found that changing adjacent-hole spacing from a uniform to a non-uniform arrangement reduced airflow variation from 35% to 6%. Cao et al. [5] reported that gradually decreasing the spacing along the airflow direction enhanced convective heat transfer near the inlet, and the coefficient at the first hole increased by 27.5%. Yeo et al. [6] observed that the standard deviation of airflow distribution decreased from 2.0 to 1.1. In cattle manure composting, Cheng et al. [7] showed that a 0.75 cm increase in adjacent orifice spacing improved airflow uniformity by 36.08%, and also raised humus by 4.5 g/kg, the humic acid-to-fulvic acid ratio by 0.8, and seed germination index by 22.2%. These studies consistently demonstrate that adjusting orifice spacing is an effective optimization strategy.
Orifice diameter and pipe diameter are likewise important. For orifice diameter, Ogunwandev et al. [8] found that a 35 mm orifice combined with a vertical pipe reduced total nitrogen loss by 15.2%. Hall et al. [9] reported that a 140 μm orifice increased the gas–liquid contact area and enhanced oxygen transfer efficiency by 52%, and Yucel et al. [10] observed a similar trend with a 15 mm orifice. For pipe diameter, Lu et al. [11] showed that reducing it increased local flow velocity, refined bubble size, and raised oxygen utilization from 15.24% to 16.80%. Ghomi et al. [12] found that decreasing the nozzle diameter from 20 mm to 14 mm increased standard aeration efficiency by 1.166 kg O2/kWh. Wang et al. [13] reported that changing the pipe diameter from 64 mm to 56 mm increased effective channel coverage by 75%. Mahmud et al. [14] found that a 4-inch pipe increased aeration efficiency more than fourfold. Together, these findings indicate that an appropriate pipe diameter benefits ventilation efficiency. However, previous studies mostly optimized a single parameter in isolation and did not fully consider the interactions among multiple parameters, so multi-parameter optimization remains largely unexplored.
Response surface methodology (RSM) is a statistical approach for experimental design and process optimization that can characterize the nonlinear relationships between variables and responses in multivariable systems [15]. It has been widely applied in agricultural waste treatment. Sharma et al. [16] used RSM to identify a floral waste–cow dung–sawdust mixture that enhanced organic carbon degradation by 13.4%, and Udume et al. [17] determined the optimal conditions for lignin degradation in water hyacinth. Saleh et al. [18] optimized food waste decomposition, and Wang et al. [19] optimized the tumbling parameters of a rotary drum reactor. However, RSM derives optimal parameters from a finite set of sampling points, and its results are sensitive to point location and thus carry inherent locality and randomness.
Computational fluid dynamics (CFD) offers a complementary means of analyzing airflow distribution. It has been widely used in ventilation-system optimization and provides solid support to the semi-empirical RSM approach. Zhou et al. [20] showed that baffles increased air velocity by 2.5 m/s and enhanced heat removal by 21.1–50.9%, and Baek et al. [21] identified an optimal CFD setting with an average coefficient of variation of the root mean square error of 1.55%. Yu et al. [22] coupled CFD with Bayesian optimization and reduced temperature and airflow deviations by more than 50%, and CFD has also been applied to CO2 enrichment and gas-dispersion control.
Accordingly, this study couples CFD with RSM to examine the effects of pipe design parameters on airflow distribution within the compost pile. The specific innovations are as follows: (1) simultaneous optimization of orifice spacing, orifice diameter, and pipe diameter, examining their interaction effects and influence ranking; (2) application of CFD to visualize the full airflow field and overcome the sampling-point limitation of RSM; (3) linkage of the simulated airflow distribution to measured maturity indicators (GI and HS), elucidating the mechanism by which aeration parameters influence cattle manure compost maturation. The results provide a theoretical foundation for optimizing aeration strategies.
2. Materials and Methods
2.1. Experimental Materials
This study utilized cattle manure and maize straw as raw materials. Fresh cattle manure was sourced from a livestock farm in Sanhe City, Hebei Province, China, while maize straw was purchased from a farm in Shijiazhuang City, Hebei Province, China, and subsequently ground to approximately 1 cm using a pulverizer (Hammer mill, Model SFSP56×40, Liyang Yuda Machinery Co., Ltd., Liyang, Jiangsu, China). The mass ratio of cattle manure to maize straw was adjusted to 2:1. The basic physicochemical properties of the composting piles are summarized in Table 1.
Table 1.
Physical and chemical properties of the initial piles.
2.2. Experimental Equipment
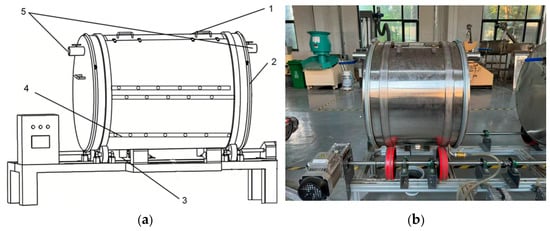
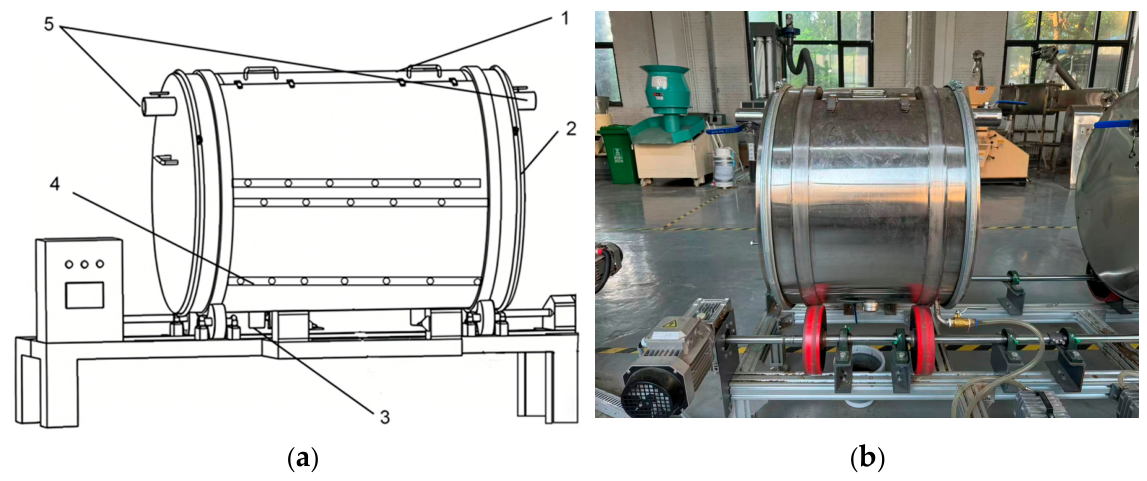
A drum-type aerobic composting reactor, independently designed and developed by the Planning and Design Institute of the Ministry of Agriculture and Rural Affairs, was used in this study. The schematic diagram and photograph of the reactor are shown in Figure 1a,b. The cylindrical reactor was 50 cm long and 60 cm in diameter. It was equipped with detachable, sealed end caps on both sides, each containing gas sampling ports located approximately one-quarter of the way up from the base. The top and bottom of the reactor featured solid sample collection ports and leachate collection ports, respectively. Internally, the ventilation system consisted of a main air duct and three detachable branch pipes arranged in a fan-shaped configuration, with each branch pipe having a length of 415 mm. To homogenize the pile, the drum reactor was rotated once every three days, at two revolutions per rotation. Between rotations the reactor remained stationary. Aeration was supplied continuously through the ventilation pipe. Upon completion, all treatments fulfilled the compost maturity standard (GI ≥ 70%, NY/T 3442–2019), and effective humification was achieved.
Figure 1.
Drum-type aerobic composting reactor. (a) Schematic diagram; (b) photograph of the laboratory-scale unit. 1—Solid sampling port; 2—Sealing cover; 3—Leachate collection port; 4—Ventilation pipe; 5—Gas collection port.
2.3. Experimental Design
A Box–Behnken design (BBD) with three factors and three levels was employed. The factors were adjacent orifice spacing increment (X1), orifice diameter (X2), and pipe diameter (X3) (Table 2). This gave 17 experimental trials (Table 3). The factor ranges were determined from preliminary tests, ventilation system characteristics, and previous studies [23,24]. The ranges were 0.5–1.0 cm for spacing increment, 2–3 mm for orifice diameter, and 11–13 mm for pipe diameter.
Table 2.
Experimental factors and levels.
Table 3.
Experimental group parameter.
Furthermore, four configurations were selected for the steady-state CFD comparison and labeled C0–C3 to distinguish them from the T1–T17 design points of the BBD (Table 4). C0 was the uniformly perforated control, with seven equally spaced 2 mm orifices on a 12 mm pipe. C1 and C2 were representative configurations corresponding to BBD point T5 and the center points T13–T17. C3 was the RSM-optimized design (spacing increment 0.78 cm, 2.83 mm orifice, 12.71 mm pipe), which falls outside the BBD matrix. All CFD simulations were conducted under steady-state conditions at the same representative operating condition, with identical pile properties and inlet velocity for all configurations. In addition to the CFD simulations, an independent composting experiment was conducted under the RSM-optimized C3 configuration to validate the reliability of the model predictions.
Table 4.
Pipe configurations for CFD simulations.
2.4. Sample Collection
The experiment was conducted in March 2025 over a 15-day composting cycle. Samples were collected on days 1, 3, 6, 9, 12 and 15 throughout the process. To reduce experimental errors, samples were taken from three distinct layers, with three sampling points per layer, yielding a total of 9 sampling points. These sampling points were positioned 12.5 cm from the reactor wall, with 12.5 cm spacing between adjacent points and 15 cm between the upper and lower layers. The nine samples were not pooled. Each spatial sample was analyzed separately in triplicate, and the mean of the three analytical determinations was used as the result for that sampling point. The nine point-specific means were then used to calculate the mean value for each treatment. The samples collected were sealed in plastic bags and stored at 4 °C until analysis. Temperature measurements were recorded twice daily at 10:00 and 17:00, and the average temperature was calculated. Each Box–Behnken treatment represented one reactor run; therefore, separate reactor-level independent replicates were not established for the individual non-center treatments. The five center-point runs, T13–T17, were used to estimate pure error for the response surface analysis. The triplicate determinations were analytical replicates and should not be interpreted as independent reactor-level replicates.
2.5. CFD Simulation of Airflow
Considering both computational accuracy and efficiency, CFD was employed to simulate airflow distribution within the composting pile, based on the experimentally validated model proposed by Cheng et al. [24], and independently confirmed by Xu et al. [25]. The governing equations included the conservation equations of mass, momentum, and energy (Equations (1)–(3)).
A full-scale three-dimensional model of the composting reactor was developed using SolidWorks 2021. The reactor dimensions were defined along the X-axis (width: 0–0.6 m), Y-axis (height: 0–0.6 m), and Z-axis (length: 0–0.5 m). The computational domain consisted of the composting pile and the aeration pipelines. A grid independence test was conducted to ensure the accuracy of the numerical results. Three levels of unstructured meshes (coarse, medium, and fine) were generated. In the aeration hole region, mesh sizes of 0.75, 0.5, and 0.25 mm were applied. In the aeration pipeline region, the mesh sizes were 5, 4, and 3 mm. In the composting pile region, the mesh sizes were 9, 8, and 7 mm. To evaluate mesh resolution, five cross-sections (Z = 0.05, 0.15, 0.25, 0.35, and 0.45 m) were selected. On each section, the area-weighted average air speed was calculated, and the five values were averaged. Relative to the fine mesh, the coarse and medium meshes deviated by 9.3% and 3.5%, respectively. This is consistent with accepted practice in porous-media CFD, where deviations of up to about 5% are regarded as an acceptable accuracy–cost trade-off [26]. Balancing accuracy with the computational cost of comparing multiple configurations, the medium mesh was selected.
Boundary conditions were specified as follows. The inlet boundary was defined as a velocity inlet, with a cross-section-averaged airflow velocity of 1.25 m/s based on the internal cross-sectional area of the ventilation pipe, while the outlet was set as a pressure outlet with a static pressure of 0 Pa. The composting pile was treated as a porous medium, with viscous and inertial resistance coefficients of 689,615.35 m−2 and 298.06 m−1 [27], respectively. The pipe Reynolds number at the inlet was approximately 1.06 × 10³. Accordingly, the main-pipe fluid zone was specified as a laminar zone, with a friction factor of 0.06, while the standard k–ε model was retained only for the localized high-shear orifice-jet and downstream mixing region. Pressure–velocity coupling was handled using the SIMPLE algorithm. The discretization of momentum, turbulent kinetic energy, and turbulent dissipation rate equations was conducted using a second-order upwind scheme.
2.6. Analysis Methods
- (1)
- Temperature: Measured using a thermometer (TP101).
- (2)
- pH and electrical conductivity (EC): Fresh samples were mixed with deionized water at a mass-to-volume ratio of 1:10, sealed, shaken for 1 h. The suspension was then allowed to stand for 10 min and filtered using filter paper (Cytiva, Maidstone, United Kingdom). The pH value of the filtrate was measured using a pH meter (PHS–3C, Inesa Scientific Instrument Co., Ltd. (Leici), Shanghai, China), and EC was determined using a conductivity meter (DDS–307A, Inesa Scientific Instrument Co., Ltd. (Leici), Shanghai, China).
- (3)
- GI (seed germination index): 5 mL of the extract was placed in a Petri dish lined with filter paper, and 10 seeds were evenly distributed. Deionized water was used as a blank control. The Petri dish was incubated at 25 ± 1 °C for 48 h. After incubation, the root length and germination rate were measured, and the GI was determined using Equation (4):where GI represents the germination index (%); Tgr and Trl represent the germination rate (%) and root length (mm) of the treatment group, respectively; Cgr and Crl represent the germination rate (%) and root length (mm) of the control group, respectively.
- (4)
- HS (humus): 4 g of air-dried samples were dissolved in 40 mL of extraction solution (0.10 mol/L NaOH and 0.10 mol/L Na4P2O7 with a mass ratio of 1:10) and shaken at 200 r/min for 24 h. The mixture was then centrifuged (4000 r/min for 15 min), and the supernatant was transferred to a container. The supernatant was filtered through a 0.45 μm membrane into a 100 mL Erlenmeyer flask. The remaining residue was repeatedly extracted using the same procedure four times until the extract became nearly colorless. All filtered extracts were combined to obtain the total HS solution.
- (5)
- TC and TN: Fresh samples were air-dried, ground in an agate mortar and passed through a 0.25 mm sieve. TC and TN were determined by dry combustion using an elemental analyser (vario MACRO cube, Elementar, Hanau, Germany), following ISO 10694:1995 and ISO 13878:1998. The C/N ratio was calculated as the mass ratio of TC to TN.
- (6)
- MC: Fresh samples were oven-dried at 105 °C to constant mass. MC was expressed as the percentage of mass loss on drying, according to NY/T 525–2021.
- (7)
- Response surface analysis: A multivariable quadratic regression equation, as shown in Equation (5), was used to model the functional relationship between the factors and response values.where Y is the predicted response factor; b0 is the constant coefficient; bi is the linear coefficient; bij is the interaction coefficient; bii is the quadratic coefficient; Xi and Xj are the coded values of the factors; and ε is the error function.
2.7. Data Processing
Experimental data were statistically analyzed using SPSS 21.0. Origin 2021 was employed for data visualization, including correlation analysis and physicochemical parameter variation. Response surface analysis and model fitting were performed using Design-Expert 13.0 software. Airflow distribution within the compost pile was simulated using Fluent 2022R1.
3. Results
3.1. Correlation Analysis Between Pipe Design Parameters and Physicochemical Indicators
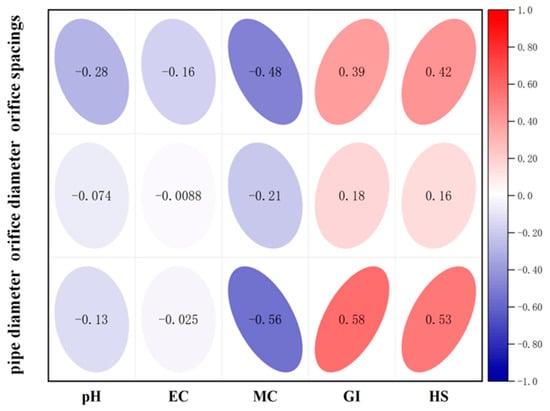
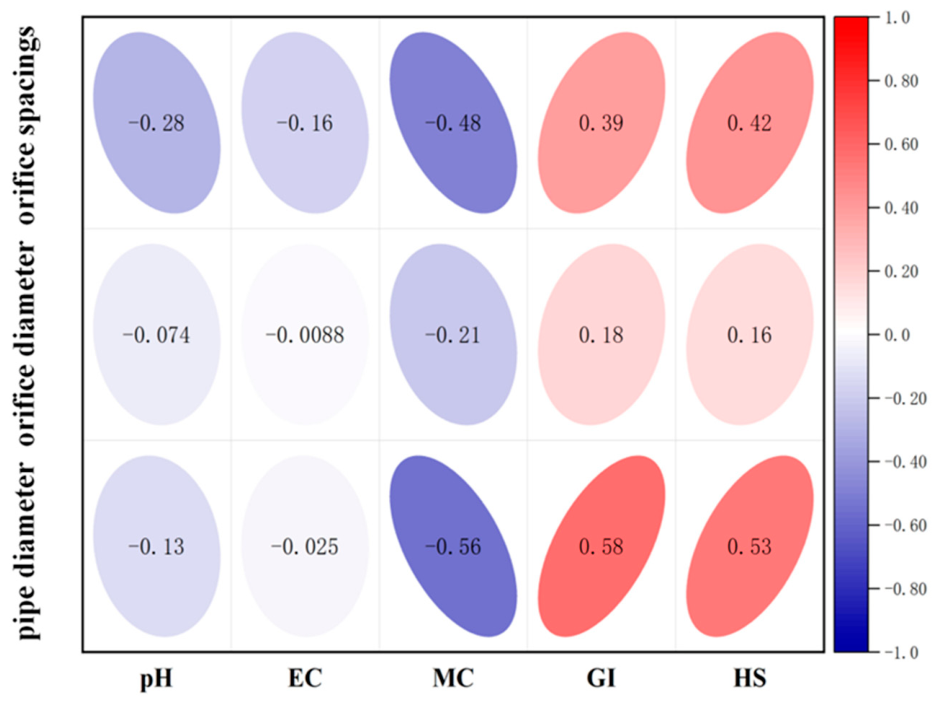
Figure 2 shows the correlations between pipe design parameters and physicochemical indicators. Red and blue represent positive and negative correlations, respectively, with coefficients closer to ±1 indicating stronger relationships.
Figure 2.
Correlation analysis of pipe design parameters and physicochemical indicators.
Pipe diameter, adjacent orifice spacing increment, and orifice diameter were positively correlated with GI and negatively correlated with MC. These relationships may reflect improved aeration, which could promote the degradation of phytotoxic compounds [23] and enhance moisture evaporation [28]. All three design parameters were also positively correlated with HS content, potentially because a more uniform airflow distribution favored microbial activity and the transformation of organic matter into humic substances. Their negative correlations with pH and EC may reflect aeration-related changes in nitrogen transformation, ammonia volatilization, and the balance between soluble ion release and immobilization [29]. The results indicated a significant correlation between pipe design parameters and physicochemical indicators.
3.2. Effect of Pipe Design Parameters on GI and HS
GI and HS were selected as the response variables. They characterize compost maturity from complementary perspectives. GI is an integrated biological indicator of phytotoxicity and biosafety. It reflects the degradation of germination inhibitors, such as volatile fatty acids and phenolic compounds. A GI above 70% is widely accepted as the threshold of mature compost. In contrast, HS represent the stable carbon formed during humification. They indicate soil-improving quality and carbon sequestration potential. Used together, the two indicators distinguish apparent maturity from genuine biological stability. This ensures both immediate biosafety and lasting fertility.
- (1)
- RSM analysis of effects of pipe design parameters on GI
Multiple regression fitting on GI yielded the equation 6 for response variable Y1 in terms of the independent variables: adjacent orifice spacing increment (X1), orifice diameter (X2), and pipe diameter (X3).
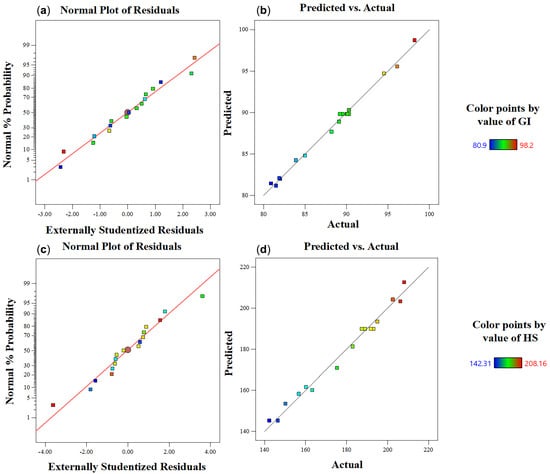
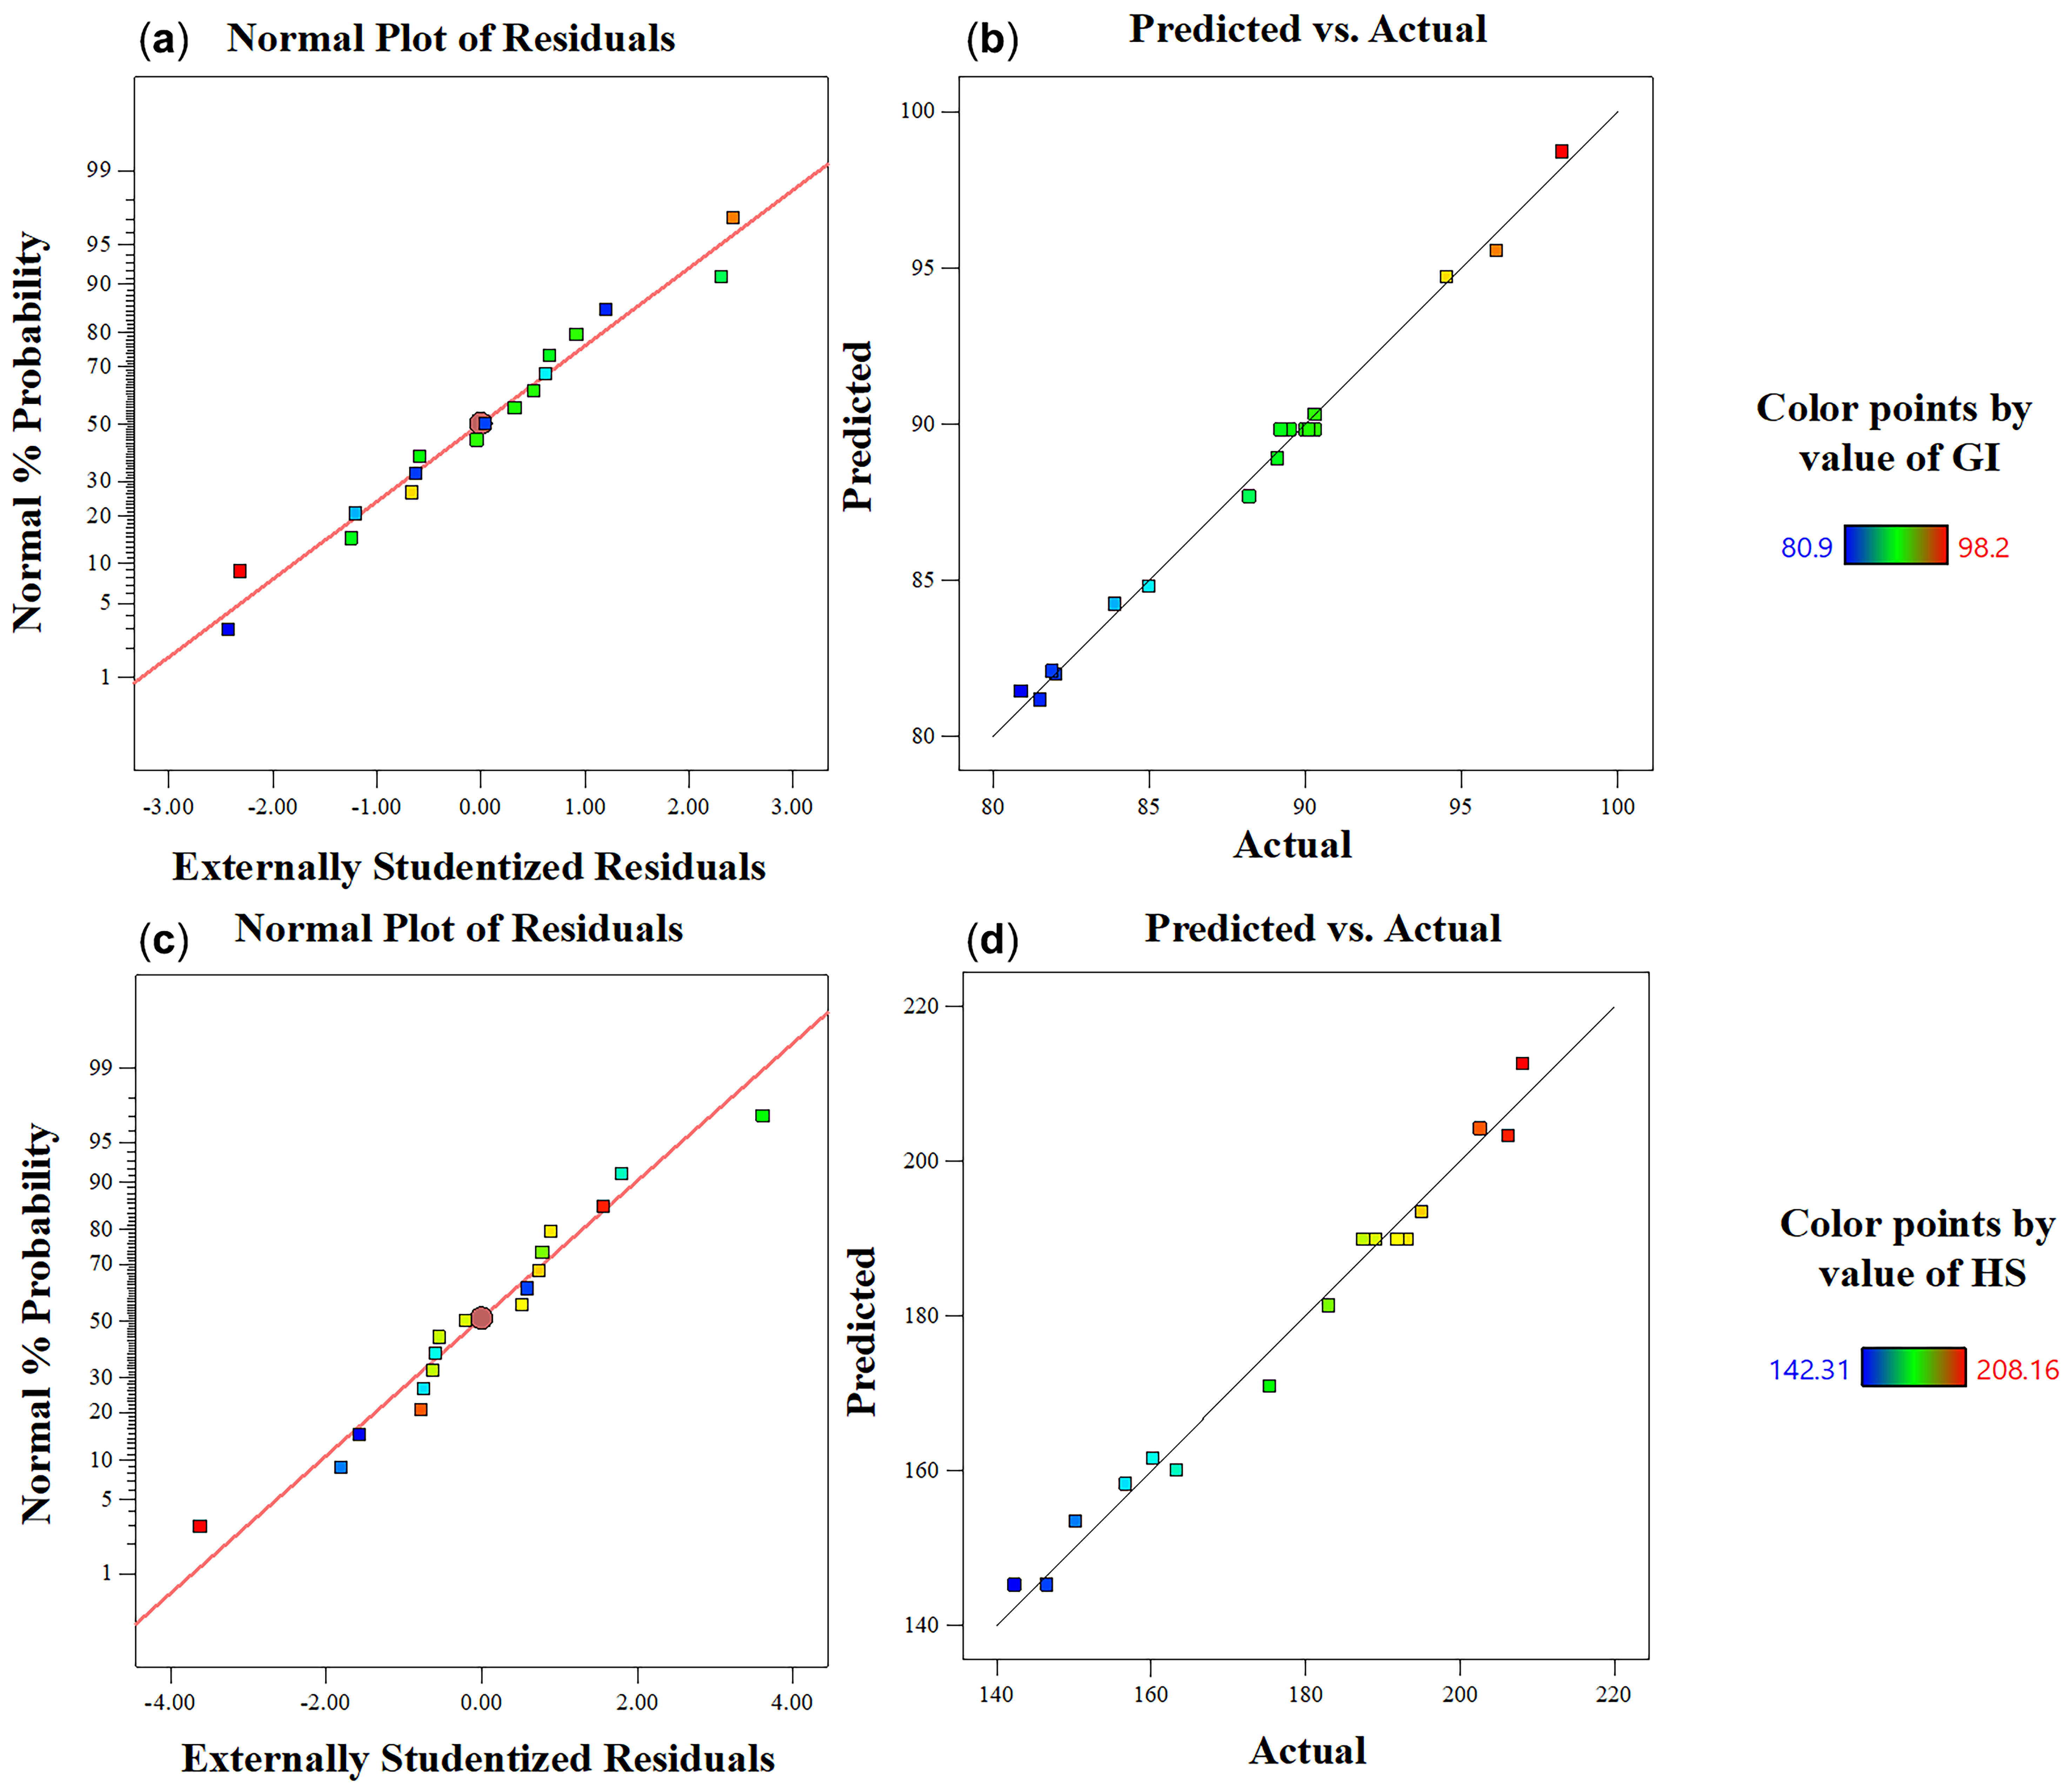
Table S1 presents the results of the response surface analysis of variance for GI. The coefficient of determination (R2 = 0.9945) indicates that 99.45% of the variation in GI was explained by changes in pipe design parameters. The model exhibited a high level of significance, with an F-value of 141.16 and a p-value of 0.0001, which was well below the conventional threshold of 0.05 (p < 0.01). The lack-of-fit p-value was 0.2056, exceeding 0.05, indicating that the lack of fit was not significant. These results confirmed a good model fit. The signal-to-noise ratio (S/N) of 39.6433, which exceeded 4, further validated the model reliability. The analysis of variance showed that the interaction between adjacent orifice spacing increment (X1) and pipe diameter (X3) was significant, while the interaction between pipe diameter (X3) and orifice diameter (X2) was not. The main effect contributions of pipe design parameters on GI followed the order: X3 (pipe diameter) > X1 (adjacent orifice spacing increment) > X2 (orifice diameter). As shown in Figure 3a, the residuals of GI followed a normal distribution, with all data points forming a linear arrangement. This indicated that the model satisfied the normality assumption. The regression coefficient between predicted and observed values was 0.9945, confirming the model’s predictive reliability. The scatter plot in Figure 3b shows that all data points closely aligned with the linear trend, further demonstrating the model applicability.
Figure 3.
(a) Normal distribution of GI; (b) the relationship between the predicted value and the actual value; (c) normal distribution of HS; (d) the relationship between the predicted value and the actual value.
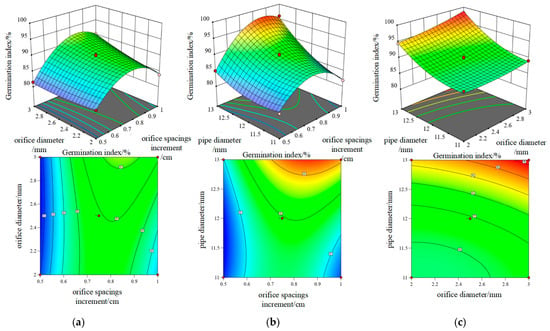
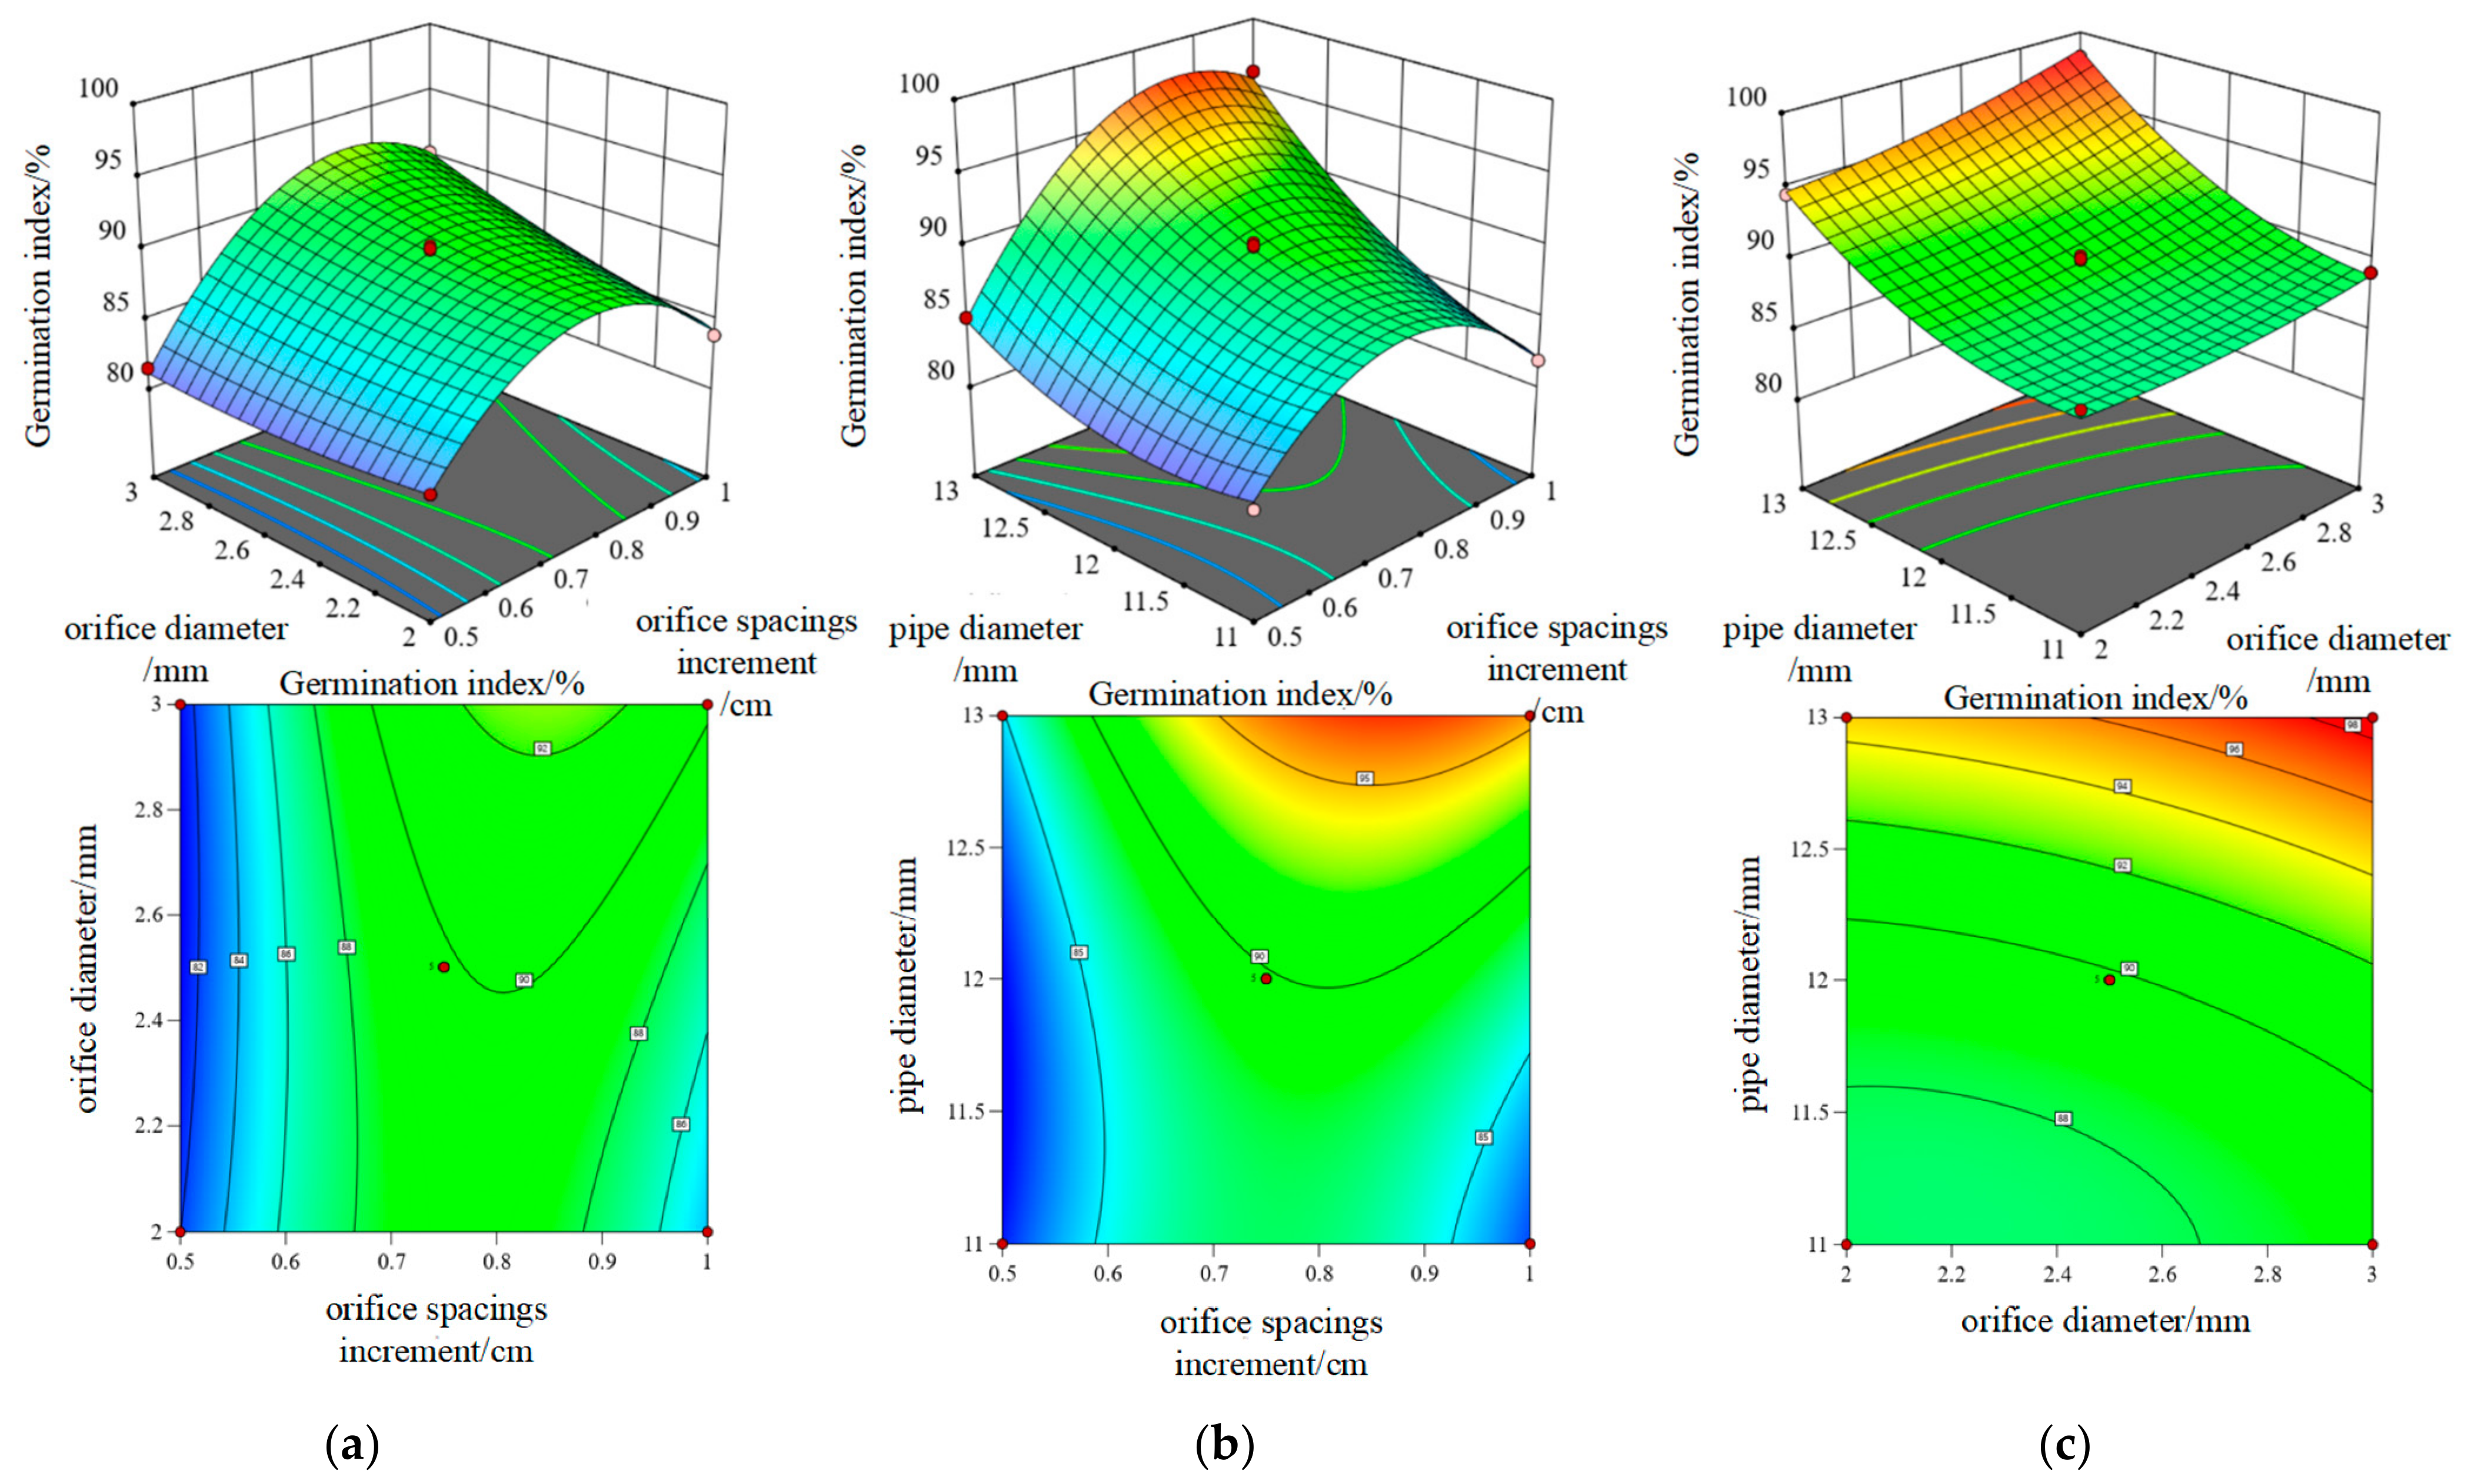
Moreover, Figure 4a,b show steep slopes and high contour curvature, while Figure 4c displays a shallower slope and lower curvature. GI values exhibited regular fluctuations in response to changes in pipe design parameters. The interaction analysis indicated that GI increased with pipe diameter and orifice diameter, although the effect of orifice diameter was relatively small. Meanwhile, as adjacent orifice spacing increment increased, GI first rose and then decreased. This trend likely results from uneven airflow distribution caused by the static-pressure recovery effect. The interaction between adjacent orifice spacing increment and pipe diameter had a highly significant effect on GI (p < 0.01). Based on the regression model, within the experimental parameter range, the theoretical maximum GI value was 98.30%, corresponding to the optimal parameter combination of X1 = 0.78 cm, X2 = 2.89 mm, and X3 = 12.94 mm.
Figure 4.
Response surfaces of adjacent orifice spacing increment, pipe diameter, orifice diameter and their interaction to GI. (a) the relationship between adjacent orifice spacing increment and orifice diameter; (b) the relationship between pipe diameter and adjacent orifice spacing increment; (c) the relationship between pipe diameter and orifice diameter.
- (2)
- RSM analysis of effects of pipe design parameters on HS. By performing multiple regression fitting on HS, the equation 7 for the response variable Y2 with respect to the independent variable adjacent orifice spacing increment (X1), orifice diameter (X2), and pipe diameter (X3) was obtained:
Table S2 presents the results of the analysis of variance for the HS response surface model. The coefficient of determination (R2 = 0.9842) indicates that 98.42% of the variation in HS is attributed to the influence of pipe design parameters. The model had an F-value of 48.54 and a p-value of 0.0001 (p < 0.01), indicating a highly significant effect. The lack of fit had a p-value of 0.0845 (p > 0.05), suggesting no significant lack of fitness and confirming the reliability of the model. The signal-to-noise ratio (S/N) was 21.56 (>4), further validating the model reliability. The interaction analysis shows that the interaction between adjacent orifice spacing increment (X1) and orifice diameter (X2) was the most significant (p < 0.05), while the interaction between pipe diameter (X3) and adjacent orifice spacing increment (X1) also reached a significant level (p < 0.05). The main effect contributions of pipe design parameters on HS followed the order: X3 (pipe diameter) > X1 (orifice spacing) > X2 (orifice diameter). As shown in Figure 3c, the residuals of HS followed a normal distribution, with all data points forming a linear arrangement, indicating that the model satisfied the normality assumption. The regression coefficient between predicted and observed values is 0.9842, confirming the reliability of the model. Figure 3d shows that all data points closely aligned along a linear trend, further demonstrating the model applicability.
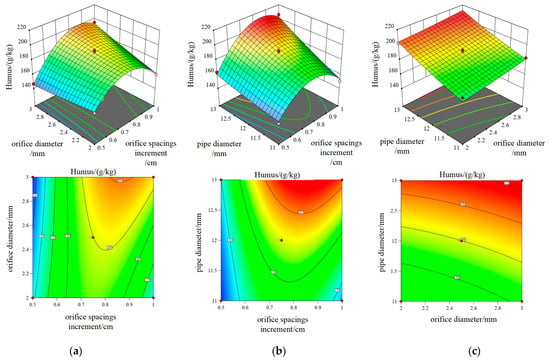
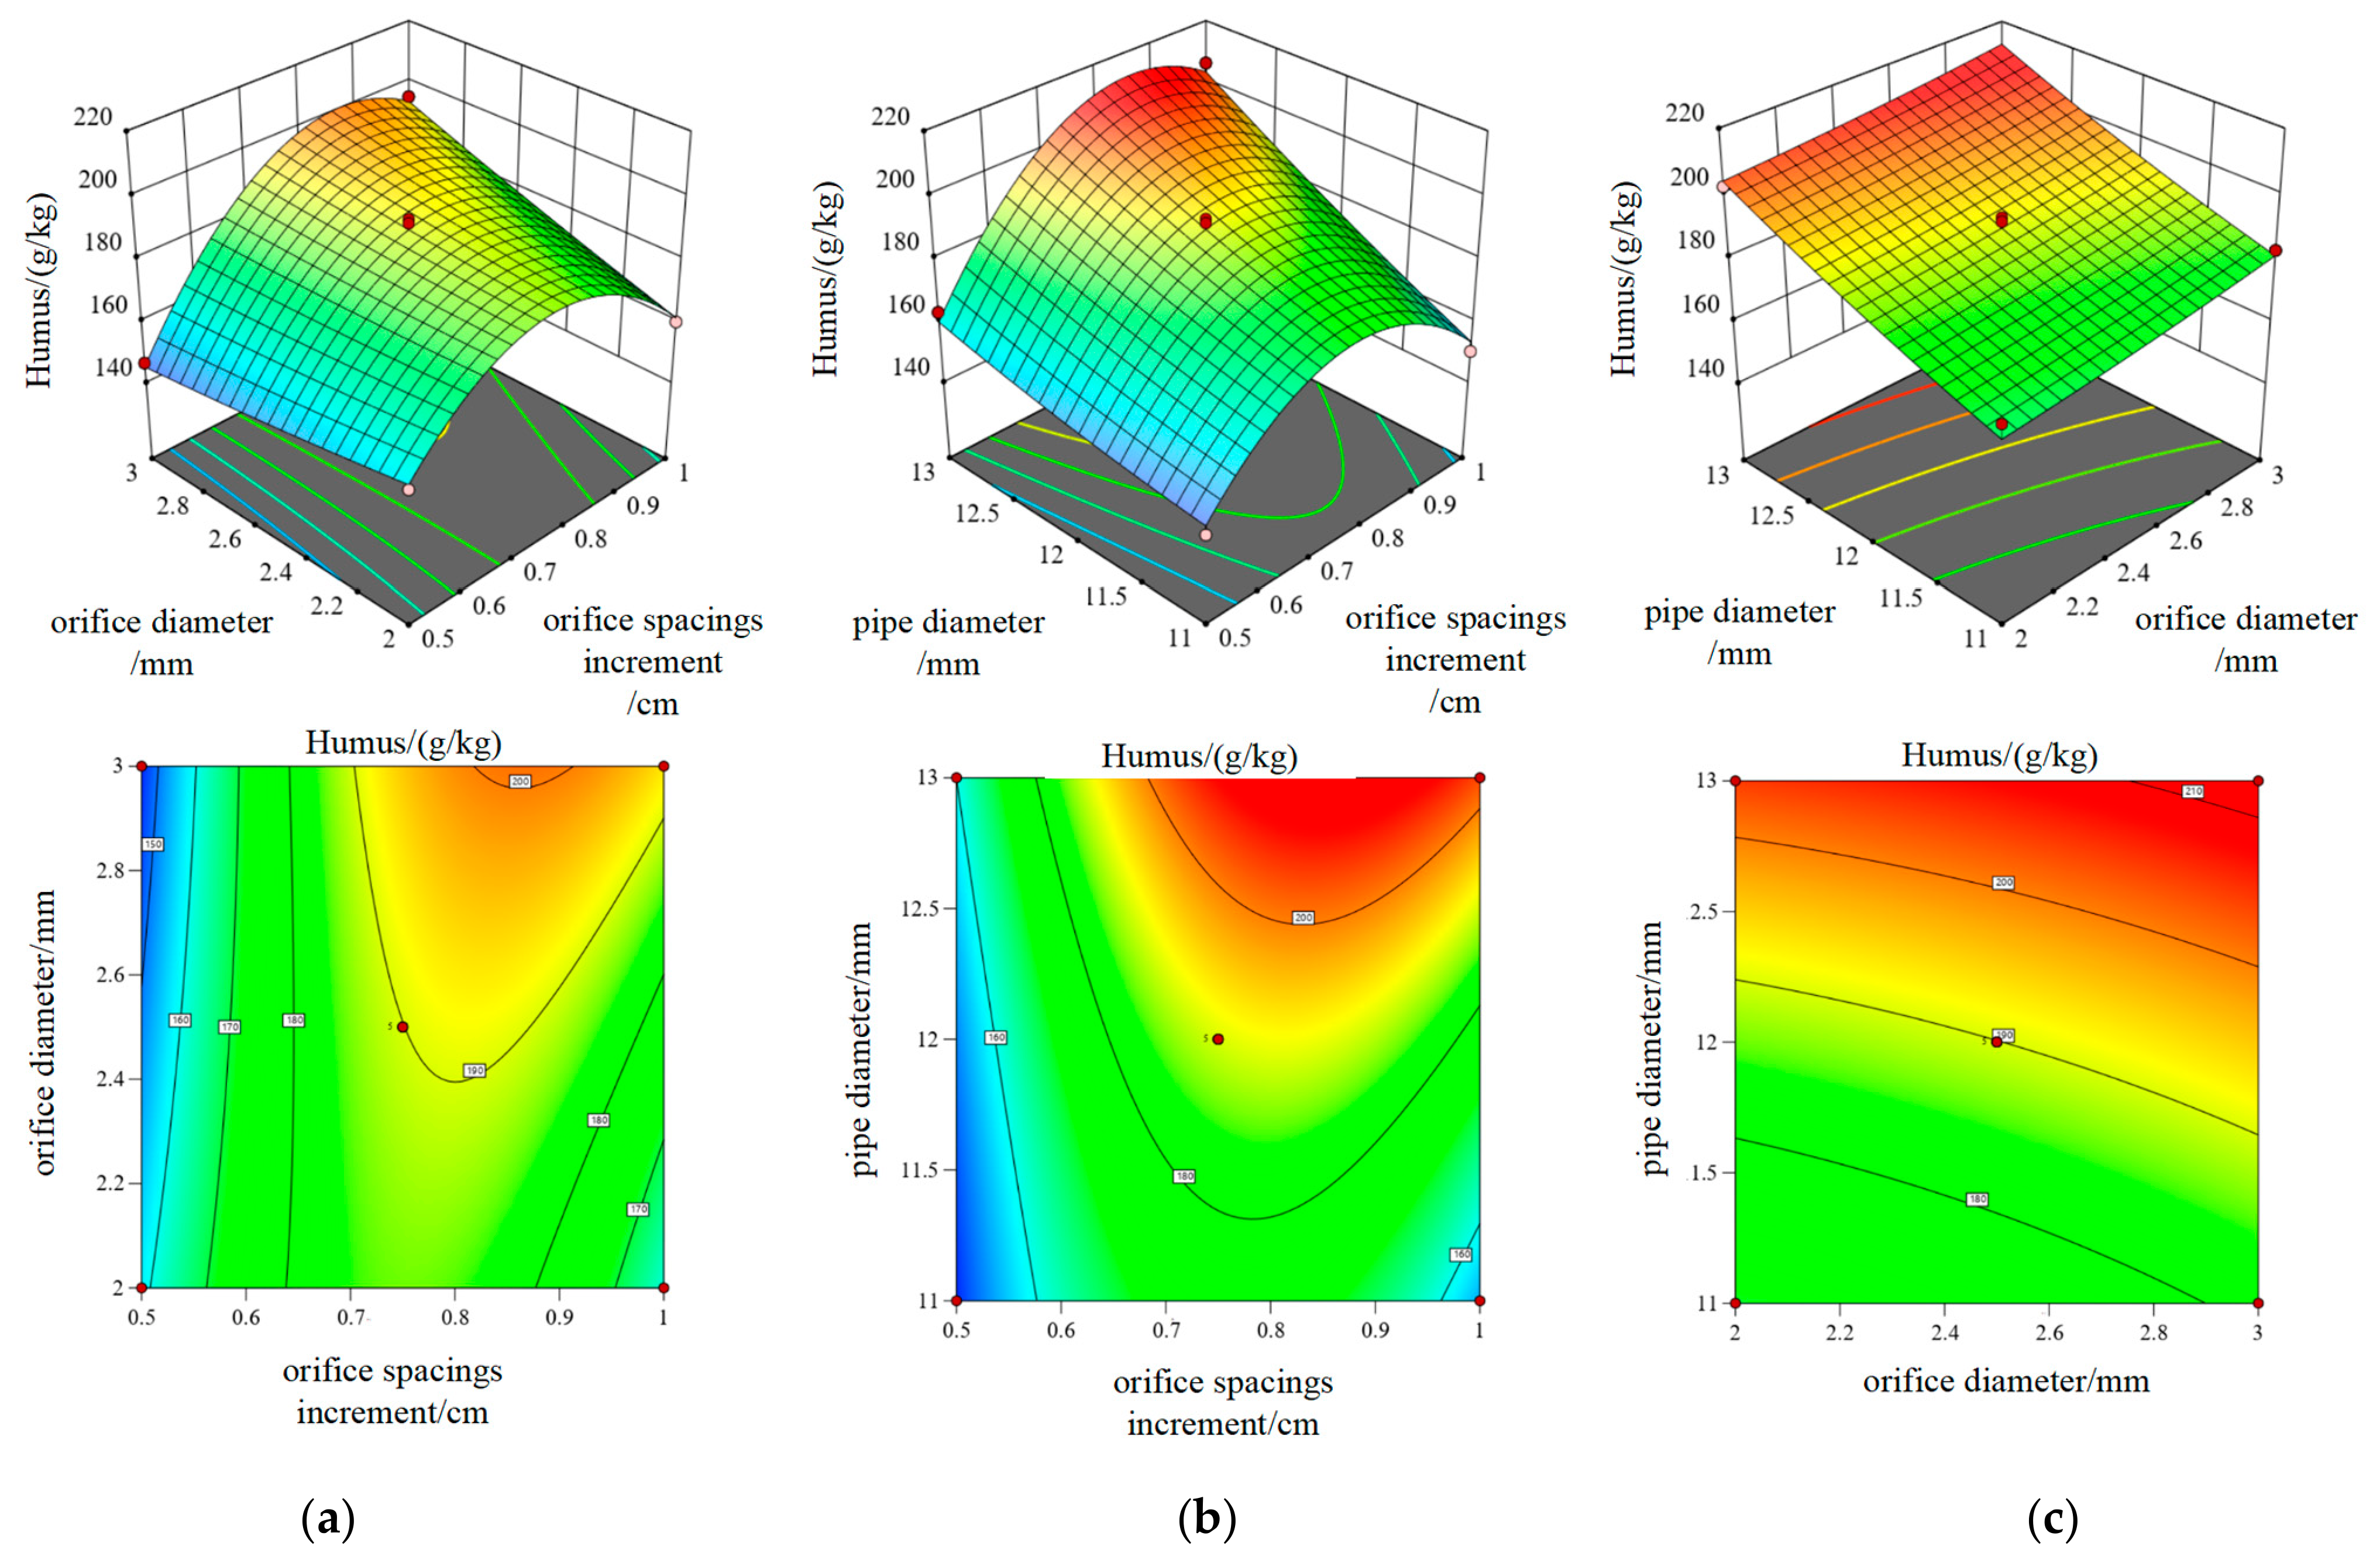
Figure 5a,b display steep slopes and high contour curvature, while Figure 5c displays a shallower slope and lower curvature. HS content fluctuated regularly in response to changes in pipe design parameters. The interaction analysis reveals that HS content decreased as orifice diameter increased when interacting with adjacent orifice spacing increment (Figure 5a). In the interaction between adjacent orifice spacing increment and pipe diameter, HS content increased as pipe diameter increased (Figure 5b). In the interaction between pipe diameter and orifice diameter, no significant interaction was detected at the adopted significance level (Figure 5c). Moreover, as adjacent orifice spacing increment increased, HS content for all interactions first increased and then decreased, which may be related to the static-pressure recovery phenomenon. The interactions between adjacent orifice spacing increment and orifice diameter, as well as between adjacent orifice spacing increment and pipe diameter, had significant effects on HS (p < 0.05). Based on the regression model, within the experimental parameter range, the theoretical maximum HS content was 208.205 g/kg, corresponding to the optimal parameter combination of X1 = 0.78 cm, X2 = 2.83 mm, and X3 = 12.71 mm.
Figure 5.
Response surfaces of adjacent orifice spacing increment, pipe diameter, orifice diameter and their interaction to HS. (a) the relationship between adjacent orifice spacing increment and orifice diameter; (b) the relationship between pipe diameter and adjacent orifice spacing increment; (c) the relationship between pipe diameter and orifice diameter.
3.3. CFD Analysis of Effect of Pipe Design Parameters on Ventilation Efficiency
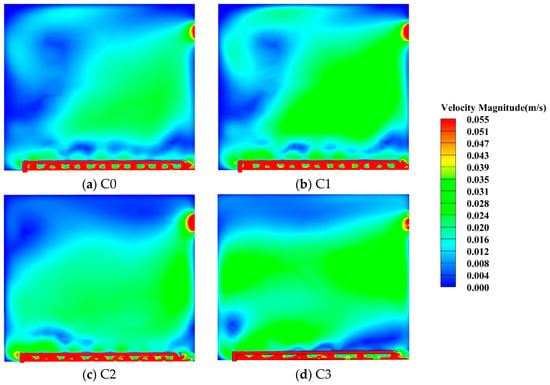
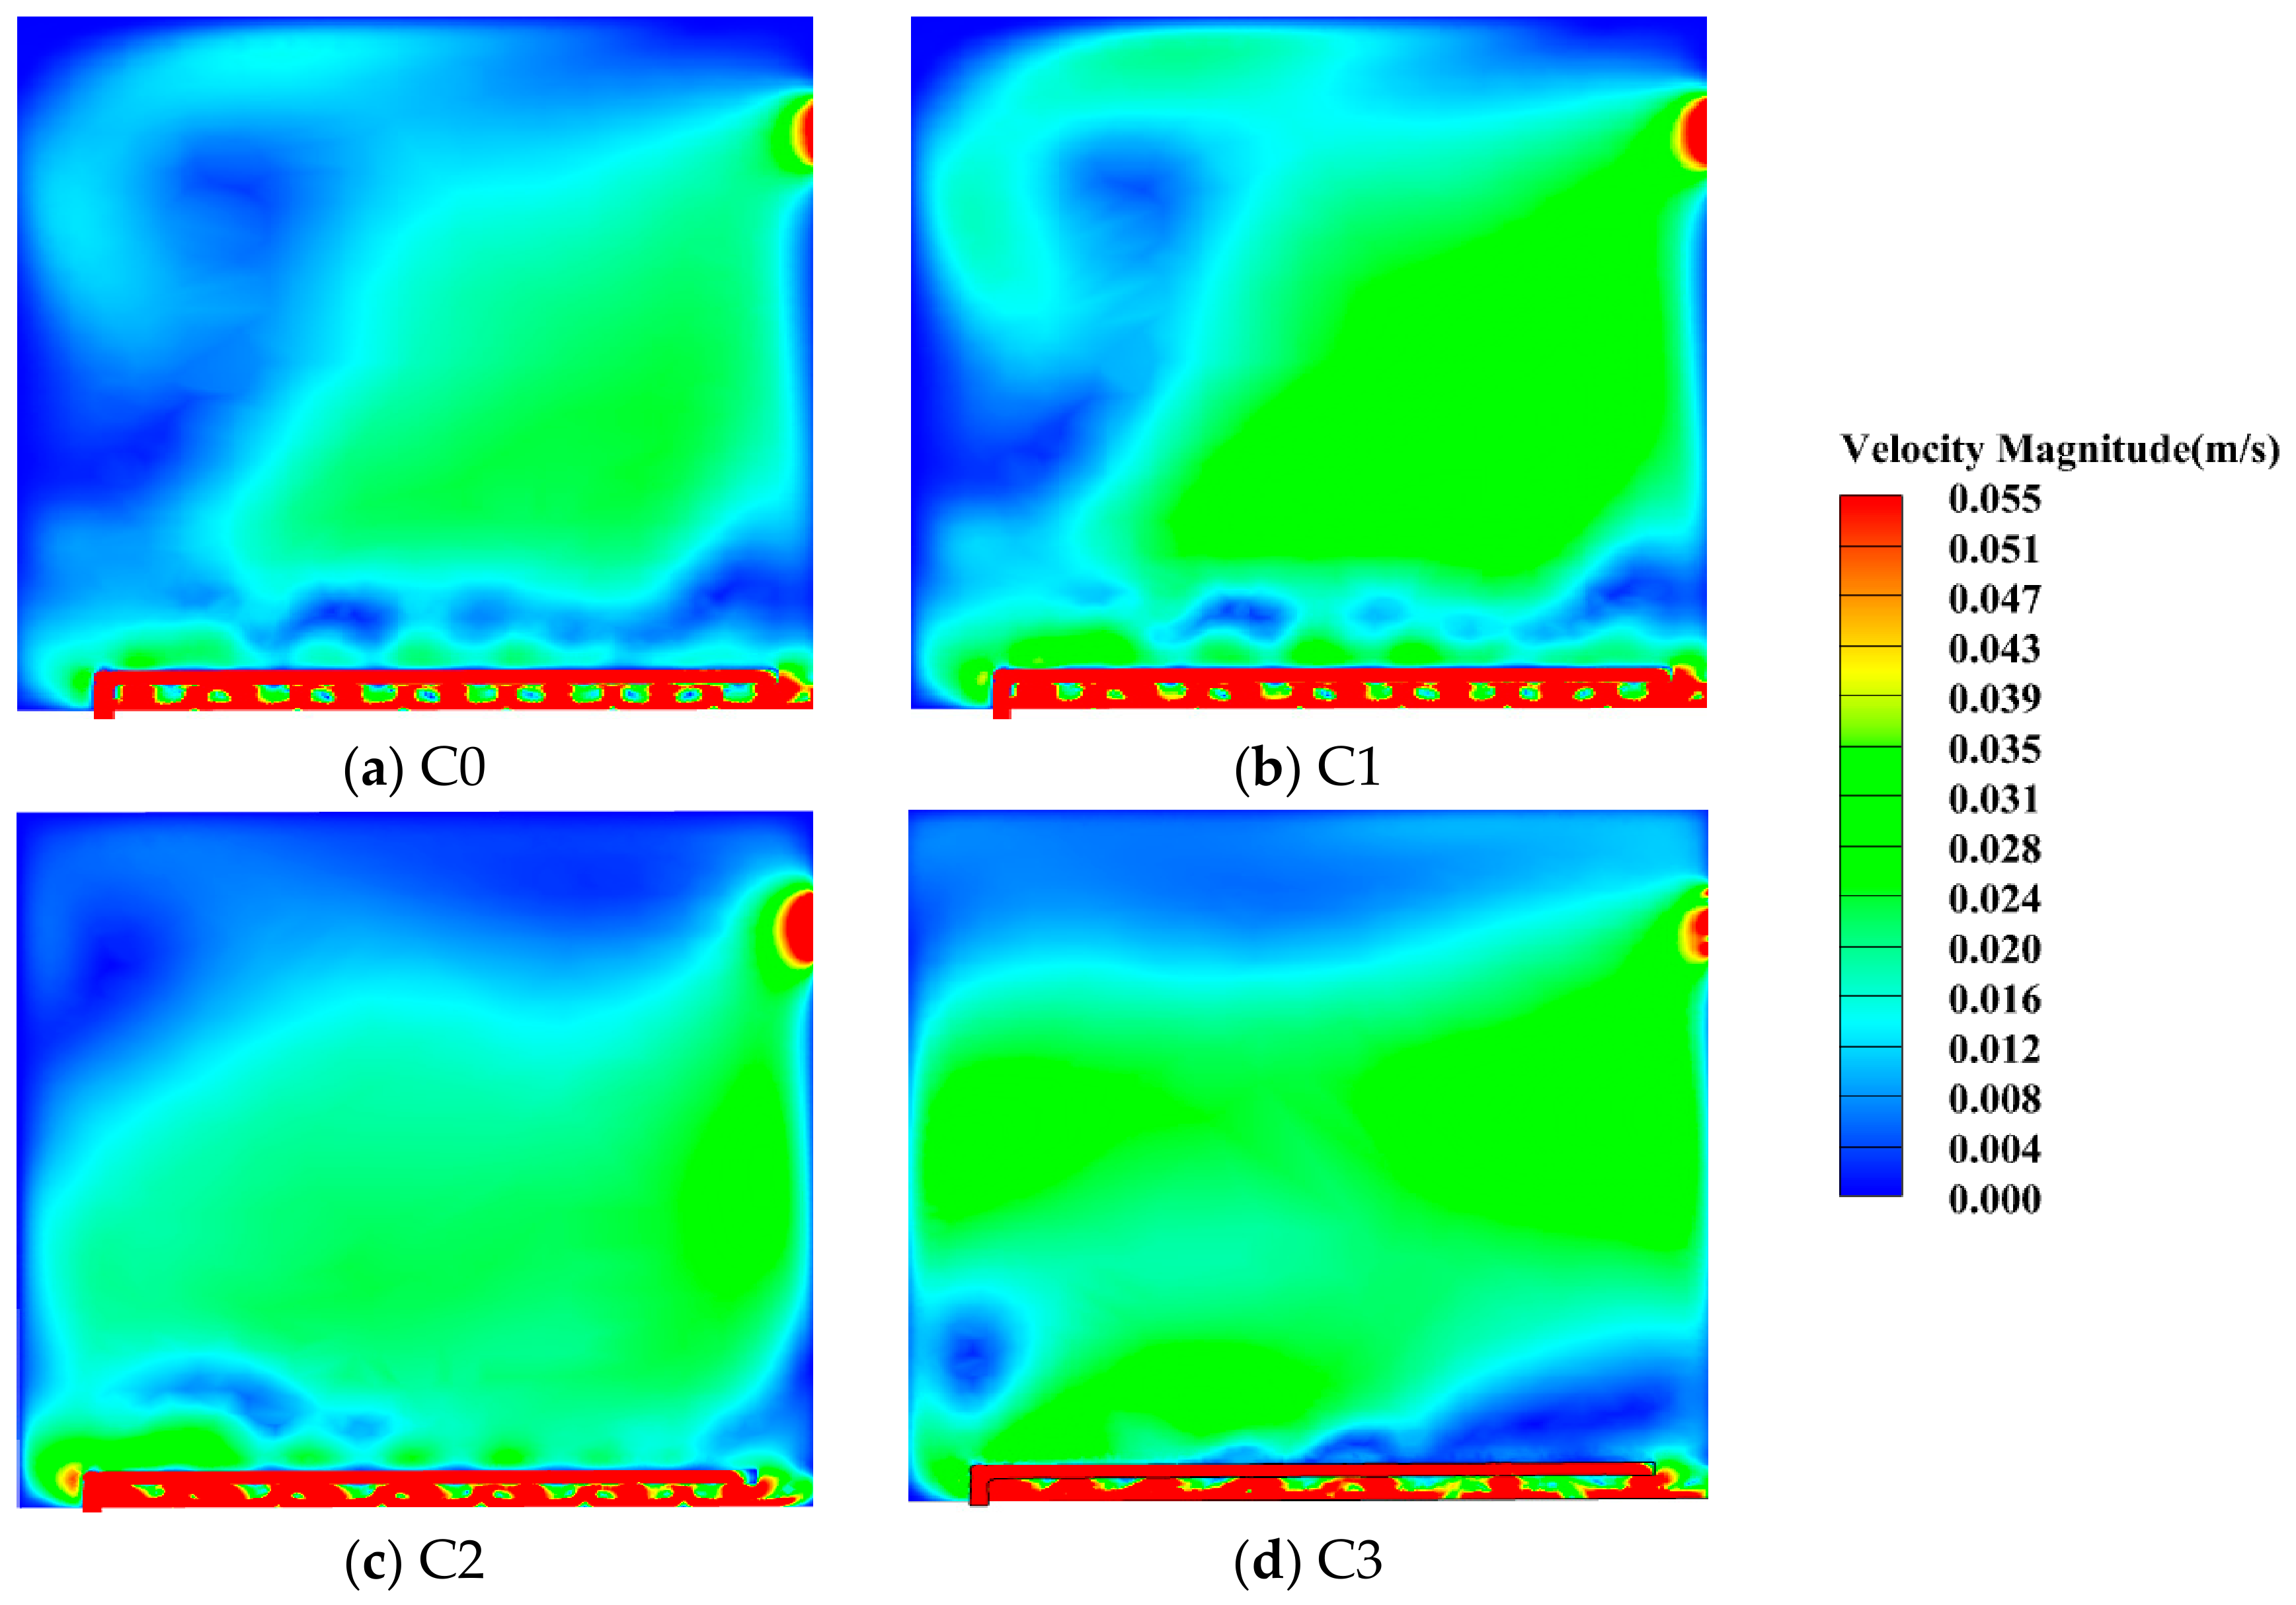
Figure 6 shows the airflow contour at plane X = 0.3 m. Under the C0 (Figure 6a) condition, a distinct poorly ventilated region was observed near the air inlet, while a recirculation region formed near the downstream end of the pipe. The high axial velocity near the inlet deflected the discharged air towards the pipe axis, limiting lateral airflow distribution, whereas downstream flow disturbances induced local recirculation. These conditions could restrict oxygen supply and inhibit aerobic degradation of organic matter. Adjusting the pipe design parameters (Figure 6b–d) increased upstream airflow velocity and decreased downstream velocity, reducing both regions. This improvement may reflect a better balance between frictional pressure losses and static-pressure recovery along the pipe, promoting more uniform discharge through the holes. Overall, the optimal parameter combination improved airflow uniformity within the compost pile.
Figure 6.
Velocity contours on the longitudinal section (X = 0.3 m) for different pipe parameters.
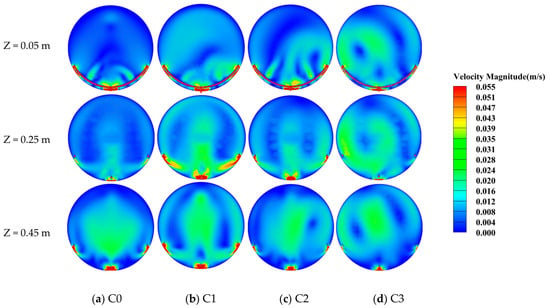
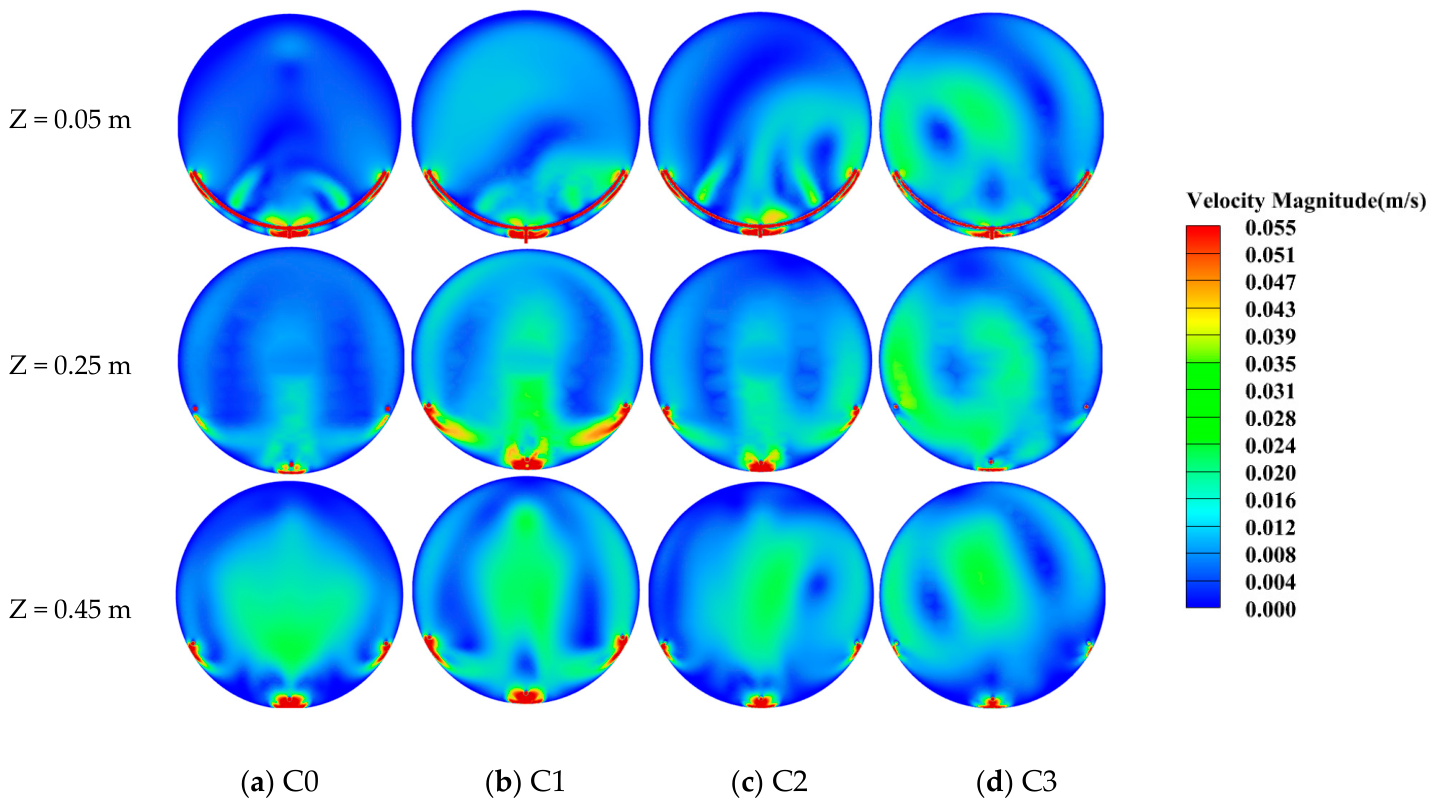
Figure 7 shows the velocity contours on three representative transverse sections (Z = 0.05, 0.25, and 0.45 m) for configurations C0–C3, shown in panels (a)–(d), respectively. Compared with C0, the average airflow velocities near the inlet increased by 16.2%, 24.9%, and 68.6% for C1, C2, and C3, respectively, while those at the downstream end decreased by 26.15%, 36.4%, and 56%. The relative velocity differences between the upstream and downstream ends decreased from 51.1% for C0 to 38.4%, 33.4%, and 33.3% for C1, C2, and C3, respectively. These findings were consistent with the RSM results, indicating that optimizing pipe design parameters improved airflow uniformity and could support more efficient composting.
Figure 7.
Velocity contours on three representative transverse sections (Z = 0.05, 0.25, and 0.45 m) for the four CFD configurations. Rows correspond to Z = 0.05, 0.25, and 0.45 m, and columns (a–d) correspond to C0–C3.
The coefficient of air speed variation (CASV) was adopted as the primary indicator of airflow uniformity. For each cross-section, , where si is the standard deviation of air speed on the cross-section (m/s), and is the corresponding area-weighted mean air speed (m/s). CASV is a dimensionless coefficient; when expressed as a percentage, it is multiplied by 100. A lower CASV indicates a more uniform airflow distribution [22].
Five cross-sections were selected at Z = 0.05, 0.15, 0.25, 0.35, and 0.45 m along the ventilation duct. The overall CASV was calculated as the arithmetic mean of the five sectional values: The overall CASV for all sections are listed in Table 5. The values are 7.08, 4.71, 4.59, and 3.16 for C0, C1, C2, and C3, respectively. Relative to C0, the optimized parameter combination reduced CASV by 55.37%, effectively diminishing poorly ventilated zones and improving airflow uniformity within the composting pile. However, this overall trend did not imply a monotonic decrease at every cross-section. At Z = 0.25 m, C2 showed a higher sectional CASV (5.36) than C1 (4.28), likely owing to stronger local jet interaction, momentum superposition and flow redistribution. This local reversal does not alter the overall trend that C3 provided the most uniform airflow distribution.
Table 5.
CASV of five cross-sections in rotary drum compost reactor.
3.4. The Selection of Optimal Pipe Design Parameters
Airflow distribution affects oxygen availability within the compost pile and thus compost maturation. In this study, ANOVA and RSM were used to optimize aeration pipe design parameters, while CFD simulations characterized airflow distribution throughout the pile. This combined approach strengthened parameter optimization and helped explain how aeration conditions affect compost maturation.
- (1)
- Optimization analysis of GI and HS
The quadratic regression model for Y1 predicted a maximum GI of 98.30% at an adjacent orifice spacing increment (X1) of 0.78 cm, an orifice diameter (X2) of 2.89 mm, and a pipe diameter (X3) of 12.94 mm. This predicted GI suggests reduced phytotoxicity and improved compost maturity, potentially associated with the degradation of organic acids and phenolic compounds. The resulting compost satisfies the requirements of the Technical Specification for Livestock and Poultry Manure Composting (GB/T 25246–2010), indicating effective sanitation and resource utilization potential. For Y2, the model predicted a maximum HS content of 208.21 g/kg at X1 = 0.78 cm, X2 = 2.83 mm, and X3 = 12.71 mm.
The optimized configuration C3 was subsequently tested to verify the reliability of the RSM predictions. The predicted GI and HS values were 98.30% and 208.21 g/kg, whereas the measured final values were 99.56% and 209.96 g/kg. The differences were 1.26% and 1.75 g/kg, respectively, indicating that the RSM models provided reliable predictions for the optimized aeration-pipe design.
This parameter combination improved humification within the compost pile, promoting the formation of humic substances. The resulting accumulation of humic fractions may enhance nutrient retention and increase the potential of the compost for use as a soil amendment.
- (2)
- Optimization analysis of airflow distribution
Using RSM, four aeration-pipe configurations were sequentially selected based on composting performance indicators to investigate airflow distribution within the compost pile. The results showed that the proportion of low-velocity regions decreased markedly with parameter optimization. The highest airflow uniformity index was obtained at an adjacent orifice spacing increment (X1) of 0.78 cm, an orifice diameter (X2) of 2.83 mm, and a pipe diameter (X3) of 12.71 mm. This configuration reduced poorly ventilated regions and could limit moisture loss associated with excessive local airflow, helping maintain a stable microenvironment for microbial activity. Agreement between the RSM predictions and experimental humification results supported the reliability of the optimization, while the airflow analysis demonstrated improved distribution uniformity. Together, these findings support the effectiveness of the optimized pipe design in improving aeration and compost quality.
- (3)
- Comprehensive selection of ventilation parameters
The optimal design was determined by integrating single-indicator RSM optimization with CFD verification. The parameter combinations maximizing GI (0.78 cm, 2.89 mm, 12.94 mm) and HS (0.78 cm, 2.83 mm, 12.71 mm) were similar. For the final selection, GI was used as a maturity threshold, while HS was maximized. The HS-optimal combination was therefore selected because it satisfied the GI threshold while maximizing HS content. This configuration (C3) also yielded the lowest CASV (3.16) in the CFD comparison, versus 7.08, 4.71, and 4.59 for C0, C1, and C2, respectively, indicating the most uniform airflow distribution among the four configurations. Thus, within the investigated parameter range and operating conditions, the recommended design comprised an orifice spacing of 0.78 cm, an orifice diameter of 2.83 mm, and a pipe diameter of 12.71 mm.
This parameter combination yielded a GI above the required maturity threshold, indicating reduced phytotoxicity. Moreover, the optimized configuration achieved the highest HS content, which may enhance nutrient retention and the value of the compost as a soil amendment. These findings provide a basis for designing and optimizing aeration systems for large-scale composting, although their performance at this scale requires further validation.
3.5. The Effect of Optimal Pipe Design Parameters on Compost Efficiency
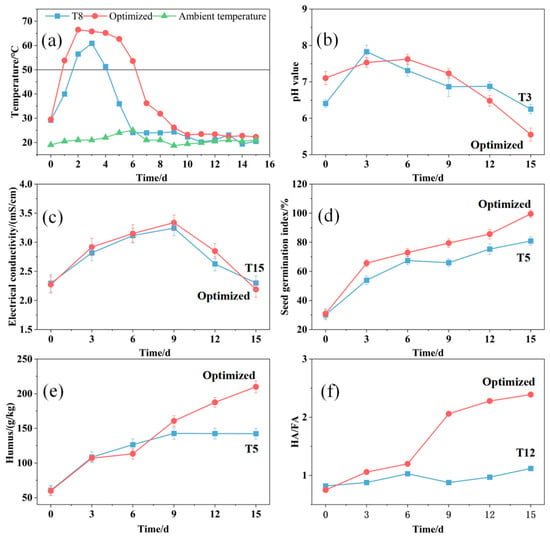
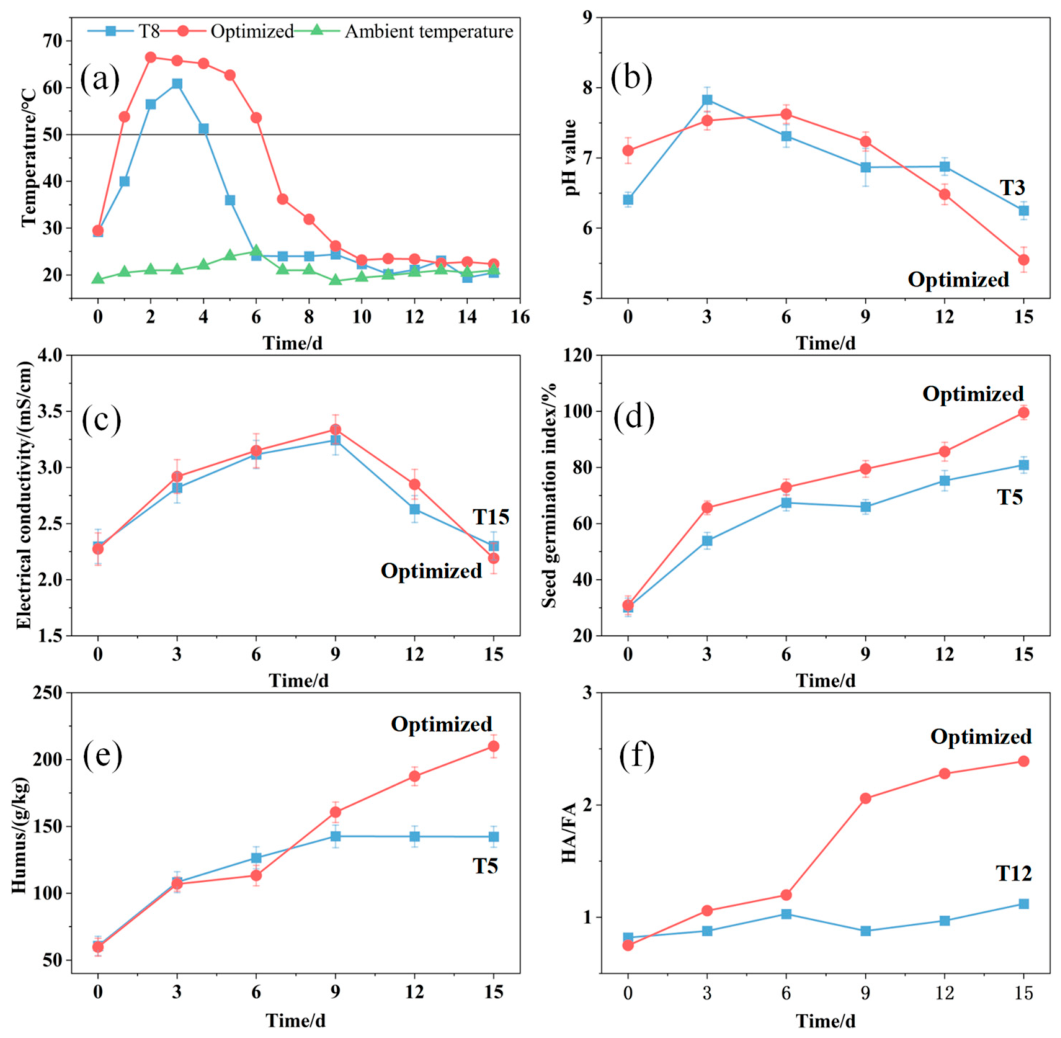
For clarity, Figure 8 shows only the optimized treatment C3 and a representative comparison treatment for each indicator. The complete time courses for all 18 treatments are provided in Supplementary Figure S1. Temperature is a critical parameter regulating microbial activity and driving compost maturation [30]. As shown in Figure 8a, the pile temperature initially increased and then declined. All treatments exceeded 55 °C during composting, which contributed to effective pathogen reduction [31]. Treatments T3, T4, T9, T10, T12, T13, T14, T15, T16, T17, and optimized reached their peak temperatures on day 2, at 61.5, 64.5, 64.1, 63.6, 63.8, 63.6, 63.4, 63.7, 63.6, 63.5, and 66.5 °C, respectively. Treatments T1, T2, T5, T6, T7, T8, and T11 peaked on day 3, at 62.1, 62.8, 62.8, 63, 65.4, 60.9, and 64.8 °C. Compared with the other 17 treatments, C3 achieved the highest peak temperature, with a maximum increase of 5.6 °C. The duration of the thermophilic phase also affects compost maturity. All treatments except T2, T3, T5, T6, and T8 maintained temperatures above 55 °C for 5 days. This variation may be attributed to differences in airflow distribution associated with aeration pipe design, which affected microbial activity and heat retention within the compost matrix [32]. These results suggest that optimizing aeration pipe parameters can improve aeration and promote heat accumulation during composting.
Figure 8.
Changes in (a) temperature, (b) pH, (c) EC, (d) GI, (e) HS, and (f) HA/FA during composting for the optimized treatment (C3) and a representative contrast treatment for each indicator (T8 for temperature, T3 for pH, T15 for EC, T5 for GI, T5 for HS, and T12 for HA/FA).
Appropriate pH conditions are essential for microbial growth and metabolism during composting. As shown in Figure 8b, the pH values of all treatments initially increased and then decreased. The initial increase was associated with ammonification during rapid organic matter decomposition, leading to ammonia and ammonium accumulation [33]. During the cooling stage, the decline in pH may be attributed to nitrification and ammonia volatilization [1]. The optimized treatment C3 showed the greatest decrease, with the pH dropping from 7.11 to 5.55, a reduction of 21.8%. T3 showed the smallest decrease, with the pH dropping from 6.40 to 6.25, a reduction of only 2.3%. At the end of composting, the pH values of all treatments ranged from 5.5 to 6.5, indicating a slightly acidic to neutral environment and satisfying the maturity requirements specified in technical specification for animal manure composting (NY/T 3442–2019).
EC reflects the soluble salt content of compost and provides useful information for assessing compost quality [34]. As shown in Figure 8c, EC initially increased and then decreased during composting. The initial increase was associated with the microbial decomposition of organic matter, which released soluble ions and generated intermediate metabolites, including organic acids and phosphate-containing compounds [23]. After day 9, EC declined noticeably, possibly due to microbial assimilation of soluble nutrients and their incorporation into more stable organic fractions during humification [23]. Before and after composting, treatments T1, T2, T3, T4, T5, T6, T7, T8, and T15 generally showed an upward trend, possibly due to differences in ventilation pipe design parameters that influenced microbial transformation efficiency and soluble nutrient conversion. At the end of composting, the EC values of all treatments were below 4.0 mS/cm, meeting the relevant national standards.
GI is widely used as an indicator of phytotoxicity and compost maturity, with higher values indicating lower phytotoxicity and greater maturity [35]. As shown in Figure 8d, GI increased in all treatments and exceeded 70% by day 12, satisfying the GI criterion specified in the Technical Specification for Livestock and Poultry Manure Composting (NY/T 3442–2019). In the optimized treatment C3, GI increased from 30.9% to 99.56%, a rise of 68.66 percentage points. These results suggest that optimizing aeration pipe parameters promoted the reduction in phytotoxicity and improved compost maturity.
HS are key indicators for evaluating compost maturity and humification degree [36,37]. During composting, degradation products derived from organic polymers can react with nitrogen-containing compounds to form humus precursors, thereby promoting humification processes [38]. As shown in Figure 8e, HS content generally increased throughout the composting process. T5 showed the smallest increase, from 60.5 to 146.60 g/kg, whereas the optimized configuration C3 exhibited the largest increase, from 59.7 to 209.96 g/kg. At the end of composting, the optimized treatment exhibited the highest HS content, with an increase of up to 63.36 g/kg compared with the other treatments. These findings indicated that optimized aeration pipe parameters enhanced the transformation of organic substrates into humus precursors and promoted HS formation.
HA/FA ratio is an important indicator for evaluating compost maturity and humification degree [39]. As shown in Figure 8f, the HA/FA ratio generally increased during composting. This increase was mainly attributed to the conversion of relatively unstable FA fractions into HA through condensation and polymerization reactions, contributing to the formation of more stable and complex humus [40]. At the end of composting, C3 had the highest HA/FA ratio (2.39), while T12 had the lowest value (1.12). These results suggest that optimizing aeration pipe design parameters promoted humification and increased the relative proportion of HA in HS.
4. Discussion
This study established a multi-parameter synergistic optimization framework for aeration-pipe design in composting systems. The optimized configuration C3, characterized by a 0.78 cm spacing increment, 2.83 mm orifice diameter and 12.71 mm pipe diameter, reduced the average CASV by 55.37% relative to C0. Relative to the 17 BBD experimental runs, C3 showed maximum observed increases of 5.6 °C in peak temperature, 18.66 percentage points in final GI and 63.36 g/kg in final HS, with a 1.27 increase in HA/FA. These concomitant improvements confirm that simultaneous multi-parameter optimization outperforms single-parameter strategies, extending our previous single-factor work on orifice spacing [7] and auxiliary deflectors [23], and demonstrate that spatial airflow uniformity is a key determinant of aerobic fermentation efficiency and humification.
The improvements in compost maturity may be related to the cascade from airflow uniformity to oxygen mass transfer, microbial activity and humification. The 55.37% reduction in average CASV for configuration C3 relative to C0 indicates lower oxygen spatial heterogeneity, which may improve oxygen mass transfer efficiency, consistent with Lu et al. [41]. Uniform oxygen distribution may increase aerobic microbial activity. This may accelerate phytotoxic compound degradation and provide more humus precursors via intensified lignocellulose decomposition. During humification, thermotolerant actinomycetes may accelerate lignocellulose degradation and humus synthesis under aerobic conditions, whereas oxygen-deficient zones could favor anaerobic metabolism. The 1.27 increase in HA/FA likely reflects enhanced fulvic-to-humic acid conversion. These mechanisms are possibly associated with aeration-driven aerobic metabolism and humification, as also reported by Shi et al. [23]. The optimized aeration distribution reduces oxygen-limited zones in the pile, promoting aerobic microbial activity and accelerating organic matter degradation. This allows the compost to reach maturity faster and shorten the overall composting duration.
The pronounced pH decline in C3 (from 7.11 to 5.55) is primarily attributed to intensive nitrification under well-aerated conditions. High nitrifying activity converts ammonium to nitrate and releases protons. Residual volatile fatty acids from incomplete degradation of labile organic matter may further contribute protons through dissociation. The cattle manure and maize straw mixture has limited calcium and magnesium buffering capacity, so the generated protons were not fully neutralized, resulting in the mildly acidic final pH, which remains within the maturity threshold specified by NY/T 3442–2019.
Several limitations of this study should be acknowledged. First, all CFD simulations were performed under steady-state assumptions. The dynamic evolution of pile porosity, moisture content and temperature throughout the composting process was not incorporated into the model, thereby precluding the capture of time-dependent airflow redistribution. Second, the viscous and inertial resistance coefficients were held constant throughout the simulation. In practice, microbial degradation and moisture loss gradually reduce substrate volume, which in turn alters bulk density, porosity and flow resistance. Holding these parameters fixed therefore disregards the time-dependent resistance of the pile and may bias the predicted pressure drop and velocity field. Third, the compost pile was simplified as a homogeneous porous medium. This assumption did not explicitly represent spatial heterogeneity in particle packing, porosity, moisture distribution, compaction, settlement, preferential flow or local ventilation dead zones. Fourth, experiments and simulations were restricted to a laboratory-scale reactor (0.6 m × 0.5 m). Scale-up involves longer pipelines, deeper piles and greater compaction, all of which alter frictional loss, static-pressure recovery and pile resistance. As a result, the absolute optimal parameter values obtained herein cannot be directly extrapolated to full-scale engineering systems. Fifth, the sealed drum reactor prevented point-wise measurement of the internal airflow field. Consequently, the measured temperature, physicochemical properties and compost maturity indicators provide only indirect support for the CFD results, rather than direct experimental validation of the simulated airflow field.
To address these limitations, transient CFD models coupled with time-varying and spatially heterogeneous pile properties should be developed to reproduce the dynamic aeration behavior of actual composting processes. Additionally, pilot-scale experiments integrated with multi-scale CFD simulations are required to quantify scale-up effects and establish transferable design principles. Furthermore, transparent test rigs combined with optical measurement techniques can provide the point-wise airflow data needed to validate and refine the numerical framework.
In summary, the four aeration-pipe configurations exhibited pronounced disparities in airflow distribution and composting performance. Configuration C3 attained the optimal overall performance, with an average CASV 55.37% lower than that of C0. It also yielded the highest-quality compost, characterized by a peak temperature 5.6 °C higher, a GI of 99.56%, an HS increment of 63.36 g/kg and a 1.27 increase in the HA/FA ratio. These findings substantiate that uniform airflow enhances aerobic fermentation and humification, thereby fulfilling the research objective and furnishing a theoretical foundation for aeration-pipe optimization in high-quality composting.
5. Conclusions
- (1)
- The structural parameters of aeration pipes significantly influenced compost maturity indicators (GI and HS), while the significance of the interaction terms differed among response variables.
- (2)
- Within the investigated reactor scale and operating conditions, the optimized configuration C3, characterized by a 0.78 cm spacing increment, a 2.83 mm orifice diameter and a 12.71 mm pipe diameter, achieved the highest overall performance. The average CASV decreased by 55.37% relative to C0, and HS increased by 63.36 g/kg, with higher GI and HA/FA. C3 is therefore the recommended aeration-pipe design within these conditions.
- (3)
- Among the investigated structural parameters, pipe diameter exhibited the greatest influence on composting performance, followed by adjacent orifice spacing increment and orifice diameter.
- (4)
- The optimized aeration configuration increased the composting temperature by 5.6 °C, improved GI by 18.66%, and increased the HA/FA ratio by 1.27, indicating enhanced humification and improved compost maturity.
- (5)
- The optimized design shortens composting time and reduces aeration energy consumption, yielding mature compost suitable for land application as a soil amendment. The reported performance is based on a laboratory-scale reactor under homogeneous porous medium assumptions and provides a basis for engineering design, although direct extrapolation to industrial composting windrows should be avoided. Scale-up warrants further investigation of flow distribution and pressure loss in extended piping networks.
Supplementary Materials
The following supporting information can be downloaded at: https://www.mdpi.com/article/10.3390/agriculture16212388/s1, Table S1: ANOVA table for the quadratic model of GI; Table S2: ANOVA table for the quadratic model of HS; Table S3: Test results table; Figure S1: Effects of ventilation pipe design parameters on (a) temperature, (b) pH, (c) EC, (d) GI, (e) HS, and (f) HA/FA during composting.
Author Contributions
B.S.: Writing—original draft, visualization, methodology, formal analysis, data curation, conceptualization. H.W.: Writing—original draft, visualization, methodology, formal analysis, data curation, conceptualization. D.Z.: Writing—review and editing, supervision, project administration, conceptualization. Y.J.: Writing—review and editing, methodology. Q.C.: Writing—review and editing, validation, software, methodology, investigation, funding acquisition, conceptualization. J.D.: Writing—review and editing, data curation. H.Z.: Writing—review and editing, supervision, resources, methodology, investigation. P.X.: Writing—review and editing, investigation. H.C.: Writing—review and editing, investigation. J.Y.: Writing—review and editing, data curation. All authors have read and agreed to the published version of the manuscript.
Funding
National Key Research and Development Program of China (2025YFD1700103); Key International S&T Cooperation Project of P. R. China (2025YFE0119400); National Natural Science Foundation of China (No.32573290); National Key Laboratory of Animal Nutrition and Feeding (2004DA125184G2616).
Data Availability Statement
The data presented in this study are available on request from the corresponding author due to the large volume of raw CFD simulation data, which exceeds the storage capacity of standard public repositories.
Acknowledgments
The authors would like to thank the following institutions for providing essential technical support for this study. 1 State Key Laboratory of Animal Nutrition and Feeding, Institute of Animal Science, Chinese Academy of Agricultural Sciences, Beijing 100193, China; 2 Academy of Agricultural Planning and Engineering, Key Laboratory of Technologies and Models for Cyclic Utilization from Agricultural Resources, Ministry of Agriculture and Rural Affairs, Beijing 100125, China; 3 School of Mechanical Engineering, Yanshan University, Qinhuangdao 066004, China.
Conflicts of Interest
The authors declare no conflicts of interest. The data providers had no role in the design of the study; in the collection, analyses, or interpretation of data; in the writing of the manuscript; or in the decision to publish the results.
Abbreviations
The following abbreviations are used in this manuscript:
| CFD | Computational Fluid Dynamics |
| BBD | Box–Behnken design |
| RSM | Response Surface Methodology |
| GI | Germination Index |
| HS | Humus |
| HA | Humic acid |
| FA | Fulvic acid |
| CASV | Coefficient of air speed variation |
References
- Wang, L.; Wang, T.; Xing, Z.; Zhang, Q.; Niu, X.; Yu, Y.; Teng, Z.; Chen, J. Enhanced lignocellulose degradation and composts fertility of cattle manure and wheat straw composting by Bacillus inoculation. J. Environ. Chem. Eng. 2023, 11, 109940. [Google Scholar] [CrossRef] [Scilit]
- Su, L.; Ren, K.; Zhang, Y.; Zhang, L. Research on the composting technology of cattle and sheep manure based on intelligent and efficient composting equipment and the evaluation standard of decomposition degree. Fermentation 2024, 10, 328. [Google Scholar] [CrossRef] [Scilit]
- Bi, W.; Butardo, V.; Sha, G.; Zhang, H.; Wu, X.; Wang, L. Microbial degradation and pollutant control in aerobic composting and anaerobic digestion of organic wastes: A review. Waste Manag. 2025, 204, 114894. [Google Scholar] [CrossRef] [Scilit] [PubMed]
- Raphe, P.; Fellouah, H.; Poncet, S.; Ameur, M. Ventilation effectiveness of uniform and non-uniform perforated duct diffusers at office room. Build. Environ. 2021, 204, 108118. [Google Scholar] [CrossRef] [Scilit]
- Cao, M.; Yang, R.; Choi, C.Y.; Rong, L.; Zhang, G.; Wang, K.; Wang, X. Effects of discharge angle of jet from a slot orifice on cooling performance for a perforated air ducting system in dairy cattle barn. Comput. Electron. Agric. 2023, 210, 107890. [Google Scholar] [CrossRef] [Scilit]
- Yeo, U.-H.; Lee, I.-B.; Kim, R.-W.; Lee, S.-Y.; Kim, J.-G. Computational fluid dynamics evaluation of pig house ventilation systems for improving the internal rearing environment. Biosyst. Eng. 2019, 186, 259–278. [Google Scholar] [CrossRef] [Scilit]
- Cheng, Q.; Shi, B.; Shen, Y.; Ding, J.; Zhou, H.; Cheng, H.; Zhang, D. Effect of adjacent orifice spacing in aeration duct on cattle manure composting efficiency. Environ. Technol. Innov. 2025, 40, 104532. [Google Scholar] [CrossRef] [Scilit]
- Ogunwande, G.A.; Osunade, J.A. Passive aeration composting of chicken litter: Effects of aeration pipe orientation and perforation size on losses of compost elements. J. Environ. Manag. 2011, 92, 85–91. [Google Scholar] [CrossRef] [Scilit] [PubMed]
- Hall, K.J.; Mavinic, D.S.; Ashley, K.I. Effect of orifice diameter, depth of air injection, and air flow rate on oxygen transfer in a pilot-scale, full lift, hypolimnetic aerator. J. Environ. Eng. Sci. 2013, 8, 11–22. [Google Scholar] [CrossRef] [Scilit]
- Yucel, P.; Unsal, M.; Yagci, A.E. Effect of air hole diameter in circular conduits for air injection. Iran. J. Sci. Technol. Trans. Civ. Eng. 2019, 43, 561–567. [Google Scholar] [CrossRef] [Scilit]
- Lu, C.; Cheng, W.; Li, Z.; Wang, M.; Liu, J. Influence of aeration rates on oxygen mass transfer and flow field in a microporous aeration system. Pol. J. Environ. Stud. 2021, 30, 3727–3739. [Google Scholar] [CrossRef] [Scilit] [PubMed]
- Ghomi, M.R.; Sohrabnejad, M.; Ovissipour, M.R. An experimental study of nozzle diameters, aeration depths and angles on standard aeration efficiency (SAE) in a venturi aerator. Water Pract. Technol. 2009, 4, wpt2009043. [Google Scholar] [CrossRef] [Scilit]
- Wang, B.; Zhang, Y.; Fang, Y.; Zhang, K.; Field, R.W. Aeration pipe design for free bubbling hydrodynamic optimization of flat sheet MBRs. J. Membr. Sci. 2022, 646, 120222. [Google Scholar] [CrossRef] [Scilit]
- Mahmud, R.; Erguvan, M.; MacPhee, D.W. Performance of closed loop venturi aspirated aeration system: Experimental study and numerical analysis with discrete bubble model. Water 2020, 12, 1637. [Google Scholar] [CrossRef] [Scilit]
- De Oliveira, L.G.; De Paiva, A.P.; Balestrassi, P.P.; Ferreira, J.R.; Da Costa, S.C.; Da Silva Campos, P.H. Response surface methodology for advanced manufacturing technology optimization: Theoretical fundamentals, practical guidelines, and survey literature review. Int. J. Adv. Manuf. Technol. 2019, 104, 1785–1837. [Google Scholar] [CrossRef] [Scilit]
- Sharma, D.; Yadav, K.D.; Kumar, S. Biotransformation of flower waste composting: Optimization of waste combinations using response surface methodology. Bioresour. Technol. 2018, 270, 198–207. [Google Scholar] [CrossRef] [Scilit] [PubMed]
- Udume, O.A.; Abu, G.O.; Stanley, H.O.; Vincent-Akpu, I.F.; Momoh, Y. Impact of composting factors on the biodegradation of lignin in Eichhornia crassipes (water hyacinth): A response surface methodological (RSM) investigation. Heliyon 2022, 8, e10340. [Google Scholar] [CrossRef] [Scilit] [PubMed]
- Md Saleh, Z.; Mohamed, R.M.S.R.; Al-Gheethi, A.; Zainun, N.Y.; Mohd Kamil, N.A.F. Optimizing decomposition of food wastes using response surface methodology. Mater. Today Proc. 2020, 31, 96–99. [Google Scholar] [CrossRef] [Scilit]
- Wang, J.; Zhu, X.; Zhu, Z.; Li, C.; Peng, X.; Qiu, S.; Ren, J.; Wu, X.; Nyambura, S.M.; Li, H.; et al. Enhancing oxygen-dissolving capacity of rotary drum food waste composting: Tumbling process optimization and experimental validation with discrete and finite element methods. Agronomy 2024, 14, 2641. [Google Scholar] [CrossRef] [Scilit]
- Zhou, S.; Jia, P.; Xu, W.; Shane Alam, S.; Zhang, Z. A novel composting system for mitigating ammonia emissions and producing nitrogen-rich organic fertilizer. Bioresour. Technol. 2023, 386, 129455. [Google Scholar] [CrossRef] [Scilit] [PubMed]
- Baek, M.; Choi, S.; Kim, H.; Jang, H.; Kim, J.; Hong, T.; Hong, J. CFD numerical setting combinations for greenhouse natural ventilation across diurnal time points using multi-criteria analysis. Comput. Electron. Agric. 2026, 247, 111689. [Google Scholar] [CrossRef] [Scilit]
- Yu, H.; Li, P.; Bo, G.; Shen, G. Studies on the humic acid structure and microbial nutrient restriction mechanism during organic-inorganic co-composting. J. Environ. Manag. 2024, 353, 120186. [Google Scholar] [CrossRef] [Scilit] [PubMed]
- Shi, B.; Cheng, Q.; Shen, Y.; Zhang, D.; Ding, J.; Zhou, H.; Cheng, H.; Wang, Y. Effects of ventilation pipe deflectors on cattle manure composting efficiency and microbial community dynamics. Trans. Chin. Soc. Agric. Eng. 2025, 41, 240–249. [Google Scholar] [CrossRef]
- Cheng, Q.; Meng, H.; Zhou, H.; Shen, Y.; Cheng, H.; Ding, J.; Zhao, S.; Hou, S. Airflow field simulation model building and application for aerobic compost using CFD. Int. J. Agric. Biol. Eng. 2021, 14, 245–254. [Google Scholar] [CrossRef] [Scilit]
- Xu, L.; Shi, J.; Li, R.; Wang, P. Simulation and experiment of bottom aeration piping and internal flow field in trough composting. BioResources 2026, 21, 6203–6217. [Google Scholar] [CrossRef] [Scilit]
- Marcato, A.; Boccardo, G.; Marchisio, D. From computational fluid dynamics to structure interpretation via neural networks: An application to flow and transport in porous media. Ind. Eng. Chem. Res. 2022, 61, 8530–8541. [Google Scholar] [CrossRef] [Scilit]
- Cheng, Q.; Shen, Y.; Zhao, S.; Ding, J.; Zhou, H. Study of the variation law of the airflow resistance and related physical parameters of the pile throughout compost process with cattle manure. Waste Manag. 2024, 174, 263–272. [Google Scholar] [CrossRef] [Scilit] [PubMed]
- Shen, Y.; Zhang, B.; Ding, J.; Meng, H.; Zhou, H.; Cheng, H.; Zhang, X.; Wang, J. Optimization of the ventilation technology for the mixed fermentation of cow manure and crop straw. Trans. Chin. Soc. Agric. Eng. 2022, 38, 242–250. [Google Scholar] [CrossRef]
- Xu, Z.; Xu, W.; Zhang, L.; Ma, Y.; Li, Y.; Li, G.; Nghiem, L.D.; Luo, W. Bacterial dynamics and functions driven by bulking agents to mitigate gaseous emissions in kitchen waste composting. Bioresour. Technol. 2021, 332, 125028. [Google Scholar] [CrossRef] [Scilit] [PubMed]
- Yang, Y.; Wen, H.; Ma, S.; Ding, J.; Zhou, H.; Shen, Y.; Cheng, H.; Wang, H.; Wang, J.; Jia, Y.; et al. The optimization of the multi-component organic wastes in mixed aerobic composting ratio based on antibiotic resistance gene reduction. Environ. Technol. Innov. 2025, 39, 104160. [Google Scholar] [CrossRef] [Scilit]
- Cole, K.J.; Hogan, J.S. Short communication: Environmental mastitis pathogen counts in freestalls bedded with composted and fresh recycled manure solids. J. Dairy Sci. 2016, 99, 1501–1505. [Google Scholar] [CrossRef] [Scilit] [PubMed]
- Yan, L.; Wang, G.; Ai, S.; Huo, Z.; Wang, Y.; Gu, J.-D.; Wang, W. Abundance of ammonia-oxidizing bacteria and archaea under different ventilation strategies during cattle manure composting. J. Environ. Manag. 2018, 212, 375–383. [Google Scholar] [CrossRef] [Scilit] [PubMed]
- Zhu, D.; Liang, N.; Zhang, R.; Ahmad, F.; Zhang, W.; Yang, B.; Wu, J.; Geng, A.; Gabriel, M.; Sun, J. Insight into depolymerization mechanism of bacterial laccase for lignin. ACS Sustain. Chem. Eng. 2020, 8, 12920–12933. [Google Scholar] [CrossRef] [Scilit]
- Zhao, L.; Wang, J.; Yin, J.; Yuan, J.; Li, G.; Zhou, H.; Ma, R. Effects of biochar from different sources on the maturity and humification during diverse materials synergistic composting. Trans. Chin. Soc. Agric. Eng. 2025, 41, 249–259. [Google Scholar] [CrossRef]
- Li, Y.; Ma, J.; Yong, X.; Luo, L.; Wong, J.W.C.; Zhang, Y.; Wu, H.; Zhou, J. Effect of biochar combined with a biotrickling filter on deodorization, nitrogen retention, and microbial community succession during chicken manure composting. Bioresour. Technol. 2022, 343, 126137. [Google Scholar] [CrossRef] [Scilit] [PubMed]
- Liang, J.; Huo, P.; Mo, X.; Zhang, L.; Fan, X.; Sun, S. Fostering sustainable banana cultivation: Maximizing red soil performance with lignin-based humic acid liquid fertilizer. Agric. Commun. 2023, 1, 100018. [Google Scholar] [CrossRef] [Scilit]
- Qin, X.; Huang, W.; Li, Q. Lignocellulose biodegradation to humic substances in cow manure-straw composting: Characterization of dissolved organic matter and microbial community succession. Int. J. Biol. Macromol. 2024, 283, 137758. [Google Scholar] [CrossRef] [Scilit] [PubMed]
- Zhao, Y.; Zhao, Y.; Zhang, Z.; Wei, Y.; Wang, H.; Lu, Q.; Li, Y.; Wei, Z. Effect of thermo-tolerant actinomycetes inoculation on cellulose degradation and the formation of humic substances during composting. Waste Manag. 2017, 68, 64–73. [Google Scholar] [CrossRef] [Scilit] [PubMed]
- Cao, Y.; Wang, X.; Zhang, X.; Misselbrook, T.; Bai, Z.; Ma, L. An electric field immobilizes heavy metals through promoting combination with humic substances during composting. Bioresour. Technol. 2021, 330, 124996. [Google Scholar] [CrossRef] [Scilit] [PubMed]
- Yang, X.; Yan, R.; Yang, C.; Zhang, H.; Lyu, H.; Li, S.; Liu, T.; Li, R.; Yao, Y.; Li, W.; et al. Soil accelerates the humification involved in co-composting of wheat straw and cattle manure by promoting humus formation. Chem. Eng. J. 2024, 479, 147583. [Google Scholar] [CrossRef] [Scilit]
- Lu, C.; Cheng, W.; Zhou, S.; Wang, M.; Liu, J.; Wan, T. Influence of aeration microporous aperture on oxygen mass transfer efficiency in terms of bubble motion flow field. ACS Omega 2021, 6, 2790–2799. [Google Scholar] [CrossRef] [Scilit] [PubMed]

Disclaimer/Publisher’s Note: The statements, opinions and data contained in all publications are solely those of the individual author(s) and contributor(s) and not of MDPI and/or the editor(s). MDPI and/or the editor(s) disclaim responsibility for any injury to people or property resulting from any ideas, methods, instructions or products referred to in the content. |
© 2026 by the authors. Licensee MDPI, Basel, Switzerland. This article is an open access article distributed under the terms and conditions of the Creative Commons Attribution (CC BY) license.