


Abstract
Liming is widely used to alleviate soil acidification, but its potential to stimulate soil organic carbon (SOC) decomposition may compromise SOC stability. Whether lime–biochar co-application can mitigate the associated increase in soil CO2 release remains unclear. A one-year field experiment in an intensively managed acid bamboo plantation compared an unamended control (CK), lime alone (L), bamboo biochar alone (B), and lime–biochar co-application (LB). Soils collected at 3, 6, and 12 months after application were analyzed for SOC fractions, extracellular enzyme activities, and microbial gene abundance and incubated for 90 days to measure CO2 release. At 3 and 6 months, L increased cumulative CO2-C release by 45% and 24%, respectively, relative to CK, accompanied by increased labile C and microbial C limitation inferred from enzyme stoichiometry. Relative to L, LB reduced mean CO2-C release rates by 18% and 13%, respectively; this response was associated with higher non-hydrolysable (recalcitrant) C, lower geometric mean enzyme activity, and weaker microbial C limitation. After 12 months, the stimulatory effect of L was no longer evident, whereas B and LB increased cumulative CO2-C release by 31% and 29%, respectively, relative to CK. Structural equation modeling linked the lime predictor to greater microbial abundance and C limitation, and the biochar predictor to higher recalcitrant C concentrations and lower C limitation. Because CO2 sources were not partitioned, these responses cannot be attributed exclusively to native SOC decomposition. Lime–biochar co-application thus moderated the short-term increase in soil CO2 release associated with liming, but this effect weakened over time, highlighting the need for longer-term assessment of SOC stability.
1. Introduction
Soil acidification is one of the major forms of soil degradation that threatens ecosystem sustainability by altering nutrient availability, microbial activity, and biogeochemical cycling. Acidified soils often exhibit reduced nutrient availability, increased exchangeable aluminum toxicity, and impaired microbial functions, thereby limiting plant productivity and ecosystem services [1,2,3]. In addition to its effects on soil fertility, soil acidification can substantially influence soil organic carbon (SOC) dynamics. Since SOC is the largest terrestrial carbon pool, even small changes in SOC decomposition can affect carbon sequestration potential and atmospheric CO2 concentrations [4,5]. Therefore, improving acidic soils while maintaining SOC stability is critical for achieving sustainable ecosystem management.
Soil microbial respiration, a major process of SOC decomposition, regulates soil–atmosphere CO2 flux and can substantially affect SOC storage [6,7]. Therefore, understanding the factors regulating microbial respiration is important for maintaining SOC stability. Soil carbon composition, microbial abundance, and enzyme activity are key factors affecting microbial respiration. For example, increased availability of labile organic carbon can stimulate microbial activity and thereby enhance microbial respiration [8], while changes in microbial abundance and community composition can further influence this process [9]. In addition, soil extracellular enzymes produced by microorganisms directly mediate organic matter decomposition, and their activities are regulated by microbial demands for C, N, and P [10,11,12]. Ecoenzymatic stoichiometry has therefore been increasingly used to characterize microbial resource limitation and resource acquisition strategies [13,14], providing further insights into microbial resource acquisition and SOC decomposition.
Lime is a traditional soil amendment widely used to ameliorate soil acidification in agricultural and forest ecosystems [15,16]. Previous studies have shown that lime application can rapidly increase soil pH and reduce exchangeable acidity and Al3+ concentrations [17,18]. However, lime can also alter soil carbon pools and microbial processes [19]. For example, lime application can increase dissolved organic carbon (DOC) and microbial biomass carbon (MBC), thereby stimulating microbial activity and respiration [20,21]. Moreover, carbonate dissolution following lime application may contribute to additional CO2 release, particularly during the initial period after application [22,23]. Thus, although liming effectively alleviates soil acidification, its potential stimulation of microbial respiration and SOC decomposition may compromise soil carbon stability. Therefore, combining lime with amendments that can reduce this potential carbon loss may provide a more effective strategy for managing acidified soils.
Biochar is widely considered a promising amendment for improving soil quality and enhancing carbon sequestration [24,25]. Its high proportion of recalcitrant carbon and pore structure can increase stable carbon pools and adsorb labile organic carbon, thereby reducing substrate availability for decomposition and potentially enhancing SOC stability [26,27,28]. Accordingly, biochar application has been reported to reduce soil microbial respiration through changes in SOC composition and availability [29]. However, biochar does not always reduce soil carbon mineralization. Biochar may also contain labile carbon compounds that can be rapidly utilized by microorganisms and consequently stimulate microbial respiration [8,30], while bamboo biochar has been reported to have no significant effect on microbial respiration [31]. Moreover, biochar aging can progressively alter its surface properties and carbon availability, potentially changing its effects on microbial decomposition over time [32,33]. These contrasting responses suggest that the effects of biochar on SOC decomposition depend on biochar feedstock, soil conditions, and experimental duration. The combined application of biochar and lime has therefore received increasing attention as a potential strategy for managing acidified soils. Previous studies have shown that their co-application can improve soil pH, nutrient availability, and crop productivity [34,35,36]. However, their effects on soil carbon dynamics remain poorly understood. For instance, Mosharrof et al. [34] reported that biochar and lime co-application increased maize yield but simultaneously accelerated carbon loss from an acidic soil. Thus, whether biochar can offset lime-induced SOC decomposition by regulating carbon availability and microbial processes, and whether such effects change over time, remains unclear.
Lei bamboo (Phyllostachys praecox) is an economically important bamboo species widely cultivated in southern China. Intensive management practices, particularly heavy fertilization and winter mulching, have substantially increased bamboo productivity and economic benefits, but have also resulted in severe soil acidification, nutrient imbalance, and changes in soil microbial communities and carbon cycling [19,37,38]. Therefore, effective management strategies are urgently needed to alleviate soil acidification while minimizing potential SOC losses in intensively managed Lei bamboo plantations. In this study, we conducted a one-year field experiment to investigate the effects of lime, bamboo biochar, and their combined application on SOC fractions, microbial respiration, extracellular enzyme activities, microbial resource limitation, and microbial abundance in an intensively managed Lei bamboo plantation. We hypothesized that (1) compared with the unamended control, lime alone would increase labile C availability and soil CO2 release, whereas biochar application, either alone or with lime, would increase non-hydrolysable (recalcitrant) C concentrations; (2) lime–biochar co-application would reduce soil CO2 release relative to lime alone, accompanied by changes in soil C availability, extracellular enzyme activities, and microbial C limitation inferred from ecoenzymatic stoichiometry; and (3) the difference in soil CO2 release between lime–biochar co-application and lime alone would vary among sampling times after amendment application. By integrating these measurements, this study aimed to characterize the temporal responses of soil C fractions and soil CO2 release to lime–biochar co-application and their associations with microbial characteristics during the amelioration of acidified bamboo soils.
2. Materials and Methods
2.1. Study Site
The field experiment was conducted in an intensively managed Lei bamboo (Phyllostachys praecox) plantation located in Taihuyuan Town, Lin’an District, Hangzhou City, Zhejiang Province, southeastern China (30°16′53″ N, 119°33′14″ E). The region has a typical subtropical monsoon climate, characterized by warm and humid conditions, with a mean annual precipitation of approximately 1550 mm and a frost-free period of approximately 236 days. The plantation had been intensively managed for more than 20 years before the experiment. The soil at the experimental site is classified as a Ferralsol according to the FAO soil classification system. Before amendment application, the surface soil (0–20 cm) had a pH of 4.40, SOC content of 37.01 g kg−1, and total N (TN) content of 3.10 g kg−1. The soil contained 32% clay, 31% silt, and 37% sand.
2.2. Experimental Design
The field experiment was established in November 2018 in an intensively managed Lei bamboo plantation. Four treatments were arranged in a randomized block design with three replicates: (1) control without lime or biochar application (CK); (2) lime application at 4 t ha−1 (L); (3) bamboo biochar application at 10 t ha−1 (B); (4) combined application of lime at 4 t ha−1 and bamboo biochar at 10 t ha−1 (LB). Each treatment had three replicate plots, resulting in a total of 12 plots. Each plot covered an area of 36 m2, with a 1 m buffer between adjacent plots. The lime application rate was selected according to the typical rate used by local farmers. The biochar was produced from bamboo wood by pyrolysis in a vertical kiln at 600 °C for 4 h. The biochar had a pH of 9.11, total C content of 59.93%, total N content of 0.86%, total P content of 0.13%, and a C to N ratio of 70.03. Before application, the biochar was ground and passed through a 2 mm sieve. Lime and biochar were applied once according to the respective treatments and incorporated evenly into the 0–20 cm soil layer by tillage. During the experimental period, winter mulching was not applied. All plots received the same fertilization regime, with fertilizer applied in May, August and November. Annual fertilizer inputs consisted of 2.25 t ha−1 compound fertilizer (N:P2O5:K2O = 16:16:16) and 1.125 t ha−1 urea (46% N).
2.3. Soil Sampling
Surface soil samples (0–20 cm) were collected from each plot in February, May, and November 2019, corresponding to 3, 6, and 12 months after amendment application, respectively. At each sampling event, five soil cores were collected from each plot along a diagonal transect and thoroughly mixed to form one composite sample. Visible stones, plant roots, and other residues were removed, and each composite sample was passed through a 2 mm sieve and divided into three subsamples. The first subsample was air-dried at room temperature, ground, and passed through a 0.25 mm sieve for soil physicochemical analysis. The second subsample was stored at 4 °C for measurements of microbial activity and extracellular enzyme activities. The third subsample was freeze-dried and stored at −70 °C for molecular analysis.
2.4. Soil Physicochemical Properties and Carbon Fractions
Soil physicochemical properties were determined using standard methods [39]. Soil bulk density was determined by the core method [39]. Soil pH was measured in soil–water suspensions at a ratio of 1:2.5 (w/v) using a pH meter (SevenCompact S220, Mettler-Toledo, Greifensee, Switzerland) [39]. Soil organic carbon (SOC) was determined by K2CrO7 oxidation, and total nitrogen (TN) was determined using the Kjeldahl method [39]. Available phosphorus (AP) and available potassium (AK) were determined using the Bray method and flame photometry, respectively [39]. Microbial biomass carbon (MBC) and nitrogen (MBN) were determined using the chloroform fumigation-extraction method with K2SO4 as the extractant [40]. Dissolved organic carbon (DOC) and dissolved nitrogen (DN) were determined from the C and N concentrations in the corresponding unfumigated K2SO4 extract using a total organic carbon analyzer (TOC-VCPH/CPN, Shimadzu Corporation, Kyoto, Japan). Labile and recalcitrant C fractions were determined using a two-step sulfuric acid hydrolysis method described by Rovira and Vallejo [41]. This method operationally separates SOC into two hydrolysable C fractions (LPI-C and LPII-C) and a recalcitrant C fraction (RP-C). LPI-C primarily represents relatively labile compounds, including polysaccharides of plant and microbial origin, whereas LPII-C contains comparatively less labile hydrolysable compounds, including cellulose. The non-hydrolysable RP-C fraction represents relatively recalcitrant organic compounds, including lignin- and tannin-derived C [41].
2.5. Soil CO2 Release During Incubation
Soil CO2 release during incubation was measured using the MicroRespTM method described by Campbell et al. [42]. Briefly, the MicroResp system consisted of a deep-well plate containing fresh soil and a CO2 detection plate. The detection plate contained a 1% Noble agar gel prepared with 150 mM KCl, 12.5 ppm (w/w) cresol red, and 2.5 mM NaHCO3. Fresh soil (0.3 g) was placed into each well and adjusted to 60% water-holding capacity with sterile water. The CO2 detection plate was then placed onto the deep-well plate, and the assembled plates were incubated at 25 °C in the dark for 6 h. After incubation, absorbance of the detection plate was measured at 570 nm, and the CO2 release rate was calculated from the change in absorbance. For the incubation experiment, soil samples were maintained at 25 °C and 60% water-holding capacity for 90 days. CO2 release was measured on days 1, 10, 12, 14, 16, 19, 23, 27, 31, 35, 39, 45, 55, 70, and 90 during the incubation, and cumulative CO2-C release over the 90-day period was calculated and expressed on a dry-soil basis. CO2-C release rate is expressed as mg CO2-C g−1 dry soil d−1.
2.6. Soil Enzyme Activity Measurement and Ecoenzymatic Stoichiometry
The potential activities of five hydrolytic enzymes and two oxidative enzymes were measured, including β-glucosidase (BG), β-cellobiosidase (CB), N-acetyl-β-glucosaminidase (NAG), leucine aminopeptidase (LAP), acid phosphatase (PHOS), peroxidase (PERO), and phenol oxidase (PHOX). The activities of hydrolytic enzymes were determined using fluorometric microplate assays following Saiya-Cork et al. [43]. Briefly, soil suspensions were incubated with enzyme-specific fluorogenic substrates at 25 °C in the dark for 3 h. Fluorescence released from 4-methylumbelliferone (MUB) or 7-amino-4-methylcoumarin (MUC)-linked substrates was measured using a microplate reader (Synergy™ H1, BioTek Instruments, Winooski, VT, USA) at an excitation wavelength of 365 nm and an emission wavelength of 450 nm. The activities of PERO and PHOX were determined using colorimetric assays according to DeForest [44]. The geometric mean enzyme activity (GMEA) was calculated according to Chen et al. [29] as:
GMEA = (BG × CB × NAG × LAP × PHOS × PERO × PHOX)1/7
Potential microbial resource limitation was evaluated using ecoenzymatic vector analysis following Moorhead et al. [45] and Cui et al. [46]. Vector length was used as an indicator of microbial C limitation, with a greater vector length indicating stronger C limitation. Vector angle was used to characterize the relative limitation of N versus P; angles < 45° indicate relatively greater N limitation, whereas angles > 45° indicate relatively greater P limitation. The extent of microbial carbon limitation is positively correlated with vector length, microbial P limitation increases with the vector angle, and microbial N limitation decreases with it. The specific calculation formula is as follows:
where X means the relative activity of C- to P-acquiring enzymes ((BG + CB)/(BG + CB + PHOS)), and Y indicates the relative activity of C- to N-acquiring enzymes ((BG + CB)/(BG + CB + (NAG + LAP))).
2.7. Soil DNA Extraction and Real-Time Quantitative PCR
Soil DNA was extracted from 0.3 g of freeze-dried soil using a PowerSoil DNA Isolation kit (MoBio Laboratories, Carlsbad, CA, USA) according to the manufacturer’s instructions. The integrity of the extracted DNA was examined by agarose gel electrophoresis, and DNA concentration and purity were determined using a NanoDrop 2000 Spectrophotometer (Thermo Fisher Scientific, Wilmington, DE, USA). Bacterial and archaeal 16S rRNA gene copy numbers and fungal internal transcribed spacer (ITS) region copy numbers were quantified using quantitative real-time PCR (qPCR) with the primer pairs 338F/518R, 344F/517R, and ITS1F/5.8S, respectively [47]. The abundances of α-Proteobacteria, β-Proteobacteria, Actinobacteria, Firmicutes, Bacteroidetes, Acidobacteria, and Basidiomycota were also quantified using group-specific primers according to Fierer et al. [48].
2.8. Statistical Analysis
Data were tested for normality and homogeneity of variance before analysis. Overall effects of lime, biochar, and their interaction were evaluated using a blocked factorial repeated-measures ANOVA, with sampling time as the within-plot factor and lime and biochar as between-plot factors. Block was included in the model, and repeated observations were identified by plot. Greenhouse–Geisser corrections were applied to within-plot tests. The overall effects of lime, biochar, and their interaction assessed across the three sampling times; full F-statistics, degrees of freedom, and p-values are provided in Supplementary Table S1. Separately, treatment differences within each sampling time were assessed using one-way ANOVA followed by Duncan’s multiple range test at p < 0.05. The ANOVAs were performed using IBM SPSS Statistics 27 (IBM Corp., Armonk, NY, USA). Pearson correlation analysis was used to evaluate the relationships among soil CO2 release, soil physicochemical properties, C fractions, enzyme activities, ecoenzymatic stoichiometry, and microbial abundances. Redundancy analysis (RDA) was performed using CANOCO for Windows 4.5 (Microcomputer Power, Ithaca, NY, USA) to examine the associations of soil environmental factors with enzyme activities and microbial abundances. Structural equation modeling (SEM) was performed using AMOS 18.0 software (IBM, Chicago, IL, USA) to evaluate the direct and indirect associations of lime and biochar with soil CO2 release through changes in soil pH, recalcitrant C, microbial C limitation, and microbial abundance. The initial model was constructed based on the hypothesized relationships among these variables and evaluated using standard model-fit indices. Statistical significance was determined at p < 0.05.
3. Results
3.1. Changes in Soil CO2 Release
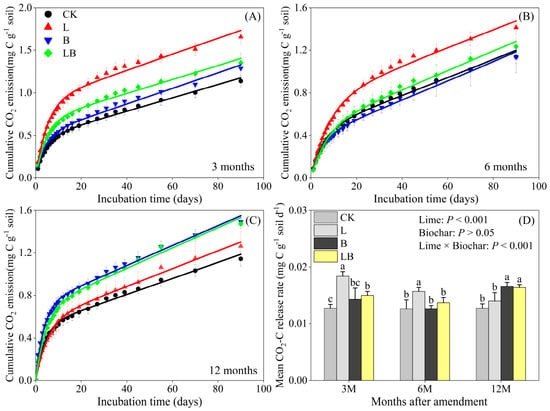
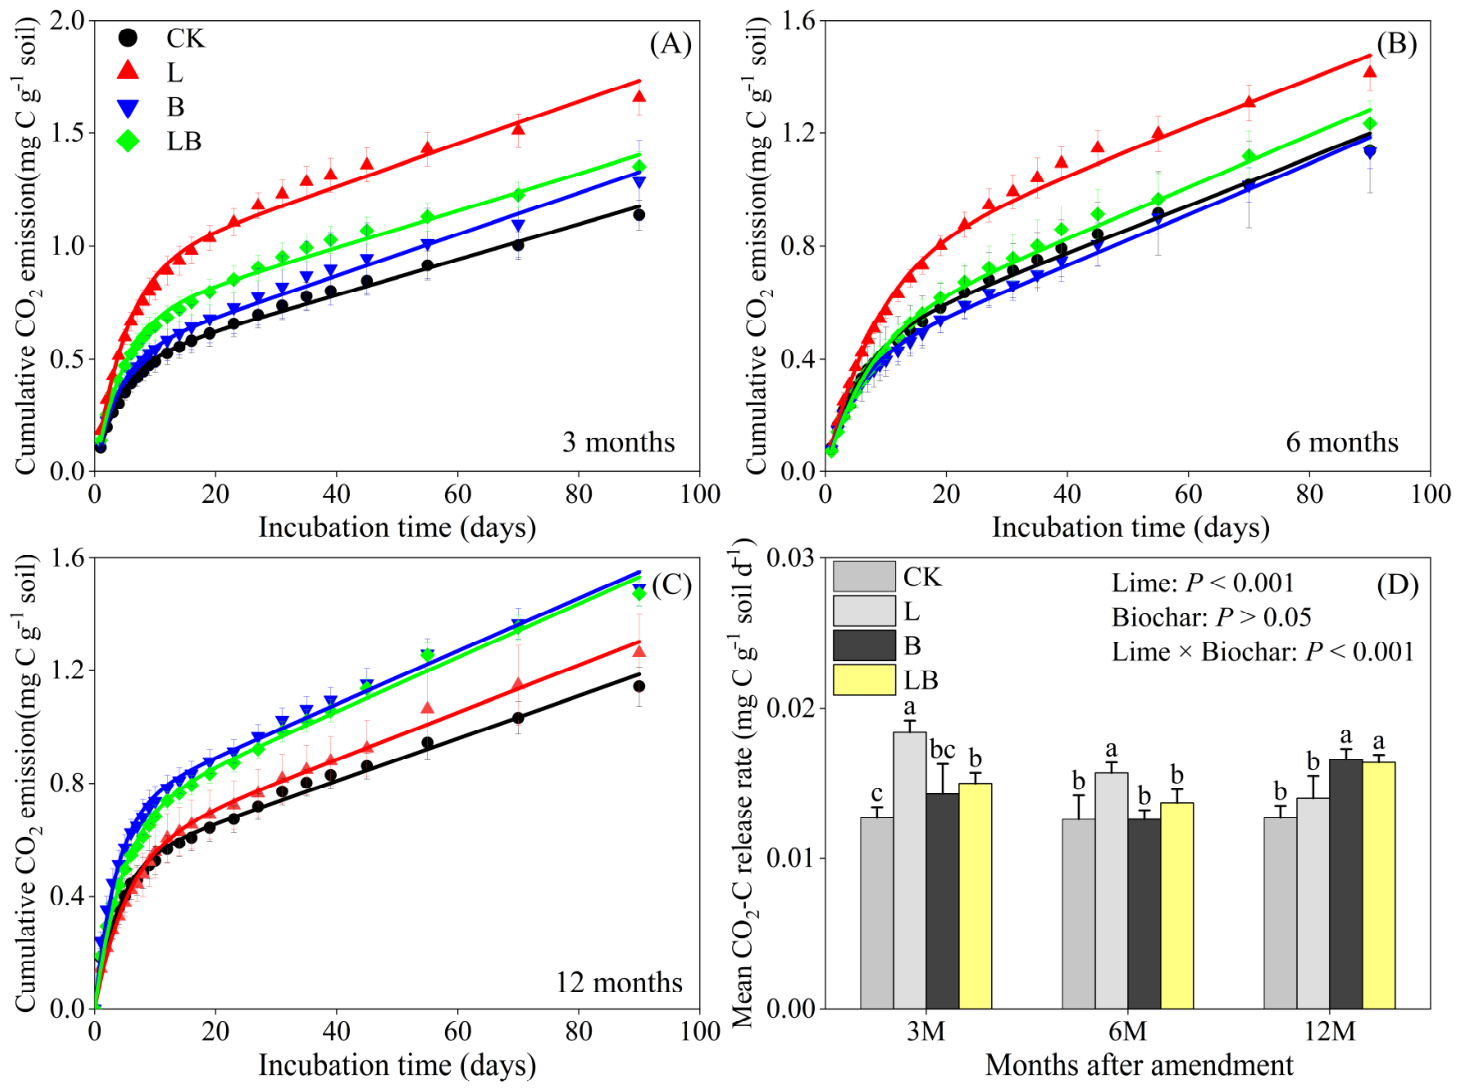
At 3 and 6 months, L significantly increased cumulative CO2-C release over the 90-day incubation by 45% and 24%, respectively, compared with CK, whereas B had no significant effect (Figure 1A,B). Compared with L, LB significantly decreased the mean CO2-C release rate by 18% and 13% at these two sampling times, respectively (Figure 1D). At 12 months, B and LB showed significantly higher mean CO2-C release rates than CK, and cumulative CO2-C release was 31% and 29% higher, respectively (Figure 1C,D).
Figure 1.
Effects of lime alone, bamboo biochar alone, and their co-application on soil CO2 release during laboratory incubation. Cumulative CO2-C release during the 90-day incubation of soils collected at 3 (A), 6 (B), and 12 months (C) after amendment application, and mean CO2-C release rates over the incubation period (D). CK, unamended control; L, lime alone; B, biochar alone; LB, lime–biochar co-application. Values are means ± SE (n = 3). Different lowercase letters in panel (D) indicate significant differences among treatments at the same sampling time (Duncan’s test, p < 0.05). The p-values in panel (D) represent the overall effects of lime, biochar, and their interaction from a blocked factorial repeated-measures ANOVA across the three sampling times.
3.2. Changes in Soil pH and Exchangeable Acidity
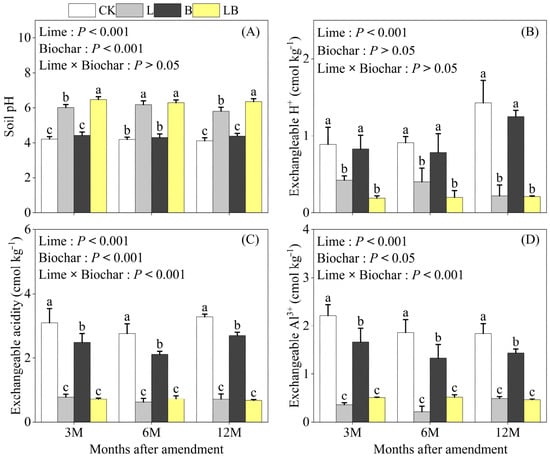
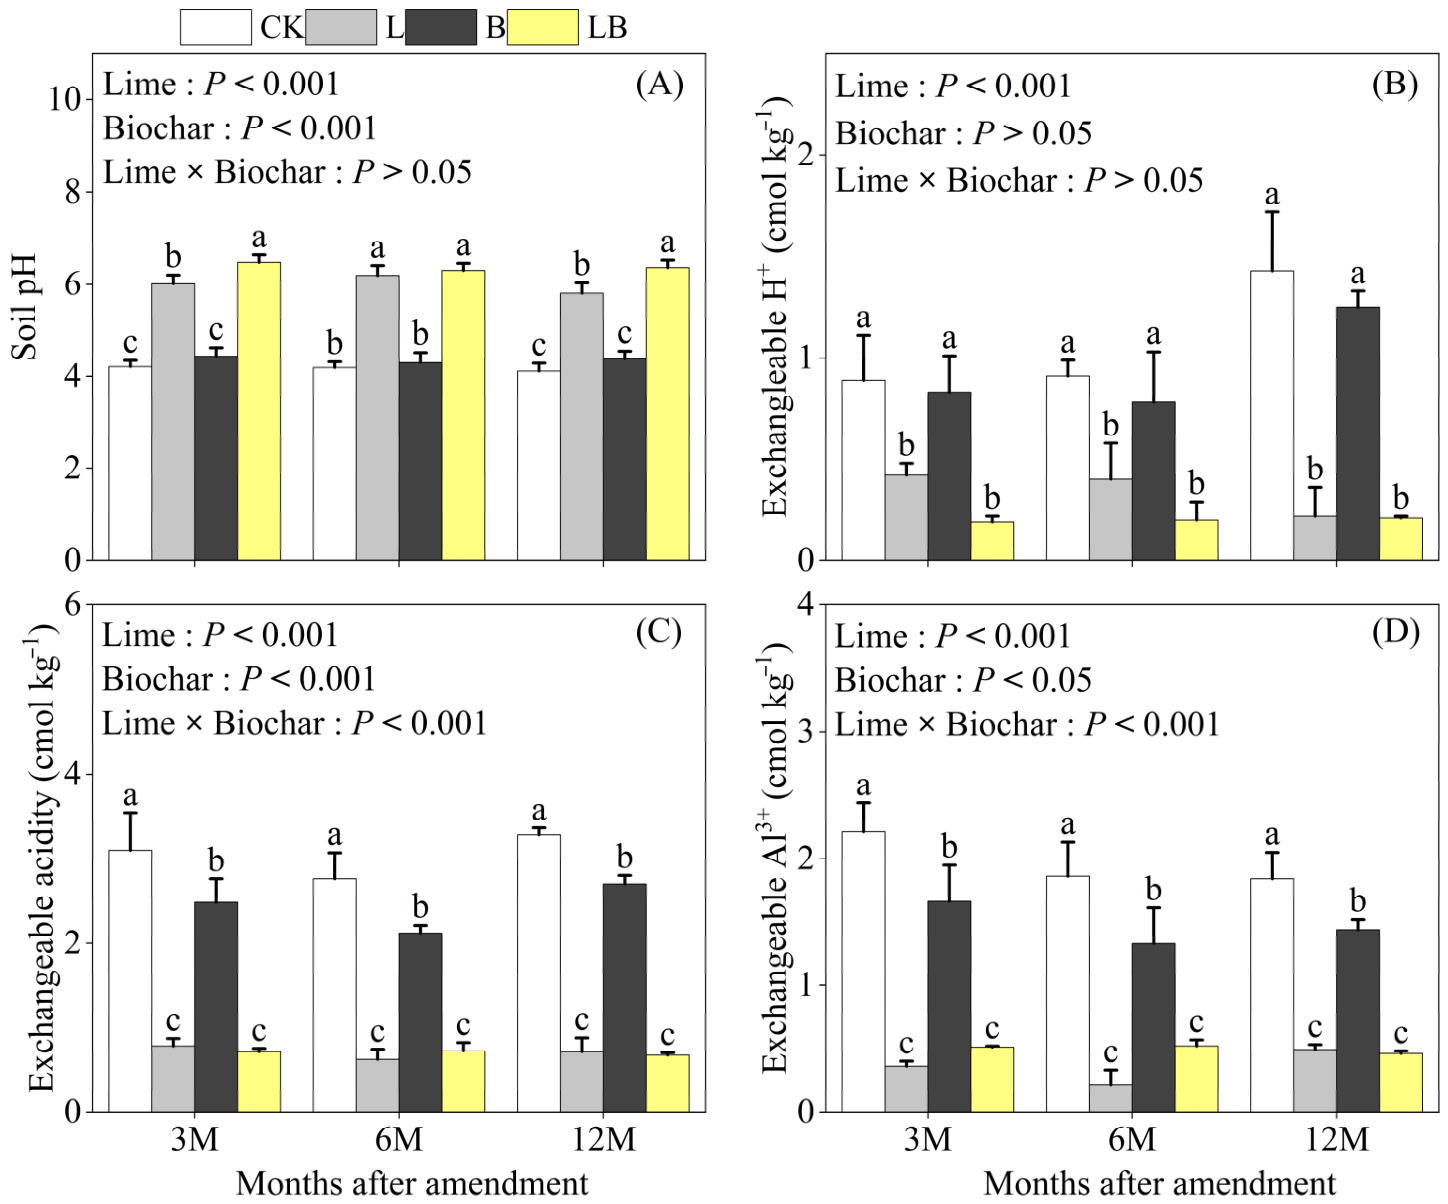
Compared with CK, L and LB significantly increased soil pH and decreased exchangeable H+, exchangeable acidity, and exchangeable Al3+ at 3, 6, and 12 months after amendment application (Figure 2). In contrast, B had no significant effect on soil pH or exchangeable H+ but significantly decreased exchangeable acidity and exchangeable Al3+ relative to CK at all three sampling times. These decreases were smaller than those under L and LB. The blocked factorial repeated-measures ANOVA showed significant lime × biochar interactions for exchangeable acidity and exchangeable Al3+ (both p < 0.01).
Figure 2.
Effects of lime alone, bamboo biochar alone, and their co-application on soil pH and exchangeable acidity. Soil pH (A), exchangeable H+ (B), exchangeable acidity (C), and exchangeable Al3+ (D) at 3, 6, and 12 months after amendment application. CK, unamended control; L, lime alone; B, bamboo biochar alone; LB, lime–biochar co-application. Values are means ± SE (n = 3). Different lowercase letters indicate significant differences among treatments at the same sampling time (Duncan’s test, p < 0.05). The p-values in each panel represent the overall effects of lime, biochar, and their interaction from a blocked factorial repeated-measures ANOVA across the three sampling times.
3.3. Changes in Soil Physical Properties and Microbial Biomass
Compared with CK, L significantly increased soil bulk density by 13% at 12 months, whereas no significant effects of L, B, or LB were observed at 3 or 6 months (Table 1). L and LB significantly increased soil electrical conductivity and DOC content, whereas B had no significant effect on these variables. In contrast, B and LB significantly increased SOC content compared with CK. Treatment effects on TN, AP, and AK were generally limited and varied among sampling times. Compared with CK, L significantly increased MBC and MBN at all three sampling times. LB also significantly increased MBC at all three sampling times and MBN at 3 months, whereas no significant effects on MBN were observed at 6 or 12 months.
Table 1.
Effects of lime alone, bamboo biochar alone, and their co-application on soil properties.
3.4. Changes in Labile and Recalcitrant C and N Pools
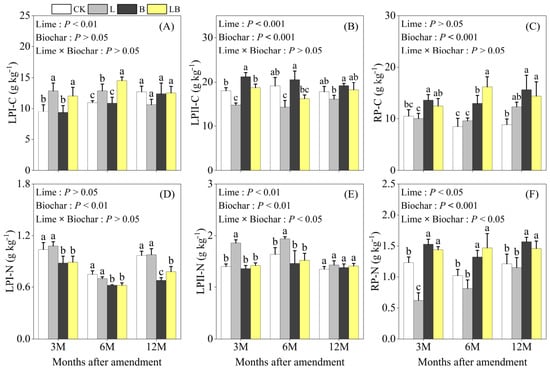
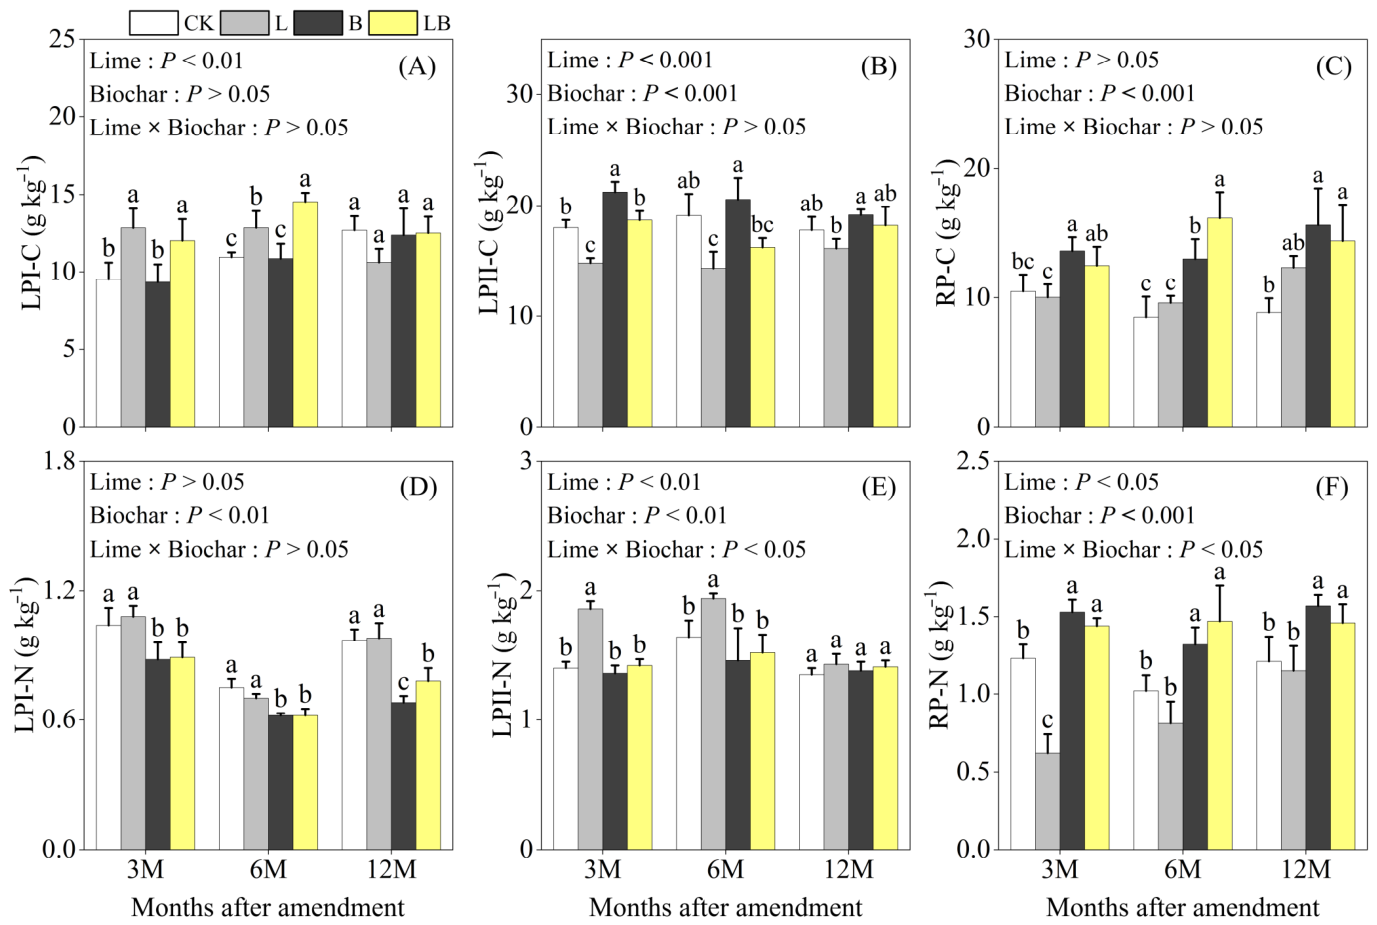
Compared with CK, L and LB significantly increased LPI-C content at 3 and 6 months, whereas no significant treatment effects were observed at 12 months (Figure 3). In contrast, L significantly decreased LPII-C content at 3 and 6 months. Compared with CK, B and LB significantly increased RP-C and RP-N contents but decreased LPI-N content at all three periods.
Figure 3.
Effects of lime alone, bamboo biochar alone, and their co-application on soil labile and recalcitrant C and N pools at different sampling times. Contents of labile pool I C (LPI-C; A), labile pool II C (LPII-C; B), recalcitrant C (RP-C; C), labile pool I N (LPI-N; D), labile pool II N (LPII-N; E), and recalcitrant N (RP-N; F) at 3, 6, and 12 months after amendment application. CK, unamended control; L, lime alone; B, bamboo biochar alone; LB, lime–biochar co-application. Values are means ± SE (n = 3). Different lowercase letters indicate significant differences among treatments at the same sampling time (Duncan’s test, p < 0.05). The p-values in each panel represent the overall effects of lime, biochar, and their interaction from a blocked factorial repeated-measures ANOVA across the three sampling times.
3.5. Changes in Enzyme Activities and Potential Microbial Resource Limitation
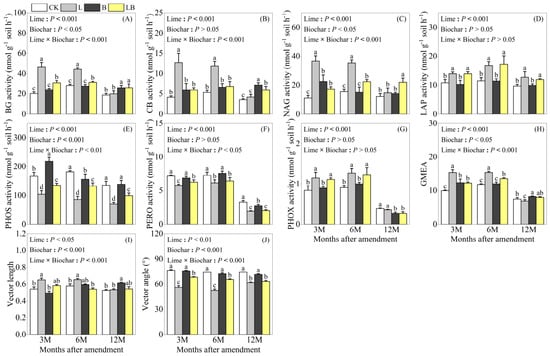
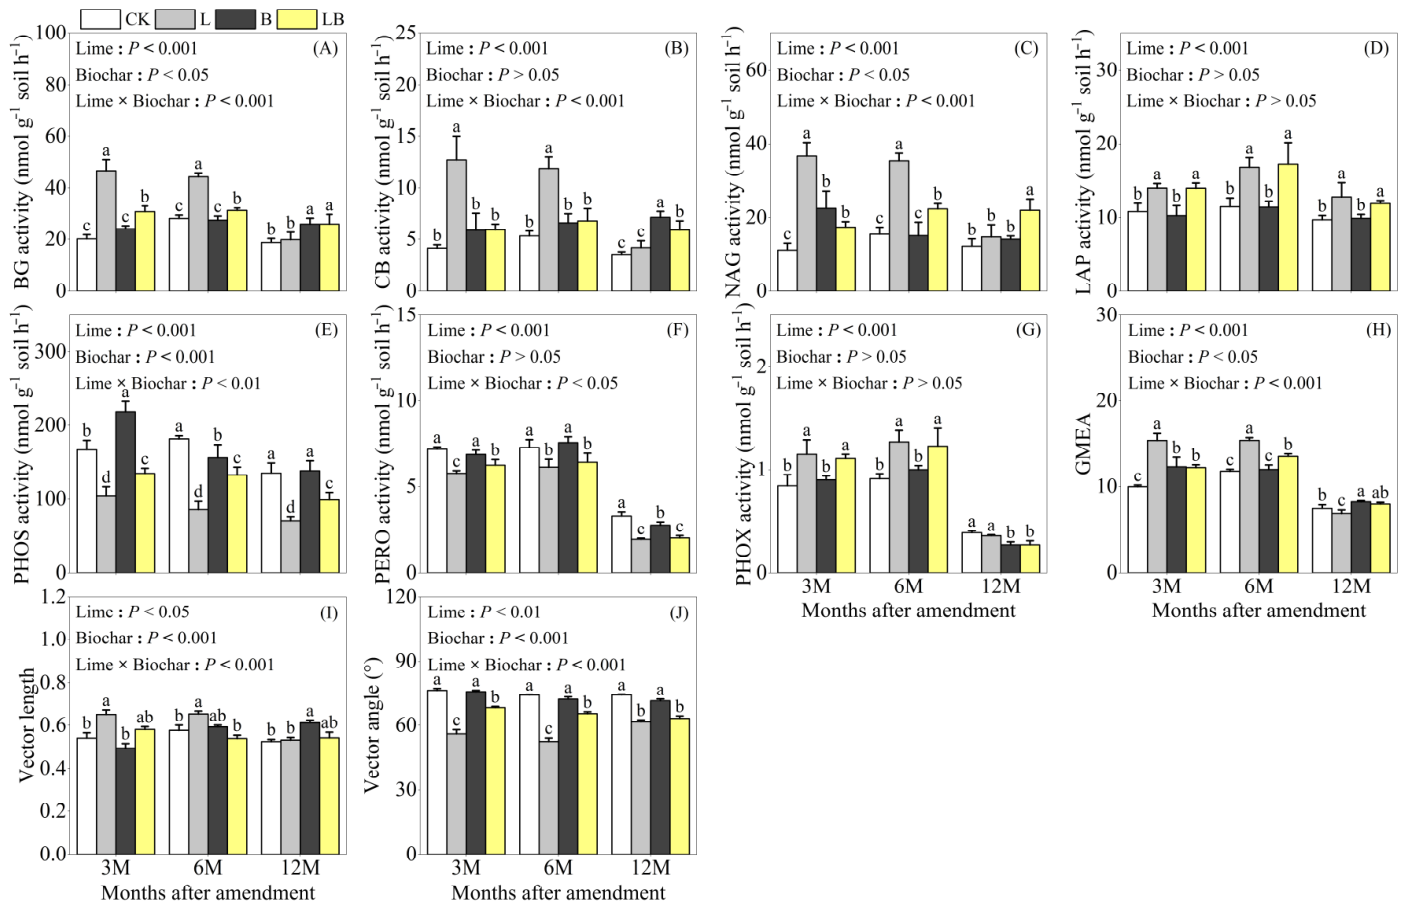
Compared with CK, B had no significant effects on enzyme activities at 3 and 6 months, but significantly increased BG, CB, and GMEA and decreased PERO and PHOX at 12 months (Figure 4). In contrast, L significantly increased BG, CB, NAG, LAP, PHOX, and GMEA at 3 and 6 months, while decreasing PHOS and PERO activities. Compared with L, LB significantly decreased GMEA at both 3 and 6 months, indicating that biochar co-application weakened the lime-induced increase in overall enzyme activity. L significantly increased vector length compared with CK at 3 and 6 months, whereas LB significantly decreased vector length compared with L at both sampling times (Figure 4I). At 12 months, B showed a higher vector length than CK. Both L and LB significantly decreased vector angle compared with CK at 3 and 6 months, while B had no significant effect (Figure 4J). At 12 months, vector angle was also lower under B, L, and LB than under CK.
Figure 4.
Effects of lime alone, bamboo biochar alone, and their co-application on soil extracellular enzyme activities and microbial resource limitation at different sampling times. Activities of β-glucosidase (BG; A), cellobiosidase (CB; B), N-acetyl-β-glucosaminidase (NAG; C), leucine aminopeptidase (LAP; D), acid phosphatase (PHOS; E), peroxidase (PERO; F), and phenol oxidase (PHOX; G), geometric mean enzyme activity (GMEA; H), vector length (I), and vector angle (J) at 3, 6, and 12 months after amendment application. Vector length indicates the degree of microbial C limitation, whereas vector angles < 45° and > 45° indicate relative N and P limitation, respectively. CK, unamended control; L, lime alone; B, bamboo biochar alone; LB, lime–biochar co-application. Values are means ± SE (n = 3). Different lowercase letters indicate significant differences among treatments at the same sampling time (Duncan’s test, p < 0.05). The p-values in each panel represent the overall effects of lime, biochar, and their interaction from a blocked factorial repeated-measures ANOVA across the three sampling times.
3.6. Changes in Microbial Abundances
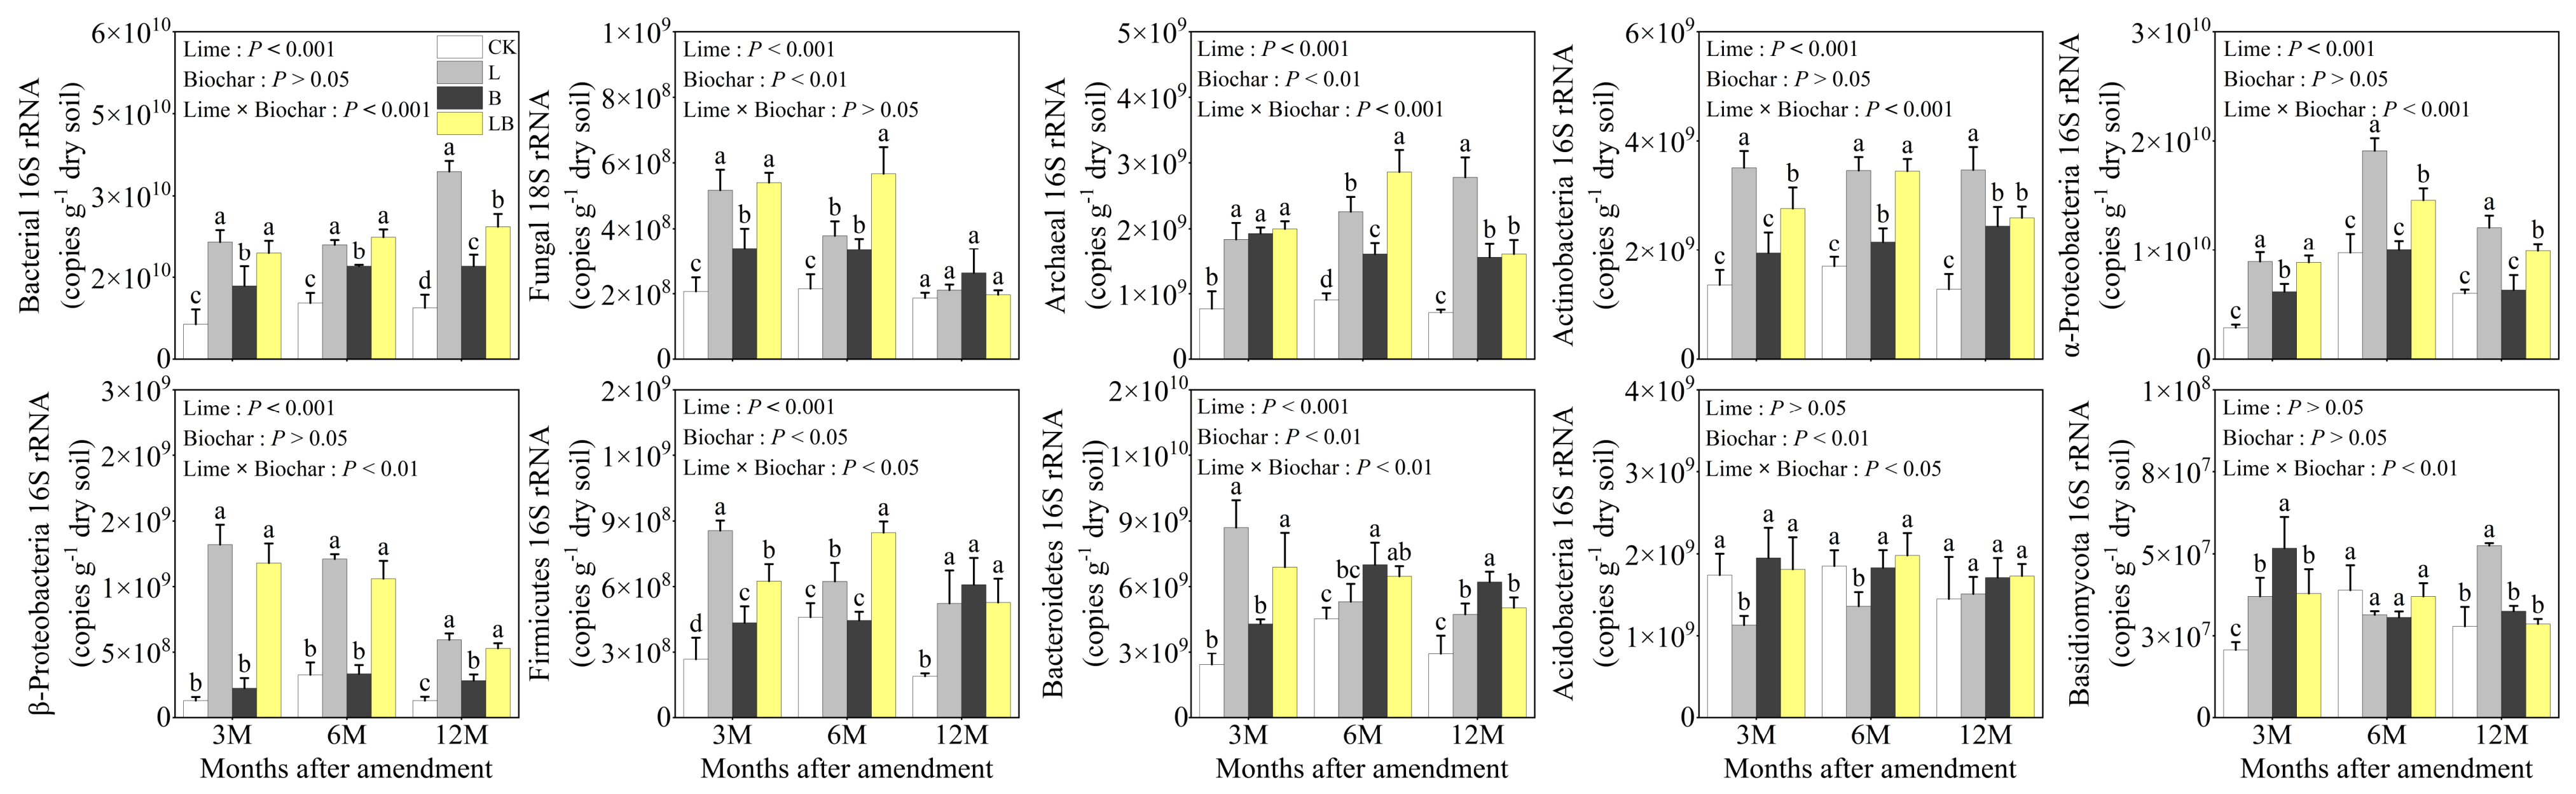
Compared with CK, L, B, and LB significantly increased bacterial and archaeal abundances at all three sampling times and fungal abundance at 3 and 6 months (Figure 5). L and LB also significantly increased the abundances of several bacterial groups, including α-Proteobacteria, β-Proteobacteria, Actinobacteria, Firmicutes, and Bacteroidetes, whereas L significantly decreased Acidobacteria abundance. The blocked factorial repeated-measures ANOVA showed significant overall effects of lime on all microbial groups examined except Acidobacteria and Basidiomycota. Significant biochar effects were detected for fungi, archaea, Firmicutes, Bacteroidetes, and Acidobacteria. Lime × biochar interactions were significant for all microbial groups examined except fungi.
Figure 5.
Effects of lime alone, bamboo biochar alone, and their co-application on soil microbial abundances at different sampling times. Abundances of bacteria, fungi, archaea, α-Proteobacteria, β-Proteobacteria, Actinobacteria, Firmicutes, Bacteroidetes, Acidobacteria, and Basidiomycota at 3, 6, and 12 months after amendment application. CK, unamended control; L, lime alone; B, bamboo biochar alone; LB, lime–biochar co-application. Values are means ± SE (n = 3). Different lowercase letters indicate significant differences among treatments at the same sampling time (Duncan’s test, p < 0.05). The p-values in each panel represent the overall effects of lime, biochar, and their interaction from a blocked factorial repeated-measures ANOVA across the three sampling times.
3.7. Relationships Among Soil Properties, Microbial Characteristics, and Soil CO2 Release
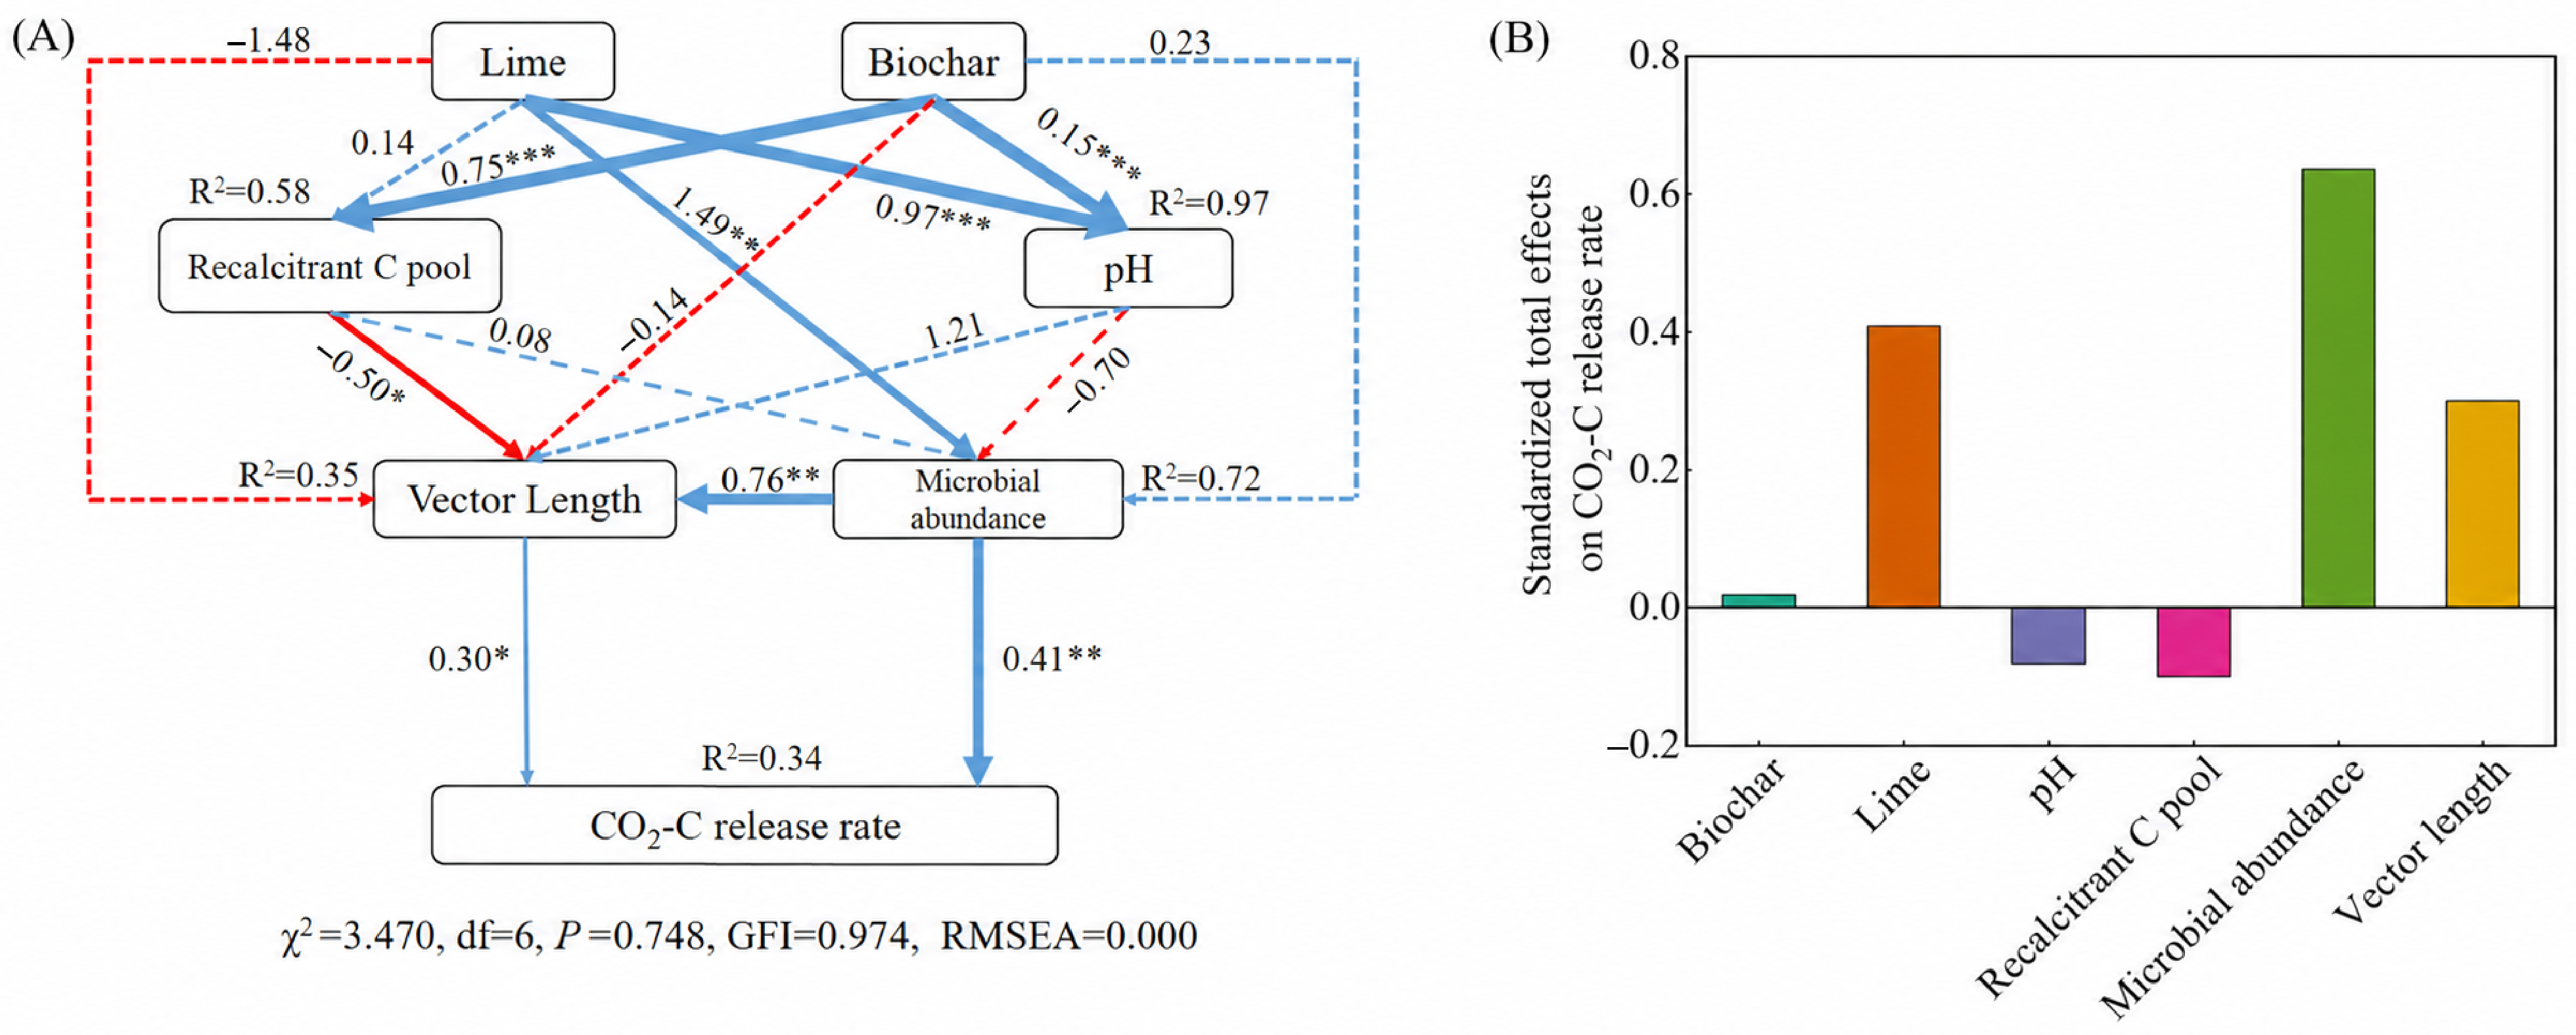
RDA showed that soil acidity-related properties were the major factors associated with variations in enzyme activities and microbial abundances (Figure S1). Specifically, Al3+, exchangeable acidity, pH, and H+ were significantly associated with both enzyme activities and microbial abundances. LPI-C, LPII-C, DN, and LPII-N were also significantly associated with enzyme activities, whereas LPI-C, LPII-C, DN, LPII-N, RP-N, AP, and AK were significantly associated with microbial abundances. Pearson correlation analysis showed that soil CO2 release was significantly positively correlated with pH, DOC, DN, LPI-C, MBC, BG, CB, NAG, vector length, and bacterial abundance, but negatively correlated with PHOS activity and vector angle (Figure S2). Structural equation modeling (SEM) further showed that lime and biochar were associated with soil CO2 release through different pathways (Figure 6). Lime was positively associated with microbial abundance and vector length, both of which were positively related to soil CO2 release, whereas biochar was positively associated with the recalcitrant C pool and negatively associated with vector length.
Figure 6.
Structural equation model linking lime and biochar application to soil CO2-C release rate during laboratory incubation (A) and standardized total effects of the model variables on CO2-C release rate (B). In panel (A), blue arrows indicate positive relationships, whereas red arrows indicate negative relationships. Solid and dashed arrows represent significant (p < 0.05) and nonsignificant (p > 0.05) relationships, respectively. Numbers adjacent to arrows are standardized path coefficients, and R2 values indicate the proportion of variance explained for each endogenous variable. Panel (B) shows the standardized total effects of biochar, lime, pH, recalcitrant C pool, microbial abundance, and vector length on CO2-C release rate. Total effects are the sums of direct and indirect effects and are standardized using the standard deviations of the predictor and response variables, rather than normalized to the control treatment. * p < 0.05; ** p < 0.01; *** p < 0.001.
4. Discussion
4.1. Liming Increases Soil CO2 Release in Association with Increased C Availability and Microbial Activity
The early stimulation of soil CO2 release by lime alone was consistent with our first hypothesis and may partly reflect increased labile C availability. Liming may have promoted microbial activity by alleviating the constraints imposed by severe soil acidity. Acidification can restrict microbial activity both directly through proton and Al toxicity and indirectly by altering nutrient and organic matter availability [49]. Increasing soil pH and reducing exchangeable Al can therefore create a more favorable environment for microbial growth and extracellular enzyme production [50,51]. Experiments using limed forest-floor material have shown that higher pH can increase DOC solubility and leaching, with both chemical and microbial processes contributing to DOC dynamics [52]. The greater microbial biomass and higher activities of several enzymes under L relative to CK, together with increased labile C availability, are consistent with enhanced microbial C utilization.
Notably, although the biochar had a pH of 9.11 and was applied at 10 t ha−1, B did not significantly increase soil pH relative to CK, whereas L did (Figure 2). Biochar pH does not quantify its acid-neutralizing capacity, which depends on the composition of its alkaline constituents [53]. The limited pH response may reflect insufficient effective alkalinity relative to soil buffering. Despite reducing exchangeable acidity and Al3+, B did not reproduce the pH correction achieved by L under the conditions examined here.
However, amelioration of soil acidity alone cannot fully explain the differences in soil CO2 release. This is particularly evident from the comparison between L and LB: both treatments effectively ameliorated soil acidity, but the mean CO2-C release rate under LB was 18% and 13% lower than under L in soils collected at 3 and 6 months, respectively (Figure 1D). This contrast suggests that increasing pH does not necessarily lead to greater soil CO2 release; rather, the response may depend on how acidity alleviation subsequently modifies substrate availability and microbial C acquisition. Previous studies have similarly shown that liming effects on SOC mineralization vary among soils and can depend on the amount and accessibility of mineralizable C [20,54]. Recent field studies have also reported acidity amelioration accompanied by changes in soil microbial properties or enzyme activities following lime–biochar co-application [55,56]. In our study, L increased soil pH and decreased exchangeable Al relative to CK (Figure 2), while the SEM linked the lime predictor to greater microbial abundance and inferred C limitation (Figure 6). Together, these observations suggest that acidity amelioration may increase microbial C demand as well as promote microbial growth.
4.2. Lime–Biochar Co-Application Mitigates Lime-Induced Soil CO2 Release in Association with Changes in C Availability and Microbial C Limitation
The lower early soil CO2 release under LB than under L was consistent with our second hypothesis and may partly reflect differences in soil C availability. The higher non-hydrolysable (recalcitrant) C concentrations under B and LB relative to CK also supported the biochar-related prediction of our first hypothesis (Figure 3). High-temperature biochar generally contains a large proportion of aromatic and chemically resistant C while contributing relatively little readily decomposable C [57]. Microspectroscopic evidence from a biochar-amended Ferralsol has shown that sorption and the development of organic and organo-mineral coatings can retain root-derived C and microbial necromass, contributing to protection from decomposition [28]. The increase in RP-C may also partly reflect the direct contribution of biochar-derived C. Previous studies of lime–biochar co-application have reported variable effects on soil CO2 release, suggesting that the respiratory response depends strongly on biochar characteristics and the availability of decomposable substrates [34,35]. The lower DOC concentrations under LB than under L at 3 and 6 months further suggest that differences in substrate availability may have contributed to the lower soil CO2 release (Table 1).
Lime–biochar co-application also modified the microbial resource-acquisition response to liming. The increase in vector length under L relative to CK at 3 and 6 months indicates that the improvement in soil conditions was accompanied by greater inferred microbial C limitation. This may reflect increased microbial C demand as microbial growth was stimulated after liming. Such a response is consistent with ecological enzyme theory, which predicts that microorganisms adjust their investment in extracellular enzymes according to resource availability and demand [45]. By comparison, the lower GMEA and vector length under LB than under L indicate lower overall potential enzyme activity and weaker C limitation, respectively. Interestingly, this response differs from the general pattern reported for biochar alone. A meta-analysis based on ecoenzymatic stoichiometry found that biochar generally increased vector length, although the response varied with biochar and soil properties [58]. The lower C limitation under LB may therefore be specific to its co-application with lime, consistent with the differences in C availability discussed above.
At 3 and 6 months, L and LB showed lower vector angles than CK, suggesting weaker relative microbial P limitation, but their incubation CO2 responses differed markedly. This indicates that relief of P limitation alone cannot fully explain the contrasting CO2 responses between the two treatments. Previous studies have shown that alleviating microbial P limitation can stimulate soil C release, but that this response depends on soil C availability [59]. Similarly, P-induced increases in soil respiration have been linked to greater availability of organic C for microbial decomposition [60]. In our study, the similar direction of the vector-angle response under L and LB, despite their contrasting soil CO2 release, suggests that differences in C availability may also have contributed to these responses.
4.3. Temporal Shifts in the Effects of Lime Alone and Lime–Biochar Co-Application on Soil CO2 Release
The contrast between L and LB changed over the sampling period. At 12 months, the stimulatory effect of L relative to CK was no longer evident, whereas B and LB significantly increased soil CO2 release relative to CK. The early reduction under LB relative to L was no longer observed, consistent with our third hypothesis (Figure 1D). This temporal shift suggests that the processes associated with soil CO2 release changed as lime and biochar continued to interact with the soil.
For lime alone, the disappearance of the early CO2 response may reflect changes in the balance between C mobilization and microbial consumption. In a leaching-incubation experiment using limed mor humus, DOC concentrations were initially highest under the largest lime application but declined later in all treatments; the authors attributed this decline to protonation associated with nitrification [61]. This illustrates that DOC trajectories after liming can reflect changing chemical conditions as well as microbial processes, rather than substrate depletion alone. In our experiment, DOC under L was lower at 12 months than at 3 and 6 months, but it remained significantly higher than under CK (Table 1). Changes in substrate supply may therefore have contributed to the weakening CO2 response. Seasonal variation and continued fertilizer inputs may also have contributed to the temporal pattern.
The temporal response to biochar was different. The short-term effect discussed above was associated with higher recalcitrant C concentrations and weaker inferred microbial C limitation under LB, but the reduction in CO2 release did not persist throughout the experiment. The higher soil CO2 release under B and LB at 12 months points to a time-dependent response to biochar application. Previous studies have similarly shown that fresh and aged biochar can differ substantially in their effects on C mineralization [32,33]. During aging, oxidation and other physicochemical changes can modify biochar surface functional groups, pore characteristics, and sorption properties, with consequences for the accessibility of both biochar-derived and native soil organic C to microorganisms [62]. Such changes offer one possible explanation for the higher soil CO2 release under B and LB at 12 months. Similar time-dependent changes in the effects of biochar on soil C mineralization have also been reported in previous studies [24,25,63].
The effect of aging on SOC decomposition is also unlikely to be uniform. Although changes in biochar surface properties may alter substrate accessibility, a long-term Ferralsol field study demonstrated that biochar-associated organic and organo-mineral interfaces can retain rhizodeposits and microbial necromass and contribute to reduced native SOC mineralization [28]. The relative importance of these processes is likely to change as biochar interacts with soil and may help explain why the effects of biochar on C mineralization vary among soils and experimental durations.
4.4. Limitations and Implications for Future Research
The combination of a one-year field experiment and laboratory incubations provided insights into the temporal responses of soil C fractions and CO2 release to lime–biochar co-application. These responses were evaluated at one site, using one biochar and a single application rate for each amendment. The 90-day incubations allowed treatment comparisons under common conditions but did not quantify field CO2 fluxes or annual C losses. Composite sampling of the amended 0–20 cm layer also left vertical stratification and downward transport unresolved. Longer-term field observations, including depth-resolved sampling, leachate collection, and repeated SOC-stock measurements, would help establish how the observed responses translate into C retention at the soil-profile scale.
Further interpretation depends on identifying the sources of the released CO2 and the non-hydrolysable C fraction. Changes in labile C, microbial biomass, and enzyme activities were consistent with microbial involvement in the CO2 response, but organic and inorganic sources were not separated. This distinction is particularly relevant to carbonate-containing amendments, for which inorganic C reactions can contribute to measured CO2 alongside organic-C decomposition [20,54]. Similarly, RP-C was defined by acid hydrolysis and could include biochar-derived C as well as native SOC. Measurements of inorganic C combined with appropriately designed isotope-tracing experiments would help distinguish these contributions and determine whether the observed treatment responses involve changes in native SOC mineralization.
Mechanistic interpretation also depends on the properties of the biochar used. Initial characterization included pH and elemental composition, whereas acid-neutralizing capacity, volatile matter, ash content, fixed C, CEC, BET specific surface area, and surface functional groups (FTIR) were not characterized. Biochar properties were also not reassessed at 12 months. Comparing the original and field-aged material, together with targeted measurements of DOC and enzyme sorption, would help test whether changes in effective alkalinity and surface properties contribute to the observed soil and microbial responses. Such measurements would strengthen the links between the proposed mechanisms and the temporal effects of lime–biochar co-application.
5. Conclusions
This study showed that liming stimulated soil CO2 release in intensively managed Lei bamboo soils in the short term, whereas lime–biochar co-application partially mitigated this effect. The mitigating effect of co-application relative to lime alone was associated with higher non-hydrolysable (recalcitrant) C concentrations and weaker microbial C limitation. In contrast, the stimulation under lime alone was associated with greater microbial abundance and C limitation. Together, these associations suggest that changes in C availability and microbial resource acquisition may contribute to the contrasting soil CO2 responses. Importantly, the early mitigation under co-application was no longer evident at 12 months, highlighting the time-dependent nature of its effects. Lime–biochar co-application may therefore offer a means of ameliorating acidified bamboo soils while moderating the early CO2 response to liming, although its longer-term implications for SOC stability require further evaluation.
Supplementary Materials
The following supporting information can be downloaded at: https://www.mdpi.com/article/10.3390/agriculture16212359/s1, Figure S1: Redundancy analysis (RDA) of the relationships between soil properties and extracellular enzyme activities (A) and microbial abundances (B); Figure S2: Relationships between soil mean CO2-C release rate and soil physicochemical and microbial properties. Table S1: Overall effects of lime and biochar on soil responses.
Author Contributions
Conceptualization, X.S. and H.J.; methodology, X.S. and H.J.; software, X.S. and H.J.; validation, X.S. and H.J.; formal analysis, X.S. and H.J.; investigation, X.S. and H.J.; resources, X.S. and H.J.; data curation, X.S. and H.J.; writing—original draft preparation, X.S. and H.J.; writing—review and editing, L.X., J.W., X.M. and Y.Z.; visualization, Y.Z.; supervision, Y.Z.; project administration, Y.Z.; funding acquisition, J.C. All authors have read and agreed to the published version of the manuscript.
Funding
This research was funded by the National Key R&D Program of China (2023YFD1901800), National Natural Science Foundation of China (42407449), Department of Agriculture and Rural Affairs of Zhejiang Province (2025SNJF018), and Zhejiang Provincial Natural Science Foundation of China (Grant No. LR24C160001).
Data Availability Statement
The original contributions presented in this study are included in the article. Further inquiries can be directed to the corresponding author.
Conflicts of Interest
The authors declare no conflicts of interest.
Abbreviations
The following abbreviations are used in this manuscript:
| TN | Total nitrogen |
| AP | Available phosphorus |
| AK | Available potassium |
| MBC | Microbial biomass carbon |
| MBN | Microbial biomass nitrogen |
| DOC | Dissolved organic carbon |
| DN | Dissolved nitrogen |
| LPI-C and LPII-C | Hydrolysable C fractions |
| RP-C | Recalcitrant C fraction |
| MR | Microbial respiration |
| GMEA | Geometric mean enzyme activity |
References
- Galloway, J.N.; Townsend, A.R.; Erisman, J.W.; Bekunda, M.; Cai, Z.; Freney, J.R.; Martinelli, L.A.; Seitzinger, S.P.; Sutton, M.A. Transformation of the Nitrogen Cycle: Recent Trends, Questions, and Potential Solutions. Science 2008, 320, 889–892. [Google Scholar] [CrossRef] [Scilit]
- Zhao, Y.; Duan, L.; Xing, J.; Larssen, T.; Nielsen, C.P.; Hao, J. Soil Acidification in China: Is Controlling SO2 Emissions Enough? Environ. Sci. Technol. 2009, 43, 8021–8026. [Google Scholar] [CrossRef] [Scilit]
- Dai, Z.; Zhang, X.; Tang, C.; Muhammad, N.; Wu, J.; Brookes, P.C.; Xu, J. Potential role of biochars in decreasing soil acidification—A critical review. Sci. Total Environ. 2017, 581–582, 601–611. [Google Scholar] [CrossRef] [Scilit]
- Lal, R. Soil Carbon Sequestration Impacts on Global Climate Change and Food Security. Science 2004, 304, 1623–1627. [Google Scholar] [CrossRef] [Scilit]
- Amelung, W.; Bossio, D.; de Vries, W.; Kögel-Knabner, I.; Lehmann, J.; Amundson, R.; Bol, R.; Collins, C.; Lal, R.; Leifeld, J.; et al. Towards a global-scale soil climate mitigation strategy. Nat. Commun. 2020, 11, 5427. [Google Scholar] [CrossRef] [Scilit]
- Chen, D.; Wang, Y.; Lan, Z.; Li, J.; Xing, W.; Hu, S.; Bai, Y. Biotic community shifts explain the contrasting responses of microbial and root respiration to experimental soil acidification. Soil Biol. Biochem. 2015, 90, 139–147. [Google Scholar] [CrossRef] [Scilit]
- Tian, P.; Zhao, X.; Liu, S.; Sun, Z.; Jing, Y.; Wang, Q. Soil microbial respiration in forest ecosystems along a north-south transect of eastern China: Evidence from laboratory experiments. Catena 2022, 211, 105980. [Google Scholar] [CrossRef] [Scilit]
- Luo, Y.; Durenkamp, M.; De Nobili, M.; Lin, Q.; Brookes, P.C. Short term soil priming effects and the mineralisation of biochar following its incorporation to soils of different pH. Soil Biol. Biochem. 2011, 43, 2304–2314. [Google Scholar] [CrossRef] [Scilit]
- Karhu, K.; Auffret, M.D.; Dungait, J.A.J.; Hopkins, D.W.; Prosser, J.I.; Singh, B.K.; Subke, J.A.; Wookey, P.A.; Ågren, G.I.; Sebastià, M.T.; et al. Temperature sensitivity of soil respiration rates enhanced by microbial community response. Nature 2014, 513, 81–84. [Google Scholar] [CrossRef] [Scilit]
- Li, Y.; Li, Y.; Chang, S.X.; Yang, Y.; Fu, S.; Jiang, P.; Luo, Y.; Yang, M.; Chen, Z.; Hu, S.; et al. Biochar reduces soil heterotrophic respiration in a subtropical plantation through increasing soil organic carbon recalcitrancy and decreasing carbon-degrading microbial activity. Soil Biol. Biochem. 2018, 122, 173–185. [Google Scholar] [CrossRef] [Scilit]
- Nannipieri, P.; Trasar-Cepeda, C.; Dick, R.P. Soil enzyme activity: A brief history and biochemistry as a basis for appropriate interpretations and meta-analysis. Biol. Fertil. Soils 2018, 54, 11–19. [Google Scholar] [CrossRef] [Scilit]
- Li, S.; Cui, Y.; Xia, Z.; Zhang, X.; Zhu, M.; Gao, Y.; An, S.; Yu, W.; Ma, Q. The mechanism of the dose effect of straw on soil respiration: Evidence from enzymatic stoichiometry and functional genes. Soil Biol. Biochem. 2022, 168, 108636. [Google Scholar] [CrossRef] [Scilit]
- Sinsabaugh, R.L. Phenol oxidase, peroxidase and organic matter dynamics of soil. Soil Biol. Biochem. 2010, 42, 391–404. [Google Scholar] [CrossRef] [Scilit]
- Cui, Y.; Bing, H.; Fang, L.; Jiang, M.; Shen, G.; Yu, J.; Wang, X.; Zhu, H.; Wu, Y.; Zhang, X. Extracellular enzyme stoichiometry reveals the carbon and phosphorus limitations of microbial metabolisms in the rhizosphere and bulk soils in alpine ecosystems. Plant Soil 2021, 458, 7–20. [Google Scholar] [CrossRef] [Scilit]
- Holland, J.E.; Bennett, A.E.; Newton, A.C.; White, P.J.; McKenzie, B.M.; George, T.S.; Pakeman, R.J.; Bailey, J.S.; Fornara, D.A.; Hayes, R.C. Liming impacts on soils, crops and biodiversity in the UK: A review. Sci. Total Environ. 2018, 610–611, 316–332. [Google Scholar] [CrossRef] [Scilit]
- Barcelos, J.P.Q.; Mariano, E.; Jones, D.L.; Rosolem, C.A. Topsoil and subsoil C and N turnover are affected by superficial lime and gypsum application in the short-term. Soil Biol. Biochem. 2021, 163, 108456. [Google Scholar] [CrossRef] [Scilit]
- Chatzistathis, T.; Alifragis, D.; Papaioannou, A. The influence of liming on soil chemical properties and on the alleviation of manganese and copper toxicity in Juglans regia, Robinia pseudoacacia, Eucalyptus sp. and Populus sp. plantations. J. Environ. Manag. 2015, 150, 149–156. [Google Scholar] [CrossRef] [Scilit]
- Deus, A.C.F.; Büll, L.T.; Guppy, C.N.; Santos, S.D.M.C.; Moreira, L.L.Q. Effects of lime and steel slag application on soil fertility and soybean yield under a no till-system. Soil Tillage Res. 2020, 196, 104422. [Google Scholar] [CrossRef] [Scilit]
- Abdalla, M.; Espenberg, M.; Zavattaro, L.; Lellei-Kovacs, E.; Mander, U.; Smith, K.; Thorman, R.; Damatirca, C.; Schils, R.; ten-Berge, H.; et al. Does liming grasslands increase biomass productivity without causing detrimental impacts on net greenhouse gas emissions? Environ. Pollut. 2022, 300, 118999. [Google Scholar] [CrossRef] [Scilit]
- Ahmad, W.; Singh, B.; Dijkstra, F.A.; Dalal, R.C. Inorganic and organic carbon dynamics in a limed acid soil are mediated by plants. Soil Biol. Biochem. 2013, 57, 549–555. [Google Scholar] [CrossRef] [Scilit]
- Gibbons, J.M.; Williamson, J.C.; Williams, A.P.; Withers, P.J.A.; Hockley, N.; Harris, I.M.; Hughes, J.W.; Taylor, R.L.; Jones, D.L.; Healey, J.R. Sustainable nutrient management at field, farm and regional level: Soil testing, nutrient budgets and the trade-off between lime application and greenhouse gas emissions. Agric. Ecosyst. Environ. 2014, 188, 48–56. [Google Scholar] [CrossRef] [Scilit]
- IPCC. Climate Change 2014: Synthesis Report. Contribution of Working Groups I, II and III to the Fifth Assessment Report of the Intergovernmental Panel on Climate Change; Core Writing Team, Pachauri, R.K., Meyer, L.A., Eds.; IPCC: Geneva, Switzerland, 2014. [Google Scholar]
- Wachendorf, C. Effects of liming and mineral N on initial decomposition of soil organic matter and post harvest root residues of poplar. Geoderma 2015, 259–260, 243–250. [Google Scholar] [CrossRef] [Scilit]
- Yang, Y.; Sun, K.; Liu, J.; Chen, Y.; Han, L. Changes in soil properties and CO2 emissions after biochar addition: Role of pyrolysis temperature and aging. Sci. Total Environ. 2022, 839, 156333. [Google Scholar] [CrossRef] [Scilit]
- Yang, Y.; Sun, K.; Han, L.; Chen, Y.; Liu, J.; Xing, B. Biochar stability and impact on soil organic carbon mineralization depend on biochar processing, aging and soil clay content. Soil Biol. Biochem. 2022, 169, 108657. [Google Scholar] [CrossRef] [Scilit]
- Wang, J.; Xiong, Z.; Kuzyakov, Y. Biochar stability in soil: Meta-analysis of decomposition and priming effects. GCB Bioenergy 2016, 8, 512–523. [Google Scholar] [CrossRef] [Scilit]
- Chen, J.; Sun, X.; Zheng, J.; Zhang, X.; Liu, X.; Bian, R.; Li, L.; Cheng, K.; Zheng, J.; Pan, G. Biochar amendment changes temperature sensitivity of soil respiration and composition of microbial communities 3 years after incorporation in an organic carbon-poor dry cropland soil. Biol. Fertil. Soils 2018, 54, 175–188. [Google Scholar] [CrossRef] [Scilit]
- Weng, Z.H.; Van Zwieten, L.; Tavakkoli, E.; Rose, M.T.; Singh, B.P.; Joseph, S.; Macdonald, L.M.; Kimber, S.; Morris, S.; Rose, T.J.; et al. Microspectroscopic visualization of how biochar lifts the soil organic carbon ceiling. Nat. Commun. 2022, 13, 5177. [Google Scholar] [CrossRef] [Scilit]
- Chen, J.; Chen, D.; Xu, Q.; Fuhrmann, J.J.; Li, L.; Pan, G.; Li, Y.; Qin, H.; Liang, C.; Sun, X. Organic carbon quality, composition of main microbial groups, enzyme activities, and temperature sensitivity of soil respiration of an acid paddy soil treated with biochar. Biol. Fertil. Soils 2019, 55, 185–197. [Google Scholar] [CrossRef] [Scilit]
- Mitchell, P.J.; Simpson, A.J.; Soong, R.; Simpson, M.J. Shifts in microbial community and water-extractable organic matter composition with biochar amendment in a temperate forest soil. Soil Biol. Biochem. 2015, 81, 244–254. [Google Scholar] [CrossRef] [Scilit]
- Liu, Y.; Guo, K.; Zhao, Y.; Li, S.; Wu, Q.; Liang, C.; Sun, X.; Xu, Q.; Chen, J.; Qin, H. Change in composition and function of microbial communities in an acid bamboo (Phyllostachys praecox) plantation soil with the addition of three different biochars. For. Ecol. Manag. 2020, 473, 118336. [Google Scholar] [CrossRef] [Scilit]
- Zhao, R.; Coles, N.; Wu, J. Carbon mineralization following additions of fresh and aged biochar to an infertile soil. Catena 2015, 125, 183–189. [Google Scholar] [CrossRef] [Scilit]
- Liu, Z.; Zhu, M.; Wang, J.; Liu, X.; Guo, W.; Zheng, J.; Bian, R.; Wang, G.; Zhang, X.; Cheng, K.; et al. The responses of soil organic carbon mineralization and microbial communities to fresh and aged biochar soil amendments. GCB Bioenergy 2019, 11, 1408–1420. [Google Scholar] [CrossRef] [Scilit]
- Mosharrof, M.; Uddin, M.K.; Sulaiman, M.F.; Mia, S.; Shamsuzzaman, S.M.; Haque, A.N.A. Combined Application of Biochar and Lime Increases Maize Yield and Accelerates Carbon Loss from an Acidic Soil. Agronomy 2021, 11, 1313. [Google Scholar] [CrossRef] [Scilit]
- Mosharrof, M.; Uddin, M.K.; Sulaiman, M.F.; Mia, S.; Shamsuzzaman, S.M.; Haque, A.N.A. Combined Application of Rice Husk Biochar and Lime Increases Phosphorus Availability and Maize Yield in an Acidic Soil. Agriculture 2021, 11, 793. [Google Scholar] [CrossRef] [Scilit]
- Adekiya, A.O.; Ayorinde, B.B.; Ogunbode, T. Combined lime and biochar application enhances cowpea growth and yield in tropical Alfisol. Sci. Rep. 2024, 14, 1389. [Google Scholar] [CrossRef] [Scilit]
- Qin, H.; Wang, H.; Strong, P.J.; Li, Y.; Xu, Q.; Wu, Q. Rapid soil fungal community response to intensive management in a bamboo forest developed from rice paddies. Soil Biol. Biochem. 2014, 68, 177–184. [Google Scholar] [CrossRef] [Scilit]
- Guo, K.; Zhao, Y.; Liu, Y.; Chen, J.; Wu, Q.; Ruan, Y.; Li, S.; Shi, J.; Zhao, L.; Sun, X.; et al. Pyrolysis temperature of biochar affects ecoenzymatic stoichiometry and microbial nutrient-use efficiency in a bamboo forest soil. Geoderma 2020, 363, 114162. [Google Scholar] [CrossRef] [Scilit]
- Lu, R.K. Analytical Methods for Soil and Agro-Chemistry; China Agricultural Science and Technology Press: Beijing, China, 2000. (In Chinese) [Google Scholar]
- Wu, J.; Joergensen, R.G.; Pommerening, B.; Chaussod, R.; Brookes, P.C. Measurement of soil microbial biomass C by fumigation-extraction—an automated procedure. Soil Biol. Biochem. 1990, 22, 1167–1169. [Google Scholar] [CrossRef] [Scilit]
- Rovira, P.; Vallejo, V.R. Labile and recalcitrant pools of carbon and nitrogen in organic matter decomposing at different depths in soil: An acid hydrolysis approach. Geoderma 2002, 107, 109–141. [Google Scholar] [CrossRef] [Scilit]
- Campbell, C.D.; Chapman, S.J.; Cameron, C.M.; Davidson, M.S.; Potts, J.M. A Rapid Microtiter Plate Method To Measure Carbon Dioxide Evolved from Carbon Substrate Amendments so as To Determine the Physiological Profiles of Soil Microbial Communities by Using Whole Soil. Appl. Environ. Microbiol. 2003, 69, 3593–3599. [Google Scholar] [CrossRef] [Scilit]
- Saiya-Cork, K.R.; Sinsabaugh, R.L.; Zak, D.R. The effects of long term nitrogen deposition on extracellular enzyme activity in an Acer saccharum forest soil. Soil Biol. Biochem. 2002, 34, 1309–1315. [Google Scholar] [CrossRef] [Scilit]
- DeForest, J.L. The influence of time, storage temperature, and substrate age on potential soil enzyme activity in acidic forest soils using MUB-linked substrates and l-DOPA. Soil Biol. Biochem. 2009, 41, 1180–1186. [Google Scholar] [CrossRef] [Scilit]
- Moorhead, D.L.; Sinsabaugh, R.L.; Hill, B.H.; Weintraub, M.N. Vector analysis of ecoenzyme activities reveal constraints on coupled C, N and P dynamics. Soil Biol. Biochem. 2016, 93, 1–7. [Google Scholar] [CrossRef] [Scilit]
- Cui, Y.; Moorhead, D.L.; Guo, X.; Peng, S.; Wang, Y.; Zhang, X.; Fang, L. Stoichiometric models of microbial metabolic limitation in soil systems. Glob. Ecol. Biogeogr. 2021, 30, 2297–2311. [Google Scholar] [CrossRef] [Scilit]
- Situ, G.; Zhao, Y.; Zhang, L.; Yang, X.; Chen, D.; Li, S.; Wu, Q.; Xu, Q.; Chen, J.; Qin, H. Linking the chemical nature of soil organic carbon and biological binding agent in aggregates to soil aggregate stability following biochar amendment in a rice paddy. Sci. Total Environ. 2022, 847, 157460. [Google Scholar] [CrossRef] [Scilit]
- Fierer, N.; Jackson, J.A.; Vilgalys, R.; Jackson, R.B. Assessment of Soil Microbial Community Structure by Use of Taxon-Specific Quantitative PCR Assays. Appl. Environ. Microbiol. 2005, 71, 4117–4120. [Google Scholar] [CrossRef] [Scilit]
- Wenyika, P.; Enesi, R.O.; Gorim, L.Y.; Dyck, M. Effects of liming on soil biota and related processes in agroecosystems: A review. Discov. Soil 2025, 2, 37. [Google Scholar] [CrossRef] [Scilit]
- Razanamalala, K.; Razafimbelo, T.; Maron, P.A.; Ranjard, L.; Chemidlin, N.; Lelièvre, M.; Dequiedt, S.; Ramaroson, V.H.; Marsden, C.; Becquer, T.; et al. Soil microbial diversity drives the priming effect along climate gradients: A case study in Madagascar. ISME J. 2018, 12, 451–462. [Google Scholar] [CrossRef] [Scilit]
- Marinos, R.E.; Bernhardt, E.S. Soil carbon losses due to higher pH offset vegetation gains due to calcium enrichment in an acid mitigation experiment. Ecology 2018, 99, 2363–2373. [Google Scholar] [CrossRef] [Scilit]
- Andersson, S.; Nilsson, S.I.; Saetre, P. Leaching of dissolved organic carbon (DOC) and dissolved organic nitrogen (DON) in mor humus as affected by temperature and pH. Soil Biol. Biochem. 2000, 32, 1–10. [Google Scholar] [CrossRef] [Scilit]
- Fidel, R.B.; Laird, D.A.; Thompson, M.L.; Lawrinenko, M. Characterization and quantification of biochar alkalinity. Chemosphere 2017, 167, 367–373. [Google Scholar] [CrossRef] [Scilit]
- Grover, S.P.; Butterly, C.R.; Wang, X.; Tang, C. The short-term effects of liming on organic carbon mineralisation in two acidic soils as affected by different rates and application depths of lime. Biol. Fertil. Soils 2017, 53, 431–443. [Google Scholar] [CrossRef] [Scilit]
- Ahmad, S.; Wang, M.; Zhang, H.; Deng, Y.; Liang, Q.; He, B.; Wen, R. Synergistic application of biochar and lime modulates rhizosphere microbiome, suppresses pathogens, and enhances disease resistance in sugarcane. BMC Microbiol. 2025, 25, 622. [Google Scholar] [CrossRef] [Scilit]
- Tu, Q.; Zhao, P.; Li, Y.; Liu, G.; Liu, J. Synergistic effects of biochar-lime enhance acidic soil remediation and sustain peanut productivity under continuous cropping systems. Sci. Rep. 2025, 15, 39030. [Google Scholar] [CrossRef] [Scilit]
- Zhao, S.; Ta, N.; Li, Z.; Yang, Y.; Zhang, X.; Liu, D.; Zhang, A.; Wang, X. Varying pyrolysis temperature impacts application effects of biochar on soil labile organic carbon and humic fractions. Appl. Soil Ecol. 2018, 123, 484–493. [Google Scholar] [CrossRef] [Scilit]
- Chen, Z.; Jin, P.; Wang, H.; Hu, T.; Lin, X.; Xie, Z. Ecoenzymatic stoichiometry reveals stronger microbial carbon and nitrogen limitation in biochar amendment soils: A meta-analysis. Sci. Total Environ. 2022, 838, 156532. [Google Scholar] [CrossRef] [Scilit]
- Cui, Y.; Moorhead, D.L.; Wang, X.; Xu, M.; Wang, X.; Wei, X.; Zhu, Z.; Ge, T.; Peng, S.; Zhu, B.; et al. Decreasing microbial phosphorus limitation increases soil carbon release. Geoderma 2022, 419, 115868. [Google Scholar] [CrossRef] [Scilit]
- Spohn, M.; Schleuss, P.M. Addition of inorganic phosphorus to soil leads to desorption of organic compounds and thus to increased soil respiration. Soil Biol. Biochem. 2019, 130, 220–226. [Google Scholar] [CrossRef] [Scilit]
- Andersson, S.; Valeur, I.; Nilsson, I. Influence of lime on soil respiration, leaching of DOC, and C/S relationships in the mor humus of a haplic podsol. Environ. Int. 1994, 20, 81–88. [Google Scholar] [CrossRef] [Scilit]
- Luo, L.; Lv, J.; Chen, Z.; Huang, R.; Zhang, S. Insights into the attenuated sorption of organic compounds on black carbon aged in soil. Environ. Pollut. 2017, 231, 1469–1476. [Google Scholar] [CrossRef] [Scilit]
- Jiang, X.; Tan, X.; Cheng, J.; Haddix, M.L.; Cotrufo, M.F. Interactions between aged biochar, fresh low molecular weight carbon and soil organic carbon after 3.5 years soil-biochar incubations. Geoderma 2019, 333, 99–107. [Google Scholar] [CrossRef] [Scilit]

Disclaimer/Publisher’s Note: The statements, opinions and data contained in all publications are solely those of the individual author(s) and contributor(s) and not of MDPI and/or the editor(s). MDPI and/or the editor(s) disclaim responsibility for any injury to people or property resulting from any ideas, methods, instructions or products referred to in the content. |
© 2026 by the authors. Licensee MDPI, Basel, Switzerland. This article is an open access article distributed under the terms and conditions of the Creative Commons Attribution (CC BY) license.