


Abstract
To elucidate the synergistic effects of nitrogen application rate and fertilization method on the yield and quality of high-quality japonica rice, a two-year field experiment (2024 and 2025) was conducted using Koshihikari with three fertilization methods—farmers’ practice (FP), light and simplified fertilization (LSF), and precise quantitative side-deep fertilization (PQSF)—and five nitrogen rates (0, 45, 90, 135, and 180 kg ha−1). In 2024, comprehensive traits were evaluated, including grain-filling dynamics, protein fractions, panicle traits, milling quality, multidimensional quality, and yield. In 2025, only core yield and quality traits were measured for validation. Superior grains had higher filling rates and earlier initiation, whereas inferior grains showed delayed initiation and later peak timing; however, high nitrogen shortened effective filling duration and exacerbated delayed filling in inferior grains. Protein accumulation was closely associated with grain-filling parameters, with glutelin and prolamin showing more persistent associations than albumin and globulin. Milling quality was optimal at 90 kg ha−1 (N90), whereas appearance and eating quality deteriorated with increasing nitrogen; springiness and adhesion force peaked at N45. Under high nitrogen, PQSF sustained inferior grain filling and mitigated the negative effects of excessive storage protein accumulation on eating quality. LSF achieved the highest yield (approximately 8900 kg ha−1) within 135–153 kg ha−1, whereas PQSF combined with 135 kg ha−1 provided a quality-oriented strategy, increasing taste value by 3.00 and 2.33 points and reducing chalkiness percentage by 1.70 and 0.25 percentage points relative to FP and LSF, respectively, while maintaining lower hardness. PCA and hierarchical clustering analyses revealed that nitrogen rate established the fundamental framework for yield and quality, while fertilization method provided secondary regulation. The core yield and quality findings were consistent across both years, confirming the robustness of the conclusions and providing a basis for precise nitrogen management of high-quality japonica rice in the Liaodong coastal rice region; however, the mechanistic insights were mainly derived from 2024 and require further multi-year validation.
1. Introduction
Koshihikari, a high-quality japonica rice cultivar, is widely recognized as a benchmark for premium quality rice and is renowned worldwide for its low amylose and protein contents and excellent taste [1]. Since 1979, it has been one of the most widely cultivated rice varieties in Japan and has been introduced into numerous countries and regions, including the United States, Australia, and Italy [2]. In China, Koshihikari has been introduced into Donggang in Liaoning Province, as well as Shandong and Shanghai. Among these regions, Donggang City is located in the Liaodong rice-growing region along the Yellow Sea, where the rice acreage and production account for approximately 10% of the provincial totals and contribute to over 90% of the city’s rice production. The growing season in this region lasts about 160–165 days. With a latitude similar to that of high-quality japonica rice-producing regions such as Niigata, Japan, Donggang has favorable climatic conditions for producing high-quality japonica rice [3]. However, unlike the slightly acidic soils commonly found in Japan and the alluvial soils of the United States, soils in the Donggang rice-growing region are primarily paddy soil with poor water- and nutrient-retention capacity. This poses unique cultivation challenges for the Koshihikari variety, which is susceptible to lodging [4].
Nitrogen is a key nutrient regulating rice growth and development, yield formation, and grain quality; appropriate nitrogen management is essential for achieving both high yield and high quality [5,6]. However, influenced by traditional farming practices, farmers in this region often apply excessive nitrogen to achieve high yields [7]. These practices not only reduce nitrogen use efficiency and increase the risk of agricultural non-point-source pollution but can also significantly compromise overall rice quality, making it difficult to meet market demand for premium rice [8]. Previous studies have shown that, within a certain nitrogen range, increasing nitrogen application can improve milling quality and protein content, but often causes significant deterioration in appearance, cooking, and eating quality [9,10]. This trade-off is particularly pronounced in high-quality varieties, such as Koshihikari, which are extremely sensitive to nitrogen management. Excessive nitrogen application can promote excessive vegetative growth and delay maturity, exacerbate the disparity in grain filling between superior and inferior grains, and impair the filling of inferior grains, ultimately increasing chalkiness and deteriorating textural quality [11,12]. These challenges are particularly pronounced for high-quality japonica rice such as Koshihikari in the Liaodong coastal rice region, where optimizing nitrogen management is critical for balancing yield and quality.
Rice quality is not merely a static reflection of final chemical composition, but rather a dynamic physiological outcome that spans the entire grain-filling and maturation process. The accumulation rates and proportions of storage protein components, including albumin, globulin, prolamin, and glutelin, at different stages after heading directly determine rice nutritional and eating quality. Nitrogen management and the timing of soil nutrient supply significantly regulate this process [13]. At the same time, rice yield is fundamentally determined by the source–sink relationship, and the efficiency of assimilate transport to grains affects the degree of sink filling. Quantitative fitting of the grain-filling dynamics using the Richards growth equation allows key parameters, including initial growth potential, maximum grain-filling rate, average grain-filling rate, active grain-filling period, and the inflection point of grain filling, to be estimated, thereby objectively characterizing the differences and synchrony in grain filling between superior and inferior grains [14,15]. Furthermore, panicle traits are major determinants of rice yield and are closely linked to the efficiency of nitrogen allocation within plants and overall nutrient status [16].
Although numerous studies have examined the effects of nitrogen application rates or fertilization methods on individual rice traits, systematic, comprehensive evaluations integrating dynamic accumulation of grain protein fractions, Richards equation-derived grain-filling parameters, panicle morphogenesis, measured yield, and comprehensive rice quality within a single experimental framework are still limited, particularly regarding two-year field validation under the specific ecological conditions of the Liaodong rice-growing region along the Yellow Sea.
In contrast to the farmers’ practice (FP), an extensive management model characterized primarily by surface broadcasting or shallow incorporation, which can lead to spatiotemporal mismatches in nutrient availability and low nitrogen use efficiency [17], this study introduced two novel fertilizer management techniques: light and simplified fertilization (LSF) and precise quantitative side-deep fertilization (PQSF). LSF is based on the management principles of “reducing nitrogen input” and “early control and late promotion,” aiming to optimize nitrogen supply and root vitality to improve rice quality while maintaining stable yields [18,19,20]. PQSF uses mechanized equipment to precisely apply nitrogen fertilizer to the deep rhizosphere, creating micro-zones of high nutrient concentration in the root zone. This significantly reduces nitrogen loss and improves fertilizer use efficiency, making it a key technological strategy for improving productivity and environmental sustainability [21,22].
We hypothesized that FP would result in spatiotemporal mismatches between nitrogen supply and crop demand, leading to excessive vegetative growth and poor inferior-grain filling. In contrast, LSF was expected to synchronize nitrogen supply with the demand rhythm of Koshihikari through an “early-control, late-promotion” strategy, thereby improving sink filling and yield. PQSF was expected to create a concentrated nitrogen zone in the deep root layer, reduce nitrogen loss, delay root senescence, and sustain assimilate transport to inferior grains under high nitrogen, thereby stabilizing quality. These contrasting spatiotemporal nitrogen supply patterns were expected to differentially regulate source–sink coordination, grain-filling dynamics, protein fraction accumulation, and final yield and quality.
To test these hypotheses, this study used Koshihikari as the experimental material and conducted a two-year field experiment (2024 and 2025) combining three fertilization methods and five nitrogen application rates. In 2024, comprehensive traits were measured, including: (1) the dynamic accumulation of protein fractions in grains from 10 to 50 days after heading; (2) Richards equation-derived grain-filling parameters of superior and inferior grains; (3) the traits of primary and secondary panicle branches and measured yield; and (4) milling quality, appearance quality, nutritional quality, cooking and eating quality, and textural characteristics. In 2025, core yield and quality traits—including grain yield, milling quality, protein content, chalkiness, and taste value—were measured to validate the reproducibility of the main findings. The mechanistic measurements in 2024 provide preliminary insights into grain-filling dynamics and protein accumulation, and these mechanistic interpretations should be considered indicative and require further multi-year validation. This study preliminarily aimed to elucidate the relationships between source–sink coordination and quality formation in Koshihikari under different nitrogen management strategies and to identify, using multivariate statistical analyses, including PCA and comprehensive scoring evaluation, to identify efficient nitrogen-management schemes suitable for the Liaodong rice-growing region along the Yellow Sea. A further objective was to verify the consistency of the core conclusions across two years. Ultimately, the study aimed to provide a theoretical basis and technical support for reducing nitrogen input, while improving yield and grain quality in high-quality japonica rice production.
2. Materials and Methods
2.1. Experimental Site
Field experiments were conducted in Beijingzi Town, Donggang City, Liaoning Province (39°45′ N, 123°22′ E) during the rice-growing season (May–October) of 2024 and 2025. The study site is located within the eastern coastal rice-growing region of Liaodong along the Yellow Sea and has a temperate monsoon climate. The daily mean temperatures, precipitation, relative humidity, and total sunshine hours during the growing seasons of both years are shown in Figure 1. The soil at the experimental site is classified as paddy soil. Chemical properties of soil samples collected from the 0–20 cm layer before transplanting in 2024 were as follows: total N, 1.21 g kg−1; available P, 25.40 mg kg−1; available K, 96.90 mg kg−1; organic matter, 23.20 g kg−1; and pH, 6.39, indicating moderate soil fertility.
Figure 1.
Mean temperatures, total sunshine hours, precipitation, and relative humidity during the rice growing seasons of 2024 and 2025. (a) Total sunshine hours and relative humidity in 2024; (b) Precipitation and mean temperatures in 2024; (c) Total sunshine hours and relative humidity in 2025; (d) Precipitation and mean temperatures in 2025.
2.2. Experimental Design and Crop Management
The same two-factor randomized complete block design was used in both 2024 and 2025. Factor A was the fertilization method (F), with three levels: farmers’ practice (FP), light and simplified fertilization (LSF), and precise quantitative side-deep fertilization (PQSF). Factor B was nitrogen application rate (N), with five levels: 0, 45, 90, 135, and 180 kg N ha−1. Nitrogen was applied as urea (46% N), phosphorus as calcium superphosphate (16% P2O5), and potassium as potassium chloride (60% K2O). The same fertilizer sources were used for all treatments. For all treatments, phosphorus fertilizer (110 kg P2O5 ha−1) was applied as basal dressing, and potassium fertilizer (110 kg K2O ha−1) was split into two equal applications, with 50% applied as basal and 50% at the panicle initiation stage. Each plot covered an area of 45 m2 and was with three replicates. Rice seedlings were transplanted manually at a spacing of 30.0 × 16.5 cm, with two to three seedlings per hill, following local practices. The adjacent plots were separated using PVC barriers (40.0 cm height: 1.5 mm thickness, inserted 25.0 cm into the soil) to prevent water and nutrient exchange. Each plot was irrigated and drained independently. All other agronomic practices, including water management, mid-season drainage, weeding, and pest and disease control were consistent with conventional local management. The specific nitrogen application rates and timing for each treatment are presented in Table 1 and were identical in both years.
Table 1.
Nitrogen fertilizer application rate for each treatment (kg ha−1).
2.3. Measurement Index and Methods
2.3.1. Sampling and Grain-Filling Parameters
Rice panicles with relatively uniform flowering time and size were selected and tagged at the heading stage. A total of 200 panicles were tagged in each plot. From flowering to maturity, 15 tagged panicles were randomly collected from each plot at 5-day intervals. Superior and inferior grains were separated from each panicle according to their position. Superior grains were defined as the grains on the three primary branches at the top of the panicle, excluding the second grain from the apex; inferior grains were defined as the grains on the secondary branches of the three primary branches at the bottom of the panicle, excluding the grain at the top of each secondary branch. Unfilled grains were removed. After manually removing the hulls, the fresh weight was recorded, and the grains were oven-dried to constant weight for dry weight determination. Each sample consisted of grains pooled from 15 panicles per plot, with three replicate plots per treatment. The same panicle was not sampled twice; new tagged panicles were used at each sampling time to ensure independence.
The Richards growth equation [23] was used to calculate the grain-filling dynamics, and the corresponding grain-filling characteristic parameters were derived using the method of Zhu et al. [24,25]. Grain-filling dynamics were measured only in 2024. Growth analysis of grain filling was therefore performed using the 2024 dataset to fit the following equation:
where W is the weight of the rice grains (mg); A is the final growth (mg); t is the time after flowering (d); and B, K, and N are the equation parameters. The second equation (Equation (2)), derived by taking the first derivative of Equation (1), was used to estimate the effective grain-filling duration and kernel growth rate.
2.3.2. Determination of Rice-Related Quality Indexes
The harvested seeds were threshed, naturally dried, and stored in a cool, well-ventilated, and dry place for 3 months for grain quality measurement. The milling quality of brown rice, milled rice, and head milled rice was measured according to the GB/T 17891-1999 standard [26]. Amylose and protein contents were measured using a Foss 1241 near-infrared grain analyzer (InfratecTM 1241, FOSS, Hillerød, Denmark). Protein fractions were extracted sequentially according to the method of Luthe and Liu [27,28] with minor modifications. Briefly, milled rice flour (0.5 g) was defatted with hexane, air-dried, and then extracted stepwise with the following buffers: (1) distilled water for albumin; (2) 0.5 M NaCl for globulin; (3) 70% (v/v) ethanol for prolamin; and (4) 0.1 M NaOH for glutelin. For each step, the suspension was shaken for 2 h at room temperature and centrifuged at 10,000× g for 10 min at 4 °C. The supernatant was collected, and the residue was used for the next extraction step. Each fraction was diluted appropriately, and protein content was determined using a modified Bradford protein assay kit based on Coomassie Brilliant Blue G-250, with bovine serum albumin (BSA) as the standard. Absorbance was measured at 595 nm. The protein content of each fraction was calculated from the BSA standard curve and expressed as a percentage of dry weight (% dry weight). The rice grain taste quality was measured using an STA1A rice taste meter (SATAKE, Saitama, Japan). Milled rice (30 g) was rinsed until the water became clear and then soaked in a stainless-steel tank for 30 min. Water was added at a ratio of 1:1.2 (rice:water); the rice was placed in a steamer to cook for 40 min and cooled for 1 h 50 min, and a taste meter was used to measure appearance, hardness, viscosity, balance degree, and taste value. This process was repeated thrice for each sample. Texture profile analysis (TPA) of cooked rice was performed using the three-grain method with a CT3 4500 texture analyzer (Brookfield Engineering Laboratories, Middleboro, MA, USA) equipped with a TA43 spherical probe [28]. After cooking and cooling, three intact grains were randomly selected from the rice cake, placed symmetrically on the test platform, and subjected to a two-cycle compression test. The test parameters were as follows: pre-test speed 2.00 mm s−1, test speed 1.00 mm s−1, post-test speed 1.00 mm s−1, trigger force 5.000 gf, and target deformation 50% of the original grain height. Ten replicate measurements were performed per sample. After discarding the two highest and two lowest values, the mean of the remaining six replicates was calculated for each parameter. Six key texture attributes were extracted from the force-time curve: hardness, springiness, adhesion force, cohesiveness, gumminess, and chewiness. These parameters collectively provide a comprehensive quantitative description of the textural properties closely associated with the eating quality of japonica rice.
2.3.3. Actual Yield and Panicle Traits
At maturity, the actual yield was determined by harvesting a 6 m2 area from each plot, excluding border rows, with three replicates. After threshing and cleaning, the grain yield per unit area was calculated based on a standard moisture content of 14.50% for japonica rice. For panicle-trait evaluation, ten hills with an average panicle number per hill were sampled at maturity using the average-panicle-number sampling method. The following traits were measured: the number of primary and secondary branches per panicle, grain numbers on primary and secondary branches, seed-setting rates of primary and secondary branches, and 1000-grain weight of the primary and secondary branches. Primary branches were defined as branches directly attached to the main rachis, and secondary branches as branches attached to primary branches. Branches bearing two or fewer spikelets were excluded from the counting of both branch number and spikelet number, as such branches are morphologically rudimentary and rarely contribute to grain yield. The number of primary and secondary branches per panicle was counted directly. For each branch, the total number of spikelets and the number of filled grains were recorded, and the seed-setting rate was calculated as the number of filled grains divided by the total number of spikelets × 100%. The 1000-grain weight was determined separately from filled grains of primary and secondary branches. Branch length was measured, and spikelets per centimeter was calculated as the number of spikelets per branch divided by branch length (cm).
2.4. Statistical Analysis
For the experimental variables, a three-way ANOVA was performed using SPSS Statistics version 22.0 (IBM Corp., Armonk, NY, USA). Significant differences among treatments (p < 0.05) were indicated by different letters based on Fisher’s least significant difference (LSD) test. Graphs were drawn using Origin 2024b (OriginLab, Northampton, MA, USA).
3. Results
Table 2 shows the two-year average primary branch traits of Koshihikari under different nitrogen application rate and fertilization method. Annual data are given in Table S1. N significantly affected all five traits. With increasing N, the number of primary branches and grain density increased continuously, reaching 8.52 and 3.07 at N180, which were 0.95 and 0.29 higher than at N0. The number of spikelets per primary branch peaked at N135, reaching 56.27, which was 2.51 higher than at N90. Seed-setting rate and 1000-grain weight decreased at high N; at N180 they were 92.81% and 25.90 g, which were 1.13 percentage points and 0.48 g lower than at N0. F significantly affected number of primary branches, number of spikelets per primary branch, 1000-grain weight, and grain density, but not seed-setting rate. At N135, LSF had the highest number of spikelets per primary branch, 57.79, which was 3.07 and 1.49 higher than FP and PQSF, respectively, and the highest 1000-grain weight, 26.39 g, which was 0.66 g higher than FP. At N180, FP had the highest number of spikelets per primary branch, 56.65, which was 1.96 and 2.44 higher than LSF and PQSF, respectively, while LSF and PQSF had higher seed-setting rates, 93.28% and 93.21%, than FP, 91.92%. At N45, FP had the highest seed-setting rate, 94.53%, which was 0.98 and 1.41 percentage points higher than LSF and PQSF, respectively. The year effect was significant only for seed-setting rate, and year interactions were mostly non-significant, indicating consistent two-year trends. Therefore, two-year averages are presented in Table 2, with annual data in Table S1.
Table 2.
Effects of nitrogen application rate and fertilization method on primary branch traits of Koshihikari (two-year average, 2024–2025).
Table 3 shows the two-year average secondary branch traits of Koshihikari under nitrogen application rate and fertilization method. The corresponding annual data are presented in Table S2. Three-way ANOVA showed that nitrogen application rate had highly significant effect on the number of secondary branches, number of spikelets per secondary branch, seed-setting rate, 1000-grain weight, and spikelets per centimeter of secondary branch, and fertilization method also had highly significant effects on all five traits. The interaction between the two factors was highly significant for all measured traits, indicating that the effect of F depended on N. The year effect (Y) was significant only for seed-setting rate and spikelets per centimeter of secondary branch (p < 0.05), while it was not significant for the other traits. The interactions Y × N, Y × F, and Y × N × F were significant for some traits, such as Y × N on number of spikelets per secondary branch and spikelets per centimeter, and Y × F on seed-setting rate and 1000-grain weight, but the overall response patterns to N and F were largely consistent across the two years. As N increased, the number of secondary branches and spikelets per centimeter of secondary branch increased continuously, while the number of spikelets per secondary branch peaked at N135. Seed-setting rate was stable at N0–N90 and then decreased at N135–N180, with the highest value at N45 and the lowest at N180; 1000-grain weight peaked at N45 and was lowest at N180, indicating that N135–N180 was optimal for secondary branch panicle traits but detrimental to seed-setting rate and 1000-grain weight. The annual data in Table S2 were generally consistent with the two-year averages, although the absolute values differed slightly.
Table 3.
Effects of nitrogen application rate and fertilization method on secondary branch traits of Koshihikari (two-year average, 2024–2025).
At the same N rate, the effect of F varied with N level: at N0, PQSF produced significantly more secondary branches than FP, but there were no significant differences among the three methods for the other traits. At N45, LSF had higher numbers of spikelets per secondary branch and spikelets per centimeter than PQSF, and PQSF had the highest seed-setting rate, while LSF and FP had higher 1000-grain weight than PQSF. At N90, LSF had the highest number of secondary branches and number of spikelets per secondary branch, while PQSF had the highest seed-setting rate and FP had the lowest. At N135, LSF significantly outperformed FP and PQSF in the number of secondary branches, number of spikelets per secondary branch, 1000-grain weight, and spikelets per centimeter, while LSF and PQSF had higher seed-setting rates than FP. At N180, LSF had the highest number of secondary branches, seed-setting rate, and 1000-grain weight, while LSF and FP had higher numbers of spikelets per secondary branch than PQSF, and LSF had the highest spikelets per centimeter. The annual data in Table S2 showed similar patterns of F effects at each N level, with only minor discrepancies in the magnitude of differences. Overall, N primarily determined secondary branch and panicle trait development. An appropriate N (N135–N180) favored the coordinated development of panicle structure, but excessive N was associated with reductions in seed-setting rate and 1000-grain weight. Although F alone had a limited effect, its strong interaction with N indicates that its effects varied with nitrogen availability.
As shown in Figure 2 (solid lines, 2024; dashed lines, 2025), grain yield of Koshihikari exhibited a significant downward-opening parabolic relationship with increasing N rates under all three fertilization methods in both years. The fitted quadratic equations and coefficients of determination for the FP, LSF, and PQSF regimes in 2024 were y = −0.141x2 + 35.64x + 5302.12 with R2 = 0.99, y = −0.148x2 + 45.30x + 5209.55 with R2 = 0.92, and y = −0.091x2 + 32.33x + 5183.93 with R2 = 0.86, respectively. The corresponding theoretical optimal N rates and maximum yields in 2024 were as follows: 126.38 kg ha−1 and 7554.33 kg ha−1 for FP, 153.04 kg ha−1 and 8675.96 kg ha−1 for LSF, and 177.64 kg ha−1 and 8056.44 kg ha−1 for PQSF. For 2025, the fitted equations were y = −0.138x2 + 33.12x + 5704.76 (R2 = 0.96) for FP, y = −0.155x2 + 43.53x + 5687.93 (R2 = 0.93) for LSF, and y = −0.090x2 + 29.42x + 5546.03 (R2 = 0.83) for PQSF. The corresponding theoretical optimal N rates and maximum yields in 2025 were 120.00 kg ha−1 and 7691.96 kg ha−1 for FP, 140.40 kg ha−1 and 8744.16 kg ha−1 for LSF, and 163.40 kg ha−1 and 7950.30 kg ha−1 for PQSF. The two-year results showed highly consistent response patterns, with LSF consistently exhibiting the highest yield potential and FP the lowest.
Figure 2.
Quadratic fitted curves of measured grain yield under different nitrogen application rates and fertilization methods in 2024 and 2025. Solid lines represent 2024; dashed lines represent 2025. Black squares, orange circles, and blue triangles indicate FP, LSF, and PQSF, respectively. Error bars represent standard deviation. The fitted quadratic equations and R2 values are shown in the figure.
However, applying these mathematical models to production decisions requires a critical evaluation of the actual field data. The FP regime, with R2 = 0.99 in 2024, showed excellent agreement between model predictions and observed data, with yield optimum occurring at approximately 126 kg ha−1 and a yield of about 7550 kg ha−1, followed by a sharp decline at N180, which accurately captured the physiological yield penalty under excessive nitrogen typical of conventional practice. In contrast, the PQSF regime, with a relatively low R2 of 0.86 and a small quadratic term coefficient, exhibited substantial model extrapolation bias at its predicted optimum of 177.64 kg ha−1. The actual measured yields for PQSF peaked at N135 with approximately 8400 kg ha−1 and had already declined markedly by N180, falling well below the mathematically projected maximum; consequently, this theoretical optimum should not be used as a practical fertilization guideline. Similar patterns were observed in 2025: the actual yield of PQSF peaked at N135 (approximately 8300 kg ha−1) and declined at N180, again indicating that the theoretical optimum of 163.4 kg ha−1 was not practical. FP also showed a sharp decline at N180 in 2025, confirming the yield penalty under excessive nitrogen.
Considering both model fits and observed yield data, LSF demonstrated the highest yield potential, achieving a maximum observed yield of approximately 8900 kg ha−1 within the nitrogen range of 135 to 153 kg ha−1, and was therefore identified as the optimal high-yield fertilization strategy under the conditions of this experiment. PQSF yielded up to 8400 kg ha−1 at N135, significantly outperforming FP, whereas FP not only produced the lowest absolute yields but also showed a pronounced drop at N180. These results strongly suggest that conventional nitrogen rates exceeding 150 kg ha−1 should be strictly avoided in practice to prevent substantial economic losses. The 2025 data further validated these conclusions: LSF again achieved the highest observed yield (approximately 8900 kg ha−1) within the 135–153 kg ha−1 range, PQSF peaked at N135 (approximately 8300 kg ha−1), and FP showed the lowest yields with a sharp decline at N180. Since the two-year trends were highly consistent in Figure 2, the 2024 dataset is representative for the detailed analysis, and the 2025 data confirmed the robustness of the conclusions.
As shown in Figure 3a–e and the grain-filling parameters in the Supplementary Materials, N, F, and grain position significantly affected the grain-filling dynamics of Koshihikari. Across different nitrogen levels, both superior and inferior grains exhibited asynchronous filling characteristics: superior grains showed earlier initiation, higher rates, and earlier peak timing, representing an early-onset and rapid-filling type, whereas inferior grains displayed significantly delayed initiation, later peak timing, and consistently lower initial growth potential (R0). With increasing nitrogen application, R0 of superior grains increased and time to peak (Tmax) shifted slightly earlier; however, maximum filling rate (Gmax) and maximum grain weight (Wmax) were optimal at N45–N90. The effective filling duration (D) decreased with increasing N, whereas the final filling time (T99) was prolonged. For inferior grains, the initiation rate increased and Tmax advanced, but the effective filling duration was markedly reduced. Wmax decreased significantly under high nitrogen, and T99 extended to approximately 50 days. This indicates that although high nitrogen advanced the onset of filling in inferior grains, the imbalance between the sink and source led to prolonged delayed tail filling and reduced grain weight.
Figure 3.
Grain-filling dynamics of superior and inferior grains of Koshihikari under different nitrogen application rates and fertilization methods in 2024. The solid line represents superior grains, and the dashed line represents inferior grains. (a) Fitted grain-filling curves of superior and inferior grains under different fertilization methods at the N0 nitrogen application level; (b) fitted grain-filling curves of superior and inferior grains under different fertilization methods at the N45 nitrogen application level; (c) fitted grain-filling curves of superior and inferior grains under different fertilization methods at the N90 nitrogen application level; (d) fitted grain-filling curves of superior and inferior grains under different fertilization methods at the N135 nitrogen application level; (e) fitted grain-filling curves of superior and inferior grains under different fertilization methods at the N180 nitrogen application level.
Among the three fertilization methods, PQSF demonstrated complementary spatiotemporal advantages for both superior and inferior grains, with effects varying with the nitrogen level. Under low nitrogen (N0), PQSF conferred the highest R0, the earliest Tmax, and the longest D for superior grains, sustaining growth through an “early onset and prolonged duration” pattern, while Wmax of inferior grains was comparable to that of LSF. Under N45, PQSF similarly produced the highest R0, earliest Tmax, and longest D in superior grains, although Wmax was slightly lower than that under FP and LSF. At N90, PQSF produced a highly rapid filling pattern in superior grains, characterized by explosive initiation, rapid peaking, and prompt termination, with the highest R0, earliest Tmax, highest Gmax, and shortest D, whereas Wmax of inferior grains was slightly lower than that under FP. Under high nitrogen rates (N135–N180), the “filling consolidation” advantage of PQSF for inferior grains became evident. At N180, Wmax of inferior grains was higher than that of FP and LSF, while parameters of superior grains were comparable across treatments. Overall, PQSF dynamically coordinated filling between superior and inferior grains according to nitrogen availability: under low to medium nitrogen, it optimized the early onset and prolonged duration of superior grains to expand sink capacity; under high nitrogen, it mitigated the adverse effects of excess nitrogen by improving the filling degree of inferior grains.
N had highly significant effects on the levels of all protein fractions from 10 to 50 days after flowering (DAF). F also significantly affected protein fraction levels at all time points, except for globulin at 30 DAF. The interaction between the two factors reached significant or highly significant levels for all protein fractions except albumin at 20 DAF (Figure 4). As N increased, the levels of all four protein fractions progressively increased. Under low-nitrogen conditions (N0 and N45), albumin stabilized at 40 and 50 DAF, respectively, and continued to accumulate until 50 DAF, with the highest level at N180 and peak accumulation rate at 30 DAF. Globulin followed a similar trend, but the levels across all treatments leveled off at 50 DAF, with the peak accumulation rate occurring between 30 and 40 DAF. Prolamin showed the fastest accumulation at 20 DAF, with a gradual decline thereafter; at 50 DAF, N180 was 51.15%, 28.14%, 17.63%, and 10.50% higher than that of N0, N45, N90, and N135, respectively. Glutelin accumulation peaked at approximately 30 DAF, and at 50 DAF, N180 exceeded the corresponding treatments by 31.26%, 18.81%, 11.27%, and 5.93%, respectively.
Figure 4.
Dynamics of protein fractions in Koshihikari under different nitrogen application rates and fertilization methods after full heading in 2024. Data are presented as means ± standard error. To evaluate the individual and combined effects of nitrogen application rate (N) and fertilization method (F) at each sampling time point, a two-way ANOVA was performed for each protein fraction. The corresponding ANOVA results (indicating the significance levels for the main effects of N, F, and their interaction N × F) are summarized in the text block located in the lower right corner of the rightmost panel in each row. Each column in this text block corresponds to the statistical result for the specific sampling date shown on the x-axis. Asterisks indicate significant differences (** p < 0.01, * p < 0.05), and ‘ns’ denotes not significant. Different lowercase letters indicate significant differences among fertilization methods at the same days after full heading (* p < 0.05).
At the same N, the effect of F varied with the nitrogen level. At N0, no significant differences among the three fertilization methods were observed for most protein fractions, except for glutelin in PQSF, which exhibited a rapid accumulation pattern characterized by an initial low level, followed by a sharp increase between 10 and 20 DAF. At N45, the treatment differences were most pronounced for albumin and globulin; FP had the highest albumin and prolamin levels, whereas LSF had the highest globulin and glutelin levels. At N90, differences in albumin were minimal, whereas globulin and prolamin levels in PQSF were significantly lower than those in the other treatments. At N135, PQSF showed significantly lower globulin and prolamin levels than the other treatments after 30 DAF, whereas glutelin continued to accumulate. At N180, no significant differences in albumin were observed among treatments; PQSF had significantly lower globulin than FP and LSF after 30 DAF; differences in prolamin increased over time in the order FP > LSF > PQSF, and glutelin followed a trend of LSF > FP > PQSF between 30 and 50 DAF.
To account for multiple testing and within-plot temporal correlation, two additional analyses were performed. First, Benjamini–Hochberg FDR correction was applied to all 60 p values obtained from two-way ANOVAs performed for each protein fraction at each sampling time point. After correction, the main effect of N remained highly significant (Q < 0.01) at all sampling time points for all fractions, and the main effect of F remained highly significant (Q < 0.01) except for globulin at 30 DAF, where it became non-significant (Q > 0.05). Of the 20 N × F interactions, 12 remained significant at Q < 0.01, and 4 additional interactions (globulin at 20, 40, and 50 DAF and glutelin at 20 DAF) were significant at Q < 0.05 but not at Q < 0.01. The remaining 4 interactions (albumin at 20 and 40 DAF, prolamin at 20 DAF, and glutelin at 10 DAF) remained non-significant after correction (Q > 0.05). Second, linear mixed-effects models were fitted separately for each protein fraction, with N, F, Time, and the N × F × Time interaction as fixed effects (Table S8). The three-way interaction was highly significant for albumin (F = 3.031, p < 0.001), prolamin (F = 5.853, p < 0.001), and glutelin (F = 3.453, p < 0.001), suggesting that the combined effects of N rate and fertilization method on these fractions varied over the grain-filling period. For globulin, the three-way interaction was not significant (F = 1.378, p = 0.115), providing no evidence that the N × F effect changed over time. In the mixed-effects models, the main effects of N, F, and Time were highly significant for all four protein fractions (p < 0.001). For albumin, the N × Time, F × Time, and N × F interactions were all significant (p < 0.001, p < 0.001, and p = 0.005, respectively). For globulin, the N × Time interaction was not significant (p = 0.325), whereas the F × Time and N × F interactions were significant (both p < 0.001). For prolamin and glutelin, all two-way interactions were highly significant (p < 0.001). To assess whether the repeated-measures covariance structure was necessary, model comparisons based on the Akaike information criterion (AIC) were performed. Although the AR(1) ρ estimates were small and non-significant (all p > 0.05), AIC comparisons indicated that models without the AR(1) covariance structure fitted better for all fractions. Therefore, the simpler models were adopted because the significant Time and N × F × Time effects adequately accounted for the systematic temporal variation. Overall, the mixed-model results were consistent with the ANOVA and FDR-corrected results: the main effects and most interactions remained significant. Protein fraction accumulation was mainly affected by N, with higher N associated with greater accumulation. Under low N, accumulation tended to plateau earlier, whereas under high N it continued through 50 DAF. F had a secondary effect, influencing certain protein fractions only at certain N levels.
Table 4 shows the two-year average milling quality of Koshihikari under different fertilization methods and nitrogen application rates. The corresponding annual data are presented in Table S3. Three-way ANOVA showed that N had highly significant effects on brown rice, milled rice, and head rice rates; F significantly affected brown rice rate and had highly significant effects on milled rice and head rice rates; and the N × F interaction was highly significant for all three indicators. The year effect (Y) was not significant for any of the three milling quality indicators. The Y × N interaction was not significant for brown rice and milled rice rates, but was significant for head rice rate; the Y × F interaction was significant for brown rice rate and highly significant for milled rice rate, but not significant for head rice rate; and the Y × N × F interaction was highly significant for brown rice rate and significant for milled rice and head rice rates, suggesting that the effects of fertilization method and nitrogen rate fluctuated somewhat between years, but the main trends remained consistent. As N increased, brown rice and milled rice rates first increased and then decreased, with the highest values at N90 and the lowest at N0; head rice rate was highest at N45 and N90 and lowest at N180. This trend was generally consistent between the two years, with only slight differences in absolute values (Table S3). At the same N level, the effect of F varied with the nitrogen rate. At N0, LSF and PQSF had the highest brown rice and milled rice rates, while FP had the lowest; LSF and PQSF were 1.89 and 1.43 percentage points higher in brown rice rate and 2.50 and 2.58 percentage points higher in milled rice rate than FP, respectively; there were no significant differences among the three methods for head rice rate. At N45, LSF had the highest brown rice and milled rice rates, while FP had the lowest; FP had the highest head rice rate, and LSF and PQSF had lower head rice rates. At N90, LSF achieved the highest values for all three indicators, followed by PQSF, while FP had the lowest values. At N135, LSF and PQSF had higher brown rice rates than FP; LSF had the highest milled rice rate, and FP had the lowest; PQSF had the highest head rice rate, which was 1.04 and 3.09 percentage points higher than those of FP and LSF, respectively. At N180, there were no significant differences among the three methods for brown rice rate; FP had the highest milled rice rate; and PQSF had the highest head rice rate, while LSF had the lowest. In summary, an appropriate N rate (N90) combined with a suitable F (such as N90 × LSF or N135 × PQSF) effectively improved the milling quality, whereas excessive or insufficient N and mismatched F were detrimental to the milling quality, consistent with the significant interaction between the two factors.
Table 4.
Effects of nitrogen application rate and fertilization method on milling quality of Koshihikari (two-year average, 2024–2025).
Table 5 shows the two-year average nutritional and appearance quality of Koshihikari under different fertilization method and nitrogen application rate. The corresponding annual data are presented in Table S4. Three-way ANOVA showed that N had highly significant effects on chalkiness degree, chalkiness percentage, moisture content, protein content, amylose content, and acid value; F had significant effects on chalkiness degree and acid value, highly significant effects on chalkiness percentage and amylose content, but no significant effects on moisture content or protein content; and the N × F interaction was highly significant for chalkiness degree, chalkiness percentage, moisture content, amylose content, and acid value, but not significant for protein content. The year effect was not significant for chalkiness degree, chalkiness percentage, moisture content, protein content, or amylose content, but was highly significant for acid value. The Y × N interaction was significant for chalkiness degree, chalkiness percentage, moisture content, and acid value; the Y × F interaction was significant only for acid value; and the Y × N × F interaction was significant for chalkiness percentage, moisture content, and acid value, suggesting that the effects of fertilization method and nitrogen rate fluctuated somewhat between years, but the main trends remained consistent. As N increased, chalkiness degree and chalkiness percentage increased continuously, with the highest values at N180 and the lowest at N0. This trend was generally consistent between the two years (Table S4). Protein content increased with increasing N, with the highest at N180 and the lowest at N0. Amylose content decreased with increasing N, with the highest at N0 and the lowest at N180. Moisture content and acid value fluctuated across N levels, with no clear consistent trend. At the same N level, the effect of F varied with the nitrogen rate. At N0, there were no significant differences among the three methods for most traits; PQSF had the highest moisture content, while FP had the highest amylose content. At N45, LSF had the highest chalkiness degree and chalkiness percentage, while PQSF had the lowest; FP had the highest moisture content and acid value; LSF had the lowest amylose content. At N90, LSF had the highest chalkiness degree, while PQSF had the lowest chalkiness percentage and the highest amylose content; FP had the highest chalkiness percentage. At N135, there were no significant differences among the three methods for chalkiness degree; FP had the highest chalkiness percentage and the lowest moisture content; PQSF had the highest amylose content. At N180, FP had the highest chalkiness degree and chalkiness percentage, while LSF and PQSF had lower values; PQSF had the highest amylose content; there were no significant differences among the three methods for protein content. In summary, N and F exhibited significant interactive effects on nutritional and appearance quality. Appropriate combinations of F and N can improve selected rice quality, whereas excessive N significantly deteriorates rice chalkiness.
Table 5.
Effects of nitrogen application rate and fertilization method on nutritional and appearance quality of Koshihikari (two-year average, 2024–2025).
The effects of N and F on the cooking and eating quality of Koshihikari rice varied among the measured parameters (Table 6). The corresponding annual data are presented in Table S5. Three-way ANOVA showed that N, F, and their interaction had highly significant effects on appearance, hardness, viscosity, balance, and taste value. The year effect was significant only for appearance, while the Y × N interaction was significant only for taste value; all other Y, Y × N, Y × F, and Y × N × F interactions were non-significant, indicating that the overall response patterns to N and F were highly consistent across the two years.
Table 6.
Effects of nitrogen application rates and fertilization methods on cooking and eating quality of Koshihikari (two-year average, 2024–2025).
As N increased, the appearance score declined from 8.53 at N0 to 7.31 at N180, and the taste value decreased from 84.33 at N0 to 76.39 at N180. Hardness increased from 5.80 at N0 to 6.13 at N180. Viscosity and balance degree both increased initially and then decreased, peaking at N45 with values of 8.92 and 8.61, respectively. N45 treatment exhibited the best overall cooking and eating quality, while excessive N application (N ≥ 90) led to a substantial decline in taste value. These trends were generally consistent between the two years, with only slight differences in absolute values (Table S5).
At the same N, the effect of F varied with N level. At N0, no significant differences were observed among the three methods for appearance, viscosity, balance, or taste value, while PQSF had significantly lower hardness than FP and LSF. At N45, LSF and PQSF were significantly superior to FP in appearance, viscosity, balance degree, and taste value, with significantly lower hardness than FP; PQSF had the highest taste value, exceeding that of FP by 6.33 points. At N90, LSF significantly outperformed FP for all indicators, demonstrating the best overall performance, followed by PQSF, while FP had the lowest values. At N135, PQSF had the lowest hardness and highest taste value, whereas no significant differences in viscosity or balance degree were detected among the treatments. At N180, PQSF significantly outperformed both FP and LSF in terms of appearance, viscosity, degree of balance, and taste value, and had the lowest hardness, whereas LSF had the lowest taste value. The annual data in Table S5 showed similar patterns of F effects at each N level, with only minor discrepancies in the magnitude of differences.
Overall, an appropriate N rate (N45) combined with a suitable F effectively improved cooking and eating quality, whereas excessive N significantly deteriorates the appearance and taste value. Hardness, viscosity, appearance, degree of balance, and taste value were all significantly regulated by N, F, and their interaction.
As shown in Figure 5, N and F significantly affected the textural properties of cooked Koshihikari rice, with the effects differing among parameters. The main effects of N and F and their interactions on hardness, springiness, adhesion force, adhesiveness, and chewiness were all highly significant. For cohesiveness, the effects of N and F were significant, but their interaction was not, indicating that cohesiveness is a relatively stable structural attribute that was primarily regulated by independent effects of the two factors.
Figure 5.
Textural properties of cooked Koshihikari rice under different nitrogen application rates and fertilization methods in 2024. (a) Hardness; (b) Springiness; (c) Adhesion force; (d) Gumminess; (e) Cohesiveness; (f) Chewiness. Asterisks indicate significant differences (** p < 0.01), and “ns” denotes not significant. In the “Mean” rows, different lowercase letters indicate significant differences among nitrogen application rates (N0–N180) at p < 0.05. Different lowercase letters in the other rows indicate significant differences among fertilization methods at the same nitrogen application rate (p < 0.05).
With increasing N, hardness, adhesiveness, and chewiness increased continuously. Springiness and adhesion force first increased and then decreased, peaking at N45, whereas high N caused a marked reduction in surface stickiness and a significant decline in springiness. N45 treatment yielded the most balanced texture and the best palatability, whereas excessive N (N135 and N180) severely disrupted the softness–firmness balance and adhesive properties.
At N0, the differences among F results were relatively small. At N45, LSF and PQSF had significantly higher adhesion forces and significantly lower hardness than FP, resulting in softer and stickier grains. At N90, FP hardness increased sharply with structural deterioration, PQSF maintained a relatively high springiness and balanced hardness, and LSF had the lowest hardness but a marked reduction in springiness. At N135 and N180, FP and LSF showed sharp increases in hardness and adhesiveness along with severe losses in springiness and adhesion force, whereas PQSF demonstrated superior hardening resistance, with significantly better hardness, adhesiveness, and chewiness than those of FP and LSF. Notably, at N180, PQSF had significantly lower hardness than FP and LSF, while maintaining the highest springiness and adhesion force, effectively alleviating grain stiffness and decreased of surface stickiness caused by high N and substantially improving mouthfeel.
Together, excessive N disrupted the texture balance of cooked rice, leading to a significant deterioration in eating quality. A rational N management strategy combined with the PQSF method reduced grain hardness and adhesiveness while maintaining high springiness under high-N conditions, thereby synergistically regulating multiple texture parameters.
Figure 6a illustrates the correlations between the grain protein fraction contents and grain-filling parameters in superior and inferior grains during grain filling. For both grain types, all protein components exhibited significant negative correlations with Tmax and t1, and significant positive correlations with t2 and t3, indicating that early initiation, a short progressive phase, and prolonged mid-to-late filling favored protein accumulation. In superior grains, the protein fraction content was also positively correlated with Gmax and Gmean and negatively correlated with D, suggesting that higher protein accumulation was associated with a relatively rapid and concentrated filling process. In inferior grains, protein fraction content was positively correlated with R0 and negatively correlated with Wmax and I, implying that protein accumulation in inferior grains benefited mainly from higher initial growth potential and early filling. As the filling progressed, the correlations of albumin and globulin with certain parameters weakened in the later stages, whereas those of glutelin and prolamin remained more persistent. By 50 days after heading, glutelin and globulin in inferior grains still maintained significant positive correlations with R0, t2, and t3, highlighting the sustained contribution of late-stage filling vigor to storage protein accumulation in inferior grains.
Figure 6.
Correlation matrix among grain quality and panicle traits of Koshihikari. (a) Correlation matrix illustrating the correlations between grain protein fraction contents and grain-filling parameters in superior and inferior grains during grain filling. (b) Correlation matrix further showing the relationships among protein fractions, grain-filling parameters, rice quality traits, panicle traits, and yield at different stages. * indicate significant correlations (p < 0.05). The variables X1–X20 and X61–X71 represent rice quality, panicle, and yield traits, respectively: X1, brown rice rate; X2, milled rice rate; X3, head rice rate; X4, chalkiness degree; X5, chalkiness percentage; X6, moisture content; X7, protein content; X8, amylose content; X9, acid value; X10, appearance score; X11, hardness (by taste meter); X12, viscosity; X13, balance degree; X14, taste value; X15, hardness (by texture analyzer); X16, adhesion force; X17, springiness; X18, chewiness; X19, gumminess; X20, cohesiveness; X61, number of primary branches per panicle; X62, number of spikelets per primary branch; X63, seed setting rate of primary branches; X64, 1000-grain weight of spikelets from primary branches; X65, spikelets per centimeter of primary branch; X66, number of secondary branches per panicle; X67, number of spikelets per secondary branch; X68, seed setting rate of secondary branches; X69, 1000-grain weight of spikelets from secondary branches; X70, spikelets per centimeter of secondary branch; and X71, actual measured yield.
Figure 6b further shows the relationships of protein fractions, grain-filling parameters, rice quality traits, panicle traits, and yield at different stages. Across all stages, protein fraction contents were positively correlated with X4, X5, X7, X71, as well as with X15, X61, X62, X66, and X67, but negatively correlated with X8, X14, and X17. Among these, glutelin and prolamin showed more comprehensive and persistent correlations. Filling parameters exhibited differential correlation patterns: Tmax and t1 for superior grains, as well as Tmax, Wmax, I, and t1 for inferior grains, were mostly negatively correlated with the above traits, whereas Gmax, Gmean, t2, and t3 for superior grains and R0 for inferior grains were mostly positively correlated. The correlation direction with X14 was opposite to that with yield-related traits. Notably, D in superior grains was positively correlated with X14 and negatively correlated with X71, whereas all other yield-promoting filling parameters and protein indicators were negatively correlated with X14, indicating contrasting relationships between yield improvement and taste value.
PCA was performed to evaluate the relationships among protein fractions and quality-related traits in Koshihikari, as shown in Figure 7a and Table 7a, and among grain-filling parameters and yield-related traits, as shown in Figure 7b and Table 7b. In both analyses, the eigenvalues of the first four principal components showed a steep decrease, after which the scree plot leveled off from the fifth component onward. The first four principal components exhibited eigenvalues greater than 1 and cumulative variance contributions of 83.21% for the protein quality dataset and 84.64% for the filling yield dataset, indicating high representativeness. Therefore, based on the combined results shown in Figure 7 and Table 7, the first four principal components were retained as the primary axes for subsequent evaluation and analysis.
Figure 7.
(a) Scree plot of principal component analysis for quality-related traits. (b). Scree plot of principal component analysis for yield related traits.
Table 7.
(a) Eigenvalues and variance contribution rates of principal component analysis for quality-related traits. (b) Eigenvalues and variance contribution rates of principal component analysis for yield related traits.
The PCA in Figure 8a shows that the first two principal components collectively explained 74% of the total variation in rice quality. PC1 primarily delineated the core trade-off between milling quality and protein accumulation and cooking/eating quality and textural properties, whereas PC2 further resolved the nitrogen-directed regulation of taste-related traits. At the treatment level, N45 and N90 significantly promoted the enrichment of traits, including brown rice rate, milled rice rate, and protein content, at various post-heading stages on the positive side of PC1, whereas N135 formed an extreme on the PC2 axis, closely aligned with appearance, balance degree, and taste value vectors, thus representing the optimal nitrogen rate for maximizing the eating quality of Koshihikari. Under this N-dominated framework, the three fertilization methods exhibited marked spatial shifts within the same N rate: PQSF and LSF data points shifted predominantly toward the positive PC1 and PC2 directions, confirming that precision fertilization, through enhanced nutrient use efficiency, effectively promoted the accumulation of quality components, such as albumin and glutelin, while maintaining favorable eating quality. This surpassed the conventional yield–quality trade-off and achieved secondary optimization within a narrow range. In contrast, FP treatment points tended to cluster in the lower-left or left-leaning regions, reflecting the inherent shortcomings of conventional broadcast application in spatiotemporal nutrient synchronization.
Figure 8.
(a) Principal component analysis biplot of quality-related traits and treatments on PC1 and PC2. (b). Principal component analysis biplot of yield related traits and treatments on PC1 and PC2. Note: The variables X1 to X71 represent the following traits, respectively: X1, brown rice rate; X2, milled rice rate; X3, head rice rate; X4, chalkiness degree; X5, chalkiness percentage; X6, moisture content; X7, protein content; X8, amylose content; X9, acid value; X10, appearance score; X11, hardness (by taste meter); X12, viscosity; X13, balance degree; X14, taste value; X15, hardness (by texture analyzer); X16, adhesion force; X17, springiness; X18, chewiness; X19, gumminess; X20, cohesiveness; X21, albumin at 10 days after heading; X22, globulin at 10 days after heading; X23, prolamin at 10 days after heading; X24, glutelin at 10 days after heading; X25, albumin at 20 days after heading; X26, globulin at 20 days after heading; X27, prolamin at 20 days after heading; X28, glutelin at 20 days after heading; X29, albumin at 30 days after heading; X30, globulin at 30 days after heading; X31, prolamin at 30 days after heading; X32, glutelin at 30 days after heading; X33, albumin at 40 days after heading; X34, globulin at 40 days after heading; X35, prolamin at 40 days after heading; X36, glutelin at 40 days after heading; X37, albumin at 50 days after heading; X38, globulin at 50 days after heading; X39, prolamin at 50 days after heading; X40, glutelin at 50 days after heading; X41, R0 of superior grains; X42, Tmax of superior grains; X43, Gmax of superior grains; X44, Wmax of superior grains; X45, I of superior grains; X46, Gmean of superior grains; X47, D of superior grains; X48, t1 of superior grains; X49, t2 of superior grains; X50, t3 of superior grains; X51, R0 of inferior grains; X52, Tmax of inferior grains; X53, Gmax of inferior grains; X54, Wmax of inferior grains; X55, I of inferior grains; X56, Gmean of inferior grains; X57, D of inferior grains; X58, t1 of inferior grains; X59, t2 of inferior grains; X60, t3 of inferior grains; X61, number of primary branches per panicle; X62, number of spikelets per primary branch; X63, seed setting rate of primary branches; X64, 1000-grain weight of spikelets from primary branches; X65, spikelets per centimeter of primary branch; X66, number of secondary branches per panicle; X67, number of spikelets per secondary branch; X68, seed setting rate of secondary branches; X69, 1000-grain weight of spikelets from secondary branches; X70, spikelets per centimeter of secondary branch; and X71, actual measured yield.
The dimension-reduction projection in Figure 8b similarly illustrated the predominant role of N and the fine-tuning effect of F. In terms of spatial distribution, N level determined the overall trajectory of grain-filling parameters and panicle traits. N90 treatment was closely aligned with primary and secondary branch traits and measured yield vectors, representing the optimal combination for balancing sink capacity and actual yield, whereas N135 treatment focused on optimizing the filling potential of the superior grains. Within the same N range, PQSF and LSF points shifted to the right or upward compared with FP, indicating that under a given N, optimized fertilization further improved filling parameters of inferior grains (especially Gmean and R0) and increased seed-setting rate, thereby alleviating filling retardation or delayed maturity caused by excessive N and achieving precise regulation with reduced input. In contrast, FP at the same N application rate tended to cluster near the center or lower left of the plot, confirming its disadvantages in improving inferior grain filling and its lower nutrient use efficiency. Taken together, both figures consistently demonstrate that, while N establishes the basic framework for yield and quality, efficient F (PQSF and LSF) serve as critical complementary measures for achieving precise regulation of high-quality and high-yield production.
As shown in Table 8a, the hierarchical clustering results were closely aligned with the comprehensive quality scores, indicating a significant negative correlation between rice quality and N. N0 treatment consistently ranked first to third, with F-values ranging from 3.92 to 4.31, whereas N180 treatments generally had the lowest scores with negative F-values; specifically, N180LSF and N180FP ranked lowest and second-lowest, respectively. Overall, N0 and N45 treatments were clearly separated from N90, N135, and N180 treatments in the cluster dendrogram (Figure 9a). Within the same nitrogen level, three fertilization methods further differentiated the comprehensive quality response. PQSF was particularly effective in mitigating the decline in quality, especially under ultra-high nitrogen, where its comprehensive score of −1.93 (ranked 11th) significantly outperformed LSF (−5.64, ranked 15th) and FP (−5.12, ranked 14th). This confirms that precise quantitative side-deep fertilization effectively buffers the negative effects of nitrogen on taste, appearance, and protein accumulation even under high nitrogen stress.
Table 8.
(a) Factor scores and comprehensive scores of principal component analysis for quality-related traits. (b) Factor scores and comprehensive scores of principal component analysis for yield-related traits.
Figure 9.
(a) Hierarchical clustering dendrogram of rice quality traits under different nitrogen and fertilization treatments. (b) Hierarchical clustering dendrogram of yield-related traits under different nitrogen and fertilization treatments.
As shown in Table 8b, in stark contrast to the quality-related results, the composite yield scores generally increased sharply with increasing nitrogen concentrations, with high-yield clusters concentrated primarily in N135 and N180 groups. Specifically, N180LSF (4.15), N135LSF (3.00), and N90PQSF (1.84) ranked first, second, and third, respectively. The clustering dendrogram in Figure 9b clearly separated low-yield treatments (N0 and N45) from high-yield treatments (N90, N135, and N180). The yield response also differed among the three fertilization methods. LSF demonstrated superior yield-enhancing performance in the medium-to-high nitrogen range; at N180 and N135, LSF yield scores substantially exceeded those of PQSF and FP at the same nitrogen levels, indicating that simplified and efficient fertilization significantly and positively influenced the grain-filling dynamics of inferior grains and panicle traits.
Overall, the quality and yield clustering systems exhibited a nearly mirror-image relationship: nitrogen application established the fundamental framework of the yield-quality trade-off, whereas PQSF and LSF served as differentiated agronomic measures, demonstrating precise regulatory advantages in stabilizing quality under high nitrogen (PQSF) and promoting yield under medium-to-high nitrogen (LSF), respectively.
4. Discussion
Grain filling directly contributes to final grain yield and quality, and asynchronous grain filling between superior and inferior grains is a key factor affecting grain plumpness and grain weight uniformity [29]. In this study, Richards’ equation was used to characterize grain filling in superior and inferior grains of Koshihikari. The results indicated that, regardless of N or F, the two grain types consistently exhibited asynchronous filling. These findings are consistent with previous studies on japonica rice, showing that nitrogen application not only affects the absolute values of filling parameters, but also influences the degree of difference between grain types [30,31].
As nitrogen application increased, R0 for superior grains generally increased and Tmax shifted slightly earlier; however, Gmax and Wmax were optimal under N45–N90, and D shortened with increasing nitrogen. For inferior grains, although higher nitrogen promoted R0 and advanced Tmax, it simultaneously shortened the effective filling duration, resulting in a significant decrease in Wmax under high nitrogen and an extension of T99 to approximately 50 days. This pattern is consistent with previous findings [32]. The prolonged “filling tail” observed in inferior grains under high nitrogen may therefore reflect an imbalance between assimilate supply and sink demand.
Notably, the regulation of grain filling by F was strongly nitrogen-dependent. Under low nitrogen, PQSF sustained superior grain growth through early initiation and a sustained growth pattern. At N90, PQSF had the most pronounced promoting effect on superior grains, with the highest R0, earliest Tmax, highest Gmax, and shortest D in superior grains, indicating greatly enhanced sink activity. At N135 and N180, the “filling consolidation” advantage of PQSF became more evident in inferior grains, which reached their highest Wmax. Side-deep fertilization has been shown to significantly increase rice yield and nitrogen use efficiency; a meta-analysis reported increases of 4.8% in yield and 21.4% in nitrogen use efficiency [33]. By precisely applying basal nitrogen near the deep root zone, PQSF creates a high-concentration nutrient zone in the rhizosphere, which may delay root senescence and optimize post-anthesis assimilate translocation during the early growth stage. However, because the green-returning, tillering, and panicle fertilizers were broadcast on the soil surface, the advantage of side-deep placement was limited to the basal fertilizer, and the later nitrogen supply was similar to that of FP. Therefore, the quality-stabilizing effect of PQSF under high nitrogen may be partly attributed to the deep placement of basal fertilizer, but its nitrogen use efficiency advantage may be weakened by the surface broadcasting of topdressing. This may partly explain its ability to sustain inferior grain filling under high nitrogen [34].
The dynamic accumulation of storage protein fractions, including albumin, globulin, prolamin, and glutelin, was strongly affected by the N and, to a lesser extent, F. All four protein fractions increased with nitrogen application. Under high nitrogen, accumulation continued until 50 days after flowering, whereas under low nitrogen, levels stabilized earlier. Correlation analysis further revealed that, for both grain types, each protein component was significantly negatively correlated with Tmax and t1, and positively correlated with t2 and t3, indicating that early initiation and prolonged mid-to-late filling favored protein accumulation. Among these, glutelin and prolamin showed more persistent correlations than albumin and globulin; even at 50 days after heading, glutelin and globulin in inferior grains remained significantly positively correlated with R0, t2, and t3, highlighting the sustained contribution of late-stage filling to storage protein accumulation. These results corroborate previous findings that protein and protein content increase with higher nitrogen levels while taste scores decrease, and that prolamin and glutelin are the primary components responsible for the deterioration of cooking and eating quality [35,36]. This study further confirms this conclusion at the dynamic level and reveals the coupling between these components and grain-filling parameters. Moreover, these conclusions were robust to multiple testing and temporal correlation. After Benjamini-Hochberg FDR correction, the main effects of N and F on protein fractions remained significant (Q < 0.01) for most time points, with only the N × F interaction for prolamin at 20 DAF becoming non-significant (raw p = 0.0483, adjusted Q = 0.0522). Linear mixed-effects models further confirmed that the main effects and most two-way interactions remained significant after accounting for within-plot temporal correlation (Table S8). These results indicate that the observed effects of nitrogen rate and fertilization method on protein fraction accumulation are robust and unlikely to be artifacts of multiple testing or temporal correlation.
The responses of different quality indicators to nitrogen management often involve inherent trade-offs. In this study, milling quality was optimal under N90, which is consistent with previous findings that increasing nitrogen within a certain range can improve milling quality [37,38]. However, the appearance quality continuously deteriorated with increasing nitrogen, as indicated by increases in chalkiness and chalkiness percentage. Chalkiness is closely related to poor grain filling during the late stage; under high nitrogen, inferior grains exhibit delayed filling and prolonged T99, leading to a loose starch granule arrangement and increased light scattering [39]. These trade-offs were highly consistent between 2024 and 2025: N90 remained optimal for milling quality, and excessive nitrogen consistently increased chalkiness and chalkiness percentage in both years.
The eating quality was particularly sensitive to nitrogen. As the nitrogen content increased, the appearance score and taste value declined progressively, whereas hardness increased. Texture properties also exhibited regular changes: hardness, gumminess, and chewiness increased with higher nitrogen rates, indicating excessive densification and stiffening under high nitrogen. Springiness and adhesion force first increased and then decreased, with N45 yielding the best results. These results are highly consistent with previous studies showing that as nitrogen content increases, hardness, cohesiveness, and chewiness tend to increase, whereas aroma, luster, flavor, mouthfeel, and taste values tend to decrease [40,41]. The negative effect of excessive nitrogen on appearance and taste value was validated in both years, confirming the robustness of this conclusion. The textural properties were measured in 2024; however, the overall trend of quality deterioration under high nitrogen was consistent across years.
Changes in rice protein components are the key drivers of these quality responses. At all growth stages, protein fraction contents were significantly positively correlated with chalkiness, chalkiness percentage, and cooked rice hardness, but negatively correlated with amylose content, taste value, and cooked rice adhesiveness; glutelin and prolamin showed more comprehensive correlations. In other words, nitrogen application enhances nutritional quality by increasing protein accumulation (particularly glutelin and prolamin) but at the expense of appearance and eating quality [42,43].
Among the three F, PQSF exhibited a unique “quality-stabilizing” effect under high nitrogen. At N180, PQSF had a significantly lower protein content than FP and LSF, more favorable chalkiness, higher taste value, significantly lower texture hardness, and better springiness. This “anti-hardening” effect may stem from side-deep fertilization altering the spatiotemporal distribution of nitrogen in the rhizosphere, slowing luxury nitrogen uptake during the late filling stage and thereby preventing the negative impact of excessive storage protein accumulation on eating quality [34,44]. Previous meta-analyses indicate that the effects of side-deep fertilization on rice quality are complex; while it may increase protein content, its impact on milling and appearance quality is relatively minor [33]. Other studies have also shown significant reductions in chalkiness percentage of 10.63–20.41% following side-deep fertilization [45]. In the present study, PQSF similarly showed advantages in maintaining chalkiness and eating quality under high nitrogen. However, these proposed mechanisms were not directly tested in the present study, as root activity, nitrogen uptake dynamics, and assimilate translocation were not measured. Therefore, the quality-stabilizing effect of PQSF under high nitrogen should be considered a hypothesis that requires further physiological validation.
Rice yield is essentially constrained by the source–sink relationship, with panicle traits directly reflecting the sink capacity. In this study, N played a dominant role in primary branch traits, whereas secondary branch traits exhibited a strong nitrogen-by-fertilization interaction; their regulation by F was entirely dependent on the nitrogen level. This is consistent with previous research showing that, among panicle traits, secondary branch number is most affected by nitrogen, followed by spikelet number per panicle [46]. As nitrogen increased, primary branch number, grain number per panicle, and grain density continued to rise; however, seed-setting rate first increased and then decreased, while 1000-grain weight gradually declined. This indicates that excessive nitrogen significantly increased sink capacity at the expense of seed-setting rate and 1000-grain weight, resulting in a “large but unfilled sink” structural defect [47].
The yield response to N followed a significant downward-opening parabolic trend, but the optimal nitrogen ranges differed markedly among the three F. For FP, the optimal rate was approximately 126 kgha−1; above 150 kgha−1, the yield dropped precipitously, reflecting the physiological reduction in yield associated with conventional broadcast applications under high nitrogen. LSF achieved the highest observed yield, with an optimal range of 135–153 kg ha−1; its “early-control, late-promotion” approach effectively matched the nitrogen demand rhythm of Koshihikari. The optimal rate for PQSF was approximately 135 kg ha−1; although yields were lower than those of LSF under high nitrogen, PQSF demonstrated a distinct quality advantage. These quality responses were consistent across both years, with N90 optimal for milling quality and N45 best for eating quality in both 2024 and 2025.
From the perspective of the panicle-yield relationship, secondary branches were more responsive to F than primary branches, suggesting that optimizing secondary branch establishment and filling through improved fertilization may be a key avenue for further increasing Koshihikari’s yield. PCA and clustering analyses consistently showed that LSF exhibited superior yield-promoting performance in the medium-to high-nitrogen range (N135–N180), whereas PQSF demonstrated precise regulatory advantages in stabilizing quality under high nitrogen.
The two growing seasons had similar thermal conditions but differed in precipitation distribution and relative humidity. Mean temperature during the growing season was 19.96 °C in 2024 and 19.93 °C in 2025. Total precipitation was 910.9 mm and 885.5 mm, total sunshine hours were 1158.5 h and 1138.9 h, and mean relative humidity was 84.59% and 82.15%, respectively. Monthly precipitation differed markedly, especially in July and August. Despite these differences, the response patterns of grain yield, milling quality, appearance quality, protein content, and taste value to nitrogen rate and fertilization method were consistent between the two years (Tables S1–S5), indicating that the main conclusions were robust to interannual climatic variation.
Some limitations should be considered when interpreting these results. First, although this study included two years of field data (2024 and 2025), the comprehensive characterization of grain-filling dynamics, protein fraction accumulation, and textural properties was conducted only in 2024. Therefore, while the core conclusions on yield, milling quality, appearance quality, protein content, and taste value are validated across two years, the mechanistic interpretations should be considered preliminary and require further multi-year validation. Second, the experiment was conducted at a single site with a single cultivar; future studies should include multiple sites and cultivars to generalize the findings. Interannual temperature fluctuations and typhoon frequency can significantly affect grain filling and protein accumulation rates, thereby altering the relative advantages of different F [48]. Therefore, the stability of the proposed strategies requires further validation through multi-year field experiments. Future studies should combine 15N isotope tracing with dynamic monitoring of soil nitrogen mineralization to clarify nitrogen transformation and allocation under PQSF and LSF, particularly in paddy soils with poor water- and nutrient-retention capacity. Additionally, classification of climatic years could be introduced to develop scenario-based fertilization recommendations, providing a theoretical basis for achieving reduced input, higher yields, and improved quality in high-quality japonica rice production in this region. Finally, the quadratic model used for the yield–N response may overestimate the optimal nitrogen rate when the yield approaches a plateau. Alternative models such as quadratic-plateau or Mitscherlich may provide more biologically realistic estimates. Future studies should compare multiple response models and report confidence intervals for agronomic and economic optima.
5. Conclusions
This study systematically investigated the synergistic regulatory effects of nitrogen application rate (N) and fertilization method (F) on grain-filling dynamics, protein fraction accumulation, panicle traits, multidimensional quality, and yield in Koshihikari over two growing seasons (2024 and 2025). The conclusions are as follows:
The synergistic regulation of the grain-filling process and protein accumulation is central to understanding the effects of nitrogen fertilization. Grain-filling parameters and protein fractions were measured only in 2024. Grain filling in superior grains was primarily characterized by a higher filling rate and earlier initiation, whereas inferior grains showed delayed initiation and later peak timing. However, under high-nitrogen conditions, the duration of effective grain filling in inferior grains was shortened and late-stage grain filling was prolonged. Protein fraction accumulation was highly correlated with grain-filling parameters; grains with an early onset of grain filling and prolonged filling periods during the early, middle, and late stages were more conducive to protein accumulation, with the association between glutelin and prolamin being more persistent than that between albumin and globulin. These conclusions were robust to multiple testing and temporal correlation, as confirmed by FDR correction and linear mixed-effects models.
Rice quality exhibited structural trade-offs in response to nitrogen application. Milling quality was optimal at N90, while appearance and cooking/taste quality continued to deteriorate as nitrogen application increased; improvements in protein accumulation came at the expense of taste quality. Among the textural characteristics, hardness, gumminess, and chewiness increased continuously with increasing nitrogen application, whereas springiness and adhesion force were optimal at N45. These quality responses were consistent across both years, with N90 optimal for milling quality and N45 best for eating quality.
Fertilization methods were effective in mitigating the yield–quality trade-off. Precise quantitative side-deep fertilization (PQSF), under high-nitrogen conditions, maintained grain filling in weaker grains by delaying root senescence and optimizing post-flowering assimilate transport, thereby mitigating the negative impact of excessive storage protein accumulation on taste; light and simplified fertilization (LSF) achieved the highest measured yield within the nitrogen application range of 135–153 kg ha−1. The 2025 data confirmed that LSF consistently produced the highest yield within this range, while PQSF maintained better quality under high nitrogen in both years. PCA and hierarchical clustering analyses indicated that N accounted for most of the variation in yield and quality, whereas fertilization methods served as a secondary optimization function.
Two strategies are recommended based on the two-year experimental results. For maximum yield, light and simplified fertilization (LSF) combined with an N of 135–153 kg ha−1 is recommended. For high-quality, eco-friendly production, precise quantitative side-deep fertilization (PQSF) and an N of 135 kg ha−1 is recommended. However, because only the basal fertilizer was deep-placed in this study, the performance of fully mechanized side-deep fertilization systems requires further evaluation. Conventional fertilization with N application exceeding 150 kg ha−1 should be avoided under the conditions of this experiment. Because the core yield and quality conclusions were validated across two years, these recommendations are more robust; however, the mechanistic insights were derived mainly from the 2024 experiment, and further multi-year, multi-site field trials are needed to verify the stability of these conclusions. Future research should specifically examine the following aspects: (1) root activity, nitrogen uptake dynamics, and assimilate translocation to confirm the physiological mechanisms underlying the quality-stabilizing effect of PQSF; (2) soil nitrogen mineralization and 15N isotope tracing to clarify nitrogen transformation and allocation under PQSF and LSF; (3) lodging resistance, stem strength, and harvest index to evaluate the yield stability of high-nitrogen treatments; (4) economic optimum nitrogen rates based on local rice and fertilizer prices; (5) fully mechanized side-deep fertilization systems with both basal and topdressing fertilizers deep-placed; (6) multiple cultivars and soil types to generalize the recommendations; and (7) climate year classification to develop scenario-based fertilization strategies. These directions will provide a more comprehensive basis for precise nitrogen management of high-quality japonica rice in the Liaodong coastal rice region.
Supplementary Materials
The following supporting information can be downloaded at https://www.mdpi.com/article/10.3390/agriculture16212357/s1, Table S1: Effects of nitrogen application rates and fertilization methods on primary branch traits of Koshihikari rice in 2024 and 2025; Table S2: Effects of nitrogen application rates and fertilization methods on secondary branch traits of Koshihikari rice in 2024 and 2025; Table S3: Effects of nitrogen application rates and fertilization methods on milling quality of Koshihikari rice in 2024 and 2025; Table S4: Effects of nitrogen application rates and fertilization methods on nutritional and appearance quality of Koshihikari rice in 2024 and 2025. Table S5: Effects of nitrogen application rates and fertilization methods on cooking and eating quality of Koshihikari rice in 2024 and 2025; Table S6: Grain-filling parameters of superior and inferior grains under different nitrogen application rates and fertilization methods; Table S7: Benjamini-Hochberg FDR correction results for protein fraction data; Table S8: Linear mixed-effects model results for protein fractions; Table S9: Factor loadings of principal component analysis for quality-related traits (X1–X40); Table S10: Factor loadings of principal component analysis for yield-related traits (X1–X71); Table S11: Principal component scores of quality-related traits for each treatment (X1–X40); Table S12: Principal component scores of yield-related traits for each treatment (X1–X71).
Author Contributions
Conceptualization, X.L. and D.M.; methodology, X.L. and D.M.; software, L.C.; validation, L.C., H.J., H.L., W.D., Z.B. and B.P.; formal analysis, L.C.; investigation, H.J., H.L., W.D., Z.B., B.P. and X.Y.; resources, X.L. and D.M.; data curation, H.J., H.L., W.D., Z.B., B.P. and X.Y.; writing—original draft preparation, L.C.; writing—review and editing, L.C., H.J., H.L., W.D., Z.B., B.P., X.L., D.M. and X.Y.; visualization, L.C.; supervision, X.L. and D.M.; project administration, X.L. and D.M.; funding acquisition, X.L. and D.M. All authors have read and agreed to the published version of the manuscript.
Funding
This research was funded by the Doctoral Scientific Research Start-up Fund Project of Eastern Liaoning University (grant number 2024BS013), the Donggang Rice Science and Technology Commissioner Program of Liaoning Province (grant number 2026JH5/10400086), the Key Research and Development Program of Liaoning Province (Innovation Consortium) (grant number 2025JH2/102700015), and the Science and Technology Program Joint Plan of Liaoning Province (grant number 2024-BSLH-091).
Data Availability Statement
The original contributions presented in this study are included in the article/Supplementary Materials. Further inquiries can be directed to the corresponding author.
Conflicts of Interest
The authors declare no conflicts of interest.
Abbreviations
The following abbreviations are used in this manuscript:
| FP | Farmers’ practice |
| LSF | Light and simplified fertilization |
| PQSF | Precise quantitative side -deep fertilization |
| N | Nitrogen application rate |
| F | Fertilization method |
| DAF | Days after flowering |
| TPA | Texture profile analysis |
| PCA | Principal component analysis |
| Gmax | Maximum grain-filling rate |
| Gmean | Mean grain-filling rate |
| D | Effective grain-filling duration |
References
- Takeuchi, Y.; Hori, K.; Sasaki, K. Major QTLs for Eating Quality of an Elite Japanese Rice Cultivar, Koshihikari, on the Short Arm of Chromosome 3. Breed. Sci. 2008, 58, 437–445. [Google Scholar] [CrossRef] [Scilit]
- Kobayashi, A.; Hori, K.; Yamamoto, T.; Yano, M. Koshihikari: A premium short-grain rice cultivar—Its expansion and breeding in Japan. Rice 2018, 11, 15. [Google Scholar] [CrossRef] [Scilit]
- Yan, R.Y.; Gan, G.Y.; Zhao, X.M.; Yin, D.C.; Li, Y.L.; Jin, H.F.; Zhu, H.; Li, J.F. Research on Production Pattern and Fertilization Status of Dominant Rice Production Areas in China. China Rice 2023, 29, 1–8. (In Chinese) [Google Scholar] [CrossRef]
- Cao, F.Y. Cultivation Techniques for Lodging Resistance of High-Quality Rice Variety Koshihikari in the Yellow Sea Rice Region. North. Rice 2021, 51, 52–53. (In Chinese) [Google Scholar]
- Cassman, K.G.; Peng, S.; Olk, D.C.; Ladha, J.K.; Reichardt, W.; Dobermann, A.; Singh, U. Opportunities for Increased Nitrogen-Use Efficiency from Improved Resource Management in Irrigated Rice Systems. Field Crops Res. 1998, 56, 7–39. [Google Scholar] [CrossRef] [Scilit]
- Che, S.G.; Zhao, B.Q.; Li, Y.T.; Yuan, L.; Li, W.; Lin, Z.A.; Hu, S.W.; Shen, B. Review grain yield and nitrogen use efficiency in rice production regions in China. J. Integr. Agric. 2015, 14, 2456–2466. [Google Scholar] [CrossRef] [Scilit]
- Xu, Y.F.; Jia, H.Y.; Li, Y.T.; Cao, R.; Gao, Z.Q.; Zhao, Z.; Chen, L.Q.; Liang, X. Effects of Nitrogen Application Rate and Management on Yield Formation and Root Morphology of High-Quality Japonica Rice Cultivar Koshihikari. Crops 2026, 42, 117–128. (In Chinese) [Google Scholar] [CrossRef]
- Zhao, C.; Liu, G.; Chen, Y.; Jiang, Y.; Shi, Y.; Zhao, L.; Liao, P.; Wang, W.; Xu, K.; Dai, Q. Excessive Nitrogen Application Leads to Lower Rice Yield and Grain Quality by Inhibiting the Grain Filling of Inferior Grains. Agriculture 2022, 12, 962. [Google Scholar] [CrossRef] [Scilit]
- Chen, G.Y.; Li, C.M.; Hu, M.M.; He, X.M.; Yang, H.; Zhang, Q.Q.; Wu, C.Y.; Duan, Q.; Peng, L.G.; Zhang, Y. Evaluating Rice Lipid Content, Yield, and Quality in Response to Nitrogen Application Rate and Planting Density. Front. Plant Sci. 2024, 15, 1469264. [Google Scholar] [CrossRef] [Scilit]
- Zhou, C.; Huang, Y.; Jia, B.; Wang, Y.; Wang, Y.; Xu, Q.; Li, R.; Wang, S.; Dou, F. Effects of Cultivar, Nitrogen Rate, and Planting Density on Rice-Grain Quality. Agronomy 2018, 8, 246. [Google Scholar] [CrossRef] [Scilit]
- Chen, X.; Yu, J.; Zhu, Y.; Liu, G.; Li, G.; Xu, F.; Hu, Q.; Cao, J.; Zhang, H.; Wei, H. Carbon–Nitrogen Metabolism Associated with Appearance Quality in Superior and Inferior Grains of Soft and Non-Soft Japonica Rice in Southern China. Plants 2026, 15, 1155. [Google Scholar] [CrossRef] [Scilit]
- Zhao, C.; Chen, Y.; Liu, K.; Liu, G.; Lu, J.; Wang, W.; Huo, Z. Excessive Nitrogen Application Reduces Eating Quality by Changing the Starch Molecular Structure and Physicochemical Properties of Inferior Grains. J. Cereal Sci. 2025, 121, 104097. [Google Scholar] [CrossRef] [Scilit]
- Xu, Y.Q.; Guan, X.Y.; Han, Z.Y.; Zhou, L.J.; Zhang, Y.; Asad, M.A.U.; Wang, Z.W.; Jin, R.; Pan, G.; Cheng, F.M. Combined Effect of Nitrogen Fertilizer Application and High Temperature on Grain Quality Properties of Cooked Rice. Front. Plant Sci. 2022, 13, 874033. [Google Scholar] [CrossRef] [Scilit]
- Jiang, Z.R.; Yang, H.Y.; Zhu, M.C.; Wu, L.M.; Yan, F.Y.; Qian, H.Y.; He, W.J.; Liu, D.; Chen, H.; Chen, L.; et al. The Inferior Grain Filling Initiation Promotes the Source Strength of Rice Leaves. Rice 2023, 16, 41. [Google Scholar] [CrossRef] [Scilit]
- Wei, H.; Meng, T.; Li, X.; Dai, Q.; Zhang, H.; Yin, X. Sink-Source Relationship During Rice Grain Filling Is Associated with Grain Nitrogen Concentration. Field Crops Res. 2018, 215, 23–38. [Google Scholar] [CrossRef] [Scilit]
- He, H.B.; Wang, Q.; Yang, K.; Niu, M.X.; Wang, L.L.; Wu, H.; You, C.C.; Ke, J.; Zhu, D.Q.; Wu, L.Q. Optimizing Nitrogen Distribution in Source-Sink Organs at Heading for High Grain Yield and High Nitrogen Use Efficiency in Japonica Rice. Agron. J. 2021, 113, 4832–4849. [Google Scholar] [CrossRef] [Scilit]
- Li, L.; Tian, H.; Zhang, M.H.; Fan, P.S.; Ashraf, U.; Liu, H.D.; Chen, X.F.; Duan, M.Y.; Tang, X.R.; Wang, Z.M.; et al. Deep Placement of Nitrogen Fertilizer Increases Rice Yield and Nitrogen Use Efficiency with Fewer Greenhouse Gas Emissions in a Mechanical Direct-Seeded Cropping System. Crop J. 2021, 9, 1386–1396. [Google Scholar] [CrossRef] [Scilit]
- Yi, J.; Gao, J.; Zhang, W.; Zhao, Y.; Zhao, C.; Zhao, Y.; Li, Z.; Xin, W. Delayed Timing of Tillering Fertilizer Improved Grain Yield and Nitrogen Use Efficiency in Japonica Rice. Crop Sci. 2020, 60, 2. [Google Scholar] [CrossRef] [Scilit]
- Chen, L.; Jia, H.; Xu, Y.; Xu, J.; Liu, Y.; Liang, X.; Zhang, W. Effects of Potassium Management on Yield Formation and Nutrient Utilization in Japonica Rice Cultivars with Contrasting Nitrogen Efficiency Under a Simplified Nitrogen Regime. Agriculture 2026, 16, 1242. [Google Scholar] [CrossRef] [Scilit]
- Chen, L.; Zhang, W.; Gao, J.; Liu, Y.; Wang, X.; Liu, Y.; Feng, Y.; Zhao, Y.; Xin, W. Effects of Precise K Fertilizer Application on the Yield and Quality of Rice under the Mode of Light, Simple, and High-Efficiency N Fertilizer Application during the Panicle Stage. Agronomy 2022, 12, 1681. [Google Scholar] [CrossRef] [Scilit]
- Wu, P.H.; Wang, G.B.; Dai, Z.G.; Zhou, X.; Wu, Y.Q.; Gong, X.M.; Li, X.K. Effects of Reduced Mechanical Side-Deep Fertilization on Rice Yield and Fertilizer Use Efficiency. Trans. Chin. Soc. Agric. Eng. 2025, 41, 57–65. [Google Scholar] [CrossRef]
- Huang, L.Y.; Li, X.X.; Peng, S.B.; Wang, F. Inter-Annual Climate Variability Constrains Rice Genetic Improvement in China. Food Energy Secur. 2021, 10, e299. [Google Scholar] [CrossRef] [Scilit]
- Richards, F. A flexible growth function for empirical use. J. Exp. Bot. 1959, 10, 290–301. [Google Scholar] [CrossRef] [Scilit]
- Zhu, Q.; Cao, X.; Luo, Y. Growth analysis on the process of grain filling in rice. Acta Agron. Sin. 1988, 14, 182–193. (In Chinese) [Google Scholar]
- Liu, B.; Meng, S.; Yang, J.; Wu, J.; Peng, Y.; Zhang, J.; Ye, N. Carbohydrate flow during grain filling: Phytohormonal regulation and genetic control in rice (Oryza sativa). J. Integr. Plant Biol. 2025, 67, 1086–1104. [Google Scholar] [CrossRef] [Scilit]
- Fan, M.; Wang, X.; Sun, J.; Zhang, Q.; Xu, Z.; Xu, Q. Effect of indica pedigree on eating and cooking quality in rice backcross inbred lines of indica and japonica crosses. Breed. Sci. 2017, 67, 450–458. [Google Scholar] [CrossRef] [Scilit][Green Version]
- Luthe, D. Storage protein accumulation in developing rice Oryza sativa L. seeds. Plant Sci. Lett. 1983, 32, 147–158. [Google Scholar] [CrossRef] [Scilit]
- Liu, Z.; Cheng, F.; Cheng, W.; Zhang, G. Positional variations in phytic acid and protein content within a panicle of japonica rice. J. Cereal Sci. 2005, 41, 297–303. [Google Scholar] [CrossRef] [Scilit]
- Cui, J.; Yu, X.Y.; Yu, Y.J.; Liang, C.W.; Sun, J.; Chen, W.F. Analysis of the Texture Factors and Genetic Basis Influencing the Differences in Eating Quality between Northeast China and Japanese Japonica Rice. Chin. Bull. Bot. 2025, 60, 533–550. (In Chinese) [Google Scholar] [CrossRef]
- Chen, L.; Deng, Y.; Zhu, H.L.; Hu, Y.X.; Jiang, Z.R.; Tang, S.; Wang, S.H.; Ding, Y.F. The Initiation of Inferior Grain Filling Is Affected by Sugar Translocation Efficiency in Large Panicle Rice. Rice 2019, 12, 75. [Google Scholar] [CrossRef] [Scilit]
- Guo, C.C.; Xie, Y.; Feng, Y.; Xu, K.; Huo, Z.Y. Nitrogen Application Rate Affects the Accumulation of Carbohydrates in Functional Leaves and Grains to Improve Grain Filling and Reduce the Occurrence of Chalkiness. Front. Plant Sci. 2022, 13, 921130. [Google Scholar] [CrossRef] [Scilit]
- Jiang, H.F.; Zhao, Y.Z.; Chen, L.Q.; Wan, X.; Yan, B.C.; Liu, Y.Z.; Liu, Y.Q.; Zhang, W.Z.; Gao, J.P. Grain Weight and Taste Quality in Japonica Rice Are Regulated by Starch Synthesis and Grain Filling Under Nitrogen–Phosphorus Interactions. Plants 2025, 14, 432. [Google Scholar] [CrossRef] [Scilit]
- Xu, W.T.; Li, J.M.; Feng, J.C.; Shao, Z.Z.; Huang, Y.D.; Hou, W.F.; Gao, Q. Nitrogen and Potassium Interactions Optimized Asynchronous Spikelet Filling and Increased Grain Yield of Japonica Rice. PeerJ 2023, 11, e14710. [Google Scholar] [CrossRef] [Scilit]
- Yuan, K.Q.; Li, J.T.; Chen, Z.F.; Ma, X.W.; Bell, R.W.; Cao, Y.X.; Hou, J. Side-Deep Fertilization Increases Rice Yield and Nutrient Use Efficiency in China: A Meta-Analysis. Eur. J. Agron. 2026, 176, 127547. [Google Scholar] [CrossRef] [Scilit]
- Hu, M.M.; Li, Z.X.; Chen, K.R.; Xiong, Y.; Luo, Y.H.; Wang, A.L.; Li, L.L.; Shu, C.H.; Chen, Z.K.; Yang, Z.Y.; et al. Side Deep Placement of Slow-Release N as Base Fertilizer Combined with Urea as Panicle Fertilizer Increases Rice Yield by Optimizing Dry Matter and N Accumulation and Translocation. Front. Plant Sci. 2025, 16, 1600215. [Google Scholar] [CrossRef] [Scilit]
- Liang, H.L.; Gu, B.Y.; Wang, T.Y.; Rong, L.Y.; Sun, W.T.; Wu, Z.X. Relationship between Protein Structure and Eating Quality of Rice under Different Nitrogen Application Rates. Cereal Chem. 2022, 99, 578–588. [Google Scholar] [CrossRef] [Scilit]
- Chen, S.B.; Chen, S.J.; Jiang, Y.H.; Lu, Q.; Liu, Z.Y.; Liu, W.Y.; Wang, X.H.; Shi, W.H.; Xu, Q.; Sun, J.; et al. Dissecting of the Deterioration in Eating Quality for Erect Panicle (Ep) Type High Yield Japonica Super Rice in Northeast China. Rice 2022, 15, 20. [Google Scholar] [CrossRef] [Scilit]
- Han, D.; Jiang, B.; You, X. Effects of Nitrogen Fertilizer Levels on Rice Quality and Starch Properties of Common and Glutinous Japonica Rice: Implications for Sustainable Nitrogen Management. Sustainability 2026, 18, 3828. [Google Scholar] [CrossRef] [Scilit]
- Yang, S.; Zhu, Y.; Zhang, R.; Liu, G.D.; Wei, H.Y.; Zhang, H.C.; Zhang, H.P. Mid-Stage Nitrogen Application Timing Regulates Yield Formation, Quality Traits and 2-Acetyl-1-Pyrroline Biosynthesis of Fragrant Rice. Field Crops Res. 2022, 287, 108667. [Google Scholar] [CrossRef] [Scilit]
- Xi, M.; Wu, W.G.; Xu, Y.Z.; Zhou, Y.J.; Chen, G.; Ji, Y.L.; Sun, X.Y. iTRAQ-Based Quantitative Proteomic Analysis Reveals the Metabolic Pathways of Grain Chalkiness in Response to Nitrogen Topdressing in Rice (Oryza sativa L.). Plant Physiol. Biochem. 2020, 154, 622–635. [Google Scholar] [CrossRef] [Scilit]
- Jiang, Y.H.; Zhao, K.; Xu, J.W.; Sun, J.J.; Zhang, H.C.; Dai, Q.G.; Xu, K.; Huo, Z.Y.; Wei, H.Y.; Guo, B.W.; et al. Effect of Nitrogen Fertilizer Application Rate on the Eating Characteristic and Textural Properties of Japonica Softer Rice. J. Plant Nutr. Fertil. 2015, 21, 288–295. (In Chinese) [Google Scholar] [CrossRef]
- Ma, Z.; Zhu, Z.; Song, W.; Luo, D.; Cheng, H.; Wang, X.; Lyu, W. Effects of Nitrogen Fertilizer on the Endosperm Composition and Eating Quality of Rice Varieties with Different Protein Components. Agronomy 2024, 14, 469. [Google Scholar] [CrossRef] [Scilit]
- Liu, G.D.; Liu, S.Q.; Gao, H.; Zhang, H.C.; Wei, H.Y. High-Level Nitrogen Application Decreases Eating Quality of Rice by Affecting Pasting, Rheological, Water Migration, and Oral Processing Properties. ACS Food Sci. Technol. 2021, 1, 429–438. [Google Scholar] [CrossRef] [Scilit]
- Li, L.N.; Shi, S.J.; Cheng, B.; Zhao, D.; Pan, K.Q.; Cao, C.G.; Jiang, Y. Association between Rice Protein Components and Eating Quality Traits of Different Rice Varieties under Different Nitrogen Levels. J. Cereal Sci. 2023, 113, 103760. [Google Scholar] [CrossRef] [Scilit]
- Tang, J.P.; Chen, J.D.; Liu, S.G.; Hong, Y.; Zhang, Y.; Xin, H.B.; Lu, P.L.; Zhang, M.W. Impact of Reduced and Simplified Side Deep Fertilization on Rice Biomass Production and Quality. Chin. Agric. Sci. Bull. 2026, 42, 16–24. (In Chinese) [Google Scholar] [CrossRef]
- Jiang, D.R.; Xiong, R.Y.; Wu, J.Q.; Mao, F.Q.; Feng, J.J.; Tao, L.; Xie, X.B.; Pan, X.H.; Zeng, Y.J.; Wang, Y.L.; et al. Effects of Side-Deep Fertilization on Yield Formation and Nitrogen Absorption of High-Quality Early Indica Rice under Precision Sowing in Line and Machine Planting. Acta Agron. Sin. 2024, 50, 3096–3106. (In Chinese) [Google Scholar] [CrossRef] [Scilit]
- Hu, X.Y.; Liu, Y.Z.; Zhong, X.H.; Hu, R.; Li, M.J.; Peng, B.; Pan, J.F.; Liang, K.M.; Fu, Y.Q.; Huang, N.R. Optimized Nitrogen Management Improves Grain Yield of Rice by Regulating Panicle Architecture in South China. Heliyon 2024, 10, e34607. [Google Scholar] [CrossRef] [Scilit]
- Li, J.; Feng, Y.H.; Wang, X.K.; Xu, G.L.; Luo, Z.F.; Peng, J.F.; Luo, Q.X.; Lu, W.; Han, Z.L. High Nitrogen Input Increases the Total Spikelets but Decreases the High-Density Grain Content in Hybrid Indica Rice. Field Crops Res. 2022, 288, 108679. [Google Scholar] [CrossRef] [Scilit]
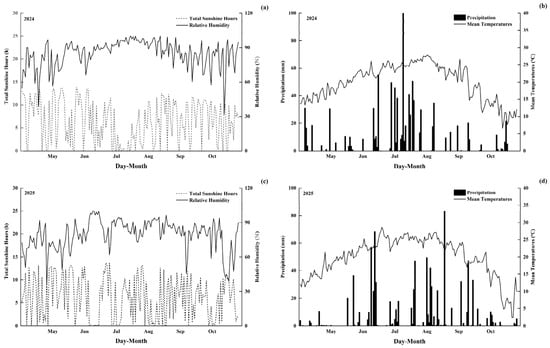
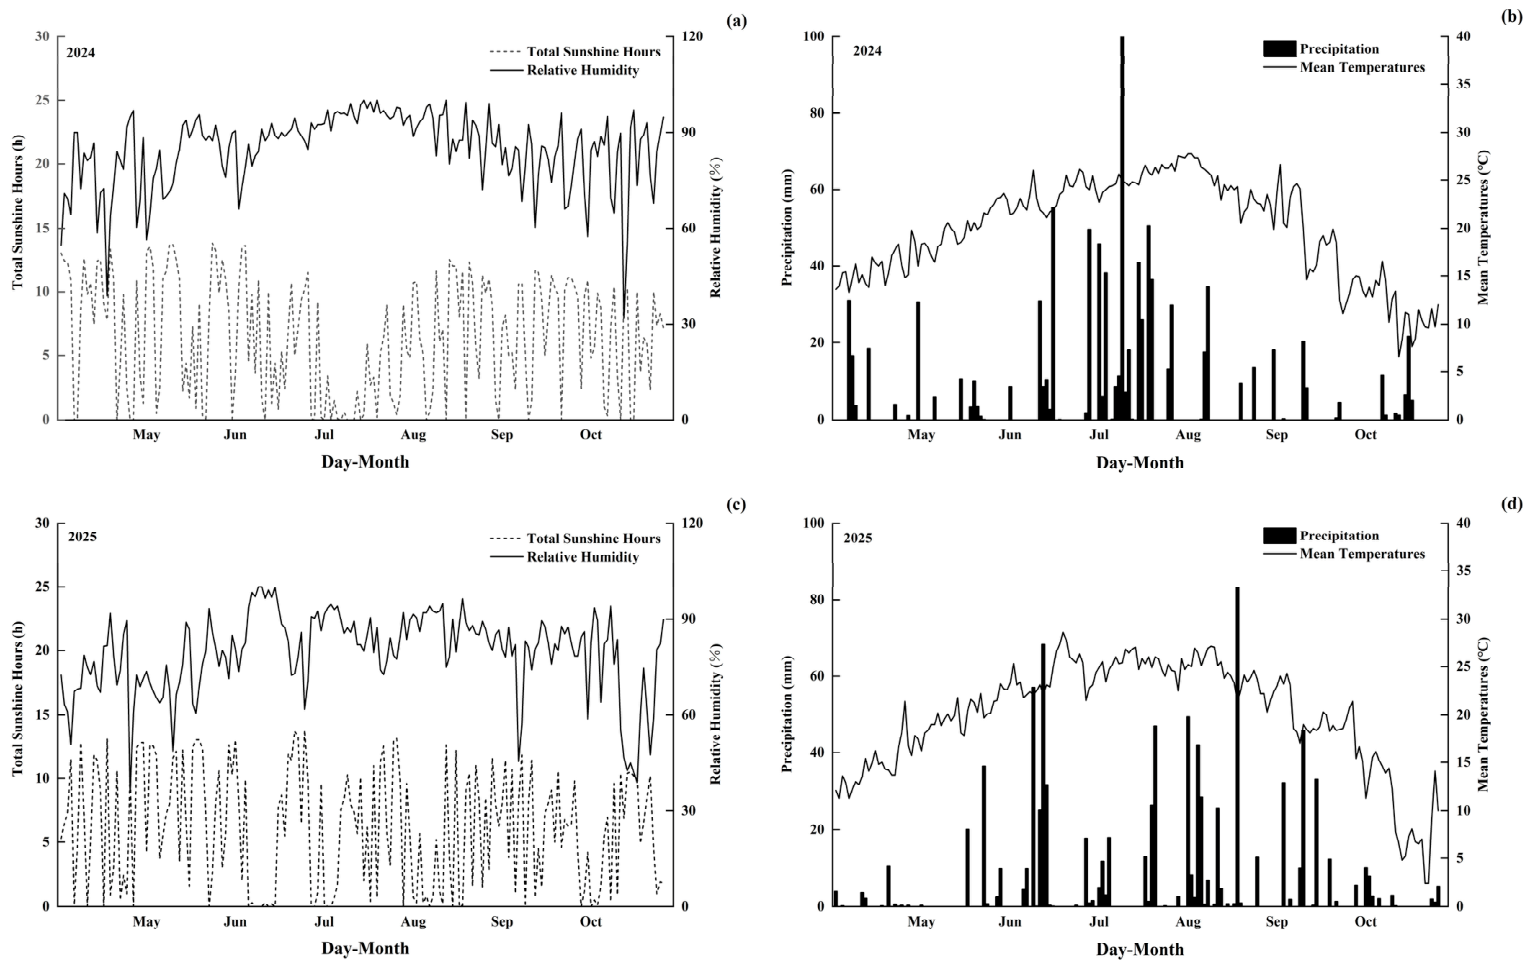
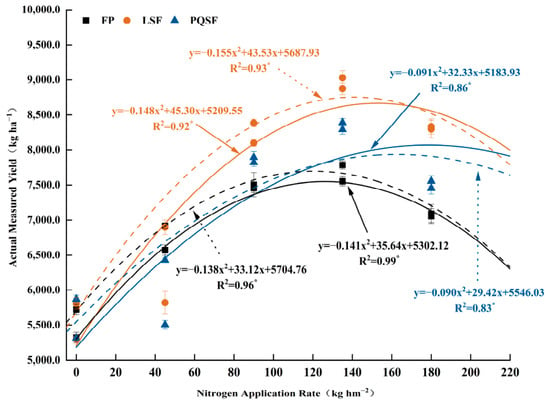
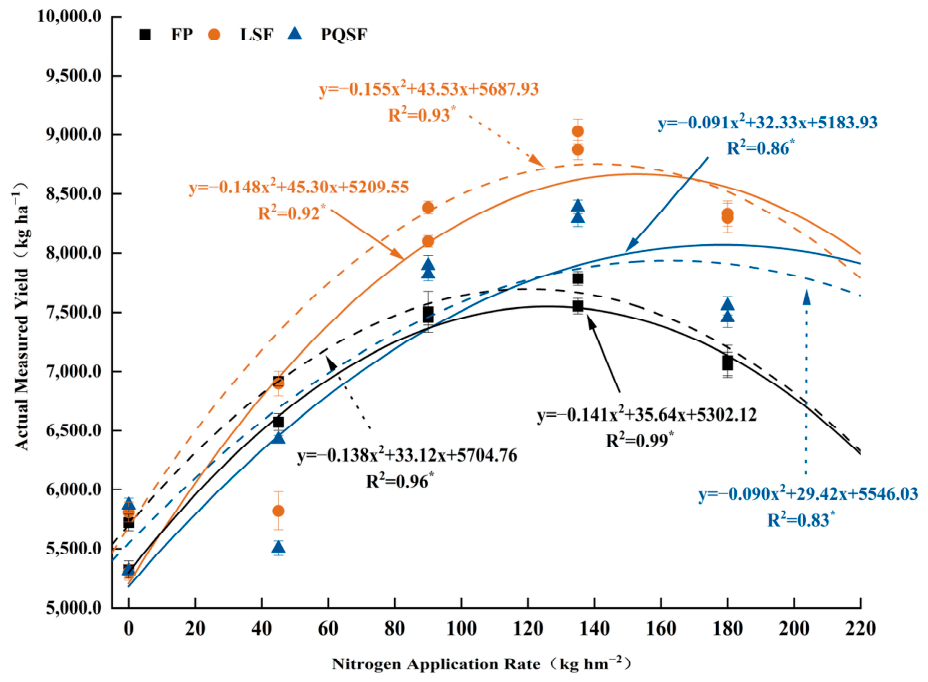
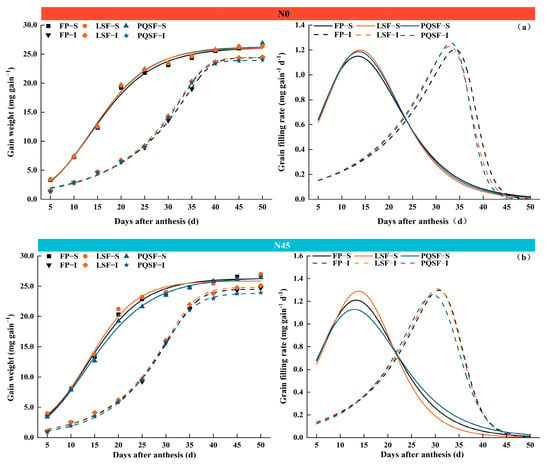
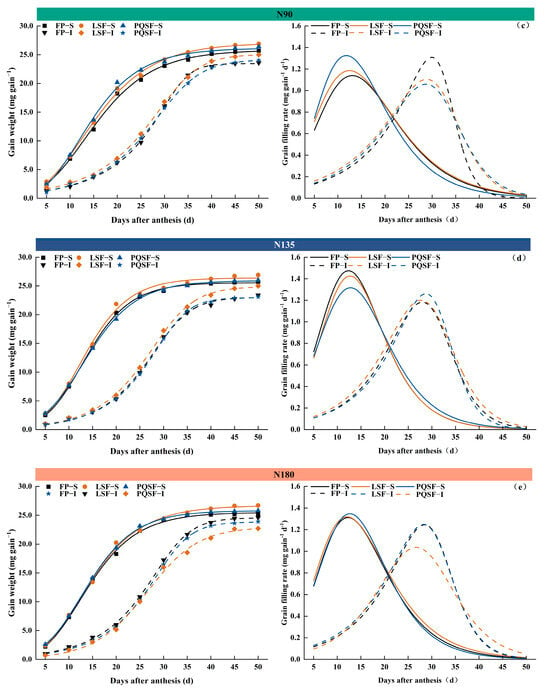
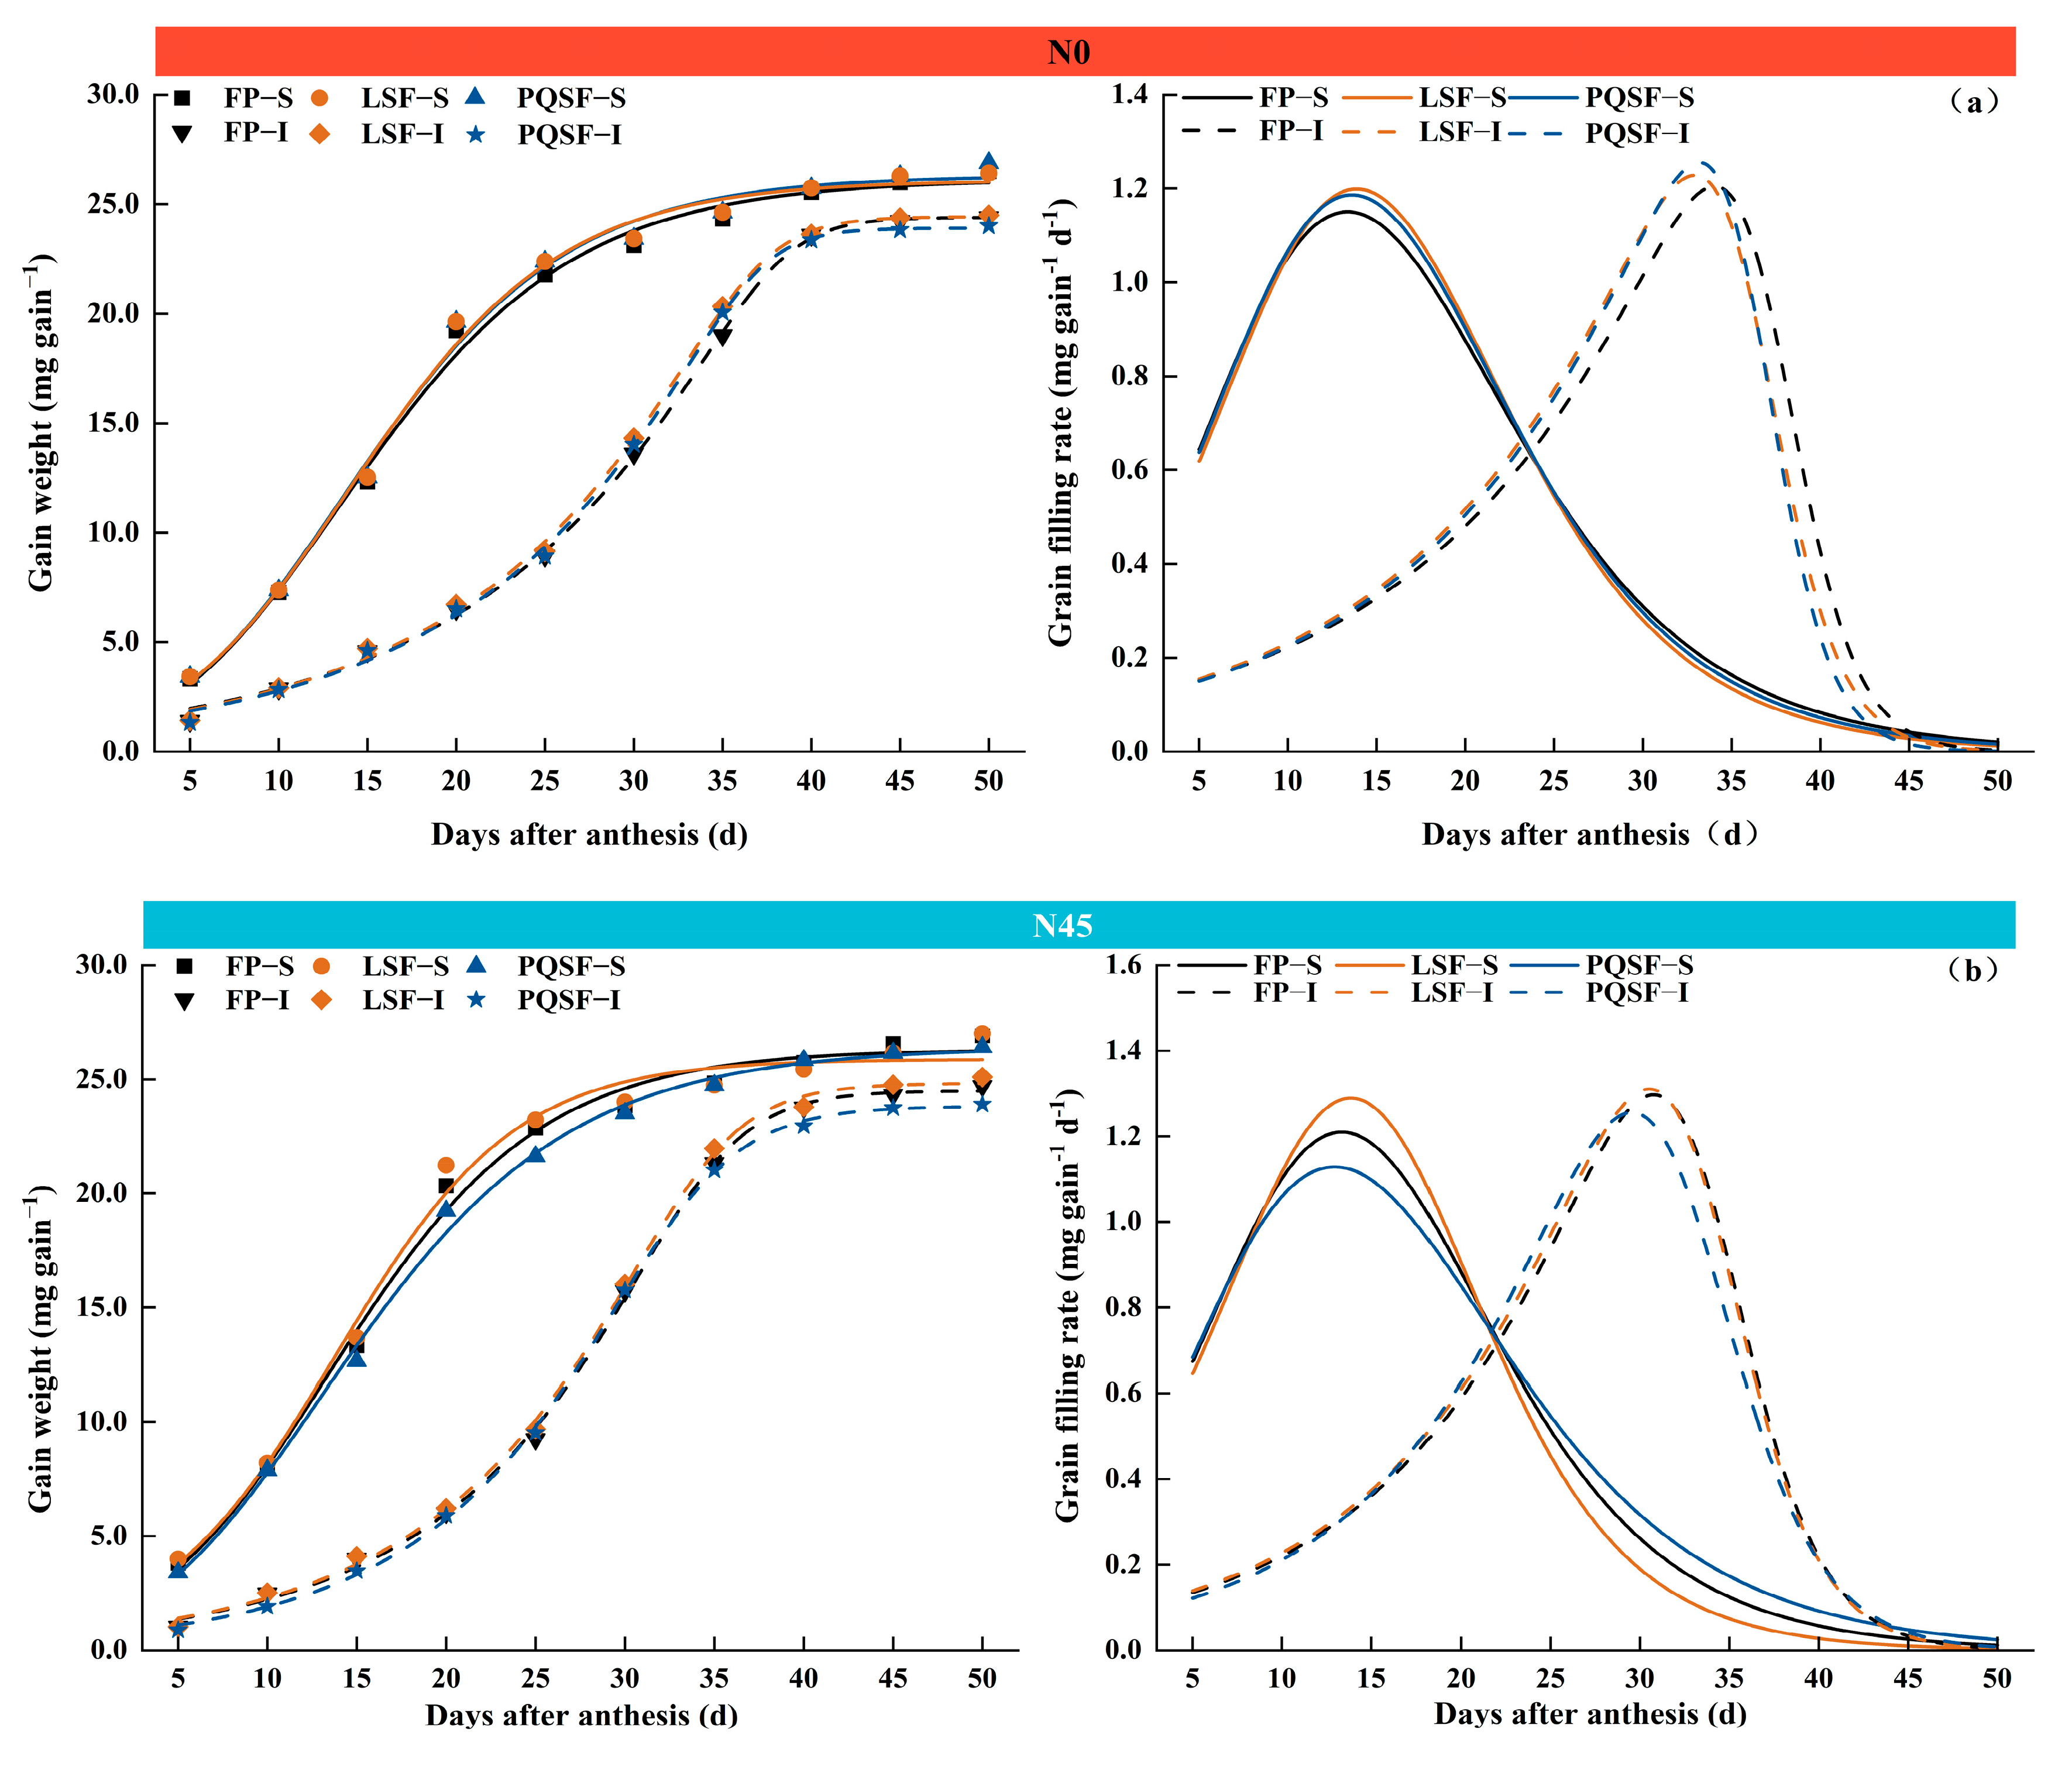
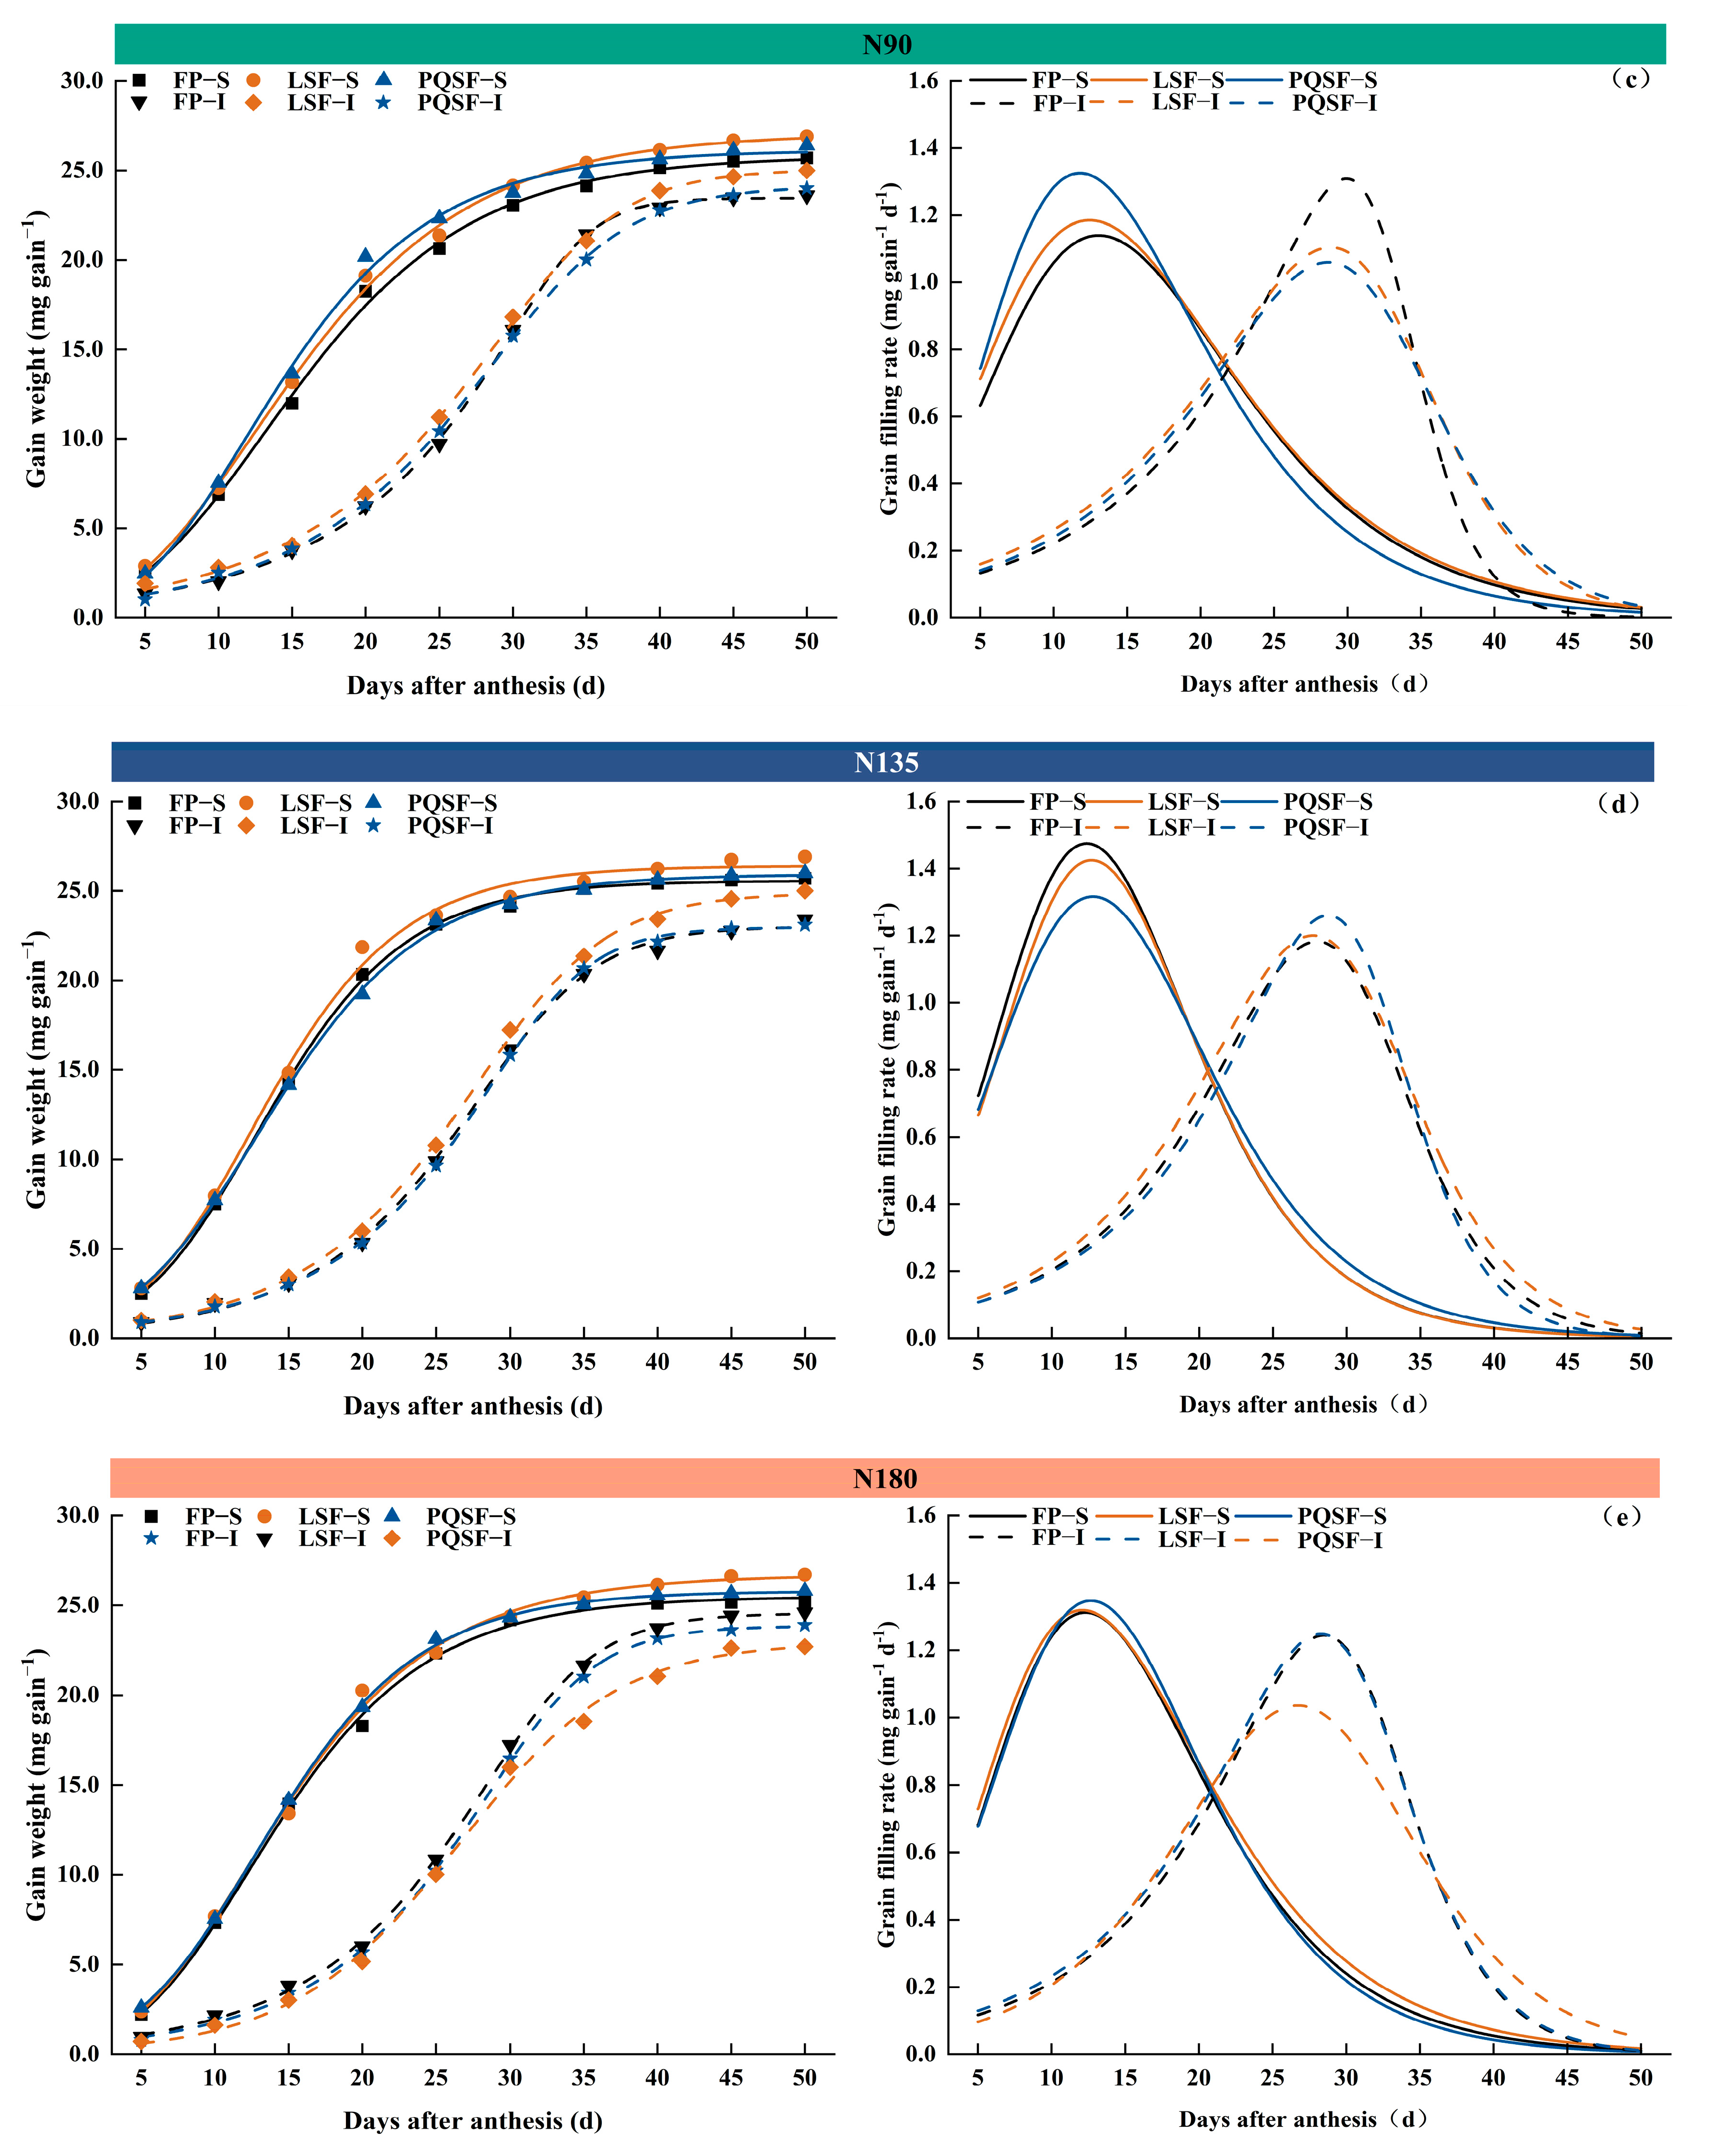
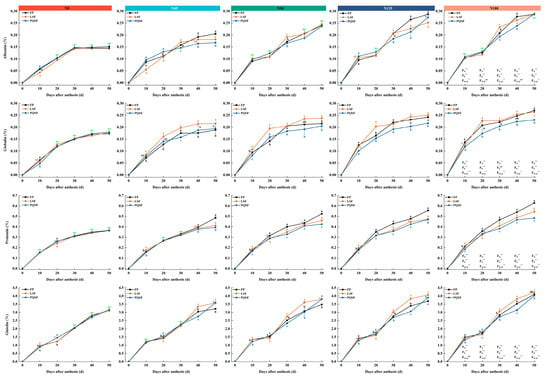
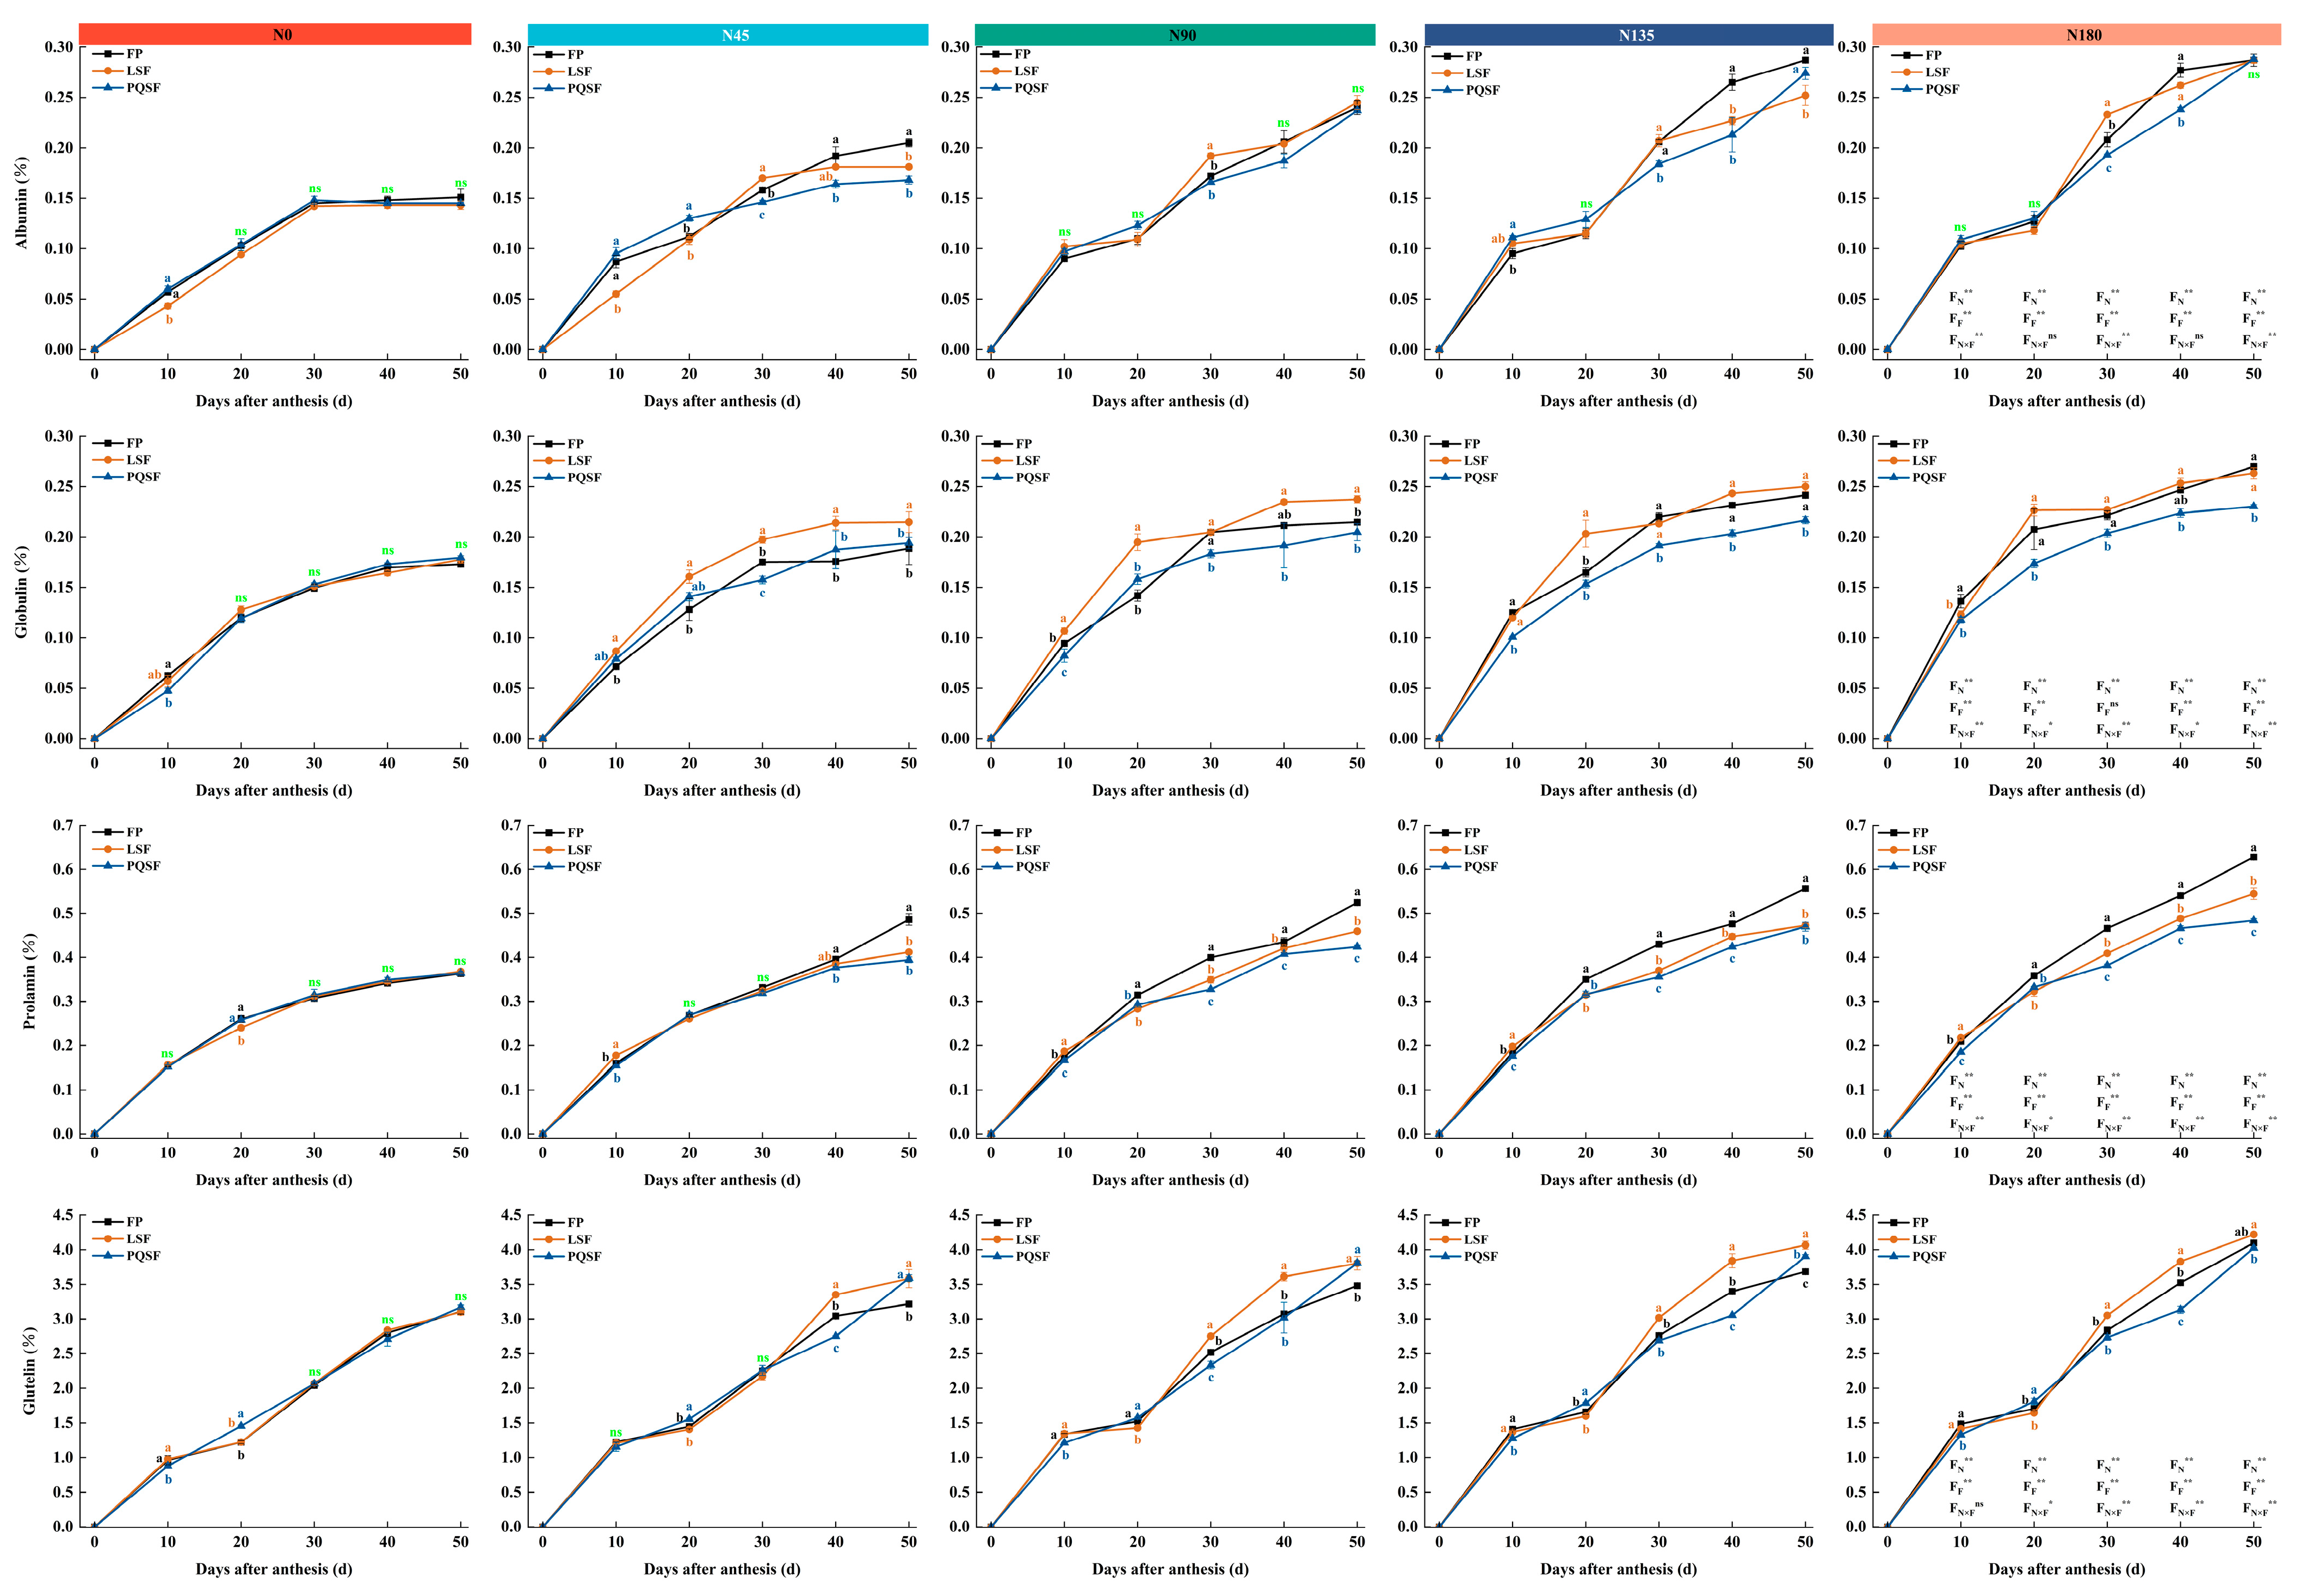
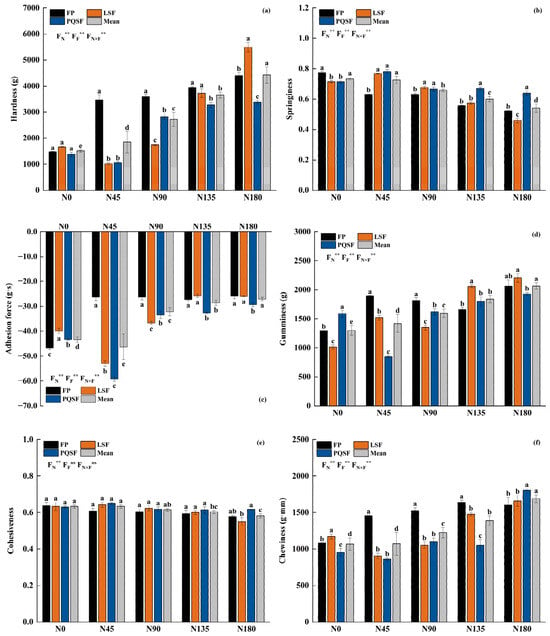
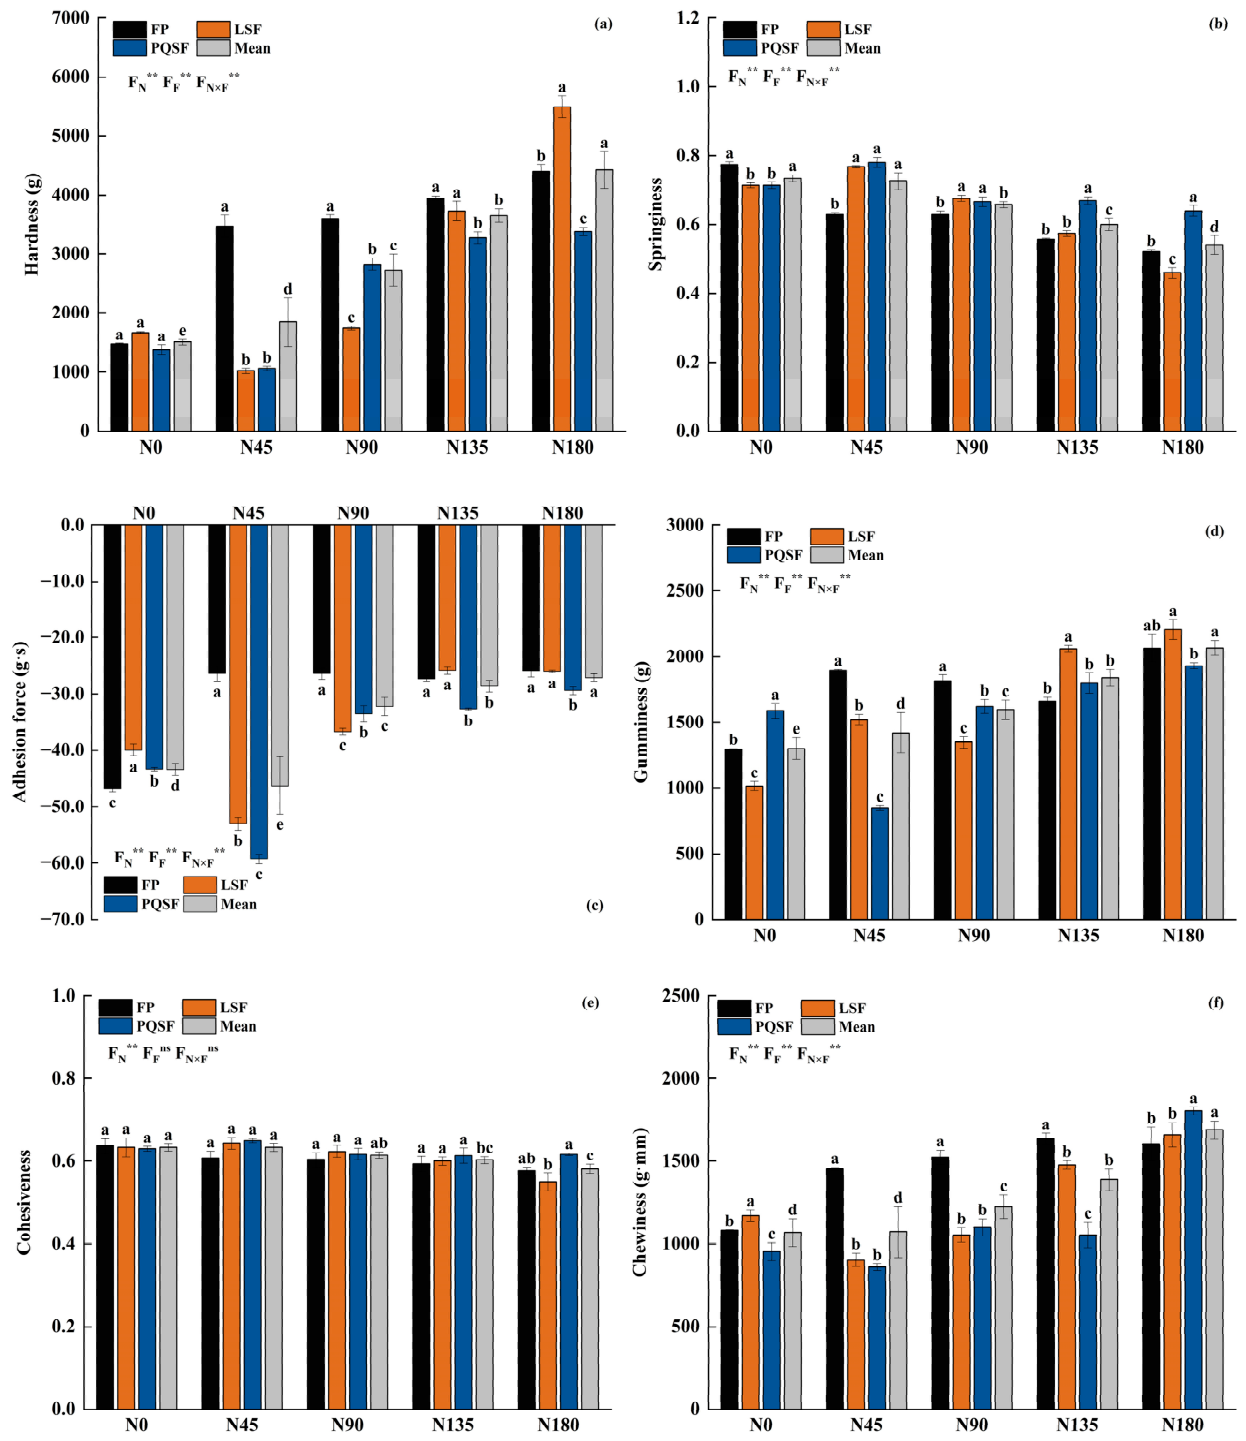
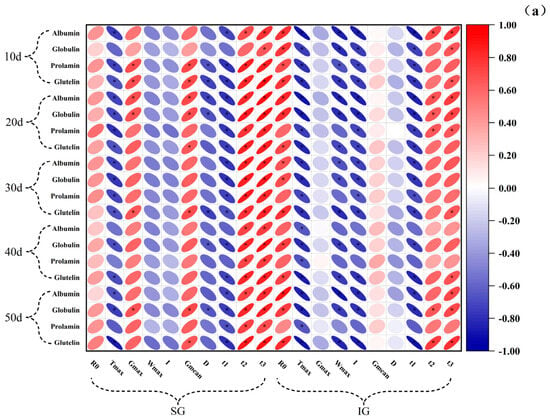
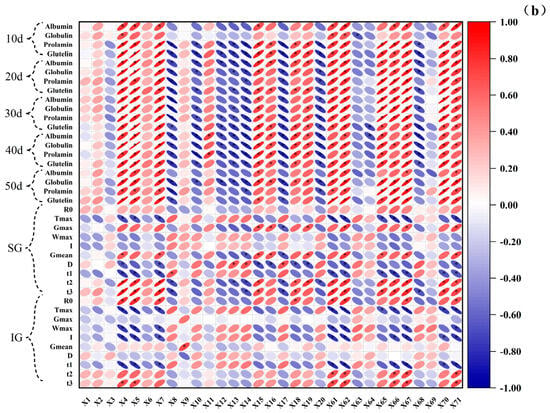
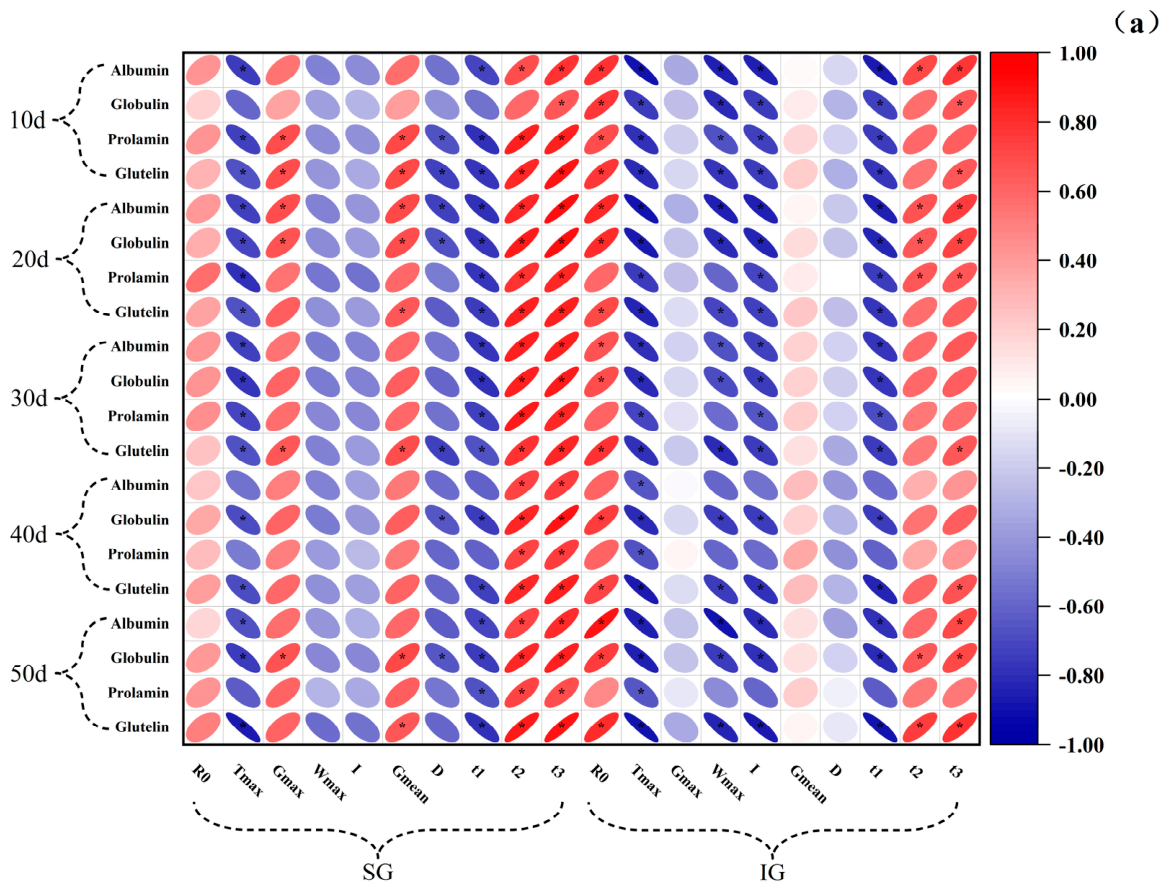
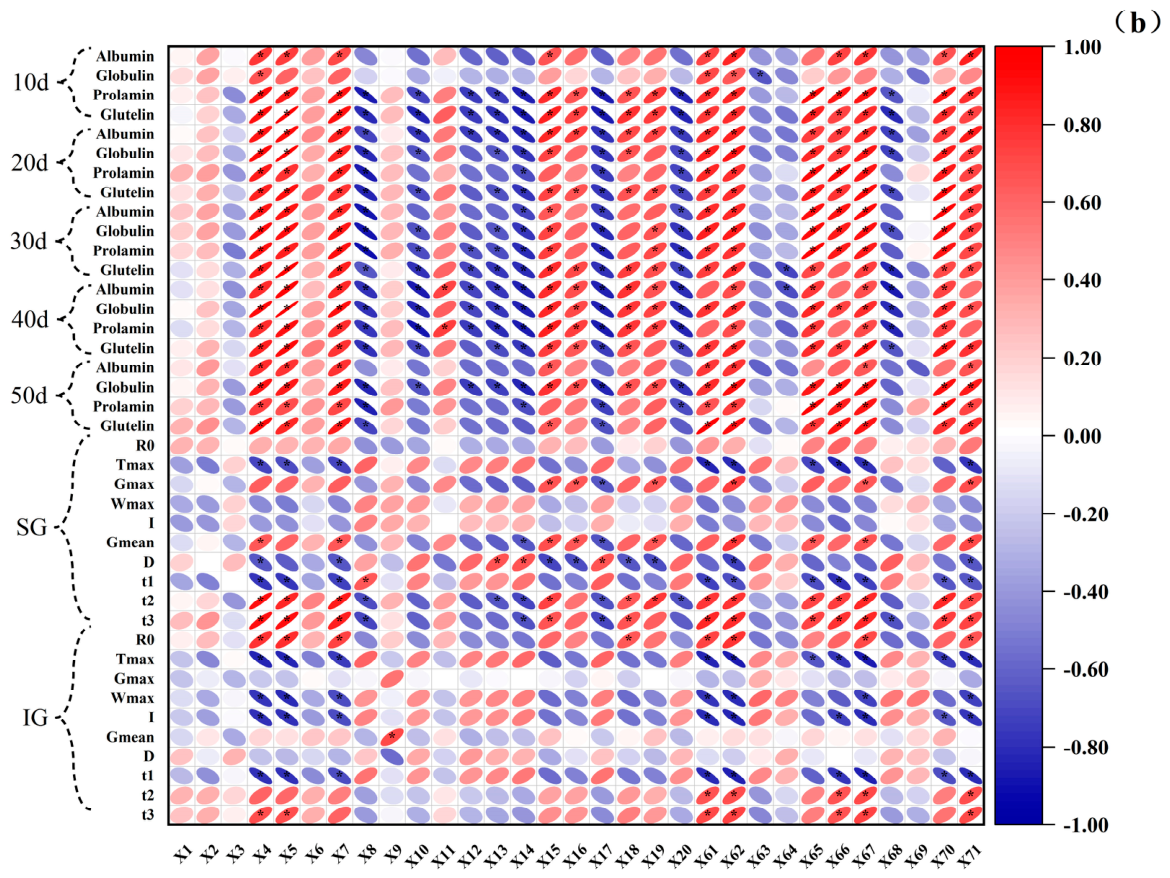
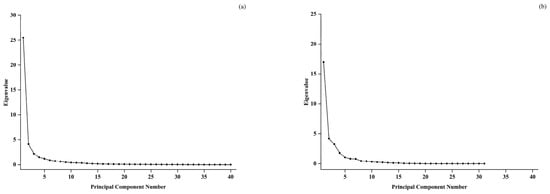
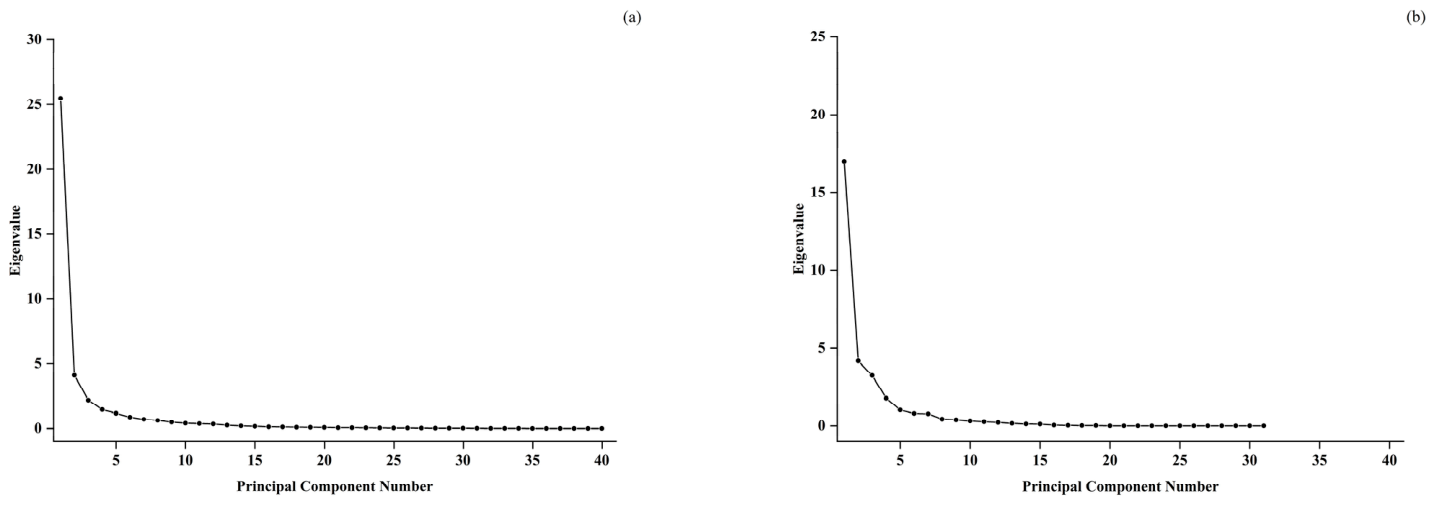
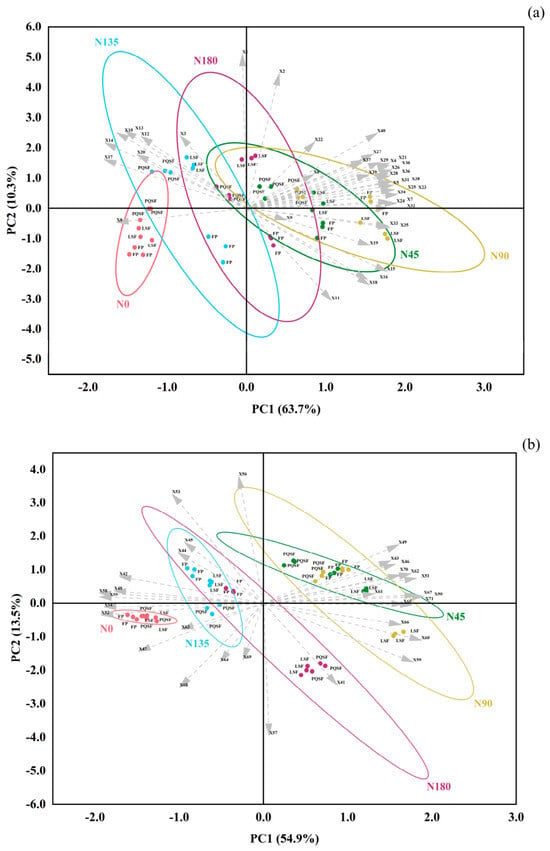
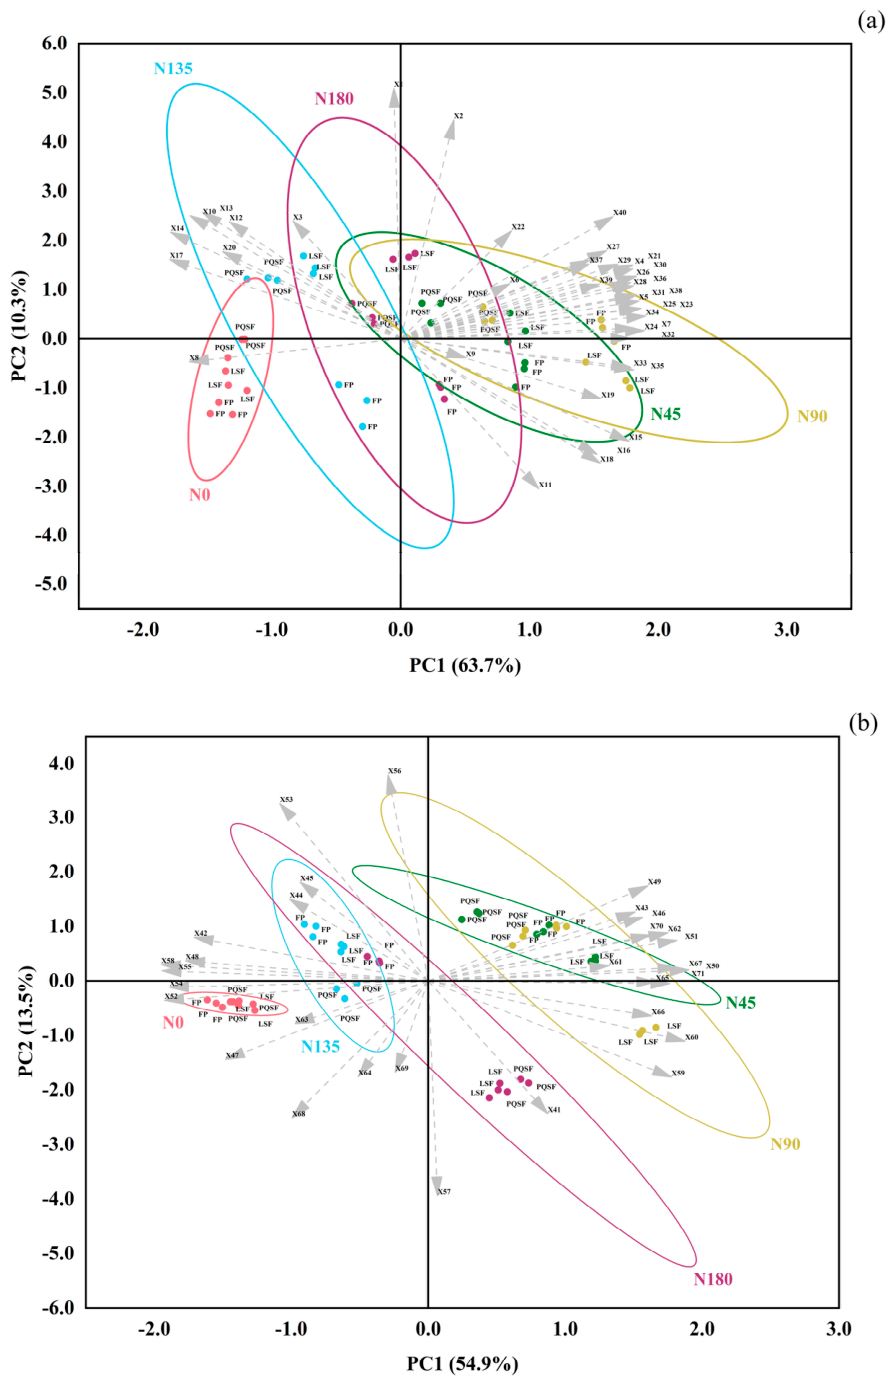
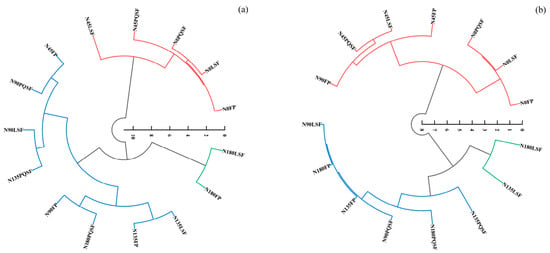
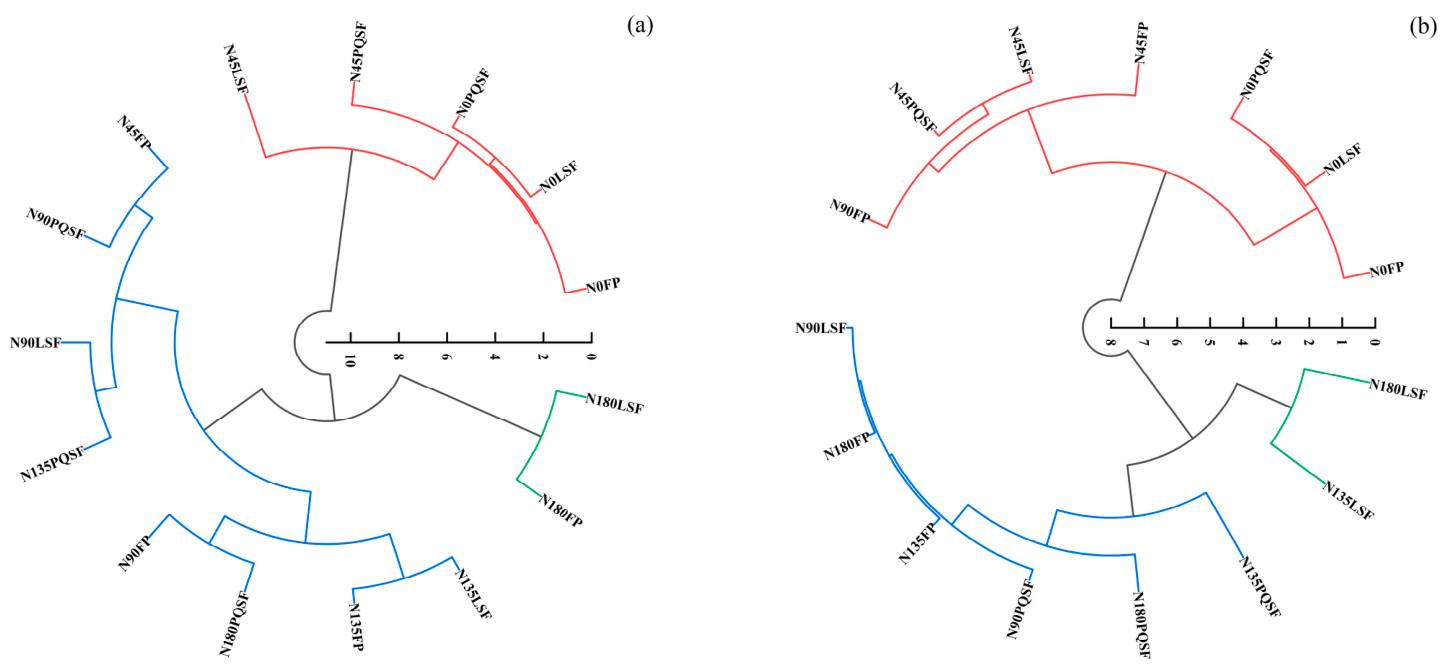

Disclaimer/Publisher’s Note: The statements, opinions and data contained in all publications are solely those of the individual author(s) and contributor(s) and not of MDPI and/or the editor(s). MDPI and/or the editor(s) disclaim responsibility for any injury to people or property resulting from any ideas, methods, instructions or products referred to in the content. |
© 2026 by the authors. Licensee MDPI, Basel, Switzerland. This article is an open access article distributed under the terms and conditions of the Creative Commons Attribution (CC BY) license.