


Abstract
In Korean broiler houses, an evaporative cooling pad (ECP) and a kerosene heater conventionally provide cooling and heating. However, ECP struggles to maintain the optimal rearing temperature under Korea’s hot, humid summer conditions, while winter kerosene heating produces on-site carbon emissions. This study evaluated replacing the conventional cooling and heating system with a rooftop-photovoltaic (PV)-driven air source heat pump (ASHP) that electrifies both cooling and heating. Using a building energy simulation model with a field-validated thermal environment component, 24 scenarios combining climate zone, weather condition, rooftop PV installation, and environmental control strategy were evaluated for thermal environment, energy, and carbon performance. The ASHP reduced setpoint exceedance hours (at least 2 °C) from an ECP average of 387 to 0 h·year−1 and eliminated heat stress hours (temperature–humidity index ≥ 78) but fully electrified the load, raising annual electricity demand to 192–204 MWh. Rooftop PV (323–382 MWh·year−1) exceeded this demand by day, giving 37–38% self-sufficiency and net-negative operational emissions under an export credit approach. Only ASHP + PV removed on-site fossil fuel, making it the substantive decarbonization pathway. PV coupling yielded net revenue with an undiscounted simple payback of 4–13 years. Combining secure thermal control, on-site decarbonization, and self-consumption-oriented operation, ASHP + PV is a promising option for climate-resilient, low-carbon broiler production.
1. Introduction
Since the Paris Agreement, major countries including the Republic of Korea, which has declared carbon neutrality by 2050, have pursued sector-specific emission reductions [1,2,3]. Agriculture and livestock production contribute substantially to global greenhouse gas emissions, both directly and indirectly, throughout the production chain, from feed production to control of the rearing environment [4,5]. In Korea, the 2030 Nationally Determined Contribution targets a reduction in emission from the agriculture, livestock, and fisheries sector from 24.7 to 18.0 MtCO2eq (approximately 27%) [6]. These targets have increased the need for low-carbon approaches to livestock production, including broiler production [7].
Broiler production has grown rapidly worldwide and in Korea [8,9]. Modern broiler farming relies on high-density housing, in which control of indoor temperature, humidity, and air quality directly affects productivity and welfare [10,11]. Environmental control is energy-intensive, requiring heating in winter, cooling in summer, and year-round ventilation [12]. Accurate quantification of this energy demand is therefore important. In a previous study, the authors predicted the energy demand of mechanically ventilated broiler houses in Korea using building energy simulation [13].
High summer temperatures cause heat stress, which reduces feed intake and weight gain and increases mortality, especially during the late rearing period, when body weight is high [14,15,16]. Ventilation has two main functions: minimum ventilation, which removes carbon dioxide, ammonia, and moisture to maintain air quality and is required even in winter, and ventilation for temperature control [17]. In mechanically ventilated broiler houses, summer cooling relies primarily on increasing the ventilation rate to raise the indoor air velocity and thereby reduce the effective temperature, and evaporative cooling pads are engaged when air velocity alone can no longer maintain the target temperature [18,19,20].
The evaporative cooling pad, widely used in broiler houses, cools incoming air through water evaporation [18,19]. However, its efficiency depends on the difference between the dry bulb and wet bulb temperatures of the air, which reflects relative humidity [21,22]. Under Korea’s hot, humid summer and monsoon conditions, the wet bulb depression is small and cooling efficiency decreases sharply, making it difficult to maintain the target temperature [23,24]. Moreover, high-volume ventilation draws hot outdoor air into the house and, where active cooling is used, increases the cooling load [17]. Where active cooling is applied, temperature reduction should therefore be achieved through cooling while ventilation is reset to the level needed to maintain air quality. Improvements to such ventilation control algorithms have recently been investigated [25]. Winter heating, on the other hand, often relies on fossil fuels and is a major source of fuel costs and greenhouse gas emissions [26]. Renewable and sustainable heating methods have been investigated to reduce these costs and emissions [27].
Air source heat pumps (ASHP) can provide reliable cooling regardless of humidity and have been reported to lower indoor temperature and noxious gas concentrations while maintaining productivity [28]. The same heat pump technology can also be applied to heating, replacing fossil-fuel-based heating with electrification, and its applicability to broiler houses and other livestock facilities has been examined [29,30,31]. Despite these advantages, the ASHP has not been widely adopted in broiler houses, mainly owing to its high installation and maintenance costs and the substantial electricity demand associated with full electrification. The required electricity can be supplied by photovoltaic (PV) modules installed on the house roof [32]. Recent studies on broiler farms have shown that the self-consumption of on-site PV generation decreases as the PV capacity increases relative to the farm load, with its economic value depending on the energy accounting scheme [33], and that battery storage can increase the share of the ventilation-dominated farm demand covered by PV [34]. Coupling the electrification of cooling and heating with rooftop PV therefore offers a means of securing the rearing thermal environment while reducing carbon emissions. The benefit of this coupling, however, depends on whether the generated electricity is self-consumed for cooling or exported to the grid, with implications for grid stability. Accordingly, the assessment of solar-driven cooling and heating should consider not only the thermal environment, energy consumption, and carbon emissions but also self-consumption and grid-side implications.
To date, dynamic simulation of building energy and the thermal environment of broiler houses [12,35,36], ASHP-based cooling and heating in the livestock sector [28,29,30,31], and PV applications in the agricultural and building sectors [32,37,38,39] have been studied separately. Recent heat pump HVAC studies in broiler houses [40,41,42] have focused on indoor climate control and equipment sizing. Few studies have redesigned ventilation to work with active cooling and coupled this approach with rooftop PV under a hot, humid climate. Fewer still have used simulation built on a validated thermal environment model to evaluate these systems across regions and weather conditions and jointly quantify the thermal environment, energy consumption, and carbon emissions.
The objective of this study was to evaluate an approach for maintaining the rearing thermal environment while reducing carbon emissions by combining rooftop-PV-driven air source heat pump cooling with a minimum ventilation strategy. TRNSYS dynamic simulation was used to construct scenarios combining regional weather conditions in Korea, cooling method (evaporative cooling pad or air source heat pump), and the presence or absence of PV and to quantitatively compare the resulting indoor thermal environment, energy consumption, and carbon emissions. This study contributes by (i) quantifying the limitations of evaporative cooling in a humid climate and (ii) assessing cooling and heating electricity supply by rooftop PV and the resulting carbon reduction effect, including its self-consumption and grid-side implications.
2. Materials and Methods
The overall procedure of this study is summarized in Figure 1. First, the target broiler house, the representative region for each of the three climate zones, and extreme weather conditions (extreme hot summer and extreme cold winter) were defined. Based on these settings, a TRNSYS-based dynamic simulation model of the broiler house was constructed using a rearing thermal environment model previously validated against field measurements [13,43]. The cooling and heating, ventilation, and rooftop PV systems were then modeled within the simulation framework. Once established, the model was applied to scenarios combining region, weather condition, roof configuration (with or without PV), and cooling/heating method (the conventional combination of an evaporative cooling pad and a kerosene hot air heater or an air source heat pump). Hourly indoor temperature, energy consumption, and carbon emissions were then estimated for each scenario. The resulting outputs were then used to compute indicators of optimal temperature maintenance, energy use, and carbon emissions in an integrated assessment. As a supplementary analysis, the economics of PV coupling were also assessed. Overall, this procedure was used to evaluate the combined effects of the cooling and heating method, ventilation strategy, and rooftop PV coupling on the rearing thermal environment, energy use, and carbon emissions of the broiler house.
2.1. Target Broiler House and Study Regions
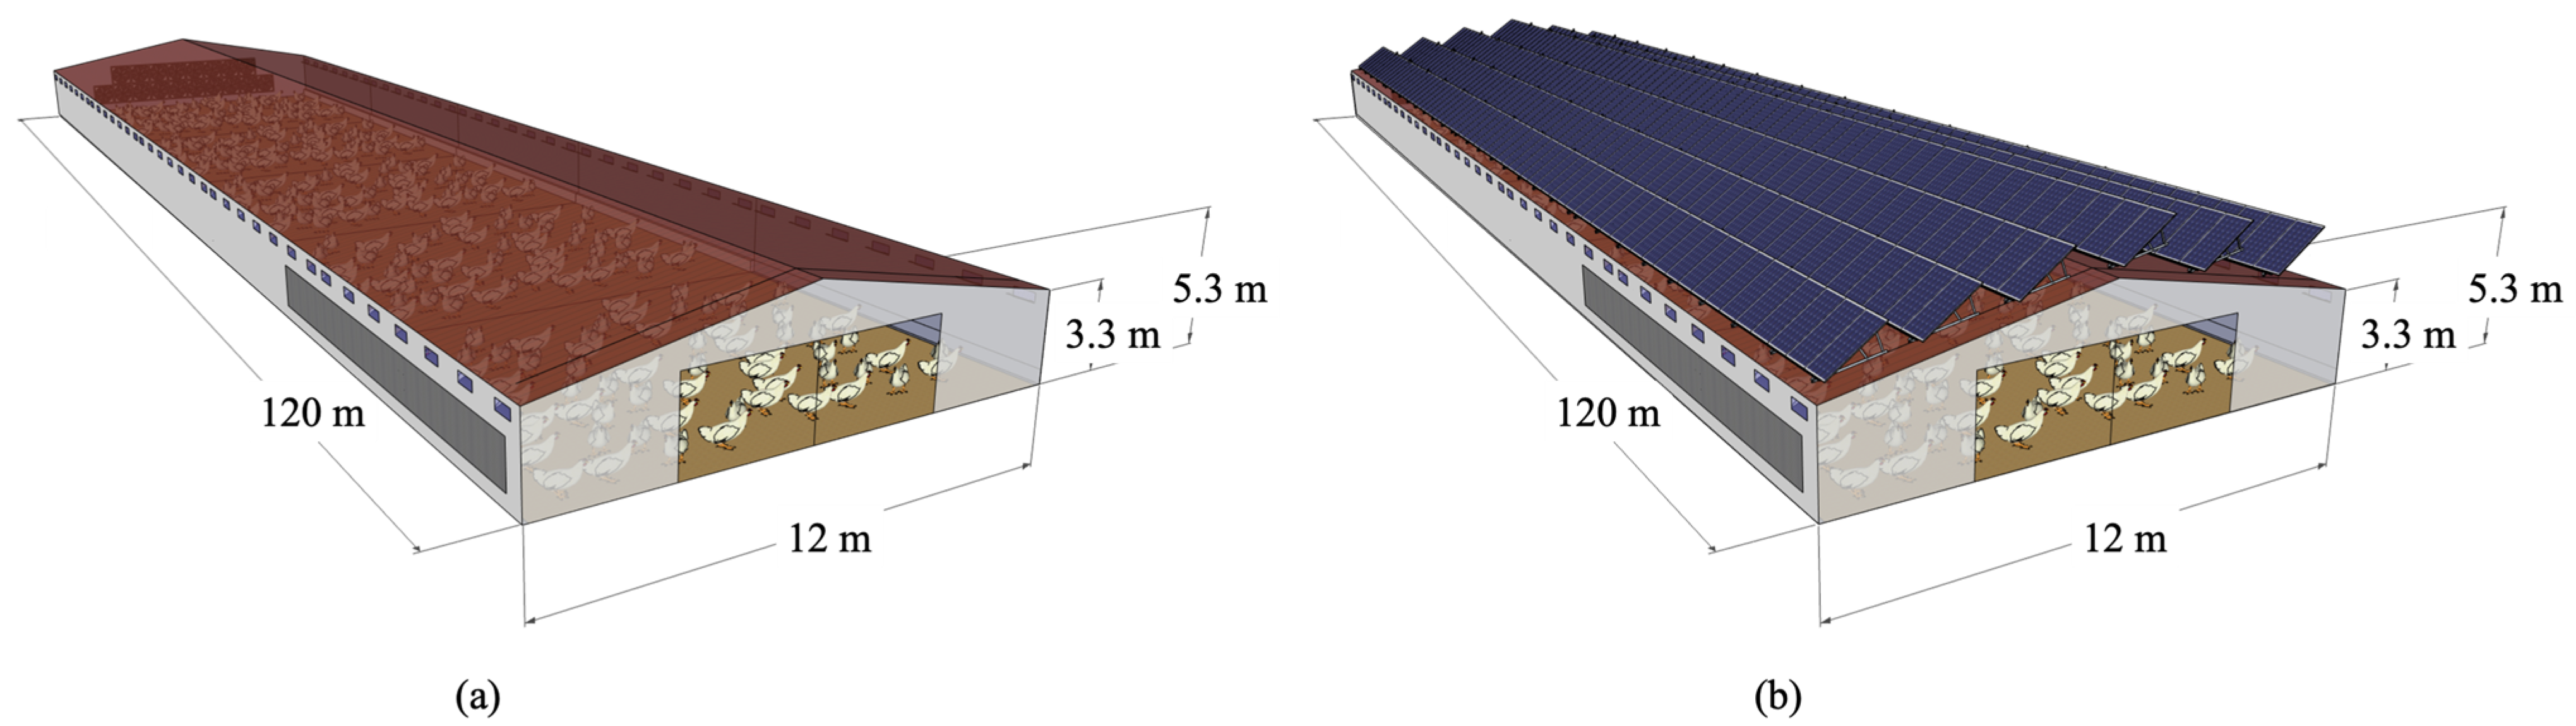
The target broiler house was a mechanically ventilated house conforming to the 2024 Livestock House Standard Design of the Ministry of Agriculture, Food and Rural Affairs. The house was 120 m long and 12 m wide [44] and equipped with tunnel exhaust fans, side-wall evaporative cooling pads, and a double-pitched roof with PV modules mounted on south-facing support frames over both roof slopes (approximately 756 m2 per face, 1512 m2 in total). The walls and roof consisted of sandwich panels satisfying the thermal transmittance requirements of the Building Energy-Saving Design Standard [45] (Table 1). A 3 m anteroom was excluded from the total house length of 120 m, resulting in an effective rearing area of 1404 m2 (117 m × 12 m). Based on the Korean stocking density regulation of 39 kg·m−2 and the target weight of 1.5 kg, the total number of birds was set at 36,504. This target weight reflects Korean commercial practice: over the last ten years (2016–2025), sizes 11–12 (carcass weight 1155.22 ± 4.15 g; live weight 1536.25 ± 6.83 g) were the most frequent carcass weight grades of broilers in Korea, accounting for 38.0% of all graded birds [46]. Figure 2 shows the geometry of the target broiler house under the two roof configurations considered in this study: (a) the baseline house without rooftop PV and (b) the house with rooftop PV mounted on south-facing support frames over the double-pitched roof.
Table 1.
Thermal transmittance requirements (W·m−2·K−1) by building element for the Central-1 zone under the Energy-Saving Design Standard for Buildings [45].
Figure 1.
Flowchart of the study for evaluating optimal temperature maintenance, energy consumption, carbon emission reduction, and economic feasibility [44].
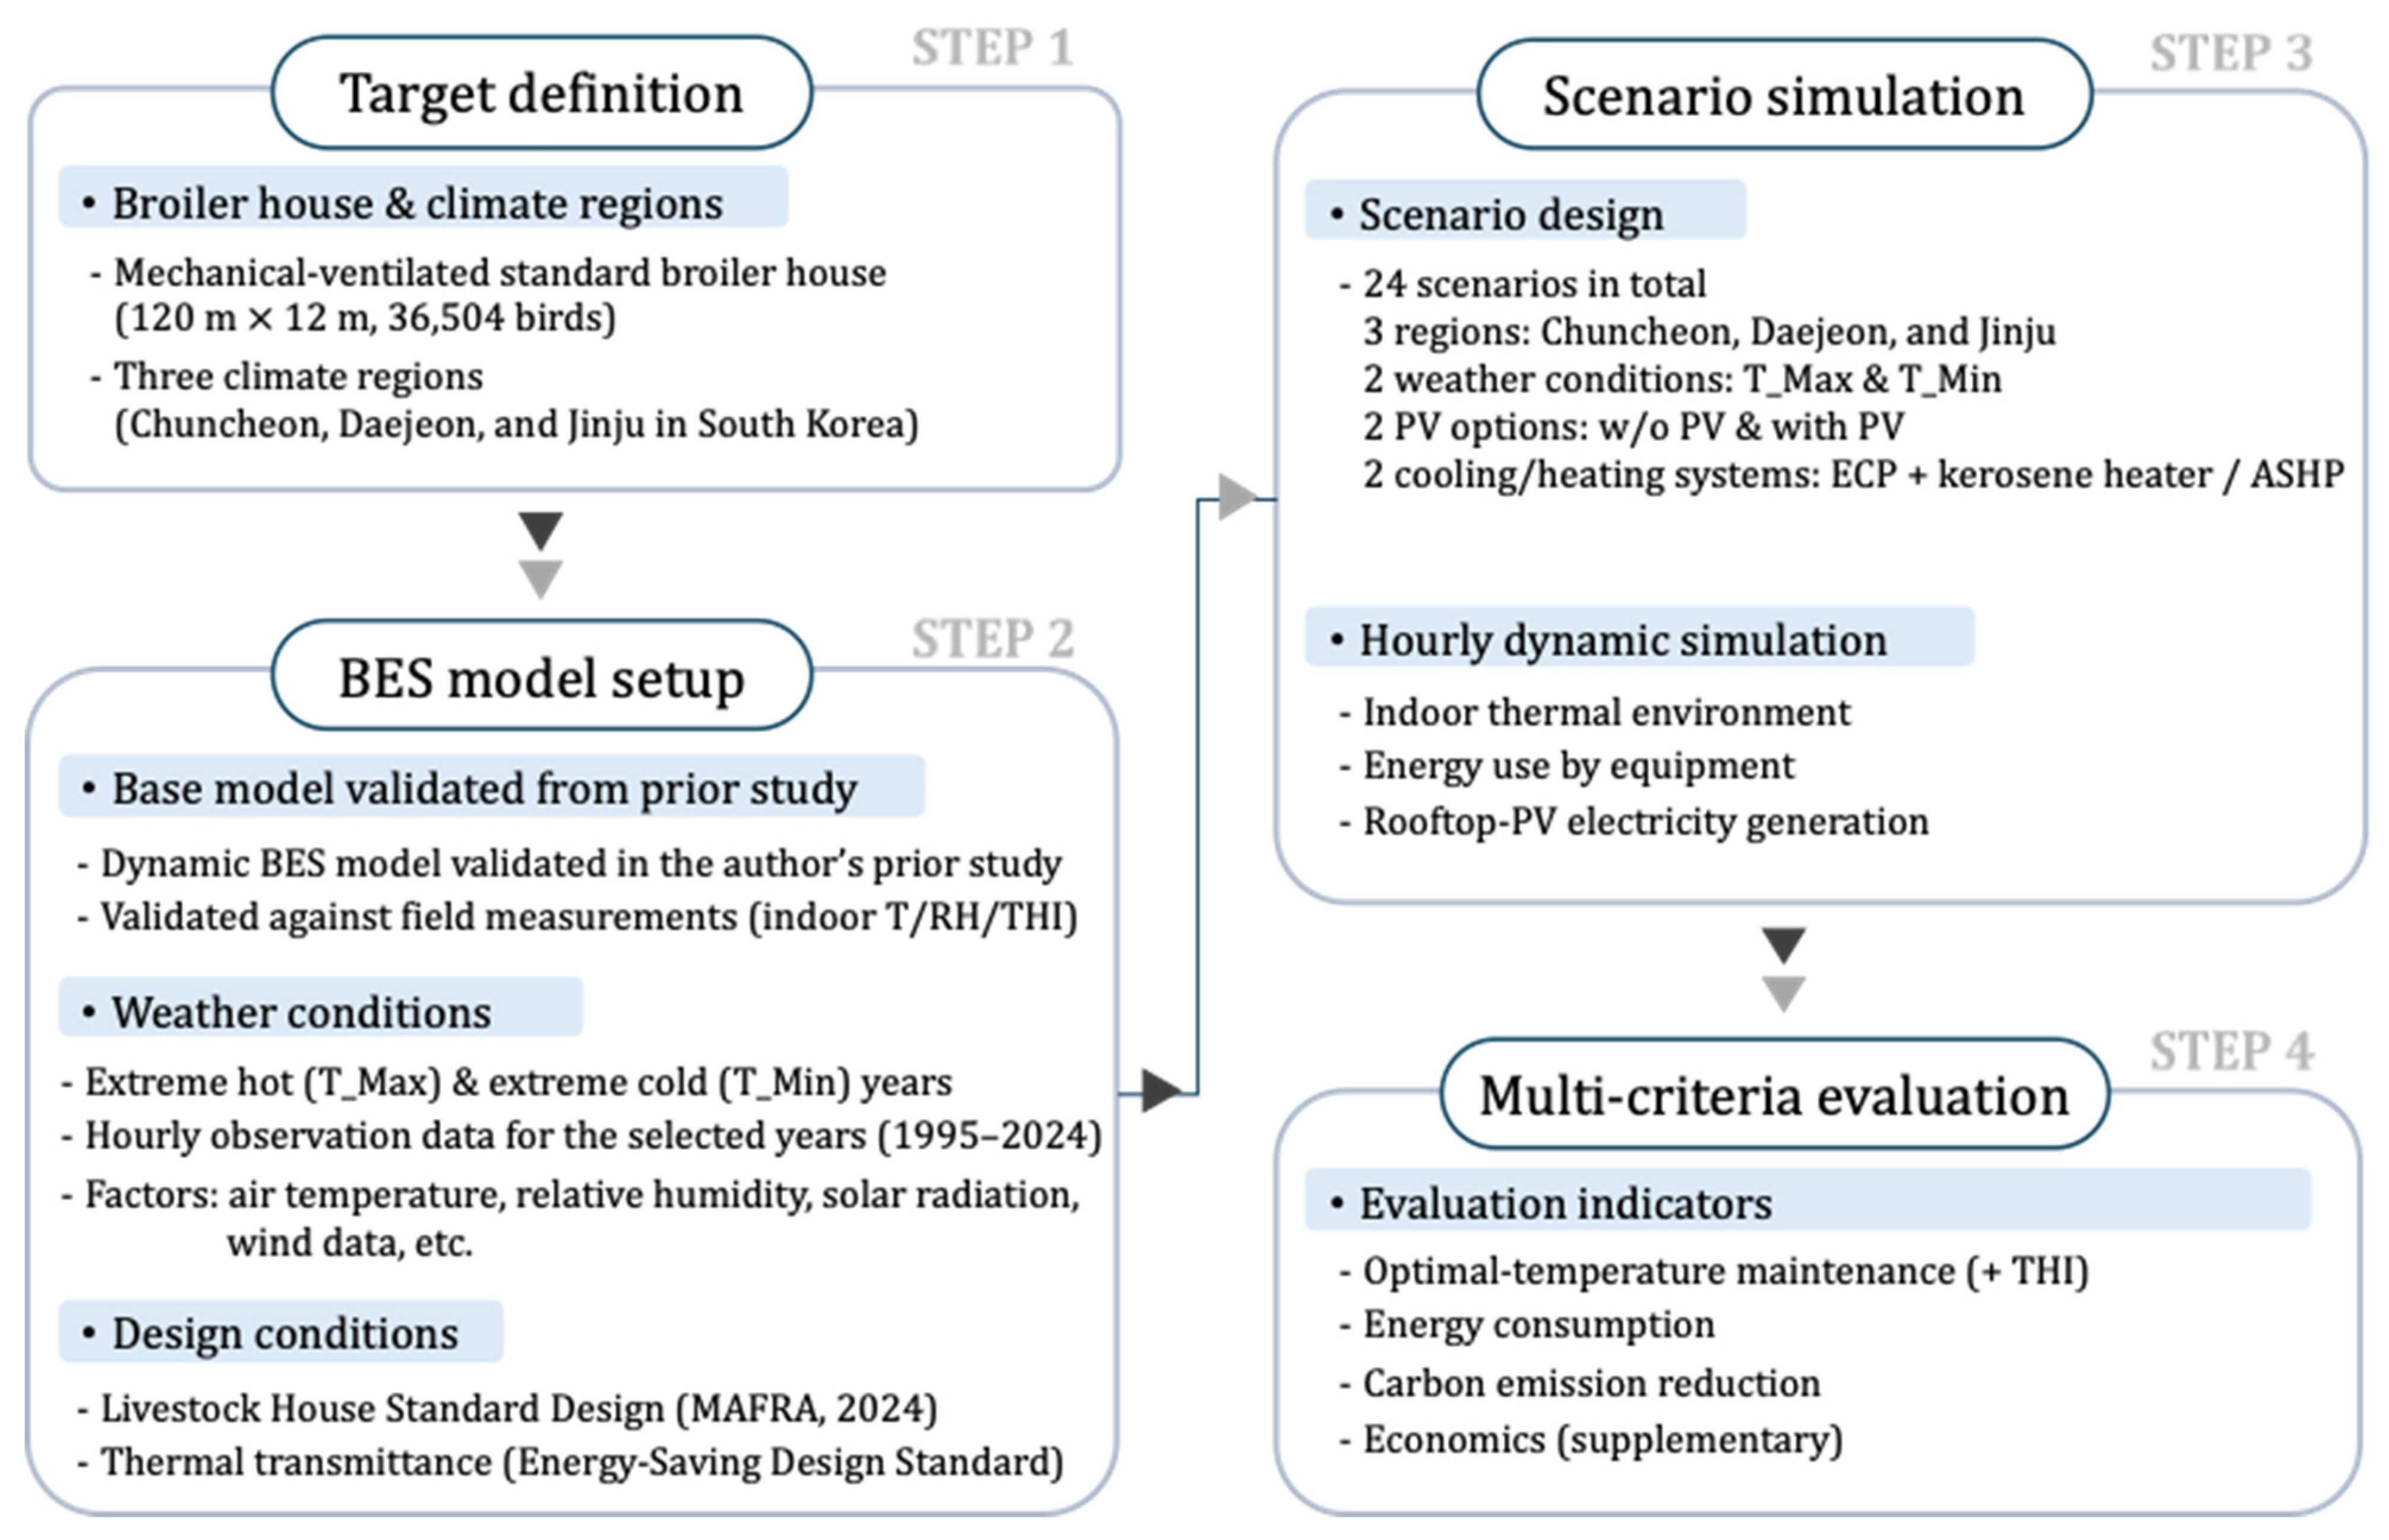
Figure 2.
Geometry of the target mechanically ventilated broiler house (120 m long and 12 m wide; eave height, 3.3 m; ridge height, 5.3 m): (a) baseline broiler house without rooftop PV; (b) broiler house with rooftop PV mounted on south-facing support frames over the double-pitched roof.
Three regions (Chuncheon, Daejeon, and Jinju) were selected to represent Korea’s Central-1, Central-2, and Southern climate zones, respectively. The Building Energy-Saving Design Standard specifies thermal transmittance criteria for each building element according to climate zone. However, to prevent differences in wall and roof insulation performance from interfering with inter-regional comparison, the same thermal transmittance values were applied to all regions. Specifically, the Central-1 zone values, which have the strictest insulation requirements, were applied identically to all regions as a conservative assumption (Table 1).
2.2. Weather Data
The indoor thermal environment, cooling and heating loads, and PV generation are directly influenced by the outdoor conditions and were therefore analyzed under extreme weather conditions. Hourly observations from 1995 to 2024 (30 years) were obtained for the three regions. For each region, the year with the highest daily maximum temperature was selected as the summer extreme hot (T_max) condition, while the year with the lowest daily minimum temperature was selected as the winter extreme cold (T_min) condition. The T_max year was 2018 for all regions, consistent witha previous study [43], whereas the T_min years were 2001 for Chuncheon, 2023 for Daejeon, and 1997 for Jinju. The principal climatic characteristics are summarized in Table 2. Under T_max, annual maximum temperatures reached 36.8–39.3 °C, while those under T_min remained as high as 35.4–35.5 °C, indicating a considerable cooling load. The lowest annual minimum temperature was −24.2 °C in Chuncheon, indicating the largest heating load at the higher latitude. The maximum daily accumulated solar radiation (MDSR) was higher under T_max, suggesting greater PV potential in the summer extreme year. Because each condition was selected by a single-day extreme, the paired years differed mainly in their daily extremes (annual maximum by 1.3–3.9 °C and annual minimum by 1.7–3.0 °C), whereas their annual mean temperatures differed by no more than 0.5 °C.
Table 2.
Principal climatic characteristics by region and weather condition.
2.3. Building Energy Simulation (BES) Model
2.3.1. TRNSYS Model for BES
The dynamic thermal environment analysis was performed using TRNSYS 18 (version 18.06; Solar Energy Laboratory, University of Wisconsin–Madison, Madison, WI, USA), a commercial simulation tool. TRNSYS treats each component as an independent module and connects the data flows among modules, allowing for flexible implementation of complex control logic and nonlinear behavior. It is therefore well-suited to analyzing facilities such as livestock houses, where heat sources and ventilation change transiently [43]. The model comprised four components: (i) weather and solar processing (Types 9, 16, 33, 69); (ii) environmental control, including ventilation by exhaust fans, cooling by an evaporative cooling pad (Type 506), and heating by a heater, with indoor temperature regulated using a proportional–integral–derivative (PID) controller (Type 23); (iii) real-time sensible and latent heat production by the broilers as functions of age and indoor temperature; and (iv) a multizone building model (Type 56) integrating wall conduction, solar gains, ventilation, and internal gains to compute hourly indoor temperature and humidity. A PV module was additionally coupled to the model for rooftop PV generation (Section 2.5).
The air temperature of each thermal zone was computed using an energy balance equation in which the sum of the heat gains from wall conduction, infiltration, ventilation, and internal heat generation equals the change in the zone’s thermal capacitance (Equation (1)). The heat exchange between the surfaces and the air was simplified using the star-network approach, which combines radiation and convection into a single node [47].
where Cz is the thermal capacitance of the zone, Tz is the air temperature of zone, and Qsurf, Qinf, Qvent, and Qgain are the heat gains/losses (kJ·h−1) from wall conduction, infiltration, ventilation, and internal heat generation, respectively.
2.3.2. Sensible and Latent Heat Production by Broilers
Broiler heat production depends on body weight and indoor air temperature. Body weight was computed as a function of rearing age using an empirical relationship for broiler body weight by age (Equation (2)) [48]. Total heat production was computed by applying a linear temperature correction referenced to an indoor temperature of 20 °C to the body weight power law relationship specified in the CIGR guidelines and was then separated into sensible and latent heat production (Equations (3)–(5)) [49]. Heat production was updated at each computational time step using the indoor temperature at that instant.
where m1 is the broiler body weight (g), m2 is the body weight converted to kilograms (m2 = m1/1000, kg), d is the broiler age (day), T is the indoor air temperature (°C), and ϕtotal, ϕsensible, and ϕlatent are the total, sensible, and latent heat production per broiler (W·head−1), respectively.
2.3.3. Model Validation
The predictive validity of the BES model used in this study had previously been confirmed through comparison with measured indoor air temperature, relative humidity, and temperature–humidity index (THI) over four rearing cycles at a commercial broiler house [13,43]. This study therefore retained the same model structure and heat production, ventilation, and cooling equations without performing separate re-validation while newly configuring only the model components associated with the addition of the cooling and heating method, the ventilation strategy, and the rooftop PV. The previous validation therefore supports the building thermal environment model, namely the heat and moisture balances of the house, broiler heat production, and ventilation. In contrast, the ASHP capacity and dehumidification and the PV generation were newly introduced in this study. These components were configured from the equipment specifications and standard TRNSYS components described in Section 2.4 and Section 2.5 and were not separately validated against measurements of the integrated system.
2.4. Modeling of the Environmental Control System
2.4.1. Minimum Ventilation Algorithm and Fan Power Model
Conventionally, the summer ventilation rate criterion is increased substantially with rising outdoor temperature to lower the effective temperature. In the present study, however, which is premised on active cooling, temperature reduction is achieved through cooling, while ventilation is reset to the minimum level required to secure air quality. The minimum ventilation rate was based on the ventilation requirement for maintaining the indoor carbon dioxide concentration at an appropriate level. Carbon dioxide production increases with rearing age; therefore, the age-specific carbon dioxide production of broilers and the corresponding ventilation requirement for its removal, as specified in the National Institute of Animal Science’s Guidelines for Ventilation Management of Broiler Houses in Spring, were applied (Table 3) [50]. The same guideline also provides ventilation requirements for moisture removal; however, these are tabulated as a function of both outdoor temperature and rearing age only for outdoor temperatures between −20 and 20 °C, so applying them to summer conditions would require extrapolation. The CO2-based requirement, which is specified by rearing age independently of the outdoor temperature, was therefore adopted as the minimum ventilation rate applicable throughout the year. Because the ventilation requirements for moisture and ammonia control were not explicitly considered, this rate represents the lower bound of the ventilation requirement.
Table 3.
Carbon dioxide production and minimum ventilation requirement of broilers by age [50].
To represent a continuous minimum ventilation rate as a function of rearing age, the per-bird minimum ventilation rate was regressed using a cubic polynomial of rearing age (Equation (6); R2 = 0.9999986). This regression was then multiplied by the number of birds in the house to obtain the whole-house hourly minimum ventilation rate.
where qhead is the per-bird minimum ventilation rate (m3·h−1·head−1) and d is the rearing age (day).
The total ventilation rate produced by the 16 tunnel exhaust fans installed in the house varies with the number of operating fans. In this study, an empirical relationship between the total ventilation rate and the number of operating fans (N) was derived from the ventilation rates measured with 1, 2, 4, 8, and 16 fans operating (25,275.4, 50,386.8, 98,551.3, 178,092.9, and 277,921.6 m3·h−1, respectively) (Equation (7), R2 = 1). Taking the rated power consumption of one fan as 0.735 kW, fan power consumption was computed as N×0.735 kW, with the number of operating fans capped at 16. The number of operating fans was maintained at the minimum ventilation requirement specified in Section 2.4.1 as a lower bound, while any additional ventilation required to maintain the indoor temperature was determined by the PID controller (Section 2.4.2).
where Q is the total house ventilation rate produced by the operating fans (m3·h−1) and N is the number of operating fans (maximum 16).
2.4.2. Temperature Control and the Cooling/Heating System
The indoor temperature was controlled using the PID module (Type 23) with the age-specific optimal temperature as the setpoint. To prevent cooling–heating short-cycling, a deadband of ±0.5 °C was placed around the setpoint with cooling activated above and heating below the deadband. The PID controller generates a control signal based on the deviation between the indoor temperature and the setpoint, and this signal adjusts the operating level of the cooling or heating system (i.e., the number of fans, heat pumps, or heaters). Throughout the simulation, ventilation was maintained at the minimum ventilation rate specified in Section 2.4.1 as a lower bound.
Two environmental control scenarios were compared. Each scenario represents an integrated environmental control strategy, which combines a cooling/heating method with its corresponding ventilation strategy rather than a cooling device alone. The ECP scenario used temperature-driven high-volume ventilation, whereas the ASHP scenario maintained ventilation at the minimum rate (Section 2.4.1). The baseline scenario was the conventional scenario, using an evaporative cooling pad (ECP) for cooling and a kerosene hot air heater for heating. In this scenario, the number of operating tunnel exhaust fans was adjusted according to the PID controller signal, and the cooling pad was operated to lower the indoor temperature. Evaporative cooling performance depends on the difference between the dry bulb and wet bulb temperatures of the supply air, i.e., on relative humidity. The power consumption of the pad auxiliaries, including the circulation pump, was assumed to be 4.0 kW. In the alternative ASHP scenario, a heat pump that performs both cooling and heating with a single unit was applied. This heat pump was assumed to have a cooling capacity of about 23,000 kcal·h−1 and a heating capacity of about 30,000 kcal·h−1, with identical power consumption of 11 kW per unit in both cooling and heating modes. In cooling mode, it cools reliably regardless of humidity. Assuming a sensible heat ratio of 0.75, a sensible heat of 72,174 kJ·h−1 per unit was reflected in the indoor heat balance. The remaining latent portion (about 24,058 kJ·h−1) was converted using the latent heat of water vaporization (about 2466 kJ·kg−1) to a moisture removal rate of 9.75 kg·h−1 per unit and reflected in the indoor humidity balance. The number of operating units was adjusted by the PID controller.
For heating, the ECP scenario assumed a poultry kerosene hot air heater with a heat output of about 100,000 kcal·h−1, supplying this heat output per unit to the indoor heat balance. Kerosene consumption was about 13 L·h−1 per unit, and the power consumption of the blower and burner motor was reflected as about 0.39 kW per unit, accounting for motor efficiency. In contrast, in the ASHP scenario, the combined cooling/heating heat pump described above switches to heating mode and provides the required heating; therefore, no separate heating equipment is provided. In heating mode, it also consumes 11 kW per unit, as in cooling mode.
2.5. Rooftop Photovoltaic (PV) Modeling
The rooftop PV system covered both faces of the double-pitched roof. Allowing for maintenance and working space, the installation area was set at 600 m2 per face (1200 m2 in total) out of approximately 756 m2 available per face.
PV generation was simulated using the TRNSYS PV module (Type 190), which includes maximum power point tracking (MPPT) and an inverter. Rather than using a specific manufacturer’s parameters, the module was parameterized using datasheet values for a commercial 400 W, 72-cell monocrystalline module (approximately 2 m2 per panel): an open-circuit voltage of 49.5 V, a short-circuit current of 10.5 A, and maximum power point voltage and current of 41.5 V and 9.65 A, respectively, consistent with modules in the California Energy Commission (CEC) Solar Equipment List [51]. Each roof face carried 15 × 20 = 300 panels (approximately 120 kWp over 600 m2), giving a total of approximately 240 kWp for both faces combined.
The array tilt was 30°, with both arrays mounted on south-facing support frames (Figure 2b), and the module temperature was corrected to the nominal operating cell temperature (NOCT) condition. A CEC grid support inverter model comprising two 60 kW-class units in parallel (120 kW AC per roof face, 240 kW AC in total), with a weighted efficiency of approximately 98.5% and an MPPT voltage window of approximately 550–850 V, was used to convert DC to AC, accounting for MPPT and inverter efficiency [51,52].
Hourly PV generation, based on tilted surface radiation and module/inverter characteristics, was matched hour by hour with house electricity consumption to separate self-consumption from surplus generation (Section 3.3).
2.6. Experimental Design
This study aimed specifically to evaluate whether rooftop PV generation could enable the replacement of the existing environmental control equipment—the evaporative cooling pad and kerosene hot air heater. Accordingly, the experimental design incorporated only the factors needed to examine this substitution potential.
Four factors were combined: (i) region, (ii) weather condition, (iii) rooftop PV, and (iv) cooling/heating method. The region factor comprised Chuncheon, Daejeon, and Jinju, representing the domestic climate zones along the northern to southern latitudinal gradient, allowing the effects of regional differences in PV generation on substitution potential to be examined. All three regions have Automated Synoptic Observing Systems (ASOS) stations operated by the Korea Meteorological Administration for more than 30 years, making them suitable for extracting extreme weather (extreme hot and extreme cold) data from long-term historical observations. The weather condition factor (T_Max and T_Min), derived from the 30-year analysis, was used to assess robustness under the extreme conditions associated with the greatest cooling and heating loads. The summer extreme hot condition tested whether PV generation could meet peak cooling electricity demand, while the winter extreme cold condition tested the robustness of fully electrified (ASHP) heating under the peak heating load. The rooftop PV factor (without vs. with PV) isolated and quantified the effect of PV coupling relative to the no-PV baseline, including electricity generation, self-consumption, and the resulting energy consumption and carbon emission reductions. The cooling/heating method factor (ECP vs. ASHP), the core comparison of this study, contrasted the two integrated environmental control strategies, each comprising a cooling/heating method and its ventilation strategy (Section 2.4.2), in terms of thermal environment, energy, and carbon performance.
These four factors yielded 24 scenarios (3 regions × 2 weather conditions × 2 rooftop PV options × 2 cooling/heating methods). For each scenario, the hourly indoor thermal environment, equipment energy consumption, and PV electricity generation were analyzed over the year.
Rearing was assumed to begin on 1 January. Each flock was reared for 30 days, from placement at 1 day of age to shipment at 31 days of age, followed by a 14-day downtime for cleaning and disinfection, giving eight flocks and 5760 occupied hours per year. Because the house was assumed to be empty during downtime, energy consumption was accounted for only during the occupied periods, and all PV generation during downtime was exported to the grid. To examine the sensitivity of the results to market weight, the Daejeon T_Max scenario was additionally simulated for a heavier market weight of approximately 2.5 kg (Supplementary Text S2). Each flock was reared to 42 days of age (Equation (2)), with the same 14-day downtime, giving six flocks and 5904 occupied hours per year, and the number of birds was reduced to 21,902 to maintain the same stocking density.
2.7. Evaluation Indicators
2.7.1. Indicators of Optimal-Temperature Maintenance
The primary evaluation indicator of this study was the ability of the cooling/heating method to maintain the age-specific optimal rearing temperature. Broiler management guidelines recommend a high rearing temperature for day-old chicks (approximately 33–36 °C), which is progressively lowered as the birds grow, reaching approximately 20 °C at market body weight (1.5 kg) [53,54]. Accordingly, the indoor setpoint was assigned as a function of rearing age, decreasing from 34 °C at placement by 1 °C every 2 days to 21 °C at 28 days of age, and was then maintained at 21 °C until shipment.
The setpoint maintenance performance was quantified over the entire occupied rearing period as the number of hours during which the indoor temperature exceeded the setpoint by 2 °C or more. These hours were computed across all regions and weather conditions to compare the ECP and ASHP methods. Because no single threshold is universally established, a sensitivity analysis was also performed with thresholds of 1, 2, 3, and 4 °C.
Whereas the setpoint exceedance hours are a thermal environment indicator based on the setpoint (dry bulb temperature), the THI, which reflects both temperature and humidity, was calculated as a supplementary indicator. Evaporative cooling adds moisture to the supply air; therefore, dry bulb temperature alone does not reveal the heat stress caused by high humidity, whereas THI captures it. THI was calculated from the indoor dry bulb temperature T (°C) and relative humidity RH (%) (Equation (8)) [43].
The heat stress threshold for broilers was set at THI ≥ 78 [55]. However, chicks require high temperatures early (32–35 °C), such that a high THI during this stage reflects the normal environment rather than heat stress. Therefore, THI threshold exceedance was tallied only over the occupied hours of the late rearing period, from approximately 21 days of age, corresponding to the pre-shipment interval when body weight is high and birds are most vulnerable. During this period, THI ≥ 78 was considered a valid heat stress indicator.
2.7.2. Energy Consumption
The energy consumed by the equipment was accumulated on an hourly basis. Electricity consumption comprised the ventilation fans, cooling equipment (cooling pad auxiliaries or the ASHP), and heating equipment (the blower motor of the kerosene hot air heater or the ASHP). Fossil fuel consumption was computed from the kerosene used by the hot air heater.
2.7.3. Carbon Emission Reduction Analysis
Carbon emissions were estimated using official domestic emission factors. For electricity, the national indirect electricity emission factor of 0.4594 kgCO2eq·kWh−1 was used [56]. For kerosene, an emission factor of approximately 2.49 kgCO2·L−1 was derived from the national net calorific value (indoor kerosene, 34.1 MJ·L−1) and carbon emission factor (19.926 tC·TJ−1) reported by the Greenhouse Gas Inventory and Research Center (GIR) in the 2024 National Inventory Document [57]. ECP heating relies on kerosene, resulting in fossil fuel emissions that PV cannot replace and are therefore locked in on-site, whereas ASHP electrifies both cooling and heating, making the whole amount reducible by PV. For each cooling/heating method (ECP vs. ASHP), with and without PV, gross (baseline) emissions, reduction from PV self-consumption, additional reductions from surplus export, and residual on-site emissions were computed.
The accounting boundary covered operational emissions only, namely on-site kerosene combustion and grid electricity use. Exported PV electricity was credited as avoided grid electricity at the same emission factor, and embodied emissions associated with the manufacture, installation, and disposal of the PV modules, ASHP units, and other equipment were excluded. A negative net value therefore indicates that the export credit exceeded the operational emissions under this accounting approach; it does not represent physical removal of CO2 from the atmosphere.
2.7.4. Economic Assessment of PV Coupling (Supplementary)
The economics of PV coupling were assessed as a supplementary analysis; the methods, price assumptions, operating modes, and full results are provided in the Supplementary Materials (Text S1 and Table S1).
3. Results
3.1. Maintenance of the Optimal Rearing Temperature
Over the entire occupied rearing period (5760 h·year−1), the hours during which the indoor temperature exceeded the setpoint by 2 °C or more, accounting for the control deadband, were tallied as failures to maintain the optimal temperature. For ECP, this reached an annual average of 387 h·year−1 (worst case 562 h·year−1), whereas ASHP recorded 0 h·year−1 under all conditions (Table 4). ECP performed worst under the T_Max condition in Daejeon (562 h·year−1). The ASHP exceeded the setpoint by 1 °C for no more than 4 h·year−1 and remained below 2 °C under all conditions (maximum hourly exceedance 1.16 °C), maintaining the optimal temperature stably. In the sensitivity analysis, the ECP exceedance decreased from 595 h·year−1 at 1 °C to 198 h·year−1 at 4 °C, whereas ASHP recorded an average of 1.3 h·year−1 at 1 °C and 0 h·year−1 at the higher thresholds; thus, the ECP–ASHP contrast did not depend on the threshold chosen. Rooftop PV slightly lowered the exceedance hours through roof shading (ECP, 387 → 383 h·year−1), but the effect was minor and did not govern the ECP–ASHP comparison (Table 4, note).
Table 4.
Hours exceeding the optimal rearing temperature by at least 1, 2, 3, and 4 °C by region, weather, and roof configuration (Base/PV) (h·year−1).
As a supplementary indicator, THI threshold exceedance (THI ≥ 78) was tallied only during the late rearing period vulnerable to heat stress, beginning at approximately 21 days of age (Table 5). Even in the late rearing period, ECP recorded THI ≥ 78 for 112–275 h·year−1 (average, approximately 184 h·year−1) depending on region and weather condition, whereas ASHP had 0 h under all conditions. During the late rearing period, the ASHP maintained the indoor dry bulb temperature below approximately 25.7 °C even under the extreme hot condition (outdoor temperature up to 37.2 °C during the late rearing period), while the indoor relative humidity remained high (largely 75–94%), giving a maximum THI of approximately 76.7. Hours with RH ≥ 95% occurred only at indoor temperatures of 24.5 °C or lower, whereas the peak indoor temperature (≈ 25.7 °C) occurred at RH of 71–76%.
Table 5.
Hours exceeding the THI index (THI ≥ 78) in the late rearing period.
3.2. Full Electrification of Cooling and Heating and Electricity Demand
With a single ASHP providing both cooling and heating, the house is fully electrified. The annual ASHP electricity demand reached 192–204 MWh, substantially exceeding the cooling- and heating-related electricity consumption of ECP (14.4–18.0 MWh) (Table 6). Under ECP, cooling electricity was relatively small, but heating required approximately 8800–14,000 L of kerosene annually, whereas ASHP required no kerosene. The ASHP electricity demand peaked at 204 MWh in the Daejeon (T_Max) scenario, where the cooling load was highest.
Table 6.
Annual electricity demand and kerosene consumption by cooling/heating method.
The number of simultaneously operating ASHP units differed markedly between the two seasons. Up to 19 out of 20 installed units operated at the peak summer cooling load, which determined the installed fleet size, whereas no more than 5 units were required for heating even under the coldest winter conditions, leaving substantial spare capacity. In the Chuncheon extreme cold (T_Min) scenario, the winter maximum of five units occurred on the morning of 15 January when the outdoor temperature fell to −24.1 °C (15 days of age), close to the annual minimum of −24.2 °C.
Ventilation fan electricity consumption also differed greatly between the ECP and ASHP scenarios. ASHP handled the cooling load directly through the heat pump and suppressed ventilation to the minimum level required for carbon dioxide removal. Consequently, summer (June–August) ventilation fan electricity consumption, when cooling demand was concentrated, was only approximately 0.7 MWh compared with 7.7–10.6 MWh for ECP, which relied on high-volume ventilation for cooling. The annual energy demand differed only slightly between the T_Max and T_Min conditions (kerosene, 0.0% to +9.5%; ASHP electricity, −3.1% to +0.3%) because the paired years differed mainly in their daily extremes, whereas their annual mean temperatures differed by no more than 0.5 °C (Section 2.2).
3.3. Securing ASHP Operating Electricity from PV
Annual rooftop PV generation from the 240 kWp system ranged from 323 to 382 MWh depending on region and weather condition, exceeding the annual ASHP electricity demand of 192–204 MWh. Thus, on an annual energy balance basis, the house was self-sufficient in electricity and produced a surplus.
Considering the temporal coincidence of generation and consumption, PV generation during daytime hours was approximately 3.0–3.4 times (average 3.2 times) the concurrent ASHP electricity demand. However, approximately 40–43% of the annual electricity demand occurred at night and was imported from the grid owing to continued cooling after sunset and brooding heating during winter. Annual self-sufficiency, defined as the ratio of self-consumption to annual electricity demand and accounting for the temporal mismatch between generation and consumption, was approximately 37–38%. The large surplus during PV generation hours, together with all generation during the downtime between flocks, was assumed to be exported to the grid.
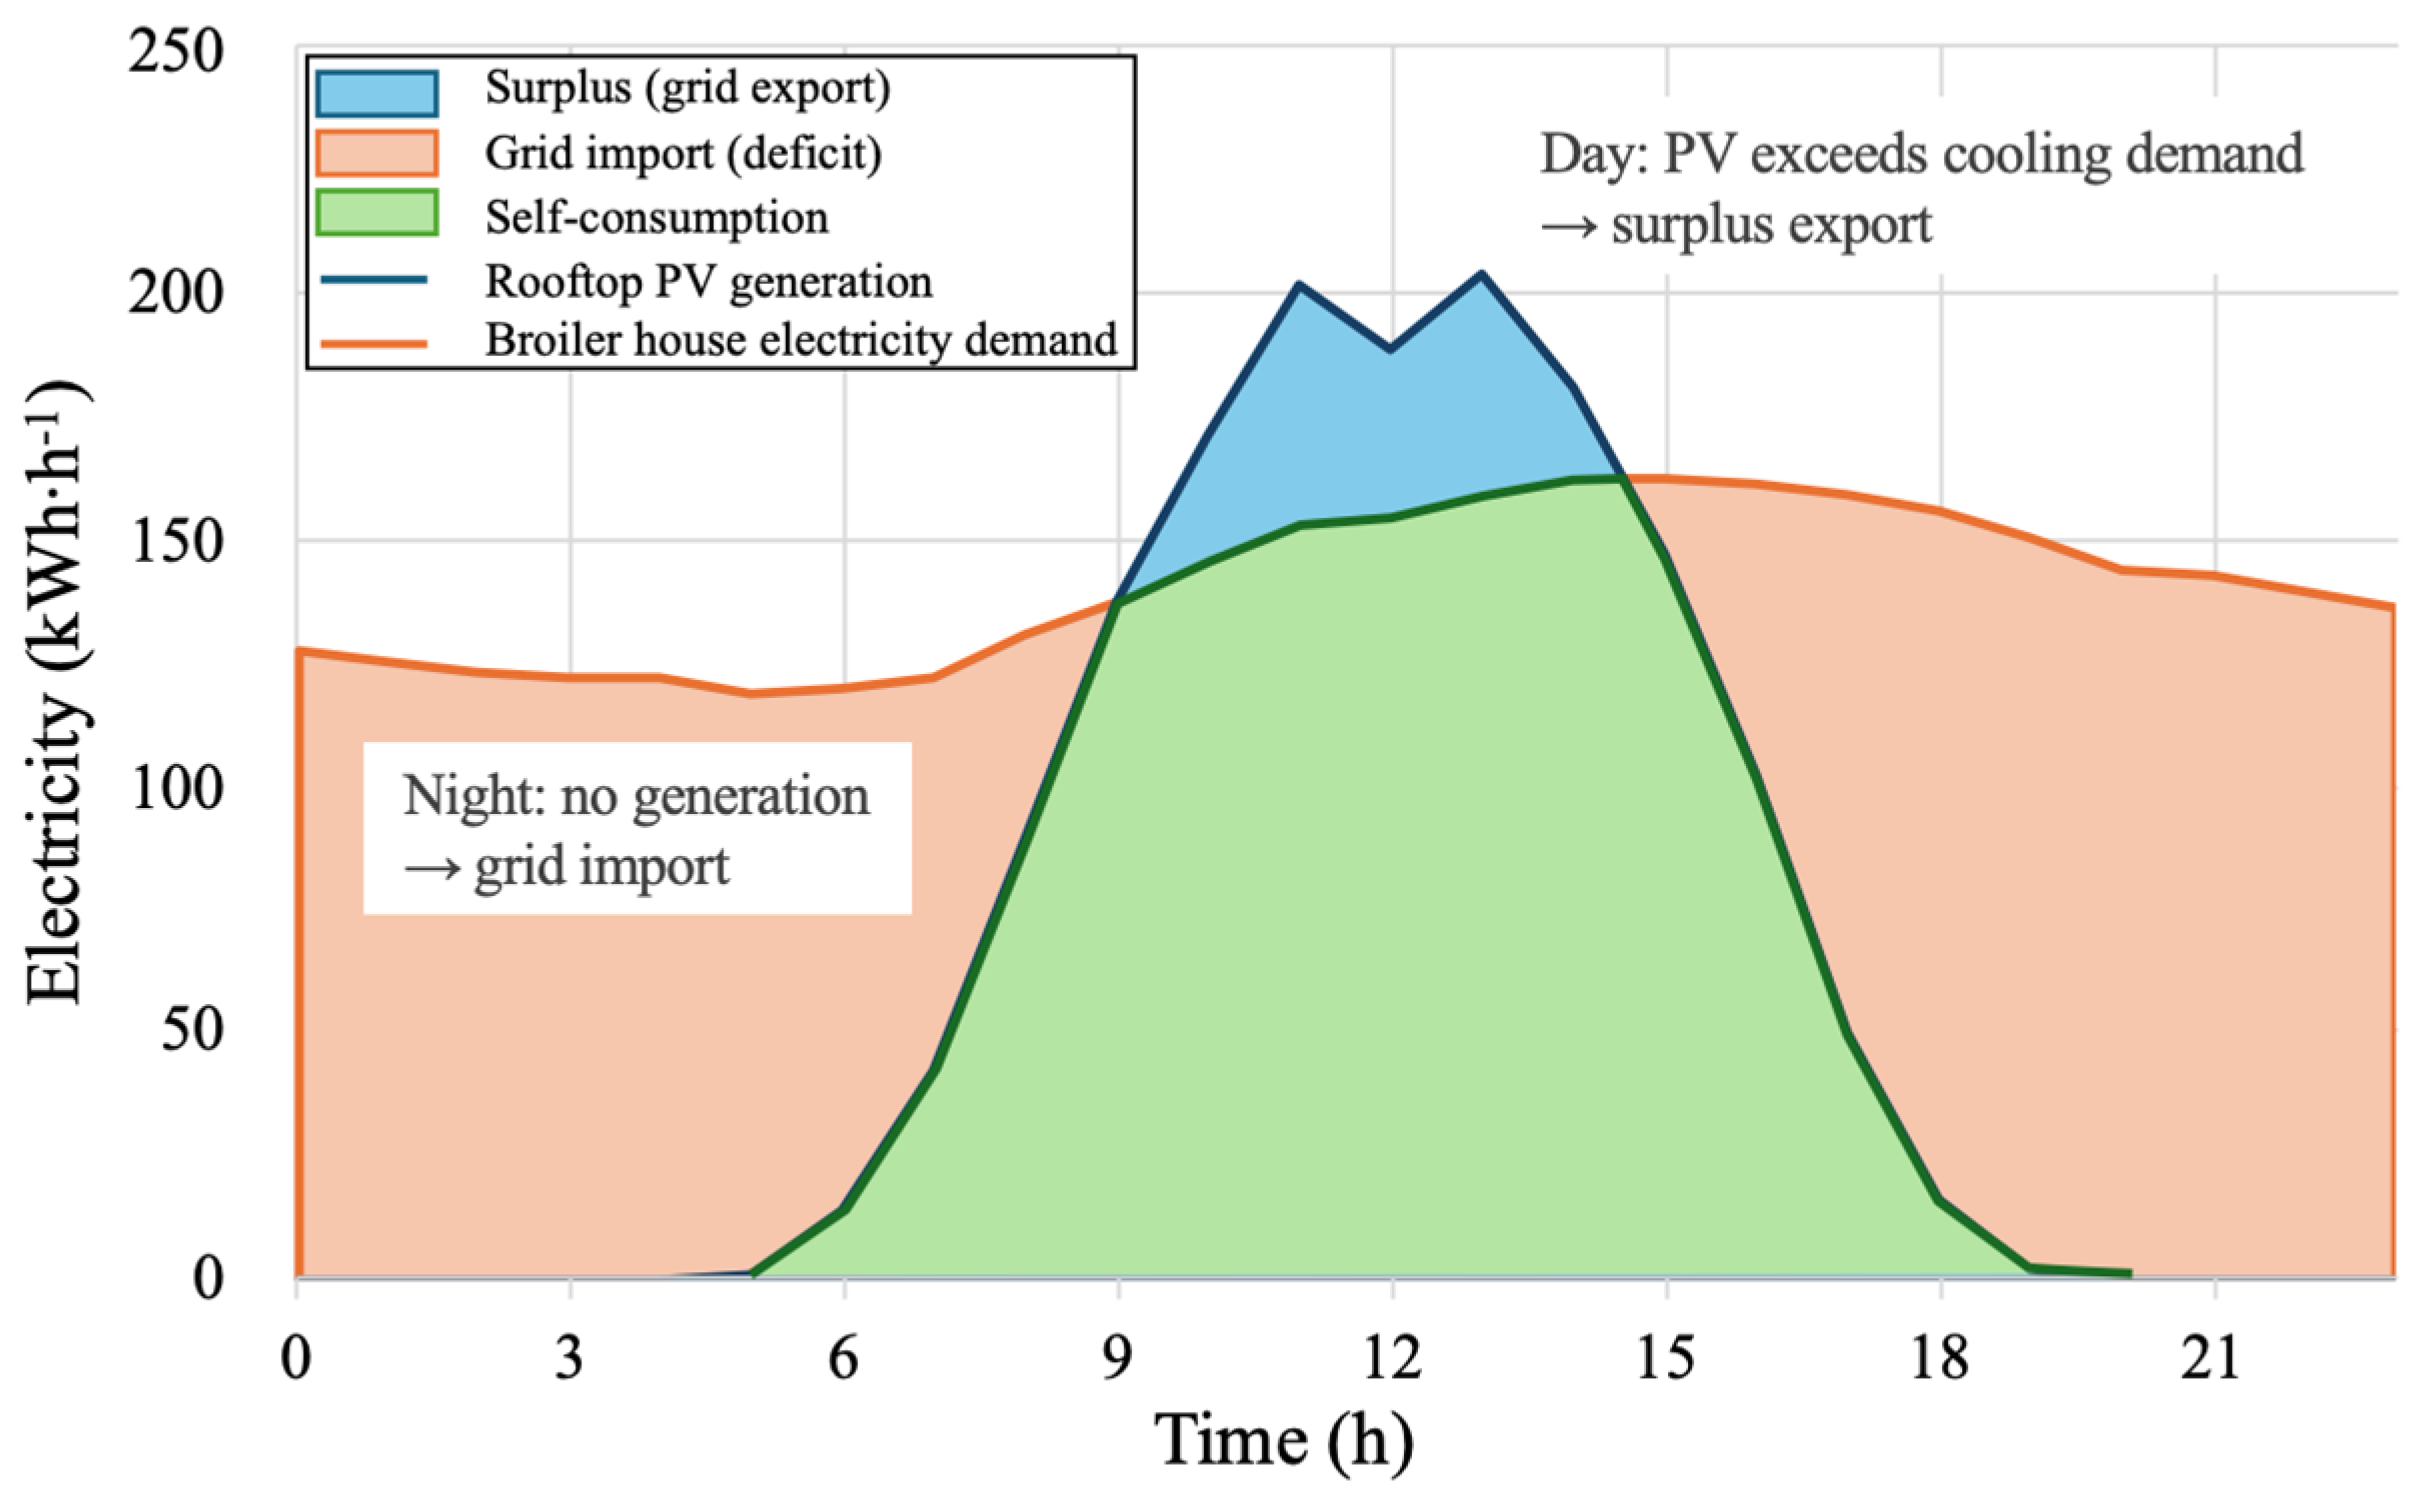
This day-scale behavior is illustrated in Figure 3 for a representative clear, extreme hot summer day (Daejeon, 21 July, 26 days of age; maximum outdoor temperature approximately 36 °C). Because cooling continued throughout the night, the night-time house electricity demand (approximately 120–145 kWh·h−1) was entirely imported from the grid. PV output exceeded the demand only from approximately 09:30 to 15:00 when the surplus was exported and peaked at approximately 204 kWh·h−1 AC around midday, compared with a concurrent demand of approximately 150–160 kWh·h−1. Over the day, self-consumed PV electricity (1374 kWh) covered approximately 41% of the demand (3375 kWh), and approximately 89% of the PV generation (1546 kWh) was self-consumed. After sunset, the house again relied on the grid.
3.4. Carbon Emission Reduction from the PV–ASHP Combination
Using the conventional ECP scenario without PV as the baseline, annual carbon emissions were compared across three mitigation conditions (Table 7). Condition 1 replaced ECP with ASHP without PV; Condition 2 added rooftop PV while retaining the existing ECP; and Condition 3 combined the ASHP system with rooftop PV. The baseline (ECP) emissions ranged from 29.0 to 41.4 tCO2 depending on region and weather condition, with a substantial part arising from kerosene combustion.
Table 7.
Annual net operational emissions by mitigation condition (tCO2·year−1). Conditions 2 and 3 are shown as net (gross emissions/self-consumption reduction/export reduction), defined in the note.
Condition 1 (ASHP alone) increased emissions to 88.0–93.6 tCO2, an average increase of +172%. Although full electrification removed kerosene consumption, it increased electricity demand to 192–204 MWh with carbon-intensive grid electricity (0.4594 kgCO2·kWh−1). Both PV-coupled conditions yield net-negative operational emissions under the export credit approach (Table 7): Condition 2 (ECP+PV) −106.3 to −143.5 tCO2 and Condition 3 (ASHP + PV) −61.5 to −86.2 tCO2. Condition 2’s larger net reduction was primarily attributed to the export of most PV generation (>300 MWh·year−1), as low ECP electricity demand left little available for self-consumption. However, kerosene-related emissions (22.5–35.7 tCO2·year−1) remained locked in on-site. In Condition 3, no fossil fuel was used; emissions therefore resulted only from night-time grid imports and were offset by daytime surplus PV exports, resulting in net-negative operational emissions.
Figure 3.
Hourly rooftop PV generation and house electricity demand on a representative summer day (Daejeon, extreme hot, 21 July, 26 days of age).
3.5. Sensitivity to Market Weight
For the heavier market weight of 2.5 kg in the Daejeon T_Max scenario (Supplementary Table S2), the ECP exceedance of 2 °C or more increased from 562 to 759 h·year−1 (from 9.8% to 12.9% of the occupied hours) and the THI ≥ 78 h increased from 275 to 419 h·year−1 because the finishing period at the 21 °C setpoint was longer. The ASHP again recorded 0 h at every exceedance threshold and for THI ≥ 78. The annual ASHP electricity demand increased from 204 to 224 MWh, mainly owing to the longer cooling period of heavier birds, whereas the kerosene consumption of ECP decreased from 9548 to 6197 L because the number of brooding periods fell from eight to six. Condition 3 (ASHP + PV) remained net-negative under the export credit approach (−63.6 tCO2·year−1), and its simple payback lengthened to approximately 14 years. The comparative conclusions of this study were therefore unchanged for the heavier market weight.
4. Discussion
4.1. Optimal Temperature Maintenance and Heat Stress
Summers in Korea are hot and humid, with monsoon conditions and high relative humidity, which greatly reduce the advantage that evaporative cooling has in dry climates. The greatest failure of ECP to maintain the optimal temperature occurred under the extreme hot condition in Daejeon (562 h·year−1), where the elevated wet bulb temperature under humid conditions exhausted the evaporative cooling potential. Here, optimal temperature exceedance hours represent more than a temperature statistic, as they indicate periods during which the birds are potentially exposed to heat stress. Previous studies have shown that exposure to high summer temperature leads to productivity losses such as reduced feed intake, lower weight gain, and increased mortality, with birds being especially vulnerable during the late rearing period when body weight is high [14,15,16]. Evaporative cooling alone therefore has a structural limitation in maintaining the optimal temperature during the high body weight, late-rearing period, which, according to previous studies, may increase the risk of productivity and welfare loss.
THI was applied during the late rearing period to characterize the nature of these high-temperature hours rather than to add new ones. During this period, THI ≥ 78 occurred only when the dry bulb temperature had already exceeded the setpoint; therefore, THI-based heat stress hours fall almost entirely within the temperature exceedance hours. The THI criterion therefore identifies exceedance periods that are humid as well as hot. Evaporative cooling adds moisture to the supply air, allowing indoor humidity to remain high even when indoor temperature is already high; consequently, ECP exceeded THI ≥ 78 for 112–275 h. In contrast, the zero THI ≥ 78 h of the ASHP resulted from temperature control rather than from dehumidification. The persistently high indoor humidity indicates that moisture was removed mainly through ventilation rather than ASHP dehumidification; nevertheless, because the dry bulb temperature was held low, the THI remained below the threshold. Under saturated conditions (RH 100%), a THI of 78 corresponds to an indoor temperature of 25.56 °C, and in the simulations the highest temperature and the highest humidity never coincided. These results indicate that for the ASHP, maintaining the dry bulb temperature is the key to preventing heat stress, even when humidity remains high.
4.2. Challenges of Full Electrification and the Significance of the Ventilation Algorithm
ASHP effectively maintains the optimal temperature regardless of humidity, but full electrification greatly increases electricity demand and makes the house wholly grid dependent. This creates two challenges. First, if electrification proceeds without PV, carbon-intensive grid electricity can increase carbon emissions, as shown by Condition 1 in Section 3.4. Second, the large electricity demand increases both grid dependence and exposure to electricity price fluctuations. Thus, introducing ASHP resolves the temperature maintenance challenge but creates new challenges in securing electricity and decarbonization. This study therefore analyzed the PV–ASHP coupling effect as a means of resolving these challenges through rooftop PV coupling (Section 3.3).
The summer ventilation fan electricity of the ASHP was only about 7–10 MWh lower than that of ECP. Although this saving is small relative to the total annual electricity demand (192–204 MWh), it results from decoupling cooling from ventilation and suppressing ventilation to the minimum level needed for air quality. In ECP, high-volume ventilation itself provides cooling, whereas active cooling by ASHP requires this algorithm to be correctly represented. By decoupling ventilation from the cooling load, the algorithm keeps the ventilation load of ASHP low.
4.3. Securing Electricity from PV and the Temporal Match
The dominant ASHP load is summer daytime cooling, whose hours overlap with PV generation hours. Therefore, PV can offset much of the increased electricity demand resulting from full electrification discussed in Section 3.2. In particular, even under the extreme hot condition, the heatwave peak coincided with the solar peak, providing a temporal match between PV generation and cooling demand and supplying electricity when the cooling demand was most pressing. On the hottest days of the late rearing period, however, the cooling demand exceeded the PV output, except for around midday (Figure 3). Night-time cooling and heating are also difficult to meet directly with PV, leaving annual self-sufficiency at 37–38%.
4.4. Carbon Emission Reduction and the Substantive Decarbonization Pathway
The carbon emission results indicate two things. First, ASHP conversion must be coupled with PV, as conversion alone (Condition 1) increases carbon emissions. Second, although both ECP + PV (Condition 2) and ASHP + PV (Condition 3) yield net-negative operational emissions, their characteristics differ. The lower (more negative) net emissions of Condition 2 result from the offset achieved by exporting most of the PV generation rather than self-consuming it, owing to the low ECP electricity demand. However, the kerosene emissions cannot be offset by PV and therefore remain locked in on-site. In contrast, Condition 3 has no fossil fuel consumption, so its residual on-site emissions arise entirely from electricity use and can, in principle, be reduced to zero through deployment of an energy storage system (ESS) or future power grid decarbonization.
Superiority should not be judged by present-day net emissions alone. In terms of emission composition, Condition 3’s on-site emissions (e.g., 53.4 tCO2 for Chuncheon T_Max, all from grid electricity) exceed those of Condition 2 (35.6 tCO2); however, after export offsets, Condition 2 has lower net emissions (−124.2 vs. −77.1 tCO2). However, Condition 2’s large negative net emissions are transitional, as they depend on the high carbon intensity of the present grid and crediting large-scale exports as grid replacement. As the grid emission factor falls toward zero, the export offset disappears, and Condition 2 returns to approximately +22.5–35.7 tCO2·year−1, representing its irreplaceable kerosene emissions. In contrast, Condition 3, with no fossil fuel consumption and increasingly clean grid electricity, converges to essentially zero emissions. Considering both the nature of the residual emissions (fixed fossil fuel vs. reversible electrical) and grid decarbonization, Condition 3 (ASHP + PV) represents the complete long-term decarbonization pathway. Coupling the system with an ESS to shift daytime PV surplus to night-time demand could further reduce its residual emissions.
4.5. Interpretation of the Economics
Based on the simple payback analysis, PV coupling makes both cooling methods economically revenue generating, but the revenue outcomes differ according to how each condition monetizes its PV generation (Supplementary Materials). ECP has very low electricity demand, making it more valuable to export the entire PV generation and receive the Renewable Energy Certificate (REC) premium. In contrast, ASHP self-consumes a substantial share of the generation for cooling and exports only the surplus, on which no REC applies. Consequently, self-consumption-centered ASHP + PV generates lower private revenue than full-export ECP+PV; however, this forgone revenue can be regarded as the private cost of on-site decarbonization and the potential grid benefit of self-consumption. Moreover, ECP fails to maintain the optimal summer temperature from the outset. Therefore, ECP+PV effectively adds PV to a system with insufficient cooling rather than securing the required rearing environment. Considering ECP’s failure to maintain the optimal temperature together with the private–social gap, self-consumption-centered ASHP + PV provides a balanced option that simultaneously secures the rearing environment, supports on-site decarbonization, and can be expected to reduce reverse power flow to the grid. A policy scheme that compensates for the forgone revenue could help realize such public benefits (Section 4.6).
4.6. Policy Implications
Economically, if profit maximization is the sole objective, exporting a large share of the generated electricity to the grid may be more advantageous than self-consuming it for cooling; for ASHP + PV, full export would yield more revenue than self-consumption. However, this private optimum may not align with the perspective of the power grid. If many farms and power generation operators participate in large-scale export without self-consumption, summer daytime reverse power flows could become concentrated, increasing the burden on the existing power grid, particularly distribution lines and transformers, and increasing the risk of output curtailment. In contrast, ASHP + PV directly self-consumes the generated electricity for summer cooling, thereby lowering net reverse flow and grid dependence. With a self-sufficiency of 37–38% in this study, this operating mode can be expected to be more favorable for grid stability. However, because this study focuses on the building energy analysis of a single broiler house and does not directly simulate grid effects, this interpretation is qualitative and based on self-sufficiency and net reverse power flow.
This gap between the private and social optima provides a basis for policy intervention. The current export-based support (SMP+REC) relatively favors the practice of exporting PV generation to the grid over self-consumption, forming an incentive that can increase the grid burden. This analysis also shows that for ASHP + PV, self-consumption first operation generates substantially lower annual net revenue than full export because no REC applies to self-consumption (Supplementary Materials). This gap shows that the current support system structurally disadvantages self-consumption. Shifting policy support from export compensation toward self-consumption-oriented electrification could therefore encourage farm participation through government support programs while potentially easing the grid burden and promoting sectoral decarbonization. In particular, ASHP + PV provides social and national benefits that are not fully reflected in private profitability: (i) it secures the optimal rearing temperature under a hot and humid climate, which can be expected to reduce the risk of heat-stress-related productivity and welfare loss reported in previous studies; (ii) it replaces winter fossil fuel (kerosene) heating with electrification, enabling substantive on-site decarbonization; and (iii) through self-consumption, it can be expected to reduce reverse power flow to the grid. These potential benefits provide a rationale for considering policy support for solar-driven ASHP cooling and heating.
5. Conclusions
Using a building energy simulation built on a previously validated thermal environment model, this study evaluated the conversion of summer cooling in Korean broiler houses from ECP to ASHP. Because the cooling method and the ventilation strategy were changed together, this comparison concerns integrated environmental control strategies rather than the cooling devices alone. The assessment covered three climate zones (Chuncheon, Daejeon, Jinju) and extreme hot summer and extreme cold winter conditions derived from 30 years of historical observations, and it addressed the thermal environment, energy consumption, carbon emissions, and economic performance.
In the hot, humid summer, ECP cooling performance deteriorated as the wet bulb temperature rose, resulting in an average setpoint exceedance of 387 h·year−1 (worst case, 562 h·year−1), whereas ASHP maintained the optimal temperature stably, remaining within 2 °C of the setpoint under all conditions. The ASHP conversion fully electrified cooling and heating and eliminated kerosene use, greatly increasing electricity demand to 192–204 MWh·year−1, of which rooftop PV supplied 37–38% directly through hourly self-consumption. In terms of carbon emissions, ASHP without PV increased emissions by 172% on average, whereas PV coupling yielded net-negative operational emissions under the export credit approach. Only ASHP + PV, which eliminates fossil fuel use entirely, provided a substantive on-site decarbonization pathway. Economically, based on a simple payback analysis, PV coupling made both methods revenue-generating; full-export ECP+PV earned higher revenue than self-consumption-centered ASHP + PV. This difference reflects ECP’s inability to use its own PV generation, whereas ASHP + PV self-consumes much of it and consequently exports less to the grid. The self-consumption-oriented operation therefore forgoes revenue relative to full export, which can be regarded as the private cost of its potential grid benefit.
Overall, solar-driven ASHP showed potential as an integrated solution that simultaneously provides optimal temperature maintenance under hot and humid conditions, enables substantive decarbonization by eliminating fossil fuel use, and improves economic self-reliance through PV self-consumption. In particular, ASHP conversion must be coupled with PV for its carbon and economic advantages to be realized. Although export-oriented operation aimed at maximizing profit yields higher private revenue, it increases reverse power flow to the grid. In contrast, when the rearing environment, on-site decarbonization, and the potential grid benefit are considered together, self-consumption-centered ASHP + PV represents a promising option, although its grid-level benefits require confirmation through grid-level analysis. These findings provide a rationale for considering policy support for self-consumption-oriented electrified cooling and heating. Further studies coupling an energy storage system and applying life-cycle assessment can further substantiate its effectiveness.
Finally, some limitations should be noted. The analysis was based on years selected for their summer extreme hot and winter extreme cold conditions. Although the annual mean temperatures of the paired years differed by no more than 0.5 °C (Section 2.2), such years do not necessarily represent typical annual heating and cooling demand or solar radiation. Therefore, the reported annual energy, PV, carbon, and economic results should be interpreted as values for these extreme event years rather than typical-year values, and assessing performance under typical-year conditions remains a task for future research. In addition, the ASHP was represented using its fixed (rated) capacities and power, so the reduction in heat pump efficiency at low outdoor temperatures, including defrost operation, was not reflected. This did not affect the capacity adequacy of the system, as only five out of the twenty installed units operated for heating even under the coldest conditions (Section 3.2). Nevertheless, the fixed-performance assumption may modestly underestimate winter electricity demand, operating cost, and carbon emissions, although its influence on the annual results is limited. Ventilation in the ASHP scenario was also maintained at the CO2-based minimum rate throughout the year. The ventilation required to control litter moisture, relative humidity, and ammonia may exceed this rate, which would mainly increase the winter heating demand of both the ECP and ASHP scenarios. Conversely, under transitional conditions in which the outdoor air is cooler than the indoor air, a hybrid control that also uses ventilation for cooling could reduce ASHP cooling electricity. Other limitations include the lack of field validation of the integrated ASHP–PV system, the use of an undiscounted simple payback period instead of life-cycle economics and equipment degradation, the sensitivity evaluation of the heavier market weight in a single scenario (Daejeon T_Max), and the lack of an assessment of the specific level of policy support needed to encourage farm participation.
Future research should therefore assess the performance of ASHP + PV under typical-year conditions and identify the optimal ventilation strategy, together with the optimal ASHP and PV capacities, which were beyond the scope of this study.
Supplementary Materials
The following supporting information can be downloaded at https://www.mdpi.com/article/10.3390/agriculture16212353/s1, Text S1: Economic assessment of the PV coupling (methods, price assumptions, operating modes, and results); Table S1: Net annual operating cost and simple payback period by region, weather, and condition. Each cell gives the net operating cost (103 USD · year−1; negative = net revenue) with the simple payback period in parentheses (years); “–” denotes not applicable (baseline); Text S2: Sensitivity to market weight; Table S2: Comparison of the 1.5 kg and 2.5 kg market-weight scenarios (Daejeon, T_Max). Conditions 2 and 3 were estimated from the no-PV runs for both market weights (Text S2). Exceedance and THI hours are counted over the occupied hours and the late rearing period (from 21 days of age), respectively.
Author Contributions
Conceptualization, T.H. and S.-W.H.; methodology, T.H.; software, T.H.; formal analysis, T.H.; investigation, T.H.; resources, S.-W.H.; data curation, T.H.; writing—original draft preparation, T.H.; writing—review and editing, S.-W.H.; visualization, T.H.; supervision, S.-W.H.; project administration, T.H. All authors have read and agreed to the published version of the manuscript.
Funding
This study was conducted with the support of the “Cooperative Research Program for Agriculture Science and Technology Development (Project No. RS-2024-00398327),” Rural Development Administration, Republic of Korea. This study was also supported by a research fund from Chungnam National University.
Institutional Review Board Statement
Not applicable, as this study involved only numerical simulation and did not include any experiments on live animals or humans.
Data Availability Statement
The data that support the findings of this study are available from the corresponding author upon reasonable request.
Conflicts of Interest
The authors declare no conflicts of interest. The funders had no role in the design of the study; in the collection, analyses, or interpretation of data; in the writing of the manuscript; or in the decision to publish the results.
Abbreviations
The following abbreviations are used in this manuscript:
| ASHP | Air source heat pump |
| BES | Building energy simulation |
| CEC | California Energy Commission |
| CIGR | International Commission of Agricultural Engineering |
| ECP | Evaporative cooling pad |
| ESS | Energy storage system |
| GIR | Greenhouse Gas Inventory and Research Center |
| MDSR | Maximum daily accumulated solar radiation |
| MPPT | Maximum power point tracking |
| NOCT | Nominal operating cell temperature |
| PID | Proportional–integral–derivative |
| PV | Photovoltaic |
| REC | Renewable Energy Certificate |
| RH | Relative humidity |
| SMP | System marginal price |
| THI | Temperature–humidity index |
| TRNSYS | Transient System Simulation program |
References
- Lee, H.; McJeon, H.; Yu, S.; Liu, Y.; Kim, H.; Eom, J. Decarbonization Pathways for Korea’s Industrial Sector towards Its 2050 Carbon Neutrality Goal. J. Clean. Prod. 2024, 476, 143749. [Google Scholar] [CrossRef] [Scilit]
- Fuentes Hutfilter, A.; Cho, H.; Ventricelli, V.; Derecichei, D.; Noels, J. Rural Transitions to Net Zero GHG Emissions in Korea; OECD Regional Development Papers: Paris, France, 2023; Volume 55. [Google Scholar]
- Calvin, K.; Dasgupta, D.; Krinner, G.; Mukherji, A.; Thorne, P.W.; Trisos, C.; Romero, J.; Aldunce, P.; Barrett, K.; Blanco, G.; et al. IPCC, 2023: Climate Change 2023: Synthesis Report. Contribution of Working Groups I, II and III to the Sixth Assessment Report of the Intergovernmental Panel on Climate Change [Core Writing Team, H. Lee and J. Romero (Eds.)]; Arias, P., Bustamante, M., Elgizouli, I., Flato, G., Howden, M., Méndez-Vallejo, C., Pereira, J.J., Pichs-Madruga, R., Rose, S.K., Saheb, Y., et al., Eds.; IPCC: Geneva, Switzerland, 2023. [Google Scholar]
- Gerber, P.J.; Steinfeld, H.; Henderson, B.; Mottet, A.; Opio, C.; Dijkman, J.; Falcucci, A.; Tempio, G. Tackling Climate Change Through Livestock: A Global Assessment of Emissions and Mitigation Opportunities; Food and Agriculture Organization of the United Nations: Rome, Italy, 2013; ISBN 9789251079208. [Google Scholar]
- Eska, N.; Lee, J.S.; Park, K.H. Greenhouse Gas Emissions from Livestock: Sources, Estimation, and Mitigation. J. Anim. Sci. Technol. 2024, 66, 1083–1098. [Google Scholar] [CrossRef] [Scilit]
- Hur, S.J.; Kim, J.M.; Yim, D.G.; Yoon, Y.; Lee, S.S.; Jo, C. Greenhouse Gas Emission Status in Agriculture and Livestock Sectors of Korea: A Mini Review. Food Life 2024, 2024, 1–7. [Google Scholar] [CrossRef] [Scilit]
- Kang, H.Y.; Hwang, Y.W.; Lee, J.H.; Cho, S.J.; Jeon, Y.S.; Kim, N.S.; Kim, J. Evaluating the Greenhouse Gas Emissions Footprint of Chicken Meat Production in South Korea: A Life Cycle Perspective. Food Bioprod. Process. 2025, 150, 230–239. [Google Scholar] [CrossRef] [Scilit]
- USDA Foreign Agricultural Service (GAIN). Poultry and Products Annual—Republic of Korea; USDA: Washington, DC, USA, 2024.
- Kim, S. Challenges and Constraints to the Sustainability of Poultry Farming in Republic of Korea. Anim. Biosci. 2025, 38, 829–844. [Google Scholar] [CrossRef] [Scilit]
- May, J.D.; Lott, B.D. The Effect of Environmental Temperature on Growth and Feed Conversion of Broilers to 21 Days of Age. Poult. Sci. 2000, 79, 669–671. [Google Scholar] [CrossRef] [Scilit]
- Donkoh, A. Ambient Temperature: A Factor Affecting Performance and Physiological Response of Broiler Chickens. Int. J. Biometeorol. 1989, 33, 259–265. [Google Scholar] [CrossRef] [Scilit]
- Costantino, A.; Fabrizio, E.; Ghiggini, A.; Bariani, M. Climate Control in Broiler Houses: A Thermal Model for the Calculation of the Energy Use and Indoor Environmental Conditions. Energy Build. 2018, 169, 110–126. [Google Scholar] [CrossRef] [Scilit]
- Kwon, K.S.; Kim, J.B.; Kim, B.; Jang, D.H.; Pann, V.; Kim, J.E.; Ha, T. Predicting Energy Needs in Mechanically Ventilated Broiler Houses in South Korea Using a Building Energy Simulation-Driven Algorithm. Biosyst. Eng. 2026, 261, 104317. [Google Scholar] [CrossRef] [Scilit]
- Apalowo, O.O.; Ekunseitan, D.A.; Fasina, Y.O. Impact of Heat Stress on Broiler Chicken Production. Poultry 2024, 3, 107–128. [Google Scholar] [CrossRef] [Scilit]
- Liu, L.; Ren, M.; Ren, K.; Jin, Y.; Yan, M. Heat Stress Impacts on Broiler Performance: A Systematic Review and Meta-Analysis. Poult. Sci. 2020, 99, 6205–6211. [Google Scholar] [CrossRef] [Scilit]
- Oke, O.E.; Alo, E.T.; Oke, F.O.; Oyebamiji, Y.A.; Ijaiya, M.A.; Odefemi, M.A.; Kazeem, R.Y.; Soyode, A.A.; Aruwajoye, O.M.; Ojo, R.T.; et al. Early Age Thermal Manipulation on the Performance and Physiological Response of Broiler Chickens under Hot Humid Tropical Climate. J. Therm. Biol. 2020, 88, 102517. [Google Scholar] [CrossRef] [Scilit]
- Costantino, A.; Fabrizio, E.; Villagrá, A.; Estellés, F.; Calvet, S. The Reduction of Gas Concentrations in Broiler Houses through Ventilation: Assessment of the Thermal and Electrical Energy Consumption. Biosyst. Eng. 2020, 199, 135–148. [Google Scholar] [CrossRef] [Scilit]
- Çaylı, A.; Akyüz, A.; Üstün, S.; Yeter, B. Efficiency of Two Different Types of Evaporative Cooling Systems in Broiler Houses in Eastern Mediterranean Climate Conditions. Therm. Sci. Eng. Prog. 2021, 22, 100844. [Google Scholar] [CrossRef] [Scilit]
- Daǧtekin, M.; Karaca, C.; Yildiz, Y. Performance Characteristics of a Pad Evaporative Cooling System in a Broiler House in a Mediterranean Climate. Biosyst. Eng. 2009, 103, 100–104. [Google Scholar] [CrossRef] [Scilit]
- Yahav, S.; Straschnow, A.; Vax, E.; Razpakovski, V.; Shinder, D. Air Velocity Alters Broiler Performance Under Harsh Environmental Condition. Poult. Sci. 2001, 80, 724–726. [Google Scholar] [CrossRef] [Scilit]
- Jain, J.K.; Hindoliya, D.A. Correlations for Saturation Efficiency of Evaporative Cooling Pads. J. Inst. Eng. Ser. C 2014, 95, 5–10. [Google Scholar] [CrossRef] [Scilit]
- Tejero-González, A.; Franco-Salas, A. Optimal Operation of Evaporative Cooling Pads: A Review. Renew. Sustain. Energy Rev. 2021, 151, 111632. [Google Scholar] [CrossRef] [Scilit]
- Dos Santos, M.P.; Deniz, M.; de Sousa, K.T.; Klein, D.R.; Branco, T.; Pacheco, P.S.; Do Vale, M.M. Efficiency of Cooling Systems in Broiler Houses during Hot Days. Cienc. Rural 2021, 51, e20200941. [Google Scholar] [CrossRef] [Scilit]
- Haile, M.G.; Garay-Martinez, R.; Macarulla, A.M. Review of Evaporative Cooling Systems for Buildings in Hot and Dry Climates. Buildings 2024, 14, 3504. [Google Scholar] [CrossRef] [Scilit]
- Daniel, K.F.; Choi, L.Y.; Lee, S.Y.; Lee, C.R.; Park, J.Y.; Park, J.; Hong, S.W. Preliminary Evaluation of an Advanced Ventilation-Control Algorithm to Optimise Microclimate in a Commercial Broiler House. Animals 2024, 14, 3430. [Google Scholar] [CrossRef] [Scilit]
- Bokkers, E.A.M.; van Zanten, H.H.E.; van den Brand, H. Field Study on Effects of a Heat Exchanger on Broiler Performance, Energy Use, and Calculated Carbon Dioxide Emission at Commercial Broiler Farms, and the Experiences of Farmers Using a Heat Exchanger. Poult. Sci. 2010, 89, 2743–2750. [Google Scholar] [CrossRef] [Scilit]
- Cui, Y.; Theo, E.; Gurler, T.; Su, Y.; Saffa, R. A Comprehensive Review on Renewable and Sustainable Heating Systems for Poultry Farming. Int. J. Low-Carbon Technol. 2019, 15, 121–142. [Google Scholar] [CrossRef] [Scilit]
- Rathnayake, D.; Mun, H.S.; Dilawar, M.A.; Chung, I.B.; Park, K.W.; Lee, S.R.; Yang, C.J. Effect of Air Heat Pump Cooling System as a Greener Energy Source on the Air Quality, Housing Environment and Growth Performance in Pig House. Atmosphere 2021, 12, 1474. [Google Scholar] [CrossRef] [Scilit]
- Choi, H.C.; Salim, H.M.; Akter, N.; Na, J.C.; Kang, H.K.; Kim, M.J.; Kim, D.W.; Bang, H.T.; Chae, H.S.; Suh, O.S. Effect of Heating System Using a Geothermal Heat Pump on the Production Performance and Housing Environment of Broiler Chickens. Poult. Sci. 2012, 91, 275–281. [Google Scholar] [CrossRef] [Scilit]
- Wang, H.; Liu, J.; Wu, Z.; Liu, J.; Yi, L.; Li, Y.; Li, S.; Wang, M. Research on the Flexible Heating Model of an Air-Source Heat Pump System in Nursery Pig Houses. Agriculture 2023, 13, 1059. [Google Scholar] [CrossRef] [Scilit]
- Jeong, M.G.; Rathnayake, D.; Mun, H.S.; Dilawar, M.A.; Park, K.W.; Lee, S.R.; Yang, C.J. Effect of a Sustainable Air Heat Pump System on Energy Efficiency, Housing Environment, and Productivity Traits in a Pig Farm. Sustainability 2020, 12, 9772. [Google Scholar] [CrossRef] [Scilit]
- Li, H.; Wang, L.; Li, S.; Peng, J. Seasonal Variation of the Photovoltaic Driven Air Conditioner with and without Temperature Range Control. Build. Simul. 2025, 18, 1337–1354. [Google Scholar] [CrossRef] [Scilit]
- Liang, Y.; Popp, M. Economic Impact of Energy Accounting Schemes for Commercial Systems on a Broiler Farm with Power Demand and Generation. Energies 2025, 18, 979. [Google Scholar] [CrossRef] [Scilit]
- Nęcka, K.; Szul, T.; Knaga, J. Technical Optimization of a DC-Coupled Photovoltaic System with Battery Energy Storage for Poultry Farm Applications: A Two-Loop Methodology Based on Energy Utilization Indices. Appl. Sci. 2026, 16, 5799. [Google Scholar] [CrossRef] [Scilit]
- Shin, H.; Kwak, Y.; Jo, S.K.; Kim, S.H.; Huh, J.H. Calibration of Building Energy Simulation Model for a Mechanically Ventilated Livestock Facility. Biosyst. Eng. 2022, 217, 115–130. [Google Scholar] [CrossRef] [Scilit]
- Cho, J.H.; Lee, I.B.; Lee, S.Y.; Park, S.J.; Jeong, D.Y.; Decano-Valentin, C.; Kim, J.G.; Choi, Y.B.; Jeong, H.H.; Yeo, U.H.; et al. Development of Heat Stress Forecasting System in Mechanically Ventilated Broiler House Using Dynamic Energy Simulation. Agriculture 2022, 12, 1666. [Google Scholar] [CrossRef] [Scilit]
- Lee, T.H.; Liou, Y.Y.; Chang, H.H. Is Solar Panel Adoption a Win–Win Strategy for Chicken Farms? Evidence from Agriculture Census Data. Agriculture 2025, 15, 2124. [Google Scholar] [CrossRef] [Scilit]
- Soto-Gómez, D. Integration of Crops, Livestock, and Solar Panels: A Review of Agrivoltaic Systems. Agronomy 2024, 14, 1824. [Google Scholar] [CrossRef] [Scilit]
- Asa’a, S.; Reher, T.; Rongé, J.; Diels, J.; Poortmans, J.; Radhakrishnan, H.S.; van der Heide, A.; Van de Poel, B.; Daenen, M. A Multidisciplinary View on Agrivoltaics: Future of Energy and Agriculture. Renew. Sustain. Energy Rev. 2024, 200, 114515. [Google Scholar] [CrossRef] [Scilit]
- Manolakos, D.; Panagakis, P.; Bartzanas, T.; Bouzianas, K. Use of Heat Pumps in HVAC Systems for Precise Environment Control in Broiler Houses: System’s Modeling and Calculation of the Basic Design Parameters. Comput. Electron. Agric. 2019, 163, 104876. [Google Scholar] [CrossRef] [Scilit]
- Tyris, D.; Gkountas, A.; Bakalis, P.; Panagakis, P.; Manolakos, D. A Dynamic Heat Pump Model for Indoor Climate Control of a Broiler House. Energies 2023, 16, 2770. [Google Scholar] [CrossRef] [Scilit]
- Han, Z.; Wang, K.; Dai, L.; Li, K.; Wang, X. Recent Application of Heat Pump Systems for Environmental Control in Livestock Facilities–A Review. Agriculture 2024, 14, 2309. [Google Scholar] [CrossRef] [Scilit]
- Ha, T.; Kwon, K.; Hong, S.W.; Yeo, U.H. Regression Meta-Model for Predicting Temperature-Humidity Index in Mechanically Ventilated Broiler Houses Using Building Energy Simulation in South Korea. Agriculture 2026, 16, 824. [Google Scholar] [CrossRef] [Scilit]
- Ministry of Agriculture Food and Rural Affairs; National Agricultural Cooperative Federation. 2024 Livestock Standard Design Drawings; Ministry of Agriculture, Food and Rural Affairs: Sejong, Republic of Korea, 2024.
- Ministry of Land Infrastructure and Transport (MOLIT) Energy Saving Design Standards for Buildings. Available online: https://www.law.go.kr/ (accessed on 5 September 2025).
- Korea Institute for Animal Products Quality Evaluation (KAPE). Livestock Distribution Statistics: Occurrence Rate of Chicken Grading Size Numbers. Available online: https://mtrace.go.kr/stats/stp/dtl/stl/xtlStatsList.do (accessed on 18 October 2026).
- Seem, J.E. Modeling of Heat Transfer in Buildings; The University of Wisconsin-Madison: Madison, WI, USA, 1987; ISBN 9798207161914. [Google Scholar]
- Yoo, J.S. New Feeding and Management for the Production of Poultry Farming; Gyeheung Co., Ltd.: Seoul, Republic of Korea, 2009. [Google Scholar]
- Pedersen, S.; Sällvik, K. Heat and Moisture Production at Animal and House Levels—4th Report of Working Group on Climatization of Animal Houses; CIGR: Horsens, Denmark, 2002. [Google Scholar]
- National Institute of Animal Science. 100 Questions and Answers on Chicken Rearing: How to Determine the Ventilation Rate for Carbon Dioxide Removal. Available online: https://www.nias.go.kr/front/qaBoardList.do?cmCode=M120927150306083 (accessed on 15 July 2026).
- California Energy Commission Solar Equipment List: Photovoltaic Modules. Available online: https://solarequipment.energy.ca.gov/Home/PVModuleList (accessed on 27 September 2026).
- California Energy Commission Solar Equipment List: Grid Support Inverters. Available online: https://solarequipment.energy.ca.gov/Home/InverterSolarList (accessed on 27 September 2026).
- Aviagen. Ross Broiler Management Handbook 2025; Aviagen Ltd.: Scotland, UK, 2025. [Google Scholar]
- Cassuce, D.C.; Tinôco, I.d.F.F.; Baêta, F.C.; Zolnier, S.; Cecon, P.R.; VIeira, M.d.F.A. Thermal Comfort Temperature Update for Broiler Chickens up to 21 Days of Age. Eng. Agrícola 2013, 33, 28–36. [Google Scholar] [CrossRef] [Scilit]
- St-Pierre, N.R.; Cobanov, B.; Schnitkey, G. Economic Losses from Heat Stress by US Livestock Industries. J. Dairy Sci. 2003, 86, E52–E77. [Google Scholar] [CrossRef] [Scilit]
- Ministry of Environment. Guidelines for the Reporting and Certification of Emissions Under the Greenhouse Gas Emissions Trading Scheme, Appendix 6. In Korea Ministry of Government Legislation; National Law Information Center: Sejong, Republic of Korea, 2025. [Google Scholar]
- Greenhouse Gas Inventory and Research Center (GIR). 2024 National Inventory Document: Republic of Korea’s Submission to the UNFCCC; Greenhouse Gas Inventory and Research Center (GIR): Sejong, Republic of Korea, 2026. [Google Scholar]

Disclaimer/Publisher’s Note: The statements, opinions and data contained in all publications are solely those of the individual author(s) and contributor(s) and not of MDPI and/or the editor(s). MDPI and/or the editor(s) disclaim responsibility for any injury to people or property resulting from any ideas, methods, instructions or products referred to in the content. |
© 2026 by the authors. Licensee MDPI, Basel, Switzerland. This article is an open access article distributed under the terms and conditions of the Creative Commons Attribution (CC BY) license.