


Abstract
The importance of producing bioenergy using agricultural by-products is increasing in response to energy depletion and climate change caused by dependence on fossil fuels. In particular, rice straw is one of the most abundant agricultural by-products generated in Korea and has high potential for utilization in various bioenergy resource recovery applications. The objective of this study was to estimate rice straw production and select optimal locations for agricultural by-product resource recovery facilities based on resource availability, facility processing capacity, and collection and transportation costs. Field measurements of soil properties were conducted to analyze their relationships with rice straw production, while rice cultivation and production statistics were obtained from the Korean Statistical Information Service (KOSIS), and digital map data were obtained from the National Geographic Information Institute (NGII). The soil-property data were statistically analyzed to evaluate their relationships with rice straw production, while the digital map data were processed using ArcGIS Pro to delineate paddy field areas, apply correction factors based on statistical rice cultivation areas, generate representative centroid locations, identify candidate sites using spatial exclusion criteria, and calculate road-network-based transportation distances and costs. However, since the economic feasibility of resource recovery facilities is greatly affected by the stable supply of raw materials and the efficiency of collection costs, optimal site selection considering resource generation and transportation characteristics is necessary. The suitability of rice cultivation was evaluated by investigating the soil moisture content, electrical conductivity (EC), penetration resistance, and soil texture of the study area, and the resource supply was estimated based on the rice cultivation area and rice straw generation in 2024. In addition, ArcGIS Pro 3.6.4 (Esri, Redlands, CA, USA) was used to derive candidate sites by considering conditions such as roads, slope, streams, rivers, lakes, and wetlands, and the optimal locations by facility scale were evaluated by analyzing the total logistics costs, including collection and transportation costs. The results showed that both study areas exhibited soil properties suitable for rice cultivation and were capable of providing a stable supply of rice straw. For the 30,000 ton processing facility, two optimal locations were selected in each of Naju-si and Goheung-gun, while one optimal location was selected in each region for the 60,000 ton processing facility. The GIS-based site selection method proposed in this study is expected to be applicable not only to rice straw resource recovery facilities but also to the planning and supply chain development of various agricultural biomass resource recovery facilities. It is also expected to contribute to the development of efficient systems for achieving sustainable agriculture and carbon neutrality.
1. Introduction
The increasing use of fossil fuels has exacerbated problems related to energy depletion, rising energy prices, and climate change. Accordingly, the development of sustainable renewable energy has become increasingly important, and biomass utilizing agricultural by-products has attracted attention as a promising alternative [1]. Rice straw, a representative agricultural by-product in the agricultural sector, is one of the largest biomass resources worldwide. Globally, rice straw production amounts to approximately 800 million to 1 billion tons annually, and its production continues to increase with advances in rice cultivation technologies and the shortening of growth cycles. Traditionally, rice straw has been used as animal feed or compost, but some of it is burned or left unmanaged. This causes severe air pollution, affects the ecological balance of soil, and significantly contributes to the increase in agricultural waste [2,3]. In particular, open-field burning of rice straw is a major source of carbon dioxide (CO2), methane (CH4), and nitrous oxide (N2O) emissions, and it has been reported that the utilization of rice straw as a resource and its use for bioenergy production are necessary to reduce greenhouse gas emissions in the agricultural sector [4].
Renewable energy utilizing agricultural by-products has been proposed as a key means of reducing agricultural waste and achieving carbon neutrality, and interest in bioethanol production using agricultural by-products is increasing. In addition, lignocellulosic biomass such as rice straw has been reported to have potential for use not only in bioethanol production but also as a feedstock for biohydrogen production. In particular, rice straw and rice husks are considered promising renewable energy resources capable of producing electricity and fuels through various conversion technologies, including combustion, gasification, and pyrolysis [5,6,7]. The development of sustainable biofuels can help reduce dependence on fossil fuels and mitigate the impacts of climate change, and biofuels are considered next-generation bioenergy resources that can replace fossil fuels [8]. Biofuels are a type of fuel derived from biomass, and an analysis of a bioethanol production system using high-yielding rice in Japan showed that rice straw biomass had a positive effect in terms of energy balance and was therefore considered a suitable feedstock for sustainable biofuel production [9]. In addition, biofuels can be used as alternatives or additives to conventional fossil fuels such as gasoline and diesel, and biomass is considered the world’s fourth-largest energy resource after oil, coal, and natural gas. Biofuel demand is expected to reach 200 billion liters by 2028 [10,11].
The potential of biomass energy for achieving the United Nations Sustainable Development Goals has attracted global attention. The utilization of rice straw for energy can not only mitigate environmental pollution and energy shortages but also prevent the adverse effects caused by the disposal and open-field burning of rice straw. Biomass energy is widely used in various fields, including power generation, solid densification, fuels, and ethanol [12].
To establish an efficient system for the utilization of rice straw, it is first necessary to accurately estimate the production volume by region. Existing production estimation methods have limitations in analyzing the distribution characteristics of resources because they do not sufficiently reflect the spatial variability observed in actual field conditions [13]. In particular, agricultural by-products are geographically dispersed over large areas, making it difficult to establish collection and transportation plans based solely on total quantity information. In Korea, studies have been conducted on collection cost and route optimization using agricultural by-products [14]; however, simple total quantity-based estimations that do not consider the spatial distribution characteristics of by-products may lead to inefficiencies in the actual operation of resource recovery facilities [15,16].
Gwak et al. (2024) [17] periodically investigated the physical properties of paddy soils in Jeollanam-do by collecting soil samples from representative fields in major cities and counties of the region at four-year intervals, with the aim of analyzing changes in the physical properties of paddy soils over time and providing baseline data for sustainable paddy soil management and future policy development. The results showed that the organic matter content in the soil continuously increased from 18.2 g/kg in 2019 to 23.1 g/kg in 2023. The authors reported that the return of rice straw to the soil and the maintenance of appropriate cropping systems should be continuously encouraged to manage the quality of paddy soils in Jeollanam-do [17]. Yoon et al. (2024) [18] investigated the effects of applying organic materials with different characteristics, such as rice straw, cattle manure compost, and swine manure compost, to paddy soils on rice productivity. The results showed that the application of organic materials, particularly cattle and swine manure, promoted plant growth and increased the production of rice straw and grains; however, the differences were not statistically significant. The authors also reported that nutrients from organic materials not absorbed by crops may remain in the soil and potentially have negative effects on the soil environment [18]. Che et al. (2024) [19] analyzed changes in the physical and chemical properties of paddy soils and rice productivity following the application of rice straw to paddy soils. The results showed that rice straw incorporation increased soil organic carbon (SOC), total nitrogen (TN), available phosphorus, and available potassium contents, indicating a positive effect on soil fertility. In particular, total nitrogen content was identified as the factor with the greatest influence on soil organic carbon accumulation, while soil pH showed a significant correlation with rice yield. In addition, appropriate rice straw incorporation was evaluated as improving crop productivity by enhancing soil structure and nutrient cycling. These results suggest that the physical and chemical properties of soil may affect not only crop productivity but also rice straw biomass production, highlighting the need for studies estimating rice straw production using soil properties [19].
Rice straw production varies depending on various factors; however, most previous studies have focused on changes in organic matter in paddy soils and the effects of applying various organic materials on rice growth and productivity. Therefore, there are limitations in identifying the direct relationship between rice straw production and soil properties. In addition, the individual contributions of changes in the physical and chemical properties of soil to rice straw production have not been sufficiently analyzed. Studies examining the relationship between long-term changes in soil properties resulting from organic material application and productivity have also been limited, while comparative studies reflecting regional differences in soil properties remain insufficient, limiting the generalizability of the findings. Although the effects of rice straw incorporation and compost application on soil properties have been reported, their direct relationships with rice straw production have been insufficiently demonstrated. Furthermore, analyses of the combined effects of interactions among soil nutrients on rice straw production have been inadequate. Therefore, research comparing the correlations between soil properties and rice straw production is needed.
Therefore, this study estimates the production of rice straw, an agricultural by-product that can serve as a feedstock for biofuels, and analyzes the optimal site selection and economic feasibility of resource recovery facilities based on the estimated production. To this end, areas with relatively easy accessibility and data availability were selected based on rice straw production in the study area. The correlation between rice straw production and the physical properties of soil was analyzed, and rice straw production estimation, collection costs, and transportation costs were analyzed. Finally, potential sites for resource recovery facilities were selected based on logistics costs, spatial distribution of rice straw resources, transportation conditions, and processing capacity. For GIS-based estimation of rice straw production and optimal site selection of resource recovery facilities, the annual processing capacities of the facilities were set at 30,000 tons and 60,000 tons.
Specifically, the objectives of this study were to: (1) investigate the physical properties of paddy soils and examine their relationships with rice straw production in the selected study areas; (2) estimate the spatial distribution and total production of rice straw using GIS-based analysis and statistical data; (3) estimate the costs associated with rice straw collection and transportation; and (4) identify optimal locations for rice straw resource recovery facilities with processing capacities of 30,000 and 60,000 tons by considering spatial distribution, road-network-based transportation distances, restricted areas, and total logistics costs.
The GIS-based optimal site selection method for agricultural by-product resource recovery facilities proposed in this study can serve as baseline data for spatial information-based decision-making technologies that comprehensively support production, logistics, and resource circulation in smart agricultural and livestock systems. In particular, the spatial distribution of rice straw resources, road-network-based transportation distances, and collection and transportation costs identified in this study can support data-driven planning of agricultural biomass collection and logistics. By connecting agricultural production information with spatial and transportation information, the proposed approach can contribute to the development of smart agricultural systems that improve the efficiency of resource movement and agricultural by-product utilization. Furthermore, the proposed framework can be extended by integrating real-time information, such as agricultural machinery locations, harvesting schedules, traffic conditions, and weather conditions, to support dynamic planning of biomass collection and transportation. Together with smart livestock automation technologies, it can be utilized as a foundational technology to support the digital transformation of the agricultural and livestock sectors as a whole and the achievement of carbon neutrality.
A previous study by the authors investigated the optimization of biomass resource circulation facility location in Goheung-gun using GIS-based spatial analysis [20]. The present study extends that work in several aspects. First, the geographical scope was expanded to include both Naju-si and Goheung-gun, allowing the proposed approach to be examined under different agricultural and spatial conditions. Second, the present study combines field measurements of soil physical properties with statistical analysis of their relationships with rice straw production, while also integrating rice cultivation statistics and digital spatial data to estimate the spatial distribution of rice straw resources. Third, the facility site-selection procedure was expanded by incorporating correction factors between mapped paddy-field areas and statistically reported rice cultivation areas, road-network-based transportation distances, collection and transportation costs, restricted areas, and alternative facility processing capacities of 30,000 and 60,000 tons per year. Finally, the present study provides an integrated spatial decision-support framework that links biomass resource availability, collection and transportation logistics, and facility capacity for agricultural biomass resource recovery planning. These extensions distinguish the present study from the previous work and provide additional information for evaluating the applicability of GIS-based biomass facility planning across different agricultural regions.
2. Materials and Methods
2.1. Optimal Site Selection Procedure
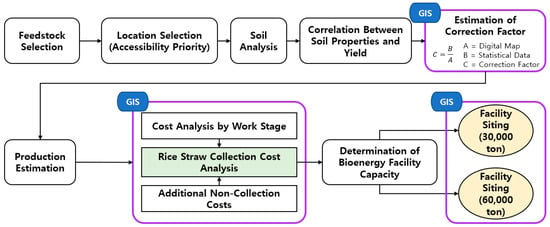
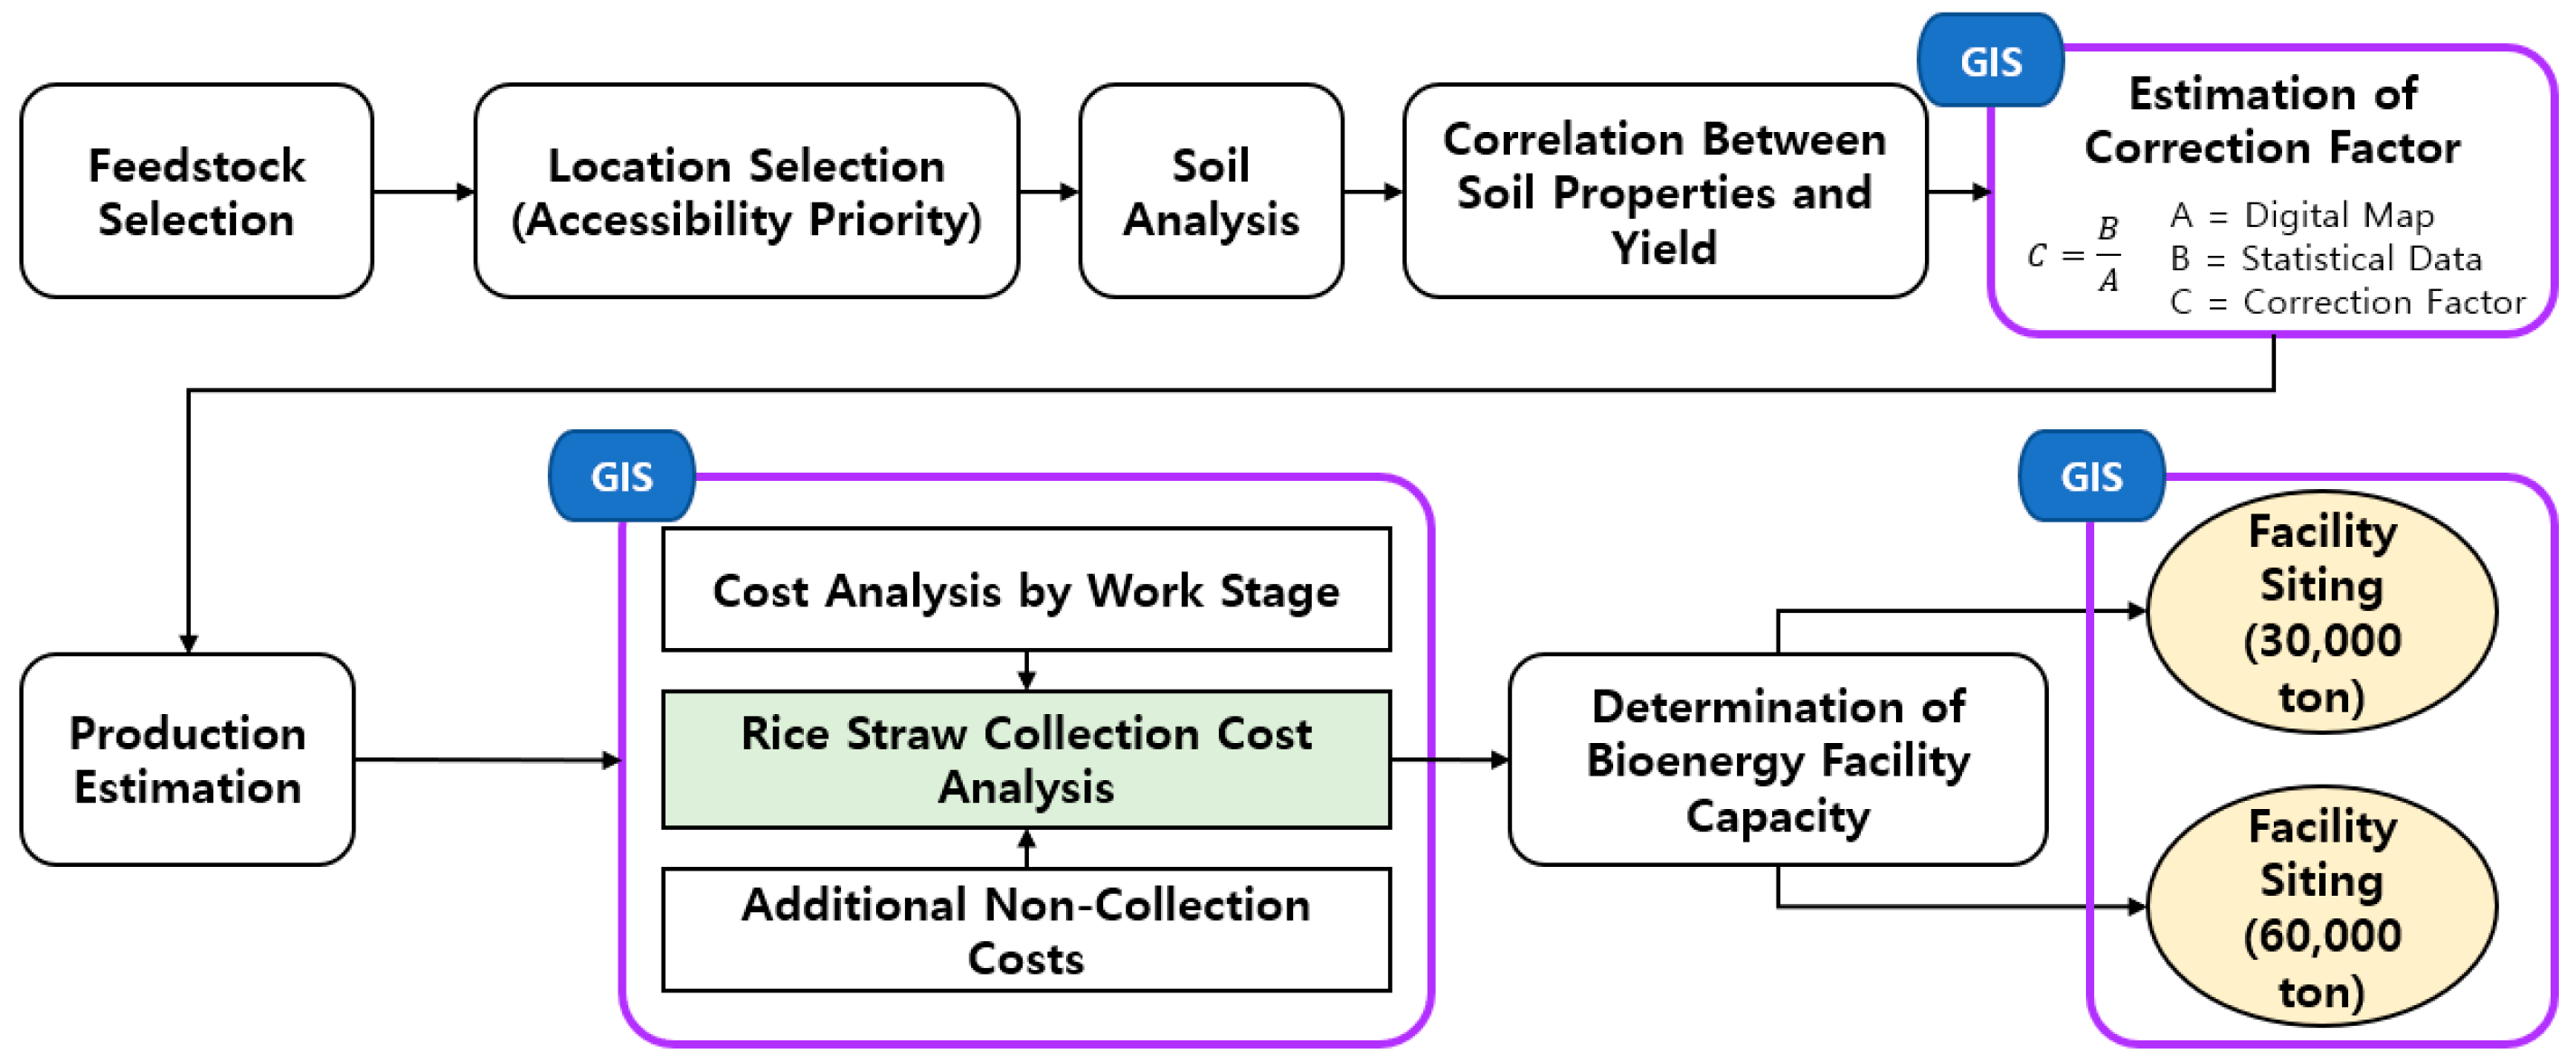
This study selected rice straw as the agricultural by-product of interest and Naju-si and Goheung-gun as the study areas because they offer relatively easy accessibility and data availability and have high rice straw production. The soil properties of paddy fields in the selected areas were investigated, and their correlations with rice straw production were comparatively analyzed. Although the land use was classified as paddy fields, correction coefficients were calculated using statistical data and digital maps to account for areas actually used for purposes other than agricultural production, and rice straw production was estimated accordingly. The costs associated with each stage of the rice straw collection process, as well as costs other than collection operations, were estimated to analyze the rice straw collection costs. Based on these results, the processing capacity of the resource recovery facility was determined, and site selection and economic feasibility were analyzed. Spatial analysis and mapping were performed using ArcGIS Pro 3.6.4 (Esri, Redlands, CA, USA). The overall process of this study is shown in Figure 1.
Figure 1.
Overall process for GIS-based estimation of rice straw production and optimal siting of resource utilization facilities.
2.2. Selection of Target Agricultural By-Products
As of 2024, the major crops cultivated in the Republic of Korea were ranked by cultivation area as follows: paddy rice 697,684 ha, soybean 74,018 ha, and barley 32,834 ha. In terms of by-product production, rice straw had the highest production volume at 4,098,028 tons, followed by potato stems at 477,223 tons and pepper stems at 455,657 tons, as shown in Table 1 [21]. Among these crops, paddy rice had the largest cultivation area, while rice straw accounted for the highest by-product production. Therefore, rice straw was selected as the target by-product for analysis in this study.
Table 1.
Cultivation area and by-product production by crop in 2024.
2.3. Selection of the Study Area
The study areas selected for analysis were Naju-si and Goheung-gun in Jeollanam-do Province. According to statistical data, the rice cultivation area by province nationwide was 147,714 ha (21.2%) in Jeollanam-do, 129,786 ha (18.6%) in Chungcheongnam-do, and 104,343 ha (15.0%) in Jeonbuk State, in descending order, as shown in Table 2. Among these, Jeollanam-do, which had the largest rice cultivation area, consisted of Haenam-gun with 19,727 ha (13.35%), Yeongam-gun with 14,123 ha (9.56%), and Naju-si with 11,460 ha (7.76%), in descending order, as shown in Table 3 [21]. Although Haenam-gun had the largest rice cultivation area and rice straw production, it was excluded due to its considerable distance from the study site and relatively poor accessibility. Yeongam-gun was also excluded because small-scale farming was more prevalent than large-scale cultivation. Naju-si is a representative granary of Jeollanam-do Province, characterized by extensive plains and, in particular, a high concentration of rice cultivation. Goheung-gun has better-developed agricultural land consolidation than other regions due to large-scale reclamation projects. In addition, both regions have a relatively large number of large-scale farms compared with other areas, making them effective for research analysis and application, and they also have good accessibility from nearby cities. Accordingly, Naju-si, characterized by its extensive plains, and Goheung-gun, characterized by its large-scale reclamation projects, were selected as the respective study areas.
Table 2.
Rice cultivation area and rice straw production by province in 2024.
Table 3.
Rice cultivation area and rice straw production by city and county in Jeollanam-do (2024).
2.4. Investigation of Soil Physical Properties
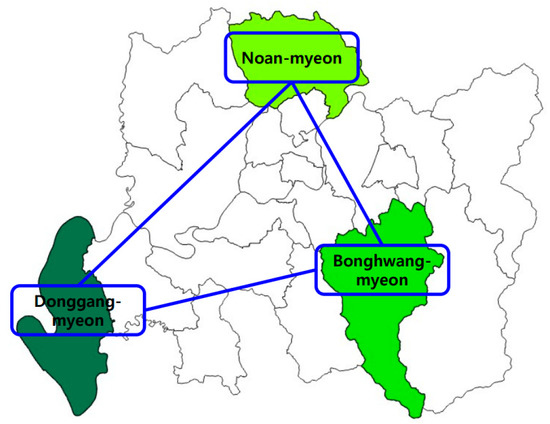
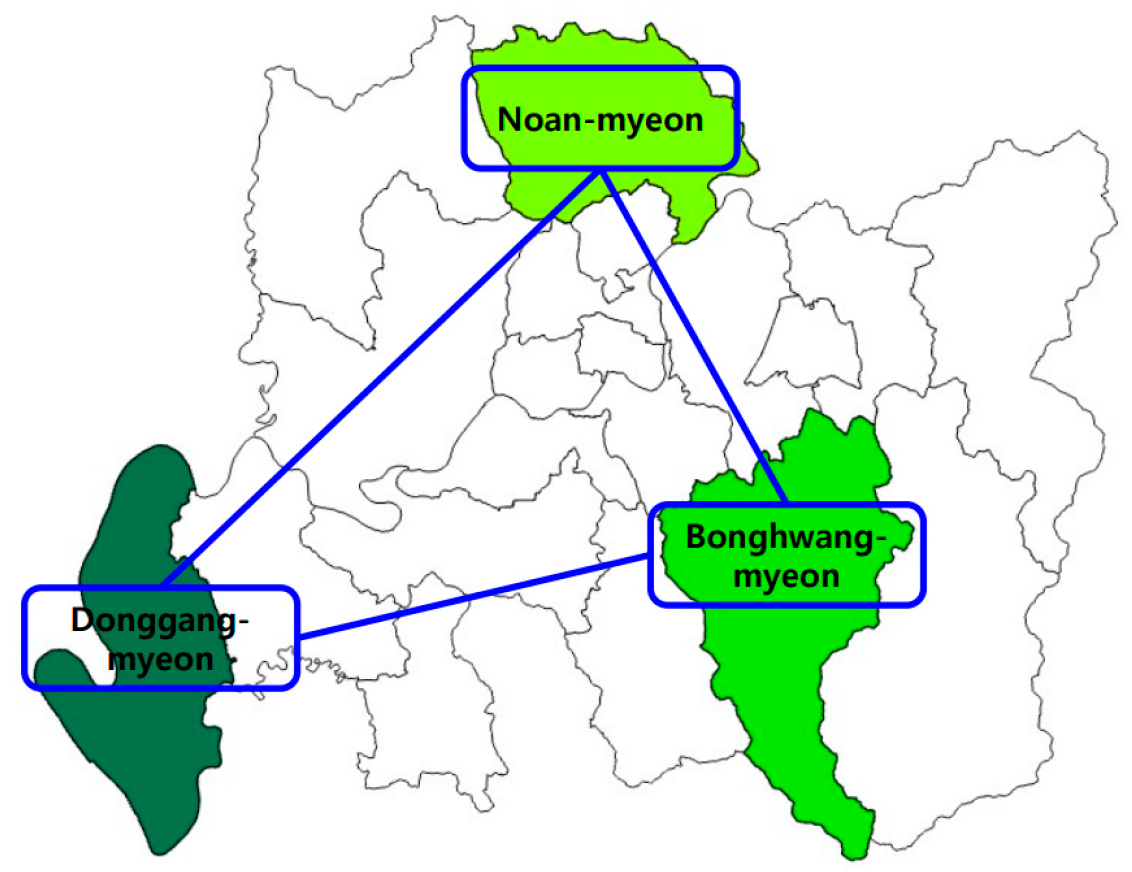
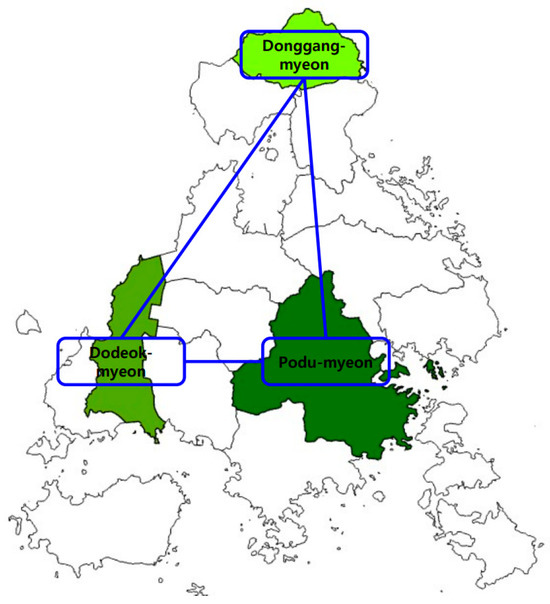
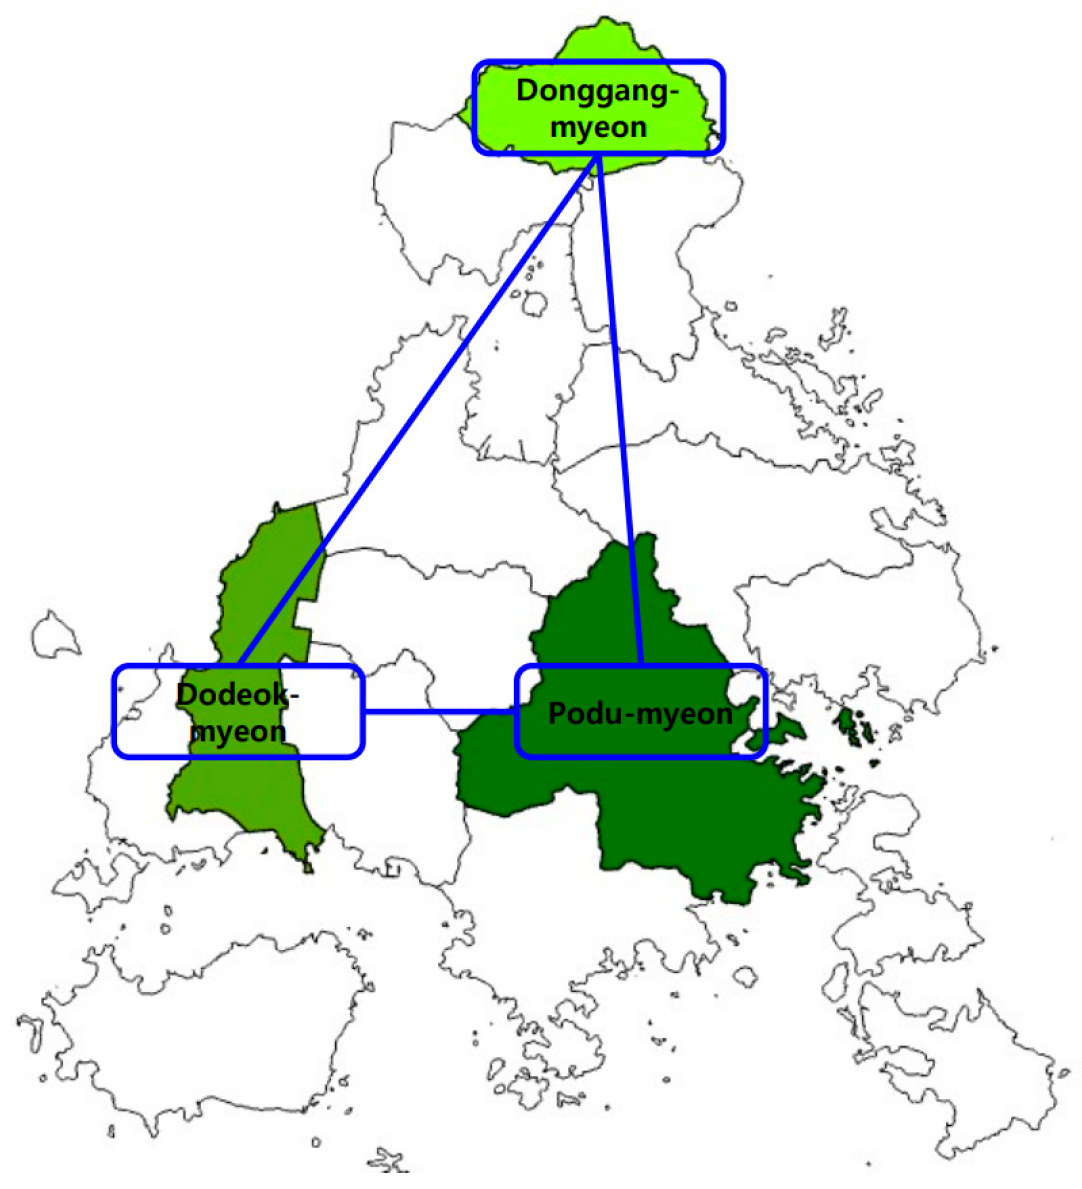
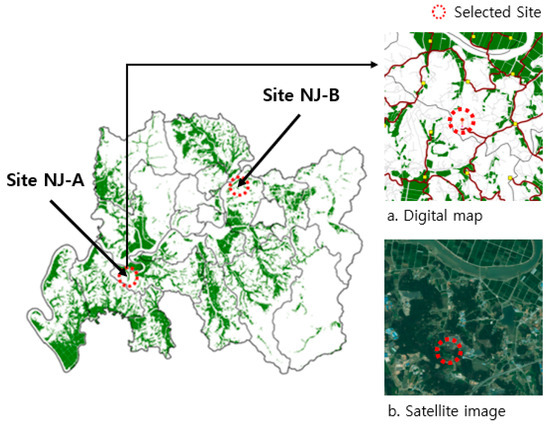
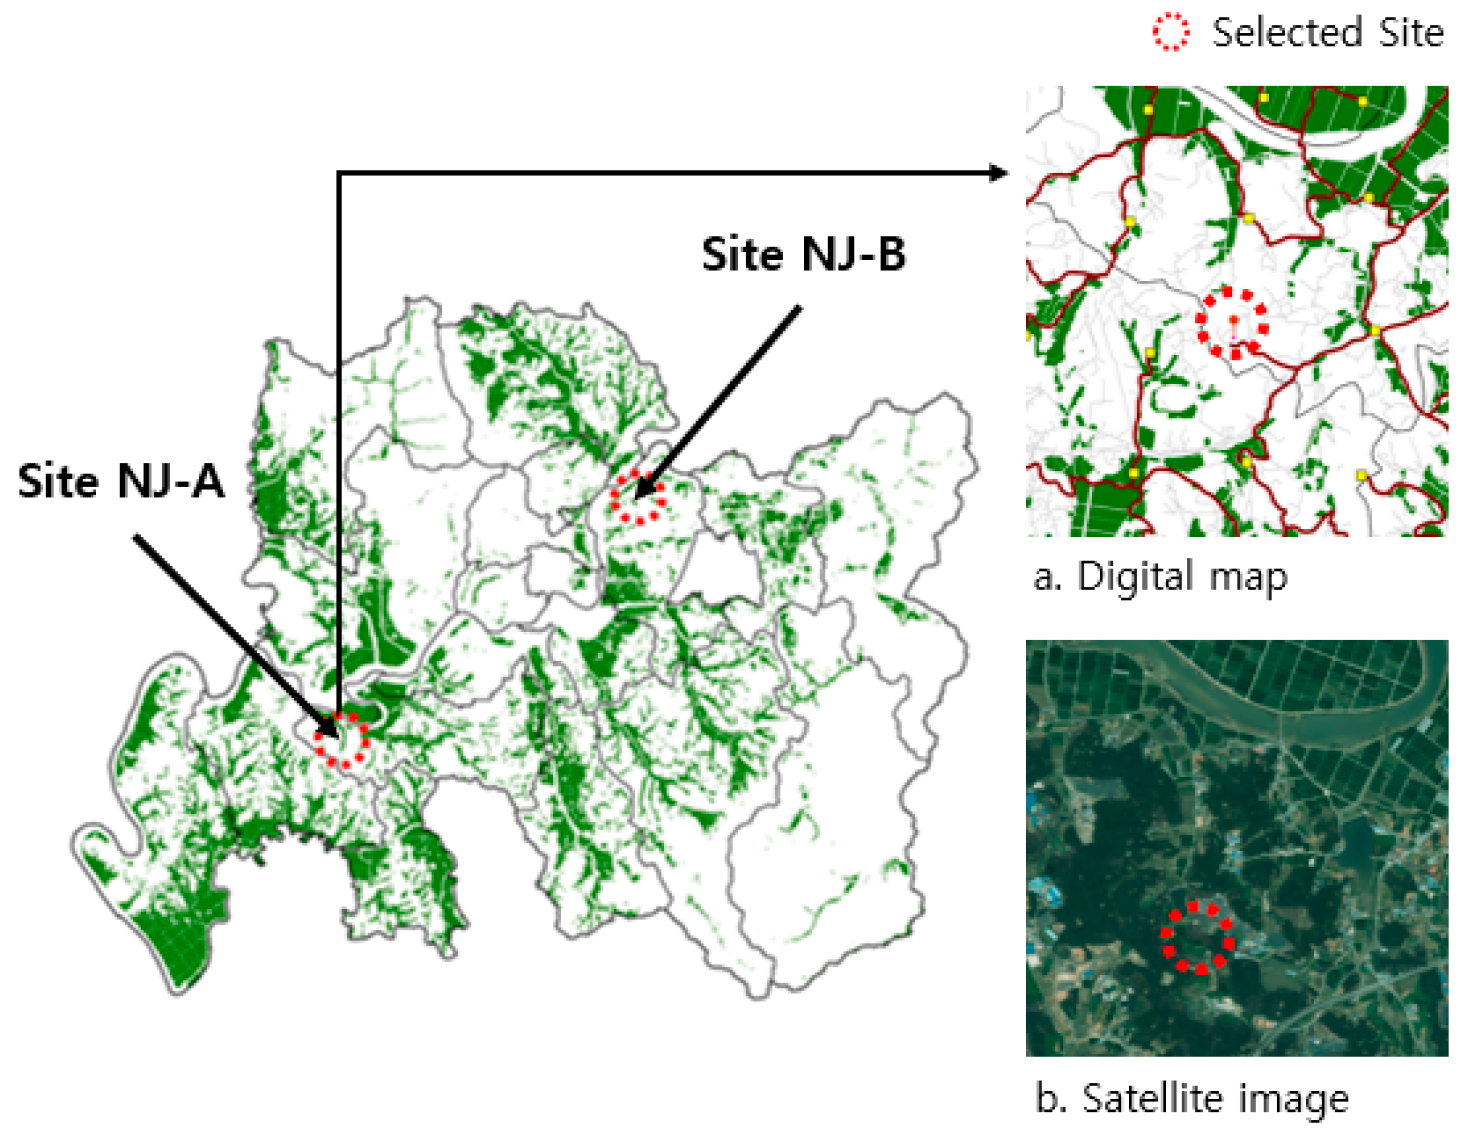
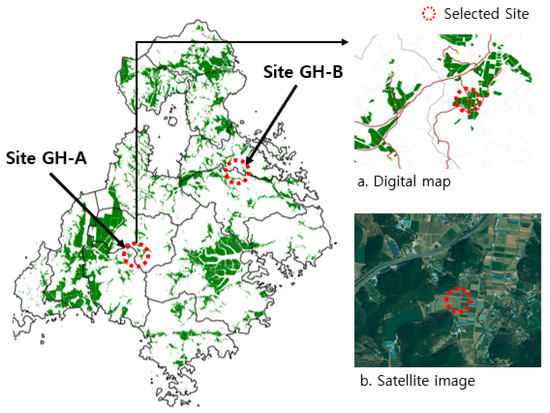
To investigate the physical properties of paddy soils and their potential relationship with rice straw production, three myeons were surveyed in each of Naju-si and Goheung-gun, resulting in a total of six survey areas. The soil properties were investigated separately from the GIS-based facility site-selection analysis to examine whether local soil characteristics were associated with rice straw production. The target areas were selected primarily based on rice cultivation area and accessibility. Based on these criteria, locations were selected so that, when the sampling sites were connected by straight lines on a map, they formed a shape as close to a triangle as possible. Accordingly, Noan-myeon, Bonghwang-myeon, and Donggang-myeon were selected in Naju-si, while Donggang-myeon, Podu-myeon, and Dodeok-myeon were selected in Goheung-gun (Figure 2 and Figure 3). The longitude and latitude of the selected locations are presented in Table 4.
Figure 2.
Sampling sites in Naju-si.
Figure 3.
Sampling sites in Goheung-gun.
Table 4.
Longitude and latitude of the sampling sites.
2.5. Sampling and Data Collection Procedures
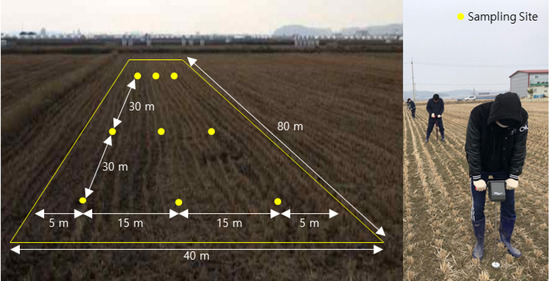
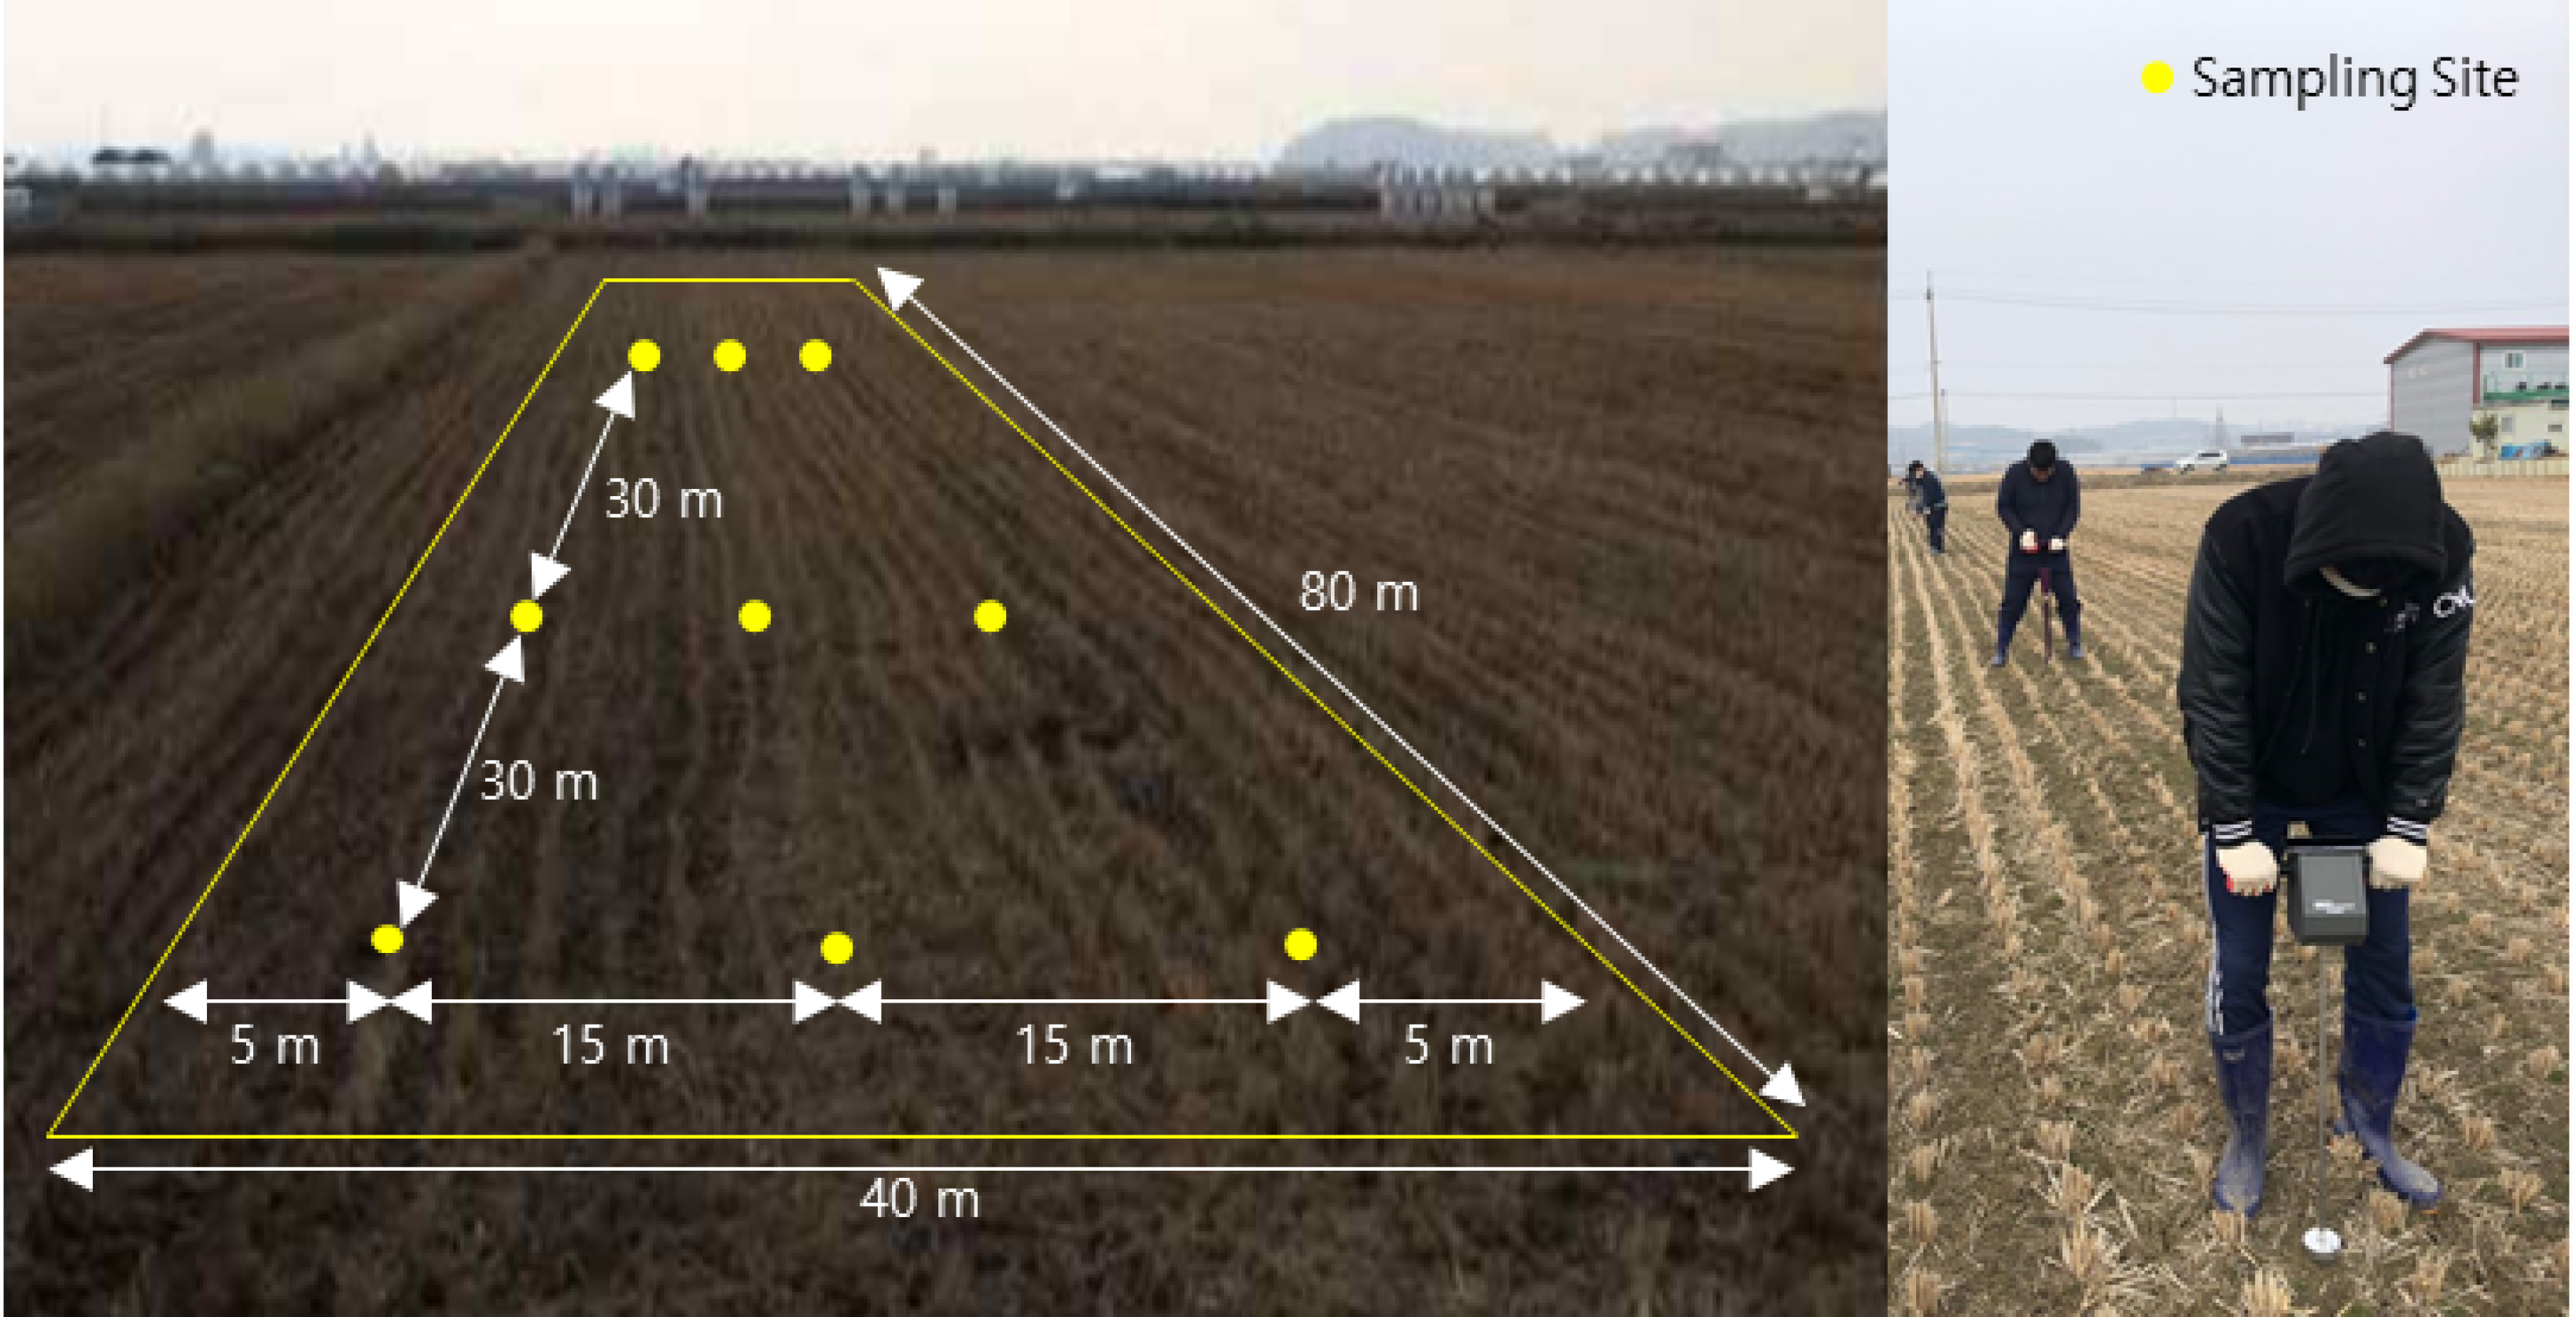
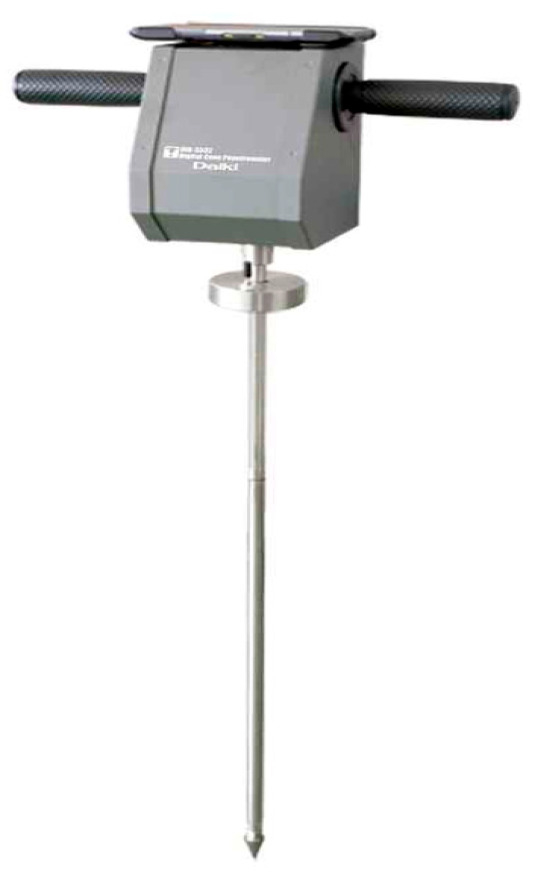
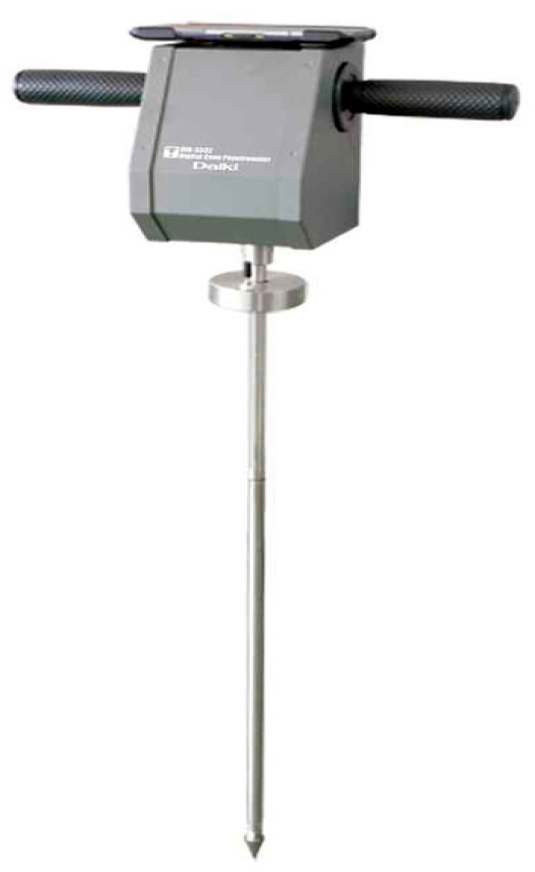
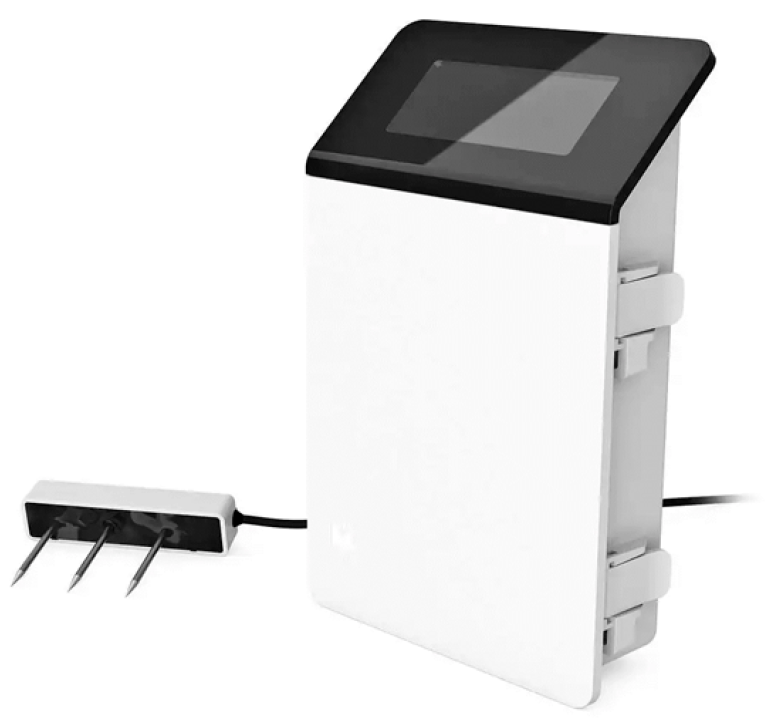
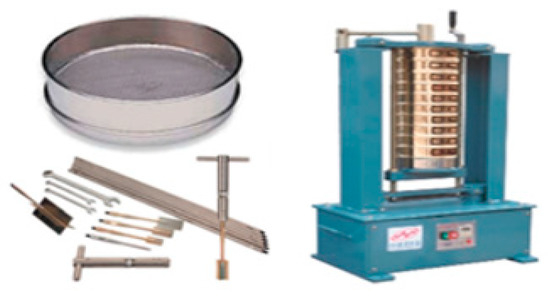
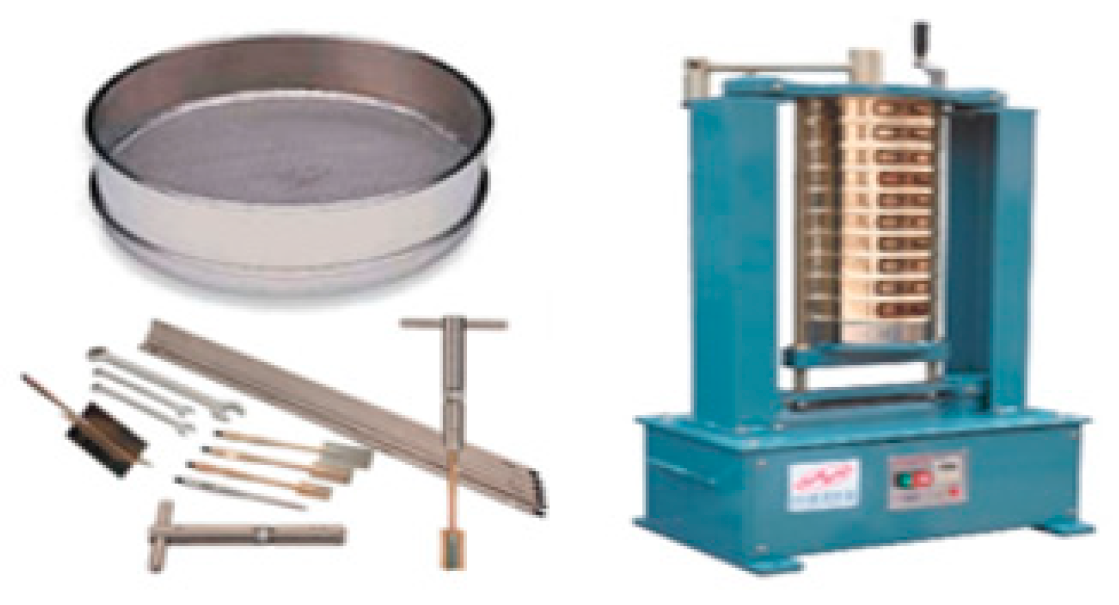
Sampling was conducted after the rice harvest, with sampling in Naju-si carried out in October 2024 and in Goheung-gun in November 2024. Within each selected myeon, nine sampling locations were selected based on the spatial distribution of the paddy fields and the accessibility of the sampling sites, and sampling was conducted three times at one-week intervals. Thus, three replicate measurements were obtained at each of the nine sampling locations in each myeon, resulting in 27 measurements per myeon and a total of 162 individual measurements across the six surveyed regions. Sampling was performed at regular intervals within an area of 3200 m2 (40 m × 80 m) at each sampling location, as shown in Figure 4. Accordingly, 27 observations were obtained from each myeon, resulting in a total of 162 observations from the six survey areas. At each sampling location, soil samples were collected and analyzed for moisture content, electrical conductivity (EC), soil strength, soil texture, and soil color. Moisture content and soil strength were measured according to the procedures shown in Figure 5, Figure 6 and Figure 7, and the specifications of the measurement equipment are presented in Table 5 and Table 6. Soil texture was determined using the Soil Texture Calculator provided by the United States Department of Agriculture (USDA), Natural Resources Conservation Service (NRCS), Washington, DC, USA [22]. The soil texture at all 54 sampling locations in Naju-si and Goheung-gun was classified as silt loam. Soil color was determined directly in the field by comparison with the Munsell Soil Color Charts.
Figure 4.
Sampling at nine sites in each myeon.
Figure 5.
Cone index.
Figure 6.
Moisture and EC sensor.
Figure 7.
Soil sampling and classification.
Table 5.
Cone index specifications.
Table 6.
Moisture and EC sensor specifications.
2.6. Statistical Analysis of Soil Characteristics and Rice Straw Production
The relationship between the physical properties of paddy soils and rice straw production was analyzed across six regions. Moisture content, electrical conductivity (EC), and soil strength were measured three times at each of nine sampling locations within each of the six surveyed regions, resulting in 162 individual measurements. For the Pearson correlation analysis, the individual measurements were averaged within each region to obtain regional mean values. Thus, the observational unit for the correlation analysis was the surveyed region (myeon), and a total of six regional observations were used. The five-year rice straw production values from 2020 to 2024 were averaged for each region to obtain a representative regional production value [21]. The regional production values were paired with the corresponding regional mean soil-property values for the Pearson correlation analysis. Pearson correlation analysis was performed to evaluate the associations between regional rice straw production and each soil property, as shown in Equation (1). In addition, a one-way analysis of variance (ANOVA) was conducted to determine whether soil physical properties differed among the six regions using the individual measurements (total n = 162; n = 27 per region), as shown in Equation (2). The ANOVA was used to compare the measured soil-property values among the six surveyed regions:
where
- SSB: Sum of squares between groups.
- SSW: Sum of squares within groups.
- k: Number of regions.
- ni: Sample size in region i.
- N: Total sample size.
- : Mean of the i-th region.
- : Overall mean.
- xij: j-th observation in the i-th region.
2.7. Statistical Analysis
2.7.1. Estimation of Production
To estimate rice straw production in Naju-si and Goheung-gun, statistical data on rice cultivation area and rice straw production were obtained from the Korean Statistical Information Service (KOSIS, Daejeon, Republic of Korea) [21], while digital map data (Version 2.0, 2024) were obtained from the National Geographic Information Institute (NGII, Suwon, Republic of Korea) through the National Land Information Platform [23]. The digital map data were processed using ArcGIS Pro 3.6.4 (Esri, Redlands, CA, USA). The digital map sheets covering the study areas were first integrated into a single analysis dataset, and the integrated areas were subsequently divided into 1 km × 1 km grid cells for spatial analysis. Rice paddy polygons within each grid cell were identified and used to calculate representative centroid locations, which were subsequently used as spatial reference points for estimating rice straw resources and analyzing transportation distances and costs. The specifications of the digital map are presented in Table 7.
Table 7.
Specifications of the digital map (Version 2.0).
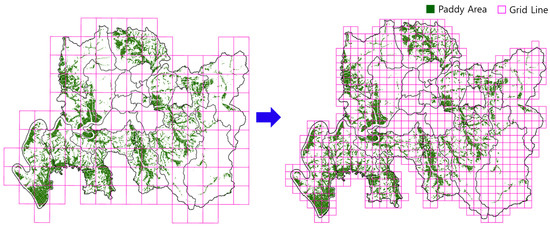
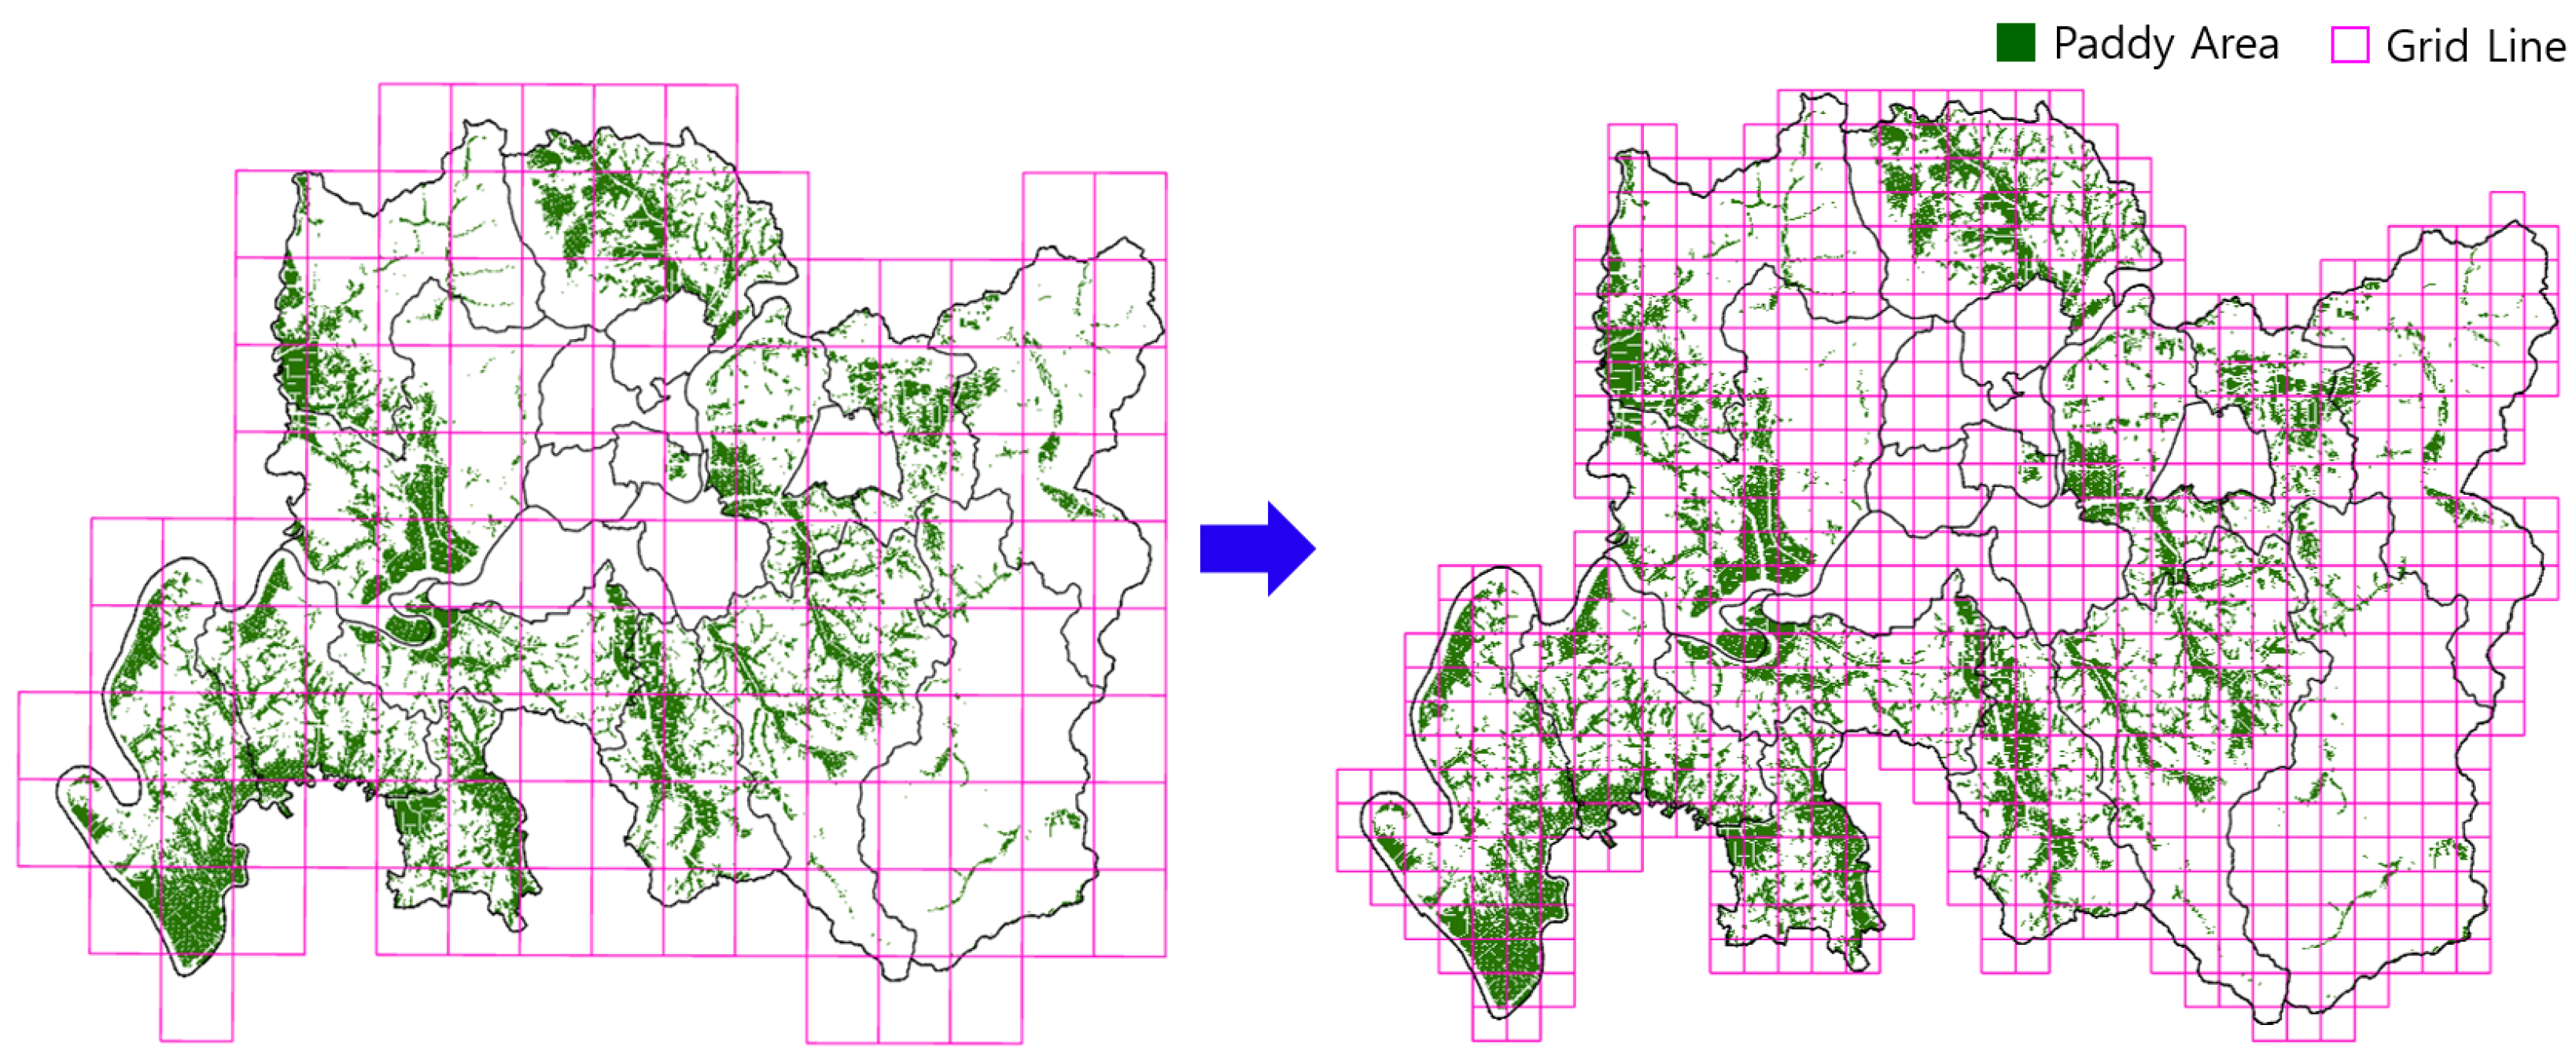
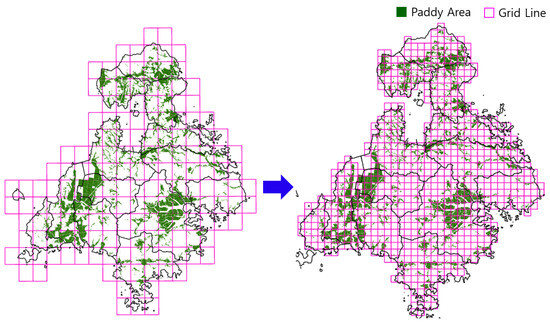
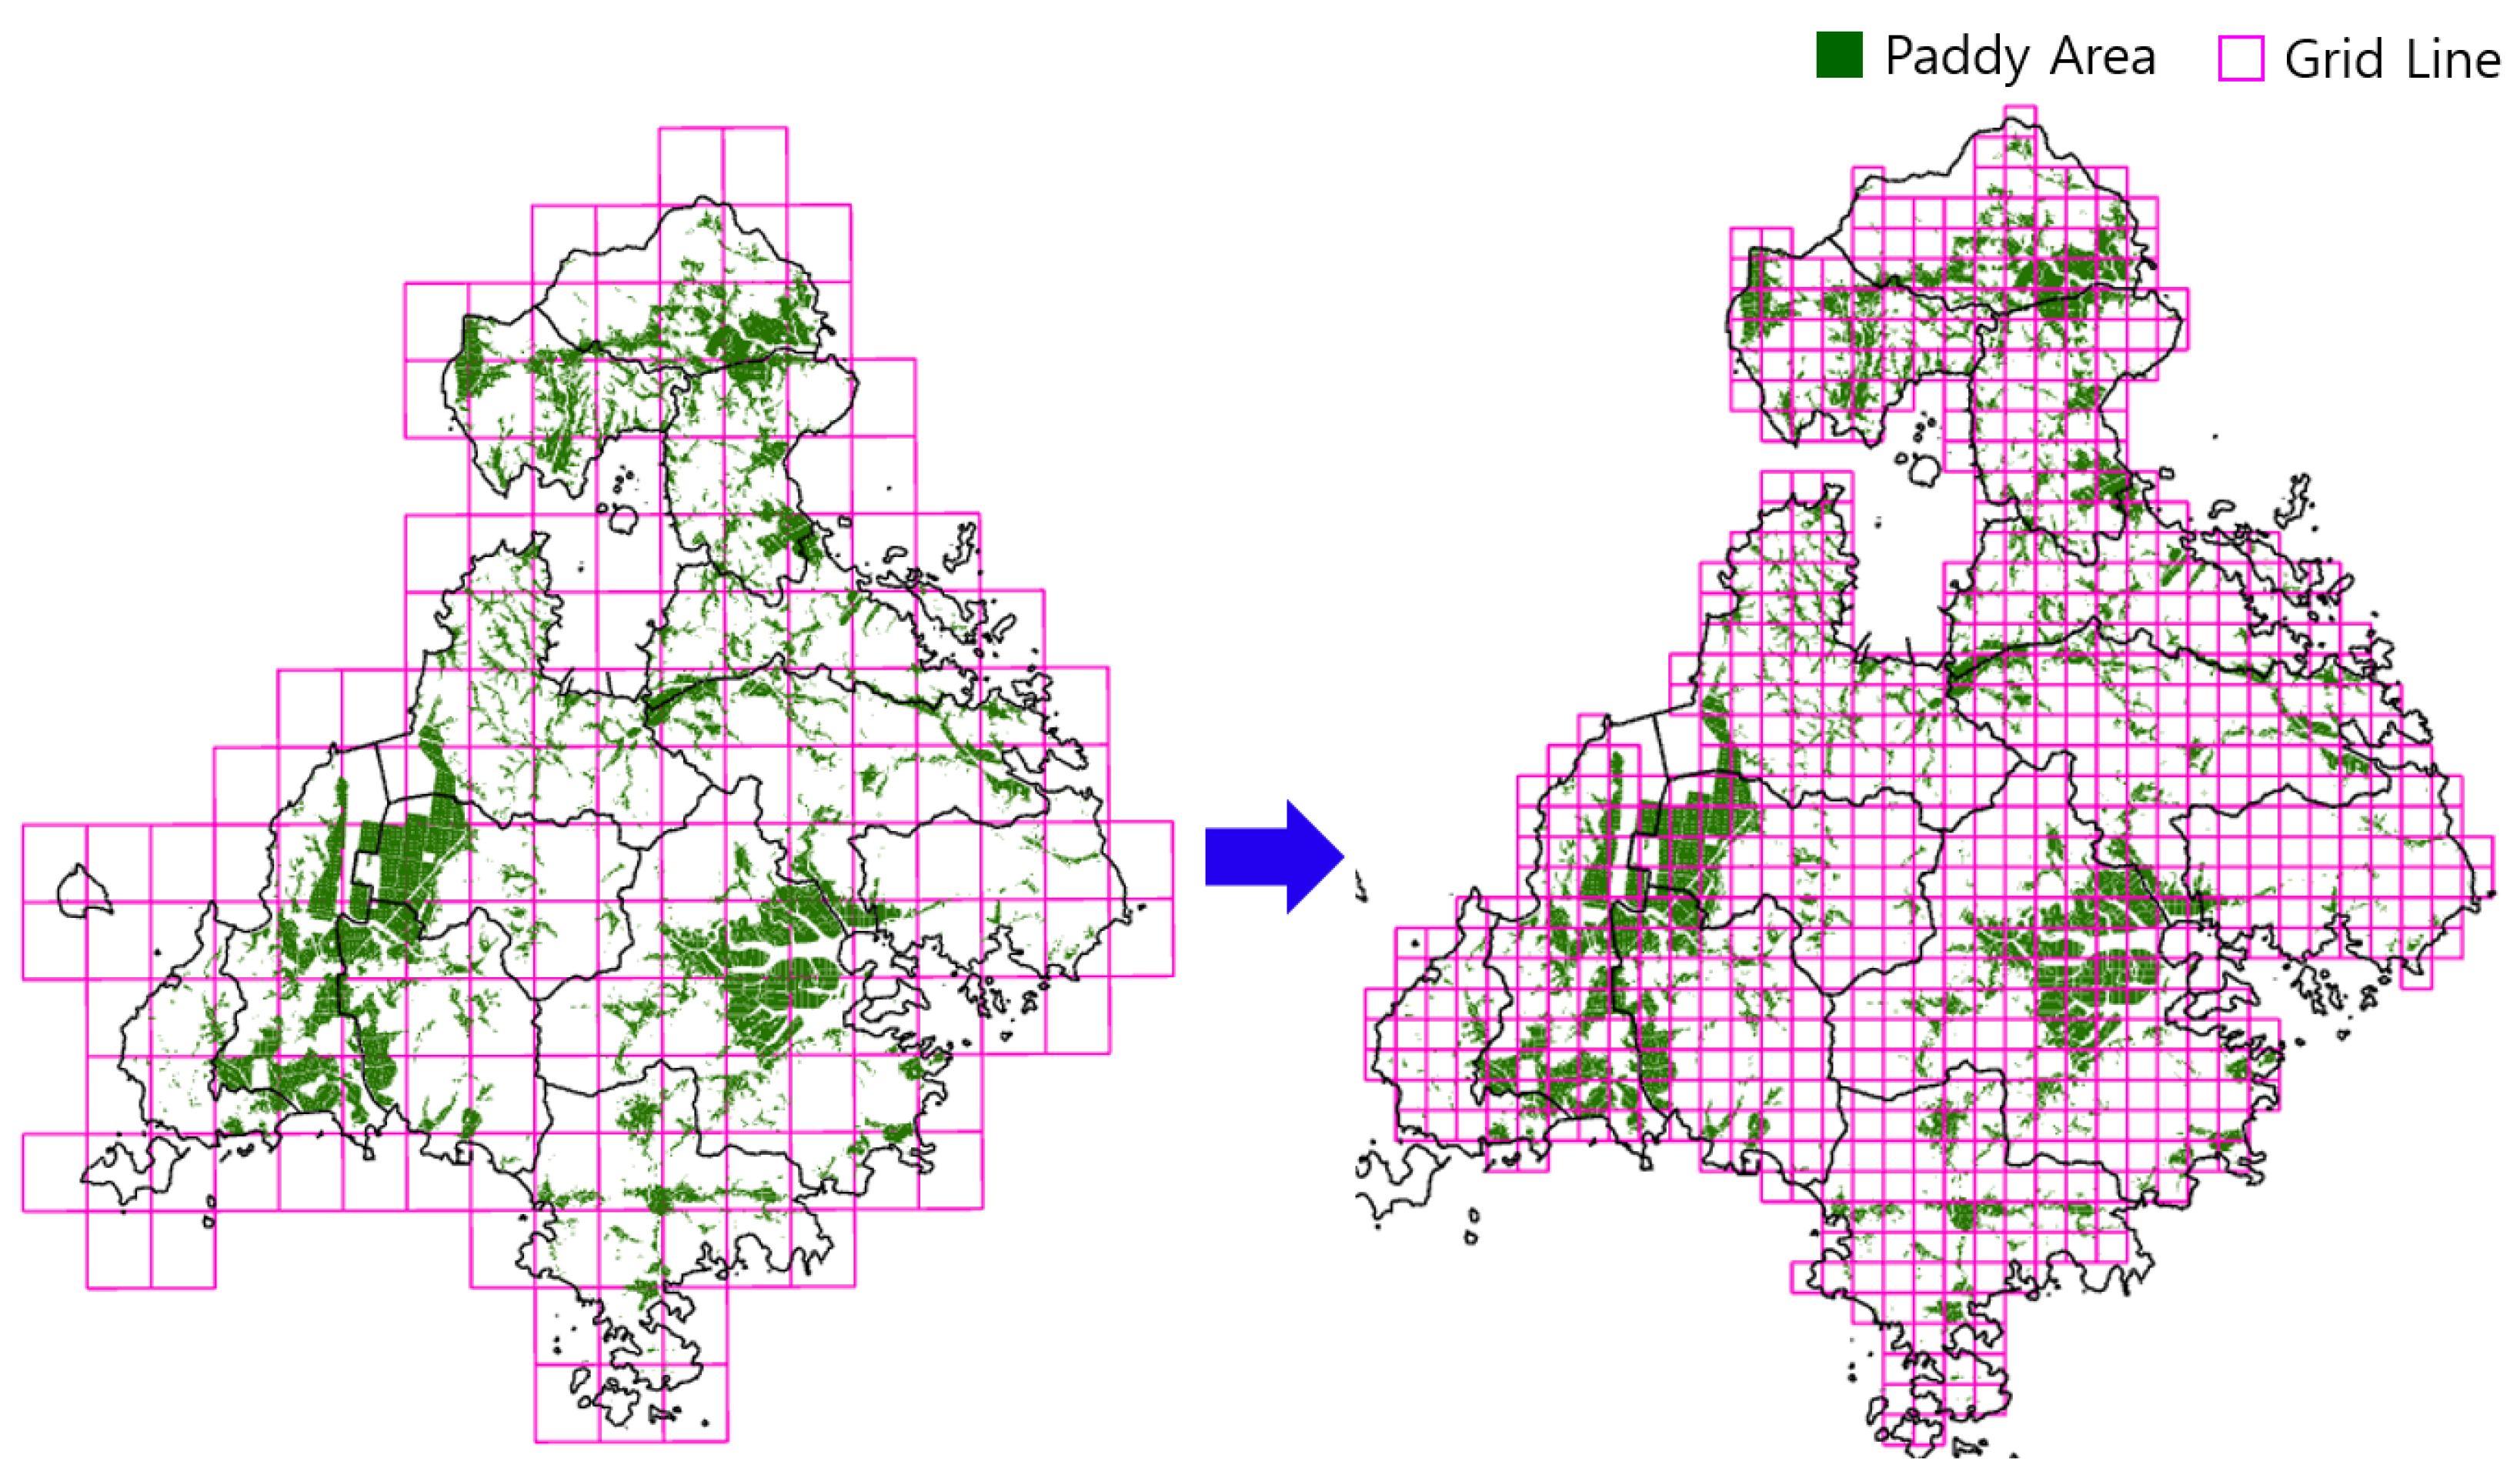
The digital map sheets (2.2 km × 2.75 km) used for the analysis of Naju-si (134 map sheets) and Goheung-gun (170 map sheets) were first merged into a single analysis area. To facilitate spatial analysis and to systematically represent the spatial distribution of rice cultivation areas, the integrated areas of Naju-si and Goheung-gun were subdivided into regular 1 km × 1 km cells. This spatial subdivision provided a consistent spatial unit for aggregating rice cultivation areas, generating representative centroid locations, and subsequently calculating road-network-based transportation distances and costs between resource supply areas and potential facility locations. Accordingly, Naju-si was subdivided into 706 cells, as shown in Figure 8, while Goheung-gun was subdivided into 1133 cells, as shown in Figure 9.
Figure 8.
Subdivision of the digital map of Naju-si.
Figure 9.
Subdivision of the digital map of Goheung-gun.
For each subdivided cell, a centroid was generated in ArcGIS based on the rice cultivation area. The centroid tool calculates the geometric center or an interior representative point of a polygon feature to generate a new point feature. The centroid was calculated based on the geometric characteristics of the input features, as shown in Equation (3):
where
- (Cx, Cy): Centroid coordinates.
- A: Polygon area.
- (xi, yi): Vertex coordinates.
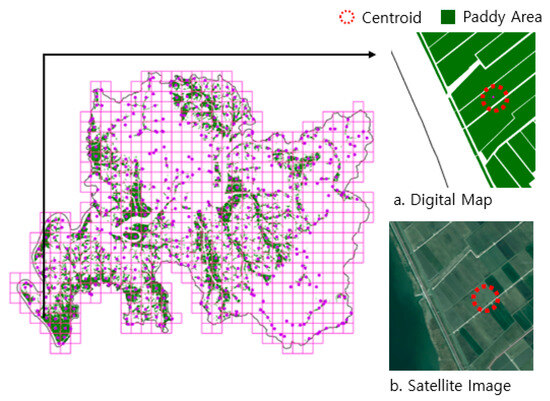
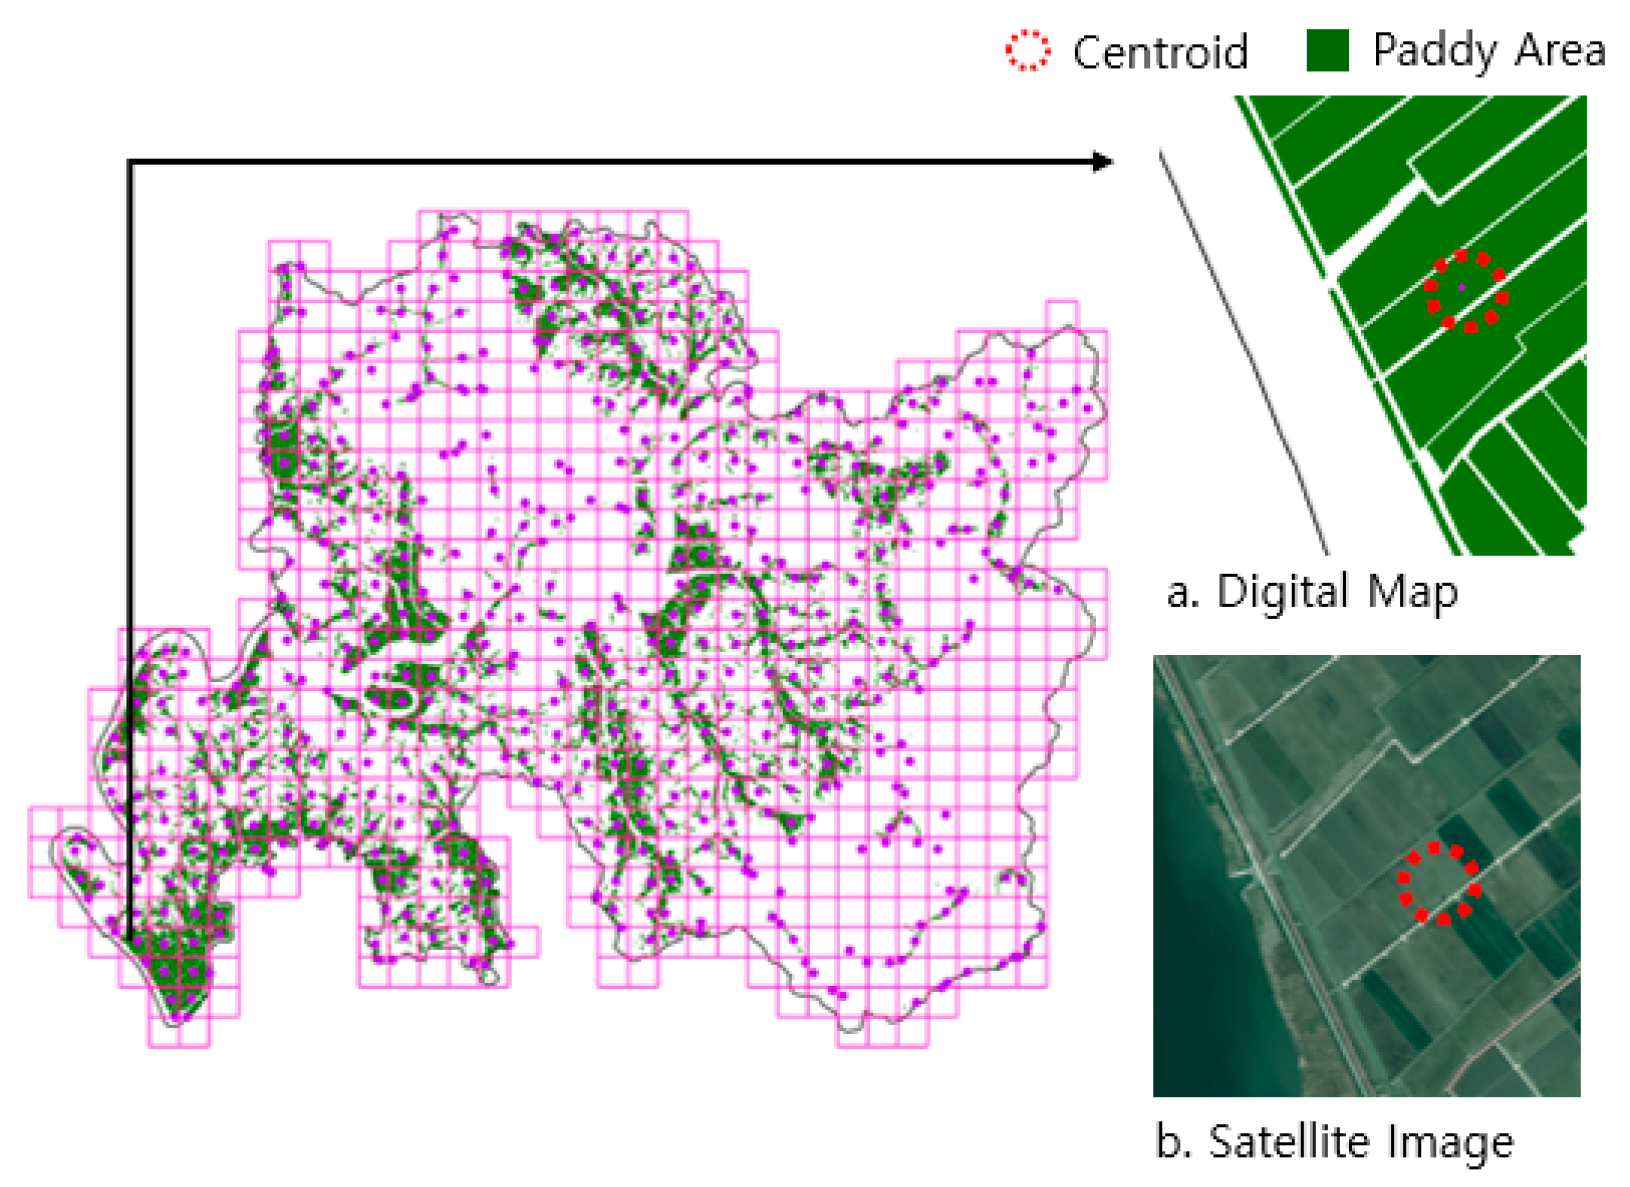
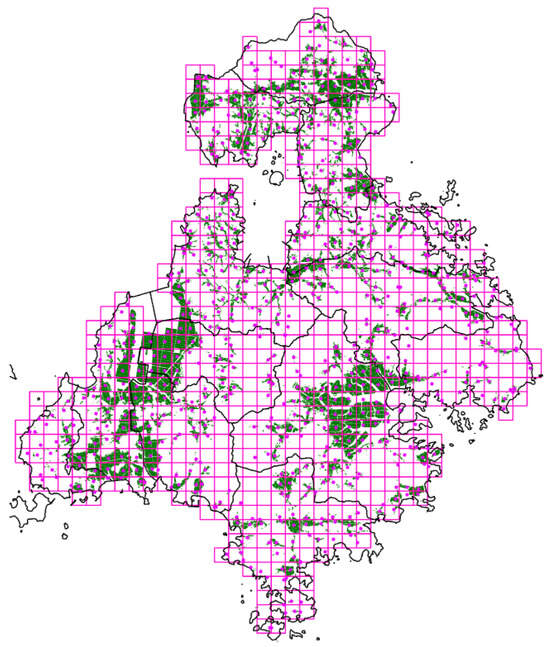
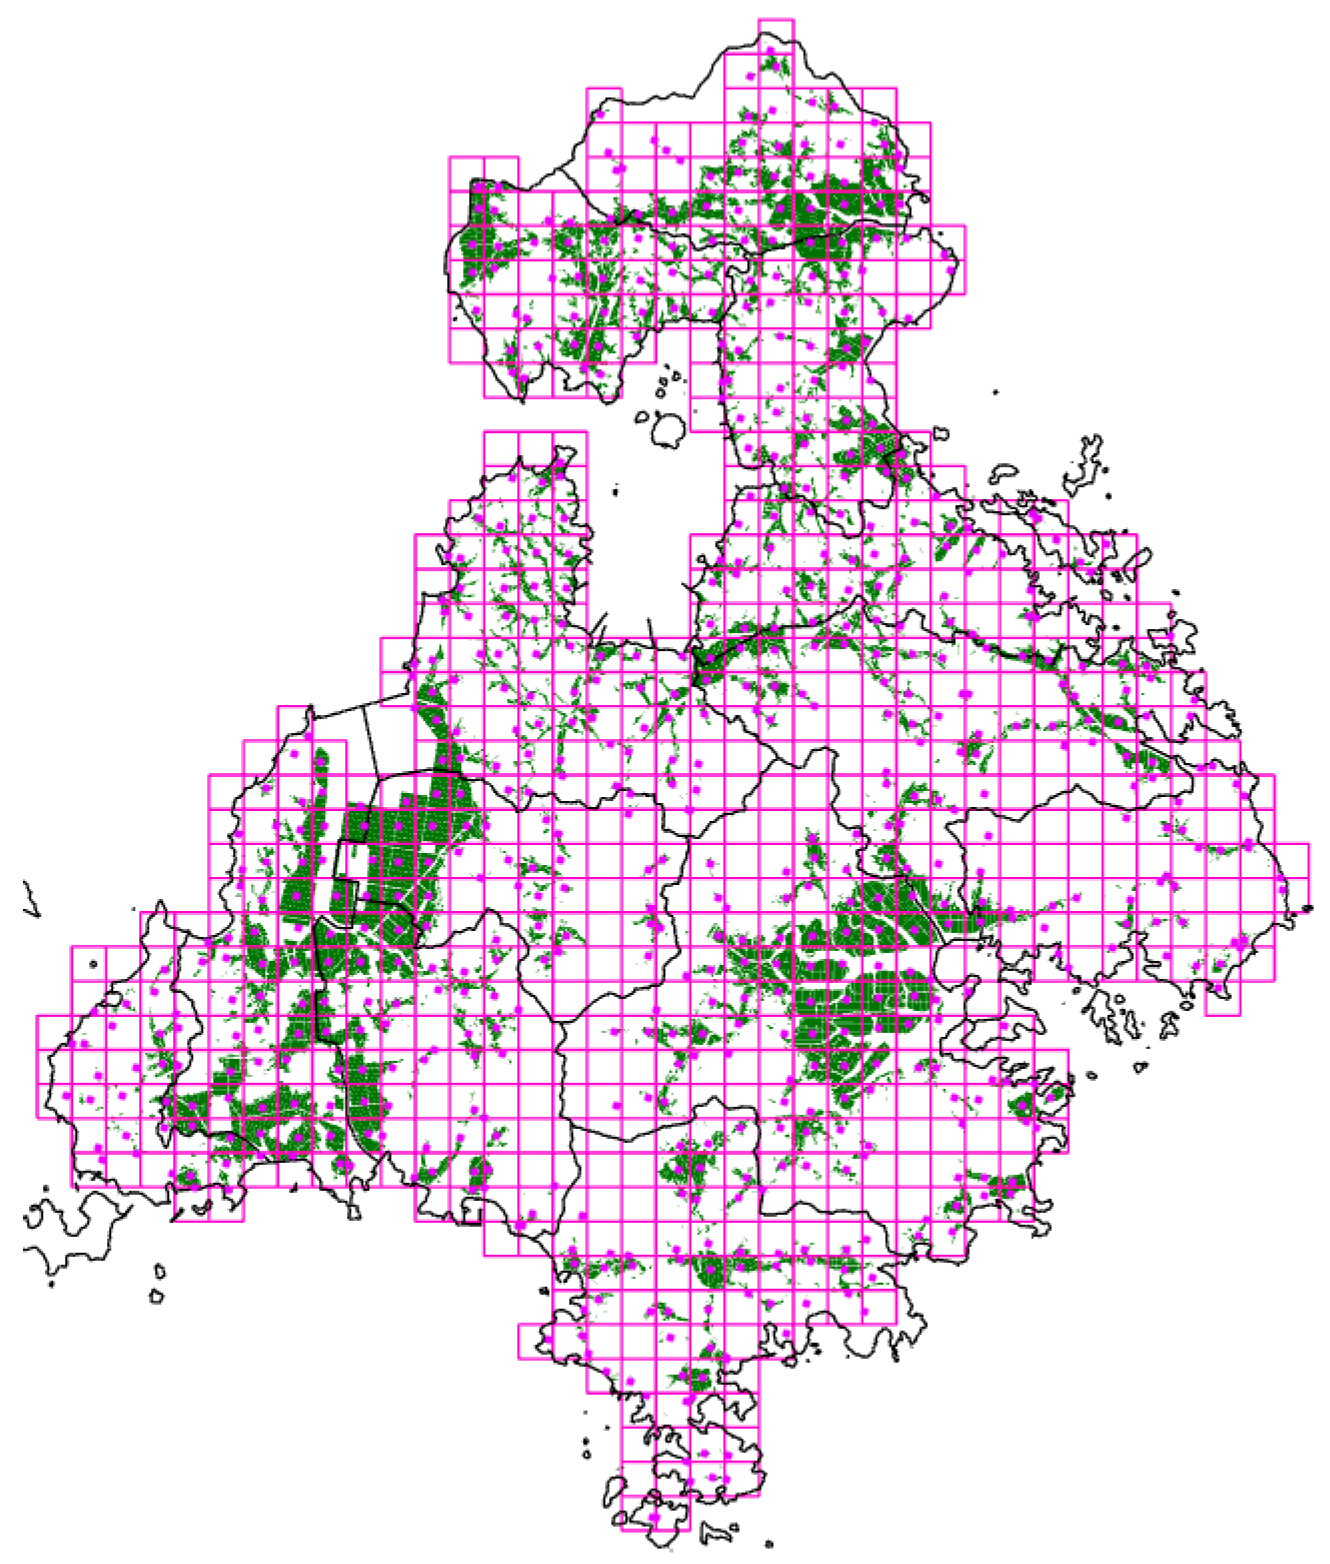
The generated centroids were assigned as the representative locations of the respective cells. To prevent centroids from being generated outside the cells, the Inside option was applied so that all centroids were located within their corresponding cells. Cells without rice paddies were excluded from the candidate sites, resulting in a total of 591 centroids being selected as candidate sites in Naju-si. As shown in Figure 10, the green areas within the 1 km × 1 km cells represent the distribution of rice paddies, while the purple circles indicate the centroids determined based on the rice cultivation area. In Goheung-gun, island areas were additionally excluded, resulting in a total of 668 centroids being selected as the initial candidate sites, as shown in Figure 11. Among the candidate sites, the cell with the lowest transportation cost for transporting rice straw from one centroid to another was selected as the optimal location for the renewable energy production facility.
Figure 10.
Rice cultivation area distribution and centroid coordinates in Naju-si.
Figure 11.
Rice cultivation area distribution and centroid coordinates in Goheung-gun.
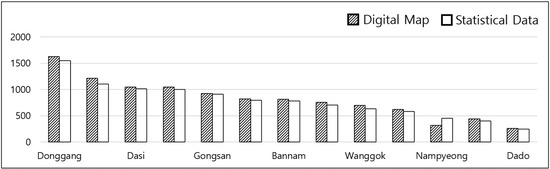
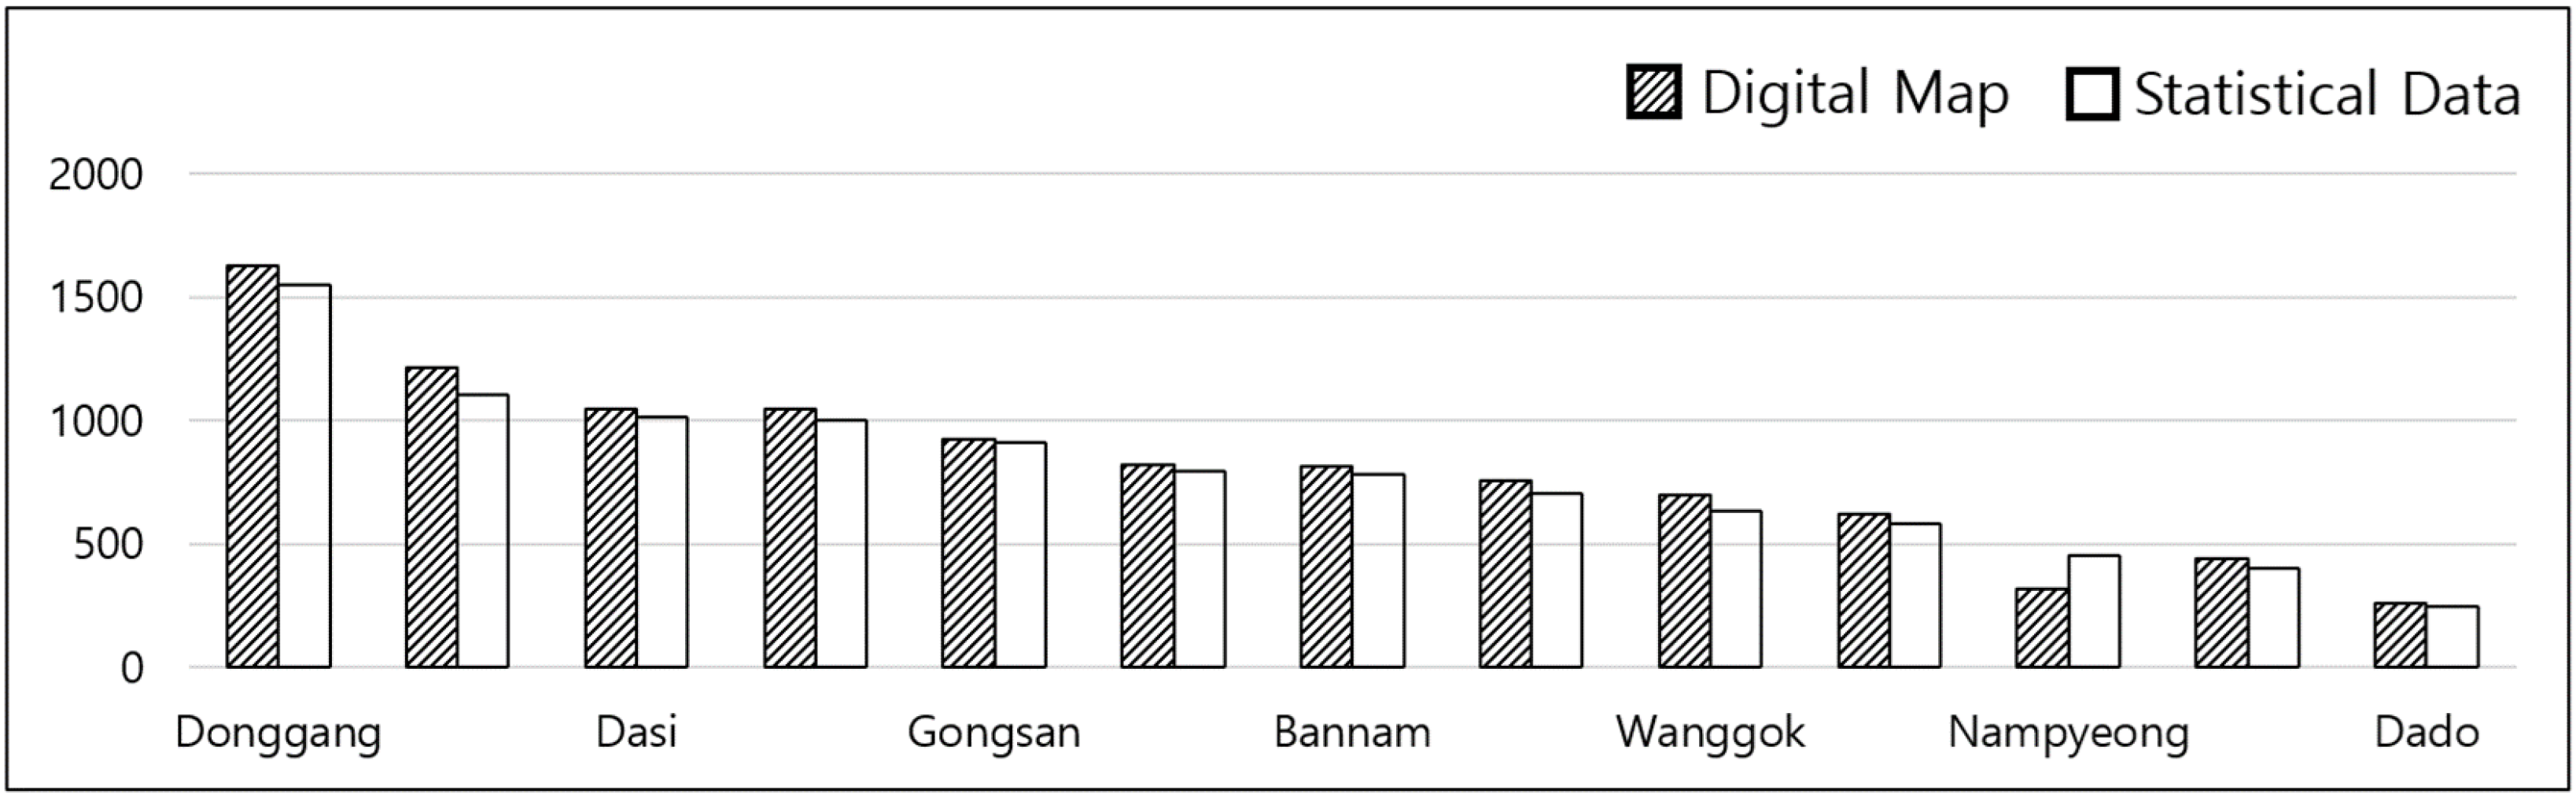
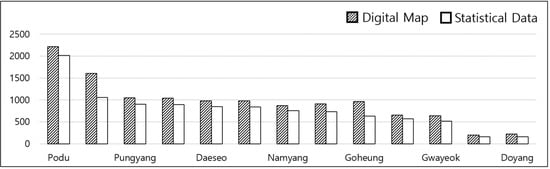
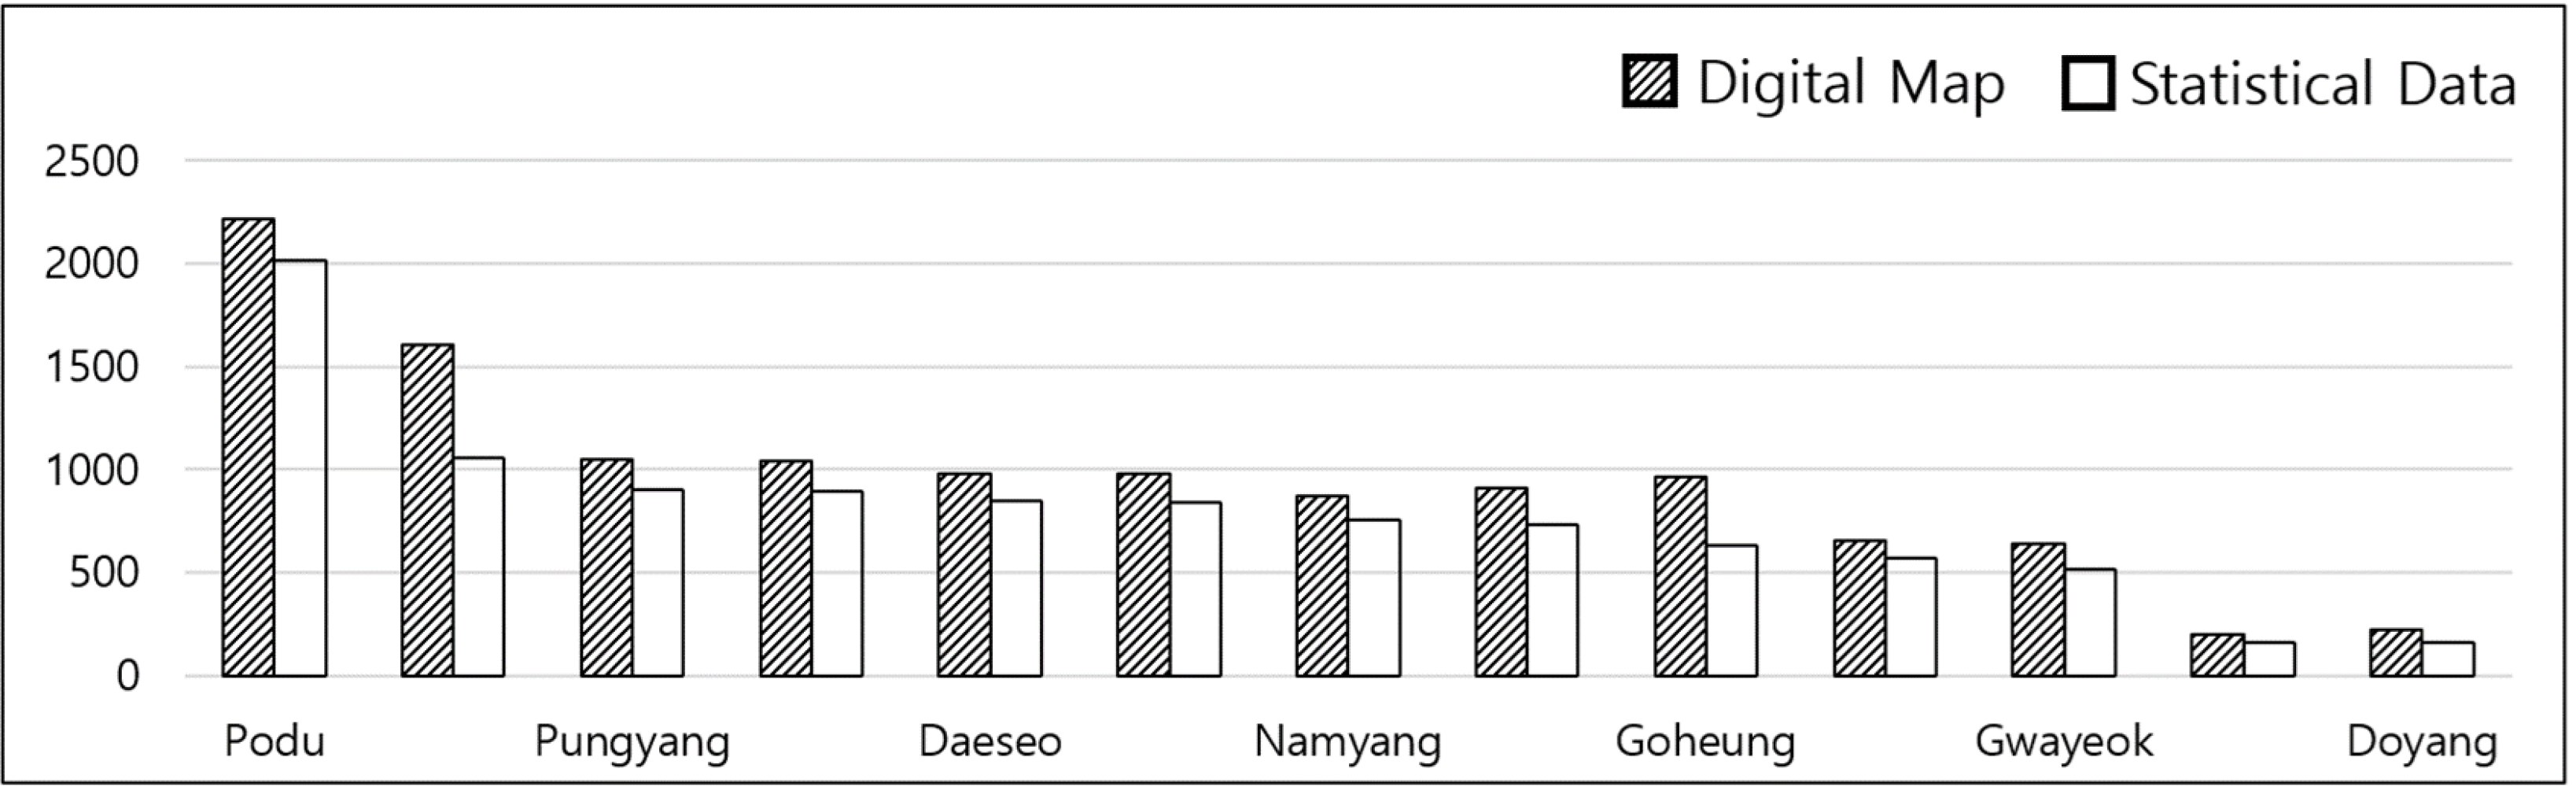
Naju-si is administratively divided into 37 eup, dong, and myeon areas (1 eup, 14 dong, and 12 myeon); however, dong areas with relatively small rice cultivation areas were excluded from the analysis, and only 13 eup and myeon areas were included. Goheung-gun is divided into 16 eup and myeon areas, of which 13 eup and myeon areas were included in the analysis after excluding three island areas. In this study, the terms “paddy field area” and “rice cultivation area” refer to different concepts. The paddy field area represents the total area classified as paddy fields in the digital map based on land-use characteristics, whereas the rice cultivation area represents the area actually used for rice cultivation according to the statistical data. Therefore, the paddy field area may include areas classified as paddy fields but used for other purposes, such as plastic greenhouses or cultivation of other crops. Because the two datasets represent different aspects of agricultural land use, their reported areas may differ. To reconcile these differences, correction factors were calculated for each eup and myeon by dividing the rice cultivation area from the statistical data by the paddy field area from the digital map. The correction factors for Naju-si ranged from 0.91 to 1.42, with a mean value of 0.96, as shown in Table 8 and Figure 12. For Goheung-gun, the correction factors ranged from 0.80 to 0.91, with a mean value of 0.82, as shown in Table 9 and Figure 13. The selected correction factors were applied to the rice paddy area of each digital map cell (1 km × 1 km) to adjust the area to be consistent with the statistical data. Rice straw production was estimated by multiplying the corrected rice cultivation area by the estimated rice straw production of 5.5 t/ha at a moisture content of 50% (wet basis). Accordingly, the total rice cultivation areas in Naju-si and Goheung-gun were estimated at 10,206 ha and 10,098 ha, respectively, corresponding to estimated rice straw production of 56,133 t and 55,539 t, respectively, on a fresh-weight basis at a moisture content of 50%.
Table 8.
Paddy field area, rice cultivation area, and correction factor by eup and myeon in Naju-si (2024) [21,24].
Figure 12.
Paddy field area, rice cultivation area, and correction factor by eup/myeon in Naju-si (2024) [21,24].
Table 9.
Paddy field area, rice cultivation area, and correction factor by eup and myeon in Goheung-gun (2024) [21,24].
Figure 13.
R Paddy field area, rice cultivation area, and correction factor by eup/myeon in Goheung-gun (2024) [21,24].
2.7.2. Estimation of Rice Straw Collection Costs
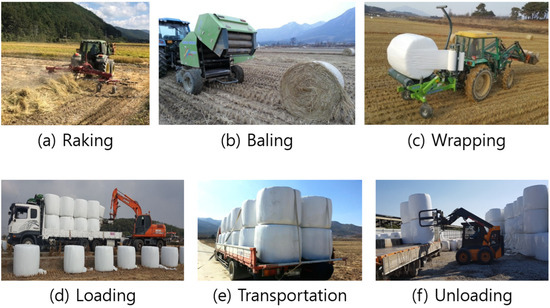
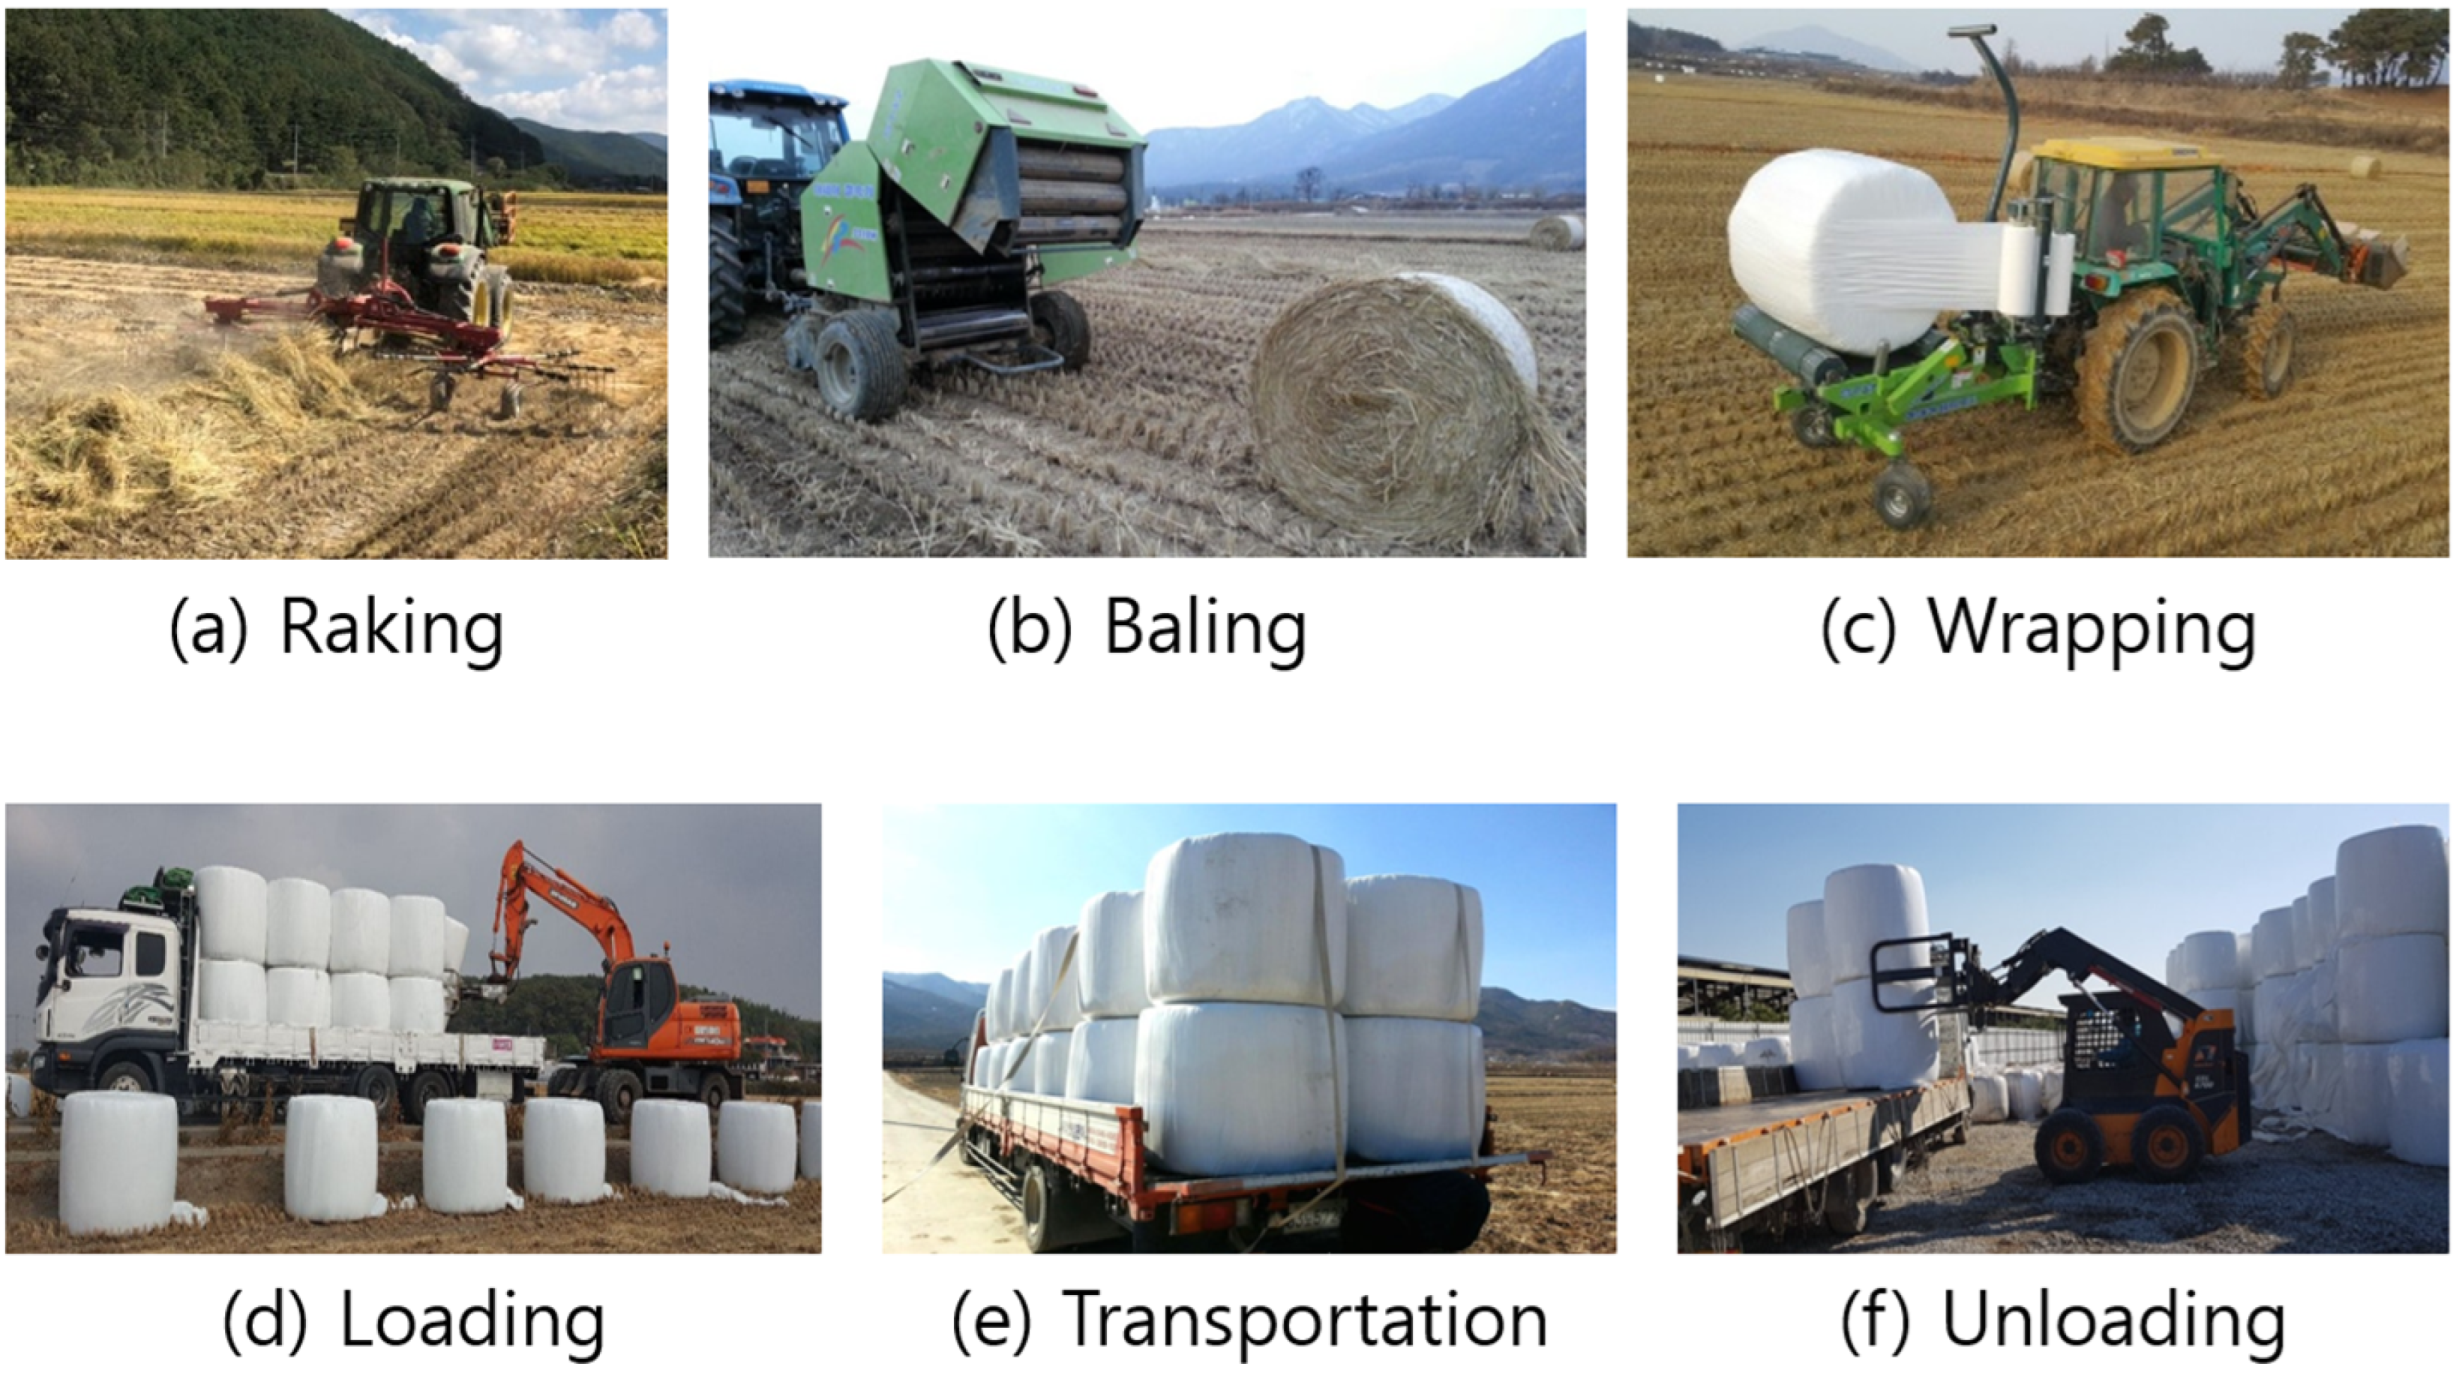
To use rice straw as a raw material for bioenergy production, the rice straw collection process consists of windrowing to collect the rice straw after harvesting rice using various types of equipment, baling to form the collected rice straw into cylindrical bales with a diameter of 1.0~1.25 m and a height of 1.0~1.4 m, wrapping to cover the bales with plastic, loading the wrapped rice straw onto a vehicle for transportation, transporting it to the destination, and unloading the rice straw after arriving at the destination, as shown in Figure 14. In this collection process, only the transportation cost per bale varies depending on the distance, while the cost per bale for the remaining processes was assumed to be constant.
Figure 14.
Rice straw collection and baling operations.
Excluding road transportation, the composition and required costs of the collection equipment were estimated based on a service area of 211 ha (6330 bales) by analyzing the field capacity, equipment prices, and operating time of each piece of equipment, and the costs required for each process were calculated using Equation (4) [20]:
where
C = FcCi + H(F + O + L)
- C: Annual cost (KRW/yr).
- Fc: Annual fixed cost ratio.
- Ci: Purchase price (KRW).
- H: Hours used per year (hr/yr).
- F: Fuel cost (KRW/hr).
- O: Lubricant cost (10% of fuel cost), (KRW/hr).
- L: Labor cost (25,000 KRW/hr), (KRW).
The collection-system configuration and bale production basis were established with reference to previous field-based research [20]. In the previous study, a service area of 211 ha was associated with the production of 6330 round bales, corresponding to approximately 30 bales/ha. In the present study, the fresh weight of a round bale was assumed to be 0.3 tons at 50% moisture content, corresponding to 0.15 tons of dry matter per bale. Thus, 6330 bales from 211 ha correspond to approximately 949.5 tons of dry rice straw, which is consistent with the approximately 950 tons reported in the previous study [20]. In addition, a field survey was conducted at Jukam Farm (Jukam Ltd., Goheung-gun, Republic of Korea) in Goheung-gun to obtain field-specific information on rice straw weight and moisture content. Rice straw and grain were separately measured after manually harvesting rice within an area of 1 m2. Based on the measured data, the moisture content of rice straw in each bale was assumed to be 50% on a wet basis. The fresh weight and dry matter weight of each bale were assumed to be 0.30 t and 0.15 t, respectively. Accordingly, all bale-number calculations were performed using the fresh biomass weight at a moisture content of 50% (0.30 t/bale), whereas the dry matter weight (0.15 t/bale) was used only to express the corresponding dry matter content. This distinction ensured consistency between the estimated biomass supply and the number of bales used in the subsequent logistics calculations. The operating times were 378 h for baling, 284 h for wrapping, 284 h for windrowing, and 95 h for transportation within the field. The collection costs were 28,471 thousand KRW for baling, 15,415 thousand KRW for wrapping, and 10,512 thousand KRW for windrowing, respectively, resulting in a total operating cost of 67,384 thousand KRW, as shown in Table 10.
Table 10.
Composition and required costs of the rice straw collection system (based on a service area of 211 ha).
The total cost, including the total cost of each operation (KRW 67,384 thousand), rice straw purchase cost (KRW 94,950 thousand), and wrapping material cost (KRW 31,650 thousand), was calculated as KRW 193,984 thousand. As shown in Table 11, when the annual service area of the collection system was set at 211 ha, the collection cost, excluding road transportation, was calculated as KRW 30,645 per bale, based on a dry weight of 0.15 tons per bale.
Table 11.
Analysis of costs excluding collection operations.
2.7.3. Site Selection Conditions for Bioenergy Production Facilities
Rice straw production in Naju-si and Goheung-gun was estimated to be 56,133 tons and 55,539 tons, respectively, on a dry-weight basis. Based on these regional resource potentials, two facility-capacity scenarios of 30,000 and 60,000 tons per year were considered for the site-selection analysis. For the 30,000 ton processing capacity scenario, the locations of the two facilities were determined sequentially to prevent the same rice straw resources from being allocated to both facilities. First, the optimal location of Facility A was identified based on the spatial distribution of available rice straw resources and the associated transportation costs. Once the location of Facility A was determined, its entire designated supply area was excluded from the candidate supply areas considered for Facility B. The optimal location of Facility B was then re-evaluated using the remaining supply areas. This sequential allocation procedure was applied to ensure that the supply areas assigned to the two facilities did not overlap and that the same biomass resources were not counted twice in the site-selection analysis. These capacities were selected to represent different scales of resource recovery facilities while considering the seasonal characteristics of rice straw collection. Rice straw is generated and collected mainly during the rice harvesting period and is generally handled in the form of large round bales. Because the bales have a relatively large volume and weight, their loading, transportation, and storage require considerable handling capacity. Therefore, the 30,000 and 60,000 ton capacities were used as alternative facility-scale scenarios to examine how facility capacity affects the spatial distribution of collection sources, transportation distances, and total logistics costs. The calculation method shown in Table 12 was used to estimate the road transportation costs required to transport rice straw from the centroid of one cell to the centroid of another cell.
Table 12.
Calculation method for rice straw transportation costs.
To improve the transparency and reproducibility of the biomass logistics calculations, a numerical example was provided for the NJ-A supply area. The supply area was 5529.5 ha, and the estimated rice straw production at a moisture content of 50% was 5.5 t/ha on the basis used for bale collection. Accordingly, the estimated biomass quantity was calculated as 5529.5 ha × 5.5 t/ha = 30,412.25 t. Given an assumed bale weight of 0.30 t at the same moisture content, the number of bales was calculated as 30,412.25 t ÷ 0.30 t/bale, yielding approximately 101,374 bales. The same calculation procedure was applied to each candidate supply area. The resulting bale numbers were then used to estimate the number of transportation trips and the associated transportation, fuel, labor, and logistics costs.
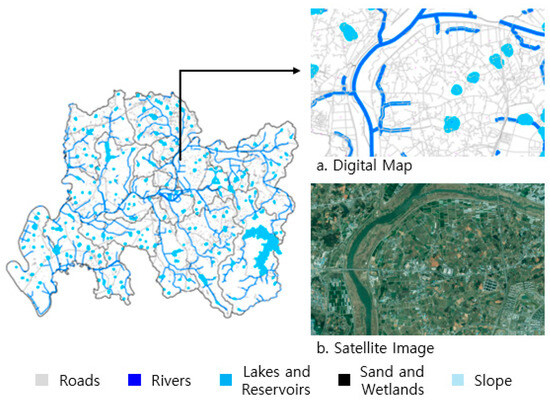
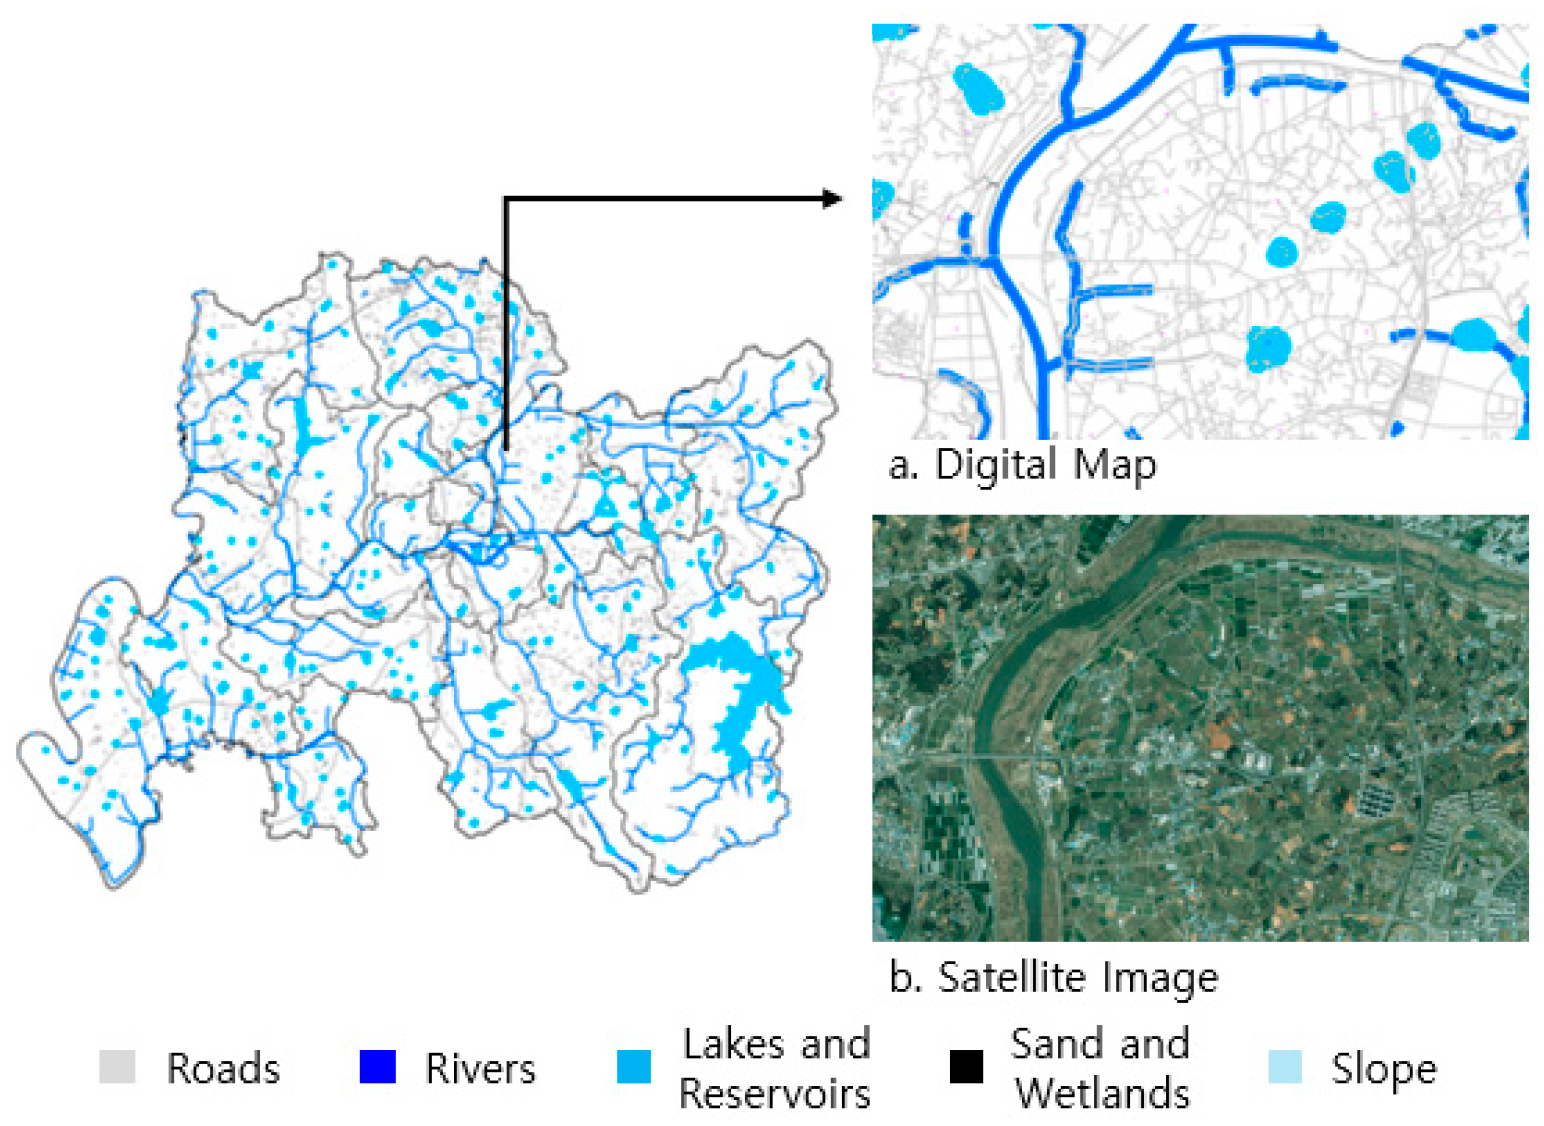
In addition, areas where facility construction would be difficult or inappropriate, including roads, rivers, lakes/reservoirs, wetlands, and steep-slope areas, were excluded from the facility candidate sites. The separation distances and slope criteria were established based on the biomass facility siting criteria reported in previous GIS-based biomass logistics research [24]. Specifically, separation distances of 30 m from roads, 50 m from rivers, and 100 m from lakes/reservoirs were applied, together with the specified slope criterion. The exclusion criteria applied to define spatially restricted areas are summarized in Table 13. These criteria were used to define spatially restricted areas rather than to represent regulatory requirements, and candidate sites overlapping these restricted areas were excluded from further analysis.
Table 13.
Criteria for defining restricted areas.
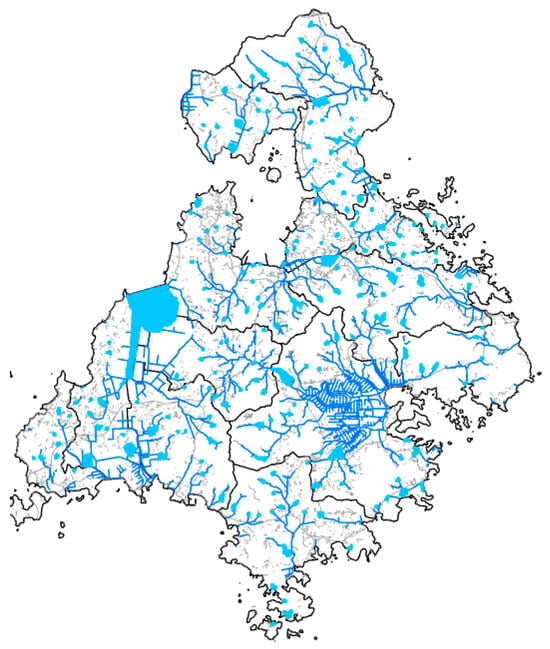
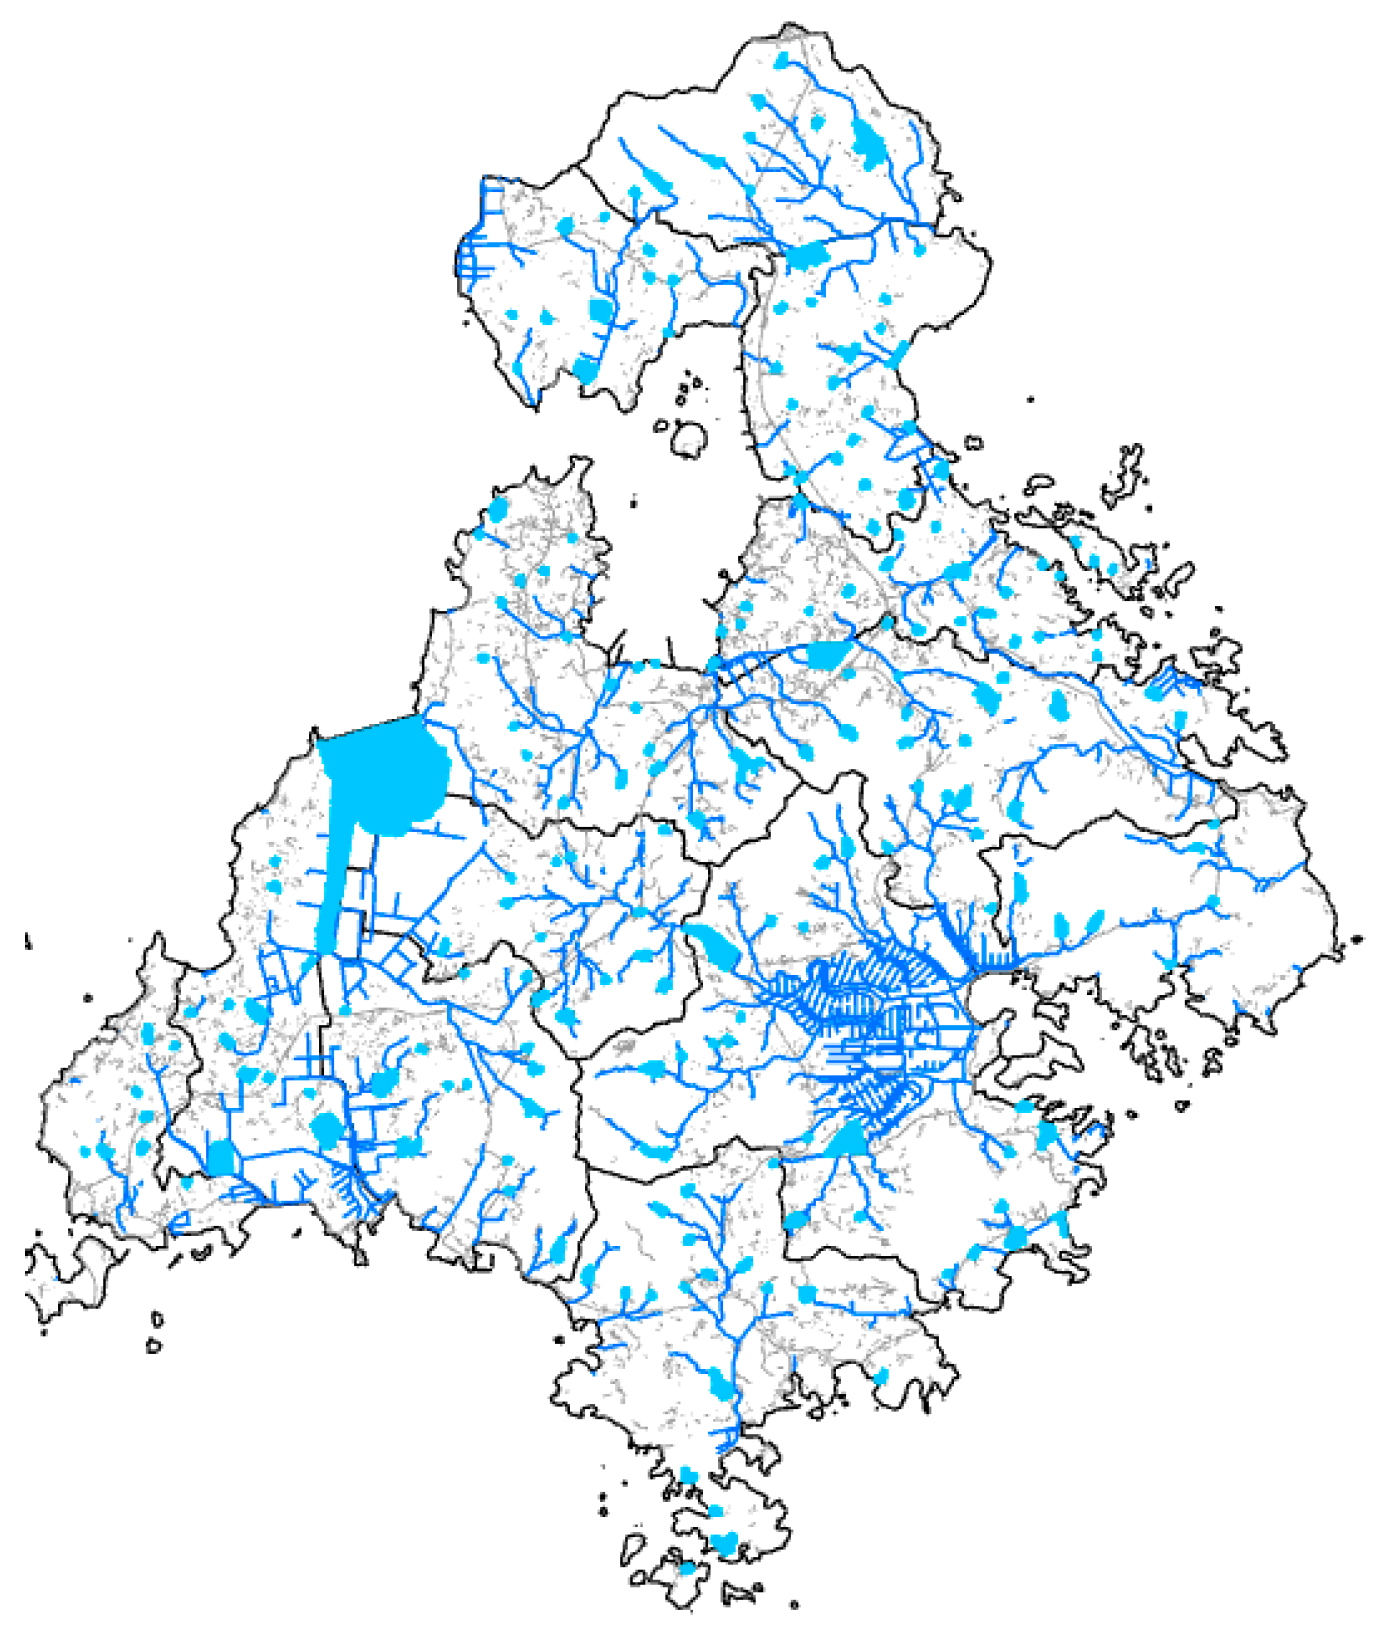
ArcGIS uses a spatial analysis technique that generates an area expanded by a specified distance from the input features. For line features such as roads and rivers, the area is generated by extending the specified distance equally on both sides of the line, while for polygon features such as lakes and wetlands, a new area is generated by extending the specified distance from the outer boundary. Of the 591 candidate sites in Naju-si, 449 were included in the restricted areas, and therefore, the bioenergy production facility site selection analysis was conducted for a total of 142 candidate sites, as shown in Figure 15. In Goheung-gun, 509 of the 668 candidate sites were included in the restricted areas, and therefore, the bioenergy production facility site selection analysis was conducted for a total of 159 candidate sites, as shown in Figure 16. To calculate the travel distance, the shortest travel distance between centroids was calculated using ArcGIS. When calculating the travel distance, the shortest distance from the centroid of the reference cell to another centroid was calculated along the road network of the digital map, and the calculation was performed using the equation shown in Equation (5).
where
Figure 15.
Restricted areas for facility location in Naju-si.
Figure 16.
Restricted areas for facility location in Goheung-gun.
- Dij: Distance from origin i to destination j (shortest path).
- Wk: Length of road segment k.
- n: Number of road segments in the route.
- k: Index of road segments (1, 2, 3, …, n).
3. Results
3.1. Physical Properties of Soil
The moisture content, electrical conductivity, soil strength, soil color, and soil texture were analyzed for the collected soil samples from Naju-si and Goheung-gun. As described in Section 2.4 and Section 2.5, soil properties were measured at nine sampling locations in each of the six surveyed myeons, with three repeated measurements at each location. Thus, 27 measurements were obtained from each myeon, resulting in a total of 162 individual measurements. The regional mean values are presented in Table 14 and Table 15. However, since the results did not differ significantly, the results are presented as mean values. The moisture contents were 31.1% in Noan-myeon, 30.9% in Bonghwang-myeon, and 31.5% in Donggang-myeon in Naju-si, and 31.6% in Donggang-myeon, 31.8% in Podu-myeon, and 31.5% in Dodeok-myeon in Goheung-gun. The electrical conductivities were 0.77 dS/m in Noan-myeon, 0.78 dS/m in Bonghwang-myeon, and 0.78 dS/m in Donggang-myeon in Naju-si, and 0.80 dS/m in Donggang-myeon, 0.80 dS/m in Podu-myeon, and 0.80 dS/m in Dodeok-myeon in Goheung-gun. The soil strengths were 1.142 MPa in Noan-myeon, 1.145 MPa in Bonghwang-myeon, and 1.095 MPa in Donggang-myeon in Naju-si, and 1.131 MPa in Donggang-myeon, 1.118 MPa in Podu-myeon, and 1.141 MPa in Dodeok-myeon in Goheung-gun.
Table 14.
Mean soil physical properties in Naju-si.
Table 15.
Mean soil physical properties in Goheung-gun.
3.2. Results of the Analysis of Soil Physical Properties and Rice Straw Production
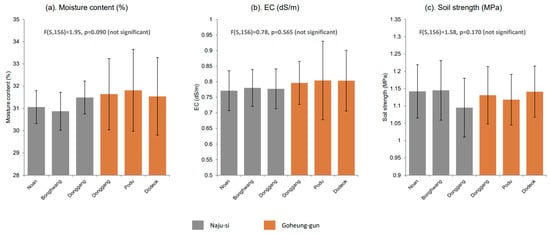
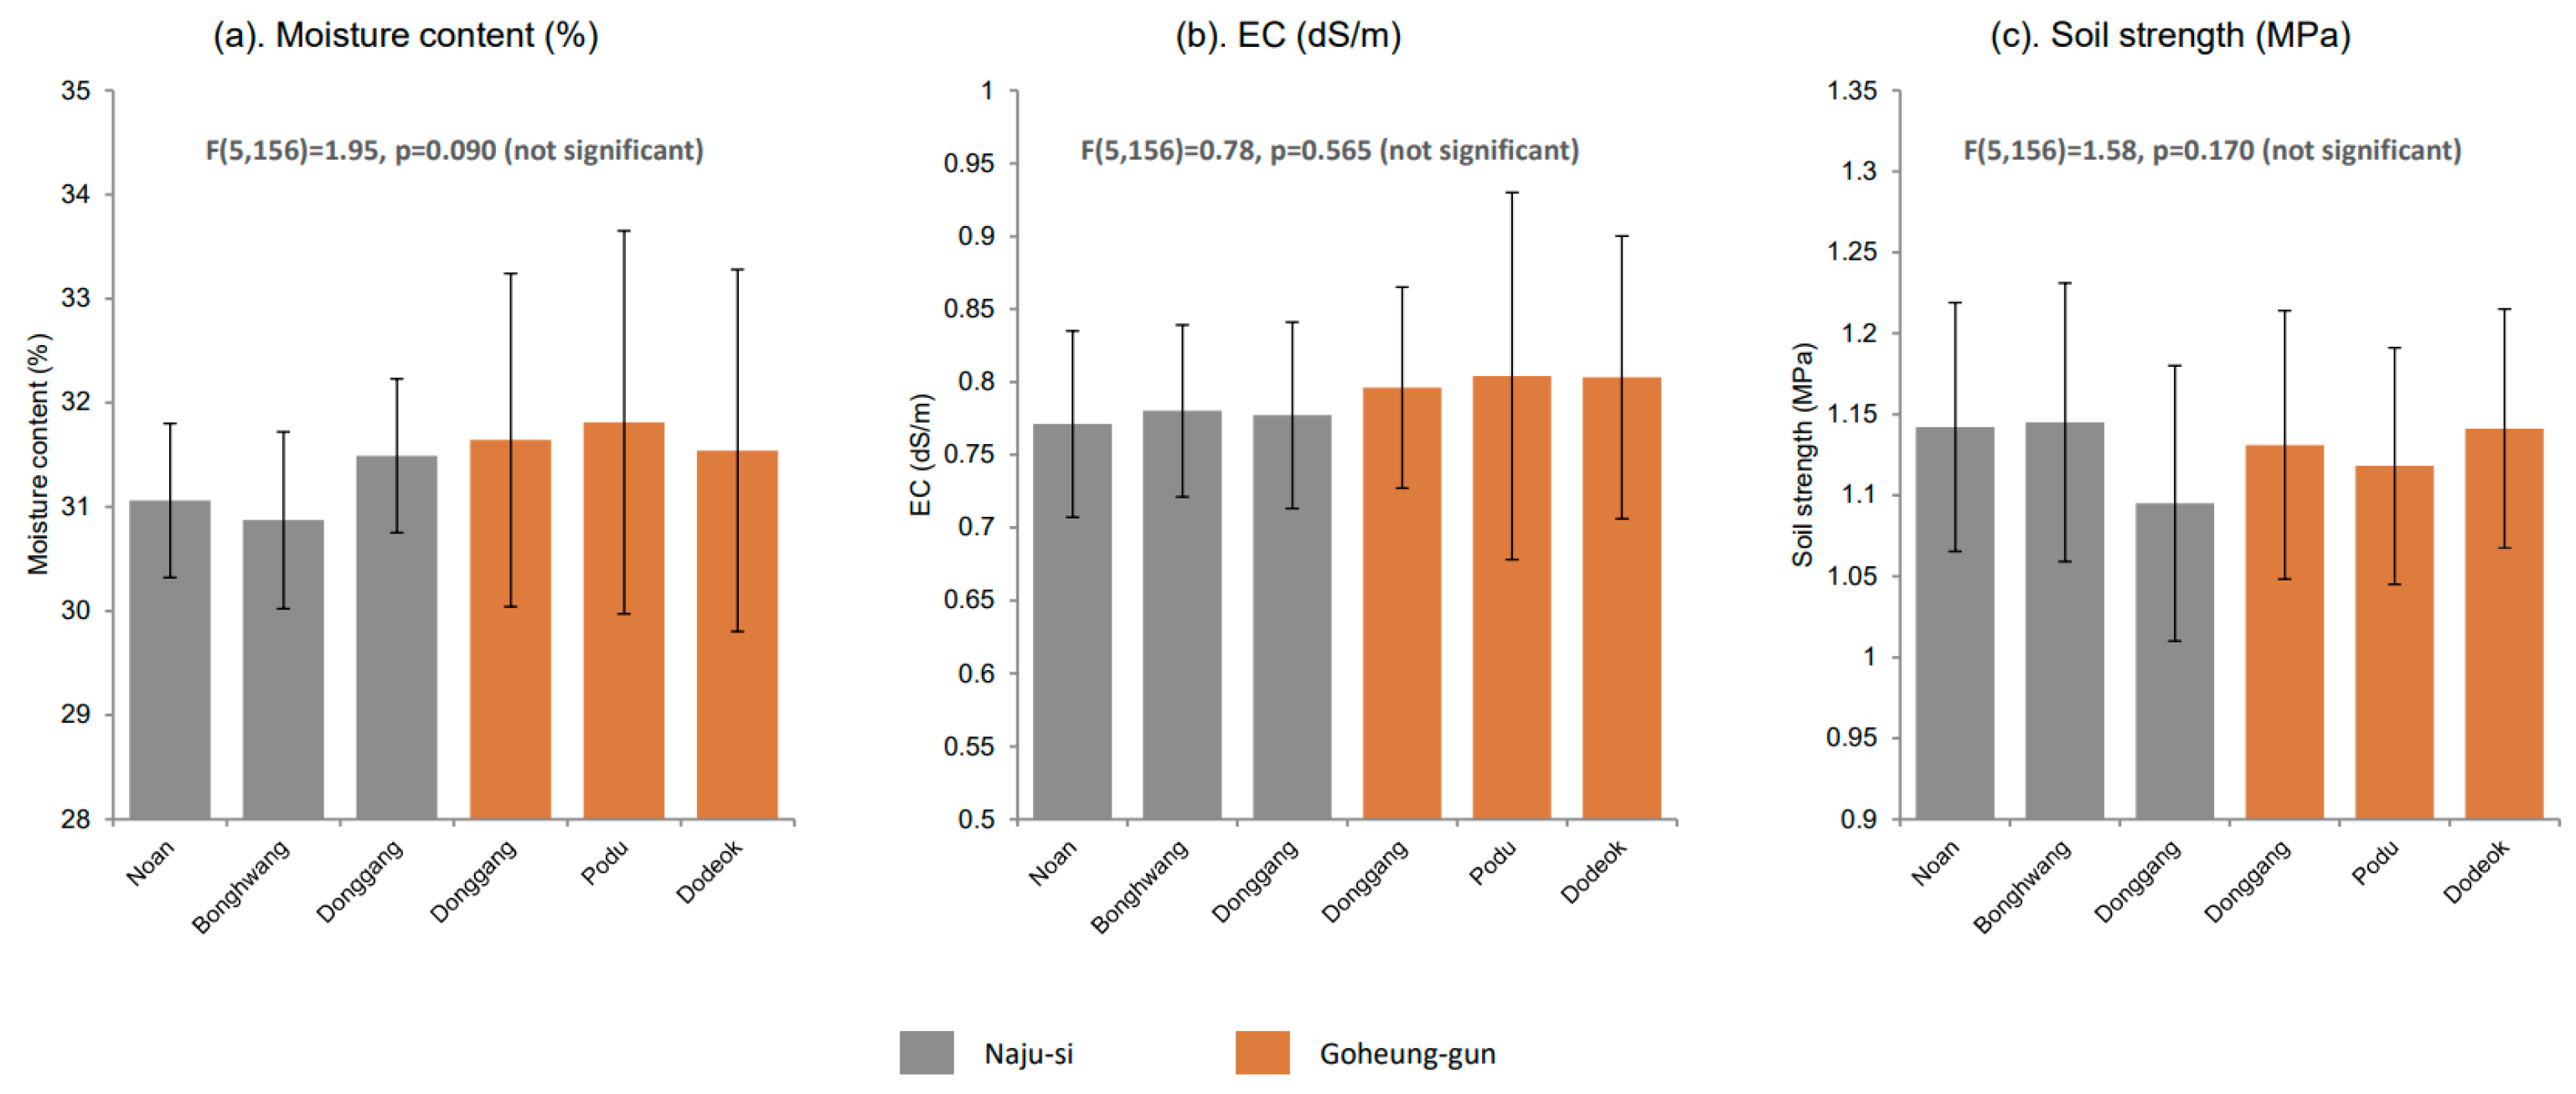
The results of the one-way analysis of variance for the paddy soil properties in six regions, based on 162 individual measurements, are shown in Table 16. As shown in Figure 17a, the moisture content was the lowest in Bonghwang-myeon, Naju-si, at 30.87 ± 0.85% and the highest in Podu-myeon, Goheung-gun, at 31.81 ± 1.84%; however, the differences among the regions were not statistically significant. Similarly, as shown in Figure 17b, the electrical conductivity ranged from 0.771 to 0.804 dS/m, with no significant differences among the regions. As shown in Figure 17c, the soil strength was the lowest in Donggang-myeon, Naju-si, at 1.095 ± 0.085 MPa and the highest in Bonghwang-myeon, Naju-si, at 1.145 ± 0.086 MPa; however, no significant differences among the regions were confirmed. The moisture content, electrical conductivity, and soil strength of the paddy soils in the six surveyed regions showed statistically uniform characteristics at a significance level of α = 0.05.
Table 16.
Regional soil properties, coefficients of variation, and ANOVA results.
Figure 17.
Paddy soil properties by region (Mean ± Standard Deviation).
Rice straw production in all six regions showed the same trend, with an increase of approximately 15~18% compared with the previous year in 2021, followed by a continuous decrease from 2022 to 2024.
Pearson correlation analysis was performed using the regional mean values of the soil properties and the corresponding regional rice straw production values. Based on six regional observations (n = 6), the correlation coefficients between rice straw production and moisture content, electrical conductivity, and soil strength were r = 0.144, 0.058, and −0.144, respectively. These results indicate weak linear associations between rice straw production and the investigated soil properties. As the soil moisture content increased, rice straw production showed a slight increase, whereas as soil strength increased, rice straw production showed a slight decrease. These results indicate that the observed linear associations between rice straw production and the investigated soil properties were weak.
3.3. Site Selection for a 30,000 Ton Processing Capacity Facility
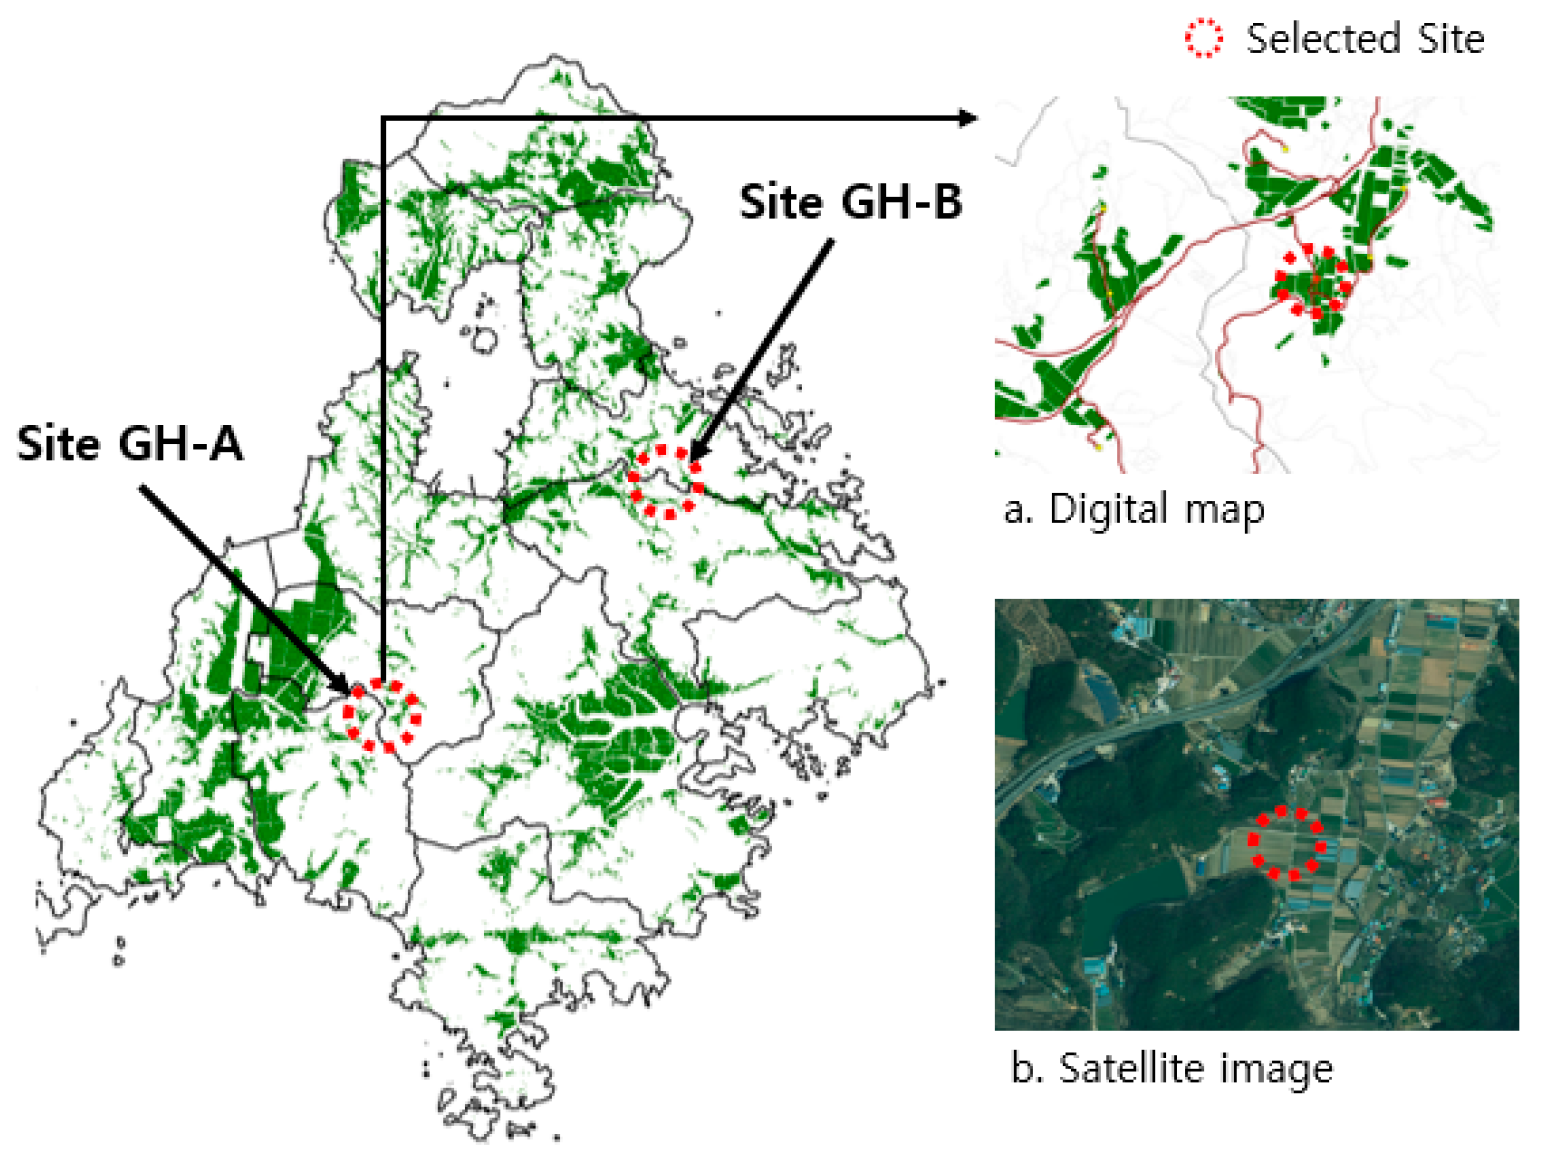
When the annual processing capacity of a resource recovery facility using rice straw as feedstock was assumed to be 30,000 tons on a dry-weight basis, two facilities could be constructed in each of Naju-si and Goheung-gun. As a result of the analysis, NJ-A and NJ-B were selected in Naju-si, as shown in Figure 18, while GH-A and GH-B were selected in Goheung-gun, as shown in Figure 19. The analysis values for each site, including the selected site and the second- and third-ranked sites, are presented in Table 17 and Table 18. The selected sites were further evaluated by comparing their transportation distances and associated transportation costs with those of the second- and third-ranked candidate sites. This comparison was used to assess whether the selected locations provided relatively favorable logistics conditions among the available candidate sites.
Table 17.
Analysis results for 30,000 ton facility sites in Naju-si.
Table 18.
Analysis results for 30,000 ton facility sites in Goheung-gun.
Figure 18.
Final site selection for a 30,000 ton facility in Naju-si.
Figure 19.
Final site selection for a 30,000 ton facility in Goheung-gun.
3.4. Site Selection for a 60,000 Ton Processing Capacity Facility
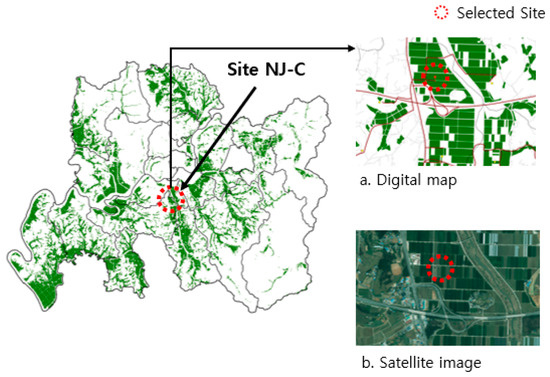
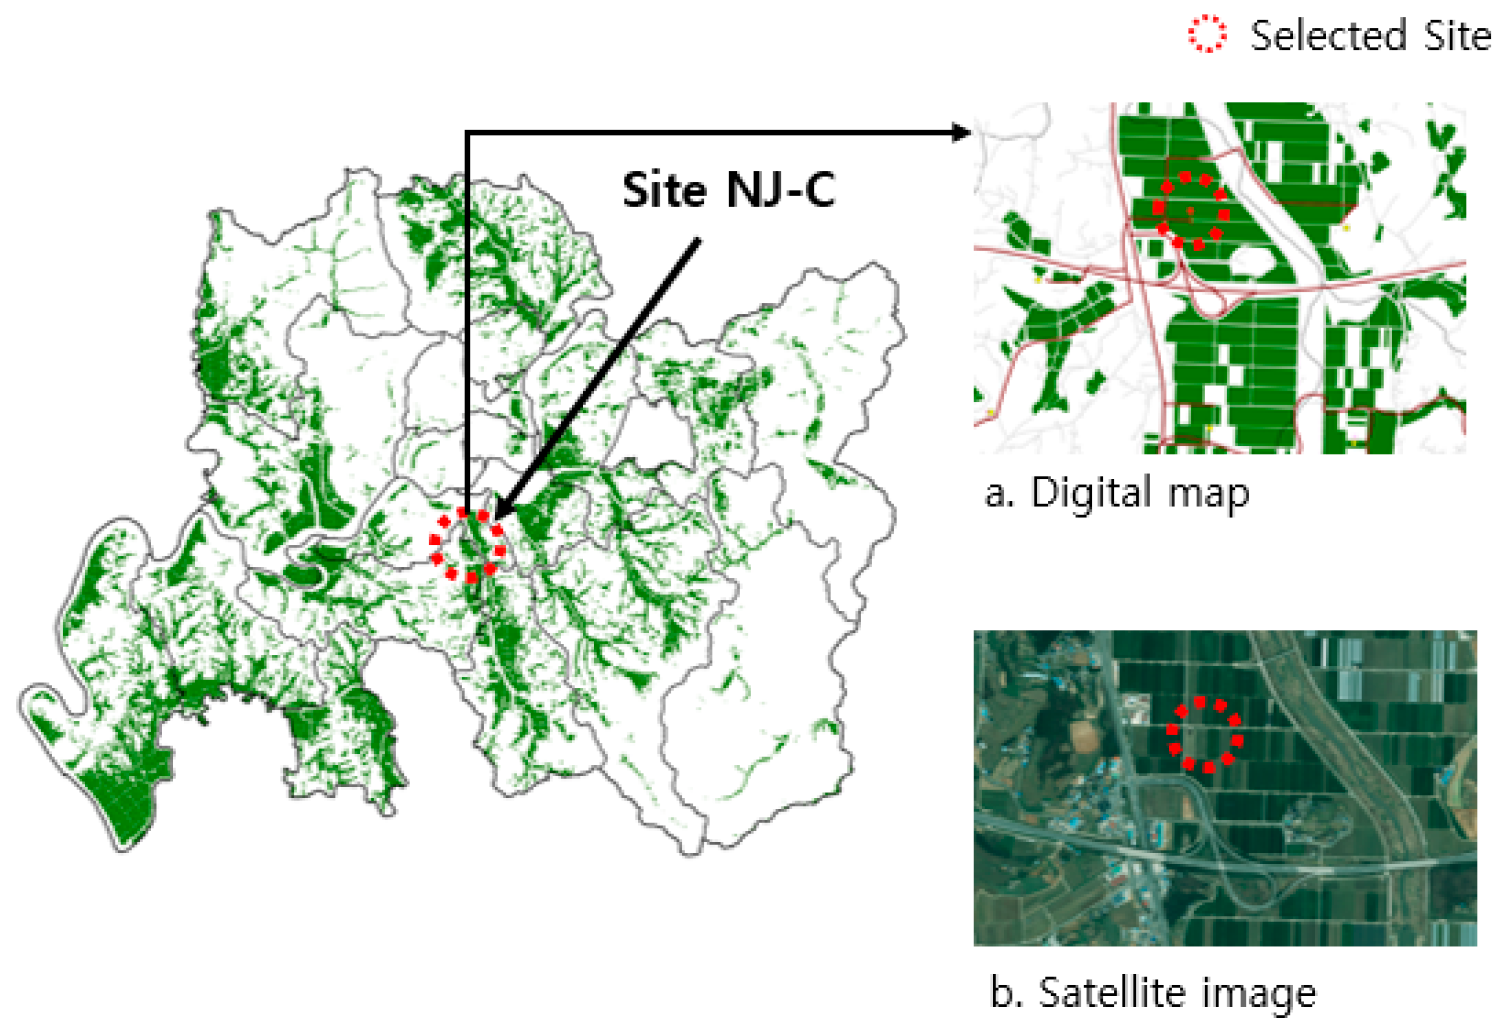
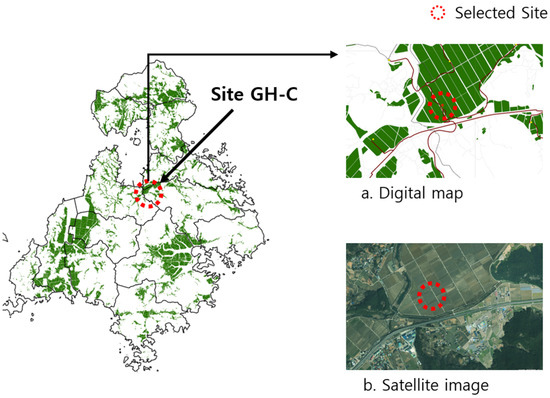
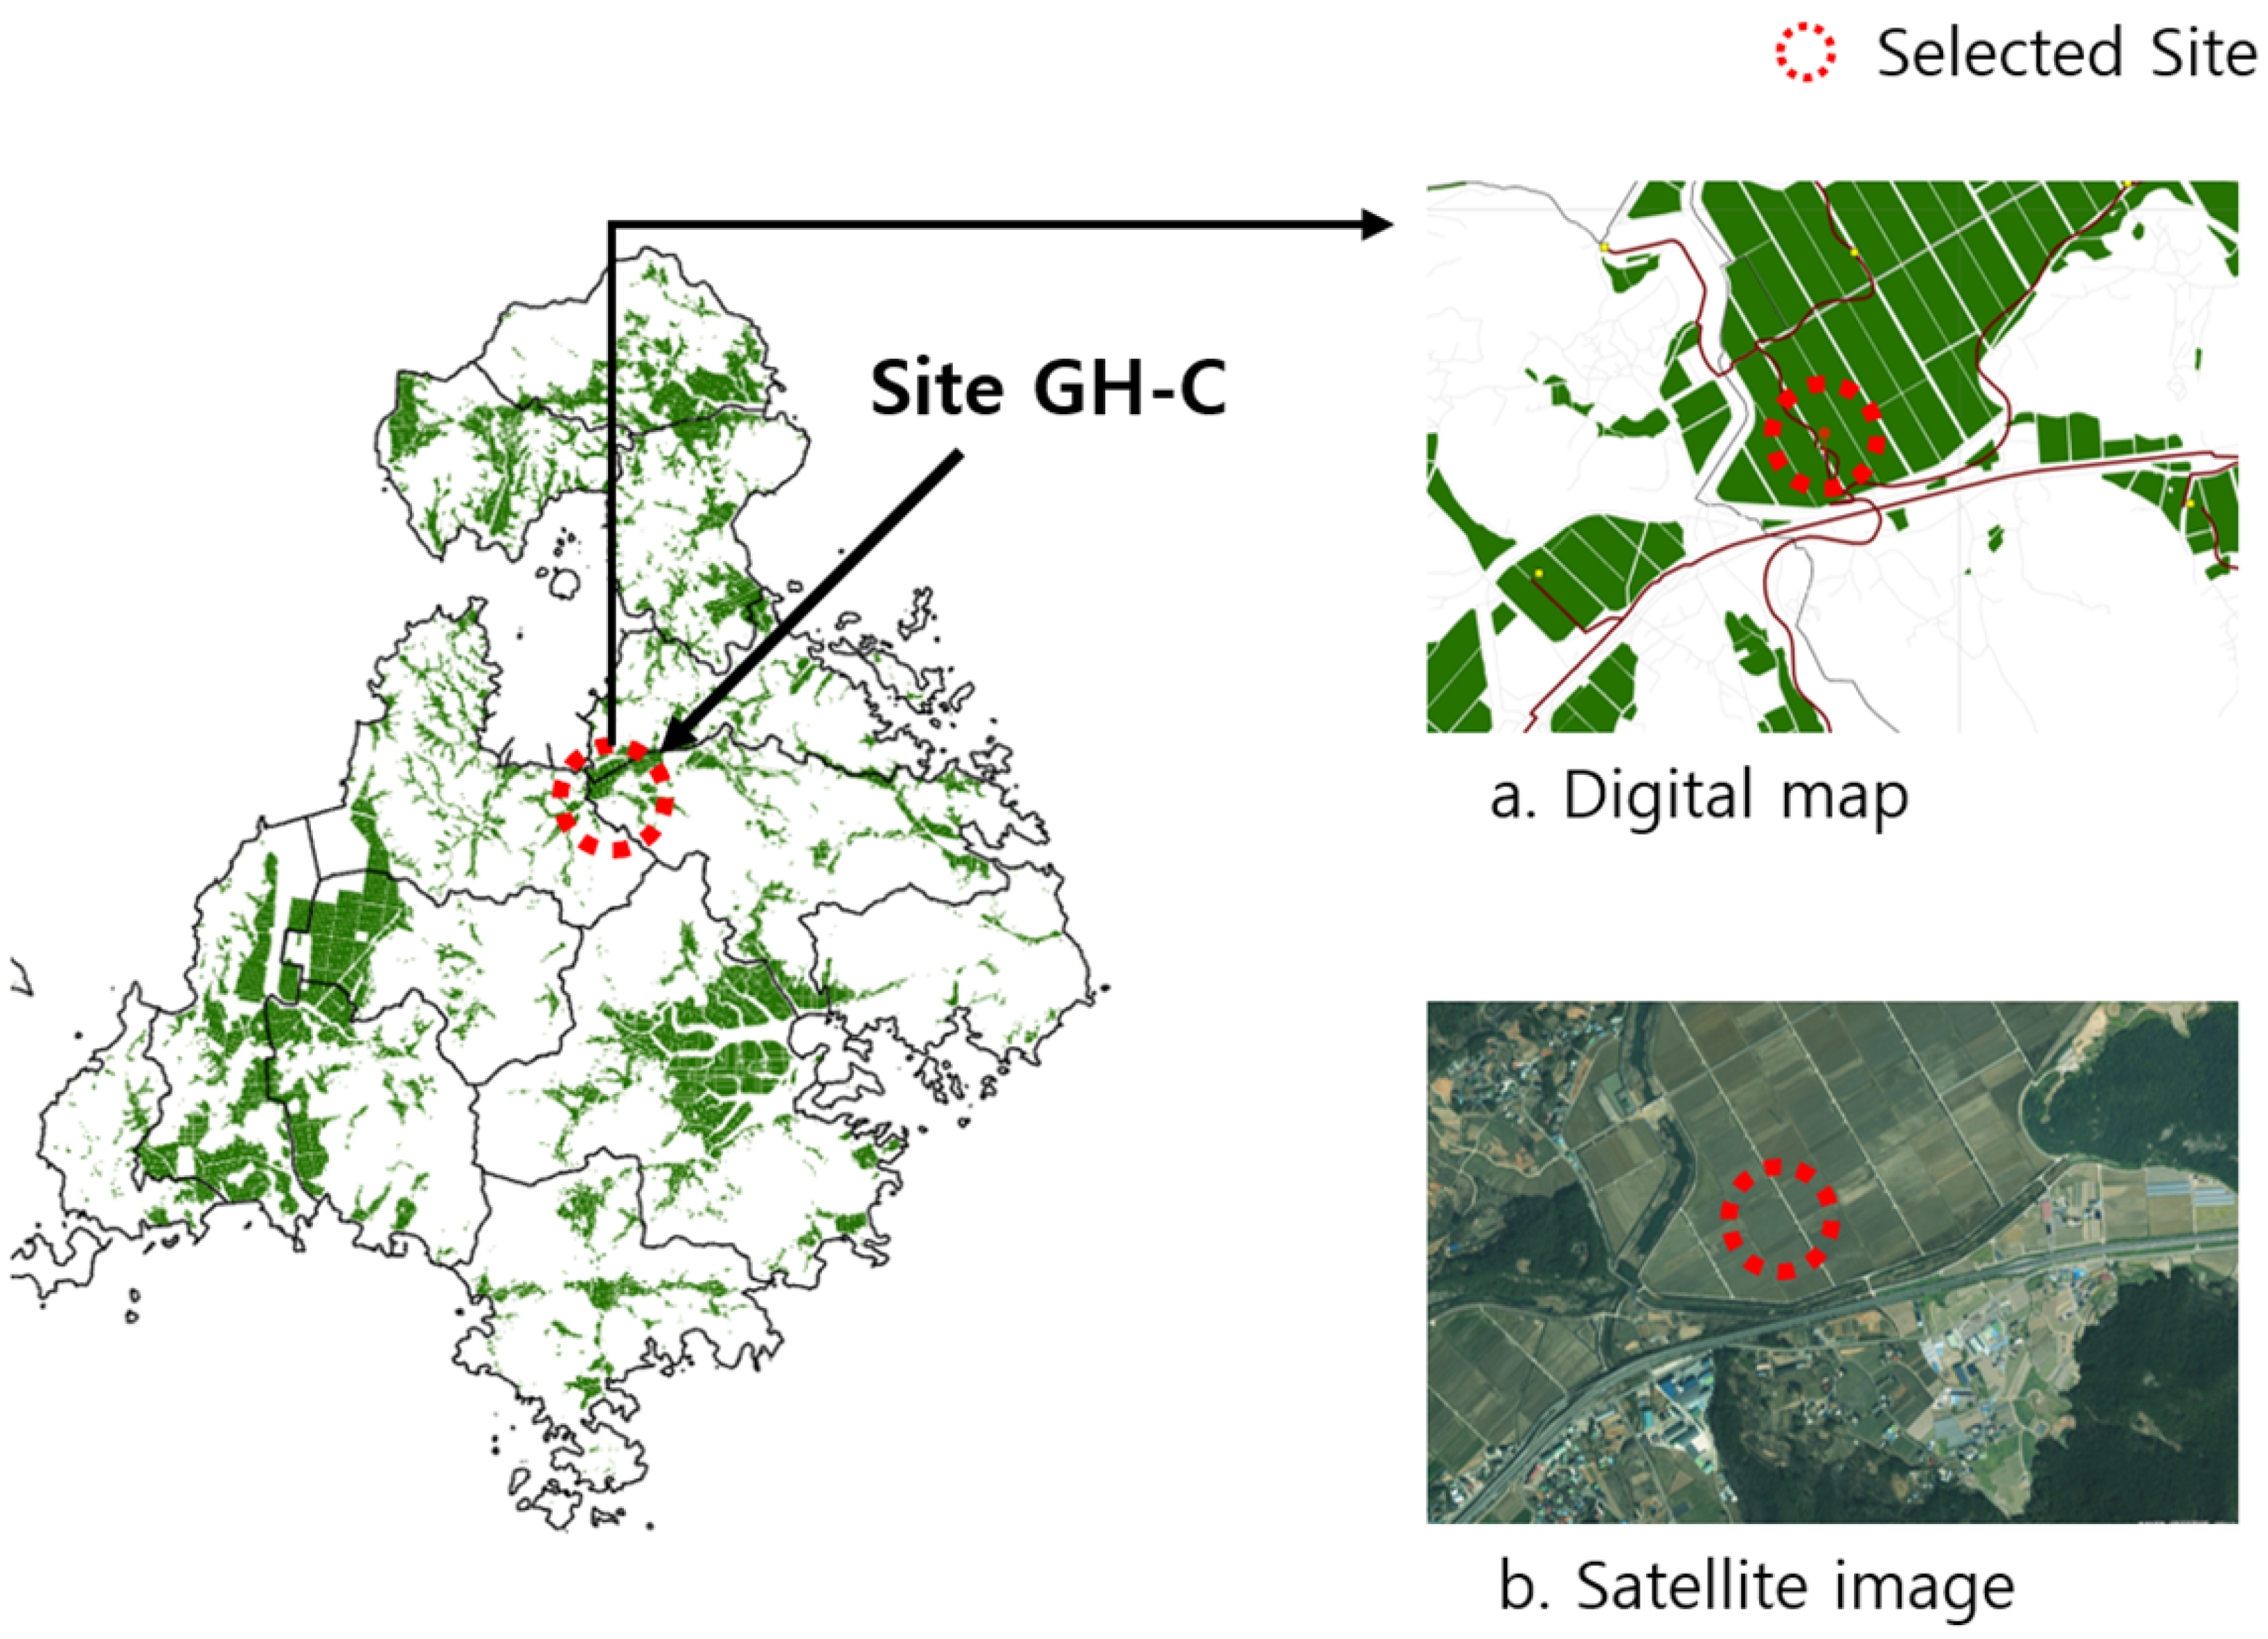
When a hypothetical annual processing capacity of 60,000 tons of rice straw on a dry-weight basis was assumed, one candidate facility location was identified in each of Naju-si and Goheung-gun. As a larger facility capacity than the estimated annual rice straw production of each study area, the 60,000 ton scenario was used to examine the spatial and logistics implications of increasing facility scale. Therefore, the identified locations should be interpreted as hypothetical planning locations rather than as sites for facilities that can be supplied entirely by the currently estimated rice straw resources within each region. As a result of the analysis, NJ-C was selected in Naju-si, as shown in Figure 20, and GH-C was selected in Goheung-gun, as shown in Figure 21. The analysis results for each site are presented in Table 19. The selected sites were also compared with the alternative candidate sites in terms of transportation distance and transportation cost. This comparison was used to evaluate the relative transportation conditions associated with the hypothetical 60,000 ton processing capacity scenario.
Figure 20.
Final site selection for a 60,000 ton facility in Naju-si.
Figure 21.
Final site selection for a 60,000 ton facility in Goheung-gun.
Table 19.
Analysis results for 60,000 ton facility sites in Naju-si and Goheung-gun.
4. Discussion
The results of this study provide useful information for the spatial planning of agricultural biomass resource recovery facilities. The analysis showed that the spatial distribution of rice straw resources, road-network-based transportation distances, and collection and transportation costs are important factors in determining suitable facility locations. In particular, the selected locations for the 30,000 ton and 60,000 ton processing capacities indicate that facility scale and the spatial distribution of available resources should be considered simultaneously in facility planning.
The analysis of soil physical properties showed weak linear associations between rice straw production and moisture content, electrical conductivity, and soil strength. This suggests that the investigated soil properties alone were insufficient to explain regional differences in rice straw production. Therefore, the investigated soil properties were not used as input factors or selection criteria in the GIS-based facility location analysis, which instead focused on the spatial distribution of available rice straw resources and the associated transportation conditions.
The results are consistent with previous studies emphasizing the importance of spatial resource distribution and transportation networks in biomass logistics [15,24]. In addition, the present study extends these approaches by considering rice straw collection costs and different facility processing capacities in the study areas. These findings suggest that GIS-based analysis can provide practical spatial decision-support information for establishing agricultural biomass collection systems and resource supply chains.
Furthermore, the proposed approach can be connected with agricultural production information and future real-time information, such as agricultural machinery locations, harvesting schedules, traffic conditions, and weather conditions. Such integration could support more efficient biomass collection and transportation and contribute to dynamic agricultural resource management. However, the present site-selection results were evaluated based on spatial and cost comparisons among candidate locations rather than actual facility operation. Further validation using actual collection routes, seasonal operating conditions, and field-scale logistics data would therefore be necessary to improve the practical applicability of the proposed approach.
Several limitations should also be considered when interpreting the estimated biomass availability and logistics costs. First, the estimated rice straw production represents the potential resource availability and does not imply that all rice straw can be collected for resource recovery facilities, because rice straw may be used for other purposes, such as animal feed, composting, or incorporation into paddy fields. Second, the actual collection rate may vary depending on field conditions, harvesting practices, weather conditions, and the availability of collection equipment, which may result in lower feedstock availability than the theoretical production estimated in this study. Third, the biomass availability and associated logistics conditions may vary among years because rice production and cultivated areas are affected by weather and agricultural conditions. Finally, the estimated collection and transportation costs are subject to changes in fuel prices, labor costs, equipment costs, and other operating conditions. Therefore, future studies should incorporate realistic collection rates, interannual variations in biomass availability, and sensitivity analyses of major cost parameters to improve the robustness of facility planning.
5. Conclusions
This study analyzed rice straw production and evaluated suitable locations for rice straw resource utilization facilities in Naju-si and Goheung-gun, Jeollanam-do, using ArcGIS-based spatial analysis. The relationship between soil physical properties and rice straw production was also examined separately to determine whether soil characteristics were associated with rice straw production.
The results of the soil property investigation showed that both regions had soil conditions suitable for rice cultivation; however, no significant correlation was found between the investigated soil properties and rice straw production. Separately, GIS spatial analysis identified two candidate sites (NJ-A and NJ-B in Naju-si and GH-A and GH-B in Goheung-gun) for the 30,000 ton treatment facility, while one candidate site was identified for each region (NJ-C and GH-C) for the 60,000 ton treatment facility. The results showed that locations closer to the center of the rice straw collection area reduced total transportation distance and transportation cost per bale, highlighting the importance of considering resource distribution and road networks in facility site selection.
However, the site-selection results were evaluated based on spatial and cost comparisons among candidate locations rather than actual facility operation. Further validation using actual collection routes, seasonal operating conditions, and field-scale logistics data is required before practical implementation.
In particular, the GIS-based analysis of resource distribution, transportation distances, and collection and transportation costs can provide spatial decision-support information for improving agricultural biomass logistics and resource circulation. By integrating these results with agricultural production data and, in the future, real-time information such as agricultural machinery locations, harvesting schedules, traffic conditions, and weather conditions, the proposed approach could support dynamic resource management and logistics planning in agricultural systems.
Author Contributions
Conceptualization, K.-D.P., J.-K.S., R.-G.L.; methodology, K.-D.P., J.-K.S., R.-G.L.; software, K.-D.P.; validation, K.-D.P., J.-K.S., R.-G.L.; formal analysis, K.-D.P., R.-G.L.; investigation, K.-D.P., R.-G.L.; data curation, K.-D.P.; writing—original draft preparation, K.-D.P., R.-G.L.; writing—review and editing, K.-D.P., R.-G.L.; supervision, R.-G.L.; project administration, K.-D.P., R.-G.L., S.-Y.S., M.-Y.H.; funding acquisition, R.-G.L., K.-D.P. All authors have read and agreed to the published version of the manuscript.
Funding
This work was supported by Korea Institute of Planning and Evaluation for Technology in Food, Agriculture and Forestry(IPET) and Korea Smart Farm R&D Foundation(KosFarm) through Smart Farm Innovation Technology Development Program, funded by Ministry of Agriculture, Food and Rural Affairs(MAFRA) and Ministry of Science and ICT(MSIT), Rural Development Administration(RDA)(RS-2025-02316456).
Institutional Review Board Statement
Not applicable.
Data Availability Statement
The original contributions presented in this study are included in the article. Further inquiries can be directed to the corresponding author.
Conflicts of Interest
Author Jinkwan Son was employed by Hyundai Agricultural Machinery. The remaining authors declare that the research was conducted in the absence of any commercial or financial relationships that could be construed as potential conflicts of interest.
References
- Mofijur, M.; Mahlia, T.M.I.; Logeswaran, J.; Anwar, M.; Silitonga, A.S.; Rahman, S.M.A.; Shamsuddin, A.H. Potential of Rice Industry Biomass as a Renewable Energy Source. Energies 2019, 12, 4116. [Google Scholar] [CrossRef] [Scilit]
- Zhang, Z.; Islam, M.S.; Noman, M.; Hao, Z.; Chai, R.; Qiu, H.; Wang, J.; Cai, Y.; Wang, Y.; Wang, J. Enhanced Mesophilic Degradation of Rice Straw by Microbial Consortium SXJG15 Through Coordinated Enzymatic Activity and Community Reshaping. Microorganisms 2025, 13, 2707. [Google Scholar] [CrossRef] [Scilit] [PubMed]
- Harun, S.N.; Hanafiah, M.M.; Noor, N.M. Rice Straw Utilisation for Bioenergy Production: A Brief Overview. Energies 2022, 15, 5542. [Google Scholar] [CrossRef] [Scilit]
- Wang, X.; Cheng, J.; Zhao, D.; Li, Y.; Yang, Z. Renewable Biohydrogen Production from Straw Biomass: Recent Advances in Pretreatment/Hydrolysis Technologies and Future Development. Int. J. Hydrogen Energy 2022, 47, 37359–37373. [Google Scholar] [CrossRef] [Scilit]
- Jo, Y.T.; Cho, Y.S. Study on the Policy Determinants of Renewable Energy Technology Innovation in OECD Countries. Innov. Stud. 2024, 19, 275–292. [Google Scholar] [CrossRef] [Scilit]
- Kim, J.H.; Hwang, S.J.; Nam, J.S. Simulation Study on the Safety of a Fastening Device of Agricultural By-Product Collector. J. Drive Control 2023, 20, 42–49. [Google Scholar] [CrossRef]
- Ra, Y.H.; Kim, C.G.; Jekal, S.; Rho, J.; Kim, J.H.; Yoon, C.-M. Synthesis of Rice Husk-Derived Porous Carbon/Conducting Polymer Composites and Their Application as Hybrid Capacitor Electrodes. J. Korea Org. Resour. Recycl. Assoc. 2025, 33, 17–28. [Google Scholar] [CrossRef]
- Correia, B.; Matos, H.A.; Lopes, T.F.; Marques, S.; Gírio, F. Sustainability Assessment of 2G Bioethanol Production from Residual Lignocellulosic Biomass. Processes 2024, 12, 987. [Google Scholar] [CrossRef] [Scilit]
- Kabange, N.R.; Kwon, Y.; Lee, S.-M.; Kang, J.-W.; Cha, J.-K.; Park, H.; Dzorkpe, G.D.; Shin, D.; Oh, K.-W.; Lee, J.-H. Mitigating Greenhouse Gas Emissions from Crop Production and Management Practices, and Livestock: A Review. Sustainability 2023, 15, 15889. [Google Scholar] [CrossRef] [Scilit]
- Saga, K.; Imou, K.; Yokoyama, S.; Minowa, T. Net Energy Analysis of Bioethanol Production System from High-Yield Rice Plant in Japan. Appl. Energy 2010, 87, 2164–2168. [Google Scholar] [CrossRef] [Scilit]
- Woo, J.K.; Kim, Y.K.; Choi, Y.; Choi, D.-K.; Lee, H.-S.; Kim, J.-T.; Park, Y.-J.; Kim, D.-J.; Choi, I.S. Design and Performance Evaluation of a Variable Control Type Fresh Corn Harvester. J. Drive Control 2023, 20, 40–46. [Google Scholar] [CrossRef]
- Gao, J.; Wang, C.; Wang, Z.; Lin, J.; Zhang, R.; Wu, X.; Xu, G.; Wang, Z. Site Selection Decision for Biomass Cogeneration Projects from a Sustainable Perspective: A Case Study of China. Energy 2024, 286, 129518. [Google Scholar] [CrossRef] [Scilit]
- Eom, D.H.; Cho, D.W.; Kim, S.J.; Park, S.H.; Hwang, S.H. Route Optimization for Energy-Efficient Path Planning in Smart Factory Autonomous Mobile Robot. J. Drive Control 2024, 21, 46–52. [Google Scholar] [CrossRef]
- Yun, Y.-U.; Lee, J.-I.; Lee, J.S.; Cho, Y.-G.; Lee, J.-H.; Lee, K.-S. Quantitative Nutrient Assessment of Agricultural Residues from Different Crop Types in Chungcheongnam-do, Korea. Korean J. Soil Sci. Fert. 2025, 58, 455–464. [Google Scholar] [CrossRef] [Scilit]
- Elmore, A.J.; Shi, X.; Gorence, N.J.; Li, X.; Jin, H.; Wang, F.; Zhang, X. Spatial Distribution of Agricultural Residue from Rice for Potential Biofuel Production in China. Biomass Bioenergy 2008, 32, 22–27. [Google Scholar] [CrossRef] [Scilit]
- Song, S.; Seo, J.; Kim, Y.; Kim, S.; Kim, S. Designing a Rice Straw-Based Biofuel Supply Chain Using Mixed-Integer Programming in South Korea. Energies 2026, 19, 1338. [Google Scholar] [CrossRef] [Scilit]
- Kwak, K.; Kim, H.; Kim, S.; Lee, S.; Shin, G.; Lee, J.; Hur, S. Temporal Variation in Soil Physical Properties of Paddy Fields in Jeonnam Province. Korean J. Soil Sci. Fert. 2024, 57, 48–54. [Google Scholar] [CrossRef] [Scilit]
- Yun, J.-J.; Shim, J.-H.; Kim, S.-H.; Jeon, S.-H.; Lee, Y.-N.; Roh, A.-S. Effect of Different Type of Organic Matter Application on Rice Yield and Soil Organic Carbon Stock in Paddy Soil. Korean J. Environ. Agric. 2024, 43, 413–420. [Google Scholar] [CrossRef] [Scilit]
- Che, Y.; Zhang, B.; Liu, B.; Wang, J.; Zhang, H. Effects of Straw Return Rate on Soil Physicochemical Properties and Yield in Paddy Fields. Agronomy 2024, 14, 1668. [Google Scholar] [CrossRef] [Scilit]
- Park, K.D.; Hwang, M.Y.; Lim, R.G. Optimizing the Location for Biomass Resource Circulation from Smart Agriculture: A Case of Goheung, Jeollanam-do. J. Drive Control 2025, 22, 1–7. [Google Scholar] [CrossRef]
- Statistics Korea. Korean Statistical Information Service (KOSIS). Available online: https://kosis.kr (accessed on 3 December 2025).
- USDA Natural Resources Conservation Service (NRCS), Soil Survey Staff. Soil Texture Calculator. United States Department of Agriculture. Available online: https://www.nrcs.usda.gov/resources/education-and-teaching-materials/soil-texture-calculator (accessed on 3 December 2025).
- National Geographic Information Institute. National Land Information Platform. Available online: https://map.ngii.go.kr/ (accessed on 3 December 2025).
- Perpiñá, C.; Alfonso, D.; Pérez-Navarro, Á.; Peñalvo, E.; Vargas, C.; Cárdenas, R. Methodology Based on Geographic Information System for Biomass Logistics and Transport Optimisation. Renew. Energy 2009, 34, 555–565. [Google Scholar] [CrossRef] [Scilit]


Disclaimer/Publisher’s Note: The statements, opinions and data contained in all publications are solely those of the individual author(s) and contributor(s) and not of MDPI and/or the editor(s). MDPI and/or the editor(s) disclaim responsibility for any injury to people or property resulting from any ideas, methods, instructions or products referred to in the content. |
© 2026 by the authors. Licensee MDPI, Basel, Switzerland. This article is an open access article distributed under the terms and conditions of the Creative Commons Attribution (CC BY) license.