


Abstract
Land use transition pathways have different ecological effects, but the impacts of key conversion processes on habitat quality remain insufficiently understood. Habitat quality was defined as a unitless 0–1 InVEST index of the landscape’s relative capacity to support biodiversity, derived from land-cover suitability and exposure to anthropogenic threats. This study identified key transition pathways affecting habitat quality in the Huaihe River Eco-Economic Belt. Land use data from 2003 to 2023 were analyzed using a coupled PLUS–InVEST framework to simulate land use and habitat quality under four scenarios for 2033, while contribution analysis quantified pathway effects. Cropland continuously decreased, whereas the aggregated impervious-surface category, comprising built structures and paved or artificially sealed surfaces, expanded. Mean habitat quality increased from 0.588 to 0.628, a modest absolute increase of 0.040 on the 0–1 scale, and was higher in the south than in the north. A small number of pathways dominated habitat-quality change; cropland and forest conversion to impervious surfaces were the principal negative pathways. Scenario differences were modest, indicating potential trade-offs among agricultural production, ecosystem conservation, and habitat quality; at the transition-pathway level, the Ecological Protection and Sustainable Development scenarios reduced the negative habitat-quality contributions of specific high-risk conversions, particularly cropland-to-impervious-surface conversion.
1. Introduction
Agricultural land serves as a critical spatial carrier for ensuring food production, maintaining regional ecological functions, and promoting sustainable development [1,2]. However, rapid urbanization and economic development have significantly altered agricultural land use patterns, with large areas of cropland being converted into impervious surfaces [3,4]. Such conversions have intensified conflicts between agricultural production spaces and ecological conservation demands [5]. Land use transition not only reshapes land resource allocation patterns but also affects the structure and functioning of regional ecosystems [6]. Therefore, assessing the ecological impacts of land use transition under rapid land use change is essential for promoting sustainable agricultural development and optimizing land resource allocation [7,8,9].
The Huaihe River Eco-Economic Belt, located in China, lies in the transition zone between the warm temperate and subtropical regions, serving as an important ecological corridor connecting northern and southern ecosystems [10]. It is also a region where the national food security strategy and rapid urbanization development overlap. Compared with regions dominated by either ecological conservation or urban development objectives, the Huaihe River Eco-Economic Belt integrates multiple functions, including food production, ecological conservation, and urban development [11]. The Development Plan for the Huaihe River Eco-Economic Belt emphasizes the promotion of green development and improvement in the watershed ecological environment, with ecological economic belt construction as the guiding objective [12]. Therefore, the Huaihe River Eco-Economic Belt provides a representative case for investigating land use transition processes and their ecological effects.
In fact, different land use conversion processes have distinct ecological implications [13]. Land changes of the same magnitude may result in substantially different ecological outcomes [14]. Land use transfer not only alters spatial landscape patterns but also affects biodiversity maintenance, ecosystem stability, and ecosystem service provision by modifying ecosystem composition and processes [15]. Habitat quality (HQ) is widely used as a spatially explicit proxy for assessing ecological responses to land-use change and anthropogenic disturbance [16,17,18,19]. The Habitat quality assessment based on the InVEST model can effectively characterize the spatial responses of habitat quality to land use change [20,21], while the PLUS model has become an important tool for land use prediction due to its strong capability in simulating land expansion [22,23,24]. Existing studies have mainly focused on the spatiotemporal patterns of land use change and habitat quality evolution, while insufficient attention has been paid to the key question of which land use transition pathways contribute to habitat improvement or degradation [25,26]. The differences in ecological effects among land use transition pathways and their responses under future scenarios remain unclear [27,28]. Focusing only on changes in land use quantity cannot accurately reveal the sources of ecological risks during land use transition. Identifying key land use transition pathways and their ecological contributions can improve the understanding of how agricultural land conversion affects ecosystems from the perspective of land conversion processes and provide more targeted support for future land management strategies [24].
Based on the above background, this study selected the Huaihe River Eco-Economic Belt as the study area and established a coupled PLUS-InVEST simulation framework to quantitatively analyze land use spatiotemporal evolution, habitat-quality changes, and future multi-scenario dynamics from 2003 to 2023. The objectives of this study are as follows: (1) to analyze the characteristics of land use transfer and identify major land conversion directions in the Huaihe River Eco-Economic Belt from 2003 to 2023; (2) to simulate future land use patterns and habitat-quality changes under different scenarios; (3) to quantify the contributions of different land use transition pathways to habitat-quality changes and identify key ecological risk pathways; (4) to provide scientific support for regional land use optimization and ecological conservation.
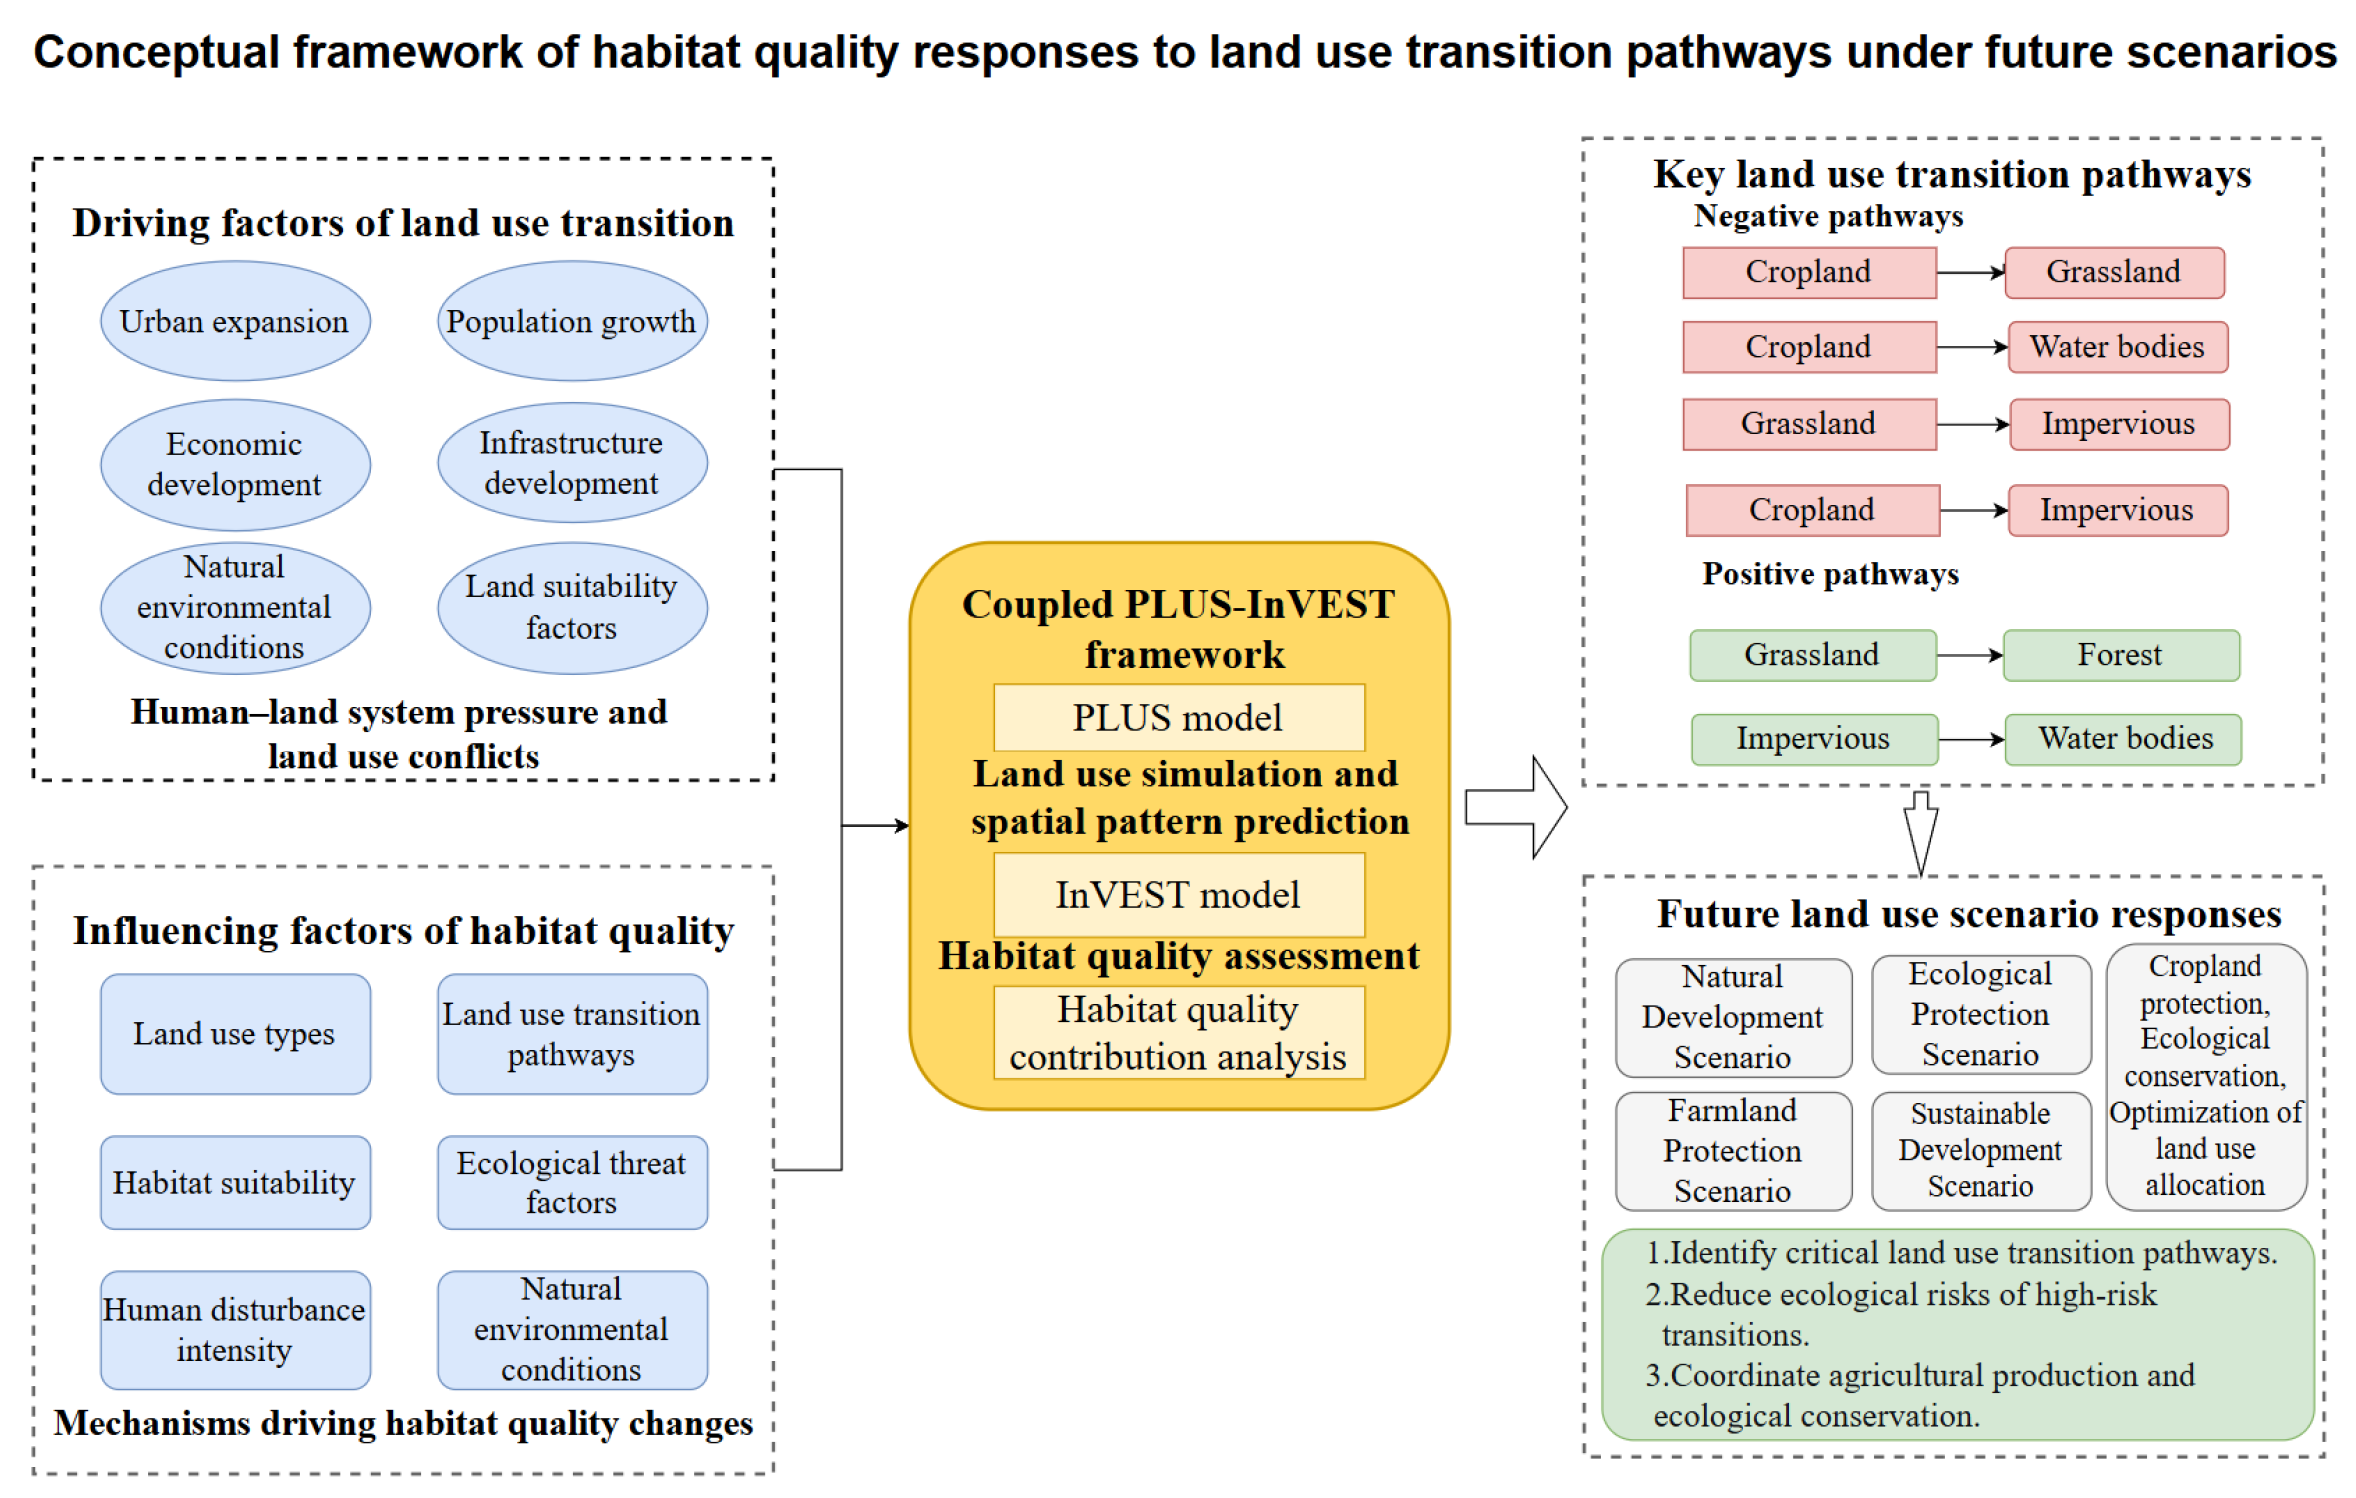
The conceptual framework of this study is illustrated in Figure 1, which integrates land use transition drivers, coupled PLUS-InVEST simulation, habitat quality assessment, key transition pathway identification, and future scenario optimization.
Figure 1.
Conceptual framework of habitat quality responses to land use transition pathways under future scenarios.
2. Materials and Methods
2.1. Overview of the Study Area
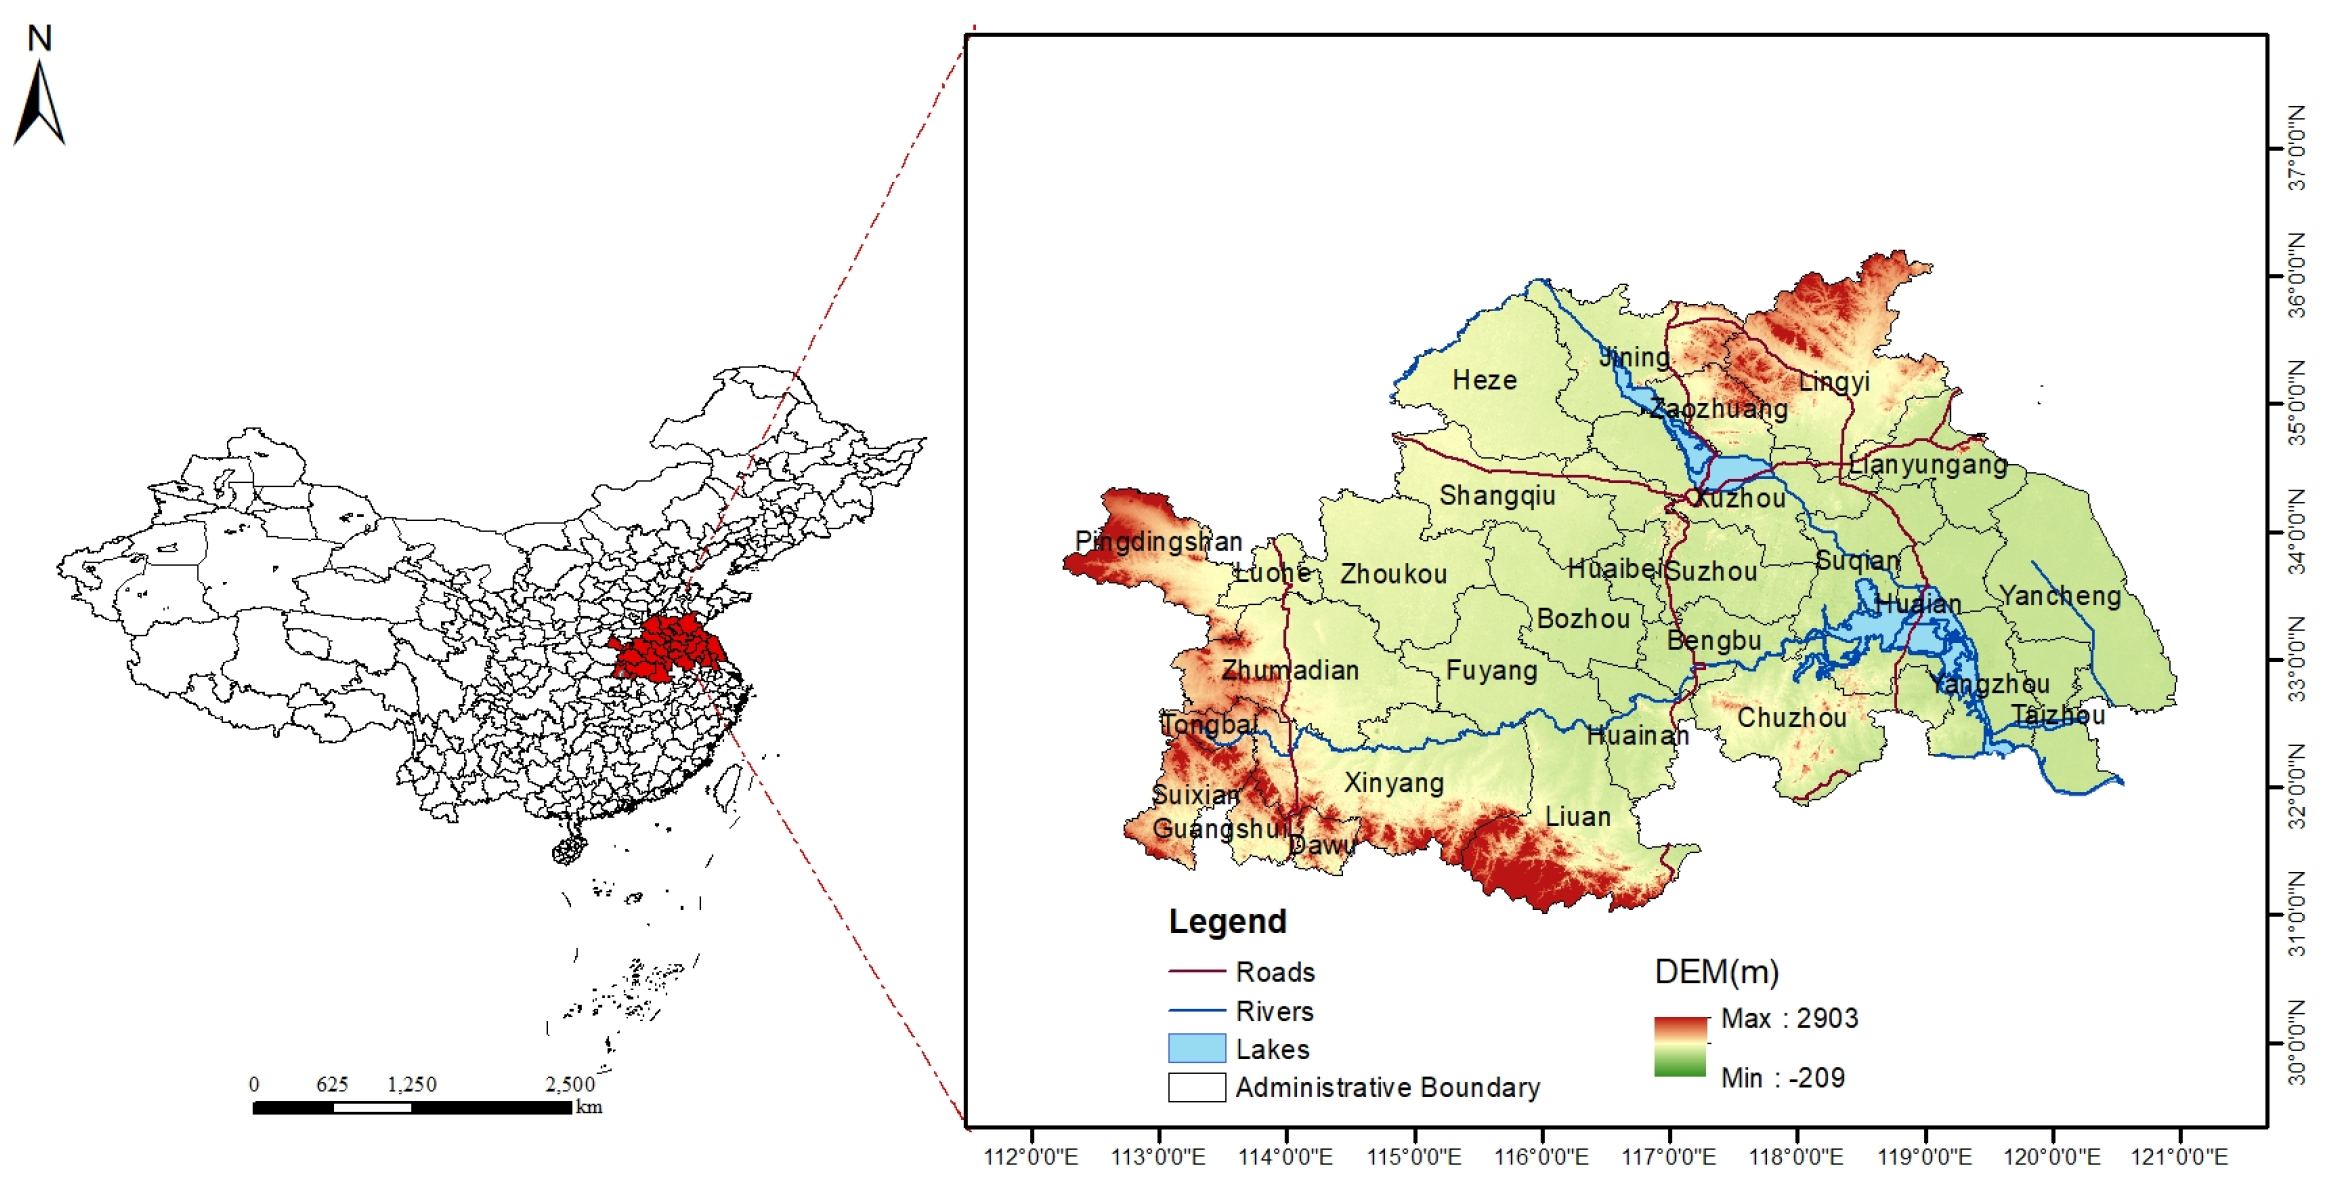
The study area of the Huaihe River Eco-Economic Belt was determined according to the Development Plan for the Huaihe River Eco-Economic Belt approved by the State Council of the People’s Republic of China, as shown in Figure 2 [12]. The Huaihe River Eco-Economic Belt extends from 112.24° E to 120.96° E and from 31.01° N to 36.21° N, covering a total area of 260,891.5 km2. The region includes 25 prefecture-level cities, such as Huai’an, Xuzhou, Huainan, Jining, and Xinyang, as well as four county-level cities, including Suizhou and Guangshui. Located in the transitional zone between northern and southern China, the region north of the Huaihe River belongs to the warm temperate zone, while the region south of the river belongs to the subtropical zone; both regions are characterized by a monsoon climate. The Huaihe River Eco-Economic Belt exhibits complex and diverse geomorphological characteristics. Mountainous and hilly areas account for approximately one-third of the total area, while plains account for approximately two-thirds.
Figure 2.
Location map of the study area. Note: The base map is sourced from the Standard Map Service Website of the Ministry of Natural Resources (approval No. GS (2024) 0650), with no modifications to the administrative boundaries.
2.2. Data Sources and Preprocessing
The land use data were obtained from the research team led by Professor Jie Yang and Professor Xin Huang at Wuhan University, with a spatial resolution of 30 m [29]. The analysis included seven broad land-cover categories: cropland (cultivated land), forest (tree-dominated land), shrubland (shrub-dominated land), grassland (herbaceous vegetation), water bodies (surface-water areas), barren land (areas with little or no vegetation cover), and impervious surfaces (built structures and paved or otherwise sealed surfaces). In the CLCD product, all land-cover types are represented as broad, aggregated categories, and finer subtypes within each category are not separately classified. For example, impervious surfaces may include built structures and paved surfaces, such as building rooftops, roads, parking areas, and other artificially sealed surfaces, while the cropland category does not distinguish between specific crop types, cropping systems, or soil conditions. Therefore, the present study examines transitions among broad land-cover categories rather than detailed changes among individual land-cover components or subtypes. After resampling the land use data to a spatial resolution of 100 m, the data were used to characterize regional land-cover patterns rather than individual buildings, road segments, crop fields.
Considering that land use change is influenced by natural, social, and economic factors, the driving factors were selected based on previous studies related to land expansion simulation using the PLUS model. The selection of driving factors also considered the actual conditions of the study area, as well as the principles of data quantification, availability, and relevance. This study selected 12 factors representing the natural conditions and socioeconomic conditions of the study area, including population (POP), GDP, elevation (DEM), NDVI, Slope, Aspect, annual average temperature (TEM), annual average precipitation (PRE), distance to primary roads (DR1), distance to secondary roads (DR2), distance to tertiary roads (DR3), and distance to water bodies (DW) [30,31]. All data were preprocessed using the ArcGIS platform and resampled to a spatial resolution of 100 m × 100 m. The specific data sources are shown in Table 1.
Table 1.
Basic data information.
2.3. Analytical Methods
2.3.1. Land Use Transfer Matrix
The land cover change transfer matrix intuitively reflects the structural characteristics and directional shifts between different land types. Land use transfer measures the quantity changes in land use types within a specific period, mainly reflecting the regional differences in the intensity and rate of land use change [32]. By using the spatial analysis function of GIS, the land cover change data from two periods are overlaid and statistically analyzed, resulting in the land cover transfer matrix between two years in the Huaihe River Eco-Economic Belt [33]. The calculation formula is as follows:
In the equation, represents the area of land use type i converted into land use type j during the study period; n is the number of land use types; and i and j represent the land use types at the beginning and end of the study period, respectively. Based on the transfer matrix, Sankey diagrams were constructed for the four five-year periods. The left and right nodes represent the land use types at the beginning and end of each period, respectively, while link width is proportional to the number of raster pixels undergoing each transition. Node size represents the total number of pixels transferred out of or into each land use type, and unchanged pixels () were excluded.
2.3.2. PLUS Model
Among the current land use simulation models, the PLUS model directly reads raster data and predicts land evolution by using a random forest algorithm to explore land expansion and its driving factors. Compared to other models, the PLUS model has been widely applied due to its ability to simulate land expansion and capture the driving mechanisms of land use change, better adaptability, and can effectively reveal the potential driving mechanisms of land use change. The model mainly consists of two modules: the Land Expansion Analysis Strategy (LEAS) and the Cellular Automata model based on multiple random seeds (CARS) [22]. The LEAS module uses a random forest algorithm to explore historical land use expansion, obtaining development probabilities and driving factor contributions for different land use types. The CARS module calculates land use demand, sets transfer matrices, and simulates the generation of land use patches. By overlaying and analyzing the land use data from 2003 and 2023, the land units that changed were extracted. Referring to the driving factors selected in existing studies, random sampling was performed on the changed parts of each land use type to calculate the development probability of each land use type. The neighborhood weight parameter represents the expansion intensity of a land type, with a value range of 0 to 1; the closer the value is to 1, the stronger the expansion capacity of that land type, and the less likely it is to be converted into other land types [34]. The specific calculation formula is:
In the formula, represents the min–max normalized value; denotes the area change in each land-use type between the two periods; and and represent the maximum and minimum area changes, respectively, among the seven land-use types.
2.3.3. Scenario Simulation Settings
Based on the actual land-use conditions of the Huaihe River Eco-Economic Belt, the territorial spatial planning framework centered on the “three zones and three lines” emphasizes the protection of prime farmland and ecological spaces, strict control of new impervious surfaces outside urban development boundaries, and a transition from incremental expansion to stock-land optimization [34]. In combination with the Development Plan for the Huaihe River Eco-Economic Belt, four scenarios were established: Natural Development, Ecological Protection, Farmland Protection, and Sustainable Development [12]. Policy documents define the direction and priority of land-use regulation but do not provide numerical adjustment coefficients. Therefore, following previous multi-scenario PLUS studies [35], the percentage adjustments to transition probabilities were treated as scenario assumptions representing different intervention intensities relative to the Natural Development Scenario.
- (1)
- Natural Development Scenario: This scenario assumes the continuation of the land use change trends from 2003 to 2023. No additional adjustments are made to the transition probabilities among different land-use types, and development policy requirements are not considered. The Markov chain module is used to project land-use demand for 2033 based on the transition trends observed from 2003 to 2023. Other model settings, including land expansion capacity, transition rules, and neighborhood weights, are kept consistent with those used in the historical simulation to represent existing development inertia.
- (2)
- Ecological Protection Scenario: Based on the Development Plan for the Huaihe River Eco-Economic Belt, this scenario prioritizes ecological-space conservation and habitat-quality maintenance. Following the parameter setting methods used in previous multi-scenario land use simulation studies, the transition probabilities from forest and grassland to impervious surfaces is reduced by 50%, while the transition probability from cropland to impervious surfaces are reduced by 30% [36]. Meanwhile, the transition probability from impervious surfaces to forest is increased by 10%. The stronger restrictions on forest and grassland conversion reflect the priority assigned to preventing ecological-land loss, whereas the 10% increase represents a comparatively conservative restoration assumption. Regional water bodies are set as restricted areas to prevent their conversion to other land-use types.
- (3)
- Farmland Protection Scenario: Based on the requirements for protecting permanent basic farmland and implementing the three control lines [37], this scenario prioritizes the prevention of cropland loss. Therefore, the transition probability from cropland to impervious surfaces is reduced by 60% [34]. This represents the strongest single-transition constraint among the four scenarios because cropland conservation is the primary objective of this scenario.
- (4)
- Sustainable Development Scenario: Based on the three control lines and the policy requirement to shift urban–rural development from incremental expansion to stock-land optimization [37], this scenario adopts moderate bidirectional adjustments. Specifically, the transition probabilities from cropland, forest, shrubland, and grassland to impervious surfaces are reduced by 30%, while the transition probabilities from impervious surfaces to cropland, forest, shrubland, and grassland are increased by 20%. Unlike the stronger single-objective constraints adopted in the Ecological Protection and Farmland Protection scenarios, these adjustments represent a balance between controlling impervious-surface expansion and optimizing existing impervious land.
These adjustments were specified according to the objectives of each scenario rather than the subsequent positive or negative classification of habitat contributions. They were applied over the entire 2023–2033 simulation period and do not represent assumptions regarding temporal response lags in land-use change.
2.3.4. Habitat Quality Assessment
The habitat quality module of the InVEST model integrates land use data and biodiversity threat factors to generate habitat quality maps [38]. The main parameters involved in the model include threat sources. In this study, habitat quality was interpreted as a landscape-level, non-species-specific indicator of the relative capacity of the landscape to support biodiversity, estimated from land-cover suitability and exposure to anthropogenic threats. The main formula is as follows:
In the formula, represents the overall habitat quality of land use type in raster cell ; represents the habitat suitability of land use type ; is the default constant; is the half-saturation constant; and represents the habitat degradation degree of raster cell for land use type . The calculation formula of is as follows:
In the formula, represents the number of threat factors; represents the number of raster cells of threat factor ; represents the weight of threat factor ; represents the degree of protection of raster cell ; represents the influence of threat factor on habitat raster cell ; represents the accessibility level, where 0 indicates inaccessible and 1 indicates accessible; and represents the sensitivity of land use type to threat factor .
Based on the availability of threat-source data, land-use datasets for 2003, 2008, 2013, 2018, and 2023 were used to assess temporal changes in habitat quality. Cropland, impervious surfaces, and barren land were treated as threat sources. Following previous studies, the habitat quality index was classified into five levels at intervals of 0.2 using the equal-interval method in ArcGIS 10.5: poor [0–0.2), relatively poor [0.2–0.4), moderate [0.4–0.6), relatively good [0.6–0.8), and good [0.8–1]. For comparisons among years and scenarios, pixel-level habitat-quality values were averaged within each of the 29 administrative units using zonal statistics, and the resulting administrative-unit means were classified using the same five thresholds. The threat factors and the habitat suitability and sensitivity of each land-use type to each threat are provided in Supplementary Material, Tables S1 and S2.
2.3.5. Habitat Contribution Rate
The habitat contribution rate is based on the proportion of increase or decrease in regional habitat quality caused by a specific land use conversion, which quantifies the response of habitat quality to land use change. Following the concept of ecological contribution rate analysis, this study integrates habitat quality assessment results to construct the habitat contribution rate index, which is used to quantify the contribution of different land use transition types to regional habitat-quality changes [39]. Contribution rates were normalized separately within each scenario by the signed sum of the area-weighted contributions from all land-use transition pathways. They express each pathway’s contribution relative to the net contribution of the transitioning pixels within that scenario. The calculation formula is as follows:
where represents the habitat contribution rate of the -th land use transition type during period ; represents the mean change in habitat quality within areas experiencing the -th land use transition type during period ; represents the area of the -th land use transition type during period ; represents the total area of the study region; and represents the number of land use transition types. Only pixels that changed land-use category () were included in the transition-pathway contribution analysis. Pixels with unchanged land use () remained part of the InVEST habitat-quality assessment but were not assigned a positive or negative transition-pathway contribution.
3. Results and Analysis
3.1. Model Accuracy Validation
In this study, the land use data from 2003 and 2013 were used as the basic data for the Land Expansion Analysis Strategy (LEAS) module of the PLUS model for the 2023 validation run. The land use expansion areas were extracted, and 12 driving factors were selected as training variables. Subsequently, the CARS module was used to simulate the land-use distribution in 2023. Land-use demand for the 2023 validation run was estimated using linear regression, while demand for the 2033 projections was estimated using the Markov chain module. The expansion weights of different land use types were obtained as follows: cropland (0.10), forest (0.60), shrubland (0.53), grassland (0.50), water bodies (0.55), bare land (0.53), and impervious surfaces (1.00). (The calculated expansion weight of cropland was 0. However, considering previous studies and the actual situation, cropland cannot completely lose its expansion capacity. Therefore, a value of 0.10 was assigned to cropland in this study.)
To evaluate model reliability, the Kappa coefficient and the Figure of Merit (FOM) coefficient were introduced. A Kappa coefficient greater than 0.75 was adopted as the reference criterion for this metric. The FOM coefficient evaluates the spatial consistency of predicted changes and compensates for the limitation of the Kappa coefficient, which mainly focuses on overall agreement but has insufficient ability to identify changed patches. The FOM coefficient is calculated as the intersection of predicted and observed changes divided by their union. The value of FOM ranges from 0 to 1. In land use simulation studies, FOM values of 0.12–0.18 have been reported in previous land-use simulation studies 0.12 and 0.18, and higher values indicate better model simulation performance [22]. The simulated land use data for 2023 were compared with the observed land use data for accuracy validation. The results showed that the Kappa coefficient was 0.76 and the overall accuracy was 0.89, both exceeding the reliability threshold of 0.75, indicating that the simulation results were reliable. The calculated FOM value was 0.42, indicating good spatial agreement between simulated and observed land-use changes. Differences in observed land use change amounts and validation settings affect comparisons of FOM values across studies.
3.2. Spatiotemporal Evolution Analysis of Land Use
3.2.1. Analysis of Land Use Transition Pathways
Based on the land use classification data, the transfer matrix method was applied to analyze cropland transitions in the Huaihe River Eco-Economic Belt from 2003 to 2023. Combined with the temporal variation characteristics of land use structure, this method can comprehensively reflect the directions and magnitude of cropland transitions to other land use types during the study period.
From 2003 to 2023, land use transition in the Huaihe River Eco-Economic Belt was mainly characterized by continuous cropland reduction and expansion of impervious surfaces, indicating that agricultural land was continuously affected by urban expansion. According to the land use transition matrix (Table 2), cropland remained in a state of net outflow throughout the study period, with net cropland losses of 8213.49 km2, 4706.31 km2, 2325.29 km2, and 1422.89 km2 during 2003–2008, 2008–2013, 2013–2018, and 2018–2023, respectively. Among these periods, cropland loss was the greatest during 2008–2013, indicating that regional construction and development activities exerted relatively strong pressure on agricultural land occupation during this period.
Table 2.
Land use transfer matrix.
From the perspective of cropland transition directions, cropland was mainly converted into impervious surfaces, forest, and grassland. Among these pathways, cropland conversion to impervious surfaces represented an important pathway of agricultural land loss, reflecting the continuous occupation of agricultural land resources caused by urban expansion. Meanwhile, the conversion of cropland to forest and grassland indicates that ecological restoration and land use structure adjustment were also important factors influencing agricultural land conversion.
Corresponding to the continuous reduction in cropland, impervious surfaces became the major net inflow land use type during the study period. The net increase in impervious surfaces reached 7259.19 km2, 4528.86 km2, 2877.40 km2, and 2505.22 km2 during 2003–2008, 2008–2013, 2013–2018, and 2018–2023, respectively, Overall, land-use transitions in the Huaihe River Eco-Economic Belt were characterized by the conversion of cropland to impervious surfaces, reflecting increasing competition between agricultural production space and urban development. Overall, land use transition in the Huaihe River Eco-Economic Belt was mainly characterized by the conversion of cropland into impervious surfaces, and the competition between agricultural production space and urban development demands became an important feature of regional land use change.
3.2.2. Spatial Distribution Characteristics of Land Use Transition
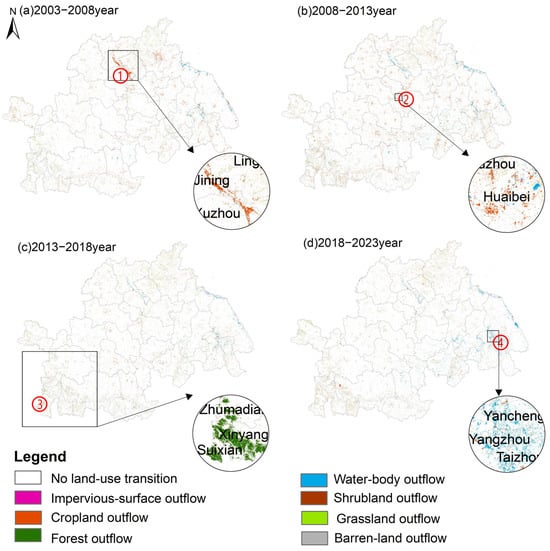
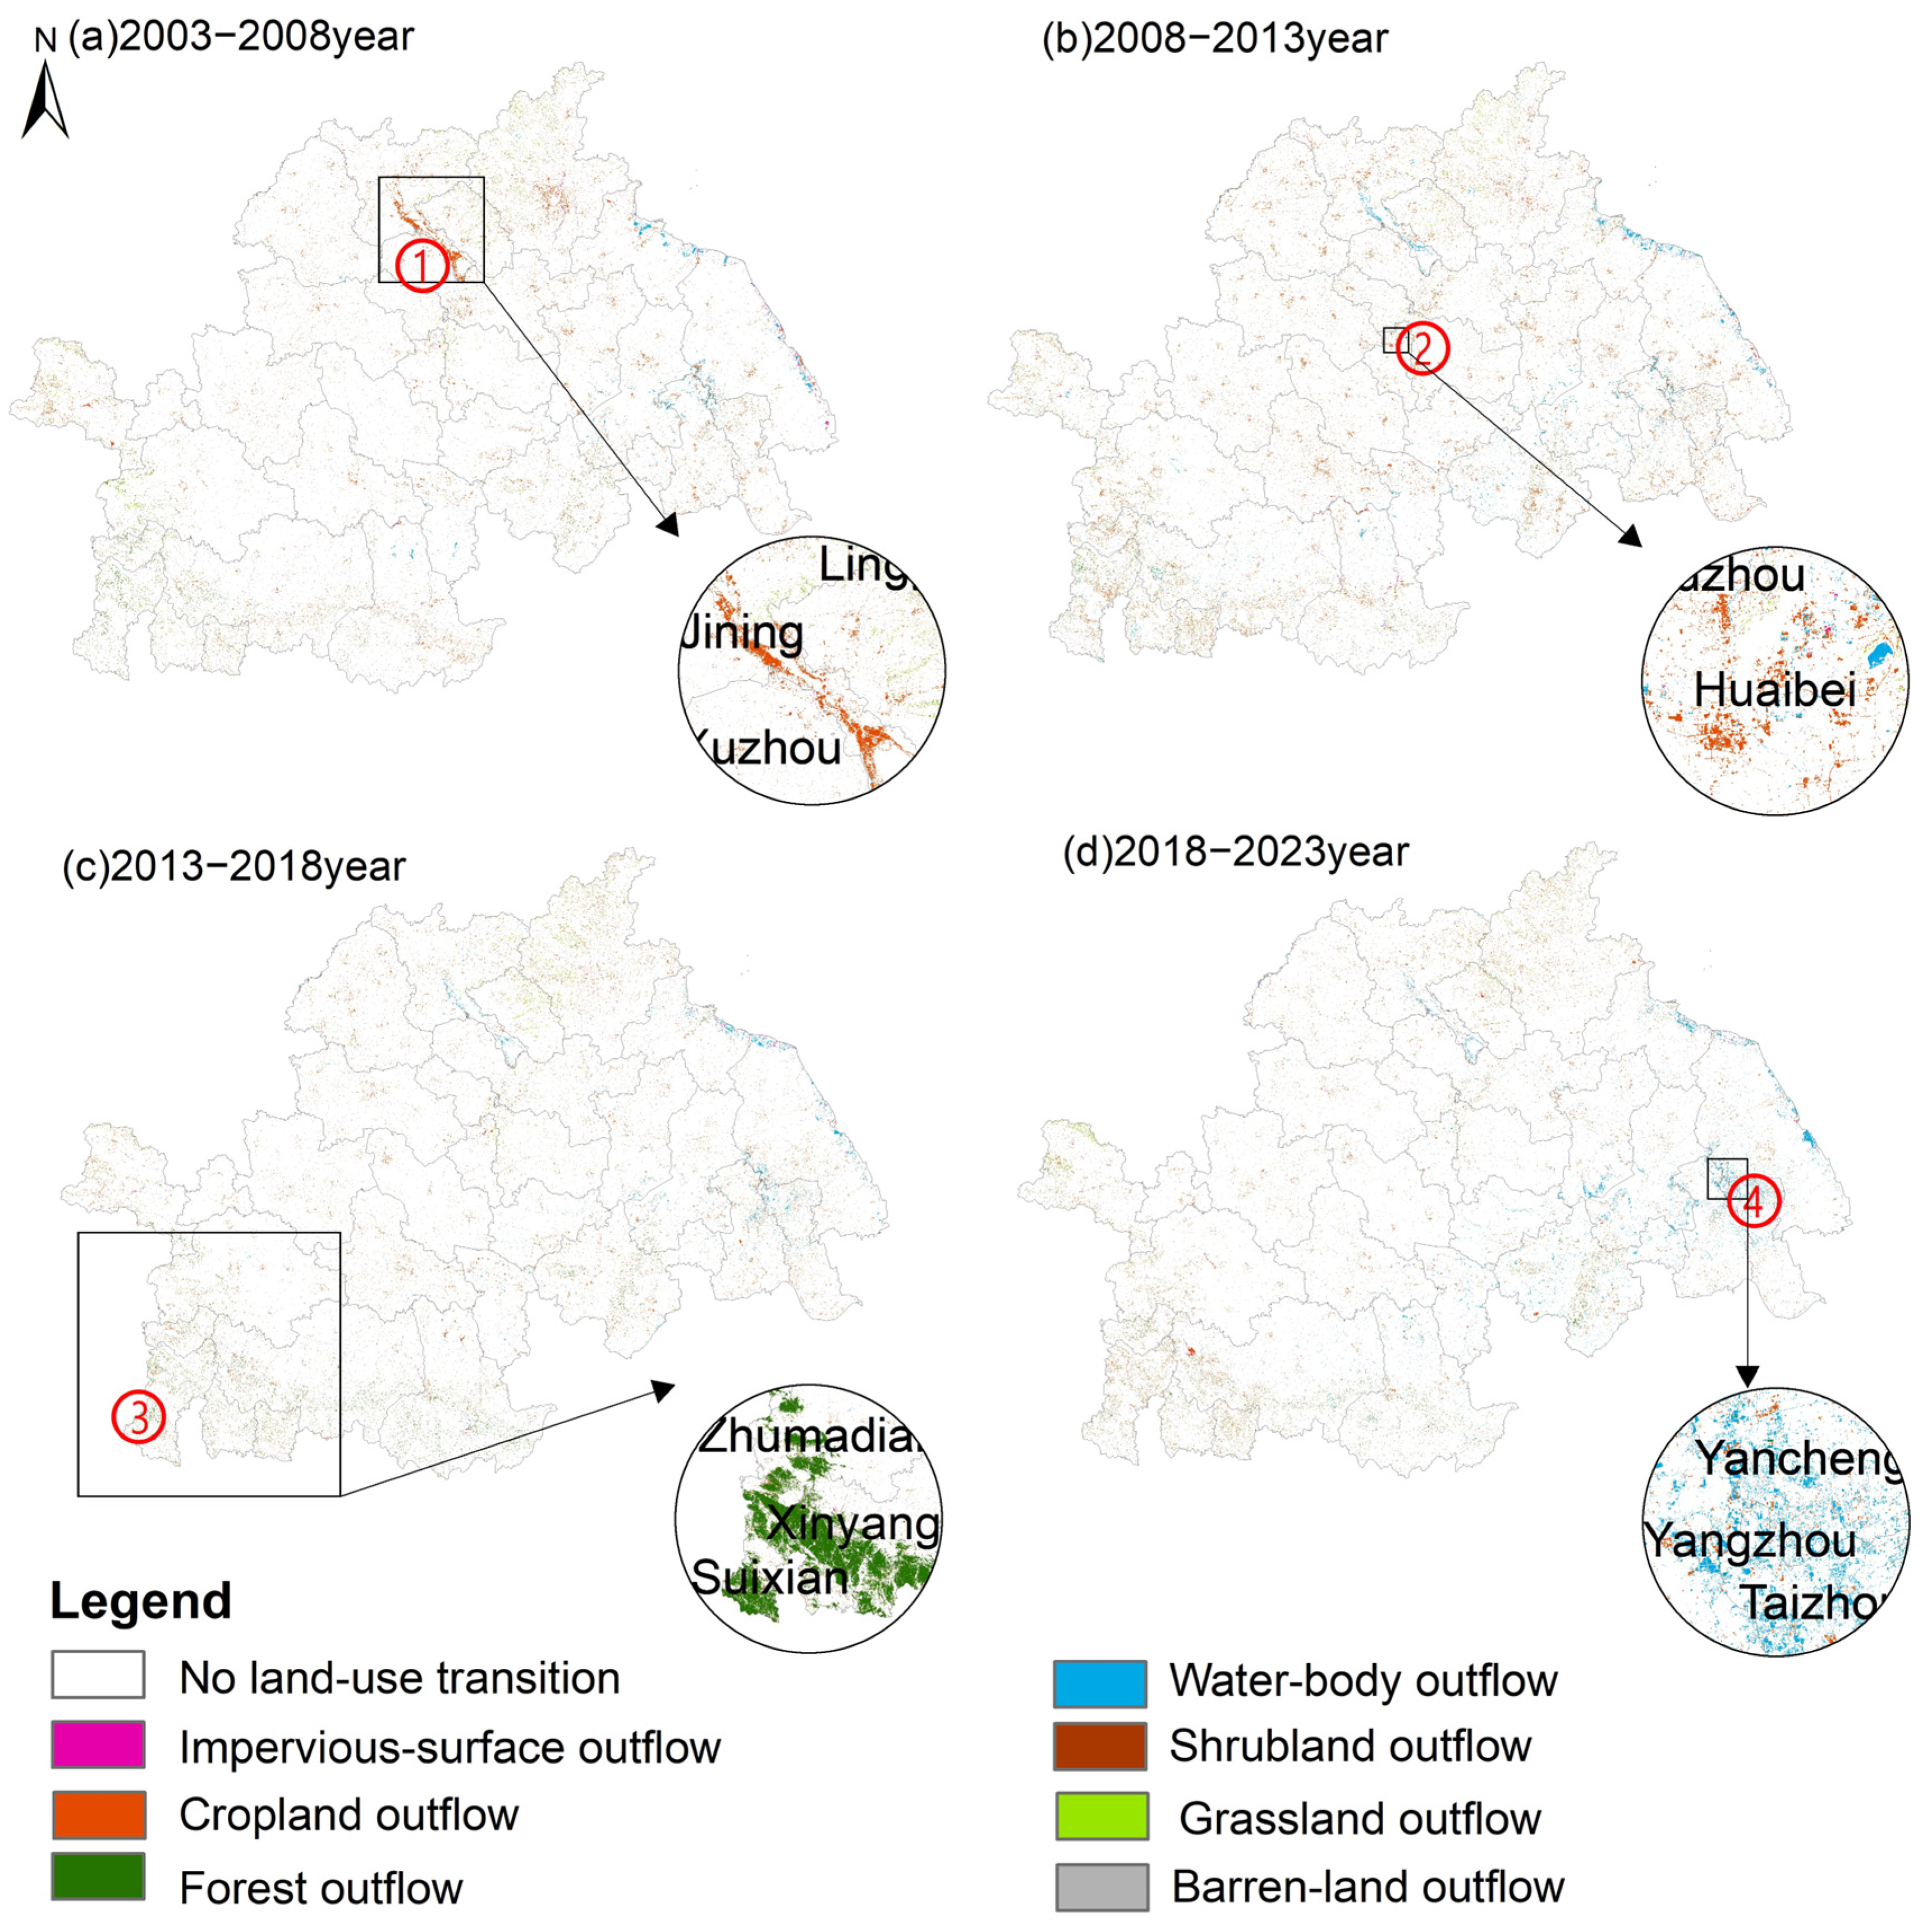
To characterize the spatial patterns of land use transitions in the Huaihe River Eco-Economic Belt from 2003 to 2023, land use data from consecutive periods were overlaid and analyzed using ArcGIS. For visualization in Figure 3, transition pathways originating from the same initial land-use type were aggregated into the corresponding outflow category, whereas areas where the land-use type remained unchanged were classified as “No land-use transition.” Overall, land use transitions during the study period were characterized by widespread dispersion and localized aggregation.
Figure 3.
Spatial distribution of land-use outflows.
During 2003–2008, the conversion of cropland to water bodies exhibited continuous belt-shaped aggregation in the Jining–Zaozhuang border area in the northern part of the study region, indicating that the transition intensity in this corridor area was significantly higher than that in surrounding regions. Considering the regional background, Nansi Lake in Jining and its river estuary areas experienced strengthened ecological protection and water environment management during this period. These management and restoration measures may have promoted the conversion of some cropland into wetland and water bodies areas through processes such as returning farmland to lakes, improving water bodies connectivity, and wetland restoration, resulting in the simultaneous expansion of water bodies and reduction in cropland in land use statistics. During 2008–2013, cropland outflow patches showed pronounced clustered aggregation in the area north of the Huaihe River. During 2013–2018, forest and grassland outflows were mainly concentrated along the mountainous belt extending from the southwestern to the southeastern parts of the study area, exhibiting distinct belt-shaped and localized aggregation patterns. During 2018–2023, in contrast to the scattered patch-like transitions observed across most of the study area, water bodies outflow exhibited a pronounced clustered pattern and was mainly distributed in the eastern part of the middle reaches of the Huaihe River and in downstream cities such as Huai’an and Yangzhou. The transition statistics further showed that water bodies were converted predominantly to impervious surfaces, with smaller areas converted to forest and grassland.
Impervious-surface expansion was concentrated around existing urban areas and exhibited both clustered and linear spatial patterns. Some linear patches occurred near transportation corridors. However, because impervious surfaces are represented as a single aggregated category in the CLCD product, these linear patterns cannot be attributed specifically to roads and may also include buildings, parking areas, or other paved surfaces. At the regional scale, impervious-surface expansion was more extensive in the northern part of the study area than in the southern part and was mainly concentrated in the plain areas north of Fuyang City.
3.2.3. Interaction Pathways of Land Use Transition
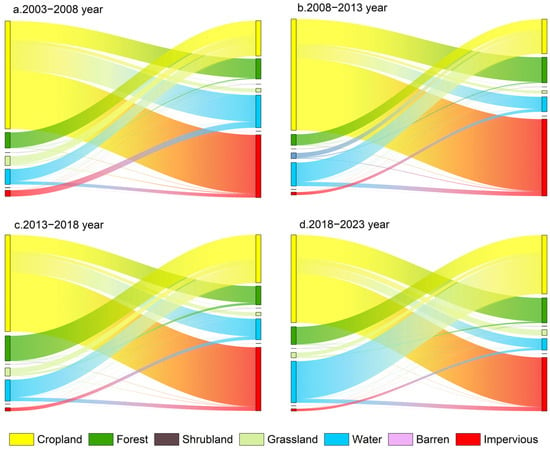
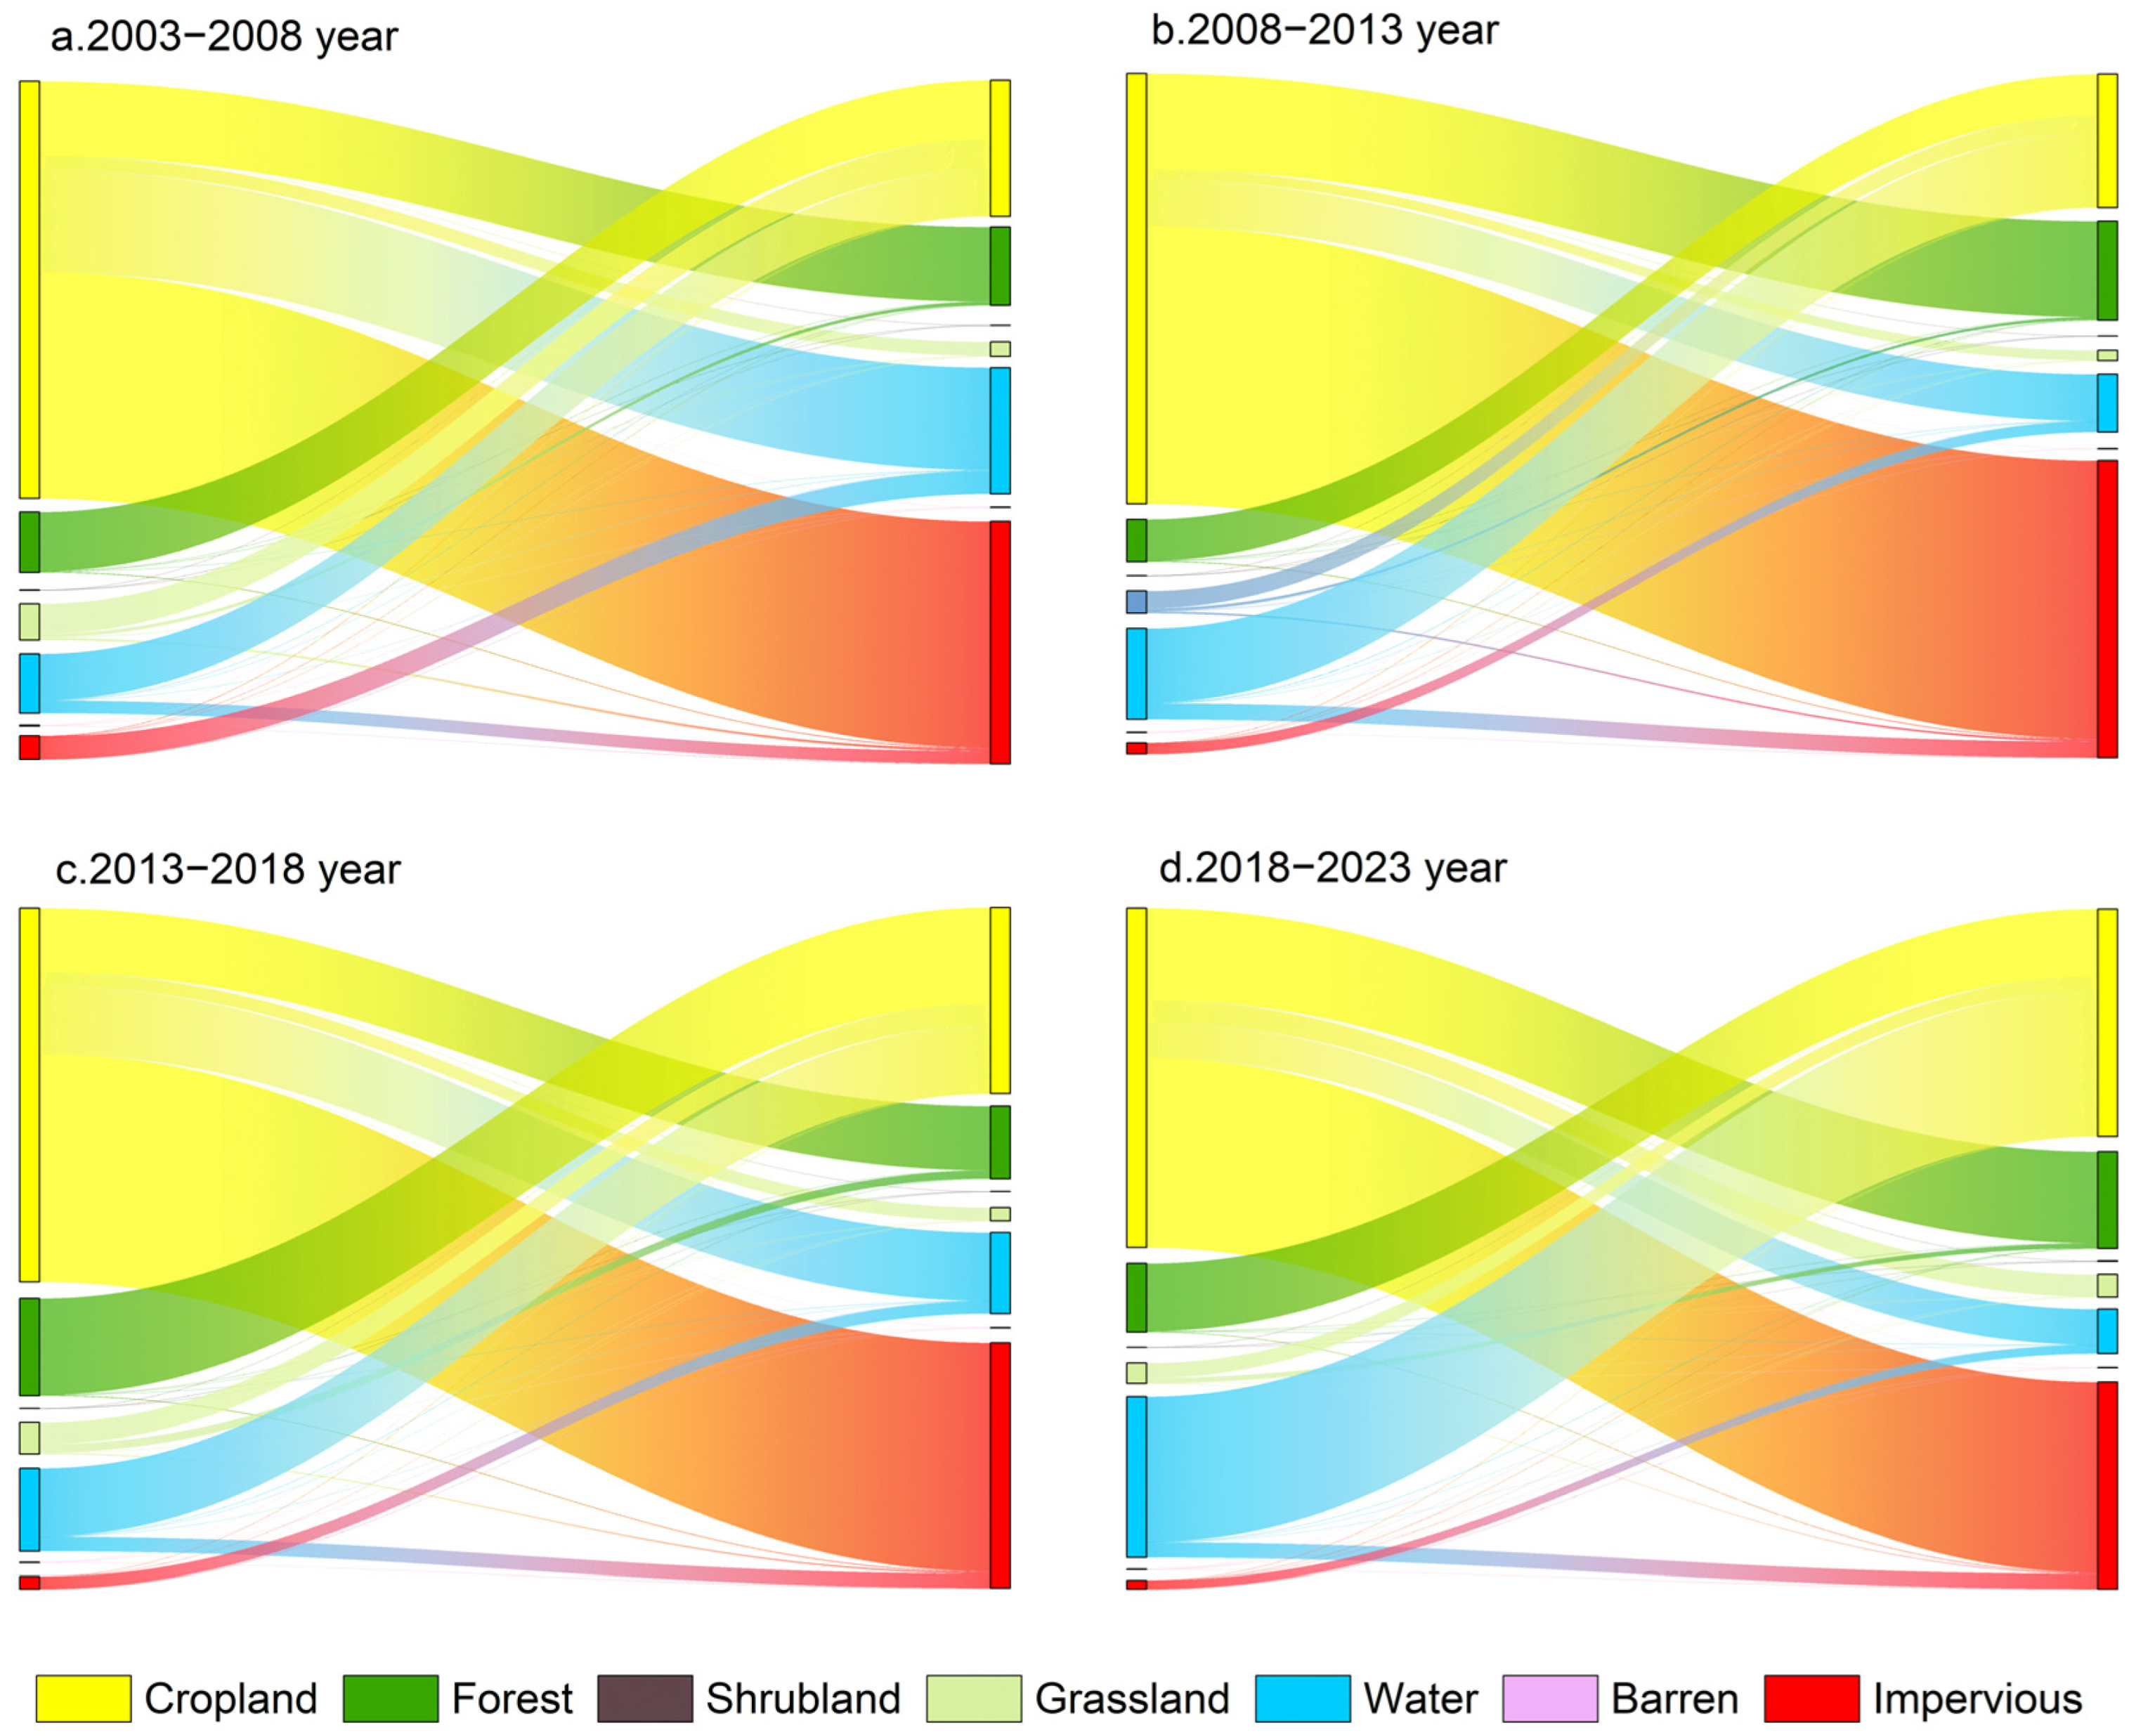
Based on land use transition data, a Sankey diagram was constructed to illustrate the interaction pathways among different land use types during the land use transition process in the study area, revealing the transition relationships and interaction intensities among various land use types. Combined with the Sankey diagram (Figure 4), it can be observed that from 2003 to 2023, cropland showed relatively strong transition relationships with forest and impervious surfaces in the Huaihe River Eco-Economic Belt, while forest, grassland, and water bodies exhibited relatively strong transition relationships with cropland. Among the four periods, 2008–2013 had the largest number of transitioned pixels, characterized by increased cropland outflow and impervious-surface inflow, characterized by an overall thickening of the transition network and significantly enhanced inflow of impervious surfaces. During this period, cropland acted as the main transition-out type and remained in a long-term state of net outflow, which is highly consistent with the findings of Sun et al. (2023) and Zhu et al. (2024) that cropland area in the Huaihe River Eco-Economic Belt has experienced substantial decline over the past three decades and that impervious surfaces have continuously expanded into cropland areas [40,41].
Figure 4.
Land use interaction network from 2003 to 2023.
Impervious surfaces represented a significant net inflow land use type during all periods. The transition of water bodies showed obvious temporal variations. During 2003–2008, cropland conversion to water bodies was relatively prominent and contributed to the net increase in water bodies. However, during the later period, especially from 2018 to 2023, the outflow of water bodies increased, and transition hotspots were more likely to form belt-shaped patterns in the eastern river network areas, resulting in an overall decrease in water areas. Stable bidirectional transition relationships existed between forest and cropland throughout the study period. Forest showed a temporary net decrease during 2013–2018 but generally recovered and increased during other periods, reflecting the fluctuation characteristics of ecological land adjustment. In contrast, transitions involving shrubland and barren land were relatively limited and contributed little to the overall land use structure.
The nodes on the left and right sides represent land use types at the beginning and end of each five-year period, respectively. The width of each link is proportional to the number of raster pixels converted from the initial land use type to the final land use type, with wider links indicating a larger transition magnitude. The size of each left-side node represents the total number of pixels transferred out of that land use type, whereas the size of each right-side node represents the total number of pixels transferred into that land use type. Pixels that remained within the same land use category were excluded from the Sankey diagrams.
3.2.4. Multi-Scenario Simulation of Land Use Evolution
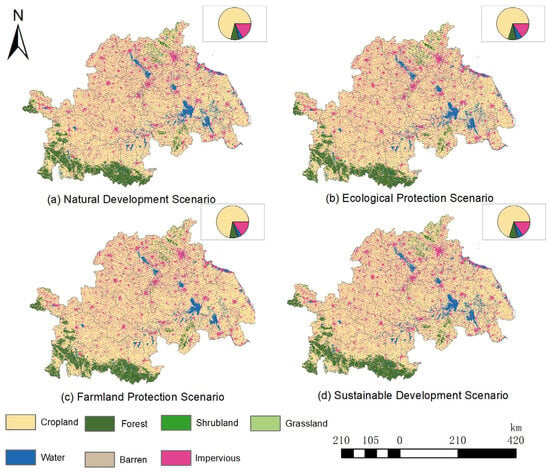
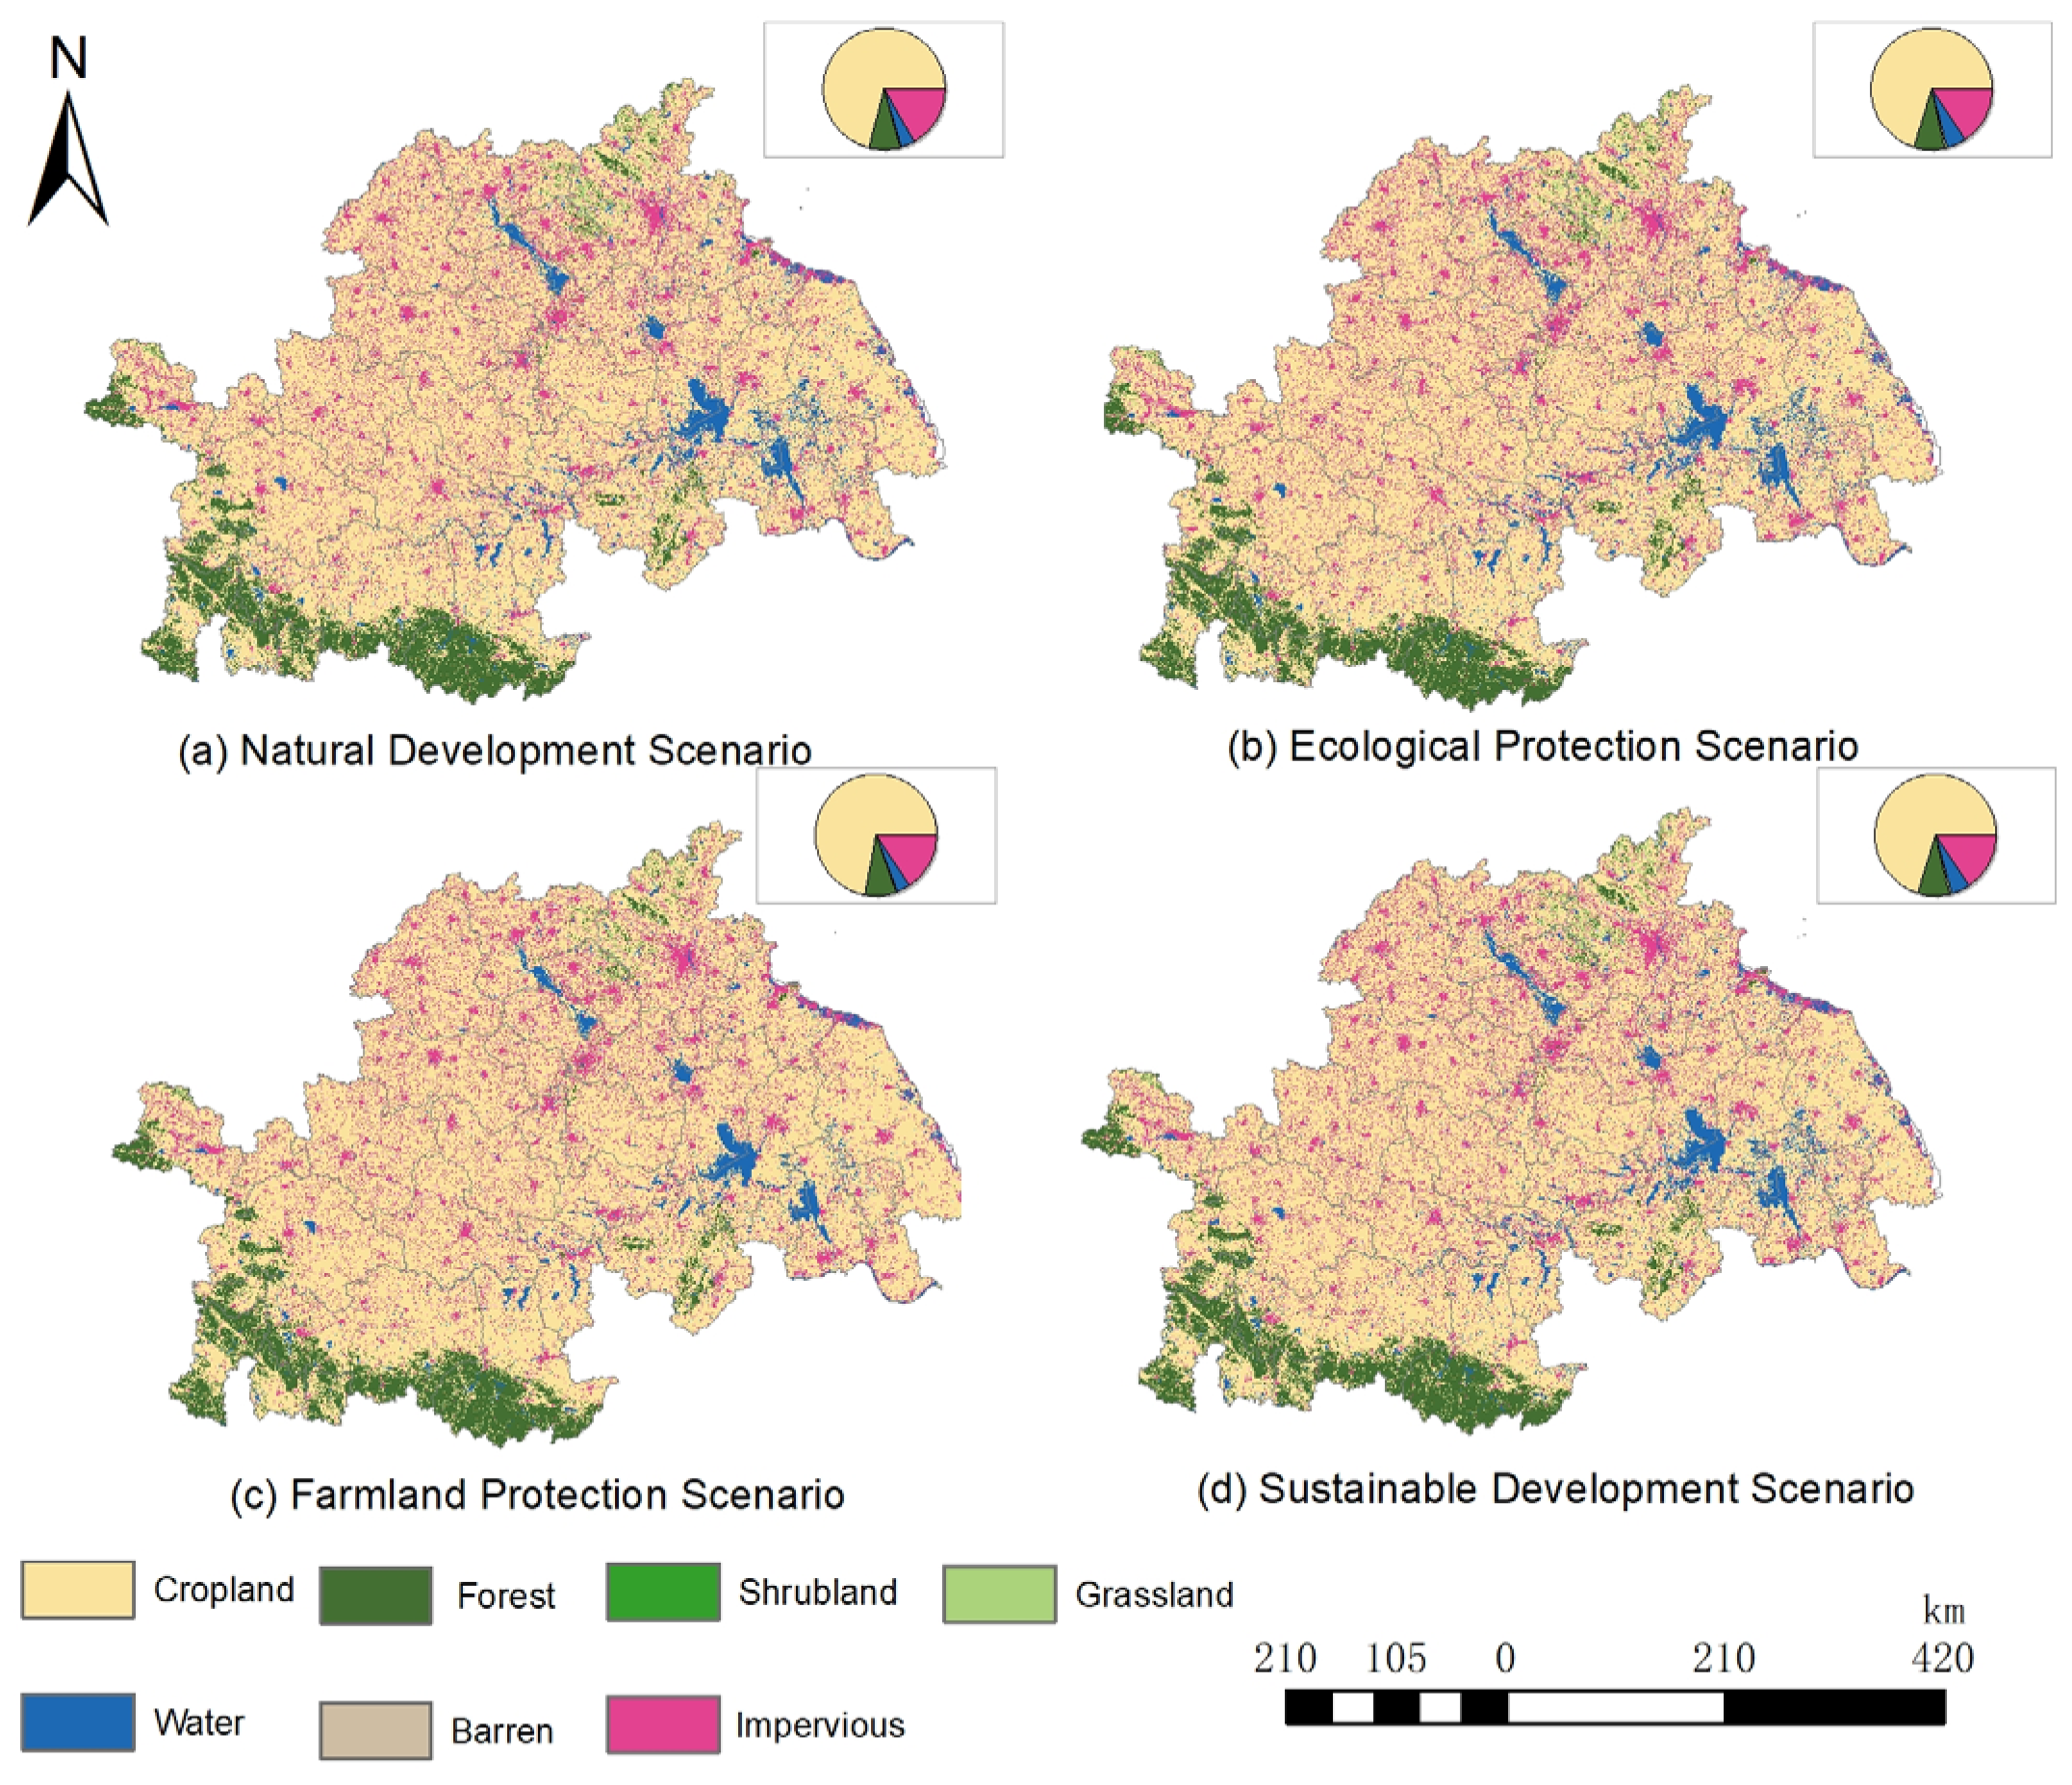
The 2023 simulation achieved a Kappa coefficient of 0.76, an overall accuracy of 0.89, and a Figure of Merit (FOM) value of 0.42, supporting the application of the calibrated PLUS model to the 2033 simulations. The four scenarios exhibited broadly similar spatial patterns, but differed quantitatively in the areas of several land-use types (Figure 5).
Figure 5.
Spatial distribution and composition of land-use types under four scenarios in 2033.
Under the Natural Development Scenario, cropland remained the dominant land use type, with an area of 188,089.77 km2, accounting for a large proportion of the total area. It was followed by impervious surfaces (44,754 km2) and forest (21,976.6 km2). This scenario was used as the reference for comparison with the other scenarios.
Under the Ecological Protection Scenario, cropland remained the dominant land use type, with an area of 185,892.92 km2. Compared with the Natural Development Scenario, impervious surfaces decreased by 2599.48 km2 to 42,154.52 km2, whereas water bodies increased by 3902.20 km2 to 13,562.79 km2. Forest increased by 73.46 km2 to 22,049.96 km2. Under the Farmland Protection Scenario, cropland reached 191,016.47 km2, representing an increase of 2926.70 km2 relative to the Natural Development Scenario and the largest cropland area among the four scenarios. Impervious surfaces decreased by 3037.33 km2 to 41,716.67 km2, the lowest value among the scenarios, while forest increased by 81.73 km2 to 22,058.23 km2. Under the Sustainable Development Scenario, cropland and forest covered 186,270.23 km2 and 22,014.29 km2, respectively. Compared with the Natural Development Scenario, impervious surfaces decreased by 2962.69 km2 to 41,791.31 km2, while water bodies and grassland increased to 3897.99 km2 and 845.64 km2 to 13,558.58 km2 and 1708.98 km2 respectively. Its land-use composition was broadly similar to that of the Ecological Protection Scenario.
Overall, the largest differences among the four scenarios occurred in cropland, impervious surfaces, water bodies, and grassland, whereas forest, shrubland, and barren land varied only slightly. The Farmland Protection Scenario retained the largest cropland area and the smallest impervious-surface area, while the Ecological Protection and Sustainable Development scenarios produced larger areas of water bodies and grassland.
3.3. Analysis of Driving Factors
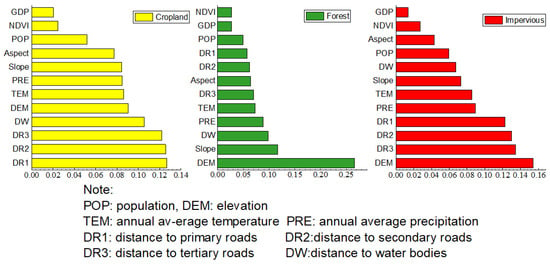
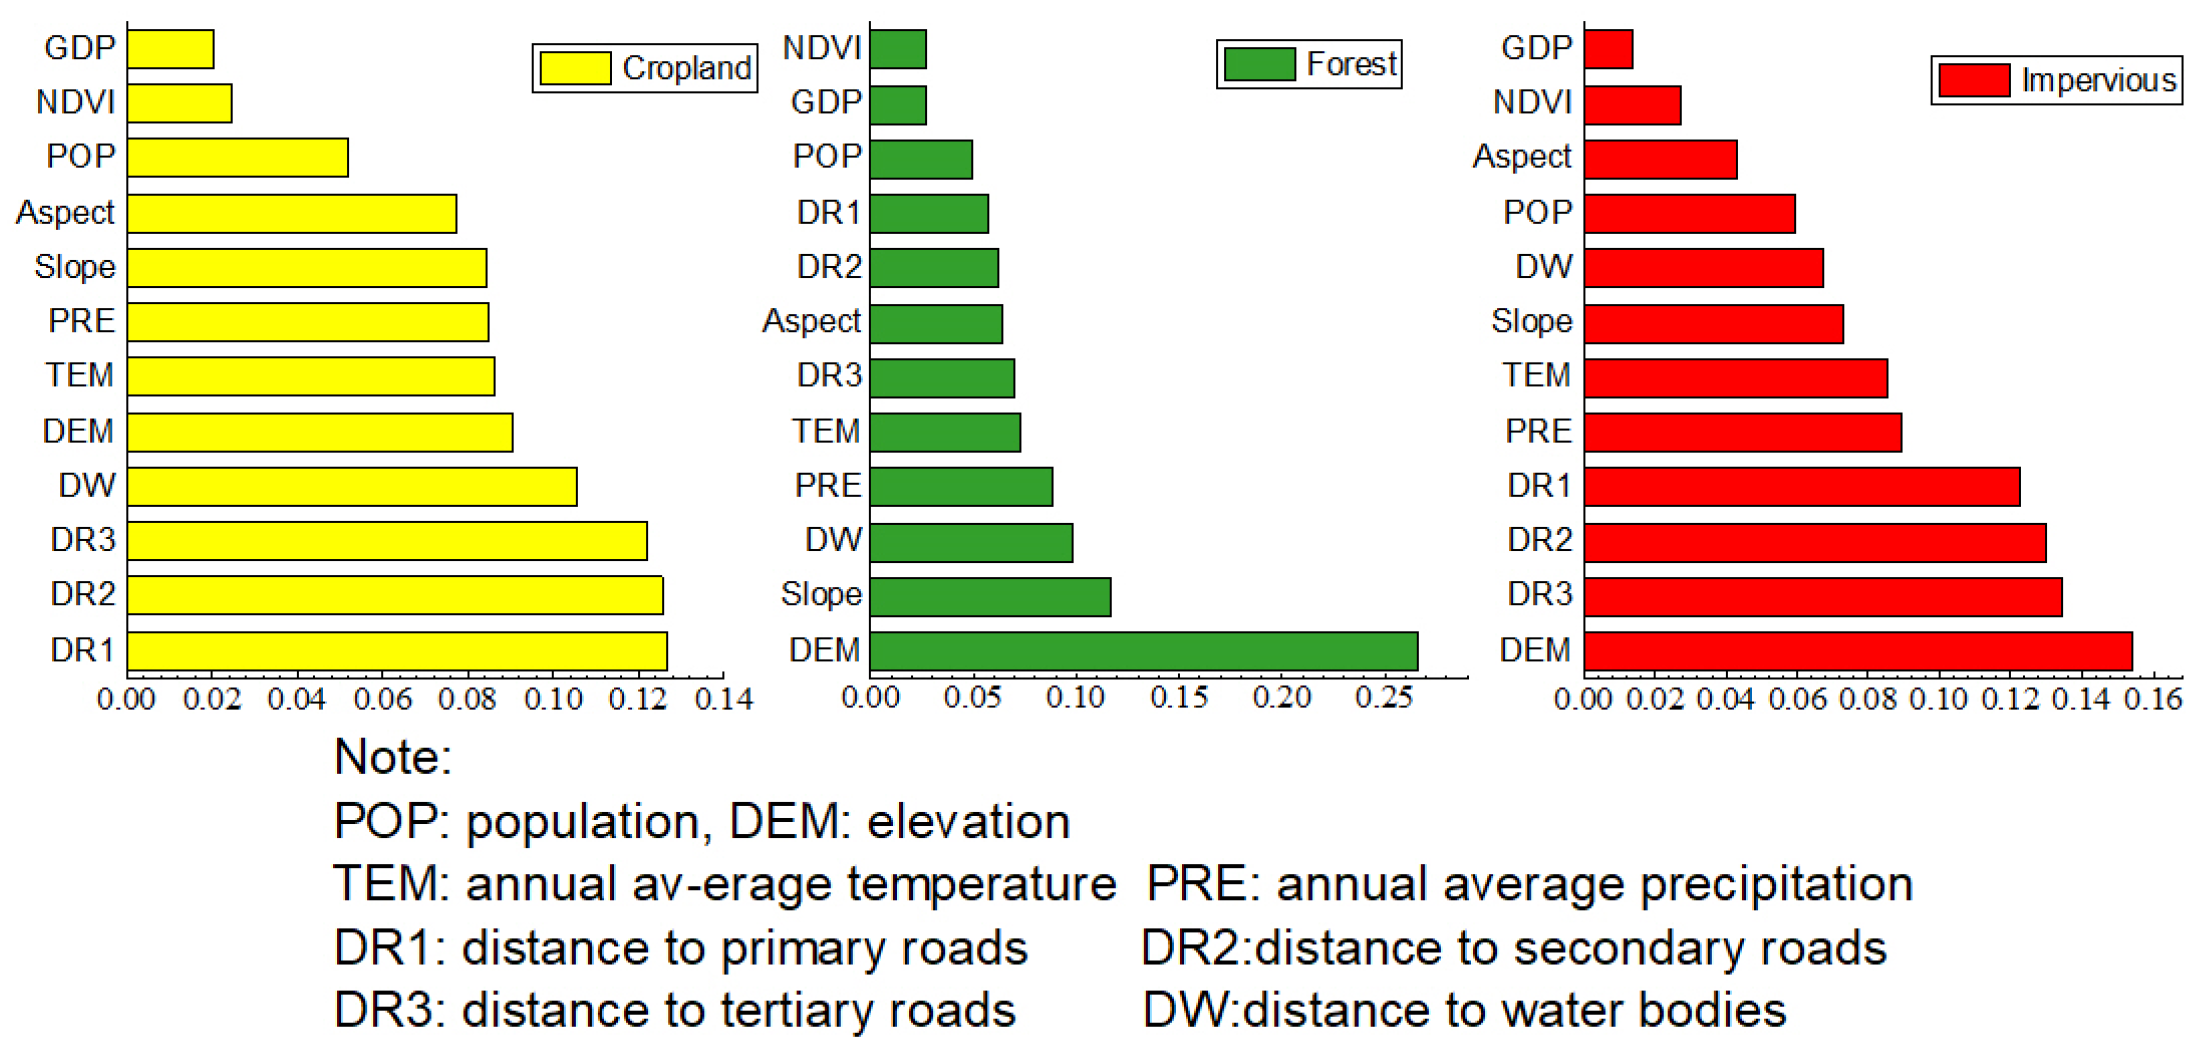
The PLUS model provides two approaches for land demand prediction based on historical data: linear regression and the Markov chain method. In this study, the Markov chain method was adopted. The land use data from 2003 and 2023 were reclassified in ArcGIS and imported into the PLUS model to analyze the driving factors of cropland change in the Huaihe River Eco-Economic Belt. Considering that land use change in the study area from 2003 to 2023 was mainly characterized by continuous net outflow of cropland, continuous expansion of impervious surfaces, and representative ecological responses associated with forest changes, this study focused on the contribution results of driving factors for three land use types: cropland, forest, and impervious surfaces. Changes in other land use types were relatively limited and contributed less to regional land use pattern evolution; therefore, they were not presented separately. The results are shown in Figure 6 and Figure 7.
Figure 6.
Contribution of driving factors to changes in cropland, forest, and impervious-surface areas.
Figure 7.
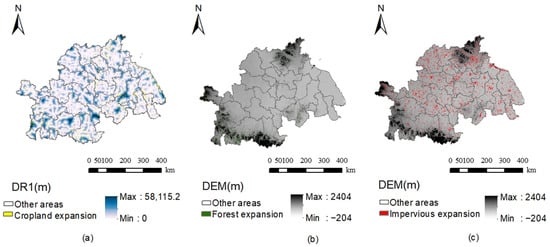
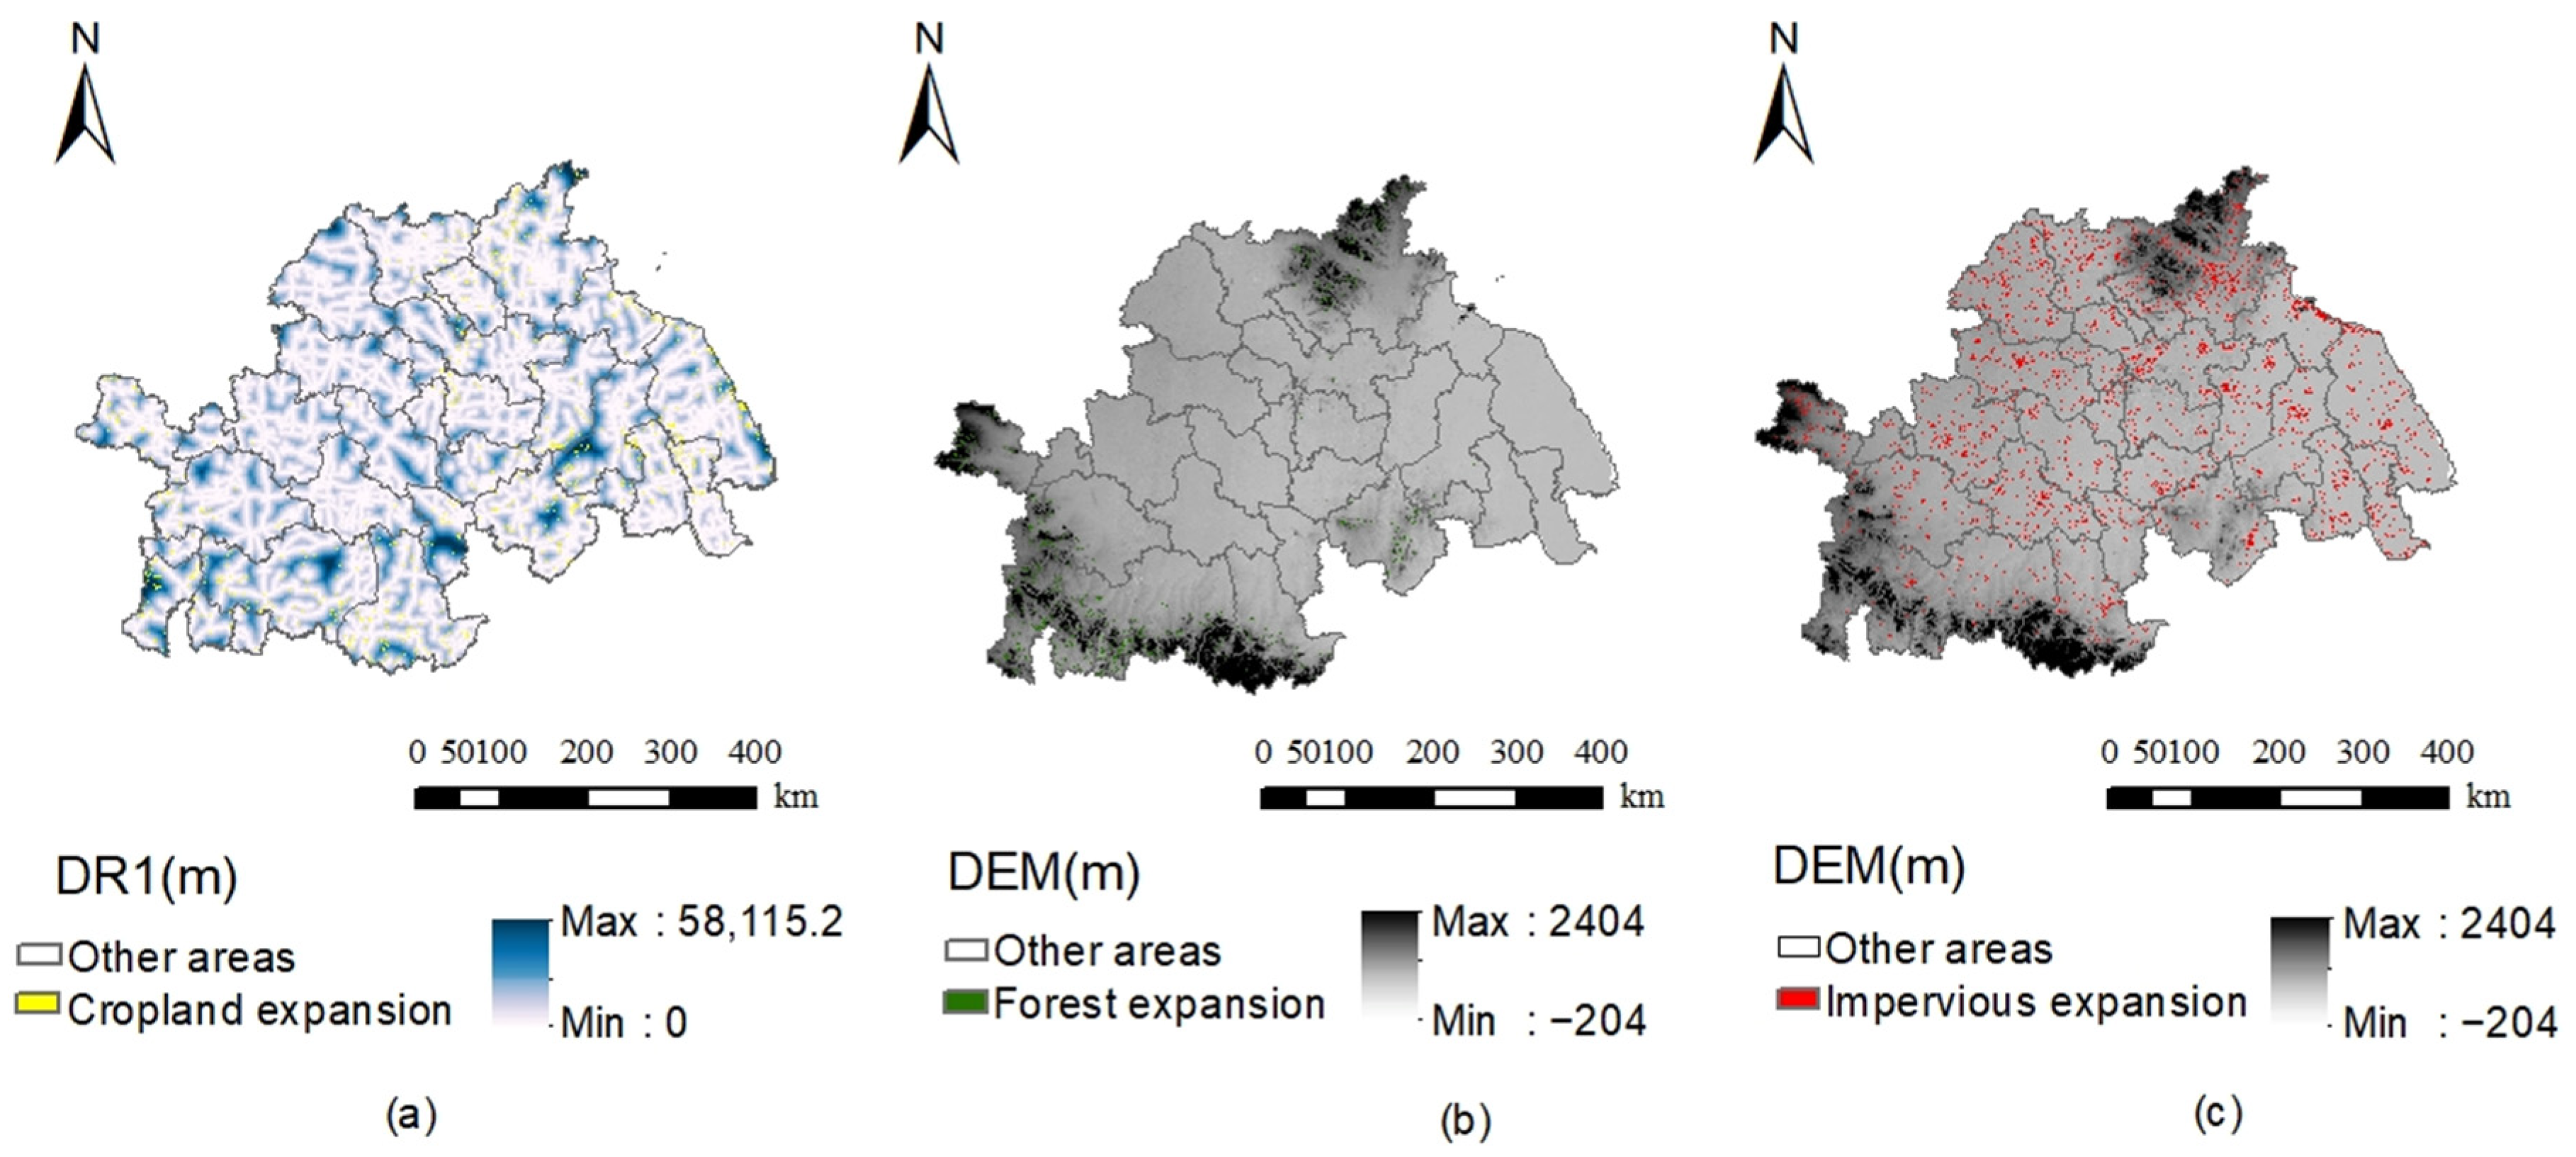
Overlay of increased areas of cropland (a), forest (b), and impervious surface (c) with their highest contribution factors.
Figure 6 and Figure 7 indicate that changes in different land use types were jointly influenced by natural environmental and socioeconomic factors, but the driving mechanisms varied among land use types. Changes in cropland and impervious surfaces were mainly affected by socioeconomic factors, particularly transportation accessibility, reflecting the dominant role of rapid urbanization and infrastructure development in shaping land use patterns during the study period. This finding is also consistent with the study by Sheng et al. (2025), which investigated the driving mechanisms of cropland resources in the Huaihe River Eco-Economic Belt [42].
Forest changes were mainly controlled by natural environmental factors, including elevation, slope, and precipitation, indicating that the distribution of ecological land remains strongly constrained by topographic conditions and ecological background. Since 2003, China has implemented a series of ecological restoration projects, including the Grain for Green Program and the second phase of the Natural Forest Protection Project. Consequently, forest changes have been increasingly influenced by ecological restoration policies and natural suitability, while showing relatively limited associations with transportation accessibility or population distribution.
The expansion of impervious surfaces was primarily driven by socioeconomic factors, including GDP, population density, and distances to primary, secondary, and tertiary roads. with their contributions substantially exceeding those of natural environmental factors. Overall, anthropogenic factors exerted a stronger influence than natural environmental factors on land use change, and regional land use evolution exhibited distinct characteristics of human–land coupling.
3.4. Analysis of Habitat-Quality Changes
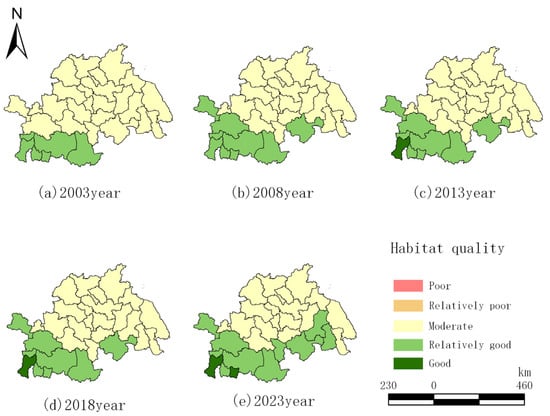
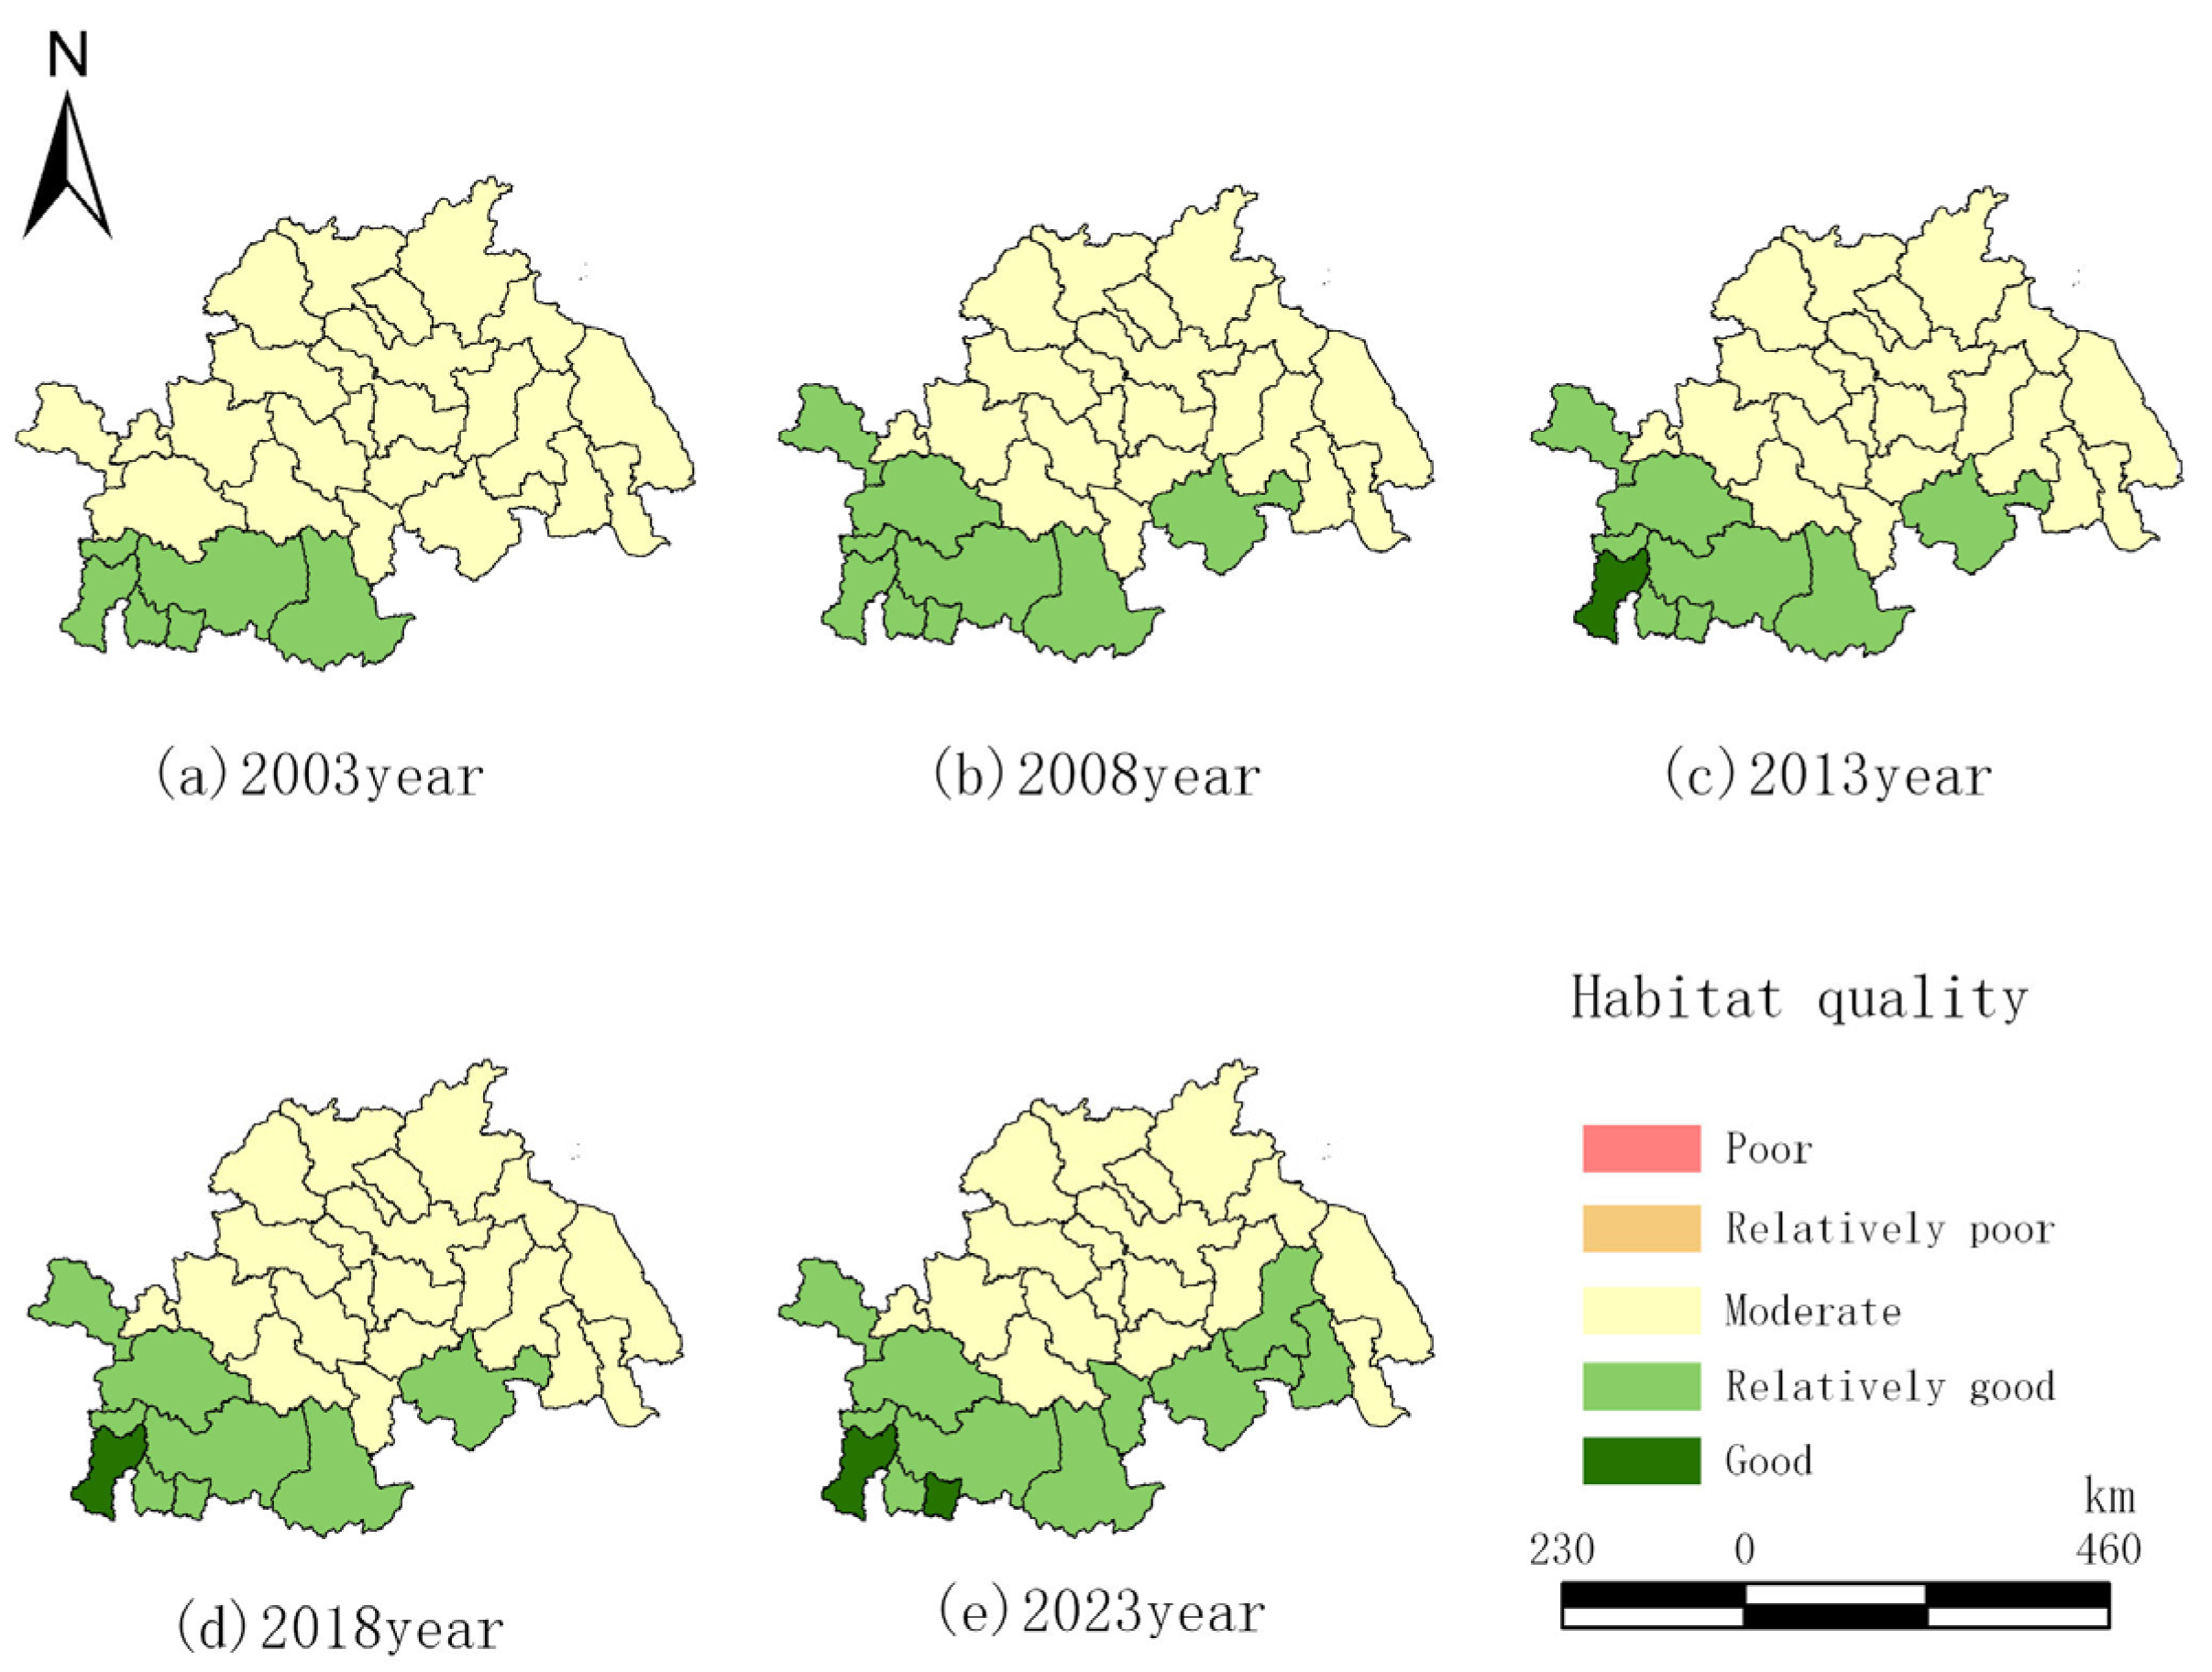
As shown in Figure 8, the mean habitat quality of the study area increased from 0.588 in 2003 to 0.628 in 2023, representing an overall increase of 6.78%. Temporally, habitat quality exhibited a three-stage pattern of slow increase, relative stability, and rapid improvement. The mean value increased by 1.06% during 2003–2008, remained relatively stable during 2008–2018, and increased by 5.66% during 2018–2023.
Figure 8.
Distribution of scenario-based habitat quality from 2003 to 2023.
Spatially, habitat quality was generally higher in the south and lower in the north. Areas with relatively high habitat quality were mainly distributed along the southern part of the study area, extending eastward from Tongbai County, whereas moderate-quality areas were concentrated primarily in the northern plains, where human disturbance was relatively intensive.
In terms of habitat-quality composition, no areas were classified as poor or relatively poor in any of the five study years. The proportion of relatively good and good habitat increased from 20.7% in 2003 to 41.4% in 2023, while the good class first appeared in 2013 and increased to 6.9% by 2023. These results indicate an overall improvement in habitat quality accompanied by increasing spatial differentiation within the study area.
3.5. Habitat Quality Responses Under Different Future Land Use Scenarios
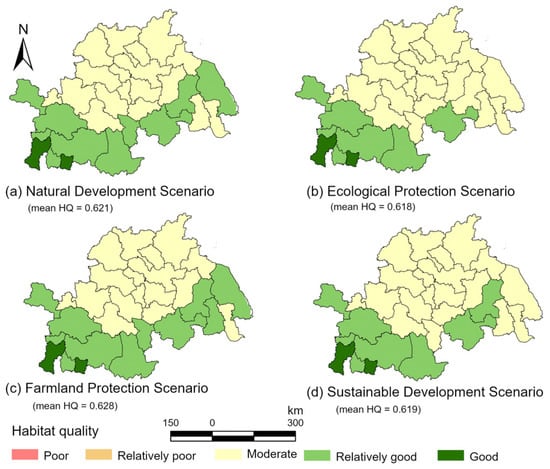
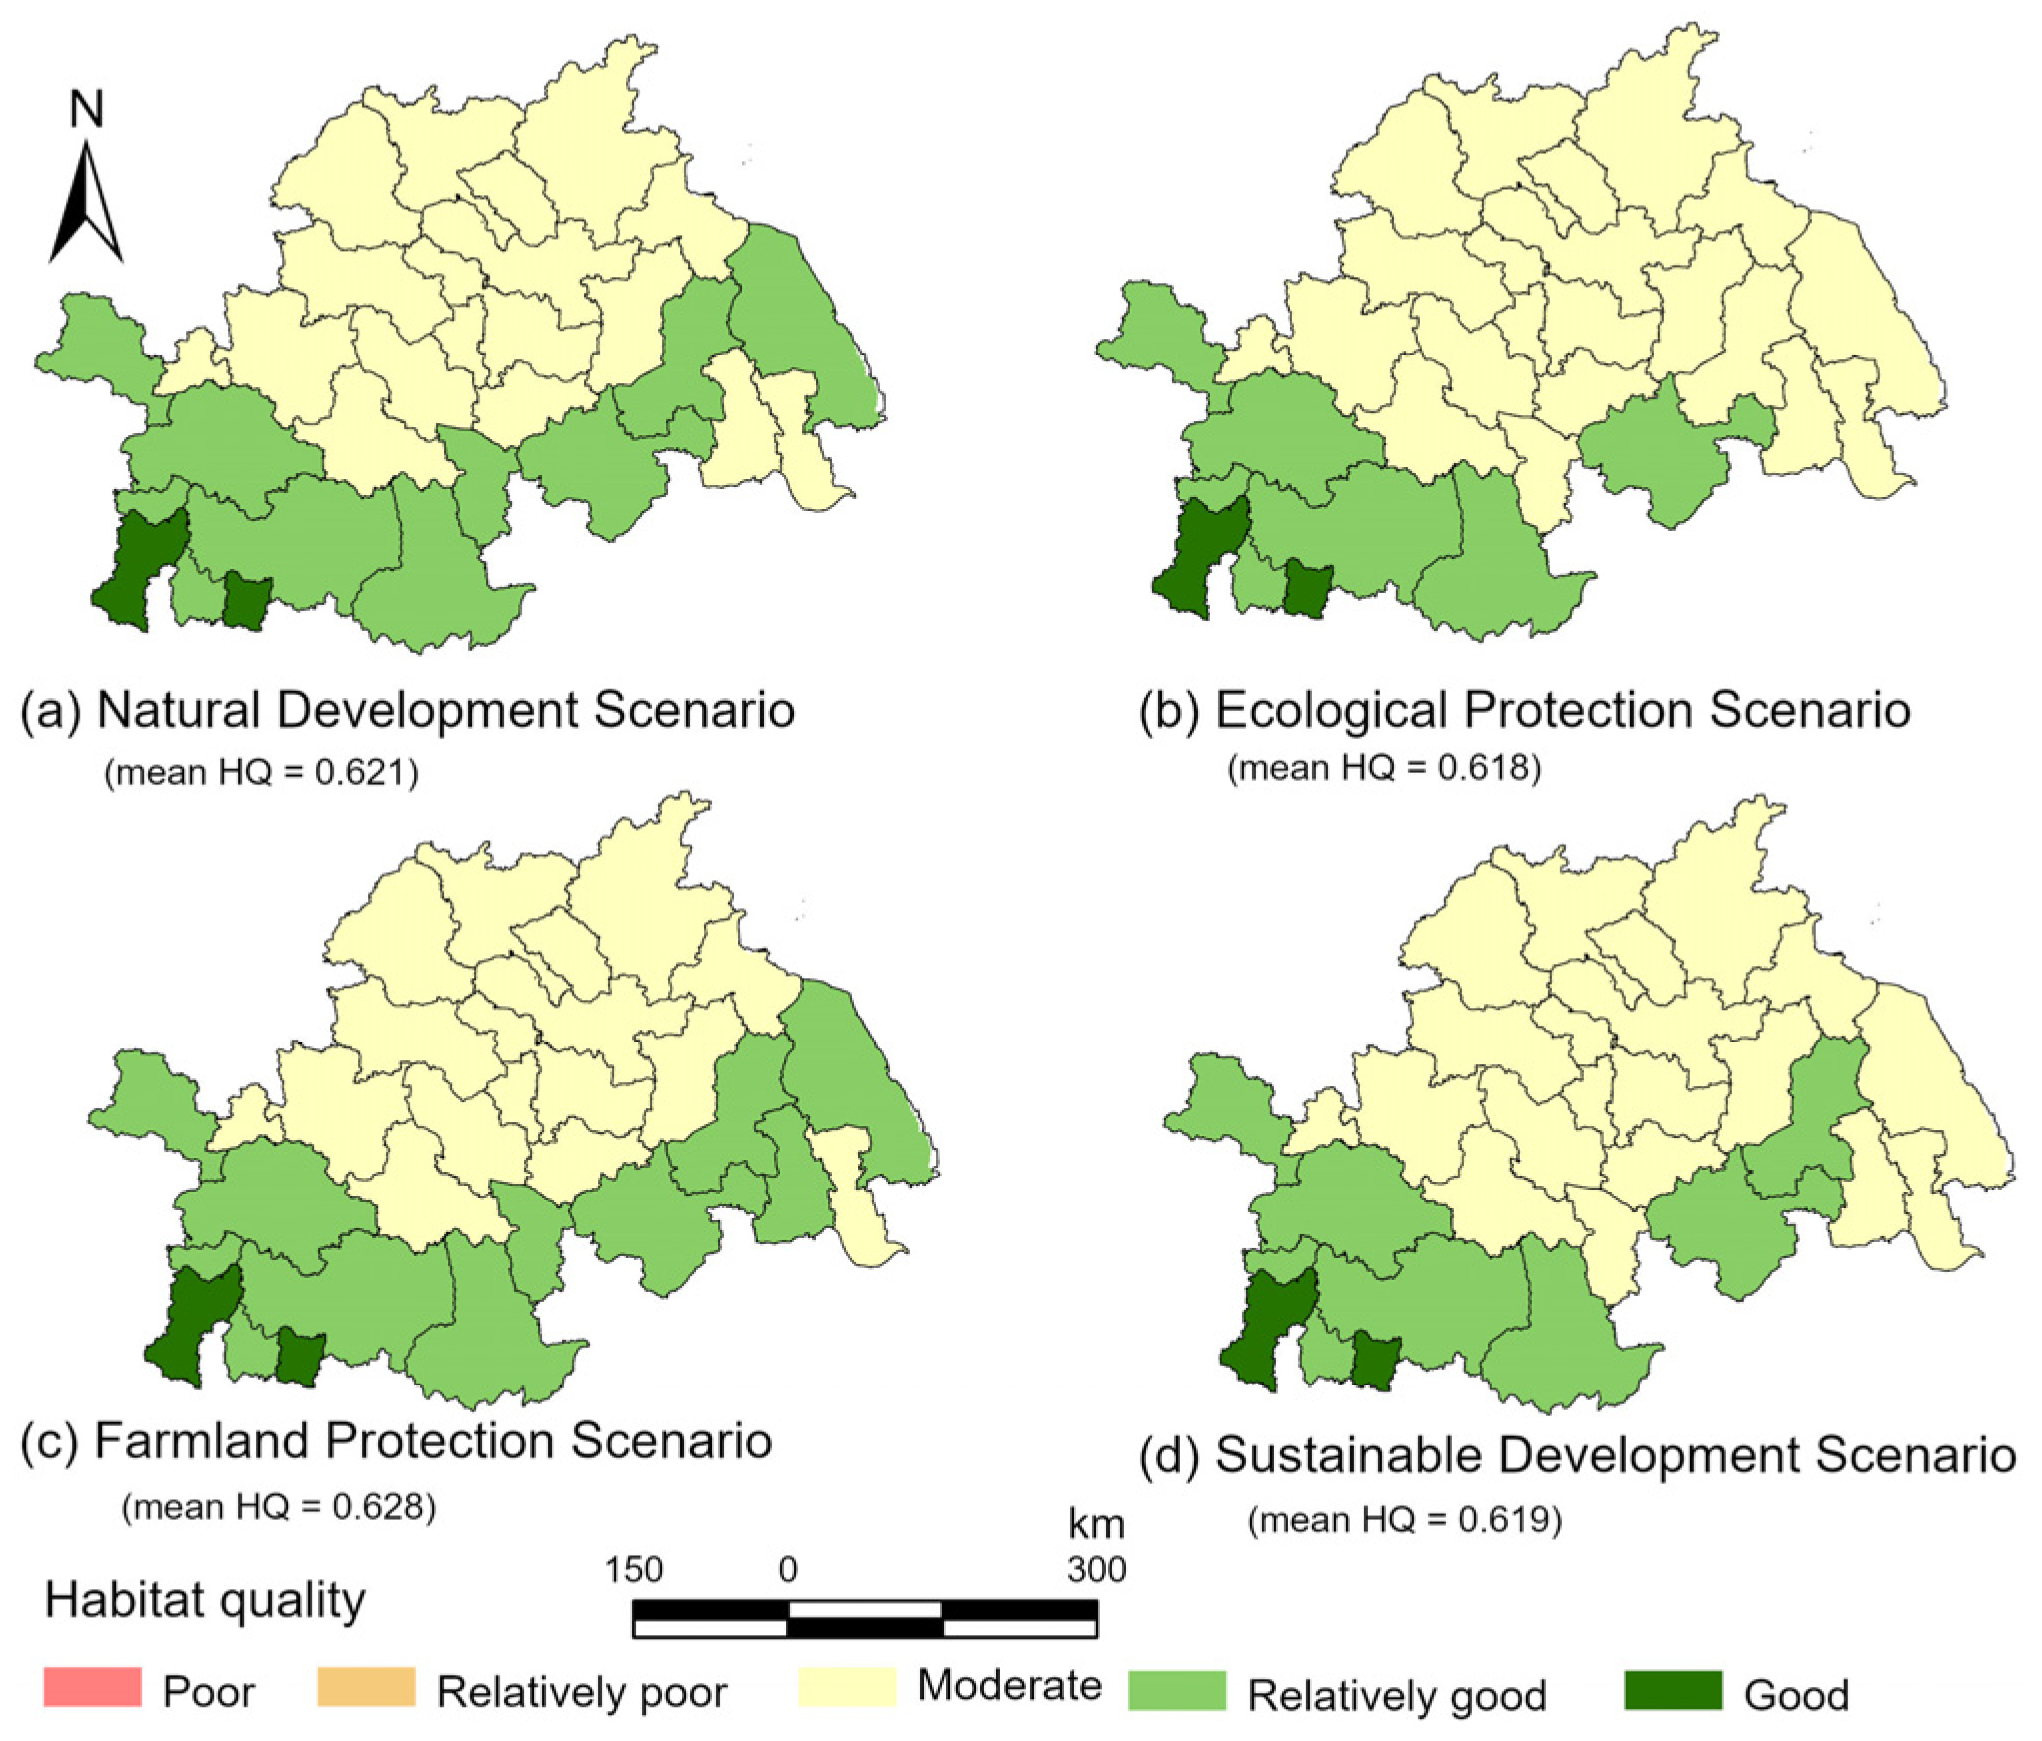
The four scenarios exhibited broadly similar spatial patterns of habitat quality, although modest quantitative differences were observed in the mean values and the distribution of habitat-quality classes among the 29 administrative units (Figure 9).
Figure 9.
Distribution of administrative-unit mean habitat quality under four scenarios in 2033.
Under the Natural Development Scenario (N), the mean habitat quality of the study area was 0.621, with values ranging from 0.517 to 0.859. Seventeen of the 29 administrative units (58.6%) were classified as having moderate habitat quality, whereas the remaining 12 units (41.4%) were classified as having relatively good or good habitat quality. No administrative units had a mean habitat-quality value within the poor or relatively poor classes. Suixian County exhibited the highest habitat quality value (0.859), and together with Dawu County, was assigned to the highest habitat-quality class. The Natural Development Scenario was used as the reference for the subsequent quantitative comparisons.
Under the Ecological Protection Scenario (E), the mean habitat quality was 0.618, ranging from 0.520 to 0.855. Nineteen of the 29 administrative units (65.5%) were classified as having moderate habitat quality, whereas the remaining 10 units (34.5%) were classified as having relatively good or good habitat quality. No administrative unit had a mean habitat-quality value within the poor or relatively poor classes. The lowest value was recorded in Xuzhou City (0.520). Relative to the Natural Development Scenario, the mean habitat quality decreased by 0.003, corresponding to approximately 0.48%, and the number of units in the relatively good and good classes decreased from 12 to 10. This result indicates that, under the current model settings, the Ecological Protection Scenario did not yield a higher regional mean habitat quality than the Natural Development Scenario during the simulated period. However, the small difference should not be interpreted as evidence that ecological protection adversely affects habitat quality. Rather, it indicates that the restrictions imposed on selected land-use transitions did not translate into uniform habitat-quality improvements across the administrative units under the simulated spatial allocation of land use.
Under the Farmland Protection Scenario (F), the mean habitat quality reached 0.628, which was 0.007, or approximately 1.13%, higher than that under the Natural Development Scenario and was the highest among the four scenarios. The values ranged from 0.527 to 0.859. Relatively good and good habitat occurred in 13 of the 29 administrative units (44.8%), whereas moderate-quality habitat occurred in 16 units (55.2%). At the administrative-unit level, none of the 29 units had a mean habitat-quality value within the poor or relatively poor classes. These results indicate a modest improvement in mean habitat quality and habitat-quality class composition relative to the Natural Development Scenario, although the magnitude of the difference remained limited.
Under the Sustainable Development Scenario (S), the mean habitat quality was 0.619, with values ranging from 0.521 to 0.855. Moderate-quality habitat occurred in 19 of the 29 administrative units (65.5%), whereas relatively good and good habitat occurred in 10 units (34.5%). Compared with the Natural Development Scenario, the mean habitat quality decreased by 0.002, or approximately 0.32%, indicating that the regional habitat-quality pattern remained broadly stable under the Sustainable Development Scenario.
Across the four scenarios, mean habitat quality followed the order Farmland Protection (0.628) > Natural Development (0.621) > Sustainable Development (0.619) > Ecological Protection (0.618). The maximum difference among the scenario means was only 0.010, indicating modest rather than substantial variation in regional habitat quality under the different development pathways.
3.6. Habitat Contribution Characteristics of Key Land Use Transition Pathways
3.6.1. Key Contribution Pathways During the Historical Period
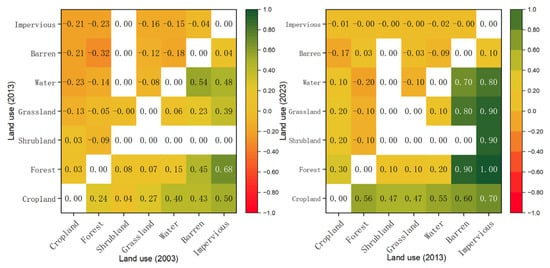
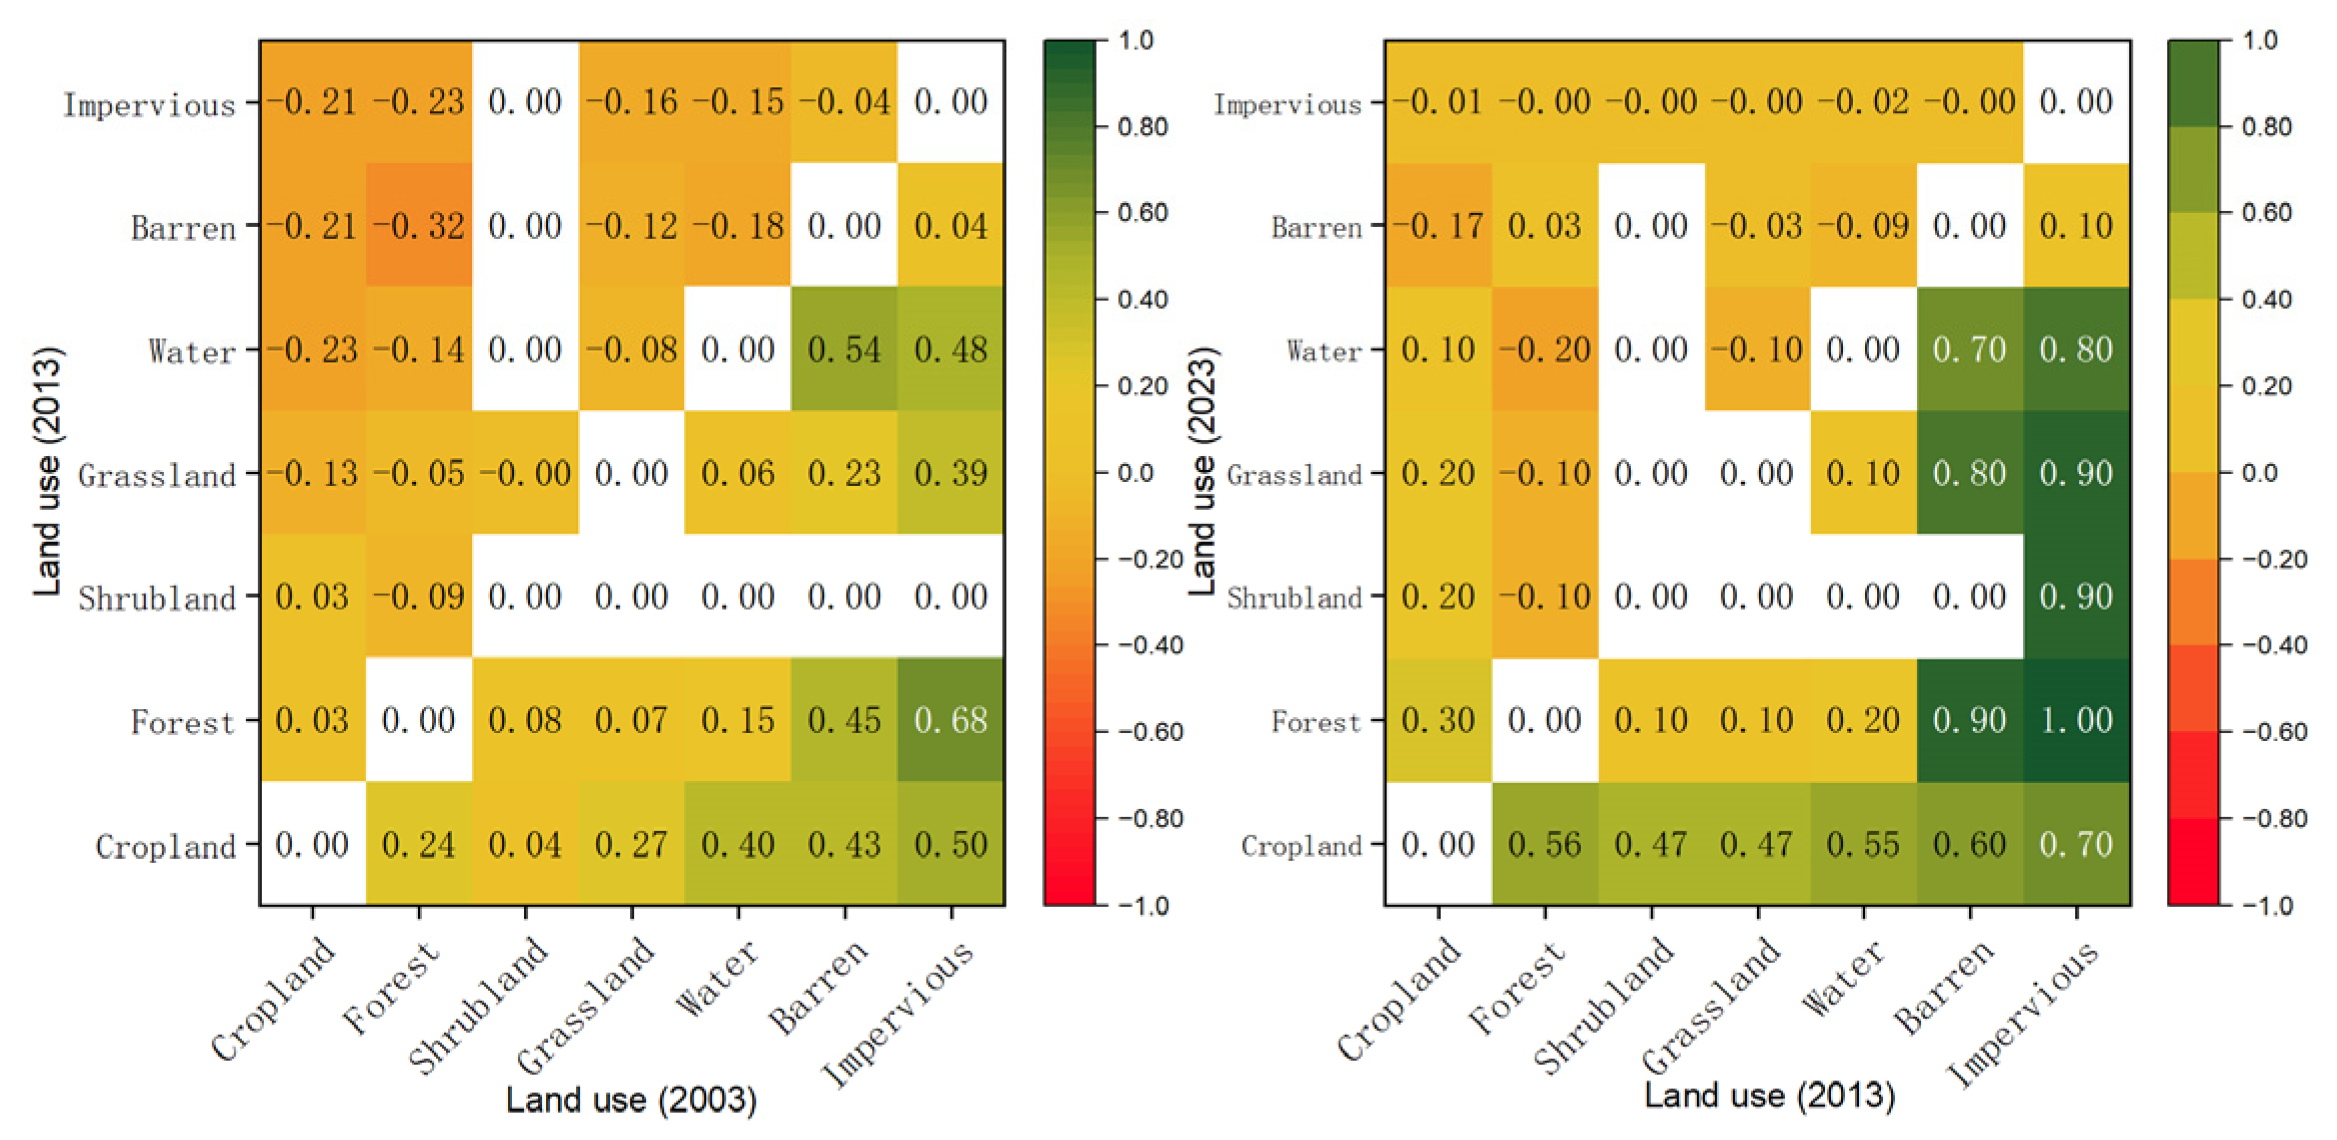
The contribution of land use transitions to habitat-quality changes is shown in Figure 10. During the two periods of 2003–2013 and 2013–2023, differences were observed in the number of transition types, positive and negative contribution patterns, and extreme contribution values.
Figure 10.
Habitat Contribution Rate Matrix of Land Use Transition Pathways from 2003 to 2023.
- (1)
- 2003–2013: Coexistence of positive and negative contributions.
Positive contributions were mainly associated with the conversion of impervious surfaces and barren land to other land use types, among which impervious surface → forest showed the highest contribution rate (0.68). The transition pathways with relatively larger negative contributions included forest → barren land (−0.32) and forest → impervious surfaces (−0.23).
- (2)
- 2013–2023: Enhancement and concentration of positive contributions.
The intensity and concentration of positive contributions further increased during this period. The improvement in habitat-quality contribution from impervious-surface conversion to other land use types became more evident. In addition, multiple transitions between agricultural land and ecological land exhibited positive contributions, including various land use types converted into cropland. The magnitude of negative contributions generally declined, and negative contributions associated with transitions toward impervious surfaces became relatively weaker during this period.
- (3)
- Comparison between periods.
The maximum positive contribution increased from 0.68 to 1, while the minimum negative contribution increased from approximately −0.3 to −0.2, indicating a reduction in the intensity of negative impacts. Meanwhile, high-value positive contributions in both periods were mainly concentrated in transition pathways involving the conversion of impervious surfaces and barren land to other land use types. Negative contributions in the early period were mainly associated with forest and cropland conversion to barren land, water bodies, and impervious surfaces, whereas in the later period they were mainly associated with pathways such as forest → water bodies and cropland → barren land, with relatively limited contribution rates.
3.6.2. Responses of Key Transition Pathways Under Different Scenarios
Based on pixel-scale statistics of habitat contribution rates for land-use transition pathways, Table 3 shows that habitat contributions under different scenarios from 2023 to 2033 were mainly concentrated in a limited number of key land use transition pathways. Contribution rates were normalized separately within each scenario to identify its dominant pathways. Under the Natural Development Scenario, cropland-to-impervious-surface conversion was the principal negative pathway. Under the Ecological Protection and Sustainable Development scenarios, cropland-to-water-body conversion was the principal negative pathway. Under the Farmland Protection Scenario, grassland-to-impervious-surface conversion was the principal negative pathway. Positive contributions were mainly associated with grassland conversion to forest and impervious-surface conversion to water bodies. These results indicate that the dominant transition pathways differed among scenarios, providing a basis for targeted land-use management and regional ecological conservation.
Table 3.
Key Land Use Transition Pathways and Their Habitat Contribution Rates under Different Scenarios from 2023 to 2033.
4. Discussion
4.1. Regional Characteristics of Land Use Change in the Huaihe River Eco-Economic Belt
The Huaihe River Eco-Economic Belt integrates multiple regional functions, including an ecological transition zone, a major grain-producing area, and a rapidly urbanizing region [43]. Land use changes in this area are jointly influenced by cropland protection, ecological management, and impervious-surface expansion [44]. From 2003 to 2023, land use change in the study area was mainly characterized by continuous cropland outflow and expansion of impervious surfaces, indicating that impervious-surface expansion remained an important factor shaping regional land use structure. Meanwhile, changes in forest and water bodies show phased fluctuations, suggesting that ecological land evolution was jointly affected by natural conditions, ecological management, and development intensity.
Land use transition is not merely a change in land area, but rather a reorganization of land functions and spatial structures. Cropland, as an important territorial resource, not only supports food production but also serves as an important carrier for maintaining ecosystem stability and providing ecosystem services [45]. Therefore, large-scale conversion of cropland into impervious surfaces not only alters landscape patterns and increases human disturbance to ecological spaces, but may also weaken regional ecosystem service functions and affect maintaining regional ecological security patterns. Future land management should shift from focusing solely on land quantity changes toward emphasizing land use transition processes, and achieve coordination among agricultural production, urban development, and ecological conservation through optimized land allocation.
4.2. Ecological Effects of Agricultural Land Transition Pathways
Traditional studies on land use change generally focus on changes in land use area and spatial distribution patterns, while paying insufficient attention to the differentiated ecological effects caused by different land conversion processes. However, the ecological impacts of land use change are determined not only by the magnitude of change but also by the direction and pathway of land transitions. Land changes of the same magnitude may generate different ecological consequences due to differences in conversion types. Therefore, identifying ecological effects from the perspective of land use transition pathways is of great significance.
Through the analysis of habitat contribution from land use transition pathways, this study found that a limited number of key transition pathways dominated habitat-quality changes in the study area, among which cropland and forest conversion to impervious surfaces represented the main negative pathways. This indicates that urban expansion not only alters the quantitative structure of agricultural land but also affects regional habitat quality through land surface hardening, landscape fragmentation, and reduced ecological connectivity. In particular, cropland conversion to impervious surfaces represents the most typical ecological risk pathway during agricultural land non-agriculturalization, and its continued occurrence may weaken the capacity of regional ecosystems to maintain ecological functions [46].
Meanwhile, some ecological restoration-related transition pathways generated positive contributions to habitat-quality changes, indicating that land use adjustment does not inevitably lead to ecological degradation. Appropriate land restoration and ecological conservation measures can improve regional ecological functions. Compared with traditional land use change assessment methods, transition pathway-based analysis can further identify ecological risk sources and improvement pathways, providing a basis for targeted land management. Therefore, future agricultural land management should not only focus on changes in cropland area but also pay greater attention to the direction of agricultural land conversion and its ecological consequences.
4.3. Implications for Land Use Management Toward Sustainable Agricultural Development
Future agricultural land management needs to achieve a balance among food production security, regional economic development, and ecosystem function maintenance [47]. The multi-scenario simulation results indicate that different development pathways altered the habitat-quality contributions of specific land-use transition pathways. As shown in Table 3, the Ecological Protection and Sustainable Development scenarios reduced the negative contributions of specific high-risk conversions, particularly cropland-to-impervious-surface conversion [48,49]. However, their mean habitat quality values (0.618 and 0.619, respectively) were lower than that under the Natural Development Scenario (0.621), demonstrating that these reductions occurred at the transition-pathway level rather than at the level of overall regional habitat quality. Accordingly, land-use management should prioritize the control of specific high-risk conversion pathways [50].
First, management of high-risk agricultural land conversion processes should be strengthened, particularly by reducing uncontrolled conversion of cropland into impervious surfaces. Compared with simply restricting impervious-surface expansion, more effective management strategies should focus on optimizing the spatial distribution of impervious surfaces, improving land use efficiency, and reducing the occupation of high-quality agricultural land resources. Agricultural land protection should not be limited to controlling cropland quantity alone but should consider the interactions among different land use types [51]. The results further show that protection strategies targeting a single land-use type may displace rather than eliminate development pressure. Under the Farmland Protection Scenario, cropland conversion was constrained, but grassland-to-impervious-surface conversion emerged as the principal negative pathway. This result indicates that integrated land-use planning should account for the redistribution of development pressure among land-use categories. Meanwhile, ecological restoration pathways should be fully utilized to enhance regional ecological functions. Appropriate allocation of ecological land can improve ecological resilience in agricultural production areas. Overall, future land management should shift from regulating land use quantity toward optimizing land transition processes, thereby promoting coordination between agricultural development and ecological conservation. Although the numerical scenario settings and simulated spatial patterns are specific to the Huaihe River Eco-Economic Belt, the pathway-based PLUS–InVEST framework may be applied to other rapidly urbanizing agricultural regions, including those outside China, provided that the scenario assumptions, transition probabilities, and model parameters are recalibrated to local land-use conditions and planning objectives.
4.4. Limitations and Future Perspectives
Although this study analyzed the habitat quality effects of land use transitions and future scenario responses in the Huaihe River Eco-Economic Belt based on the PLUS-InVEST framework, several uncertainties remain. The PLUS model simulates land use patterns based on historical evolution trends and selected driving factors; however, land use change is influenced by multiple complex factors, including policies, economic conditions, population dynamics, and major development projects [52]. Therefore, scenario parameter settings inevitably involve assumptions, and simulation results only represent possible land use evolution trends under specific scenarios rather than deterministic predictions.
The InVEST habitat quality model depends on parameters such as land use types, habitat suitability, and threat factor weights. Some parameters were determined based on previous studies and the characteristics of the study area, and parameter uncertainties may affect the accuracy of absolute habitat quality values [53]. Moreover, because the InVEST model uses land-cover categories as proxies for habitat conditions, it does not explicitly represent species-specific requirements for forest, grassland, or mixed habitats or the detailed attributes of plant communities. Therefore, the results reflect relative landscape-level habitat conditions rather than habitat suitability for particular wildlife species, and future studies should integrate focal-species distribution, field survey, and landscape-connectivity data. The CLCD product adopts a relatively broad land-cover classification system and does not provide finer subdivisions within each land-cover category. Therefore, the transition pathways identified in this study represent changes among broad land-cover categories rather than detailed conversions among specific land-cover subtypes and cannot reveal the precise physical processes underlying these transitions. In addition, crop-specific information, soil properties, and ecological recovery time lags were not incorporated. Therefore, transitions from cropland to forest or grassland represent changes in land-cover categories rather than evidence of the immediate recovery of soil conditions or diverse natural plant communities. Future studies should integrate higher-resolution remote-sensing data, detailed thematic land-use data, and crop-type data, soil-property data, and long-term field observations improve the identification and interpretation of specific land-cover transition processes.
Furthermore, this study mainly evaluated the ecological effects of agricultural land conversion from the perspectives of land use transition and habitat quality, without incorporating indicators related to agricultural productivity, cropland quality, and food production. Future studies should integrate agricultural system-related data to further evaluate agricultural land sustainability from the perspective of coordination between agricultural production and ecological functions.
5. Conclusions
This study developed a land use transition pathway–habitat quality response framework by integrating the PLUS model, InVEST model, and land use transition contribution analysis. The framework was applied to systematically investigate land use transition processes, habitat-quality changes, and future scenario responses in the Huaihe River Eco-Economic Belt from 2003 to 2023. The main conclusions are summarized as follows.
- (1)
- Land use transition in the study area was mainly characterized by continuous cropland loss and expansion of impervious surfaces. From 2003 to 2023, anthropogenic land development activities played an important role in reshaping regional land use patterns. The conversion among different land use types constituted the primary feature of regional land use evolution. The conversion of cropland to impervious surfaces represented an important pathway of agricultural land loss, reflecting the spatial competition between agricultural land protection and regional development demands.
- (2)
- Land use transitions significantly influenced habitat quality, and ecological effects varied among different transition pathways. During the study period, overall habitat quality showed an increasing trend, although significant spatial heterogeneity remained due to the combined effects of natural conditions and land use structures. Changes in habitat quality cannot be fully explained by variations in land use area alone. Compared with traditional area-based analyses, transition pathway-based analysis provides a more precise understanding of ecosystem responses to land use change.
- (3)
- Key land use transition pathways played a dominant role in habitat quality evolution. The contribution analysis of land use transitions showed that a limited number of key pathways dominated habitat quality dynamics in the study area. The conversion of cropland and forest to impervious surfaces represented the major negative pathways associated with habitat degradation, whereas the expansion of ecological land types, such as forest and grassland, contributed positively to habitat quality improvement. Compared with the magnitude of land use change, transition direction provides a more accurate representation of ecological risks. Identifying key pathways can provide scientific support for land use optimization and targeted ecological conservation.
- (4)
- Future land use management should shift from overall scale regulation toward targeted management of key transition pathways. Multi-scenario simulations demonstrated that different development pathways influenced habitat quality evolution by altering the direction and intensity of land use transitions. At the transition-pathway level, the Ecological Protection and Sustainable Development scenarios reduced the negative habitat-quality contributions of specific high-risk conversions, particularly cropland-to-impervious-surface conversion. Future land management in the Huaihe River Eco-Economic Belt should focus on optimizing key transition pathways rather than solely controlling land use quantity, thereby achieving coordination between agricultural production demands, land resource utilization, and ecological conservation.
Supplementary Materials
The following supporting information can be downloaded at https://www.mdpi.com/article/10.3390/agriculture16212325/s1. Table S1. Sensitivity of land cover types to each threat.; Table S2. Threat data used in the InVEST habitat-quality model.
Author Contributions
Methodology, Y.Y. and L.L.; software, Y.Y. and S.G.; data processing, Y.Y. and H.F.; investigation, Y.Y. and Y.J.; formal analysis, Y.Y.; writing—original draft preparation, Y.Y.; writing—review & editing, L.L. and Z.G.; visualization, Y.Y. and S.G.; supervision, L.L. and Z.G.; project administration, L.L.; funding acquisition, L.L. All authors have read and agreed to the published version of the manuscript.
Funding
This research was funded by the National Social Science Fund of China (Project Title: Policy Design and Implementation Pathways for the “Occupation-Determines-Compensation” Policy for Cultivated Land under the Dual Security Objectives, Grant No. 25BGL250).
Data Availability Statement
The land use data and other datasets used in this study are available from the sources indicated in the manuscript. Further information and data supporting the findings of this study can be obtained from the corresponding author upon reasonable request.
Conflicts of Interest
The authors declare no conflicts of interest.
References
- Wang, S.; Jin, X.; Han, B.; Liu, J.; Song, J.; Zhou, Y. Understanding the process and mechanism of agricultural land transition in China: Based on the interactive conversion of cropland and natural ecological land. J. Environ. Manag. 2025, 376, 124585. [Google Scholar] [CrossRef] [Scilit] [PubMed]
- Wang, X.; Li, X.B. China’s agricultural land use change and its underlying drivers: A literature review. J. Geogr. Sci. 2021, 31, 1222–1242. [Google Scholar] [CrossRef] [Scilit]
- Hu, G.; Li, X.; Liu, X.; Wang, S.; Zhang, X.; Shi, X.; Bai, X.; Hubacek, K. Mitigating the ripple effects of urbanization on farmland productivity and ecological security through inclusive urbanization strategies. npj Urban Sustain. 2025, 5, 12. [Google Scholar] [CrossRef] [Scilit]
- Li, C.; Wu, Y.; Qiu, B.; Li, Y.; Ning, L.; Wang, H.; Liu, L.; Ma, J. Study on dynamic changes in land use and ecosystem service value in the Huaihe River ecological economic belt based on multi-scenario simulations. Front. Environ. Sci. 2025, 13, 1617829. [Google Scholar] [CrossRef] [Scilit]
- de Espindola, G.M.; de Silva Figueredo, E.; Picanço Júnior, P.; dos Reis Filho, A.A. Cropland expansion as a driver of land-use change: The case of Cerrado-Caatinga transition zone in Brazil. Environ. Dev. Sustain. 2021, 23, 17146–17160. [Google Scholar] [CrossRef] [Scilit]
- Long, H.; Qu, Y.; Tu, S.; Zhang, Y.; Jiang, Y. Development of land use transitions research in China. J. Geogr. Sci. 2020, 30, 1195–1214. [Google Scholar] [CrossRef] [Scilit]
- Zhang, J.W.; Wang, M.; Liu, K.; Chen, S.; Zhao, Z. Social-ecological system sustainability in China from the perspective of supply-demand balance for ecosystem services. J. Clean. Prod. 2025, 497, 145039. [Google Scholar] [CrossRef] [Scilit]
- Cai, H.; Wang, Z.; Du, G.; Zhang, D. Assessing the impacts of rural residential land and cropland transition on agricultural production in Northeast China. Food Energy Secur. 2023, 12, 13. [Google Scholar] [CrossRef] [Scilit]
- Brock, C.; Roehrdanz, P.R.; Beringer, T.; Chaplin-Kramer, R.; Enquist, B.J.; Frazier, A.E.; Johnson, J.A.; Kennedy, C.M.; Kiesecker, J.; Larsen, A.E.; et al. Balancing land use for conservation, agriculture, and renewable energy. Nat. Commun. 2026, 17, 3623. [Google Scholar] [CrossRef] [Scilit] [PubMed]
- Wang, H.; Feng, R.; Li, X.; Yang, Y.; Pan, Y. Land Use Change and Its Impact on Ecological Risk in the Huaihe River Eco-Economic Belt. Land 2023, 12, 1247. [Google Scholar] [CrossRef] [Scilit]
- Zhou, K.; Li, Y.; Sun, Z.; Chen, J.; Xie, B. Land Use Transition Under a Tense Human–Land Relationship: A GWR Analysis of Conflicts Between Construction Land and Cropland. Land 2025, 14, 1660. [Google Scholar] [CrossRef] [Scilit]
- National Development and Reform Commission. Development Plan for the Huaihe River Eco-Economic Belt; National Development and Reform Commission: Beijing, China, 2018.
- Dong, D.; Luo, Y.; Gu, K.-K. Spatio-temporal Differentiation and Driving Forces of Eco-Environmental Effects of Land Use Transformation in Yangtze River Delta Economic Zone: A Perspective of “Production-Living-Ecological” Spaces. Resour. Environ. Yangtze Basin 2023, 32, 1664–1676. [Google Scholar]
- Qu, C.; Li, W.; Xu, J.; Shi, S. Blackland Conservation and Utilization, Carbon Storage and Ecological Risk in Green Space: A Case Study from Heilongjiang Province in China. Int. J. Environ. Res. Public Health 2023, 20, 3154. [Google Scholar] [CrossRef] [Scilit] [PubMed]
- Hasan, S.S.; Zhen, L.; Miah, M.G.; Ahamed, T.; Samie, A. Impact of land use change on ecosystem services: A review. Environ. Dev. 2020, 34, 100527. [Google Scholar] [CrossRef] [Scilit]
- Yang, Y. Evolution of habitat quality and association with land-use changes in mountainous areas: A case study of the Taihang Mountains in Hebei Province, China. Ecol. Indic. 2021, 129, 107967. [Google Scholar] [CrossRef] [Scilit]
- Aznarez, C.; Svenning, J.-C.; Taveira, G.; Baró, F.; Pascual, U. Wildness and habitat quality drive spatial patterns of urban biodiversity. Landsc. Urban Plan. 2022, 228, 104570. [Google Scholar] [CrossRef] [Scilit]
- Wei, L.; Zhou, L.; Sun, D.; Yuan, B.; Hu, F. Evaluating the impact of urban expansion on the habitat quality and constructing ecological security patterns: A case study of Jiziwan in the Yellow River Basin, China. Ecol. Indic. 2022, 145, 109544. [Google Scholar] [CrossRef] [Scilit]
- Chen, X.; Yu, L.; Cao, Y.; Xu, Y.; Zhao, Z.; Zhuang, Y.; Liu, X.; Du, Z.; Liu, T.; Yang, B.; et al. Habitat quality dynamics in China’s first group of national parks in recent four decades: Evidence from land use and land cover changes. J. Environ. Manag. 2023, 325, 116505. [Google Scholar] [CrossRef] [Scilit] [PubMed]
- Liu, T.; Yu, G.; Yan, S.; Xu, J.; Xue, L.; Song, G.; Wang, Q. Unraveling the impact of urban landscape pattern changes on habitat quality: A case study of Jinan City in the lower Yellow River Basin, China. Ecol. Indic. 2025, 177, 113735. [Google Scholar] [CrossRef] [Scilit]
- Hasan, F.; Makhtoumi, Y.; Chen, G. Impact of Land Use and Land Cover Changes on Ecosystem Services: A Multi-Module InVEST-LCM Analysis. Earth Syst. Environ. 2026, 10, 7019–7041. [Google Scholar] [CrossRef] [Scilit]
- Liang, X.; Guan, Q.; Clarke, K.C.; Liu, S.; Wang, B.; Yao, Y. Understanding the drivers of sustainable land expansion using a patch-generating land use simulation (PLUS) model: A case study in Wuhan, China. Comput. Environ. Urban Syst. 2021, 85, 101569. [Google Scholar] [CrossRef] [Scilit]
- Xu, J.; Mu, X.; Ma, Z. Evaluation of the Effectiveness of Regulatory Measures for the Use of Natural Ecological Space Based on the Remote Sensing-Driven PLUS-InVEST Model: A Case Study From the Central Mountainous Area of Hainan Island. Ecol. Evol. 2025, 15, e72025. [Google Scholar] [CrossRef] [Scilit] [PubMed]
- Liu, Y.; Yang, R.; Sun, M.; Zhang, L.; Li, X.; Meng, L.; Wang, Y.; Liu, Q. Regional sustainable development strategy based on the coordination between ecology and economy: A case study of Sichuan Province, China. Ecol. Indic. 2022, 134, 108445. [Google Scholar] [CrossRef] [Scilit]
- Zhang, L.; Lu, D.; Li, Q.; Lu, S. Impacts of socioeconomic factors on cropland transition and its adaptation in Beijing, China. Environ. Earth Sci. 2018, 77, 575. [Google Scholar] [CrossRef] [Scilit]
- Zhuang, R.; Luo, C.; Mi, K.; Zheng, T.; Jia, Y.; Li, T. An indicator framework for cultivated land ecological compensation based on net ecosystem service value in China. Ecol. Indic. 2026, 189, 115044. [Google Scholar] [CrossRef] [Scilit]
- Bayer, A.D.; Fuchs, R.; Mey, R.; Krause, A.; Verburg, P.H.; Anthoni, P.; Arneth, A. Diverging land-use projections cause large variability in their impacts on ecosystems and related indicators for ecosystem services. EARTH Syst. Dyn. 2021, 12, 327–351. [Google Scholar] [CrossRef] [Scilit]
- Zhao, Q.; Shao, J. Evaluating the impact of simulated land use changes under multiple scenarios on ecosystem services in Ji’an, China. Ecol. Indic. 2023, 156, 111040. [Google Scholar] [CrossRef] [Scilit]
- Yang, J.; Huang, X. The 30 m Annual Land Cover Datasets and Its Dynamics in China from 1985 to 2023; Zenodo: Geneva, Switzerland, 2024. [Google Scholar]
- Liu, J.; Liu, B.; Wu, L.; Miao, H.; Liu, J.; Jiang, K.; Ding, H.; Gao, W.; Liu, T. Prediction of land use for the next 30 years using the PLUS model’s multi-scenario simulation in Guizhou Province, China. Sci. Rep. 2024, 14, 13143. [Google Scholar] [CrossRef] [Scilit] [PubMed]
- Didan, K. MOD13A3 MODIS/Terra Vegetation Indices Monthly L3 Global 1 km SIN Grid V061; NASA LP DAAC (Land Processes Distributed Active Archive Center): Sioux Falls, SD, USA, 2021.
- Zhao, J.; Wang, L.; Jia, D.; Wang, Y. Study on the effects of land use transformation on habitat quality and its driving mechanisms: A case study of the Qin-Mang River Basin. Front. Environ. Sci. 2025, 13, 1505178. [Google Scholar] [CrossRef] [Scilit]
- Zhao, Z.; Feng, J. Spatio-temporal analysis of land use changes using remote sensing in Horqin sandy land, China. Sens. Rev. 2019, 39, 844–856. [Google Scholar] [CrossRef] [Scilit]
- Zhou, J.; Johnson, V.C.; Shi, J.; Tan, M.L.; Zhang, F. Multi-scenario land use change simulation and spatial-temporal evolution of carbon storage in the Yangtze River Delta region based on the PLUS-InVEST model. PLoS ONE 2025, 20, e0316255. [Google Scholar] [CrossRef] [Scilit] [PubMed]
- Wu, J. Land Use and Carbon Storage Evolution Under Multiple Scenarios: A Spatiotemporal Analysis of Beijing Using the PLUS-InVEST Model. Sustainability 2025, 17, 1589. [Google Scholar] [CrossRef] [Scilit]
- Liao, J.; Tang, L.; Shao, G. Multi-Scenario Simulation to Predict Ecological Risk Posed by Urban Sprawl with Spontaneous Growth: A Case Study of Quanzhou. Int. J. Environ. Res. Public Health 2022, 19, 15358. [Google Scholar] [CrossRef] [Scilit] [PubMed]
- General Office of the CPC Central Committee and the General Office of the State Council of China. Guiding Opinions on Coordinating the Delineation and Implementation of the Three Control Lines in Territorial Spatial Planning; The State Council of the People’s Republic of China: Beijing, China, 2019.
- Sharp, R.; Tallis, H.T.; Ricketts, T.; Guerry, A.D.; Wood, S.A.; Chaplin-Kramer, R.; Nelson, E.; Ennaanay, D.; Wolny, S.; Olwero, N. InVEST 3.7.0 User’s Guide; The Natural Capital Project, Stanford University: Stanford, CA, USA, 2018. [Google Scholar]
- Yang, Y.; Ma, E.; Liao, L.; Wu, M. Land Use Change in a Typical Transect in Northern China and Its Impact on the Ecological Environment. Sustainability 2024, 16, 9291. [Google Scholar] [CrossRef] [Scilit]
- Sun, B.; Wu, Y.; Yan, B.; Niu, J. Characteristics and driving mechanisms of cultivated land resource distribution in the Huaihe River Eco-Economic Belt from 1990 to 2020. Trans. Chin. Soc. Agric. Eng. 2023, 39, 247–258. [Google Scholar] [CrossRef]
- Zhu, Q.; Cai, Y. Assessment framework and simulation prediction for ecological security based on “risk-health-services”: A case study of the Huaihe River Basin. J. Nat. Resour. 2024, 39, 2676–2690. [Google Scholar] [CrossRef] [Scilit]
- Sheng, S.; Zhang, P.; Huang, J.; Ning, L. Research Advances and Emerging Trends in the Impact of Urban Expansion on Food Security: A Global Overview. Agriculture 2025, 15, 1509. [Google Scholar] [CrossRef] [Scilit]
- Hu, W.; Cheng, J.; Zheng, M.; Jin, X.; Yao, J.; Guo, F. A Multi-Scenario Simulation and Driving Factor Analysis of Production–Living–Ecological Land in China’s Main Grain Producing Areas: A Case Study of the Huaihe River Eco-Economic Belt. Agriculture 2025, 15, 349. [Google Scholar] [CrossRef] [Scilit]
- Lyu, Y.; Zhao, S.; Qiu, Z.; Wang, M.; Wu, C. The Spatio-Temporal Process of Regional Cultivated Land Use Transition: An Integrated Framework of “Factor-Structure-Function”. Land 2026, 15, 68. [Google Scholar] [CrossRef] [Scilit]
- Wang, M.; Huang, X. Inhibit or promote: Spatial impacts of multifunctional farmland use transition on grain production from the perspective of major function-oriented zoning. Habitat Int. 2024, 152, 103172. [Google Scholar] [CrossRef] [Scilit]
- Sheng, S.; Song, W.; Deng, X. Spatiotemporal dynamics of preferential occupation of high-quality cropland by construction land expansion in china and its implications for food production potential. Land Use Policy 2026, 169, 108143. [Google Scholar] [CrossRef] [Scilit]
- Wen, B.; Zeng, B.; Dun, Y.; Jin, X.; Zhao, Y.; Wu, C.; Tian, X.; Zhen, S. Spatiotemporal Evolution and Driving Factors of LULC Change and Ecosystem Service Value in Guangdong: A Perspective of Food Security. Agriculture 2025, 15, 1467. [Google Scholar] [CrossRef] [Scilit]
- Zhao, R.; Kan, H.; Xu, H.; Chen, C.; Zhang, G.; Pang, Z.; Zhang, W. The Effects of Multi-Scenario Land Use Change on the Water Conservation in the Agro-Pastoral Ecotone of Northern China: A Case Study of Bashang Region, Zhangjiakou City. Agriculture 2025, 15, 1008. [Google Scholar] [CrossRef] [Scilit]
- Li, M.; Cui, Y.; Dong, J.; Qin, Y. Abandoned cropland compensates the decrease in net ecosystem productivity of impervious surface expansion in China. Environ. Impact Assesment Rev. 2024, 104, 12. [Google Scholar] [CrossRef] [Scilit]
- Dai, Y.; Qiao, X.; Yang, Y.; Liu, L.; Chen, Y.; Zhang, J.; Zhao, T. Optimizing Land Use to Mitigate Ecosystem Service Trade-Offs Using Multi-Scenario Simulation in the Luo River Basin. Land 2024, 13, 1243. [Google Scholar] [CrossRef] [Scilit]
- Wang, Y.; Cheng, L.; Zheng, Y. An Adjusted Landscape Ecological Security of Cultivated Land Evaluation Method Based on the Interaction between Cultivated Land and Surrounding Land Types. Land 2023, 12, 833. [Google Scholar] [CrossRef] [Scilit]
- Gao, X.; Xie, Y.; Zou, Y.; Li, F.; Deng, Z.; Geng, M.; Zhang, P. Spatiotemporal Evolution and Driving Mechanisms of Land Use in Regions with Frequent Human–Land Interactions: A Case Study in the Dongting Lake Area. Sustainability 2025, 17, 1894. [Google Scholar] [CrossRef] [Scilit]
- Namaga, S.; Yeshitela, K.; Argaw, M. Assessing habitat quality using the InVEST model in the Dire and Legedadi watersheds, central highland of Ethiopia: Implication for watershed management. Sustain. Environ. 2023, 9, 2242137. [Google Scholar] [CrossRef] [Scilit]

Disclaimer/Publisher’s Note: The statements, opinions and data contained in all publications are solely those of the individual author(s) and contributor(s) and not of MDPI and/or the editor(s). MDPI and/or the editor(s) disclaim responsibility for any injury to people or property resulting from any ideas, methods, instructions or products referred to in the content. |
© 2026 by the authors. Licensee MDPI, Basel, Switzerland. This article is an open access article distributed under the terms and conditions of the Creative Commons Attribution (CC BY) license.