


Abstract
The high-density rearing environment in the domestic broiler industry causes birds to overlap and obscure one another, which is a major factor leading to reduced performance in object-recognition-based monitoring; consequently, the need for video-based automated analysis technology is growing. Accordingly, this study established an integrated video monitoring pipeline—ranging from object detection to individual counting—by combining public datasets with on-site CCTV datasets to ensure field adaptability, and by integrating heterogeneous detector fusion with multi-object tracking. A training dataset was constructed by combining the AI-Hub Intelligent Smart Poultry House Broiler Video Dataset with CCTV footage collected from a commercial broiler farm. The convolutional neural network-based YOLOv8m and Transformer-based RT-DETR-L were trained independently, and their predictions were subsequently fused using Weighted Boxes Fusion (WBF). ByteTrack was applied for tracking to maintain object identity across frames, and a virtual line crossing counting algorithm was implemented to automatically determine the points where tracking trajectories intersect with virtual lines set within the video, thereby calculating the cumulative number of objects by direction. The experimental results showed that, after training with field data, the model achieved a mean average precision at an intersection over union (IoU) threshold of 0.5 (mAP@0.5) of 0.9880 based on YOLOv8m, and the WBF fusion improved the mAP@0.5 by 26.4% compared to the best single model among the pairs trained solely on public data. The YOLOv8m model trained using combined data achieved an average absolute error of 6.33 birds and an accuracy of 97.60% in frame-level object counting, and recorded an F1-score of 0.856 in virtual line crossing counting. This study confirmed that combined training using public and field data is effective in mitigating domain gaps and that frame-level object counting can be utilized as an indicator for flock monitoring.
1. Introduction
1.1. Background
As global meat consumption continues to rise, so too are demands for the scale and production efficiency of the broiler industry. The OECD-FAO projects that global poultry meat consumption will reach approximately 173 Mt by 2034 and predicts that poultry meat will account for about 62% of the total increase in meat consumption in the future [1]. In South Korea as well, the number of broiler chickens raised in the first quarter of 2024 reached approximately 93.82 million, a 5.6% increase compared to the same period last year, reflecting a high level of production [2]. With this expansion in production scale, it has become common practice for commercial broiler farms to intensively raise tens of thousands of birds per single house [3]. Furthermore, growing concerns about productivity and animal welfare have increased the importance of efficient husbandry management, including timely assessment of flock conditions and prioritization of on-site inspections, while welfare-oriented rearing practices are increasingly being institutionalized in major regions, including the EU [4,5]. In this context, video-based monitoring could provide quantitative information on the number, spatial distribution, and movement of broilers, helping farm personnel identify unusual changes in flock conditions and prioritize management inspections.
However, existing management practices for continuously monitoring the condition of individual birds in large-scale broiler farming environments rely primarily on visual inspections and the empirical judgment of workers [6]. This manual monitoring method places a heavy labor burden on workers, as they must observe a large number of birds within a limited time [7], and evaluation results may vary depending on the observer’s skill level and judgment criteria [8]. Furthermore, high stocking densities frequently result in birds being obscured or overlapping one another, making it difficult to continuously observe abnormal behaviors or changes in the condition of individual birds. Furthermore, workers’ entry into the farm can serve as a transmission route for infectious diseases such as avian influenza, posing a biosecurity risk; moreover, since continuous 24-h monitoring is not possible, blind spots arise in the detection of abnormal signs during nighttime or unmanned periods. Consequently, there is a growing need for automated monitoring technologies to obtain objective and continuous information on flock status in large-scale rearing environments [9].
To address these limitations, the livestock industry is increasingly adopting Precision Livestock Farming (PLF). PLF is a technical approach aimed at efficiently managing productivity, health, and welfare by continuously monitoring the condition of livestock and their rearing environment using information and communication technologies such as sensors, video, and audio, and by supporting management decisions at the individual or flock level based on the collected data [10,11]. This enables the quantitative assessment of changes in condition that occur during the rearing process and facilitates the transition from traditional, experience-based management methods to a data-driven management system [12].
To effectively assess the condition of broiler chickens, it is necessary to consider not only the physical conditions of the rearing environment but also spatial changes within the flock. Environmental factors such as temperature, humidity, and gas concentrations are useful for quantitatively assessing rearing conditions inside the house; however, they have limitations in directly capturing flock-level changes, such as the location and distribution of individual broilers [13,14]. Consequently, the importance of image-based monitoring, which allows for spatiotemporal observation of the flock’s condition, is increasing [7,15]. However, actual broiler house footage involves a complex interplay of various on-site variables—such as the continuous movement of individual birds, flock formation, changes in appearance due to growth stages, occlusion and overlap between structures and birds, and changes in lighting conditions—making it difficult to consistently identify individual birds [3,16,17]. Therefore, there is a need for object-detection-based video monitoring technology capable of accurately and reliably detecting broilers even under the diverse conditions of real-world rearing environments.
1.2. Related Work
With advances in deep learning-based object detection technology, research on automatically identifying objects in broiler chicken images continues to be conducted [18]. In particular, the You Only Look Once (YOLO) family, which features a one-stage architecture that simultaneously predicts an object’s location and class within a single neural network, is widely used for real-time image analysis. Guo et al. [3] improved the detection of overlapping and small objects by combining YOLOv5 with a convolutional block attention module (CBAM). Zhu et al. [16] reported a counting accuracy of 95.87% even under uneven lighting and partial occlusion conditions by applying a YOLOv5x-based automatic counting algorithm. Furthermore, Abuhussein et al. [19] demonstrated that YOLOv8 achieves significantly improved convergence speed and mean average precision (mAP) compared to YOLOv7 in thermal image-based broiler detection. While these studies demonstrate that the YOLO family can be effectively utilized for real-time object detection in broiler images, in situations where adjacent objects overlap due to high density, valid detection results may be suppressed depending on the threshold setting of the post-processing step, non-maximum suppression (NMS).
As an alternative, the DETR (DEtection TRansformer) family, which features an end-to-end architecture that does not rely on an NMS, is being extended to the field of real-time object detection. RT-DETR, proposed by Zhao et al. [20], is the first real-time end-to-end object detector. By utilizing an efficient hybrid encoder and uncertainty-minimizing query selection, it achieved an AP of 53.1% and 108 FPS on the COCO dataset, simultaneously improving both speed and accuracy compared to the existing YOLO. In the livestock sector, Gao et al. [17] proposed CF-DETR, based on RT-DETR, demonstrating the applicability of the DETR family by achieving an mAP@0.5 of 96.9% and 81.4 FPS in chicken face detection within dense rearing environments. As such, the YOLO family possesses complementary strengths in speed and real-time performance, while the RT-DETR family excels in accuracy and the absence of NMS. Therefore, the possibility of complementary performance improvements through ensemble techniques—which combine predictions from heterogeneous detectors rather than relying on the predictions of a single model—has been raised.
Weighted Boxes Fusion (WBF) utilizes the confidence scores of the bounding boxes proposed by each detector as weights to construct an averaged box, thereby simultaneously reducing false positives and improving accuracy compared to simple NMS-based fusion. While this characteristic suggests that the false positive and false negative patterns of each model can complement one another to improve overall detection performance, validation of the approach of combining the heterogeneous predictions of YOLO and the RT-DETR family using WBF in the livestock sector remains limited [21,22,23].
In addition to structural improvements to object detection models, their adaptability to real-world commercial broiler houses must also be considered a critical issue. The visual characteristics of broiler images vary depending on growth stage, stocking density, lighting, background, and imaging conditions; differences in distribution between training data and real-world images can lead to a decline in the model’s generalization performance. Autz et al. [24] pointed out that transfer learning from general domains causes systematic problems due to the similar shape, color, and texture structures in agricultural images, while Joshi et al. [25] demonstrated that using agriculture-specific pre-trained weights can reduce convergence time and improve performance. Shin & Kim [26] proposed a source-free semi-supervised domain adaptation framework to bridge the domain gap in CCTV footage, and Hu et al. [27] systematically reviewed how domain adaptation techniques significantly improve cross-domain generalization performance across agricultural image analysis. These studies suggest that domain adaptation or fine-tuning is essential for applying pre-trained models based on public data to real-world farm CCTV footage.
Object detection results serve as the foundation for multi-object tracking (MOT), which estimates the temporal trajectories of individual objects, as well as for counting and behavior analysis. ByteTrack, proposed by Zhang et al. [28], achieved a consistent improvement in the identification F1 score (IDF1) compared to existing trackers by restoring missing objects even under occlusion through a hierarchical data association strategy that associates even low-confidence bounding boxes. Bošnjak et al. [29] reviewed the widespread application of YOLO-family detectors and tracking-by-detection frameworks such as ByteTrack and DeepSORT in livestock monitoring pipelines. Pranata et al. [30] reported that the combination of a lightweight YOLO detector and ByteTrack offers processing speed advantages in real-time MOT.
Counting based on tracking results is primarily implemented using the virtual line crossing technique. The virtual line crossing technique automatically detects the moments when an object’s tracking trajectory crosses a line defined within the image to calculate the cumulative number of objects, and prevents the same object from being counted multiple times by removing duplicates based on track IDs. Puri [31] implemented a real-time directional flow counting system by combining the YOLO11n detector, the ByteTrack tracker, and the virtual line crossing algorithm. However, in high-density broiler house environments, tracking stability can be compromised due to factors such as the simultaneous passage of multiple objects, ID changes caused by occlusion, and repeated cycles of stopping and moving, which can affect counting accuracy.
In summary, previous studies have demonstrated the potential of object detection and tracking technologies for broiler video analysis. However, further validation is needed regarding the application of models trained on public datasets to actual commercial broiler house environments and their video analysis performance. To address these limitations, comprehensive validation of broiler video analysis technologies, with a focus on real-world application, is required.
Building on previous studies of deep learning-based livestock detection and counting, this study systematically evaluated the effects of training data composition and heterogeneous detector fusion under real-world commercial broiler house conditions. The main contributions of this study are threefold: (1) a comparative evaluation of broiler detection performance using public-only and combined public and on-farm datasets to assess field adaptability; (2) an analysis of the effectiveness and limitations of WBF-based fusion between YOLOv8m and RT-DETR-L under different training data conditions; and (3) an integrated evaluation of frame-level object count estimation and ByteTrack-based virtual line crossing counting. These contributions provide practical insights into the applicability of deep learning-based video monitoring in high-density commercial broiler houses.
1.3. Research Objectives
Accordingly, this study aimed to develop and evaluate an integrated video monitoring pipeline for commercial broiler houses. Specifically, the objectives of this study were as follows: (1) to evaluate the effect of training data composition on broiler detection performance by comparing YOLOv8 and RT-DETR models trained solely on public data with those trained on combined public and on-farm CCTV data; (2) to assess whether combining the predictions of YOLOv8 and RT-DETR using Weighted Boxes Fusion (WBF) improves detection performance compared to individual models; and (3) to evaluate frame-level object count estimation and virtual line crossing counting performance using ByteTrack-based multi-object tracking.
2. Materials and Methods
2.1. Overview of the Overall Pipeline
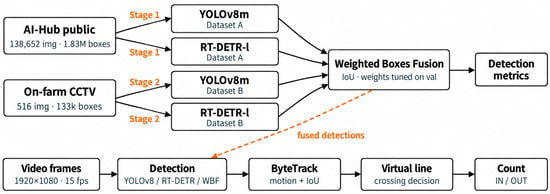
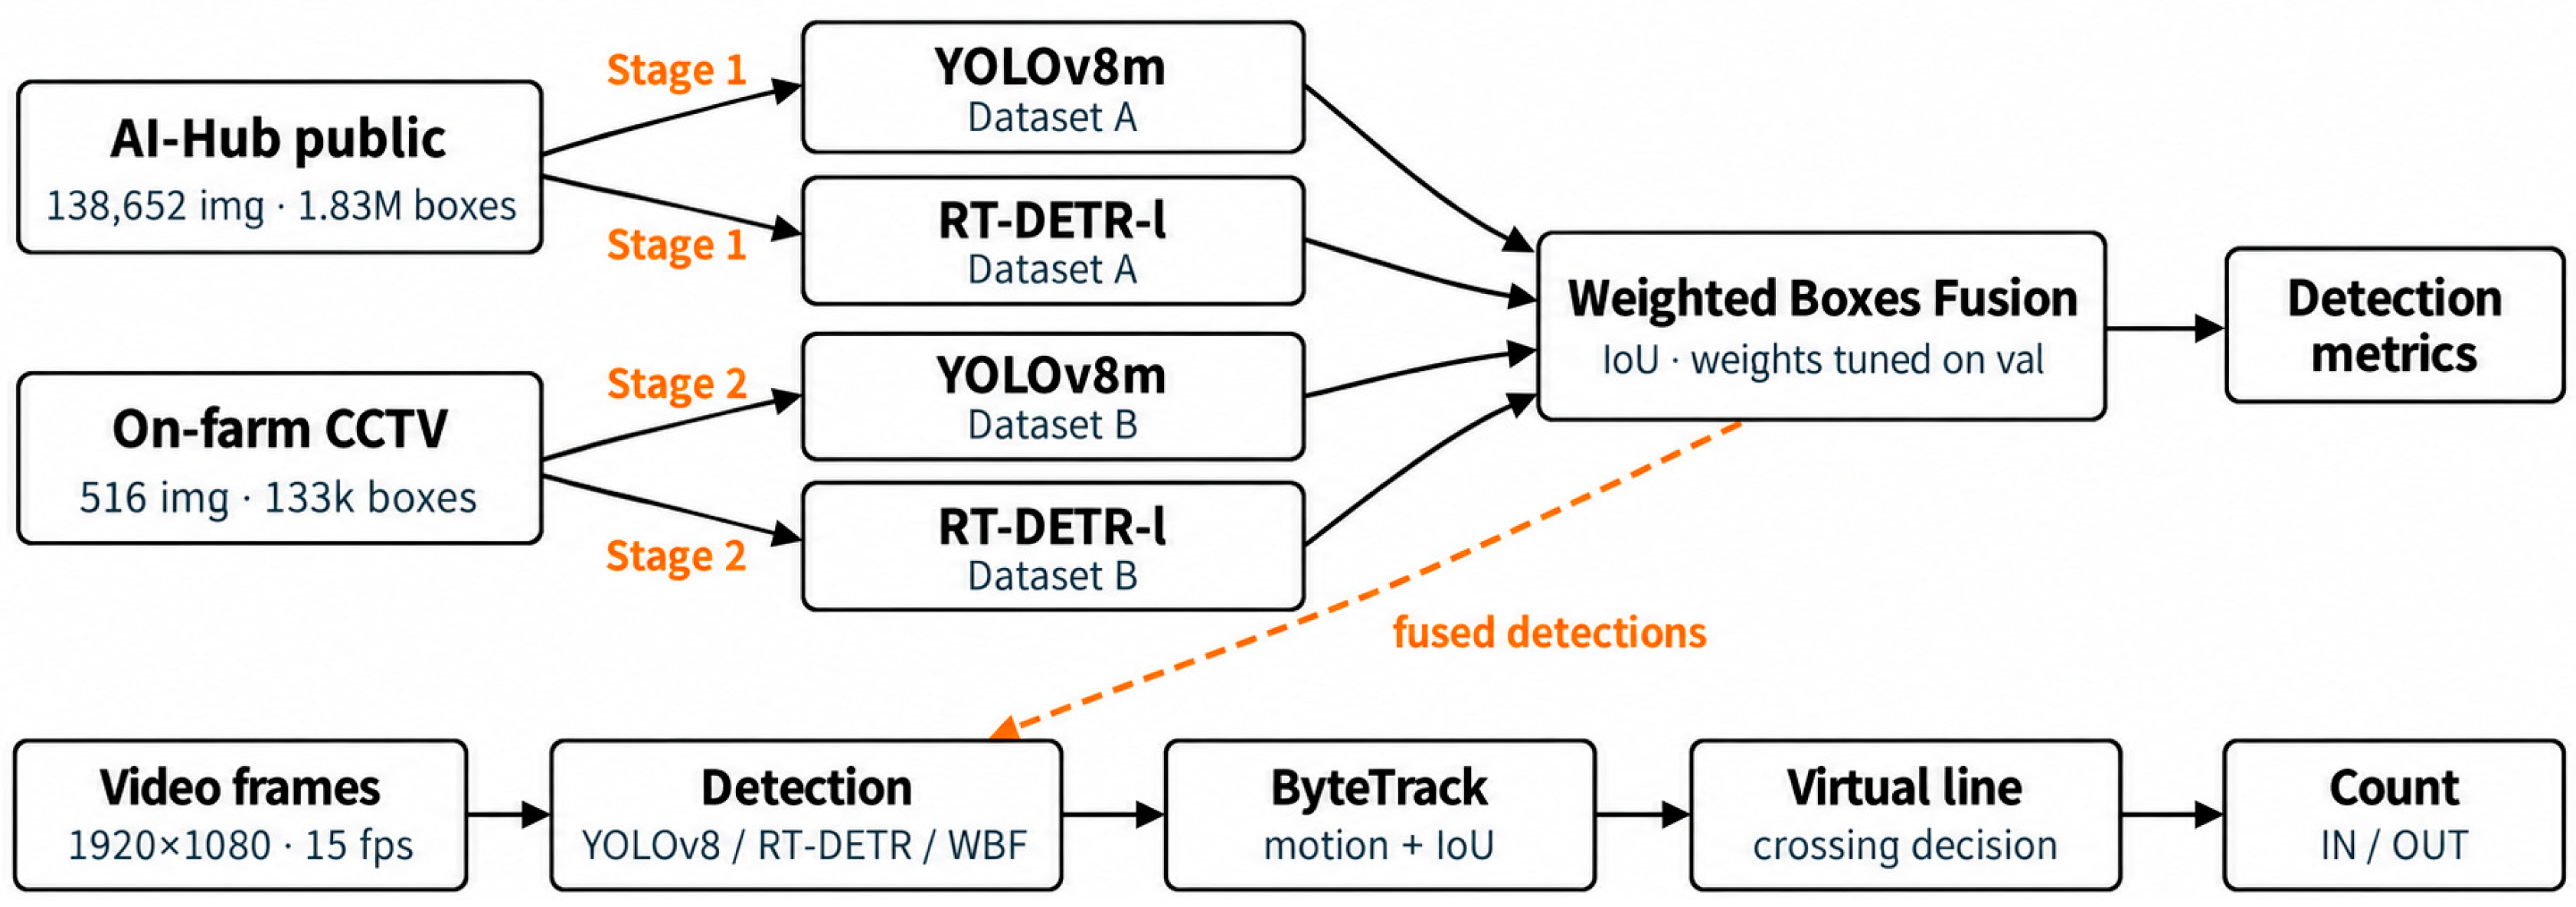
This study developed a video monitoring pipeline to improve object detection performance in real commercial broiler house environments and to link detection results to multi-object tracking and count estimation.
The first training phase used only the AI-Hub public dataset, while the second phase combined the public dataset with on-site broiler house CCTV data. At each stage, the YOLOv8 model (based on a convolutional neural network) and the RT-DETR model (based on a Transformer) were trained independently, resulting in a total of four detection models. The two models do not share weights or cross-reference each other; integration occurs solely at the bounding box level during inference.
Predictions from the two models were fused using WBF to evaluate detection performance, and the resulting detections were subsequently processed using ByteTrack for object tracking and virtual-line crossing counting. The entire pipeline is shown in Figure 1.
Figure 1.
Overview of the proposed monitoring pipeline.
2.2. Dataset
2.2.1. Public Dataset
The public dataset was obtained from AI-Hub’s “Intelligent Smart Poultry House Data (Broiler, Laying Hen)” dataset, specifically the broiler video-based object detection subset. This dataset consists of a total of 138,652 annotated video frames extracted from videos captured at numerous broiler farms in South Korea, including 123,246 frames for training and 15,406 frames for validation. The dataset was constructed by AI-Hub in 2021 and was accessed for this study in 2026. All videos had a resolution of 1920 × 1080 pixels, and the dataset included bounding-box annotations for individual broilers, which were used without modification. The original single object category was retained as the “chicken” class for object counting.
A total of 5063 source-video identifiers were established using farm and original-video information. These identifiers were used to group frames so that images originating from the same public video were assigned to only one of the training, validation, or evaluation subsets. The growth stage consisted of the late broiler phase (approximately 4–5 weeks of age), which aligned with the growth period of the field data used in this study.
2.2.2. On-Farm Broiler House CCTV Dataset
In 2026, videos with a resolution of 1920 × 1080 pixels and a frame rate of 15 fps were collected from one of six CCTV cameras installed on the ceiling of a commercial broiler house located in Gokseong County, Jeollanam-do, Republic of Korea. The camera used for this study was an XNP-6400RW (Hanwha Vision, Seongnam, Republic of Korea), installed at a height of approximately 2 m above the floor. At the time of recording, approximately 27,000 broiler chickens aged 4–5 weeks, including both males and females, were housed in the facility. The broiler house had a floor area of approximately 1008 m2 (63 m × 16 m), corresponding to an estimated stocking density of a 26.8 bird/m2. The floor was covered with rice-husk litter, and the camera view included feeders, drinkers, and structural columns. Footage was selected to include both daytime and nighttime scenes, comprising 344 daytime frames and 172 nighttime frames, while the artificial lighting conditions inside the broiler house were maintained at approximately 5–10 lux throughout the rearing period. Images were extracted at 20-s intervals from the collected videos, resulting in a total of 516 images. Bounding-box annotations were performed using Roboflow(Roboflow, Inc., Des Moines, IA, USA) through a combination of manual annotation and pseudo-label-assisted annotation.
Because temporally adjacent frames from the same CCTV recordings can be visually similar, the 516 on-farm images were divided chronologically into non-overlapping training (311 images), validation (96 images), and evaluation (109 images) subsets rather than being randomly assigned. This partitioning was based on acquisition time rather than source-video identifiers. Therefore, no identical frames were shared among the three subsets, but video-level separation was not enforced for the on-farm dataset.
2.2.3. Dataset Composition
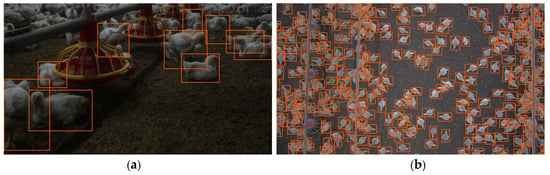
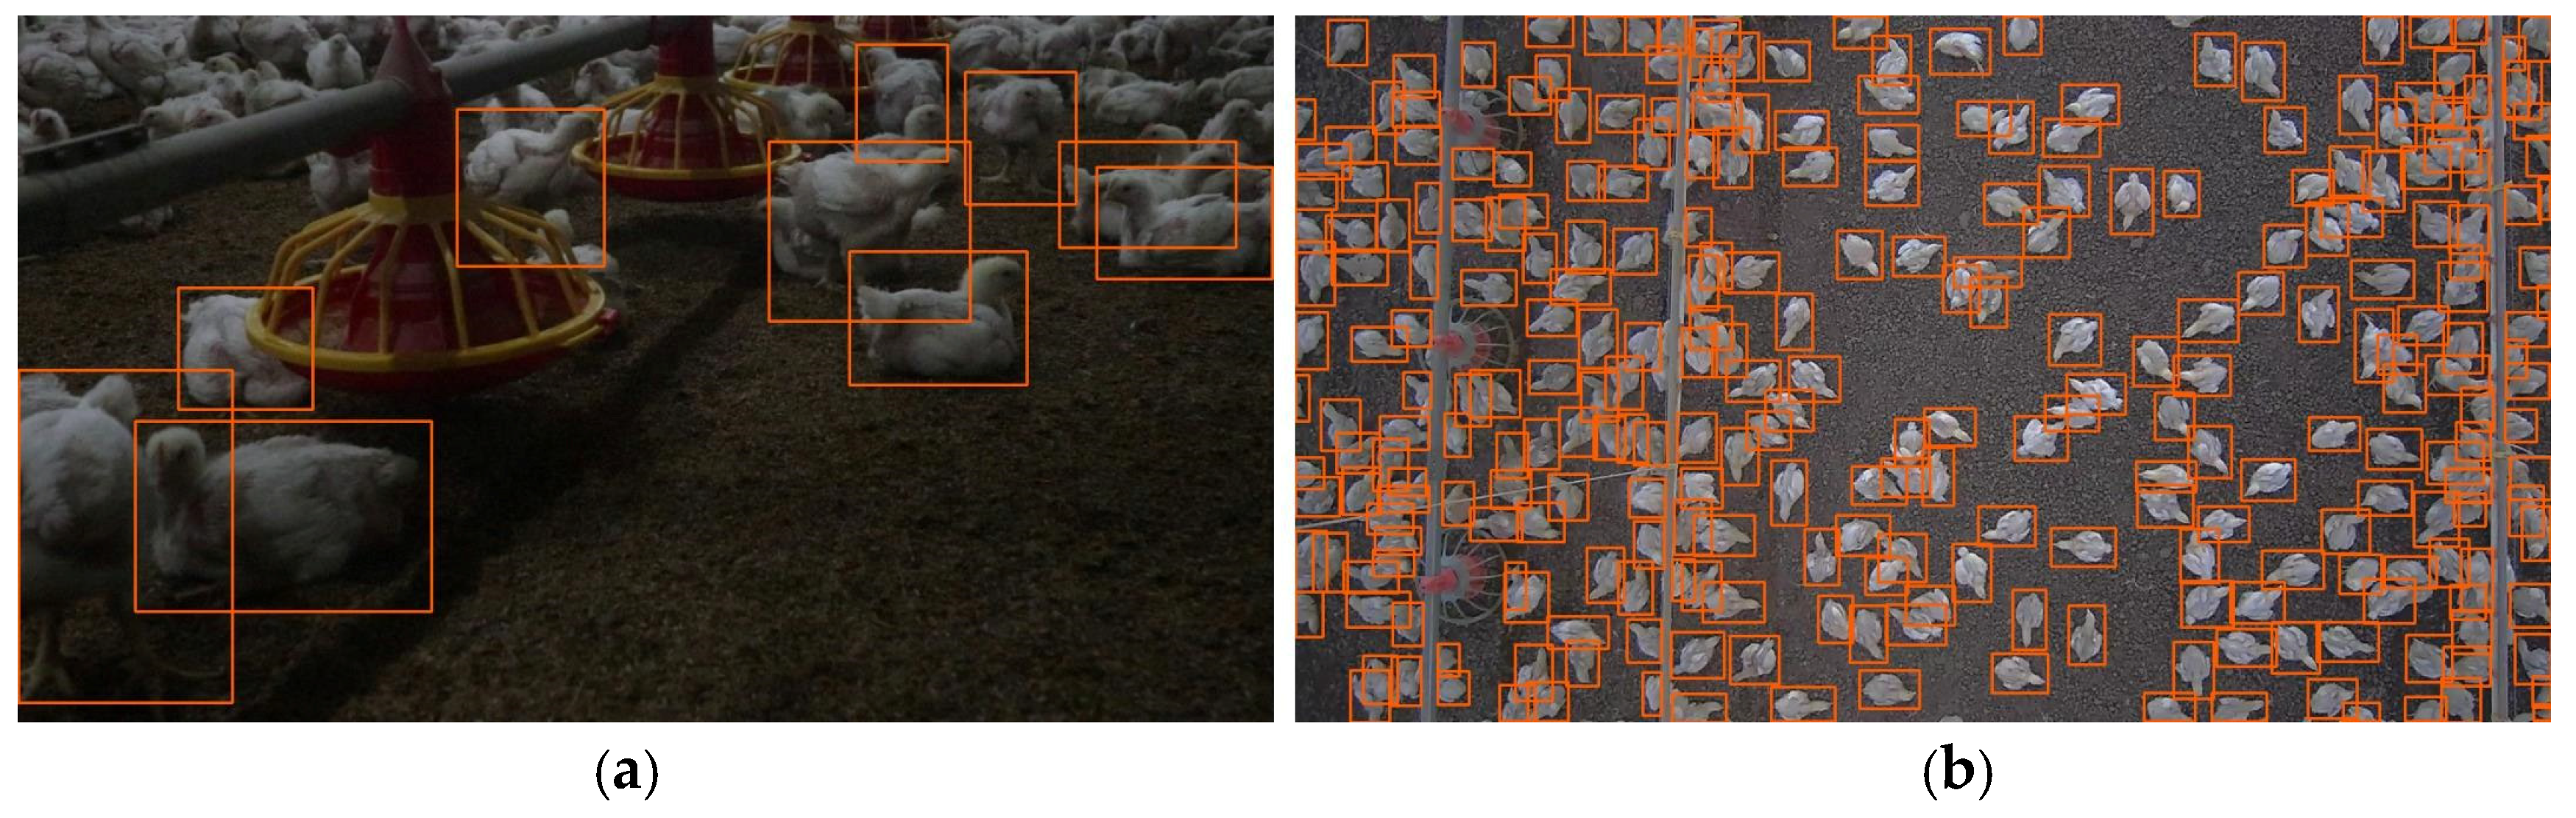
Although the two datasets had the same image resolution, they differed markedly in object size and in image-level object density because of the way they were filmed (Figure 2). Image-level object density was defined as the number of annotated broilers per image; because every image in both datasets was 1920 × 1080 pixels, this count was directly comparable between the datasets without area normalization. Medians were used to represent typical object counts and bounding-box areas while reducing the influence of extreme values. The median bounding-box area was calculated by first determining the area of each annotated bounding box and then taking the median of these areas. The public dataset was filmed at relatively close range, giving a median of 12 objects per image and a median bounding-box area of 31,396 pixels2, whereas the on-farm dataset was filmed with a wide-angle lens mounted on the ceiling, giving a median of 280 objects per image and a median bounding-box area of 4050 pixels2. The density ratio was therefore 280/12 ≈ 23.3, and the area ratio was 31,396/4050 ≈ 7.8. For reference, the mean bounding-box dimensions were 222.6 × 200.8 pixels for the public dataset and 62.3 × 64.4 pixels for the on-farm dataset. These mean dimensions were reported separately and were not used to calculate the median-area ratio. The two datasets therefore presented substantially different detection conditions despite containing the same subject.
Figure 2.
Representative images and ground-truth bounding boxes of the two datasets. (a) Public dataset, 10 birds. (b) On-farm broiler house CCTV, 281 birds.
The public dataset consisted of frames extracted from videos, resulting in a high degree of similarity between temporally adjacent frames. To reduce temporal redundancy and control the dataset size, an initial target of approximately 25,000 training images was established from the 123,246 available frames, corresponding to a sampling proportion of 0.203. For each original video containing n frames, max(1, round(0.203 × n)) frames were selected at evenly spaced positions throughout the video, rather than using a fixed temporal interval. Because the number of selected frames was rounded separately for each video and at least one frame was retained from every video, the actual training subset contained 28,485 images (23.1% of the original training frames), exceeding the initial target. The same sampling criterion was applied to the 15,406 original validation frames, resulting in 3600 images (23.4% of the original validation frames), exceeding the initial target of approximately 3000 images. After sampling, the 3600 images were divided into validation and evaluation subsets containing 1800 images each, with all frames from the same original video assigned to the same subset to prevent data leakage. Thus, subsampling was used to reduce redundancy among temporally adjacent frames and manage the dataset size, while video-level separation was maintained for the public dataset to ensure independent evaluation.
As shown in Table 1, three types of training datasets and two types of evaluation datasets were constructed. For Dataset B, the 311 original on-farm training images were replicated fivefold, resulting in 1555 training samples, which were combined with 28,485 public training images. Dataset C serves as a control group to verify the contribution of public data. For the public dataset, source-video identifiers did not overlap among the training, validation, and evaluation subsets. In contrast, the on-farm dataset was partitioned chronologically into non-overlapping frame subsets without enforcing source-video-level separation.
Table 1.
Composition of the training and validation and evaluation datasets.
2.3. Object Detection Models and Training Strategies
2.3.1. Model Architectures and Characteristics
Two detector families—YOLOv8 and RT-DETR—were selected because of their different inductive biases. YOLOv8 is a single-stage detector based on a convolutional neural network; it consists of a backbone responsible for feature extraction and a neck that combines multi-resolution features using an anchor-free approach, and it removes duplicate boxes during inference using non-maximum suppression (NMS). RT-DETR is a Transformer-based detector that performs set prediction through object queries and bipartite matching, eliminating the need for NMS post-processing. The two detector families exhibit distinct error characteristics in dense scenes, which serves as the basis for their complementarity in the subsequent fusion stage.
YOLOv8m (25.8 M parameters) and RT-DETR-L (32.0 M parameters) were selected, and both models were initialized with COCO-pretrained weights.
2.3.2. Training Setup and Experimental Design
The input resolution was set to 1280 pixels to preserve spatial details for detecting small and densely distributed broilers while considering computational requirements, and the maximum number of detections during inference was set to 1000. Data augmentation included size scaling, brightness scaling, and mosaicking. The input size, data splitting, and random seed were kept identical for both models. Other detailed settings are shown in Table 2.
Table 2.
Training configuration for each detection model.
Dataset A was used for the first training run, and Dataset B was used for the second. For each detector, both datasets were trained for 60 epochs under the same model-specific training settings to facilitate comparison of the effects of training data composition. The two training runs were initialized independently from COCO-pretrained weights, without transferring weights learned during the first run. In contrast, Dataset C contained only 311 unique on-farm training images, resulting in substantially fewer training iterations per epoch. Therefore, models trained exclusively on Dataset C were allowed up to 300 epochs, with early stopping (patience = 60) based on validation performance. Because Dataset C used a different training schedule, its results were considered an on-farm-only control baseline rather than an equal-epoch comparison. were treated as an on-farm-only control baseline rather than an equal-epoch comparison.
2.4. Weighted Boxes Fusion
To compensate for the limitations of a single detection model, the predictions from YOLOv8 and RT-DETR were combined using WBF. While techniques in the NMS or Soft-NMS family retain only the most reliable box among overlapping boxes and remove the rest, WBF is a fusion technique that generates a new box by taking a weighted average of the overlapping boxes based on their confidence scores.
For a cluster containing T overlapping detection boxes, let X(i) and C(i) denote the coordinates and original confidence score of detection i, respectively, and let w_m(i) denote the weight assigned to the model that generated detection i. Here, N represents the number of models participating in the fusion. In this study, N = 2, with weights of 2 for YOLOv8m and 1 for RT-DETR-L. Each detection contributes a weighted confidence score of w_m(i) × C(i), which is used to calculate the fused coordinates in Equation (1) and the fused confidence in Equation (2). For the average aggregation method (‘avg’), the fused confidence is adjusted by the factor min(T, N) divided by the sum of the model weights. For the maximum aggregation method (‘max’), the maximum weighted confidence is normalized by the maximum model weight without this additional correction. These equations correspond to the ensemble-boxes implementation with allows_overflow=False.
X(fused) = [Σiwm(i) ⋅ C(i) ⋅ X(i)] ∕ [Σiwm(i) ⋅ C(i)], i = 1, …, T
C(fused) = ([Σiwm(i) ⋅ C(i)] ∕ T) × [min(T, N) ∕ Σmwm] (avg)
C(fused) = maxi[wm(i) ⋅ C(i)]/maxm[wm] (max), i = 1, …, T; m = 1, …, N
C(fused) = maxi[wm(i) ⋅ C(i)]/maxm[wm] (max), i = 1, …, T; m = 1, …, N
The predictions used for fusion were extracted from each model under the conditions of a confidence threshold of 0.001 and a maximum number of detections of 1000. The four WBF parameters—the IoU threshold, model weights, minimum confidence threshold, and confidence aggregation method—were optimized independently for each model pair using the same parameter search grid on the on-farm validation set. For each pair, the configuration maximizing mAP@0.5:0.95 was selected and subsequently applied to the evaluation set. Thus, the difference in the selected confidence aggregation methods resulted from the same validation-based optimization procedure rather than different optimization protocols.
For the model pair trained solely on public data, the selected WBF parameters were an IoU threshold of 0.55, model weights of [2, 1] for YOLOv8m and RT-DETR-L, respectively, a minimum confidence threshold of 0.001, and the average confidence aggregation method (conf_type=‘avg’). For the model pair trained on the combined public and on-farm dataset, the corresponding parameters were an IoU threshold of 0.70, the same model weights and minimum confidence threshold, and the maximum confidence aggregation method (conf_type=‘max’). In both cases, the model weights were incorporated into the fused coordinate calculation, while the selected aggregation method determined the fused confidence scores according to Equations (1) and (2).
To compare the fusion techniques, NMS ensemble, Soft-NMS ensemble, and Non-Maximum Weighted (NMW) ensemble results were calculated simultaneously using the same predictions.
2.5. Tracking-Based Virtual Line Counting
2.5.1. Integration of Detection and Tracking Pipelines
The architecture was designed such that, for each frame, the predictions from the two models were fused using WBF, and the result was then passed to a ByteTrack implementation that accepted arbitrary detection inputs. The tracker embedded in the detection framework was implemented to be coupled only with the predictions of the framework’s own model, so it could not accept externally generated fused detection results as input. Separating detection and tracking enabled comparison of single-model and fused detections under identical tracking and counting conditions.
ByteTrack is a multi-object tracking technique that first performs association using high-confidence detections and then re-associates low-confidence detections with the remaining tracks to mitigate track breaks in occluded regions; association is based on the IoU between the position predicted by the Kalman filter and the detection bounding box [28]. The parameters used for tracking and counting are shown in Table 3.
Table 3.
Parameters used for multi-object tracking and virtual-line counting.
2.5.2. Virtual Line Crossing Detection Mechanism
A virtual line was defined between the starting point (x1, y1) and the endpoint (x2, y2), and the signed perpendicular distance d(p) was calculated using Equation (3) for each reference point p = (x, y) on each track. The sign of d(p) indicates which side of the virtual line the reference point lies on, while its absolute value represents the distance from the virtual line. If the sign of d(p) reverses between two consecutive frames, it is judged as a crossing, and depending on the direction of the reversal, it is classified as an entry (IN) or an exit (OUT).
2.5.3. Tracking and Counting Parameter Optimization
In a high-density environment with similar objects, tracking identifiers may switch to adjacent objects (ID switch), or tracks may fragment near virtual lines, resulting in duplicate counts of passing objects. To mitigate this, a minimum track lifetime and a no-recount interval were established to exclude unstable tracks immediately after creation and repeated passes by the same identifier. The parameters used for tracking and counting are shown in Table 3.
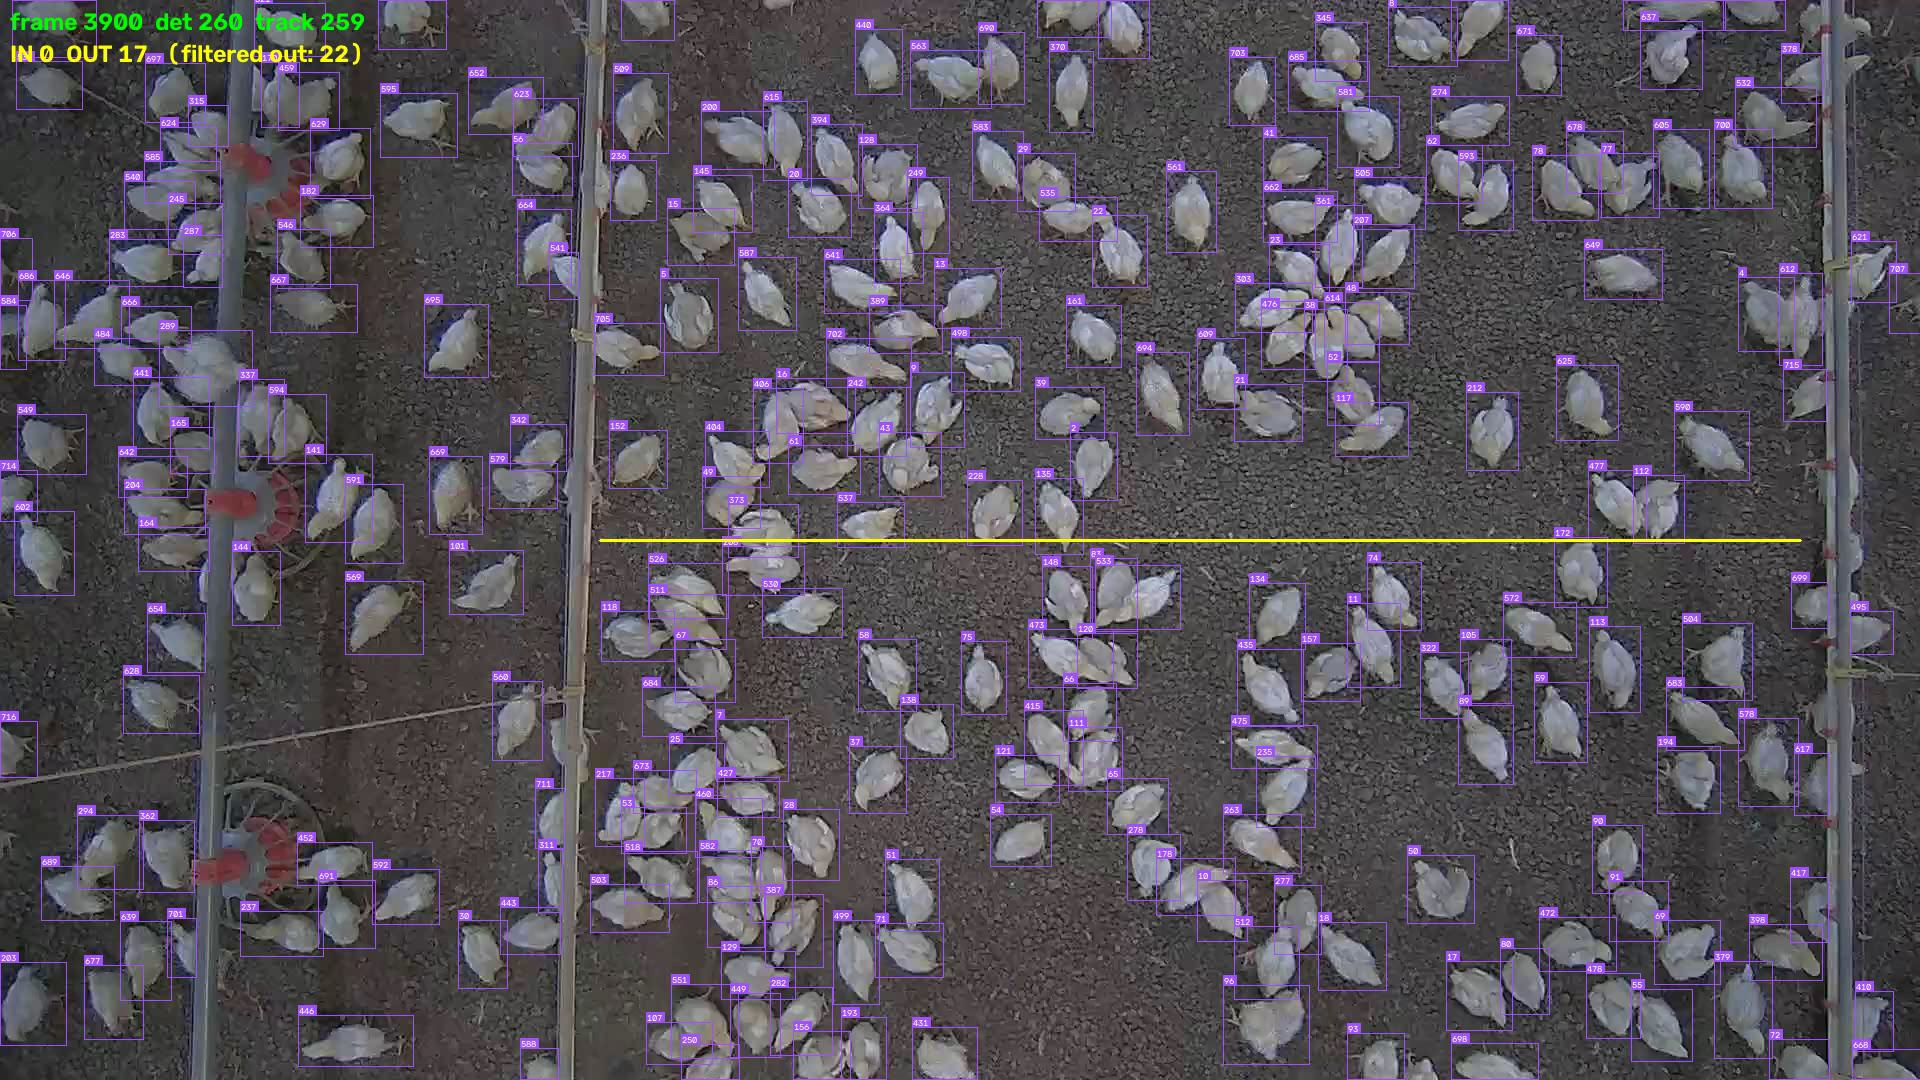
The counting experiment was conducted on a segment of video that had not been used for training, validation, or evaluation. A 2700-frame segment (approximately 3 min) of the on-site video was used, and the virtual line was set as a horizontal line running through the center of the video at coordinates (600, 540) to (1800, 540), as illustrated in Figure 3.
Figure 3.
Tracking and virtual-line counting. The numbers on the boxes are the identifiers assigned by ByteTrack, and the yellow horizontal line is the virtual line.
2.6. Evaluation Metrics and Protocol
2.6.1. Object Detection Metrics
Detection performance was evaluated using precision, recall, F1-score, and mean average precision (mAP). Precision, recall, and F1-score were defined as in Equations (4)–(6) [32], and the correspondence between predictions and ground truth was determined using greedy matching in descending order of confidence, based on an IoU threshold of 0.5.
Precision = TP∕(TP + FP)
Recall = TP∕(TP + FN)
F1 = 2∙Precision∙Recall∕(Precision + Recall)
mAP was calculated using both the IoU 0.5 metric (mAP@0.5) and the average of 10 thresholds ranging from IoU 0.5 to 0.95 in 0.05 increments (mAP@0.5:0.95). Although this study involved only one object class (“chicken”), the mAP at each IoU threshold was numerically equivalent to the average precision (AP) for that class. The mAP notation was retained for consistency with standard object detection evaluation protocols. Since the latter more strictly reflects positional accuracy, it was used as the primary metric for evaluating the effectiveness of the fusion technique. The objects in this study fall within the medium category (32 × 32 − 96 × 96-pixel equivalent) according to the COCO standard.
2.6.2. Counting and Estimation Metrics
While detection metrics evaluate the quality of individual bounding boxes, the value required in the field is the total number of objects in the image. Therefore, frame-level errors in the estimated number of objects were calculated separately. For n frames, let g be the ground-truth number of objects and p be the predicted number of objects. The mean absolute error (MAE), mean absolute percentage error (MAPE), bias, root mean square error (RMSE), and counting accuracy were defined as shown in Equations (7)–(11). Additionally, the coefficient of determination (R2) was calculated as one minus the ratio of the sum of squared differences between predicted and ground-truth counts to the sum of squared deviations of ground-truth counts from their mean.
MAE = (1 ∕ n) Σ |p(i) − g(i)|
Bias = (1 ∕ n) Σ (p(i) − g(i))
RMSE=√[(1 ∕ n) Σ (p(i) − g(i))2]
2.6.3. Evaluation Protocol and Dataset Environments
The primary evaluation target was a field CCTV evaluation dataset (109 images) representing an actual deployment environment; to verify the impact of combining training data on performance in the source domain, a public data evaluation dataset (1800 images) was also used as a supplementary metric. In this study, validation data were used to select confidence thresholds and WBF parameters, whereas evaluation data were reserved for final performance assessment. The confidence thresholds required for calculating precision, recall, and F1-score were determined by identifying the values that maximized the F1-score in the validation data for each domain and applying them directly to the evaluation data. For object counting, the counting MAE was used as the objective function, and the thresholds were determined in the same manner.
Detection metrics were calculated using a standardized in-house evaluation code based on pycocotools (COCO API project, originally developed as the Microsoft COCO Toolbox; Microsoft Research, Redmond, WA, USA). However, since pycocotools’ summary function is fixed to calculate based on a maximum detection count of 100 (mAP@0.5:0.95), this study calculated the metrics directly from the cumulative results obtained under a maximum detection count of 1000.
2.6.4. Statistical Analysis
To examine the relationship between the actual number of broilers per frame and counting errors, Pearson’s correlation analysis was performed using the 109 frames of the on-farm CCTV evaluation set for the YOLOv8m model trained on the combined dataset. For each frame i, the signed counting error was defined as e_i = p_i − g_i, where p_i and g_i represent the predicted and ground-truth counts, respectively. Pearson’s product-moment correlation coefficient (r) between the ground-truth counts and signed errors was calculated using NumPy (np.corrcoef). The two-tailed p-value was calculated from Student’s t distribution using t = r × √|(n − 2)/(1 − r2)|, with n − 2 degrees of freedom, where n = 109. Statistical significance was assessed at p < 0.05. In addition, the mean signed error was calculated separately for three ground-truth count ranges (100–200, 200–320, and ≥320 broilers per frame) to descriptively examine variations in counting bias with increasing object counts.
2.7. Experimental Setup
All training and inference were performed on a single GPU. The hardware and software configuration is shown in Table 4; the ensemble-boxes library (developed by Roman Solovyev; https://github.com/ZFTurbo/Weighted-Boxes-Fusion; accessed on 19 October 2026) was used for fusion, the supervision library (Roboflow, Inc., Des Moines, IA, USA) for tracking, and the pycocotools library for evaluation.
Table 4.
Hardware and software configuration used in this study.
3. Results and Discussion
3.1. Object Detection Performance
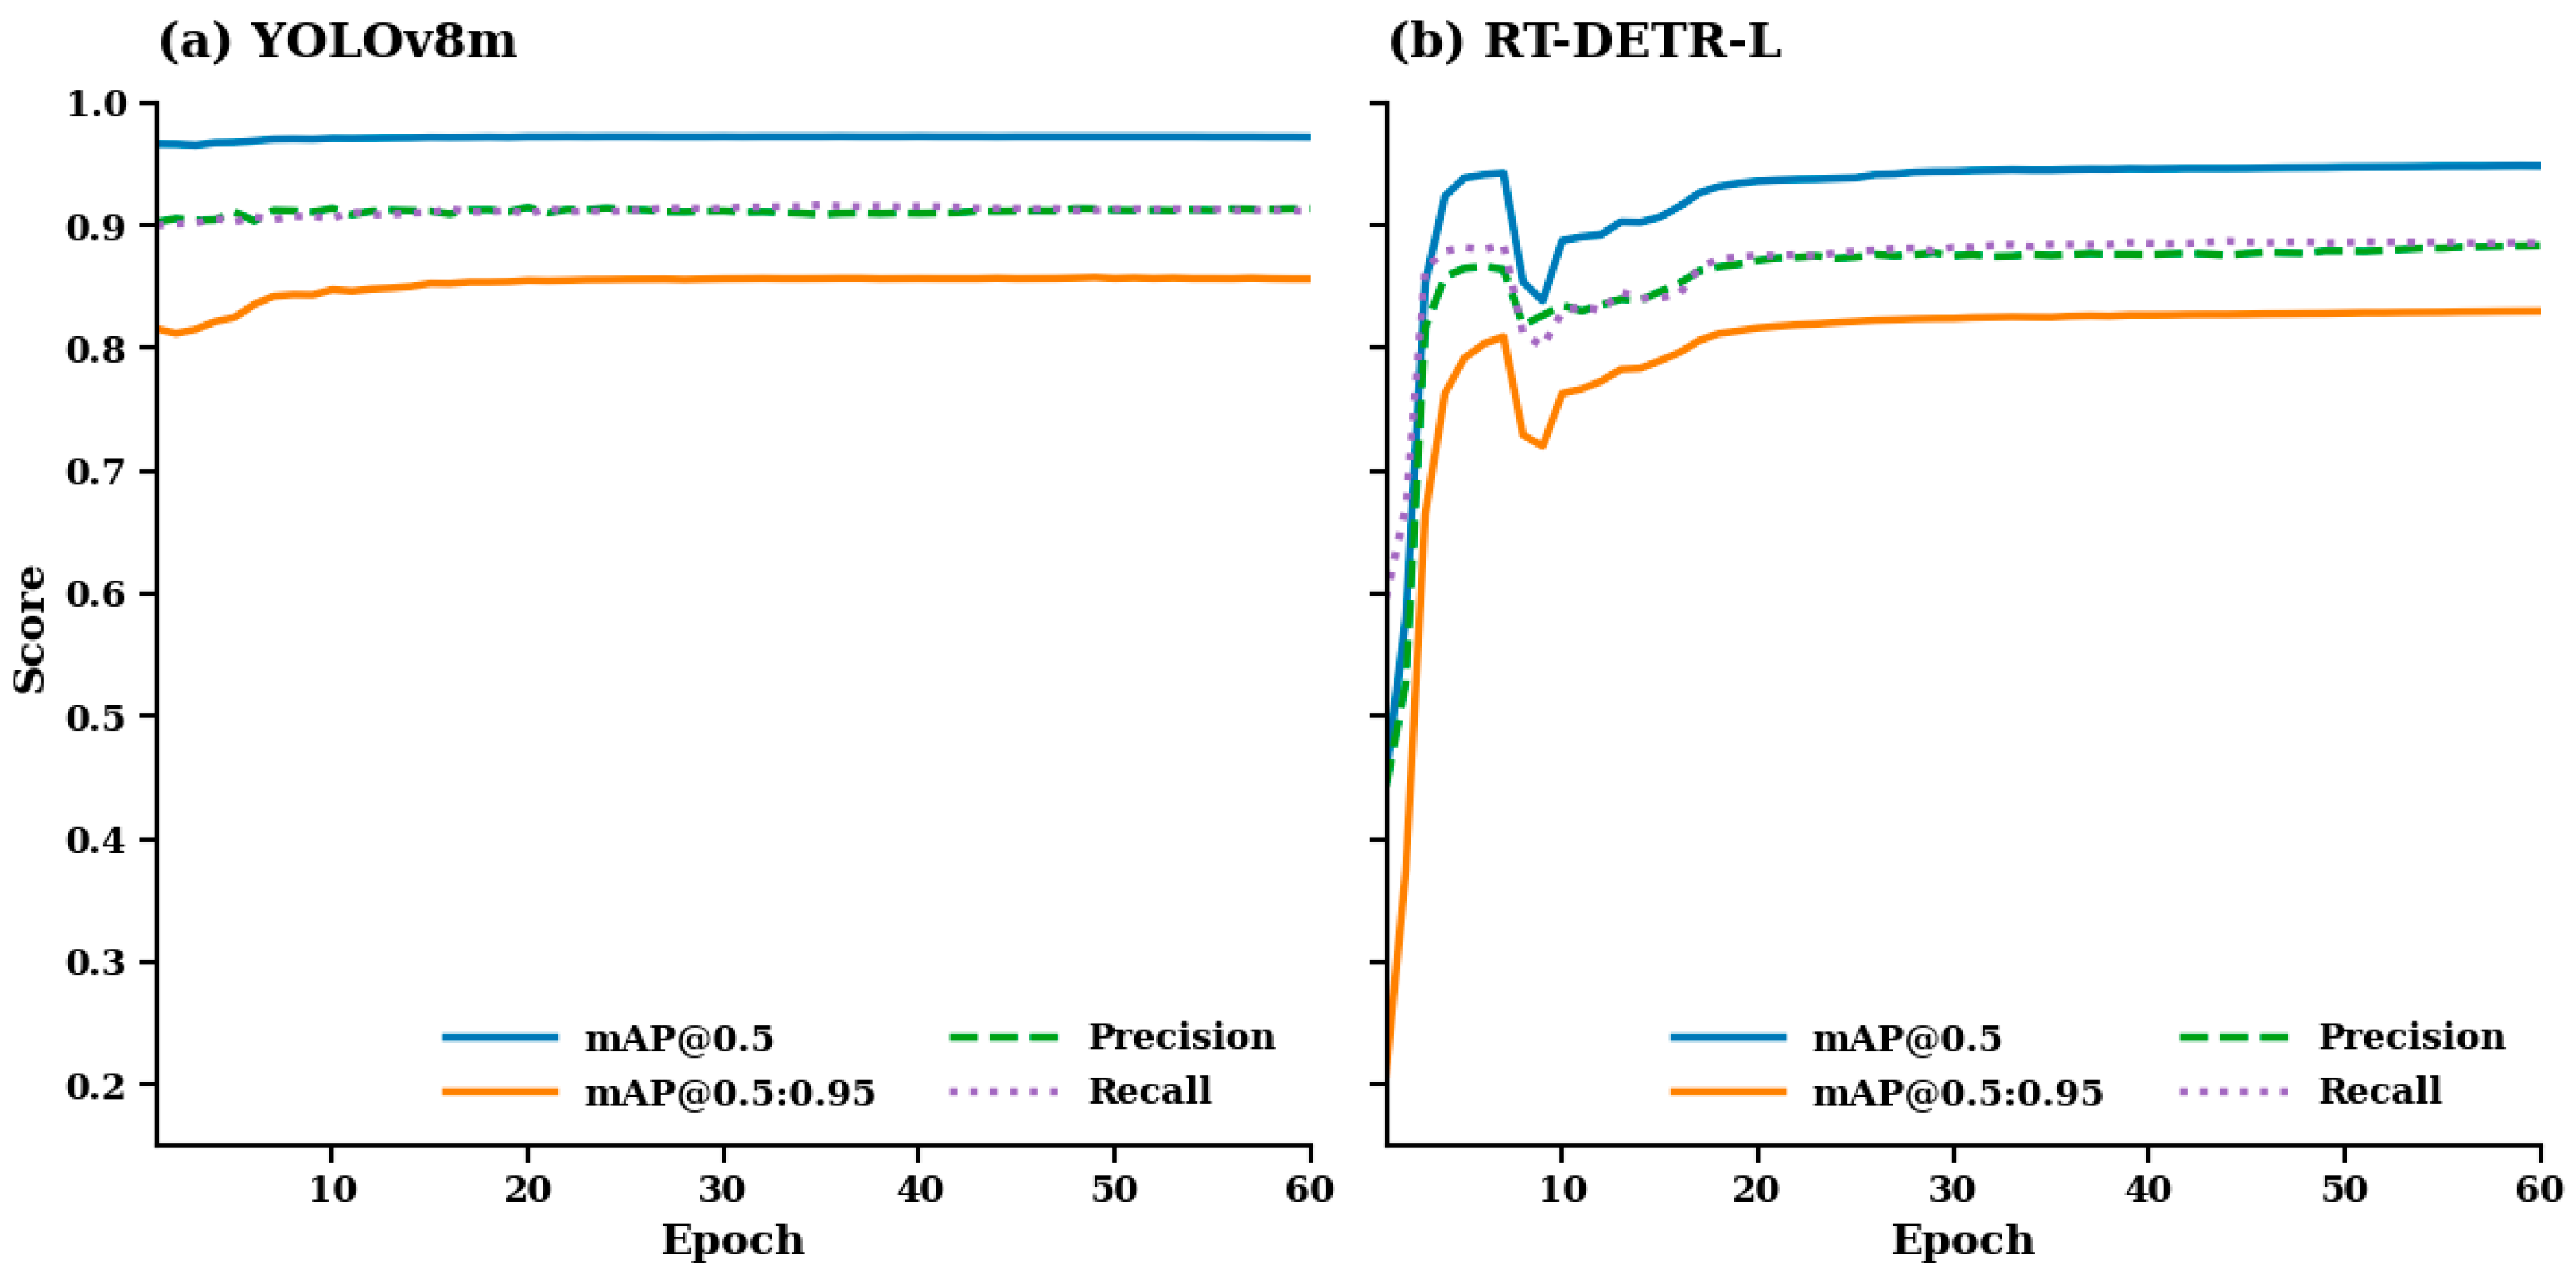
Figure 4 shows the validation performance of YOLOv8m and RT-DETR-L during the 60-epoch training on Dataset B. YOLOv8m maintained relatively stable validation metrics, whereas RT-DETR-L began to stabilize after approximately six epochs. Based on the training logs, YOLOv8m achieved its best validation mAP@0.5:0.95 at epochs 46 and 49 for Datasets A and B, respectively, whereas RT-DETR-L achieved its best validation performance at epoch 60 for both datasets. For Dataset C, YOLOv8m achieved its best validation performance at epoch 168 and stopped at epoch 228 through early stopping, whereas RT-DETR-L achieved its best performance at epoch 275 and completed the maximum of 300 epochs. These validation results describe training behavior within each configuration, while the performance comparisons in Table 5 and Table 6 were conducted using the same on-farm evaluation set. Because RT-DETR-L achieved its best recorded validation performance at the final epoch for Datasets A and B, further improvement beyond the 60-epoch training schedule cannot be ruled out.
Figure 4.
Validation metrics during combined training on Dataset B. (a) YOLOv8m. (b) RT-DETR-L.
Table 5 shows the detection performance on the field CCTV evaluation dataset. For the models trained solely on public data, mAP@0.5 was 0.3194 for YOLOv8m and 0.3309 for RT-DETR-L—these results amounted to only 35.3% and 37.2% of the public domain performance of the same models (0.9040 and 0.8904, respectively). The error patterns differed between the two models. YOLOv8m maintained a precision of 0.8156, but its recall dropped to 0.1900, indicating that missed detections were the primary error. In contrast, RT-DETR-L had a relatively high recall of 0.4086, but its precision decreased to 0.6263, resulting in a corresponding increase in false positives. In summary, models trained on public data exhibited a significant decline in detection performance when applied to real-world CCTV footage, and the nature of this performance decline varied depending on the model architecture. This finding is consistent with previous research reporting performance degradation in object detection models due to domain shifts between training datasets and real-world CCTV environments [26].
In the second model trained using combined field data, the average precision at an IoU threshold of 0.5 (mAP@0.5) improved to 0.9880 for YOLOv8m (mAP@0.5) and 0.9484 for RT-DETR-L, with F1-scores of 0.9788 and 0.9590, respectively. Furthermore, the mAP@0.5:0.95 improved to 0.8795 and 0.8323, respectively, confirming that the combined training model achieved detection performance even under strict IoU criteria. The control group, trained solely on on-site data, achieved an mAP@0.5 of 0.9876, with a difference of only 0.0004 compared to the second model. This suggests that the integration of public data did not substantially degrade detection performance in the on-site domain.
Table 5.
Detection performance on the on-farm CCTV evaluation set (109 images, 28,807 boxes).
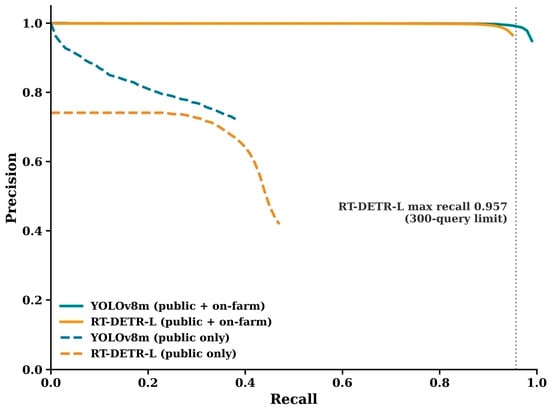
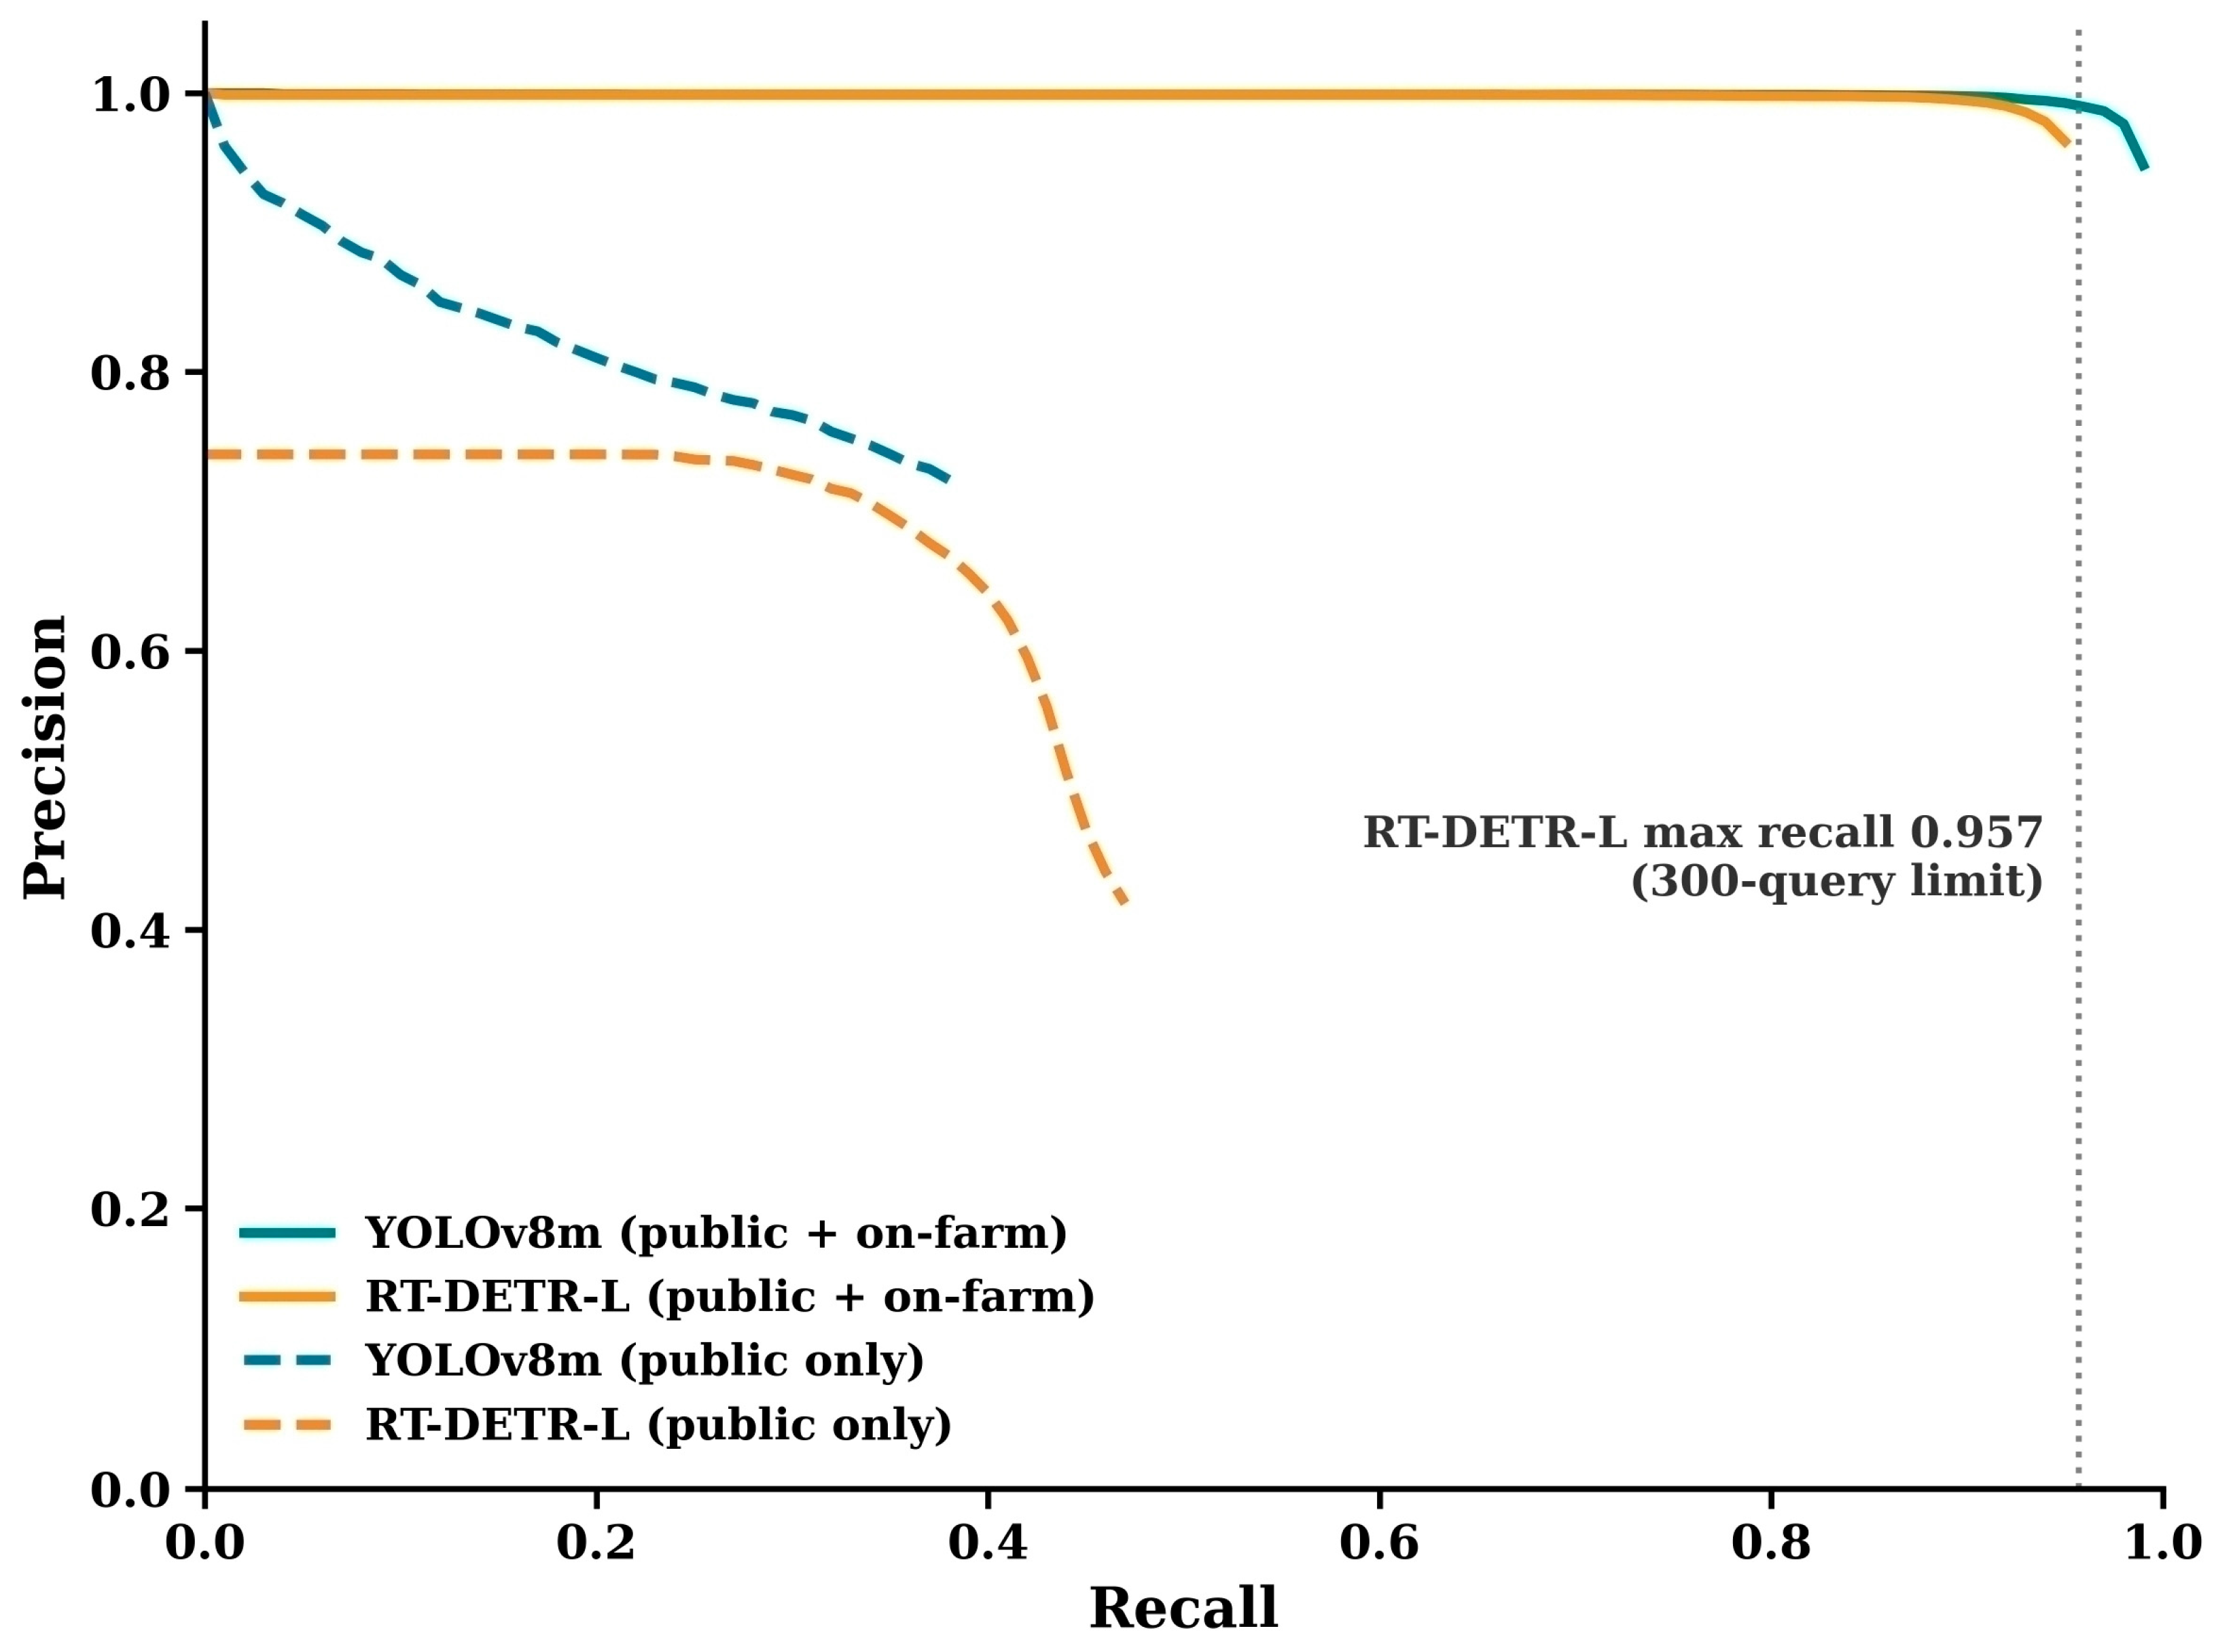
The precision-recall curve is shown in Figure 5. The combined training model maintained a precision of 0.99 or higher up to a recall of around 0.9, then decreased sharply in the final segment, demonstrating a balance that sustained high precision across a wide range of recall values. In contrast, the curves for the public-data-only models terminated at recall values of 0.3885 (YOLOv8m) and 0.4711 (RT-DETR-L). These curves terminated at their respective maximum recall values because the available predictions yielded no additional true-positive matches at an IoU threshold of 0.5, even when lower-confidence predictions were included. This indicates that there is a limit to the achievable recall even when the confidence threshold is lowered, demonstrating that adjusting the threshold or applying post-processing alone is insufficient to fully compensate for the performance gap between public and on-farm data.
Figure 5.
Precision-recall curves on the on-farm CCTV evaluation set at an IoU threshold of 0.5. The dotted vertical line indicates the maximum recall attainable by RT-DETR-L.
Even after joint training, the difference in recall between the two architectures persisted, with YOLOv8m and RT-DETR-L achieving recall values of 0.9708 and 0.9367, respectively. Analysis of the prediction results showed that RT-DETR-L output 300 boxes per image on the evaluation dataset, and in 13 of these images, the number of ground-truth objects exceeded 300. This is due to RT-DETR’s architecture, which generates predictions based on a fixed number of object queries. The number of queries used for RT-DETR-L in this study was 300, and even when the maximum detection count was set to 1000 during inference, this upper limit remained unchanged, limiting the achievable maximum recall to 0.9572. In contrast, YOLOv8m output 152–502 boxes on the same evaluation set, showing no such upper limit. In the filming environment of this study, where the median number of objects per frame was 281 and the maximum was 404, there were frames where the number of queries was fewer than the actual number of objects; in such cases, RT-DETR-based models was structurally unable to detect all objects. Therefore, when applying a Transformer-based detector to high-density poultry farming environments, the design must account for the expected object density by increasing the number of queries accordingly.
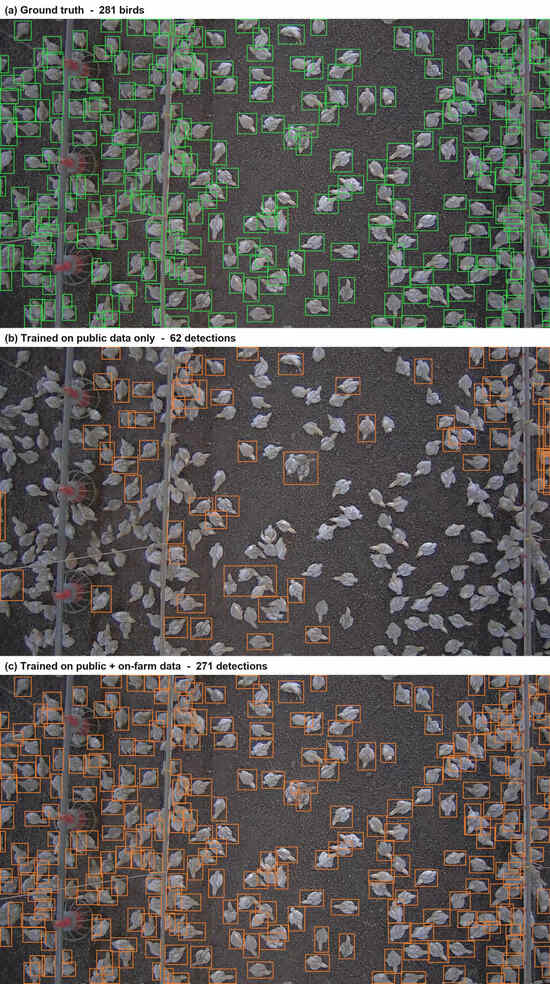
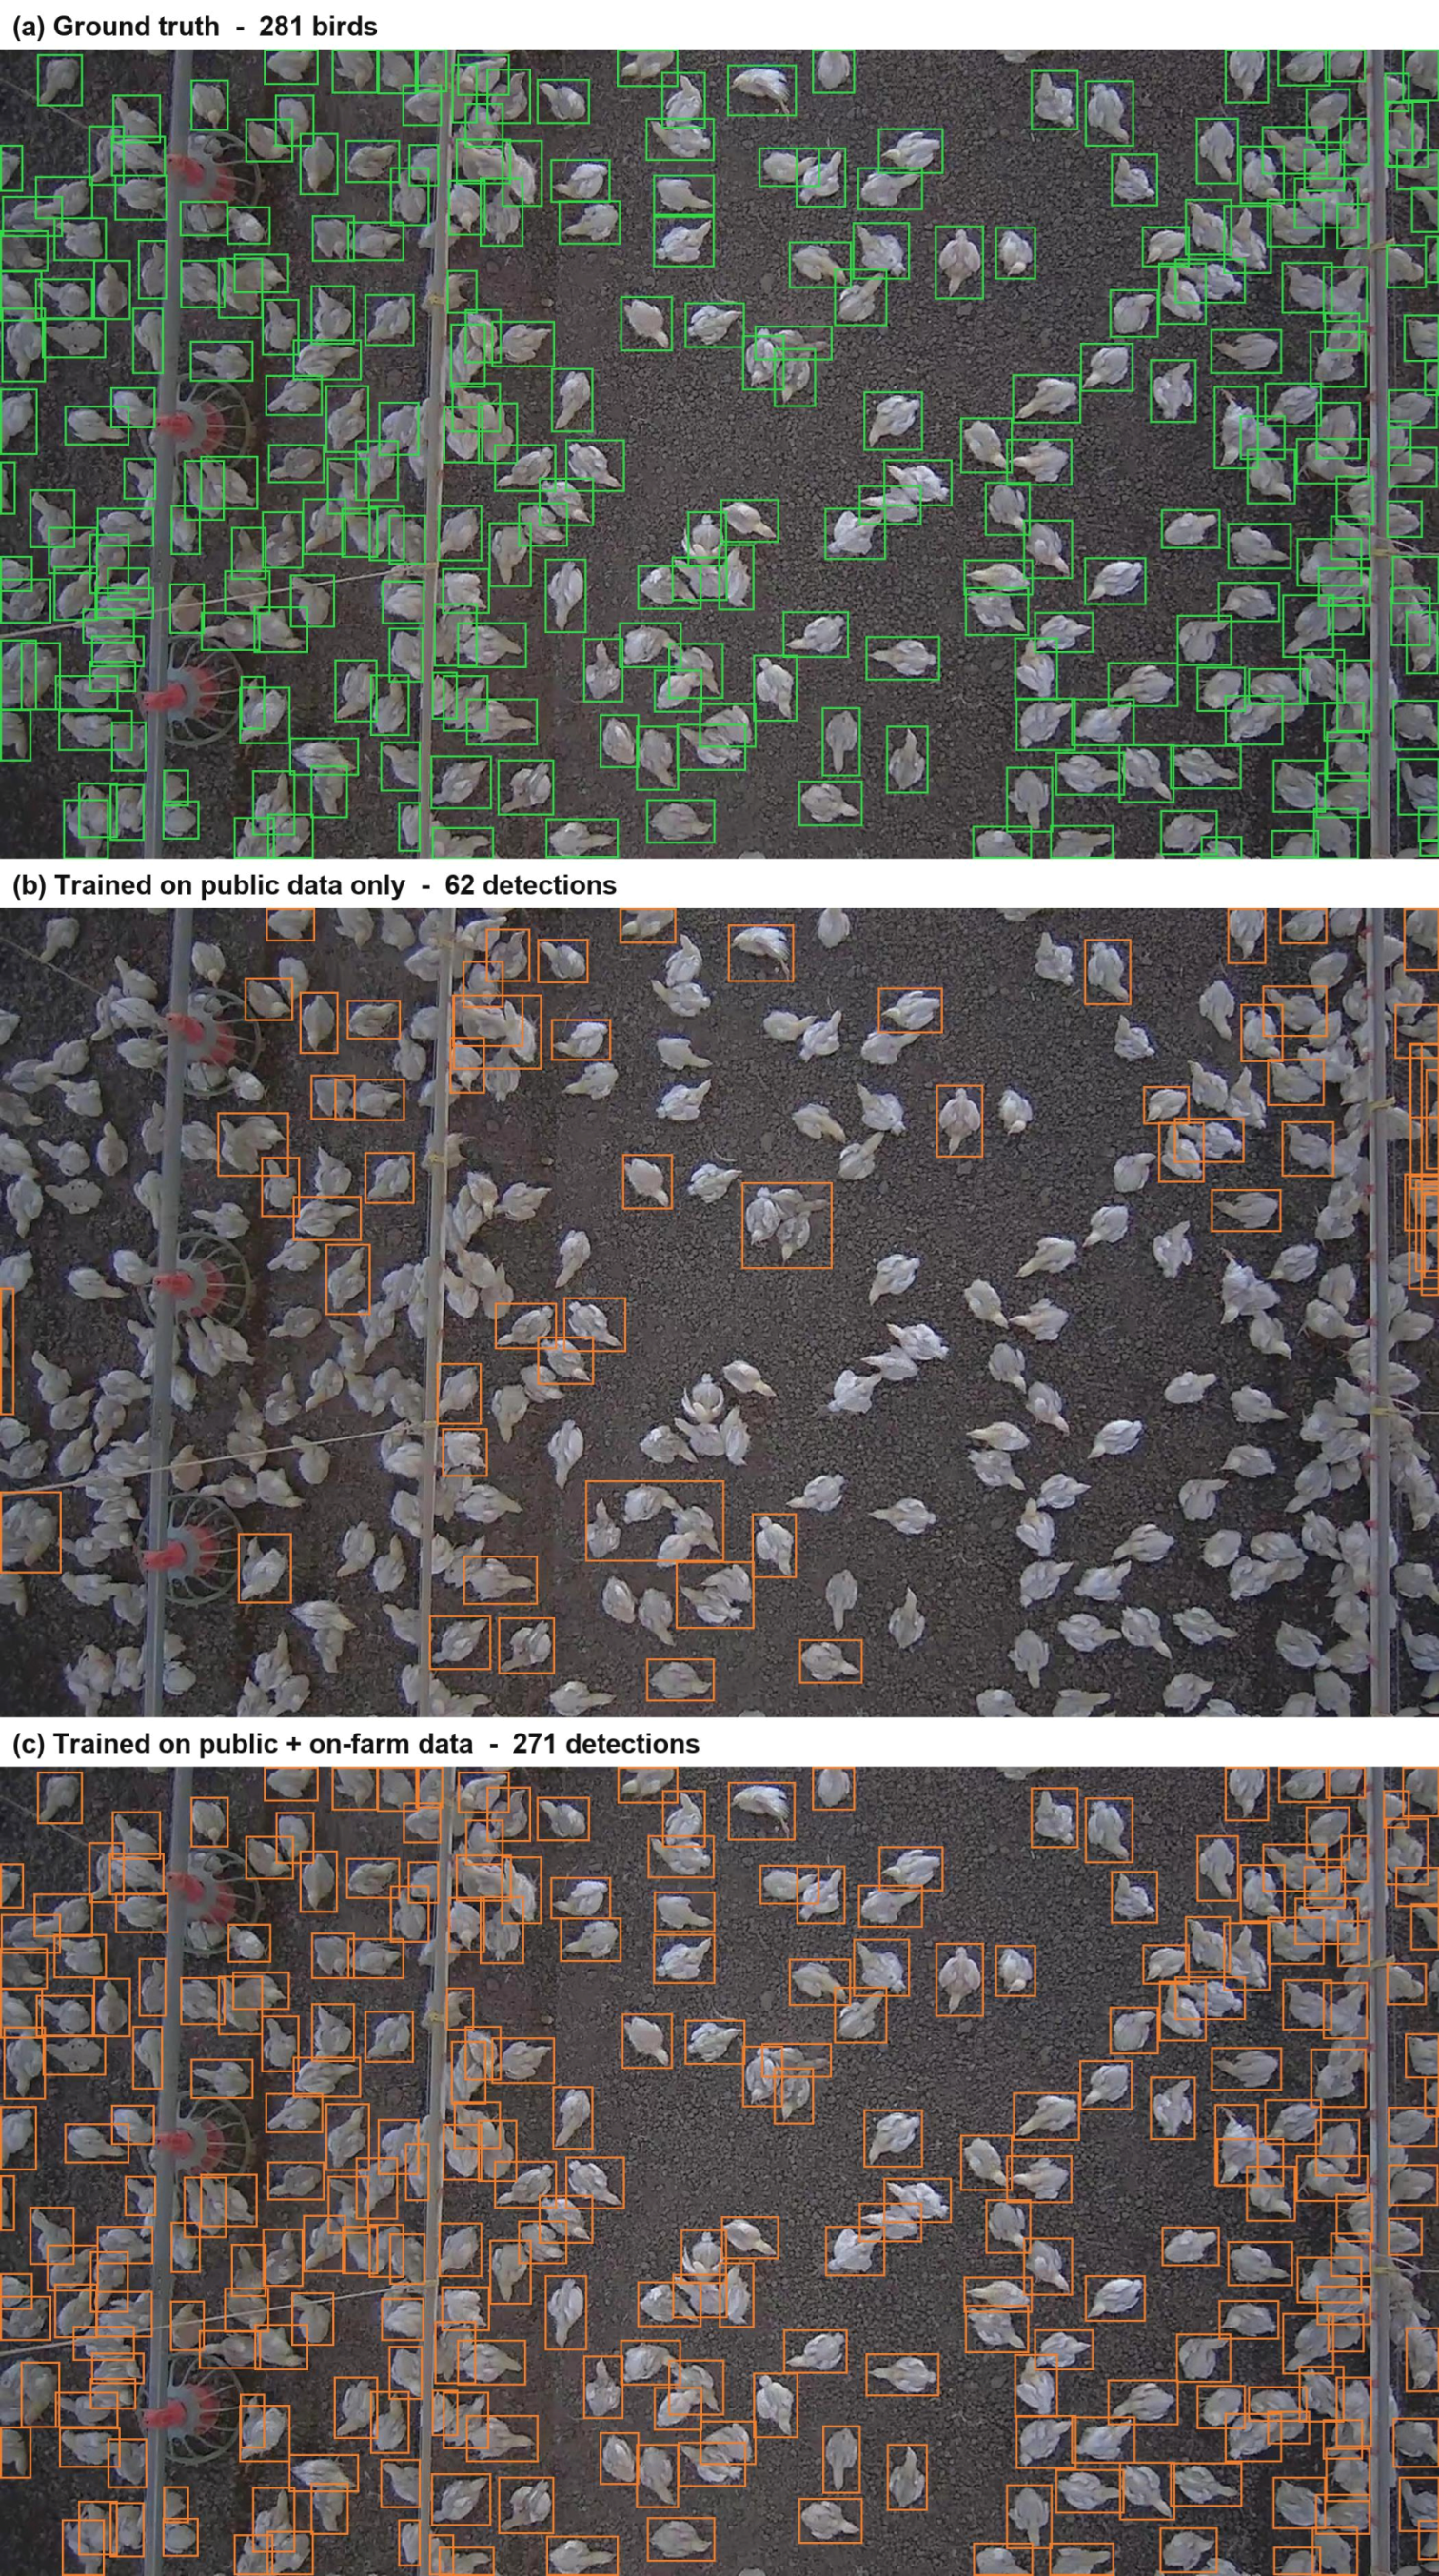
Figure 6 shows the detection results for the same video at each training stage. The first model, trained solely on public data, detected 62 of the 281 ground-truth objects, and some detection boxes encompassed two or three adjacent objects within a single box. Considering that the average bounding box area in the public dataset is approximately 7.8 times that in the field dataset, this suggests that the model directly reflected the object size distribution of the training domain. The second model, trained using combined data, detected 271 objects, with boxes separated on a per-object basis even in densely populated areas; the remaining undetected objects were primarily limited to areas where object contours overlapped.
Figure 6.
YOLOv8m detection results for the same on-farm evaluation image at each training stage. (a) Ground truth: 281 birds. (b) Trained on the public dataset only: 62 detections. (c) Trained on the combined public and on-farm dataset: 271 detections.
Performance on the public evaluation dataset is presented in Table 6. The mAP@0.5 of the second model, which incorporated on-farm data, was 0.9039 for YOLOv8m—the same level as the first model’s 0.9040—while RT-DETR-L decreased by 0.8% from 0.8904 to 0.8835. The control group, trained solely on field data, achieved a mAP@0.5 of 0.1053, failing to maintain detection performance on the public domain.
Table 6.
Detection performance on the public evaluation set (1800 images, 25,015 boxes).
Combining the results from the two evaluation sets, models trained solely on data from a single domain did not generalize sufficiently to the other domain under the conditions of this study. Models trained solely on public data showed reduced performance in the field domain, while models trained solely on field data showed reduced performance in the public domain. This domain gap is interpreted as stemming from the differences in object density and bounding box area presented in Section 2.2.3, as well as the differences in the characteristics of the two datasets. However, since this study did not independently isolate and evaluate the effects of object density, object size, and shooting conditions, it is difficult to quantitatively determine the causal contribution of each factor.
The model trained using the combined datasets showed significantly improved performance in the field domain, while maintaining a performance level similar to that of the initial model in the public domain. Specifically, the on-farm mAP@0.5 of YOLOv8m was 0.3194, 0.9876, and 0.9880 when trained on the public-only, on-farm-only, and combined datasets, respectively. While the combined dataset provided only a marginal improvement over the on-farm-only dataset in field detection performance, it maintained substantially higher performance on the public evaluation set (0.9039 vs. 0.1053). This suggests that the method of structuring data from different shooting conditions can be utilized to adapt to new domains while largely preserving detection performance in existing domains. However, given the limited scope of the field and shooting conditions used in this study, external evaluation—including different farms, shooting seasons, and camera conditions—is required to verify the generalizability of this training strategy.
3.2. Performance of the WBF-Based Ensemble
Table 7 presents the results of applying WBF to model pairs trained exclusively on public data. AR@1000 refers to average recall calculated across IoU thresholds from 0.50 to 0.95 in increments of 0.05, with a maximum of 1000 detections considered per image. The WBF achieved an mAP@0.5 of 0.4181, which was 26.4% higher than that of the top-performing single model, RT-DETR-L (0.3309), and an AR@1000 of 0.3922, representing a 24.7% improvement over the top single model. The mAP@0.5:0.95 of 0.2560 and AP_medium of 0.2811 represented improvements of 6.5% and 7.2%, respectively, while the mAP@0.75 of 0.2762 was comparable to that of the standalone YOLOv8m model (0.2799). When compared to other fusion techniques, the performance ranked as follows: WBF (0.4181), NMW (0.4160), NMS (0.4053), and Soft-NMS (0.3426), with WBF demonstrating the highest performance, although its performance differences compared to NMW and NMS were relatively small.
Table 7.
Fusion performance of the model pair trained solely on the public dataset (first stage), evaluated on the on-farm CCTV evaluation set. The selected WBF parameters were an IoU threshold of 0.55, model weights of [2, 1], a minimum confidence of 0.001, and average confidence aggregation (conf_type=‘avg’).
When applying the confidence threshold (0.01) that yields the maximum F1-score on the validation set, the precision, recall, and F1-score were 0.6986, 0.4524, and 0.5491, respectively, with an F1-score 11.0% higher than that of the best single model (RT-DETR-L, 0.4945). The detection results by model for the same area are shown in Figure 7. Out of 33 ground-truth objects, YOLOv8m detected 6, RT-DETR-L detected 23, and the fusion model detected 24.
Figure 7.
Effect of fusion for the model pair trained solely on the public dataset. Detections are shown for an identical 420 × 300-pixel region of the on-farm test set, each at its F1-optimal confidence threshold. (a) Ground truth, 33 birds. (b) YOLOv8m, 6 detections. (c) RT-DETR-L, 23 detections. (d) WBF, 24 detections.
In the second pair of models trained by combining public data and field data, the performance improvement resulting from the fusion was limited, unlike in the first pair of models (Table 8). WBF’s mAP@0.5:0.95 and mAP@0.5 were 0.8795 and 0.9879, respectively, which were similar to the corresponding metrics of the best single model (0.8795, 0.9880). However, the mAP@0.75 improved by 0.7%, from 0.9671 to 0.9737. For other fusion techniques, the NMS and Soft-NMS ensembles recorded mAP@0.5:0.95 values of 0.8645 and 0.7858, respectively, which were 1.7% and 10.7% lower than those of the YOLOv8m single model. These results show that while WBF did not improve the overall performance of the single model, it maintained the highest mAP@0.5:0.95 compared to the other fusion methods.
Table 8.
Fusion performance of the model pair trained on the combined public and on-farm dataset (second stage), evaluated on the on-farm CCTV evaluation set. The selected WBF parameters were an IoU threshold of 0.70, model weights of [2, 1], a minimum confidence of 0.001, and maximum confidence aggregation (conf_type=‘max’).
The differences in fusion effects across training stages are interpreted as being related to the performance relationships and prediction characteristics among the constituent models. For the first model pair, RT-DETR-L’s recall was 0.4086, more than twice that of YOLOv8m’s 0.1900. In contrast, mAP@0.5:0.95, which incorporates stricter IoU conditions, was higher for YOLOv8m at 0.2404 than for RT-DETR-L at 0.1794. This indicates that the two models exhibited different performance characteristics. Solovyev et al. [21] demonstrated that WBF can improve object detection by combining predictions from multiple detectors. Consistent with this finding, the improvement observed for the public-only model pair in the present study suggests that the differing predictions of YOLOv8m and RT-DETR-L helped compensate for some missed detections and localization errors.
In contrast, in the second set of models, YOLOv8m outperformed RT-DETR-L on all metrics. The results—where the model weights selected via grid search were set to 2 for YOLOv8m and 1 for RT-DETR-L, and the maximum value was chosen as the confidence calculation method—also show that YOLOv8m’s predictions were given greater weight in the fusion results. In fact, in a control experiment using the average confidence method, the mAP@0.5:0.95 was 0.8739, which was lower than that of the maximum confidence method (0.8795). Furthermore, in a high-density image containing 381 ground-truth objects, both YOLOv8m and WBF detected 376 objects, while RT-DETR-L detected 300.
Taken together, these results indicate that the benefits of WBF depend on the performance characteristics and complementarity of the constituent detectors. Under public-only training, YOLOv8m and RT-DETR-L exhibited different strengths in recall and detection performance at higher IoU thresholds, allowing WBF to improve several detection metrics relative to the best individual model. In contrast, under combined-data training, YOLOv8m consistently outperformed RT-DETR-L, and WBF did not further improve mAP@0.5:0.95, although a modest improvement in mAP@0.75 was observed. The higher weight assigned to YOLOv8m and the selected maximum confidence aggregation method may have increased the influence of its predictions, limiting the additional contribution of RT-DETR-L. These findings suggest that combining heterogeneous detector architectures does not necessarily improve performance and that the usefulness of WBF depends on model complementarity and the target evaluation metric. Therefore, fusion should be considered selectively after comparing its performance with that of the strongest individual detector.
3.3. Frame-Level Broiler Counting Performance
The results of frame-level object count estimation are presented in Table 9. The actual number of broilers in the evaluation set averaged 264.3 per frame, ranging from 103 to 381. The combined YOLOv8m model had a mean absolute error of 6.33 broilers and a root mean square error of 7.48 birds, with an accuracy of 97.60% relative to the average number of broilers and a coefficient of determination of 0.9858. RT-DETR-L’s MAE was 11.02 birds, its RMSE was 16.90 birds, and its accuracy was relatively low at 95.83%. WBF achieved a slightly higher mAP@0.75 than YOLOv8m (Table 8), but their frame-level counting metrics were identical (Table 9). Given YOLOv8m’s stronger detection performance and higher fusion weight, its predictions may have had a greater influence on the fused outputs; however, identical aggregate counting metrics do not necessarily imply identical individual detections. Under combined-data training, YOLOv8m outperformed RT-DETR-L in mAP@0.5 (0.9880 vs. 0.9484) and F1-score (0.9788 vs. 0.9590), while their corresponding counting MAEs were 6.33 and 11.02 birds per frame, respectively. Detection mAP and F1-score measure the quality of individual detections, whereas MAE and counting accuracy assess agreement between predicted and actual frame-level bird counts. Thus, the slight improvement in localization performance with WBF did not translate into a reduction in frame-level counting error under the evaluated conditions.
Table 9.
Frame-level counting accuracy on the on-farm CCTV evaluation set (109 frames; mean ground-truth count of 264.3 birds per frame). Confidence thresholds were selected on the validation set to minimize the mean absolute error.
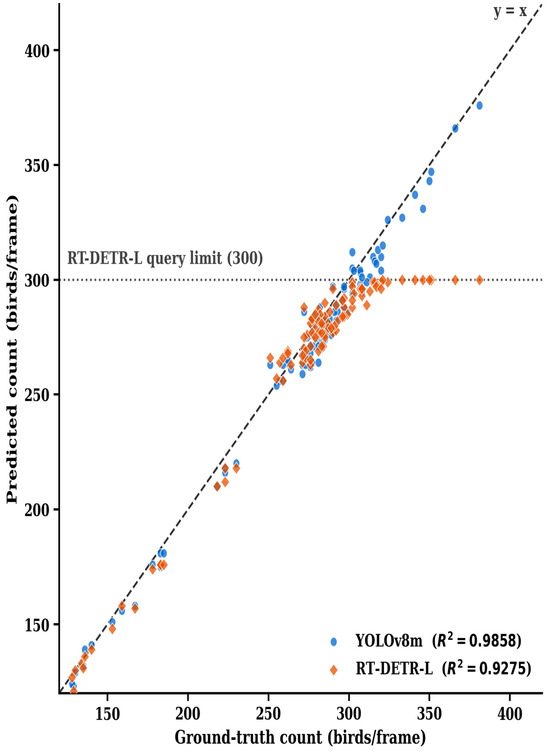
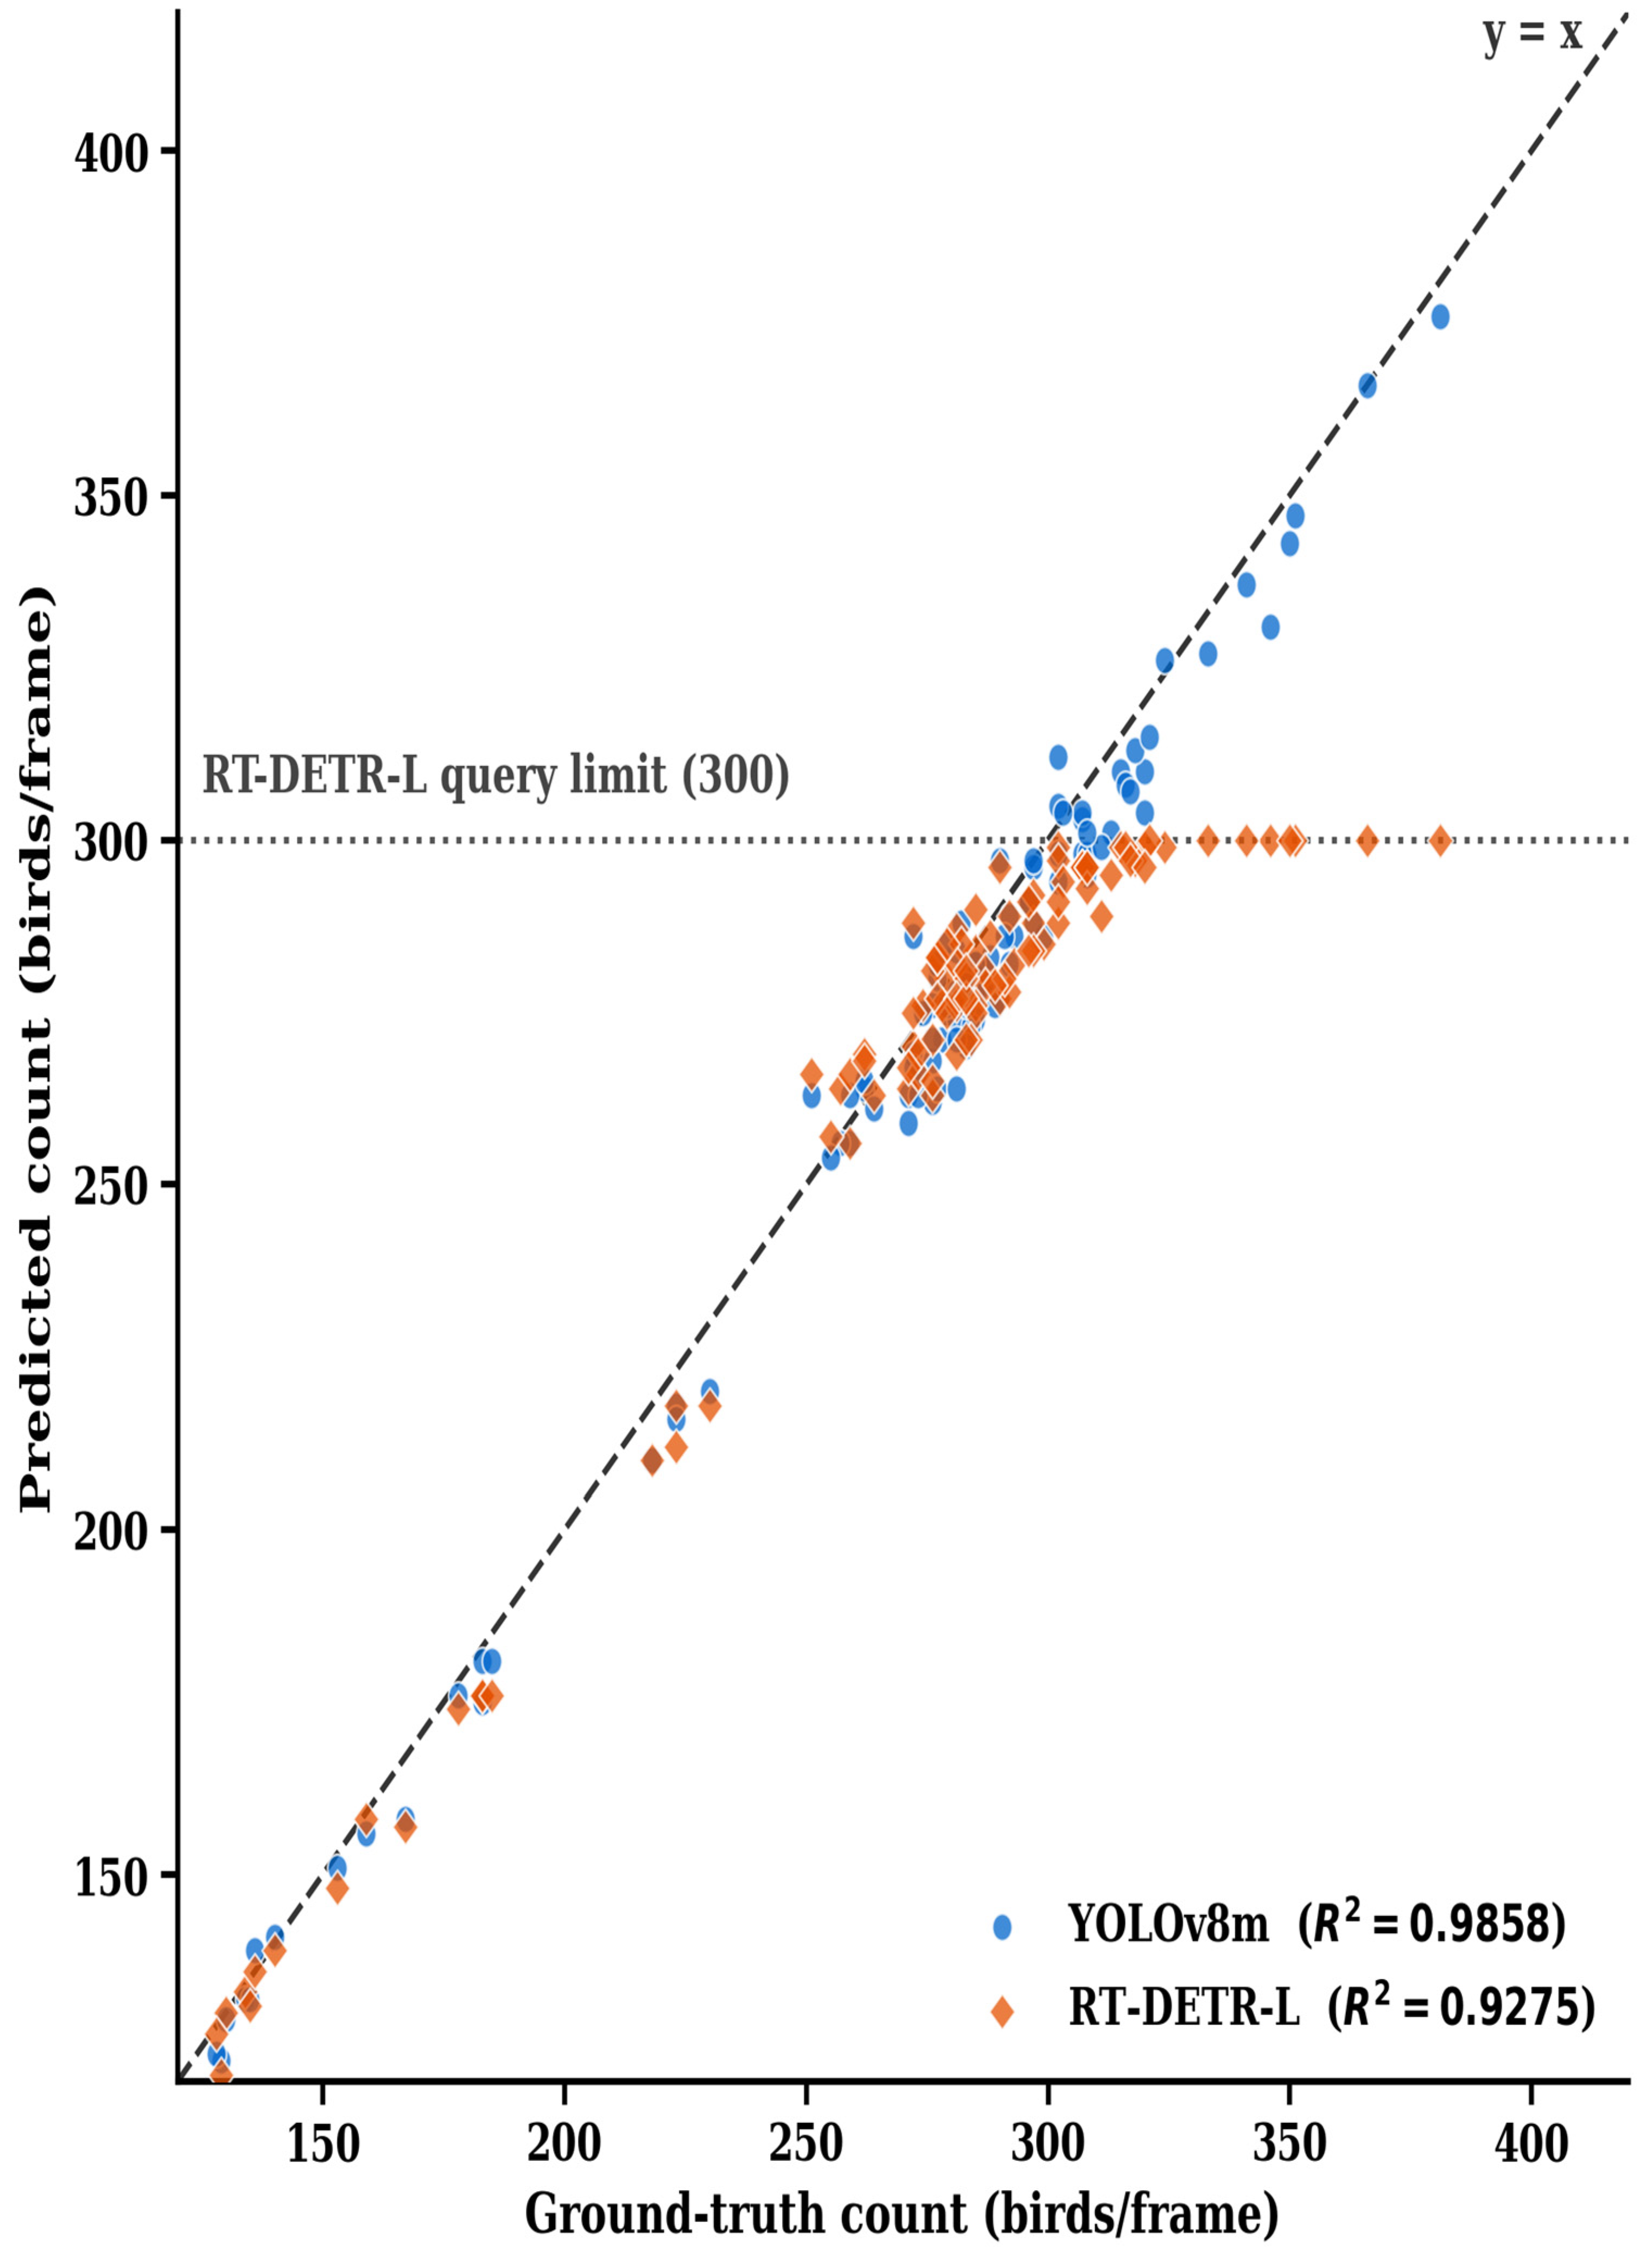
Figure 8 shows the relationship between the actual number of objects and the estimated number of objects. The estimates from YOLOv8m were distributed around the baseline (y = x) across the entire range of object counts, with a maximum absolute error of 17 objects per frame. RT-DETR-L exhibited a distribution similar to that of YOLOv8m in ranges where the actual number of animals was less than 300. However, in ranges where the actual number of animals exceeded 300, the estimated values converged to 300, resulting in a maximum absolute error of 81 animals.
Figure 8.
Relationship between ground-truth and predicted counts on the on-farm CCTV evaluation set (109 frames). The dashed diagonal line denot y = x, and the dotted horizontal line indicates the 300-query limit of RT-DETR-L.
When the mean bias was calculated as the difference between the estimated and actual counts, the results showed −4.28 and −8.61 for YOLOv8m and RT-DETR-L, respectively, indicating that both models tended to underestimate the number of objects. For the YOLOv8m model trained on the combined dataset, the mean signed errors were −1.32, −4.68, and −6.45 birds per frame for ground-truth count ranges of 100–200, 200–320, and ≥320 broilers, respectively. Furthermore, the signed counting error of the YOLOv8m model trained on the combined dataset showed a weak negative correlation with the ground-truth number of broilers per frame (r = −0.283, p = 0.003, n = 109). These results indicate that the absolute underestimation error tends to increase as the number of objects increases. However, the relative error calculated based on the average number of objects remained at around 2–3%, and no significant proportional decline in accuracy was observed with increasing object counts.
A comparison of the error distributions across models suggests that the relatively low coefficient of determination and high RMSE observed in RT-DETR-L were due to large estimation errors in some high-density frames. As shown in Figure 8, these errors were concentrated in intervals where the actual number of objects exceeded 300, which aligns with the upper bound on object query identified in Section 3.1. In contrast, YOLOv8m did not exhibit a fixed upper limit on the number of detections, and the difference between RMSE and MAE was relatively small, so the tendency for large errors to be concentrated in specific intervals was limited. Therefore, in high-density rearing environments such as those in this study, where the number of objects per frame reaches several hundred, an architecture that is not structurally limited in the number of detections is considered more suitable for object count estimation.
The above results show that the jointly trained YOLOv8m exhibits a high degree of agreement with the actual number of objects in this evaluation dataset, demonstrating its potential for use in monitoring the number of objects within a frame. However, since these results pertain to the number of objects within the field of view of individual frames, there are limitations to directly extrapolating them to estimate the total number of animals in an entire poultry house. Furthermore, since the bias consistently takes on negative values, it is considered more advantageous to incorporate the bias as a correction constant rather than using the estimated values directly in actual applications to reduce errors.
3.4. Tracking and Virtual Line-Crossing Counting Performance
The performance of the virtual line crossing counting system was evaluated using two non-overlapping 60-s video segments (900 frames each). The number of crossing events confirmed through visual counting was 39 in Segment 1 and 74 in Segment 2, for a total of 113 events. Automatic counting results were deemed to match the ground-truth events if the direction of passage was consistent and the time difference between occurrences was within 2 s. Counts matching the ground truth were recorded as TP, mismatched counts as FP, and ground-truth events with no corresponding count as FN. The performance of each detector is presented in Table 10.
Table 10.
Virtual-line crossing counting performance against manually counted ground truth. Segments 1 and 2 each cover 60 s (900 frames); a detected count was matched to a ground-truth crossing when the direction agreed and the time difference was within 2 s.
In the 120-s video combining the two segments, YOLOv8m achieved a precision of 0.927, a recall of 0.788, and an F1-score of 0.852. WBF’s corresponding metrics were 0.937, 0.788, and 0.856, respectively, with the highest F1-score among the three methods. RT-DETR-L had the lowest F1-score at 0.845, but the difference from the best-performing method was only 0.011. Considering that the average number of detections per frame for the three methods was similar, ranging from 181.4 to 181.7, it is concluded that the differences between the detectors had a limited impact on the final counting performance under these evaluation conditions. Unlike frame-level object detection, virtual line crossing counting also depends on maintaining consistent object trajectories over time. Therefore, missed detections and fragmented tracks may affect crossing counts even when the frame-level detection performance is relatively high.
Analysis by error type revealed that, across all three methods, the number of false positives (FP) ranged from 6 to 7, maintaining a precision of 0.93 or higher, while the number of false negatives (FN) ranged from 24 to 26, limiting the recall to 0.77–0.79. Therefore, the primary error in virtual line crossing counting was found to be undercounting—failing to detect actual crossing events—rather than overcounting, which involves generating additional crossing events that do not exist. In particular, 57 passage events were automatically generated in Segment 2, which was 17 fewer than the 74 events confirmed by visual counting. This indicates that passage events were generally undercounted in that section.
The ratio of the number of unique tracks generated during the tracking phase to the average number of detections per frame ranged from 9.3 to 9.8 across all 2700 frames (Table 11). This indicates that a large number of track identifiers were generated relative to the number of objects detected simultaneously, suggesting that tracks may have been repeatedly segmented during the tracking process. Previous research has reported that missing or low-confidence detections, particularly under occlusion, can lead to fragmented tracking trajectories [28]. While ByteTrack has been evaluated on general multi-object tracking benchmarks, the present footage contained numerous visually similar and overlapping broilers, which may have made reliable object association more difficult. This difference may help explain the high ratio of unique tracks to average detections observed in this study, although individual identity switches were not independently quantified. If a track is segmented near a virtual line, the previous position information required to determine a crossing may be lost, and the crossing event may not be recorded.
Table 11.
Crossing counts and tracking stability for each detector over 2700 frames (180 s). Tracks per bird is the number of unique tracks divided by the mean number of detections per frame.
3.5. Limitations of the Study
The field data for this study consisted of video footage collected from a single poultry house using a single camera. Although the training, validation, and evaluation periods were separated chronologically to eliminate frame overlap, there is a limitation in that all periods involved the same poultry house and the same flock. Therefore, the reported performance reflects evaluation results within a single environment, and the generalizability of the results to environments with different lighting conditions, litter conditions, camera installation heights, and rearing ages requires further verification. Although the on-farm dataset included 344 daytime and 172 nighttime images, artificial illumination inside the broiler house was maintained consistently, and counting performance was not evaluated separately under different lighting conditions. In addition, while the relationship between the number of visible broilers per frame and counting errors was analyzed, the independent effects of occlusion and stocking density were not quantified. Further experiments under varying illumination, occlusion levels, and stocking densities are therefore required to assess their individual effects on counting performance. Furthermore, the applicability of the proposed framework to different farms, broiler breeds, and production systems remains to be verified. Variations in bird appearance, rearing practices, camera placement, and imaging conditions may affect detection and counting performance. Extending the framework to these environments would require evaluation using representative data from each setting and, if necessary, additional model fine-tuning and adjustment of detection and tracking parameters.
The model trained solely on field data achieved a mAP@0.5 of 0.9876, with a difference of only 0.0004 compared to the combined-training model; therefore, it was difficult to clearly distinguish any additional performance improvement from combined training on the field data. In this study, the effectiveness of combined training was confirmed by the fact that it maintained performance on public domain data rather than improving field performance (Table 6). To verify the general effectiveness of combined training, a comparison using an independent evaluation set with different capture dates or poultry houses is required.
Virtual line crossing counting was evaluated using a total of 113 crossing events detected in two non-overlapping 60-s intervals. Due to the low mobility of broiler chickens, the number of events was limited; therefore, these results should be interpreted within the context of the evaluation intervals and the number of events. Consequently, additional evaluations incorporating long-duration video footage and various movement conditions are required to verify the performance and applicability of the virtual line crossing counting method. Furthermore, the virtual line method is considered more suitable for situations where individuals pass through specific points—such as during shipping or intake—rather than for continuously estimating the number of birds inside a poultry house.
4. Conclusions
An integrated video monitoring pipeline combining object detection, multi-object tracking, and object counting was developed for a commercial broiler house environment. The field adaptability of a training strategy combining the AI-Hub public dataset with on-farm CCTV data was evaluated, together with WBF-based fusion between YOLOv8m and RT-DETR-L and ByteTrack-based virtual-line crossing counting.
While the model trained solely on public data achieved a field evaluation set mAP@0.5 of 0.3309 or lower, the second model, which incorporated field data, improved to 0.9880 (YOLOv8m). WBF improved mAP@0.5 by 26.4% compared with the best single detector under public-only training, whereas under combined-data training, it matched the best individual detector in mAP@0.5:0.95 and did not reduce frame-level counting error. This suggests that the fusion effect of heterogeneous detectors may be driven more by the complementarity of errors between the constituent models than by the architectural differences themselves. The jointly trained YOLOv8m achieved an average absolute error of 6.33 birds and an accuracy of 97.60% in frame-level object counting. In virtual-line crossing counting, WBF achieved the highest F1-score of 0.856; however, undercounting remained the dominant error, with track fragmentation identified as a possible contributing factor.
Overall, the results demonstrate that incorporating on-farm data into training substantially improved broiler detection under the evaluated commercial broiler-house conditions while maintaining detection performance on the public evaluation set. The demonstrated frame-level counting accuracy and virtual-line crossing performance suggest that the proposed framework could provide quantitative indicators of local bird occupancy and movement through designated areas, potentially supporting farm personnel in prioritizing inspections. However, automated abnormal-behavior detection, management alerts, and improvements in husbandry outcomes were not evaluated, and the findings are limited to a single broiler house and camera. Further validation across different farms and imaging conditions is required.
Author Contributions
Conceptualization, M.-Y.H., Y.-J.K. and R.-G.L.; methodology, M.-Y.H. and K.-D.P.; software, M.-Y.H. and S.-M.B.; validation, M.-Y.H., K.-D.P., S.-Y.S. and S.-M.B.; formal analysis, M.-Y.H.; investigation, M.-Y.H., K.-D.P., S.-Y.S. and H.-A.L.; resources, H.-A.L. and S.-M.B.; data curation, M.-Y.H. and S.-Y.S.; writing—original draft preparation, M.-Y.H.; writing—review and editing, Y.-J.K. and R.-G.L.; visualization, M.-Y.H. and H.-A.L.; supervision, Y.-J.K. and R.-G.L.; project administration, R.-G.L.; funding acquisition, R.-G.L. All authors have read and agreed to the published version of the manuscript.
Funding
This work was supported by the Korea Institute of Planning and Evaluation for Technology in Food, Agriculture and Forestry (IPET) and the Korea Smart Farm R&D Foundation (KosFarm) through the Smart Farm Innovation Technology Development Program, funded by the Ministry of Agriculture, Food and Rural Affairs (MAFRA), the Ministry of Science and ICT (MSIT), and the Rural Development Administration (RDA) (RS-2025-02316456).
Data Availability Statement
The data presented in this study are available within the article.
Acknowledgments
During the preparation of this manuscript, the authors used DeepL Translator (web version; DeepL SE, Cologne, Germany) for the purpose of English translation. The authors have reviewed and edited the output and take full responsibility for the content of this publication.
Conflicts of Interest
The authors declare no conflicts of interest.
Abbreviations
The following abbreviations are used in this manuscript:
| AI-Hub | Artificial Intelligence Hub |
| AP | Average precision |
| AR | Average recall |
| CBAM | Convolutional block attention module |
| CCTV | Closed-circuit television |
| CNN | Convolutional neural network |
| COCO | Common Objects in Context |
| DETR | DEtection TRansformer |
| FAO | Food and Agriculture Organization of the United Nations |
| FN | False negative |
| FP | False positive |
| FPS | Frames per second |
| GPU | Graphics processing unit |
| ID | Identity |
| IoU | Intersection over Union |
| MAE | Mean absolute error |
| mAP | Mean average precision |
| MAPE | Mean absolute percentage error |
| MOT | Multi-object tracking |
| NMS | Non-maximum suppression |
| NMW | Non-maximum weighted |
| OECD | Organisation for Economic Co-operation and Development |
| PLF | Precision livestock farming |
| RMSE | Root mean square error |
| RT-DETR | Real-Time DEtection TRansformer |
| TP | True positive |
| WBF | Weighted boxes fusion |
| YOLO | You Only Look Once |
References
- OECD/FAO. OECD-FAO Agricultural Outlook 2025–2034; OECD Publishing: Paris, France; Food and Agriculture Organization of the United Nations: Rome, Italy, 2025. [Google Scholar] [CrossRef] [Scilit]
- Statistics Korea. Livestock Statistics in the First Quarter of 2024; Statistics Korea: Daejeon, Republic of Korea, 2024.
- Guo, Y.; Aggrey, S.E.; Yang, X.; Oladeinde, A.; Qiao, Y.; Chai, L. Detecting Broiler Chickens on Litter Floor with the YOLOv5-CBAM Deep Learning Model. Artif. Intell. Agric. 2023, 9, 36–45. [Google Scholar] [CrossRef] [Scilit]
- EFSA AHAW Panel (EFSA Panel on Animal Health and Animal Welfare); Nielsen, S.S.; Alvarez, J.; Bicout, D.J.; Calistri, P.; Canali, E.; Drewe, J.A.; Garin-Bastuji, B.; Gonzales Rojas, J.L.; Gortazar Schmidt, C.; et al. Welfare of Broilers on Farm. EFSA J. 2023, 21, 7788. [Google Scholar] [CrossRef] [Scilit]
- Tainika, B.; Şekeroğlu, A.; Akyol, A.; Ng’ang’a, Z.W. Welfare Issues in Broiler Chickens: Overview. World’s Poult. Sci. J. 2023, 79, 285–329. [Google Scholar] [CrossRef] [Scilit]
- An, T.E.; Cho, S.H.; Lee, D.H. Hanwoo face-based individual identification using deep learning. J. Agric. Mach. Eng. 2026, 6, 61–74. [Google Scholar] [CrossRef]
- Li, N.; Ren, Z.; Li, D.; Zeng, L. Automated Techniques for Monitoring the Behaviour and Welfare of Broilers and Laying Hens: Towards the Goal of Precision Livestock Farming. Animal 2020, 14, 617–625. [Google Scholar] [CrossRef] [Scilit]
- Blatchford, R.A. Poultry Welfare Assessments: Current Use and Limitations. J. Anim. Sci. 2017, 95, 1382–1387. [Google Scholar] [CrossRef] [Scilit]
- Kim, Y.T.; Kim, Y.H.; Baek, S.M.; Kim, Y.J. Technology trend on autonomous agricultural machinery. J. Drive Control 2022, 19, 95–99. [Google Scholar]
- Brassó, L.D.; Komlósi, I.; Várszegi, Z. Modern Technologies for Improving Broiler Production and Welfare: A Review. Animals 2025, 15, 493. [Google Scholar] [CrossRef] [Scilit]
- Rowe, E.; Dawkins, M.S.; Gebhardt-Henrich, S.G. A Systematic Review of Precision Livestock Farming in the Poultry Sector: Is Technology Focussed on Improving Bird Welfare? Animals 2019, 9, 614. [Google Scholar] [CrossRef] [Scilit]
- Van Erp-van der Kooij, E.; Rutter, S.M. Using Precision Farming to Improve Animal Welfare. CABI Rev. 2020, 15, 1–10. [Google Scholar] [CrossRef] [Scilit]
- Ben Sassi, N.; Averós, X.; Estevez, I. Technology and Poultry Welfare. Animals 2016, 6, 62. [Google Scholar] [CrossRef] [Scilit]
- Hwang, M.-Y.; Lee, J.-C.; Lee, J.-Y.; Lim, R.-G.; Han, C.-W. A Review and Future Directions Based on Trend Analysis of Smart Broiler House Environmental Monitoring Technologies. J. Korea Soc. Comput. Inf. 2026, 31, 199–212. [Google Scholar] [CrossRef] [Scilit]
- Fernández, A.P.; Norton, T.; Tullo, E.; van Hertem, T.; Youssef, A.; Exadaktylos, V.; Vranken, E.; Guarino, M.; Berckmans, D. Real-Time Monitoring of Broiler Flock’s Welfare Status Using Camera-Based Technology. Biosyst. Eng. 2018, 173, 103–114. [Google Scholar] [CrossRef] [Scilit]
- Zhu, X.; Wu, C.; Yang, Y.; Yao, Y.; Wu, Y. Automated Chicken Counting Using YOLO-v5x Algorithm. In Proceedings of the 2022 8th International Conference on Systems and Informatics (ICSAI); IEEE: Piscataway, NJ, USA, 2022. [Google Scholar] [CrossRef] [Scilit]
- Gao, B.; Zhang, W.; Hao, D.; Yang, K.; Chen, C. CF-DETR: A Lightweight Real-Time Model for Chicken Face Detection in High-Density Poultry Farming. Animals 2025, 15, 2919. [Google Scholar] [CrossRef] [Scilit]
- Jeong, H.H. Introduction of the deep learning. J. Drive Control 2024, 21, 240–249. [Google Scholar]
- Abuhussein, M.F.A.; El-Soaly, I.S.; Elmessery, W.M.; Abd El-Wahhab, G.G. Thermal Imaging and Advanced Deep Learning for Automated Broiler Detection and Counting. AL-Azhar J. Agric. Eng. 2024, 7, 49. [Google Scholar] [CrossRef] [Scilit]
- Zhao, Y.; Lv, W.; Xu, S.; Wei, J.; Wang, G.; Dang, Q.; Liu, Y.; Chen, J. DETRs Beat YOLOs on Real-Time Object Detection. In Proceedings of the 2024 IEEE/CVF Conference on Computer Vision and Pattern Recognition (CVPR); IEEE: Piscataway, NJ, USA, 2024; pp. 16965–16974. [Google Scholar] [CrossRef] [Scilit]
- Solovyev, R.; Wang, W.; Gabruseva, T. Weighted Boxes Fusion: Ensembling Boxes from Different Object Detection Models. Image Vis. Comput. 2021, 107, 104117. [Google Scholar] [CrossRef] [Scilit]
- Ariza-Sentís, M.; Vélez, S.; Martínez-Peña, R.; Baja, H.; Valente, J. Object Detection and Tracking in Precision Farming: A Systematic Review. Comput. Electron. Agric. 2024, 219, 108757. [Google Scholar] [CrossRef] [Scilit]
- Rajagukguk, R.A.; Lee, S.-Y.; Park, J.-Y.; Daniel, K.F.; Lee, C.-R.; Chen, Z.; Liu, D.; Norton, T.; Park, J.; Hong, S.-W. Deep Learning for Visual Animal Monitoring (Detection, Tracking, Pose Estimation, and Behavior Classification): A Comprehensive Review. Smart Agric. Technol. 2025, 12, 101539. [Google Scholar] [CrossRef] [Scilit]
- Autz, J.; Mishra, S.K.; Herrmann, L.; Hertzberg, J. The Pitfalls of Transfer Learning in Computer Vision for Agriculture. In Künstliche Intelligenz in der Agrar- und Ernährungswirtschaft; Gandorfer, M., Hoffmann, C., El Benni, N., Cockburn, M., Anken, T., Floto, H., Eds.; Lecture Notes in Informatics (LNI); Gesellschaft für Informatik: Bonn, Germany, 2022; pp. 51–56. [Google Scholar]
- Joshi, A.; Guevara, D.; Earles, M. Standardizing and Centralizing Datasets for Efficient Training of Agricultural Deep Learning Models. Plant Phenomics 2023, 5, 0084. [Google Scholar] [CrossRef] [Scilit]
- Shin, H.; Kim, G.-Y. Source-Free Domain-Adaptive Semi-Supervised Learning for Object Detection in CCTV Images. Sensors 2026, 26, 45. [Google Scholar] [CrossRef] [Scilit]
- Hu, X.; Chen, S.; Duan, Q.; Ahn, C.K.; Shang, H.; Zhang, D. Domain Adaptation for Big Data in Agricultural Image Analysis: A Comprehensive Review. arXiv 2025, arXiv:2506.05972. [Google Scholar]
- Zhang, Y.; Sun, P.; Jiang, Y.; Yu, D.; Weng, F.; Yuan, Z.; Luo, P.; Liu, W.; Wang, X. ByteTrack: Multi-Object Tracking by Associating Every Detection Box. In Proceedings of the European Conference on Computer Vision (ECCV), Tel Aviv, Israel, 23–27 October 2022; Springer: Cham, Switzerland, 2022; pp. 1–21. [Google Scholar] [CrossRef] [Scilit]
- Bošnjak, A.; Pejić, P.; Cupec, R.; Job, J.; Nyarko, E.K.; Lukić, B. Computer Vision for Automated Cattle Monitoring: A Review of Detection, Tracking, and Re-Identification. In Proceedings of the 2026 49th MIPRO ICT and Electronics Convention (MIPRO), Opatija, Croatia, 25–29 May 2026; IEEE: Piscataway, NJ, USA, 2026; pp. 62–67. [Google Scholar] [CrossRef] [Scilit]
- Pranata, F.S.; Na’am, J.; Yulhan; Lisna, Y.P.; Utami, R.A.; Rahmatunisa, R.; Saputra, I.; Putri, E.Y.; Mahniza, M.; Hutasuhut, N.I. A Comparative Evaluation of Lightweight YOLO Detectors with BoT-SORT and ByteTrack for Real-Time Multi-Object Tracking. Int. Res. J. Multidiscip. Scope 2026, 7, 1348–1362. [Google Scholar] [CrossRef] [Scilit]
- Puri, D. LibertyTrack: YOLO11n and Virtual Line Crossing for Real-Time Directional Flow Counting in Kathmandu—A Deployment Case Study. OSF Preprints 2026. Available online: https://osf.io/6s7aw/overview (accessed on 19 October 2026).
- Sokolova, M.; Lapalme, G. A Systematic Analysis of Performance Measures for Classification Tasks. Inf. Process. Manag. 2009, 45, 427–437. [Google Scholar] [CrossRef] [Scilit]



Disclaimer/Publisher’s Note: The statements, opinions and data contained in all publications are solely those of the individual author(s) and contributor(s) and not of MDPI and/or the editor(s). MDPI and/or the editor(s) disclaim responsibility for any injury to people or property resulting from any ideas, methods, instructions or products referred to in the content. |
© 2026 by the authors. Licensee MDPI, Basel, Switzerland. This article is an open access article distributed under the terms and conditions of the Creative Commons Attribution (CC BY) license.