


Abstract
Winter wheat grain quality is influenced by genetic and agronomic factors, including nitrogen (N) fertilisation. This study evaluated the effects of cultivar and N fertilisation strategy on the grain yield, some physical and geometric properties, colour, and chemical composition. Two cultivars, Activus and Chevignon, were compared under three N strategies: 40, 100, and 170 kg N ha−1 (N40, N100, and N170). Grain yield and its components did not differ significantly between cultivars or among N fertilisation strategies. The number of grains per ear was numerically higher in Chevignon, but the difference between cultivars was not statistically significant. Cultivar affected bulk density and grain size distribution; Activus had a higher bulk density and a higher proportion of grains > 2.8 mm, whereas Chevignon had more smaller grains. Increasing N supply did not affect the geometric characteristics of wheat grains. The colour parameters a*, b*, and chroma were highest under N40 and lowest under N170, whereas hue showed the opposite trend. Dry matter (DM) and crude protein (CP) differed between cultivars, and CP was also affected by N strategy. Phosphorus (P) and magnesium (Mg) contents did not differ statistically in relation to the independent variables included in the experiment.
1. Introduction
Balanced fertilisation plays a crucial role in improving both the efficiency and quality of crop production. Nitrogen fertilisation is one of the most important yield-forming factors in wheat production, as it increases both grain protein content and yield [1]. At the same time, N application significantly affects the spatial distribution of proteins within the grain by modifying their accumulation in specific fractions. Konopka et al. [2] demonstrated that grain protein composition depends on wheat genotype, kernel size, and their interaction. They reported that decreasing kernel size leads to a reduction in albumins, globulins, and glutenins, while gliadins are more strongly influenced by kernel size than genotype, reaching the highest levels in both the smallest and largest grain fractions [3,4]. Adequate N supply promotes vegetative growth, increases ear number, and enhances grain protein accumulation, whereas insufficient N limits plant development and reduces yield potential. Numerous studies have shown that grain yield depends strongly on the N application rate and management [5,6,7]. Conversely, excessive N fertilisation may lead to excessive vegetative growth, increased lodging risk, and deterioration of grain quality [4,7].
Grain yield and its components are influenced not only by N fertilisation but also by cultivar-specific responses and environmental conditions [6,8,9]. The effectiveness of N fertilisation depends on soil fertility, climatic conditions, and the genetic characteristics of cultivars. Therefore, optimising N management remains a key challenge in modern wheat production systems. Recent studies emphasise that both yield formation and grain quality are determined by complex interactions between genotype, environment, and agronomic practices, including N fertilisation [8,9].
In recent years, increasing attention has been paid to grain physical and geometric characteristics, which, in addition to yield, are recognised as key indicators of grain quality and determinants of post-harvest processing efficiency. These characteristics directly affect post-harvest processing efficiency, including cleaning, sorting, and milling operations, and influence storage stability and grain handling [10,11]. Despite their importance, the combined effects of N fertilisation and cultivar on these traits remain insufficiently explored. Traits such as grain size, shape, and density are affected by both genetic and environmental factors; however, their response to N fertilisation remains insufficiently understood, particularly in modern winter wheat cultivars [8,12].
Grain size is one of the most important components of cereal yield. It is a quantitative trait with a complex genetic architecture, determined by the action of multiple genes. The formation of grain size depends on a range of processes occurring at different stages of plant development, starting from the tillering and spikelet formation phases, through the accumulation of assimilates before flowering, and continuing into the grain filling and maturation stages [13]. Grain size can be characterised by length, width, thickness, and the ratio between length and width. The length and width of the grain are primarily determined by both the number and size of cells in the spikelet glumes, while its thickness is mainly shaped by processes occurring during grain filling. This trait is quantitative in nature and has a complex genetic basis, being influenced by multiple genes, as well as environmental conditions. Since the development of modern agriculture, it has remained a major focus of both scientific research and plant breeding [14].
Winter wheat (Triticum aestivum L.) is one of the most important cereal crops cultivated worldwide and plays a key role in both food and feed production [15]. In Poland, it is a dominant cereal species, and its production requires efficient nutrient management to achieve high yields and desirable grain quality [16].
The aim of this study was to evaluate the effects of cultivar and N fertilisation strategy on the grain yield and yield components, bulk density, grain size distribution, grain geometric traits, grain colour, and chemical composition in two winter wheat cultivars, Activus and Chevignon. The N treatments were considered complete fertilisation strategies combining total N rate with application schedule.
It was hypothesised that cultivar and N fertilisation strategy would affect selected physical and geometric properties and the chemical composition of the grain, and that the response to N fertilisation strategy could depend on the cultivar.
2. Materials and Methods
2.1. Experimental Design
This study was conducted during the 2023/2024 growing season at the Experimental Station of the Wroclaw University of Environmental and Life Sciences in Swojec (51°07′ N, 17°10′ E). The soil is classified as alluvial soil according to the Polish Soil Classification (SGP6) [17], or as Eutric Fluvisols (Humic) according to the IUSS Working Group WRB [17,18]. A two-factor experiment was established using a split-plot experimental design with four replications. In total, 24 plots were applied in form of 4 blocks with 6 plots in each block. Single plots covered an area of 15 m2 (1.5 m × 10 m). Cultivar was the main plot factor, and N fertilisation was the subplot factor. The factor levels for cultivar were the cultivars Activus and Chevignon. Seeds of both cultivars were supplied by Saatbau Linz eGen (Leonding, Austria). Activus is classified by the Research Centre for Cultivar Testing (Centralny Ośrodek Badań Odmian Roślin Uprawnych, COBORU) [16] as a class A cultivar. It is recognised for its excellent grain yield potential and high grain quality. In addition to its quality traits, this cultivar is also known for its adaptability to water deficiency and nutritional properties. Chevignon is classified by COBORU as a mid-early, awnless wheat cultivar that combines very high grain yields with good quality.
Three N fertilisation strategies were applied, representing increasing total N supply combined with stage-specific split applications: 40 kg N ha−1 (N40), 100 kg N ha−1 (N100), and 170 kg N ha−1 (N170). Nitrogen was applied as PULAN ammonium nitrate (34.4% N; Grupa Azoty Zakłady Azotowe “Puławy” S.A., Puławy, Poland).The N40 strategy was applied in a single application, N100 in two splits, and N170 in three splits, depending on the treatment level and key stages of plant development. The N40 treatment was applied entirely at the tillering stage (BBCH 21 on 15 March 2024). In the N100 treatment, N was applied in two doses: 40 kg N ha−1 at tillering (BBCH 21) on 15 March 2024, and 60 kg N ha−1 at the stem elongation stage (BBCH 30–31) on 6 April 2024. The highest dose, the N170 treatment, was split into three applications: 40 kg N ha−1 at tillering (BBCH 21) on 15 March 2024; 60 kg N ha−1 at stem elongation (BBCH 30–31) on 6 April 2024; and 70 kg N ha−1 at the heading stage (BBCH 53) on 12 May 2024. The N40 treatment was selected as the lowest fertiliser treatment within the adopted fertilisation programme and represented a low-input N management strategy. The treatments are referred to as N fertilisation strategies because they differed jointly in total N rate and application schedule. N40 comprised one application at BBCH 21, N100 comprised two applications at BBCH 21 and BBCH 30–31, and N170 comprised three applications at BBCH 21, BBCH 30–31, and BBCH 53. Total N rate, application frequency, and the inclusion of later applications therefore varied together and were not independently manipulated. Consequently, treatment comparisons represent the effects of the complete fertilisation strategies and do not isolate the effects of N rate from those of application timing or frequency.
Phosphorus (P) and potassium (K) fertilisers were applied to all plots before sowing on 3 October 2023. Phosphorus was applied at a dose of 70 kg P2O5 ha−1as enriched superphosphate (Super fos dar 40; Grupa Azoty “FOSFORY” Sp. z o.o., Gdańsk, Poland), and K at 100 kg K2O ha−1 as potassium chloride (Grupa Azoty Zakłady Chemiczne “Police” S.A., Police, Poland). The preceding crop was winter oilseed rape. Winter wheat was sown on the recommended sowing date for Lower Silesia (15 October 2023), with 260 germinable seeds m−2 at a planting depth of 3 cm and a row spacing of 12.5 cm. Chemical protection against weeds, diseases, and pests was applied according to the recommendations of the Institute of Plant Protection (IOR). Harvesting took place at full maturity on 12 July 2024. After harvest, grain yield, grain yield structure traits, and grain quality characteristics were assessed.
2.2. Soil and Weather Conditions
The soil has a medium texture. Before sowing, soil samples were collected on 8 October 2023 from a depth of 0–30 cm using a soil sampling probe. Six subsamples were collected from each plot and combined into one representative composite sample per plot. This procedure was applied to all plots representing the treatment combinations and replicates. The samples were submitted to the Regional Chemical and Agricultural Station in Wrocław, Poland, for analysis. Available phosphorus (P) and potassium (K) were determined using the Egner–Riehm (DL) method, and available magnesium (Mg) was determined using the Schachtschabel method. Soil pH was measured potentiometrically in 1 M KCl. Available nutrient contents were 7 mg of P2O5, 9 mg of K2O, and 4 mg of Mg per 100 g of soil. Soil pH was 5.86, and humus content was 1.5%.
A separate soil sampling procedure was conducted on 4 March 2024, before the first spring N application, to determine soil mineral nitrogen (Nmin). Samples were collected from a depth of 0 to 30 cm and submitted to the Regional Chemical and Agricultural Station in Wrocław. The reported soil mineral N stock for the sampled profile was 68 kg N ha−1.
The climate in this area is mild, generally warm, and temperate, according to the Köppen–Geiger classification; thus, the climate is classified as Cfb. In Wrocław, the mean annual temperature is 10 °C. Precipitation is moderate, with an annual total of about 600–620 mm. The growing season in Wrocław is one of the longest in Poland, with the number of days with conditions favourable for plant growth often exceeding 220 days per year.
Weather data were provided by the Swojec Experimental Station in Wroclaw. Compared to the multi-year mean, the temperature during the growing season in 2023/2024 was higher in all months, except for November, with high values as early as February and March; furthermore, precipitation was higher in November, December, and February but lower in the other months (Table 1). This study incorporated the Sielianinov hydrothermal coefficient (HTC), an indicator used to assess hydrothermal conditions during the growing season. The HTC determines the degree of moisture availability or the occurrence of drought by accounting for the relationship between total precipitation and air temperature over the examined period. This parameter provides a precise characterisation of weather variability affecting plant growth and development, and it serves as a valuable interpretative tool for evaluating plant responses to environmental stress [19]. The following classification of periods is used for the HTC values: extremely dry (<0.4); very dry (0.4–0.7); dry (0.8–1.0); rather dry (1.1–1.3); optimal (1.4–1.6); rather wet (1.7–2.0); wet (2.1–2.5); very wet (2.6–3.0); and extremely wet (>3.0) [20,21,22]. The HTC is calculated as follows:
HTCm = ∑Pm × 10/∑Tm,
Table 1.
Weather conditions during the experimental period (2023–2024) and the long-term mean values.
Here, HTCm is the hydrothermal coefficient for a given month, ΣPm is the total precipitation during that month (mm), and ΣTm is the sum of the mean daily air temperatures (°C) for days within the same month when the mean daily air temperature exceeded 8 °C. HTC was calculated separately for each month presented in Table 1. Following Chmist-Sikorska et al. [19], the HTC was calculated for the growing season; however, in our study, only months with a mean temperature > 8 °C were considered for analysis. Therefore, the Sielianinov hydrothermal coefficient (HTC) was only calculated for months in which the mean air temperature exceeded 8 °C, meaning that, for the study year, it was calculated for the period from April to October. The HTC showed extremely dry conditions for October and April, very dry conditions for May and June, and dry conditions for July (Table 1).
2.3. Grain Yield and Grain Yield Components
After harvest, the number of grains per ear and single-ear grain weight were determined using 10 ears for each plot. The moisture content of the wheat grains was measured on the day of harvest using a Wile 55 grain moisture meter (Farmcomp Oy, Tuusula, Finland) according to PN-ISO 712:2002 [23]. Before further analyses, grain moisture content was determined according to PN-ISO 712:2002 [23] and standardised [24]. The thousand-grain weight (TGW) was calculated by multiplying the mean single-grain weight (SGW) obtained during geometric analysis by 1000.
2.4. Bulk Density and Grain Distribution
The bulk density of winter wheat grain was measured using a HECTO grain bulk density meter (Pfeuffer GmbH, Kitzingen, Germany) according to PN-EN ISO 7971-3:2009 [25]. Grain size distribution was determined using a mechanical sorter (Sadkiewicz Instruments, Bydgoszcz, Poland) according to Polish Standard PN-R-74110:1998 [26]. A 100 g grain sample was placed on the upper sieve and mechanically shaken for 3 min using three slotted sieves with widths of 2.8, 2.5, and 2.2 mm. Each sample was separated into four grain size fractions: >2.8 mm (fraction 1), 2.5–2.8 mm (fraction 2), 2.2–2.5 mm (fraction 3), and <2.2 mm (fraction 4). Each fraction was weighed, and its proportion was calculated as a percentage of the initial sample mass.
2.5. Measurement of Grain Colour
Grain colour was assessed using a Minolta chromameter Konica Minolta CM-600d, Konica Minolta Sensing Americas, Inc., Ramsey, NJ, USA), based on the CIE 1976 L*, a*, b* colour space. The parameters measured included L* (lightness), a* (red–green axis), and b* (yellow–blue axis). The samples from each plot were placed in a 90 mm Petri dish and levelled to a uniform depth of approximately 2 cm prior to measurement. To ensure accuracy and representativeness, readings were taken at three different points on the surface of each wheat sample [27].
Grain surface colour was quantified using the CIELAB colour space (L*, a*, b*). In this system, L* represents lightness and ranges from 0 (black) to 100 (white). The a* coordinate represents the red–green axis, with positive values indicating redness and negative values indicating greenness. The b* coordinate represents the yellow–blue axis, with positive values indicating yellowness and negative values indicating blueness.
The Munsell colour system, an internationally accepted standard for characterising colours, especially in soil classification, was also referenced. Hue values were approximated to the nearest standard hue, typically 10 YR or 2.5 Y, as per Munsell chart designations. In the Munsell colour system, the abbreviation YR stands for yellow-red, a hue between yellow and red on the Munsell colour wheel. Due to natural variation and slight tonal differences among individual grains, visual assessment of grain colour is challenging. Hence, the use of an objective colourimetric method ensures higher precision and repeatability.
2.6. Grain Geometric Traits
The physical traits of wheat grain, including grain size parameters, were assessed using a subsample of 80 randomly selected grains from each field replicate. The measurements were performed for each treatment combination across four field replicates (2 cultivars × 3 nitrogen fertilisation levels × 4 field replicates), with 80 grains analysed per field replicate. Thus, the 80 grains represented subsamples within each field replicate and were not considered independent experimental replicates. After weighing each grain to obtain the single-grain weight (SGW), the three primary linear dimensions—length (L), width (W), and thickness (T)—were measured (with measurements taken in triplicate for each) using a precision digital micrometre (MIER-MIKR25; supplied by SPAW Sp. z o.o. Centrum Techniki, Kraków, Poland) with a measurement range of 0–25 mm and a resolution of 0.01 mm.
Based on these measurements, shape descriptors, namely, arithmetic mean diameter (Da), geometric mean diameter (Dg), equivalent mean diameter (Dp), and sphericity (ϕ), were calculated using standard geometric equations commonly applied in grain morphology analysis [28]:
The general form of the grain was characterised using the aspect ratio (Ra), which was calculated following the procedures outlined by Falade and Christopher [29] and Markowski et al. [30]:
The morphology of wheat grains can be approximately represented as that of a rotational ellipsoid. Based on this assumption, the seed surface area (Fz) of the analysed winter wheat grains was estimated using the following formula [31,32,33]:
To assess the proportional relationship between grain dimensions, the sphericity coefficient (Kw) indicator was calculated as follows [31,32,33]:
Based on the assumption that the grain shape can be approximated by a rotational ellipsoid, the grain volume (Vg) was determined as described in Gastón et al. [34]:
The factor–form–density (FFD) index is a useful phenotypic indicator for wheat grains, designed to characterise structural density differences and deviations from an ideal cylindrical form [35]:
2.7. Chemical Analysis
All chemicals and reagents used in the grain chemical analyses were purchased from Alchem (Wrocław, Poland). The N content of whole-grain samples from each plot was determined using the Kjeldahl method, with steam distillation performed using a K-355 distillation unit (BÜCHI Labortechnik AG, Flawil, Switzerland). Crude protein (CP) content was calculated by multiplying the N content by a factor of 5.7.
For the determination of phosphorus (P) and magnesium (Mg), grain samples were subjected to wet mineralisation using sulfuric acid (H2SO4) and hydrogen peroxide (H2O2; perhydrol) in an electric furnace at 400 °C. Phosphorus was determined colourimetrically using the vanadomolybdate method at a wavelength of 470 nm. Magnesium was determined spectrophotometrically using titanium yellow as the colour-forming reagent at a wavelength of 547 nm. Absorbance was measured using a Spekol 11 spectrophotometer (Carl Zeiss Jena, Jena, Germany). Phosphorus and Mg concentrations were calculated from calibration curves prepared by diluting stock standard solutions: a CertiPUR phosphorus standard containing 1000 mg L−1 P (catalogue no. 1.70340.0100; Merck KGaA, Darmstadt, Germany) and an aqueous Mg2+ standard containing (1.000 ± 0.005) g L−1 Mg (catalogue no. 13.19; Regional Office of Measures in Łódź, Łódź, Poland).
2.8. Statistical Analysis
Statistical analysis and visualisation were carried out using Statistica version 13.3 (TIBCO Software Inc., Palo Alto, CA, USA) [36]. Data were statistically analysed using two-way split-plot ANOVA. The normality of the distribution of the studied variables was assessed using the Shapiro–Wilk test. When the data did not follow a normal distribution, non-parametric tests were applied; that is, the Mann–Whitney U test was employed for analysis. When the data followed a normal distribution, homogeneous groups were identified using a post hoc test. Homogeneity of variance was checked using Levene’s test. A two-way mixed-model split-plot analysis was conducted for two main factors, namely, cultivar and N dose. The following equation was used:
yijkl = μ + αj + γk + (αγ)jk + βi + (αβ)ij + εijkl.
Here,
yijkl—the value of the observed dependent variable;
μ—the overall mean;
αj—the main effect of the wheat cultivar;
γk—the main effect of nitrogen;
(αγ)jk—the interaction between wheat cultivar and nitrogen;
βi—the effect of the block;
(αβ)ij—the main plot error;
εijkl—the subplot error.
The significance of differences was determined at p < 0.05. Tukey’s HSD test was used to determine the differences between mean values.
Correlation analysis was also performed using Statistica software, including an examination of the relationships between geometric traits and nutrients in grain. Correlation coefficients between variables were calculated using Spearman’s rank correlation test (p < 0.05). Multiple regression analysis was performed to determine the regression equation for the dependent variable, including the significance of individual predictors (p < 0.05), and the model fit was expressed as the coefficient of determination (R2). Furthermore, the NIPALS algorithm was applied for multivariate modelling using all experimental variables. Principal component analysis (PCA) was conducted to assess the proportion of variance explained (based on the sums of squares) and to evaluate the relationships among variables.
The plot-level raw data underlying Tables 2, 3, 5, 6, and 8 are provided in the Supplementary Materials.
3. Results
3.1. Effects of Cultivar and Nitrogen Fertilisation on Grain Geometric Characteristics
The mean values for both cultivars and the three fertilisation levels were as follows: grain yield, 6.33 t ha−1; grain moisture content, 13.8%; number of grains per ear, 51.0; TGW, 38.48 g; and single-ear grain yield, 1.96 g. No difference between cultivars was observed in TGW. Grain yield, grain moisture content, and single-ear grain yield of winter wheat did not differ between cultivars. Chevignon had a higher number of grains per ear than Activus, but the difference was not statistically significant. None of the parameters were affected by fertilisation (Table 2).
Table 2.
Effects of cultivar and nitrogen fertilisation on grain yield, grain moisture content, and grain yield components of winter wheat (n = 24).
The mean bulk density values and grain size distributions for both cultivars and the three fertilisation levels were as follows: bulk density, 741 kg m−3; fraction 1 (>2.8 mm), 44.5%; fraction 2 (2.5–2.8 mm), 29.1%; fraction 3 (2.2–2.5 mm), 19.3%; and fraction 4 (<2.2 mm), 7.5% (Table 3). For Activus, fraction 1 dominated, accounting for nearly 60% of the material, while fraction 2 represented approximately 25%, and the smallest proportion consisted of the finest grains. In contrast, for Chevignon, fraction 2 accounted for the highest proportion (about 33%), followed by fraction 1, and the smallest proportion was again made up of fine grains. Activus had a higher bulk density than Chevignon and a higher share of grains in fraction 1. No significant differences were observed between cultivars in fraction 2; only a trend was observed. Chevignon had higher proportions of grains in fractions 3 and 4 than Activus. No significant differences were observed among N fertilisation strategies, with the exception of fraction 4. The highest proportion was recorded under the most intensive fertilisation strategy.
Table 3.
Effects of cultivar and nitrogen fertilisation on bulk density and grain size distribution of winter wheat (n = 24).
Statistically significant negative correlations were observed between fraction 1 and the other wheat grain size fractions. Positive correlations were observed between fractions 2 and 4, as well as between fractions 3 and 4 (Table 4). These correlations describe associations among fraction proportions across the 24 plot samples pooled across both cultivars.
Table 4.
Correlation analysis of winter wheat grain size fractions (n = 24).
The mean colour values for both cultivars and the three fertilisation levels were as follows: L*, 62.01; a*, 7.47; b*, 18.30; Munsell hue YR, 8.42; Munsell value, 6.08; and Munsell chroma, 3.20 (Table 5). Significant differences between cultivars were observed in a*, b*, Munsell hue, and Munsell chroma. For N fertilisation strategy, a*, b*, and Munsell chroma decreased with increasing strategy intensity.
Table 5.
Effects of cultivar and nitrogen fertilisation on colour identification of winter wheat grains according to the Munsell scale (n = 24).
The a*, b*, and Munsell chroma values were highest under N40 and lowest under N170 (with N100 showing an intermediate value). Munsell hue was highest under N170 and lowest under N40 (with N100 showing an intermediate value), but the differences among strategies were not statistically significant.
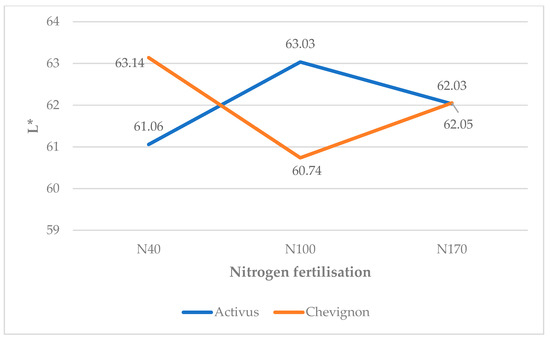
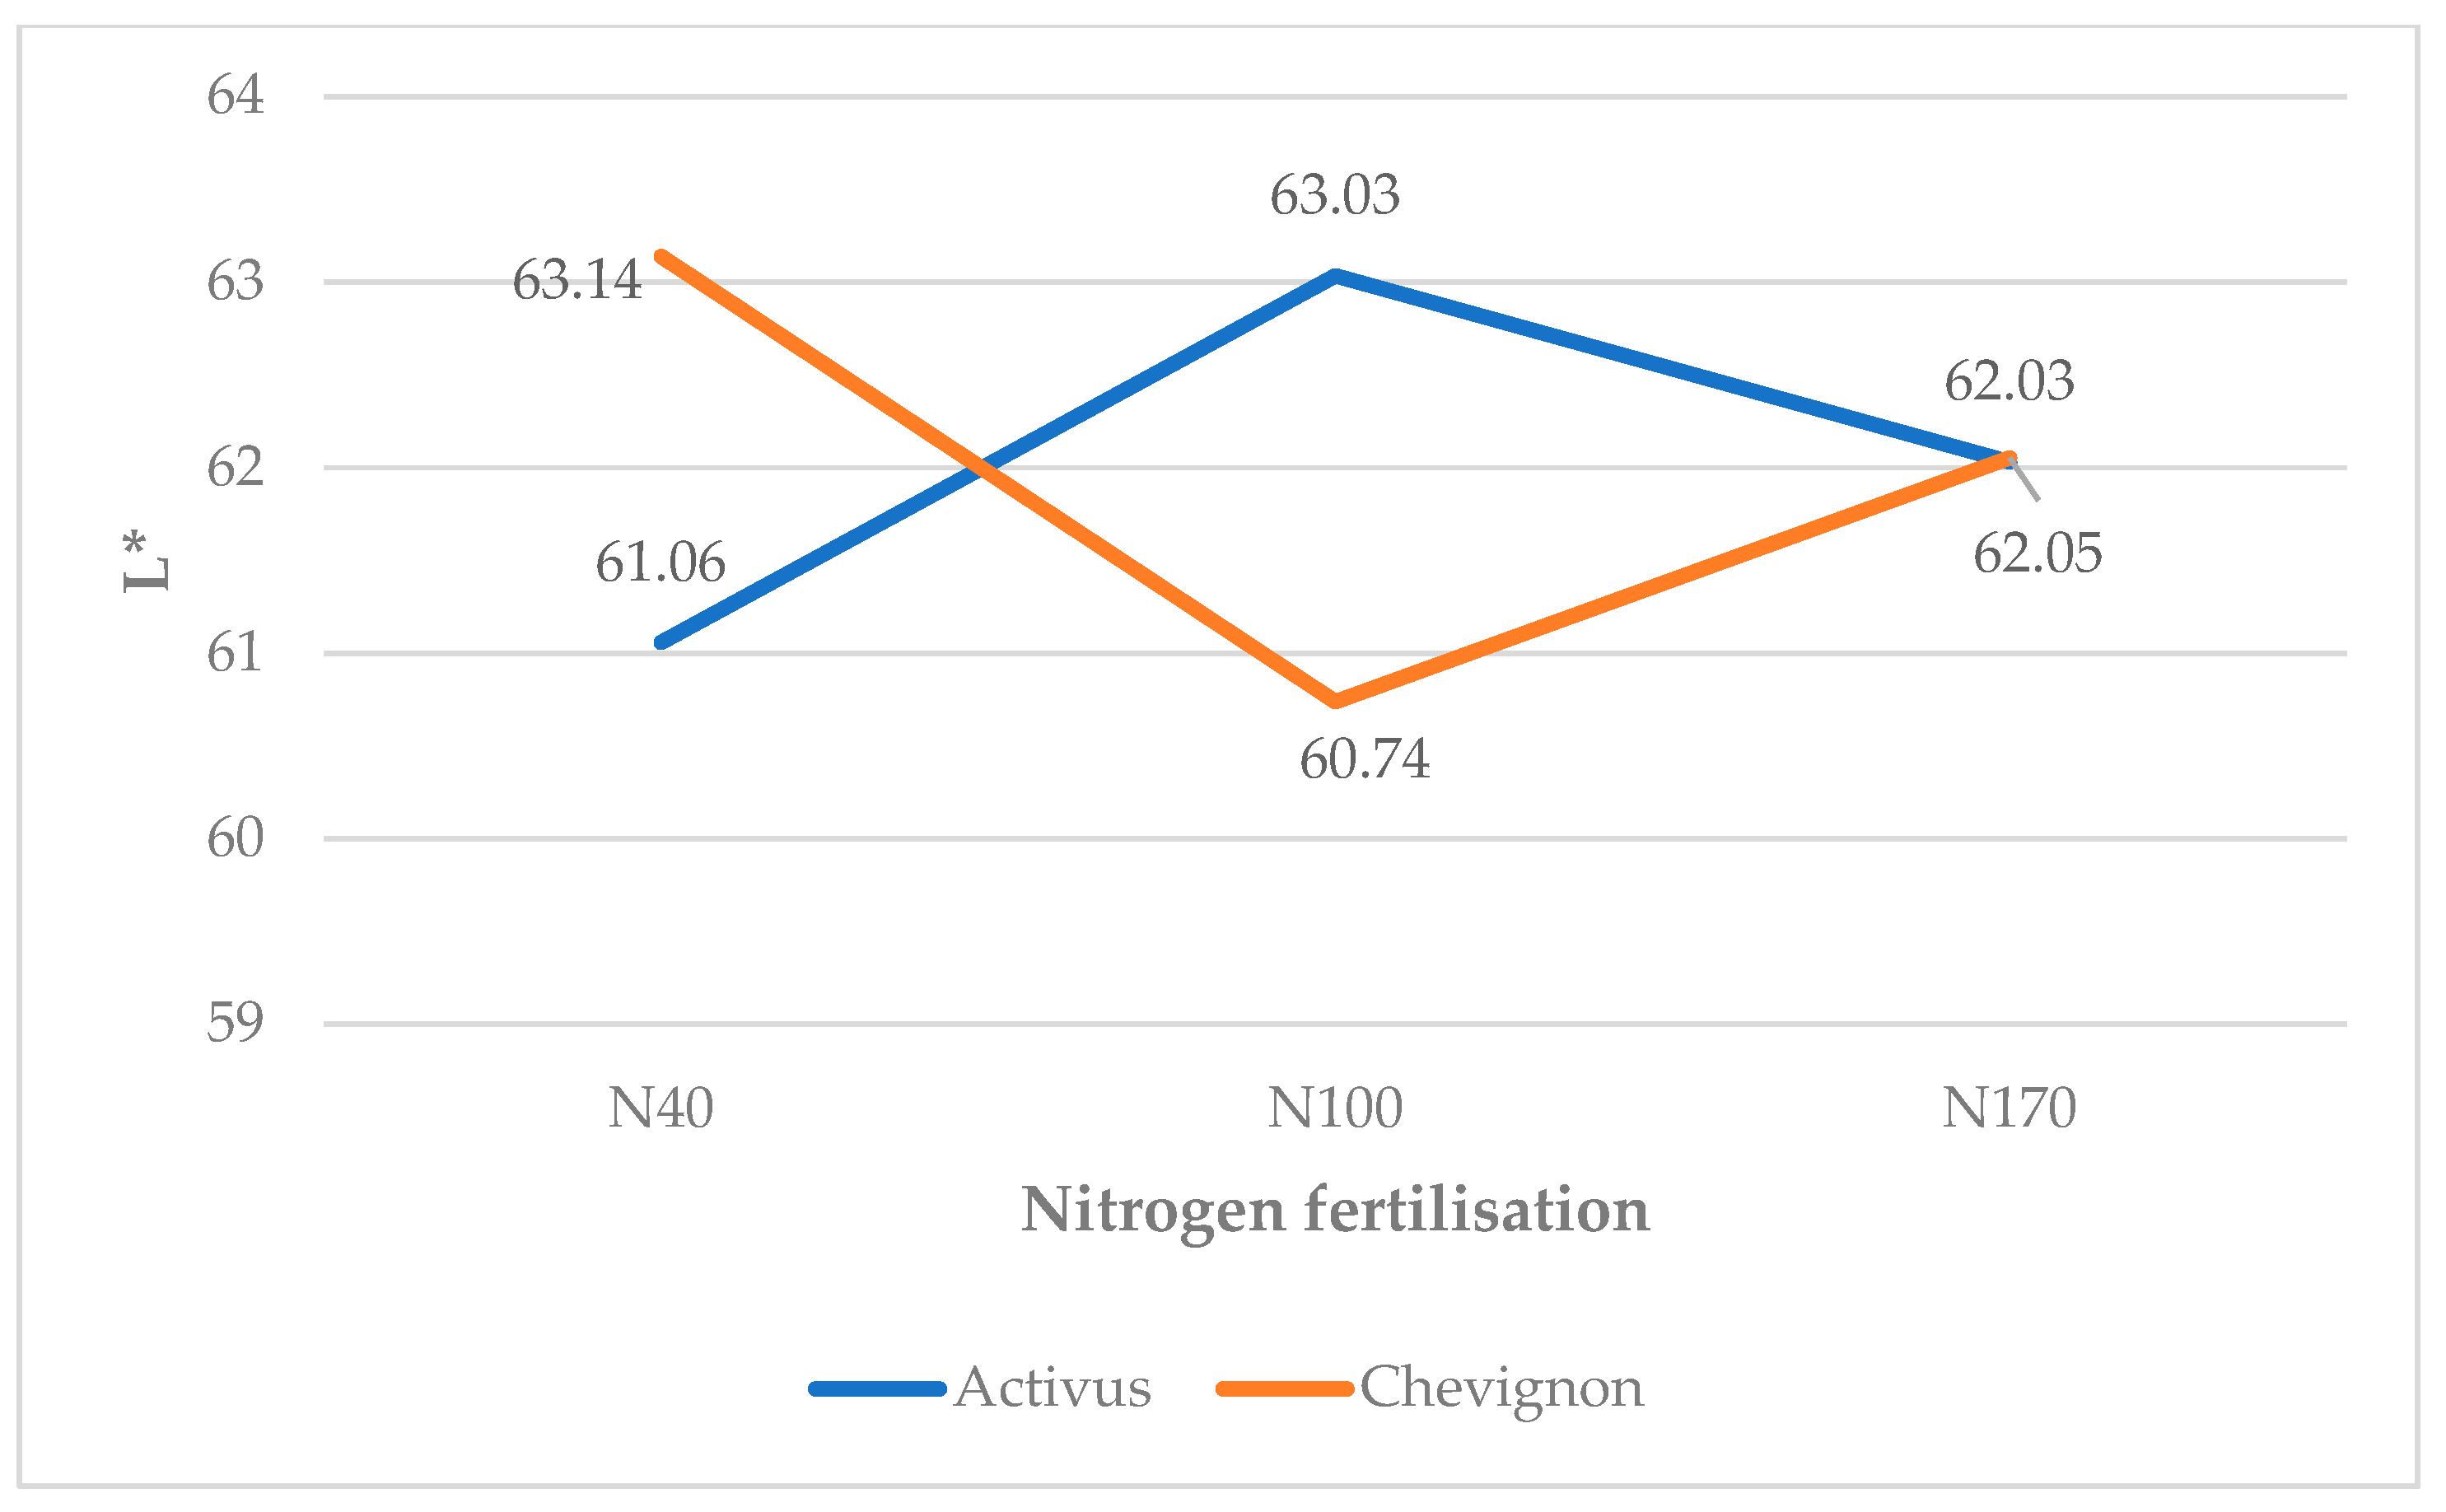
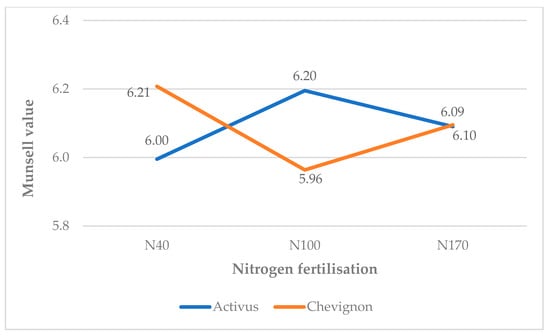
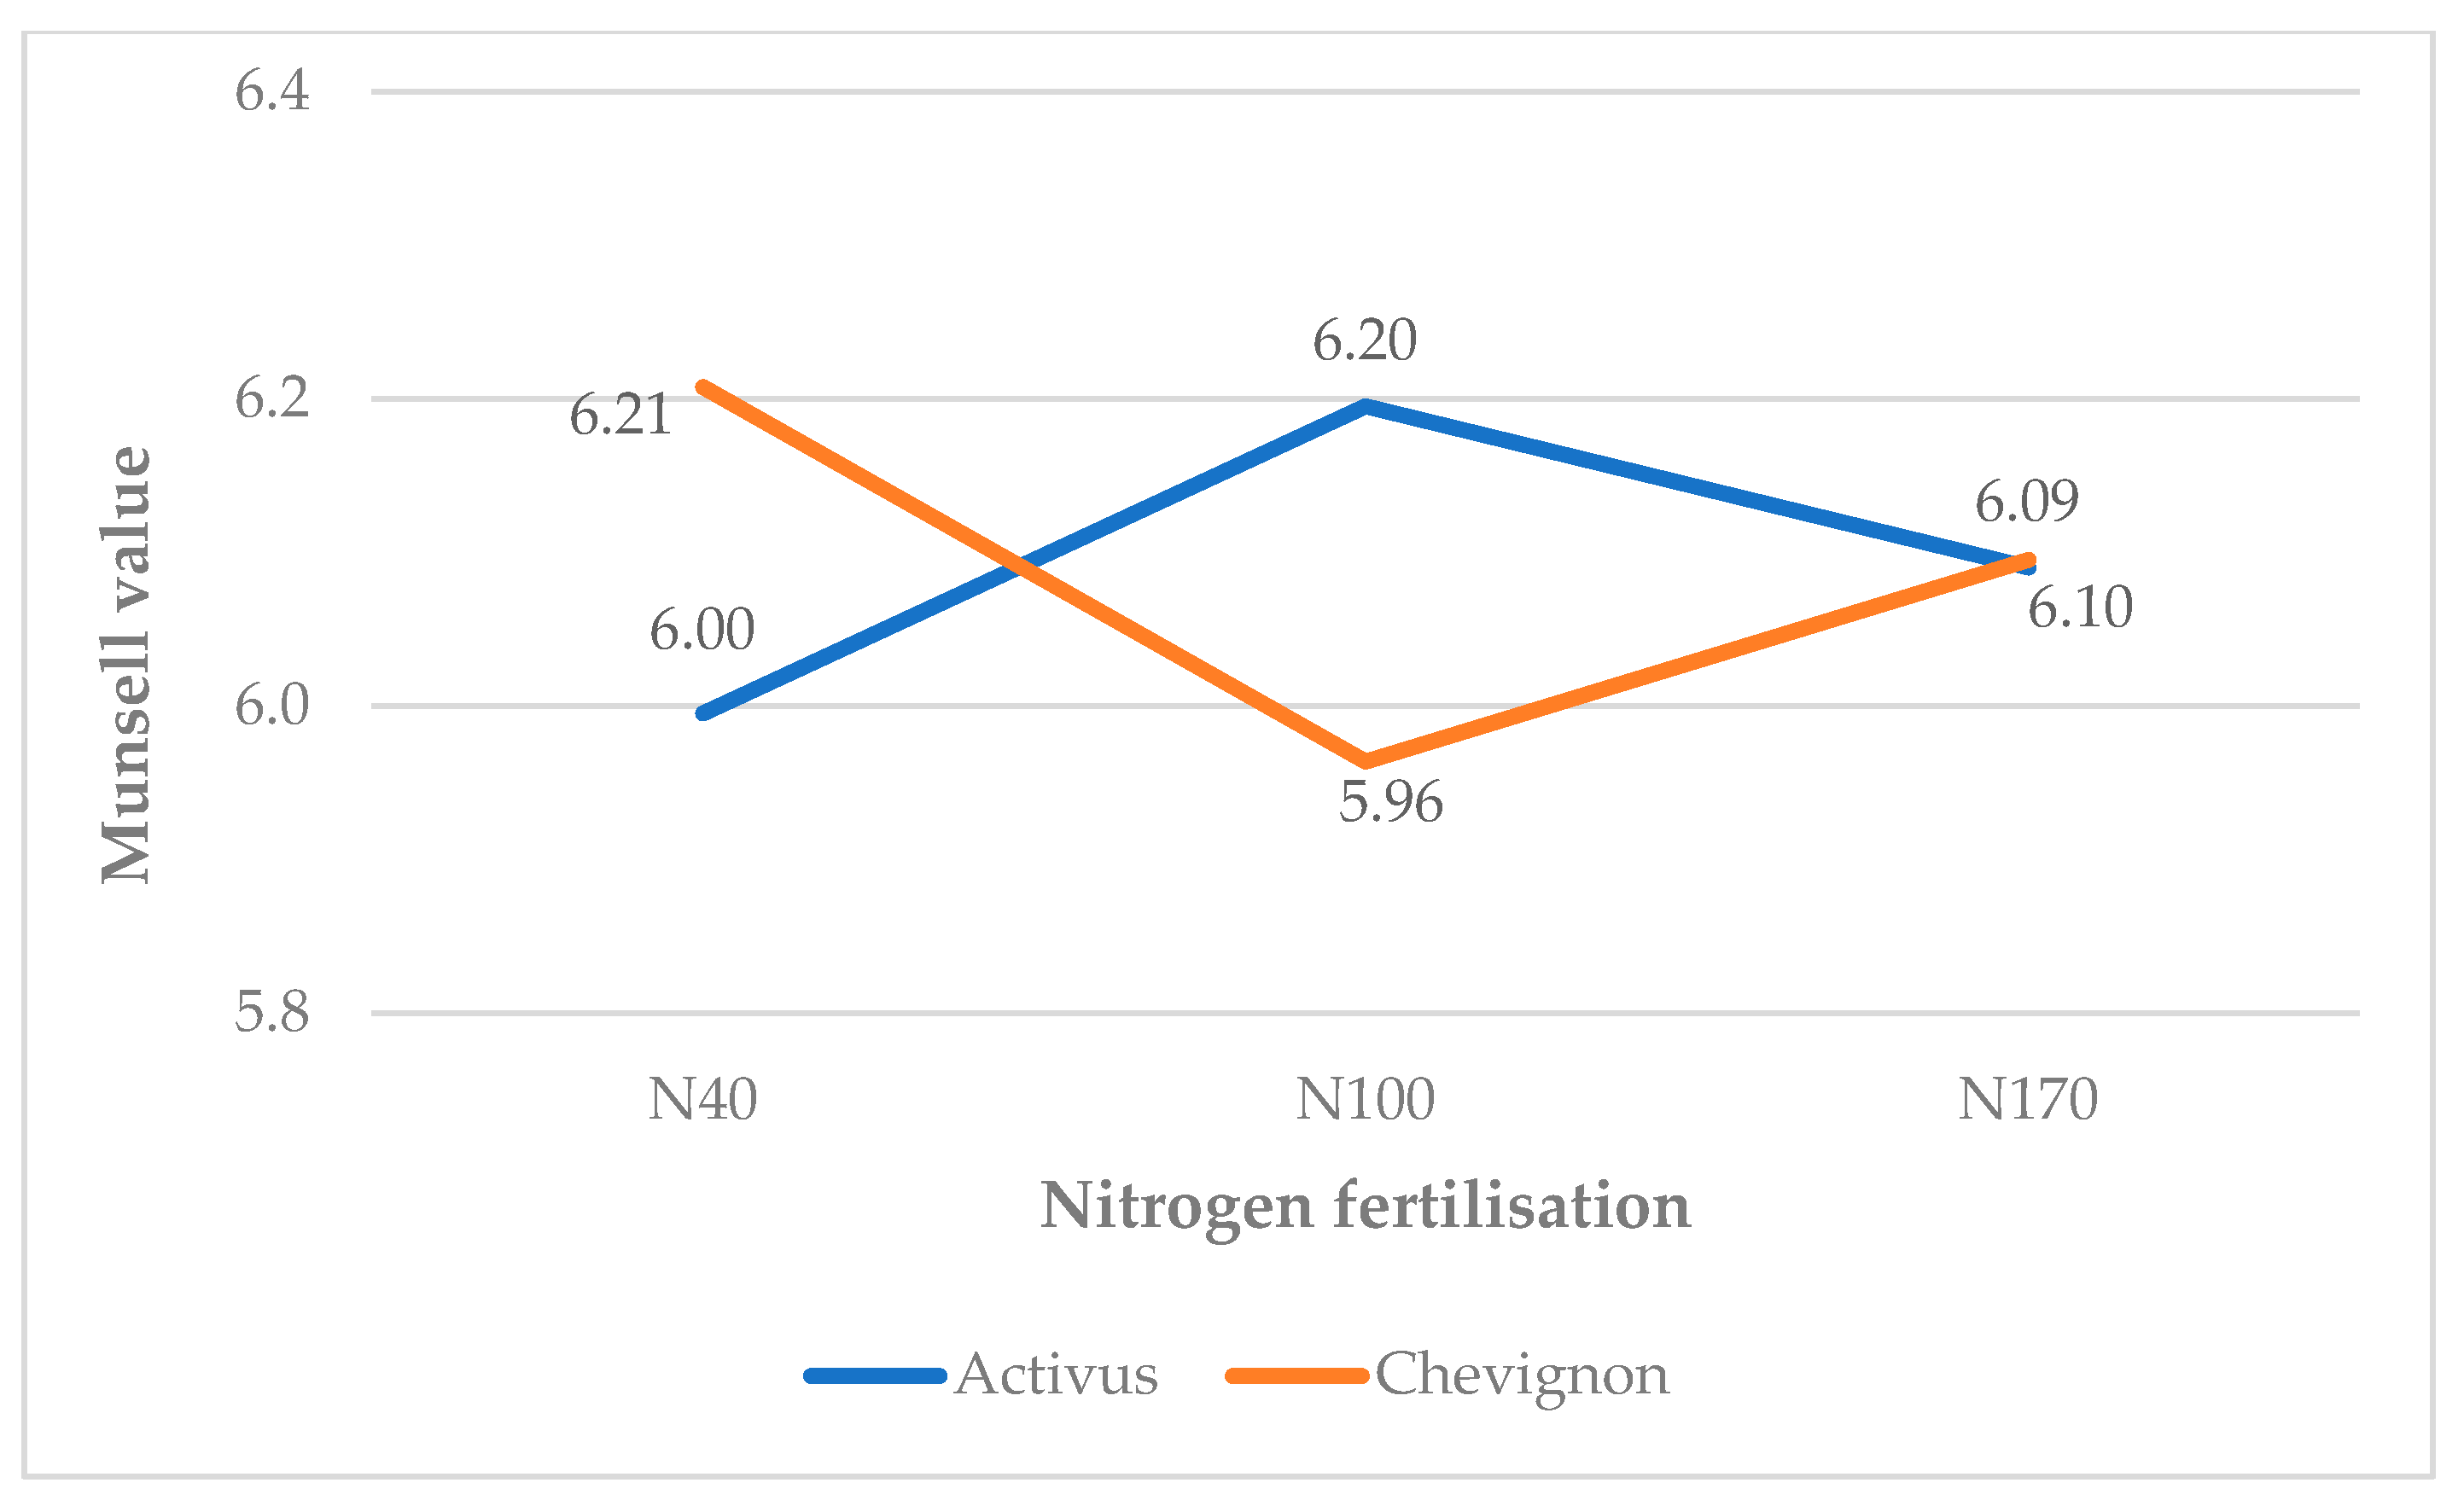
Although neither cultivar nor nitrogen fertilisation strategy significantly affected mean L* or Munsell value, significant cultivar × nitrogen fertilisation strategy interactions were detected for both variables (Table 5). The interaction plots show that the response of grain L* or Munsell value to N management depended on cultivar (Figure 1 and Figure 2). Chevignon had numerically lighter grain under N40, whereas Activus had numerically lighter grain under N100 (Figure 1). Under N170, the two cultivars had nearly identical L* values. Munsell value showed a similar pattern: Activus had its lowest mean under N40 and its highest under N100, whereas Chevignon showed the opposite response (Figure 2). The cultivar means converged under N170.
Figure 1.
Cultivar × nitrogen fertilisation strategy interaction for grain lightness (L*). The interaction was significant (p < 0.001; Table 5).
Figure 2.
Cultivar × nitrogen fertilisation strategy interaction for Munsell value. The interaction was significant (p < 0.001; Table 5).
The mean values of the geometric characteristics for both cultivars and the three fertilisation levels were as follows: SGW, 38.48 mg; L, 6.08 mm; W, 2.73 mm; T, 3.19 mm; Da, 3.99 mm; Dg, 3.72 mm; Dp, 3.74 mm; Ra, 52.16%; Fz, 56.6 mm2; ϕ, 61.6%; Kw, 0.446; Vg, 28.5 mm3; and FFD, 2.27 (mg (mm2)−1) (Table 6). Activus had higher values than Chevignon for L, Dg, Dp, Fz, and Vg. No significant differences between cultivars were detected for SGW, W, T, Da, Ra, ϕ, Kw, and FFD. N fertilisation strategy had no statistically significant effect on the geometric parameters. The numerical values of L, W, T, Da, Dg, Dp, Ra, Fz, ϕ, and Vg followed the order N40 > N100 > N170, but the differences among strategies were not statistically significant.
Table 6.
Effects of cultivar and nitrogen fertilisation on the geometric characteristics of wheat grains (n = 24).
Significant positive correlations were observed between seed surface area (Fz) and grain volume (Vg) (r = 0.95), single-grain weight (SGW) and FFD (r = 0.94), sphericity (ϕ) and grain volume (Vg) (r = 0.67) (Table 7). The remaining correlations were weak to moderate and were not statistically significant.
Table 7.
Correlation analysis of selected geometric indices of winter wheat (n = 24).
3.2. Effect of Cultivar and Nitrogen Fertilisation on Protein Content
Table 8 presents the effects of cultivar, N fertilisation strategy, and their interaction on grain chemical composition. Chevignon had a higher DM content than Activus. No significant differences were found in the DM content in relation to the N fertilisation strategy. Chevignon also had a higher CP content than the Activus. CP content was significantly higher under N170 than under either of the two lower N strategies (N40 or N100). Neither cultivar nor N fertilisation strategy significantly affected grain P or Mg concentrations, and the cultivar × N fertilisation strategy interaction was also not significant for either element.
Table 8.
Chemical composition of cereal wheat grain (%) (n = 24).
No significant correlations were observed between the contents of the analysed nutrients in Chevignon (Table 9). The correlation analysis revealed one significant negative correlation between DM and CP in Activus (Table 10). No significant relationships were observed between DM and P or Mg, or between CP and P or Mg.
Table 9.
Analysis of correlations between nutrient concentrations in Chevignon (n = 12).
Table 10.
Analysis of correlations between nutrient concentrations in Activus (n = 12).
Table 11 presents multiple linear regression models in which each chemical composition variable was treated in turn as the dependent variable, with the remaining three variables included as predictors. The overall models for DM, CP, and P concentrations were statistically significant, with p = 0.047 and R2 = 0.32 for DM, p = 0.003 and R2 = 0.49 for CP, and p = 0.049 and R2 = 0.32 for P. These models accounted for 32%, 49%, and 32% of the observed variation in DM, CP, and P concentrations, respectively. The overall model for Mg concentration was not statistically significant. The reported p-values refer to the overall model tests and do not establish the statistical significance of individual predictors.
Table 11.
Multiple linear regression equations between variables measured in the experiment (n = 24).
Table 12 presents the proportion of variance explained by the three principal components obtained using the NIPALS algorithm, together with their cross-validation results. PC1, obtained after seven iterations, explained 38.2% of the total variance and had a positive Q2 value of 0.218. PC2, obtained after 35 iterations, explained a further 20.9% of the variance but had a negative Q2 value (−0.100), indicating poor predictive performance under the applied cross-validation procedure. This negative value does not establish that the variance represented by PC2 consists solely of noise. PC3, obtained after five iterations, explained an additional 20.3% of the variance and had a positive Q2 value of 0.284. Together, the three components explained 79.4% of the total variance. Although PC1 and PC3 had positive Q2 values, these results do not justify excluding PC2 and treating PC1 and PC3 as a separately validated two-component model. The PCA results should therefore be interpreted primarily as a descriptive summary of variation in the analysed dataset.
Table 12.
PCA model of explained variance using the NIPALS algorithm (n = 24).
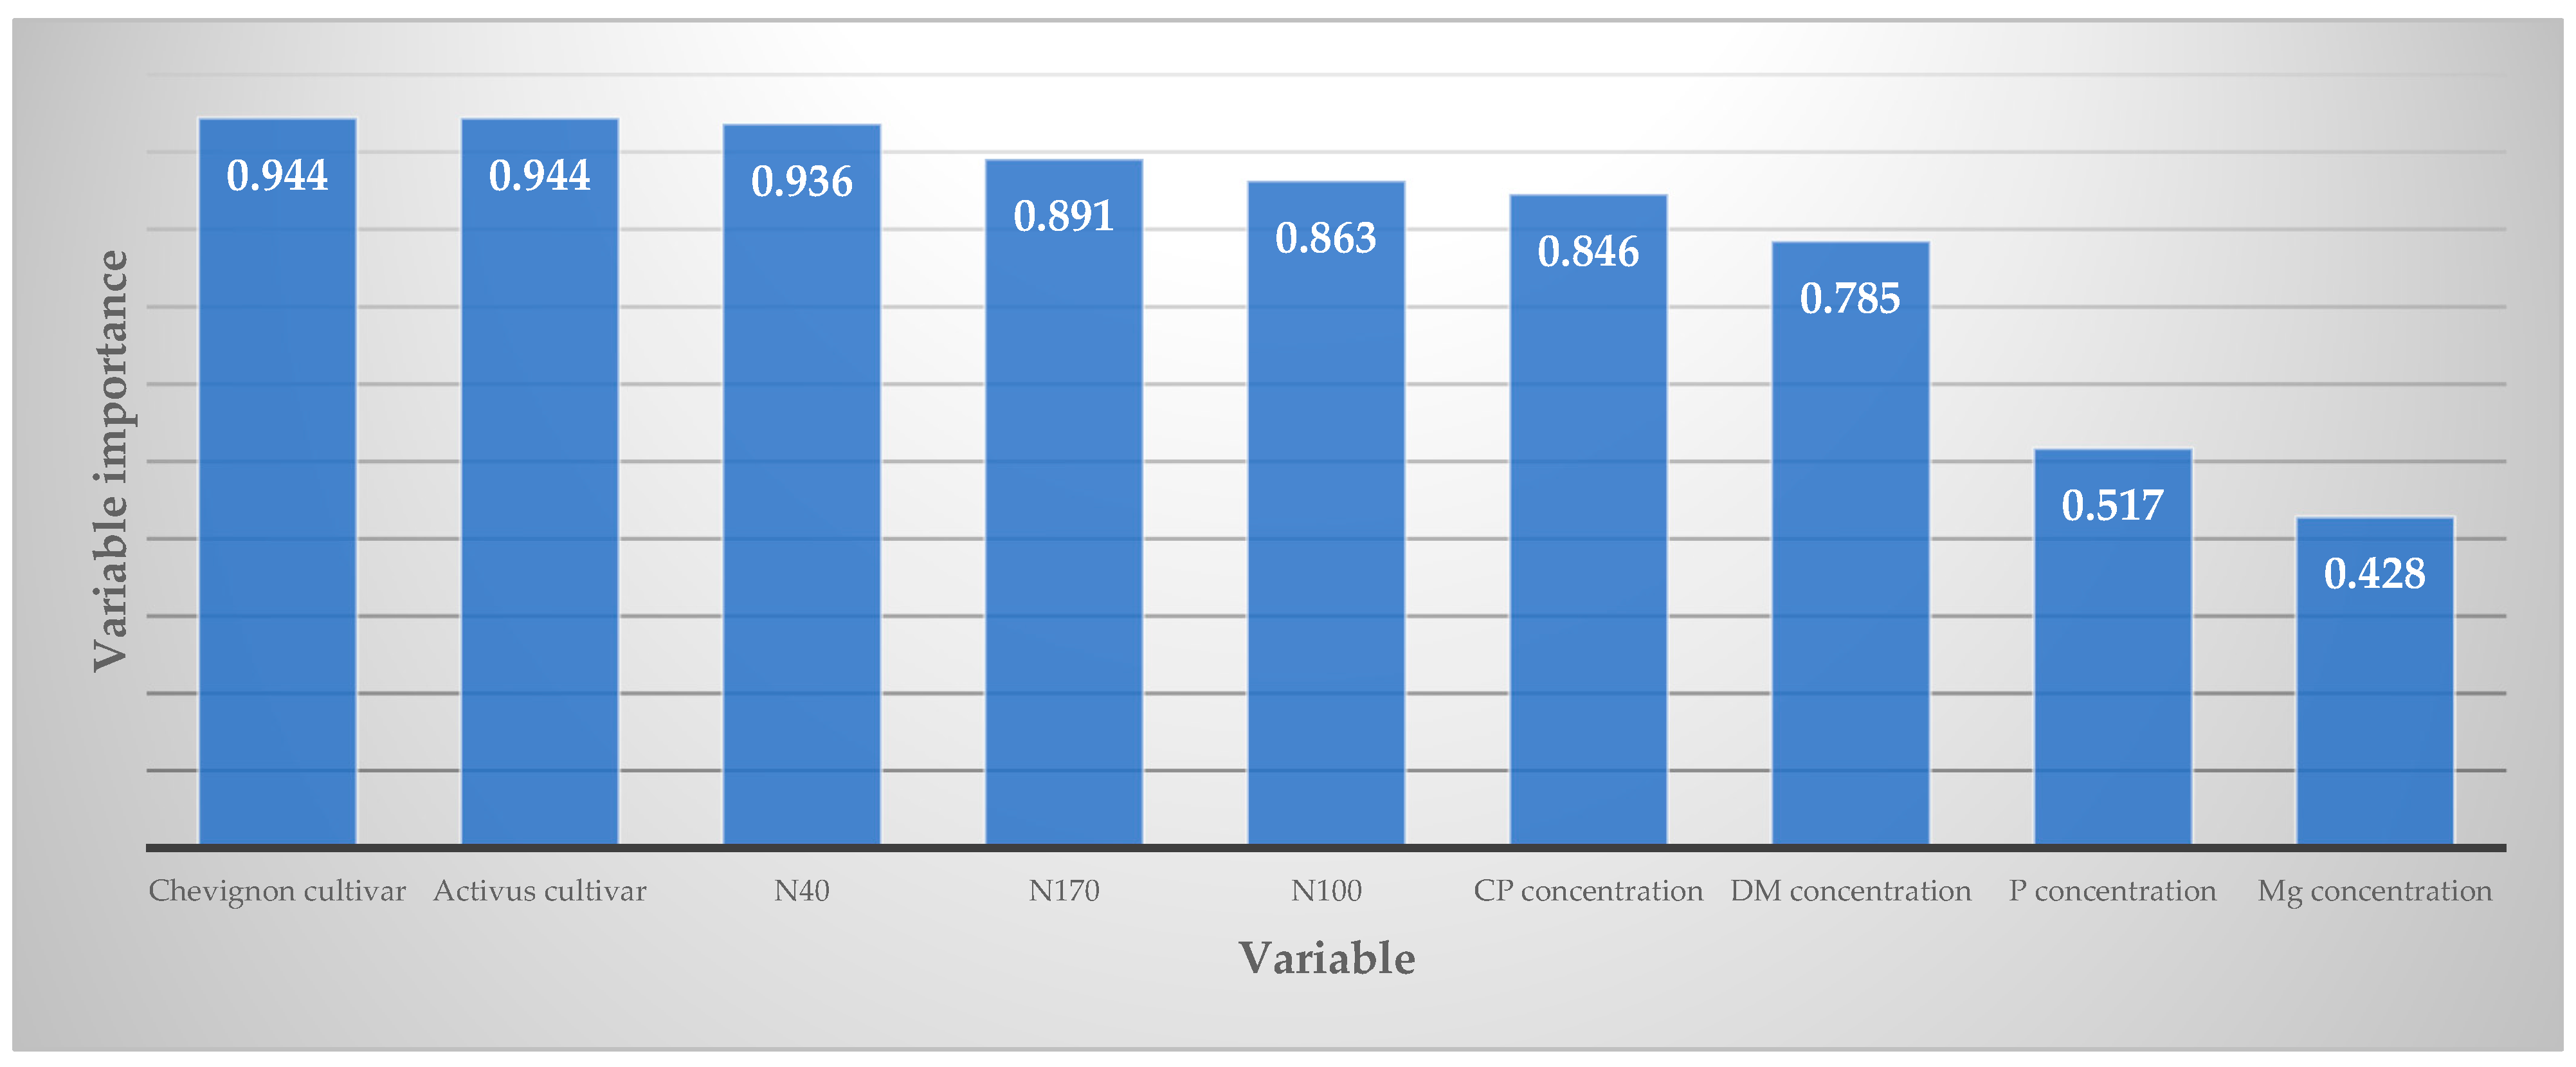
Figure 3 illustrates the importance of the individual variables considered in the PCA. Three groups of variables can be distinguished within the overall construct. The model presented in Table 12 is most strongly influenced by wheat cultivar (0.944) and the N40 strategy (0.936). High influence is also observed for the N100 and N170 strategies (0.863 and 0.891, respectively), as well as grain CP content (0.846). Grain DM content has a lesser impact on the result (0.785), while the lowest influence was found for grain P and Mg contents (0.517 and 0.428, respectively).
Figure 3.
Importance of individual independent and dependent variables in the PCA.
4. Discussion
The effects of cultivar and N fertilisation strategy on the grain yield and grain geometry of winter wheat were assessed in this study. Neither factor significantly affected grain yield or yield components; however, cultivar-related variation was observed in the number of grains per ear and grain size distribution. In contrast, a higher number of grain colour parameters differed between N fertilisation levels than between cultivars, whereas the geometric characteristics of wheat grain showed higher variability between cultivars than between N strategies. The observed differences in grain geometric characteristics between cultivars are consistent with previous findings, indicating that these traits are primarily genotype-dependent and less responsive to N fertilisation [3,6,8,11].
In the present study, Chevignon had a significantly higher CP content than Activus, confirming that grain protein concentration is partly genotype-dependent. Genotypic differences in wheat grain protein concentration have also been reported in recent studies, which emphasise the importance of genotype × management × environment interactions in determining grain quality. Ghimire et al. [37] demonstrated that grain protein concentration in winter wheat depended on N management and varied between cultivars and environmental conditions, highlighting the importance of considering cultivar × management interactions when interpreting grain protein responses.
Nitrogen plays an important role in wheat grain quality because its availability affects protein accumulation and grain technological properties. Adequate N supply is therefore important for obtaining both high grain yield and good grain quality, including protein content, which determines its suitability for particular technological applications [38]. Nitrogen management significantly affected CP concentration in the present study, with a higher value under N170 than under N40 and N100. The significantly higher CP concentration under N170 than under N40 and N100 should be interpreted as a response to the complete N fertilisation strategy. N170 combined a higher total N rate with applications at tillering, stem elongation, and heading, whereas N40 supplied N only at tillering and N100 supplied N at tillering and stem elongation. Because total N rate and application schedule varied together, the present design cannot separate their individual contributions to the observed differences in CP concentration. This finding agrees with the general response reported for wheat, where increased N availability commonly promotes N assimilation and accumulation of storage proteins in the developing grain. Wang et al. [39] showed that N application increased wheat grain protein concentration by approximately 6.6% on average, with stronger responses observed under higher N inputs, multiple applications, and later-season N supply. Similarly, Giordano et al. [40] focused specifically on late-season N application and demonstrated that later N supply increased grain protein concentration by approximately 4% while having little overall effect on grain yield. These observations are consistent with the present results, in which the most intensive N fertilisation strategy, including a later application at heading, was associated with the highest CP concentration. Kunkulberga et al. [38] reported that increasing N fertiliser rates significantly improved the technological properties of grain in two winter wheat cultivars and increased protein content. A similar relationship was observed in our study, where CP concentration was higher under N170 than under N40 and N100, whereas no significant difference was detected between N40 and N100. The authors also found that the Bussard cultivar had a higher CP content than the Zentos cultivar, which confirms the importance of cultivar characteristics in determining grain quality. Similarly, in our study, Chevignon had a higher CP content, indicating the influence of genotype on this trait. In a study by Zhang et al. [41], increasing N fertiliser rates significantly increased grain yield, protein content, and the total content of amino acids, including essential and non-essential amino acids. At the same time, the authors observed lower EAAI and PDCAAS values with increasing N rates, indicating that a higher protein content does not necessarily mean better nutritional quality of the protein. These results show that N fertilisation strategy plays an important role in increasing grain protein content, while its effect on protein quality may be more complex. Liu et al. [42], however, showed that reducing the N rate by half significantly decreased the protein content in the grain of two wheat cultivars, while the starch content increased. The authors also observed changes in the expression of grain proteins in response to N availability, indicating that N supply affects not only the amount of protein in the grain but also its composition and metabolism.
Similar responses have been reported under Polish growing conditions. Lachutta and Jankowski [43] found that the distribution of N between successive growth stages significantly affected grain technological quality and protein concentration in winter wheat, with the highest protein content observed under a specific split-N regime. Recent field studies have likewise confirmed that increasing N supply can increase grain protein concentration without necessarily producing a proportional increase in grain yield [44]. This may help to explain why, in the present study, CP responded significantly to N management whereas grain yield did not.
In contrast to CP, neither P nor Mg concentration was significantly affected by cultivar or N fertilisation strategy in the present study. Mineral concentrations in wheat grain are known to be controlled by complex interactions among genotype, soil nutrient availability, environmental conditions, and nutrient remobilisation during grain filling. Caldelas et al. [45] reported that genotype was the main determinant of several grain minerals, including Mg, whereas N fertilisation had only a limited effect on grain mineral composition. Other studies have likewise shown considerable genotypic variation in wheat grain mineral composition and have suggested that environmental and management effects may differ substantially among individual elements. Moreover, Caldelas et al. [45] reported relationships between grain shape and mineral concentration and observed negative associations between thousand-grain weight and several mineral elements.
The positive correlation between CP and P concentration in both cultivars suggests a partial association between grain N and P accumulation during grain filling. Nitrogen and P metabolism are physiologically interconnected because P is required for energy metabolism, phosphorylation processes, nucleic acid synthesis, and the formation of compounds involved in N assimilation. However, the moderate strength of the relationship indicates that the two traits were only partly coordinated. Recent studies of wheat grain mineral composition have shown that correlations among macronutrients are common but are not uniform across genotypes or environments [46].
Multivariate analyses such as PCA are useful for integrating grain physical and chemical characteristics and identifying groups of traits that respond similarly to cultivar or fertilisation. Recent wheat studies have used PCA to separate quality traits associated with protein, gluten, mineral composition, and fertilisation response, demonstrating that multivariate patterns may reveal relationships that are not apparent from univariate analyses alone [47].
Several studies have investigated the influence of N fertilisers on plant growth and grain physical properties [48,49,50,51]. The form in which N is applied has a considerable impact on its uptake, assimilation, and utilisation by crops, thereby affecting physiological processes and plant traits, which ultimately translate into differences in grain yield and quality [8]. Grain yield improvements are largely dependent on the availability of mineral fertilisers, particularly N, which is considered the most yield-limiting nutrient in cereal production systems [3,39,52].
N supplementation is generally associated with delayed leaf senescence and enhanced photosynthetic activity, which, together, promote higher accumulation of aboveground biomass [53,54]. Moitzi et al. [55] demonstrated that different N fertilisers applied at a rate of 160 kg N ha−1 under various splitting regimes in the Pannonian climate region of eastern Austria increased grain yield by approximately 25% and doubled grain N concentration compared to the unfertilised control. It should be noted, however, that, in the present study, the N fertilisation strategies differed not only in total N input but also in the timing and number of split applications. The higher fertilisation levels included additional N applications at successive stages of plant development, reflecting common agronomic practice in winter wheat cultivation, where larger N inputs are typically split to better synchronise N availability with crop demand. Consequently, the effects observed among the N40, N100, and N170 strategies cannot be attributed exclusively to differences in the total N rate and should be interpreted as responses to contrasting N fertilisation strategies combining both N supply and its temporal distribution. The N40 strategy represented the lowest fertilised treatment and a low-input N management strategy. Given that the initial soil mineral N content was 68 kg N ha−1, the contribution of soil-derived N to plant nutrition cannot be separated from the response to fertiliser N. Therefore, the present results allow a comparison among fertilised N management strategies, but do not permit a full assessment of the crop response to N addition relative to an unfertilised condition. In our study, no significant differences in grain yield were observed among N fertilisation strategies, although a tendency towards higher yields under the more intensive N fertilisation strategies was noted.
Wheat grain yield generally increases with N fertilisation up to an agronomic optimum, beyond which further N application may not improve yield and can negatively affect grain quality and plant stability [5,6,8]. Excessive N can reduce TGW and increase lodging risk [8,56]. For grain physical traits, TGW and grain dimensions may increase under low-to-moderate N supply but tend to decline at excessive N rates, with strong modulation by environmental conditions [6,57]. However, the response of TGW to N fertilisation is not always consistent, as some studies report significant increases, while others show no clear effect depending on cultivar and growing conditions [5,9]. In our study, N fertilisation did not significantly affect TGW, which is in agreement with previous reports demonstrating limited or no response of this parameter to increasing N supply under certain environmental and varietal conditions [52,58,59]. However, a more intensive N strategy was associated with a tendency towards lower grain L, W, and T, suggesting that excessive N availability may modify grain shape and dimensional traits independently of overall grain weight, possibly due to nitrogen-induced modifications in grain filling processes affecting grain morphology rather than total grain mass [8,59].
Bulk density is a crucial physical property of stored grain, especially during drying and aeration, because it directly influences airflow resistance within the stored grain mass. This parameter may change over time due to internal stress and structural rearrangements within the silo. A higher grain bulk density is commonly associated with optimal physiological maturity and the formation of a more compact vitreous endosperm, both of which contribute to improved technological and end-use quality of wheat grain [2]. Fertilisation practices, particularly N application, have been shown to affect grain bulk density and related technological quality traits in winter wheat. Increased N rates may contribute to a higher bulk density through improved kernel filling and increased vitreousness of the endosperm [43,60]. Vitreous (glassy) kernels are characterised by a higher density than mealy kernels because of their compact endosperm structure, which is associated with superior processing and end-use quality [2]. In our study, bulk density differed between the cultivars, whereas fertilisation and the interaction between factors did not significantly affect this parameter.
The most significant factors influencing wheat grain diameter are cultivar and environmental conditions. Warechowska et al. [61] reported that the cultivar Parabola was characterised by a higher grain weight and a larger grain diameter than the cultivar Radunia. In our study, W and T were not affected by N fertilisation strategy, with the lowest N doses associated only with a tendency towards wider and thicker grains. We assume that this response may have been related to grain yield, which tended to increase, although the increase was not significant, with higher N doses, thereby contributing to reduced grain size. As neither the number of grains per ear nor the TGW was affected by N fertilisation, the tendency toward a higher grain yield at higher N rates was most likely associated with increased ear density and grain density, although these parameters were not determined in the present study. Neugschwandtner et al. [62] reported that ear density is one of the major yield components contributing to wheat grain yield. Increased competition resulting from higher ear and grain densities may therefore have contributed to the lower W and T values observed at higher N fertilisation levels. Similarly, Koppensteiner et al. [6] reported a higher TGW at low N fertilisation rates under conditions of lower grain yield and grain density, whereas higher N fertilisation rates increased grain yield and grain density, thereby reducing TGW. In the present study, no statistically significant differences in grain W and T were detected between the two cultivars. Previous studies have shown that increasing N fertilisation intensity may lead to slight reductions in grain plumpness [8,59,63].
Geometric grain traits affect grain weight, which is a critical determinant of grain yield [64]. The lack of correlations between grain yield and the geometric dimensions of individual grains observed in our study may have resulted from the relatively small variation in grain yield among N fertilisation strategies, which also led to limited variation in grain geometric traits. These differences in fraction distribution imply that Activus tends to produce coarser, more uniform, and denser grains, which may improve milling performance and overall grain quality. In contrast, Chevignon, characterised by a higher proportion of grains in smaller size classes, may exhibit higher variability during processing and potentially lower milling efficiency. N fertilisation strategy did not significantly affect bulk density or the proportions of grain size fractions 1–3, but it significantly affected the proportion of fraction 4 (<2.2 mm). For fraction 4, N170 differed significantly from both N40 and N100, whereas no significant difference was detected between N40 and N100.
Grain colour, as one of the physical properties of cereal grains, is generally considered a varietal characteristic largely determined by genetic factors. However, environmental and nutritional conditions, particularly inadequate or imbalanced nutrient supply, may lead to variations in grain colour and size that deviate from those typically observed in a given cultivar. Such variability reflects the interaction between genotype and environmental conditions rather than purely genetic determination [65]. Wheat cultivars with naturally coloured grains can serve as valuable sources of anthocyanins and carotenoids, which are particularly useful in the production of bakery products, especially those based on wholegrain flour [66].
Winter wheat has been shown to exhibit variation in grain morphology, texture, and colour-related traits depending on the cultivation regime and growing location [67]. In our study, the colour parameters a* and b* were influenced by the N fertilisation strategy, with both values decreasing from N40 to N170. Munsell chroma showed a similar pattern, whereas Munsell hue increased across the same fertilisation strategies. Lightness (L*) was not significantly affected by either cultivar or N fertilisation strategy. Both a* (redness) and b* (yellowness) were significantly affected by cultivar and N fertilisation strategy. Overall, grain surface colour measurements indicated that selected colour traits were responsive to N management, although individual parameters showed different response patterns. The positive a* values recorded in the present study indicate a predominance of red colouration in the grain samples. Although no significant main effects were observed for L*, a significant cultivar × N fertilisation strategy interaction was detected, indicating that the response of lightness to N management depended on cultivar. Similarly, the Munsell value was not significantly affected by either main factor, but a significant cultivar × N fertilisation strategy interaction was observed.
5. Conclusions
The two winter wheat cultivars examined differed clearly in selected geometric grain traits, whereas differences in grain colour were relatively limited. Nitrogen fertilisation strategy had no significant effect on grain yield or any of the analysed geometric grain characteristics. However, selected grain colour parameters responded to N fertilisation strategy, indicating that grain appearance can change even when no significant yield response is detected. This suggests that colour measurements may provide additional information when characterising grain responses to fertilisation. Their relevance to processing quality or commercial grading requires further investigation, as these outcomes were not assessed in this study.
Clear cultivar-related differences were also observed in grain size distribution and bulk density. Activus had the highest proportion of grains in the largest size fraction (>2.8 mm) and a higher bulk density than Chevignon, whereas Chevignon had a higher proportion of smaller grain fractions. These differences suggest that cultivar choice may be relevant when selecting grain with a specific size distribution or bulk density. They may also inform the assessment of grain suitability for size-based sorting, although milling performance and processing quality were not evaluated in this study. Geometric traits, including grain length, were consistently higher in Activus, which was reflected in the higher values of the derived geometric indices (Dg, Dp, Fz, and Vg). The N fertilisation strategy did not result in differences in grain length, width, or thickness. Increasing the intensity of the N fertilisation strategy also resulted in a significant increase in CP content in the grain, with a higher CP content observed under the N170 strategy than under the N40 and N100 strategies.
From a breeding perspective, the pronounced cultivar-related differences in grain geometric traits, grain size distribution, and bulk density could indicate that these characteristics may be useful criteria for differentiating winter wheat cultivars and selecting genotypes with specific grain quality attributes. The observed variation between Activus and Chevignon also highlights the importance of cultivar-specific characteristics when developing wheat genotypes with specific physical grain properties.
Further research should focus on determining whether larger grain fractions are associated with differences in protein content and protein composition. Multi-year and multi-location experiments should also be conducted to examine how different forms and rates of N fertilisation affect protein accumulation in the largest grain fractions. Particular attention should be given to the relationship between grain size, N supply, and the distribution of protein within individual grain fractions, which may provide a better understanding of the factors determining the nutritional and technological value of wheat grain.
Author Contributions
Conceptualisation, A.S.-T.; methodology, A.S.-T. and A.J.-R.; investigation, A.F., W.D. and O.N.; data curation, A.S.-T. and A.J.-R.; funding acquisition, A.S.-T.; project administration, A.S.-T.; formal analysis, T.H.; resources, Z.K.; supervision, A.S.-T. and A.J.-R.; validation, B.F. and B.G.; visualisation, T.H., A.J.-R. and A.L.-S.; writing—original draft, A.S.-T., R.W.N. and A.J.-R.; writing—review and editing, A.S.-T., A.J.-R., T.H., A.F., R.W.N., Z.K., B.F., A.L.-S., W.D., O.N. and B.G. All authors have read and agreed to the published version of the manuscript.
Funding
The APC/BPC is financed by Wroclaw University of Environmental and Life Sciences. The study was co-financed by the Polish National Agency for Academic Exchange (project BPN/BAT/2025/1/00006/U/00001) and Austria’s Agency for Education and Internationalisation (OeAD) (project -PL 08/2026).
Institutional Review Board Statement
Not applicable.
Data Availability Statement
The data supporting the findings of this study are available in the article and its Supplementary Materials. Further inquiries can be directed to the corresponding author.
Acknowledgments
The authors thank Saatbau Linz eGen (Leonding, Austria) for providing the seeds of the winter wheat cultivars Activus and Chevignon used in this study.
Conflicts of Interest
Author Zygmunt Król was employed by the company Saatbau Poland Sp. z o.o. The remaining authors declare that the research was conducted in the absence of any commercial or financial relationships that could be construed as a potential conflict of interes.
References
- Zheng, B.; Jiang, J.; Wang, L.; Huang, M.; Zhou, Q.; Cai, J.; Wang, X.; Dai, T.; Jiang, D. Reducing nitrogen rate and increasing plant density accomplished high yields with satisfied grain quality of soft wheat via modifying the free amino acid supply and storage protein gene expression. J. Agric. Food Chem. 2022, 70, 2146–2159. [Google Scholar] [CrossRef] [Scilit]
- Konopka, I.; Tańska, M.; Konopka, S. Differences of some chemicals and physical properties of winter wheat grain of mealy and vitreous appearance. Cereal Res. Commun. 2015, 43, 470–480. [Google Scholar] [CrossRef] [Scilit]
- Yu, S.Y. The impact of nitrogen fertilization on yield and quality of different wheat varieties. Mol. Soil Biol. 2025, 16, 265–271. [Google Scholar] [CrossRef] [Scilit]
- Zörb, C.; Ludewig, U.; Hawkesford, M.J. Perspective on wheat yield and quality with reduced nitrogen supply. Trends Plant Sci. 2018, 23, 1029–1037. [Google Scholar] [CrossRef] [Scilit]
- Feyisa, D.S.; Jiao, X.; Mojo, D. Wheat yield response to chemical nitrogen fertilizer application in Africa and China: A meta-analysis. J. Soil Sci. Plant Nutr. 2024, 24, 102–114. [Google Scholar] [CrossRef] [Scilit]
- Koppensteiner, L.J.; Kaul, H.-P.; Piepho, H.-P.; Barta, N.; Euteneuer, P.; Bernas, J.; Klimek-Kopyra, A.; Gronauer, A.; Neugschwandtner, R.W. Yield and yield components of facultative wheat are affected by sowing time, nitrogen fertilization and environment. Eur. J. Agron. 2022, 140, 126591. [Google Scholar] [CrossRef] [Scilit]
- Jin, Y.; Chen, H.; Tang, X.; Zhang, L.; Yan, J.; Li, S.; Chen, Y.; Li, X.; Wu, H.; Xiao, X. Combination of nitrogen and organic fertilizers reduce N2O emissions while increasing winter wheat grain yields and quality in China. Front. Environ. Sci. 2024, 12, 1485043. [Google Scholar] [CrossRef] [Scilit]
- Cui, H.; Luo, Y.; Li, C.; Chang, Y.; Jin, M.; Li, Y.; Wang, Z. Effects of nitrogen forms on nitrogen utilization, yield, and quality of two wheat varieties with different gluten characteristics. Eur. J. Agron. 2023, 149, 126919. [Google Scholar] [CrossRef] [Scilit]
- Bai, N.; Mi, X.; Tao, Z.; Kang, J.; He, G.; Wang, Z. China’s nitrogen management of wheat production needs more than high nitrogen use efficiency. Eur. J. Agron. 2022, 139, 126557. [Google Scholar] [CrossRef] [Scilit]
- Kaliniewicz, Z.; Markowska-Mendik, A.; Warechowska, M. An evaluation of selected engineering properties of Polish durum wheat grain. J. Cereal Sci. 2022, 104, 103401. [Google Scholar] [CrossRef] [Scilit]
- Dziki, D. The latest innovations in wheat flour milling: A review. Agric. Eng. 2023, 27, 147–162. [Google Scholar] [CrossRef] [Scilit]
- Fan, Y.; Li, W.; Zhang, L.; Song, J.; Wang, D.; Xue, J.; Wang, Y.; Gao, Z. Wheat nitrogen use and grain protein characteristics under no-tillage: A greater response to drip fertigation compared to intensive tillage. Agronomy 2025, 15, 588. [Google Scholar] [CrossRef] [Scilit]
- Gasparis, S.; Miłoszewski, M.M. Genetic Basis of Grain Size and Weight in Rice, Wheat, and Barley. Int. J. Mol. Sci. 2023, 24, 16921. [Google Scholar] [CrossRef] [Scilit]
- Ahmar, S.; Gill, R.A.; Jung, K.-H.; Faheem, A.; Qasim, M.U.; Mubeen, M.; Zhou, W. Conventional and molecular techniques from simple breeding to speed breeding in crop plants: Recent advances and future outlook. Int. J. Mol. Sci. 2020, 21, 2590. [Google Scholar] [CrossRef] [Scilit]
- FAO. World Food Situation. 2024. Available online: https://www.fao.org/worldfoodsituation/csdb/en/ (accessed on 9 May 2026).
- COBORU (Research Centre for Cultivar Testing). Descriptive List of Agricultural Plant Varieties—Cereals Lista Opisowa Odmian Roślin Rolniczych 2024 Zboża; COBORU: Słupia Wielka, Poland, 2024. [Google Scholar]
- Kabała, C.; Charzyński, P.; Chodorowski, J.; Drewnik, M.; Glina, B.; Greinert, A.; Hulisz, P.; Jankowski, M.; Jonczak, J.; Łabaz, B.; et al. Polish Soil Classification, 6th edition—Principles, classification scheme and correlations. Soil Sci. Annu. 2019, 70, 71–97. [Google Scholar] [CrossRef] [Scilit]
- International Union of Soil Sciences (IUSS). World Reference Base for Soil Resources, 4th ed.; IUSS Working Group WRB: Vienna, Austria, 2022. [Google Scholar]
- Chmist-Sikorska, J.; Kępińska-Kasprzak, M.; Struzik, P. Agricultural drought assessment on the base of hydro-thermal coefficient of Selyaninov in Poland. Ital. J. Agrometeorol. 2022, 1, 3–12. [Google Scholar] [CrossRef] [Scilit]
- Dirse, A.; Taparauskiene, L. Humidity fluctuations in plant vegetation periods and a comparison of its assessment methods. Žemės Ūkio Moksl. 2010, 17, 9–17. [Google Scholar]
- Skowera, B.; Puła, J. Pluviometric extreme conditions in spring season in Poland in the years 1971–2000. Acta Agrophys 2024, 3, 171–177. [Google Scholar]
- Taparauskiene, L.; Miseckaite, O. Comparison of watermark soil moisture content with Selyaninov hydrothermal coefficient. Agrofor. Int. J. 2017, 2, 106–115. [Google Scholar] [CrossRef] [Scilit]
- PN-ISO 712:2002; Cereals and Cereal Products-Determination of Moisture Content-Routine Reference Method. Polish Committee for Standardization: Warsaw, Poland, 2002.
- PN-68/R-74017:1969; Cereal Grains and Edible Legume Seeds-Determination of 1000 Grain Weight. Polish Committee for Standardization: Warsaw, Poland, 1969.
- PN-EN ISO 7971-3:2009; Cereals-Determination of Bulk Density, Called Mass per Hectolitre-Part 3: Routine Method. Polish Committee for Standardization: Warsaw, Poland, 2009.
- PN-R-74110:1998; Cereals and Cereal Products-Barley-Methods of Testing. Polish Committee for Standardization: Warsaw, Poland, 1998.
- Kawałko, D.; Gruszka, D.; Waroszewski, J.; Kabała, C. Application of portable colorimeter for identification of mollic horizon and mollic-based soil groups. Soil Sci. Annu. 2023, 74, 1–9. [Google Scholar] [CrossRef] [Scilit]
- Anders, A. Modeling the shape of wheat kernels with the use of solids of revolution. Agric. Eng. 2023, 27, 187–202. [Google Scholar] [CrossRef] [Scilit]
- Falade, O.K.; Christopher, A.S. Physical, functional, pasting and thermal properties of flours and starches of six Nigerian rice cultivars. Food Hydrocoll. 2015, 44, 478–490. [Google Scholar] [CrossRef] [Scilit]
- Markowski, M.; Żuk-Gołaszewska, K.; Kwiatkowski, D. Influence of variety on selected physical and mechanical properties of wheat. Ind. Crops Prod. 2013, 47, 113–117. [Google Scholar] [CrossRef] [Scilit]
- Horabik, J.; Molenda, M. Właściwości Fizyczne Sypkich Surowców Spożywczych (Physical Properties of Granular Food Materials); Acta Agrophys Instytut Agrofizyki im. Bohdana Dobrzańskiego PAN: Lublin, Poland, 2002; Volume 74, pp. 1–89. Available online: https://agro.icm.edu.pl/agro/element/bwmeta1.element.agro-article-8c1b1640-cb3f-4866-ac1e-bd0ecf4985c1/c/Physical_properties_of.pdf (accessed on 2 September 2026).
- Gierz, Ł.; Kolankowska, E.; Markowski, P.; Koszela, K. Measurements and analysis of the physical properties of cereal seeds depending on their moisture content to improve the accuracy of DEM simulation. Appl. Sci. 2022, 12, 549. [Google Scholar] [CrossRef] [Scilit]
- Ramaj, I.; Romuli, S.; Schock, S.; Müller, J. Discrete element modelling of bulk behaviour of wheat (Triticum aestivum L.) cv. ‘Pionier’ during compressive loading. Biosyst. Eng. 2024, 242, 123–139. [Google Scholar] [CrossRef] [Scilit]
- Gastón, A.L.; Abalone, R.M.; Giner, S.A. Wheat drying kinetics. Diffusivities for sphere and ellipsoid by finite elements. J. Food Eng. 2002, 52, 313–322. [Google Scholar] [CrossRef] [Scilit]
- Dholakia, B.B.; Ammiraju, J.S.S.; Singh, H.; Lagu, M.D.; Röder, M.S.; Rao, V.S.; Dhaliwal, H.S.; Ranjekar, P.K.; Gupta, V.S. Molecular marker analysis of kernel size and shape in bread wheat. Plant Breed. 2003, 122, 392–395. [Google Scholar] [CrossRef] [Scilit]
- TIBCO Software Inc. Statistica. Data Analysis Software System, Version 13.3; TIBCO Software Inc.: Palo Alto, CA, USA, 2017.
- Ghimire, D.; Das, S.; Mueller, N.D.; Creech, C.F.; Santra, D.; Baenziger, P.S.; Easterly, A.C.; Maust, B.; Maharjan, B. Effects of cultivars and nitrogen management on wheat grain yield and protein. Agron. J. 2021, 113, 4348−4368. [Google Scholar] [CrossRef] [Scilit]
- Kunkulberga, D.; Linina, A.; Ruza, A. Effect of nitrogen fertilization on protein content and rheological properties of winter wheat wholemeal. In Proceedings of the 13th Baltic Conference on Food Science and Technology “Food. Nutrition. Well-Being” (FoodBalt 2019) Jelgava, Latvia, 2–3 May 2019; Latvia University of Life Science and Technologies, Faculty of Food Technology: Jelgava, Latvia, 2019; pp. 88–92. [Google Scholar] [CrossRef] [Scilit]
- Wang, Y.; Peng, Y.; Lin, J.; Wang, L.; Jia, Z.; Zhang, R. Optimal nitrogen management to achieve high wheat grain yield, grain protein content, and water productivity: A meta-analysis. Agric. Water Manag. 2023, 290, 108587. [Google Scholar] [CrossRef] [Scilit]
- Giordano, N.; Sadras, V.O.; Lollato, R.P. Late-season nitrogen application increases grain protein concentration and is neutral for yield in wheat. A global meta-analysis. Field Crop Res. 2023, 290, 108740. [Google Scholar] [CrossRef] [Scilit]
- Zhang, P.; Ma, G.; Wang, C.; Lu, H.; Li, S.; Xie, Y.; Ma, D.; Zhu, Y.; Guo, T. Effect of irrigation and nitrogen application on grain amino acid composition and protein quality in winter wheat. PLoS ONE 2017, 12, e0178494. [Google Scholar] [CrossRef] [Scilit]
- Liu, P.; Ma, X.; Wan, H.; Zheng, J.; Luo, J.; Hu, Y.; Pu, Z. Effects of differential nitrogen application on wheat grain proteome. J. Cereal Sci. 2021, 102, 103367. [Google Scholar] [CrossRef] [Scilit]
- Lachutta, K.; Jankowski, K.J. The quality of winter wheat grain by different sowing strategies and nitrogen fertilizer rates: A case study in Northeastern Poland. Agriculture 2024, 14, 552. [Google Scholar] [CrossRef] [Scilit]
- Leonte, A.; Pintille, S.-A.; Isticioaia, S.F.; Vălean, A.-M.; Vrînceanu, N.O. Yield and grain quality ewspnse of winter wheat to different nitrogen and phosphorus fertilization doses. Nitrogen 2026, 7, 97. [Google Scholar] [CrossRef] [Scilit]
- Caldelas, C.; Razzouk, F.Z.; Gutíerrez, N.A.; Diez-Fraile, M.C.; Ortega, J.L.A. Interaction of genotype, water availability, and nitrogen fertilization on the mineral content of wheat grain. Food Chem. 2023, 404, 134565. [Google Scholar] [CrossRef] [Scilit]
- Aljabri, M.; El-Soda, M. Genome-Wide Association Mapping of Macronutrient Mineral Accumulation in Wheat (Triticum aestivum L.) Grain. Plants 2024, 13, 3472. [Google Scholar] [CrossRef] [Scilit] [PubMed] [PubMed Central]
- Agapie, A.L.; Horablaga, M.N.; Gorinoiu, G.; Horablaga, A.; Herbei, M.V.; Sala, F. Variation of Protein and Protein Fraction Content in Wheat in Relation to NPK Mineral Fertilization. Agronomy 2025, 15, 2076. [Google Scholar] [CrossRef] [Scilit]
- Ali, A.; Jabeen, N.; Farruhbek, R.; Chachar, Z.; Laghari, A.A.; Chachar, S.; Ahmed, N.; Ahmed, S.; Yang, Z. Enhancing nitrogen use efficiency in agriculture by integrating agronomic practices and genetic advances. Front. Plant Sci. 2025, 16, 1543714. [Google Scholar] [CrossRef] [Scilit]
- Maaz, T.M.; Dobermann, A.; Lyons, S.E.; Thomson, A.M. Review of research and innovation on novel fertilizers for crop nutrition. npj Sustain. Agric. 2025, 3, 25. [Google Scholar] [CrossRef] [Scilit]
- Szuba-Trznadel, A.; Gałka, B.; Kamińska, J.; Jama-Rodzeńska, A.; Król, Z.; Jarki, D.; Fuchs, B. Diversity of chemical composition and nutritional value in grain from selected winter wheat cultivars grown in southiwestern Poland. Sci. Rep. 2024, 14, 2630. [Google Scholar] [CrossRef] [Scilit]
- Tufail, M.A.; Ayyub, M.; Tariq, L.; Iltaf, J.; Asbat, A.; Bashir, I.; Umar, W. Nitrogen fertilizers and the future of sustainable agriculture: A deep dive into production, pollution, and mitigation measures. Soil Sci. Plant Nutr. 2024, 70, 457–477. [Google Scholar] [CrossRef] [Scilit]
- Li, C.; Shi, Y.; Yu, Z.; Zhang, Y.; Zhang, Z. Optimizing nitrogen application strategies can improve grain yield by increasing dry matter translocation, promoting grain filling, and improving harvest indices. Front. Plant Sci. 2025, 16, 1565446. [Google Scholar] [CrossRef] [Scilit]
- Hawkesford, M.J. Reducing the reliance on nitrogen fertilizer for wheat production. J. Cereal Sci. 2014, 59, 276–283. [Google Scholar] [CrossRef] [Scilit]
- Gregersen, P.L.; Holm, P.B.; Krupinska, K. Leaf senescence and nutrient remobilisation in barley and wheat. Plant Biol. 2008, 10, 37–49. [Google Scholar] [CrossRef] [Scilit]
- Moitzi, G.; Neugschwandtner, R.W.; Kaul, H.-P.; Wagentristl, H. Efficiency of mineral nitrogen fertilization in winter wheat under Pannonian climate conditions. Agriculture 2020, 10, 541. [Google Scholar] [CrossRef] [Scilit]
- Yang, Z.; Liu, P.; Wang, S.; Zhang, B.; Li, H.; Wang, X.; Lv, S.; Li, J.; Abdo, A.I.; Wang, L. Optimum nitrogen rate combined with biochar increased wheat yield while improving lodging resistance. Eur. J. Agron. 2026, 172, 127849. [Google Scholar] [CrossRef] [Scilit]
- Litke, L.; Gaile, Z.; Ruža, A. Effect of nitrogen fertilization on winter wheat yield and yield quality. Agron. Res. 2018, 16, 500–509. [Google Scholar] [CrossRef]
- Jarecki, W. Response of winter wheat to delayed sowing and varied nitrogen fertilization. Agriculture 2024, 14, 121. [Google Scholar] [CrossRef] [Scilit]
- Liu, Y.; Liao, Y.; Liu, W. High nitrogen application rate and planting density reduce wheat grain yield by reducing filling rate of inferior grain in middle spikelets. Crop J. 2021, 9, 412–426. [Google Scholar] [CrossRef] [Scilit]
- Belcar, J.; Sekutowski, T.R.; Gorzelany, J. Impact of nitrogen fertiliser application on the grain quality of selected winter wheat cultivars used for malt production. Acta Univ. Cibiniensis Ser. E Food Technol. 2025, 29, 221–234. [Google Scholar] [CrossRef] [Scilit]
- Warechowska, M.; Stępień, A.; Wojtkowiak, K.; Nawrocka, A. The impact of nitrogen fertilization strategies on selected qualitative parameters of spring wheat grain and flour. Pol. J. Nat. Sci. 2019, 34, 99–212. [Google Scholar]
- Neugschwandtner, R.W.; Böhm, K.; Hall, R.M.; Kaul, H.-P. Development, growth, and nitrogen use of autumn- and spring-sown facultative wheat. Acta Agric. Scand. Sect. B Soil Plant Sci. 2015, 65, 6–13. [Google Scholar] [CrossRef] [Scilit]
- Hnizil, O.; Baidani, A.; Khlila, I.; Nsarellah, N.; Amamou, A. Assessing the impact of nitrogen fertilization, variety selection, year and their interaction on wheat yield and yield components. Nitrogen 2024, 5, 266–287. [Google Scholar] [CrossRef] [Scilit]
- Mahnoor; Jamil, M.M.; Ali, A.; Anwar, T.; Qureshi, H.; Naseem, M.T.; Albasher, G.; Ansari, M.J. Predicting wheat grain yield through morphometric analysis of seed dimensions using computational imaging techniques. Plant Mol. Biol. Rep. 2025, 43, 1426–1438. [Google Scholar] [CrossRef] [Scilit]
- Salkić, B.; Mešinović, E.; Mujić, A.; Salkić, A.; Kucalović, E. The influence of fertilizer application on color, size and number of grains in ecological wheat production. Glob. J. Sci. Front. Res. D Agric. Vet. 2019, 19, 29–35. [Google Scholar]
- Lachman, J.; Martinek, P.; Kotíková, Z.; Orsák, M.; Šulc, M. Genetics and chemistry of pigments in wheat grain. J. Cereal Sci. 2017, 74, 145–154. [Google Scholar] [CrossRef] [Scilit]
- Tańska, M.; Buczek, J.; Jarecki, W.; Wasilewska, A.; Konopka, I. Grain morphology, texture and colour-related compounds of bread wheat cultivars in relation to cultivation regimes and growing location. Zemdirb.-Agric. 2018, 105, 105–112. [Google Scholar] [CrossRef] [Scilit]

Disclaimer/Publisher’s Note: The statements, opinions and data contained in all publications are solely those of the individual author(s) and contributor(s) and not of MDPI and/or the editor(s). MDPI and/or the editor(s) disclaim responsibility for any injury to people or property resulting from any ideas, methods, instructions or products referred to in the content. |
© 2026 by the authors. Licensee MDPI, Basel, Switzerland. This article is an open access article distributed under the terms and conditions of the Creative Commons Attribution (CC BY) license.