


Abstract
Whether biochar alters the nitrogen (N) response of irrigated winter wheat by coordinating the grain-sink establishment with post-anthesis source supply remains unclear. Two independently randomized field trials compared 0 and 20 t ha−1 biochar (B0 and B20) across eight N rates (0–350 kg N ha−1 in 50 kg increments). Biochar interacted significantly with the N rate. B20 significantly increased the yield at 200–350 kg N ha−1 but not at 0–150 kg N ha−1. It raised the fitted yield-maximizing N rate by 55–57 (95%CI 34.9–80.0) kg N ha−1 and the predicted maximum yield by 1.0 (95%CI 0.70–1.29) t ha−1. The grain number (GN) increased with N but was unaffected by biochar. In contrast, B20 maintained a greater grain weight at 150–350 kg N ha−1 and increased post-anthesis dry matter production (PostDM) by 11.0–43.5% at 200–350 kg N ha−1, without affecting the apparent pre-anthesis dry matter translocation. Under a high N, a greater PostDM coincided with enhanced post-anthesis N uptake, canopy persistence, and water-use efficiency. Integrated analyses highlighted associations of yield with the estimated GN and PostDM. Treatment means showed concurrent increases in GN and PostDM through 200 kg N ha−1 under B0 and 250 kg N ha−1 under B20, followed by increasing GN and declining PostDM at higher tested rates. Biochar raised the yield ceiling by sustaining the post-anthesis source supply for an N-expanded grain sink rather than by increasing the sink capacity at a given N rate.
1. Introduction
Nitrogen (N) supply is a major determinant of winter wheat productivity because it regulates leaf-area development, canopy photosynthesis, biomass accumulation, and yield-component formation [1,2,3]. The yield therefore responds strongly to N when the soil availability is insufficient, but the crop N uptake and harvestable biomass do not increase proportionally with continued N input. As the N supply approaches or exceeds the crop demand, the marginal yield gains diminish and N-use efficiency generally declines [4]. Field studies in irrigated winter wheat similarly show that yield and water-use efficiency increase only to an optimum N rate, beyond which additional N may restrict post-anthesis dry matter accumulation and reduce yield and resource-use efficiency [5,6]. Moreover, genetic and agronomic improvement can modify the slope, plateau, and optimum of the yield–N response [7]. Effective N management should therefore increase the attainable yield while sustaining resource-use efficiency. Because N regulates both the pre-anthesis sink formation and post-anthesis source activity, the physiological basis of this response needs to be understood from a source–sink perspective.
The grain yield depends on both the reproductive sink established before and around anthesis and the extent to which that sink is realized during grain filling [8,9,10]. In wheat, the grain number (GN) largely determines the sink capacity, whereas the realized yield reflects the combined contributions of GN and grain weight (GW). Increasing GN is frequently accompanied by a lower GW because of developmental trade-offs and greater assimilate demand [9,11]. Additional grains therefore increase the yield only when the source supply is sufficient to support their filling. Source–sink manipulation studies confirm that GW depends on the balance between assimilate availability and sink demand, although the relative importance of source and sink limitations varies among genotypes and environments [8,12,13]. Grain filling is supported by current post-anthesis assimilation and by the remobilization of reserves accumulated before anthesis [14,15]. Pre-anthesis reserves can buffer temporary shortages in current assimilation but may not fully compensate for an inadequate post-anthesis source supply when the sink capacity is large. Evaluating GN, GW, post-anthesis dry matter production, and pre-anthesis dry matter translocation together is therefore essential for distinguishing sink establishment from sink realization.
The maintenance of post-anthesis source activity is closely linked to crop N dynamics, canopy persistence, and water availability [16,17,18]. Grain N demand is met by continued post-anthesis uptake and the remobilization of N stored in vegetative organs [18,19,20]. Because much leaf N is contained in chloroplasts and photosynthetic proteins, rapid remobilization is coupled with chloroplast dismantling, the loss of chlorophyll and photosynthetic capacity, and canopy senescence [17,21,22]. Continued N uptake after anthesis may help satisfy grain demand while reducing the reliance on rapid canopy-N depletion, thereby sustaining green leaf area and assimilate production [16,19]. This process also depends on water availability because nitrate mobility, root N uptake, transpiration, and photosynthesis are physiologically interconnected [23]. Post-anthesis N uptake, canopy persistence, soil water consumption, and water-use efficiency thus provide complementary indicators of the resource basis supporting post-anthesis source activity.
Biochar has been proposed as a means of modifying the soil resource availability and its synchronization with crop demand [24,25]. It may alter the N supply through nutrient sorption, microbial mineralization, and immobilization, and changes in soil water conditions and the root environment [26]. Biochar may also supply N, P, and K, although their availability depends on chemical forms and release processes. Changes in soil pH and nutrient sorption can further influence the P availability and the retention and release of nutrient cations [26]. These processes may modify the amount and timing of plant N uptake and subsequent canopy maintenance. Their direction and magnitude depend on biochar properties, soil conditions, and the accompanying fertilizer regime [27,28,29]. Recent field studies illustrate this context dependence: optimized biochar–N combinations improved water–N availability and maize productivity [30], whereas biochar did not improve yield or N-use efficiency at a fertile temperate site [31]. Biochar therefore cannot be assumed to replace fertilizer N or provide a constant yield increment across N levels. Previous studies have mainly emphasized mean yield responses, soil properties, or resource-use efficiencies; much less is known about whether biochar changes the shape and optimum of the crop yield response across a broad N gradient. It is also unclear whether any such change results from a larger grain sink or from improved realization of the established sink through sustained post-anthesis N acquisition, canopy persistence, and dry matter production.
The interpretation of nitrogen-use efficiency (NUE) requires distinguishing crop N utilization from responses to applied fertilizer N [32]. Here, NUEG expresses the grain yield per unit of aboveground N accumulated at maturity. AEN and REN describe, respectively, the additional grain yield and apparent additional N accumulation per unit of applied mineral N relative to a zero-N control, whereas PFPN expresses the grain yield per unit of applied mineral N. These indices capture different aspects of N performance, so a greater yield does not necessarily imply an improvement in every N-efficiency index.
To address these questions, two independently randomized field experiments were conducted in consecutive growing seasons using irrigated winter wheat. Treatments combined biochar application at 0 and 20 t ha−1 with eight N rates ranging from 0 to 350 kg N ha−1 at 50 kg N ha−1 intervals. The objectives were to determine whether biochar alters the magnitude, shape, and yield-maximizing N rate of the grain-yield response; distinguish sink establishment from sink realization by integrating grain components, pre- and post-anthesis dry matter contributions, post-anthesis N uptake, and canopy persistence; and identify the dominant drivers and pathways of yield formation using complementary predictive, regression, and structural modeling approaches. Nitrogen- and water-use efficiencies were also evaluated to determine whether a higher attainable yield could be achieved without compromising resource-use efficiency. We hypothesized that biochar would not uniformly increase the yield across the N gradient or directly enlarge the sink capacity at a given N rate. Instead, its benefit would emerge primarily under a relatively high N by sustaining post-anthesis N acquisition, canopy persistence, and dry matter production, thereby supporting grain filling and modifying the relationship between grain number and post-anthesis growth across the N gradient.
2. Materials and Methods
2.1. Site Description
The field experiments were conducted during the 2023–2024 and 2024–2025 winter wheat growing seasons in Quanyuan Town, Tancheng County, Shandong Province, China (34°42′ N, 118°25′ E). A separate field was used in each season to prevent carry-over effects from the biochar and N treatments applied in the preceding experiment. The two fields were adjacent to each other and had previously been managed by the same farmer using comparable conventional practices under a winter wheat–summer maize rotation. For the preceding maize crop, compound fertilizer was applied as basal fertilizer at rates equivalent to 120 kg N, 90 kg P2O5, and 120 kg K2O ha−1. Nitrogen was subsequently topdressed at V6 and VT, with 60 kg N ha−1 applied at each stage, resulting in a total N input of 240 kg N ha−1. After harvest, maize residues were chopped into fragments ≤ 3 cm long and returned to the field. Treatment allocation and randomization were conducted independently in each field.
Precipitation during the winter wheat growing period was 221.9 mm in 2023–2024 and 190.8 mm in 2024–2025. Both experimental fields had a clay loam texture according to the USDA classification. Sand, silt, and clay contents were 37%, 32%, and 31%, respectively, in 2023–2024, and 36%, 34%, and 30%, respectively, in 2024–2025. Particle-size classes were defined as sand (0.05 ≤ d < 2 mm), silt (0.002 ≤ d < 0.05 mm), and clay (d < 0.002 mm), with percentages expressed relative to the mineral soil fraction smaller than 2 mm. Before sowing, soil samples were collected from the 0–20 cm layer of each field to determine its initial fertility. In 2023–2024 and 2024–2025, respectively, soil organic matter contents were 14.9 and 15.7 g kg−1, total N contents were 1.03 and 1.06 g kg−1, Olsen-extractable P concentrations were 15.22 and 17.04 mg kg−1, available K concentrations were 135.1 and 142.0 mg kg−1, and pH values were 8.21 and 8.19. Soil organic carbon was determined by potassium dichromate–sulfuric acid oxidation with external heating, followed by ferrous sulfate titration, and converted to organic matter using a factor of 1.724. Olsen P was extracted with 0.5 mol L−1 NaHCO3 (pH 8.5) at a soil-to-solution ratio of 1:20 (w/v) for 30 min and determined by molybdenum blue colorimetry. Available K was extracted with 1 mol L−1 ammonium acetate (pH 7.0) and determined by flame photometry. Soil pH was measured using a glass-electrode pH meter (Orion Lab Star PH111 benchtop pH meter (Thermo Orion Incorporated, Thermo Fisher Scientific, Chelmsford, MA, USA)) in a 1:2.5 soil-to-deionized-water suspension (g).
A formal soil taxonomic classification was not established. Soil CEC, exchangeable Ca, Mg, and Na, electrical conductivity, and initial mineral N concentrations were not measured. Pre-sowing soil NO3−-N and NH4+-N were not determined in either field, including the 0–20 cm layer and the deeper soil profile.
2.2. Experimental Design and Crop Management
In each growing season, the experiment was arranged as a split-plot design with four blocks, and treatment randomization was conducted independently in each field. Biochar application was assigned to the main plots, comprising no biochar application (B0) and biochar application at 20 t ha−1 (B20). Within each main plot, the eight N treatments (N0–N350) were randomly allocated to subplots. Each subplot covered 40 m2 (20 m × 2.0 m) and contained 10 wheat rows spaced 0.20 m apart.
A single batch of commercially produced biochar was used in both field experiments. The biochar was produced from maize straw by pyrolysis at 500 °C for 1 h, with an approximate mass yield of 33.3% (1 kg of biochar from 3 kg of maize straw). It had a specific surface area of 7.44 m2 g−1, a pH of 9.50, an ash content of 36.4%, and a cation exchange capacity of 23.9 cmol(+) kg−1. Its C, N, P, and K contents were 46.07%, 1.27%, 0.23%, and 1.05%, respectively. The reported biochar properties were obtained from the manufacturer’s product information and were not independently determined in this study. The manufacturer identified the Chinese agricultural industry standard NY/T 3041-2016 (Biochar-based fertilizer) [33] as the reference for factory testing. The total C:N mass ratio was 36.3. At 20 t ha−1, the reported biochar composition corresponded to estimated total inputs of 254 kg N, 46 kg P, and 210 kg K ha−1, with P and K expressed on an elemental basis. These quantities represent total nutrient inputs rather than measured plant-available supplies or fertilizer equivalents. The N0–N350 treatments denote mineral fertilizer N rates and exclude the total N introduced with biochar. Three days before sowing, biochar was uniformly broadcast over the B20 main plots and incorporated into the 0–20 cm soil layer by rotary cultivation. The B0 main plots received the same rotary cultivation but no biochar.
The winter wheat cultivar ‘Linmai 9’ was sown at 300 seeds m−2 to a depth of approximately 3 cm. Sowing was performed on 14 October 2023 and 12 October 2024 using a modified wheat planter (2BMF-11; Minle County Kaiyuan Machinery Manufacturing Co., Ltd., Zhangye, China). The planter was configured with 10 active sowing units to provide the required row spacing and plot width.
Before sowing, all plots received 120 kg P2O5 ha−1 as calcium superphosphate containing 16% P2O5 and 90 kg K2O ha−1 as potassium chloride containing 52% K2O. Urea containing 46% N was used for the N treatments. For each fertilized treatment, 60% of the designated N rate was incorporated into the soil before sowing, and the remaining 40% was topdressed at jointing; N0 received no urea. Adjacent subplots were separated by bunds 30 cm high and 40 cm wide to contain surface irrigation water and limit interplot surface exchange. Each subplot was irrigated separately through a hose, with the applied volume controlled using a water meter. Flood irrigation was applied before winter dormancy, at jointing, and at anthesis, with 60 mm supplied at each event, giving a seasonal irrigation total of 180 mm. All other management practices were identical among treatments. Diseases and insect pests were controlled when necessary, and herbicides were applied three times during each growing season.
2.3. Sampling and Measurements
At maturity, grain yield was determined by harvesting ears from the center of each plot over 2 m2 (2.5 m length across four representative rows). Grain yield was converted to a standard moisture content of 13.0%, with moisture measured using a digital tester (PM8188A, Kett Electric Laboratory, Tokyo, Japan). Grain weight was determined from three randomly selected 50.00 g subsamples; grain weight values were also corrected to 13.0% moisture. Grains number per m2 (GN) were calculated as follows:
where Yield is grain yield (g m−2), and GW is grain weight (mg).
Leaf area index (LAI) and flag-leaf SPAD values were measured at anthesis and subsequently at 6-day intervals until 30 days after anthesis, corresponding to six sampling dates: 0, 6, 12, 18, 24, and 30 days after anthesis. At each sampling, plants were collected from a 0.50 m section of a representative central row in each subplot. Given the row spacing of 0.20 m, the sampled ground area was 0.100 m2. Green leaf blades were separated from the sampled plants, and their total area was measured using a leaf area meter (LI-3100C; LI-COR, Lincoln, NE, USA). LAI at each sampling date was calculated as follows:
At each sampling date, 30 flag leaves were randomly selected from each subplot, and their relative chlorophyll contents were measured using a SPAD-502 Plus chlorophyll meter (Konica Minolta, Tokyo, Japan). The mean value of the 30 flag leaves was used as the subplot-level SPAD value for that sampling date. Post-anthesis mean LAI (PostLAIm) and mean SPAD (PostSPADm) were calculated across the six sampling dates and used as integrated indicators of leaf-area and chlorophyll persistence during the post-anthesis period, respectively.
Aboveground biomass was quantified at anthesis and physiological maturity. On each occasion, all plants within a 0.50 m-long section of an internal row were removed from each subplot, representing a sampled area of 0.10 m2. Samples collected at anthesis were divided into leaf blades, ears, and stems with their attached sheaths, whereas those collected at maturity were divided into grain and remaining straw. Plant materials were initially exposed to 105 °C for 30 min to terminate metabolic activity and were then maintained at 80 °C until a stable dry mass was attained.
The total aboveground dry masses recorded at anthesis and maturity are hereafter referred to as DMA and DMM, respectively. Net dry matter production during the post-anthesis period (PostDM) was derived as follows:
PostDM is a balance of biomass gain after flowering, not a direct measurement of assimilate flux.
The apparent translocated dry matter accumulated before anthesis and subsequently transferred to grain (TransDM) was estimated by subtracting PostDM from grain dry matter at maturity:
where GDM denotes grain dry matter at maturity. These two variables are operational, mass-balance estimates of the apparent post-anthesis and pre-anthesis contributions to final grain dry matter rather than direct measurements of assimilate movement.
Dry matter partitioning to grain was expressed as the harvest index (HI, %):
After dry matter determination, the plant fractions were finely ground, and their N concentrations were quantified using an automated Kjeldahl analyzer (Kjeltec 8400; FOSS, Hillerød, Denmark). N accumulation in each plant fraction was calculated from its dry mass and N concentration. Total aboveground N uptake at anthesis (NUPA) and maturity (NUPM) was obtained by summing the N accumulation of all corresponding plant fractions. Post-anthesis N uptake (PostNUP) was estimated as follows:
N utilization efficiency for grain production (NUEG), agronomic efficiency of applied mineral N (AEN), apparent N recovery efficiency (REN), and partial factor productivity of applied mineral N (PFPN) were calculated as follows:
Here, Yield is grain yield expressed in kg ha−1, NUPM is total aboveground N accumulation at maturity expressed in kg N ha−1, and N rate denotes applied mineral fertilizer N, excluding total N introduced with biochar. Y0 and NUP0 in these equations denote yield and aboveground N accumulation at maturity, respectively, in the corresponding zero-mineral-N control within the same biochar treatment and season. REN is an apparent difference-based estimate because plant N measurements do not distinguish fertilizer-, soil-, and biochar-derived N. AEN, REN, and PFPN were not calculated at zero mineral N input, whereas NUEG remained applicable.
Gravimetric soil water content was measured before sowing and at maturity in each subplot. Soil samples were collected from the 0–200 cm profile at 20 cm intervals using a 5 cm-diameter soil auger and oven-dried at 105 °C to constant mass. Soil bulk density was determined separately using the core method in ten 20 cm layers to 200 cm (Table S1). Soil water storage (SWS, mm) was calculated for each layer from gravimetric water content, the corresponding season- and layer-specific bulk density, and layer thickness, and then summed over the profile. Seasonal soil water consumption (SWC, mm) was calculated as SWS at sowing minus SWS at maturity. Seasonal evapotranspiration was estimated as follows:
where P and I represent growing-season precipitation and irrigation, respectively. Surface runoff, drainage below 200 cm, groundwater contribution, and net lateral exchange were not quantified and were omitted from the calculation. Water use efficiency (WUE, kg ha−1 mm−1) was calculated as follows:
ET and WUE were therefore treated as approximate water-balance estimates.
2.4. Data Analysis
Because the two seasons were established in independently randomized fields, each was analyzed separately. Split-plot mixed models included biochar (B), N rate (N), and B × N as fixed effects and block and block × B as random effects. Model assumptions were checked before analysis. Means were separated by Tukey’s HSD test, with planned contrasts comparing B0 and B20 at each N rate (p < 0.05). Data are presented as means ± standard deviations.
Quadratic models (1000Y = aN2 + bN + c) were fitted by biochar treatment and season to describe diminishing yield responses and possible declines at high N. The yield-maximizing N rate was calculated as −b/(2a) for concave curves with vertices within the experimental range. Uncertainty was assessed using season-specific joint split-plot models with biochar-specific quadratic terms and random intercepts for block and block × biochar. Percentile 95% confidence intervals for the fitted N-rate and yield maxima and their B20–B0 differences were obtained from 10,000 joint parametric bootstrap simulations preserving the split-plot error structure. Paired whole-block resampling and approximate delta-method intervals provided sensitivity checks. Quadratic adequacy was evaluated against biochar-specific categorical N responses using a pure-error lack-of-fit test.
Linear and quadratic regressions based on 32 treatment-by-season means described relationships among GN, GW, PostDM, TransDM, and yield. Unadjusted R2 and model p values were reported, and relationships involving interrelated variables were interpreted descriptively.
RF models were fitted separately for B0 and B20 using 64 plot observations per group pooled across two seasons. Each of 100 fits used a different random seed, 1000 trees, mtry = max [1, floor(p/3)], and nodesize = 5. Individual trees used observation-level sampling with replacement. Original permutation importance was the unscaled increase in OOB MSE; means and SDs across fits describe algorithmic variability. Predictive performance was additionally assessed using eight complete season-by-block holdouts, averaging predictions across ten seed fits per fold. Held-out importance and 95% percentile intervals were evaluated using within-block permutation and 500 season-stratified whole-block bootstrap draws, of which 494 were evaluable. Sensitivity models excluded GN, HI, TransDM, and PostDM, with a stricter version additionally excluding DMM. Full settings and results are provided in Tables S2 and S3.
PSEM represented hypothesized relationships among N accumulation, pre-anthesis biomass, grain number, post-anthesis biomass gain, and yield. The original model comprised six response nodes, with identical component structures for B0 and B20. Each component included centered linear and quadratic N terms, season as a fixed effect, and season × block as a random intercept. Models were fitted by maximum likelihood after within-group standardization. Evaluation included directed-separation tests, Fisher’s C, marginal and conditional R2, and VIF diagnostics. Sensitivity structures removed GN alone or both GN and PostDM, together with all attached paths. Coefficient uncertainty and block influence were assessed using 1000 season-stratified whole-block bootstrap replicates and eight leave-block refits, respectively. Model fit and collinearity diagnostics are reported in Table S4. Bootstrap and leave-block sensitivity results for the PostDM–yield association and yield-model path coefficients are presented in Tables S5 and S6, respectively.
ANOVA was performed in Statistix 10.0, regressions and graphics in OriginPro 2021, and RF and PSEM in R 4.6.0 using the ‘randomForest’, ‘nlme’, and ‘piecewiseSEM’ packages. Statistical significance was set at p < 0.05.
3. Results
3.1. Grain Yield Performance
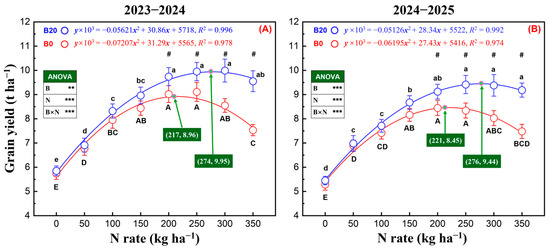
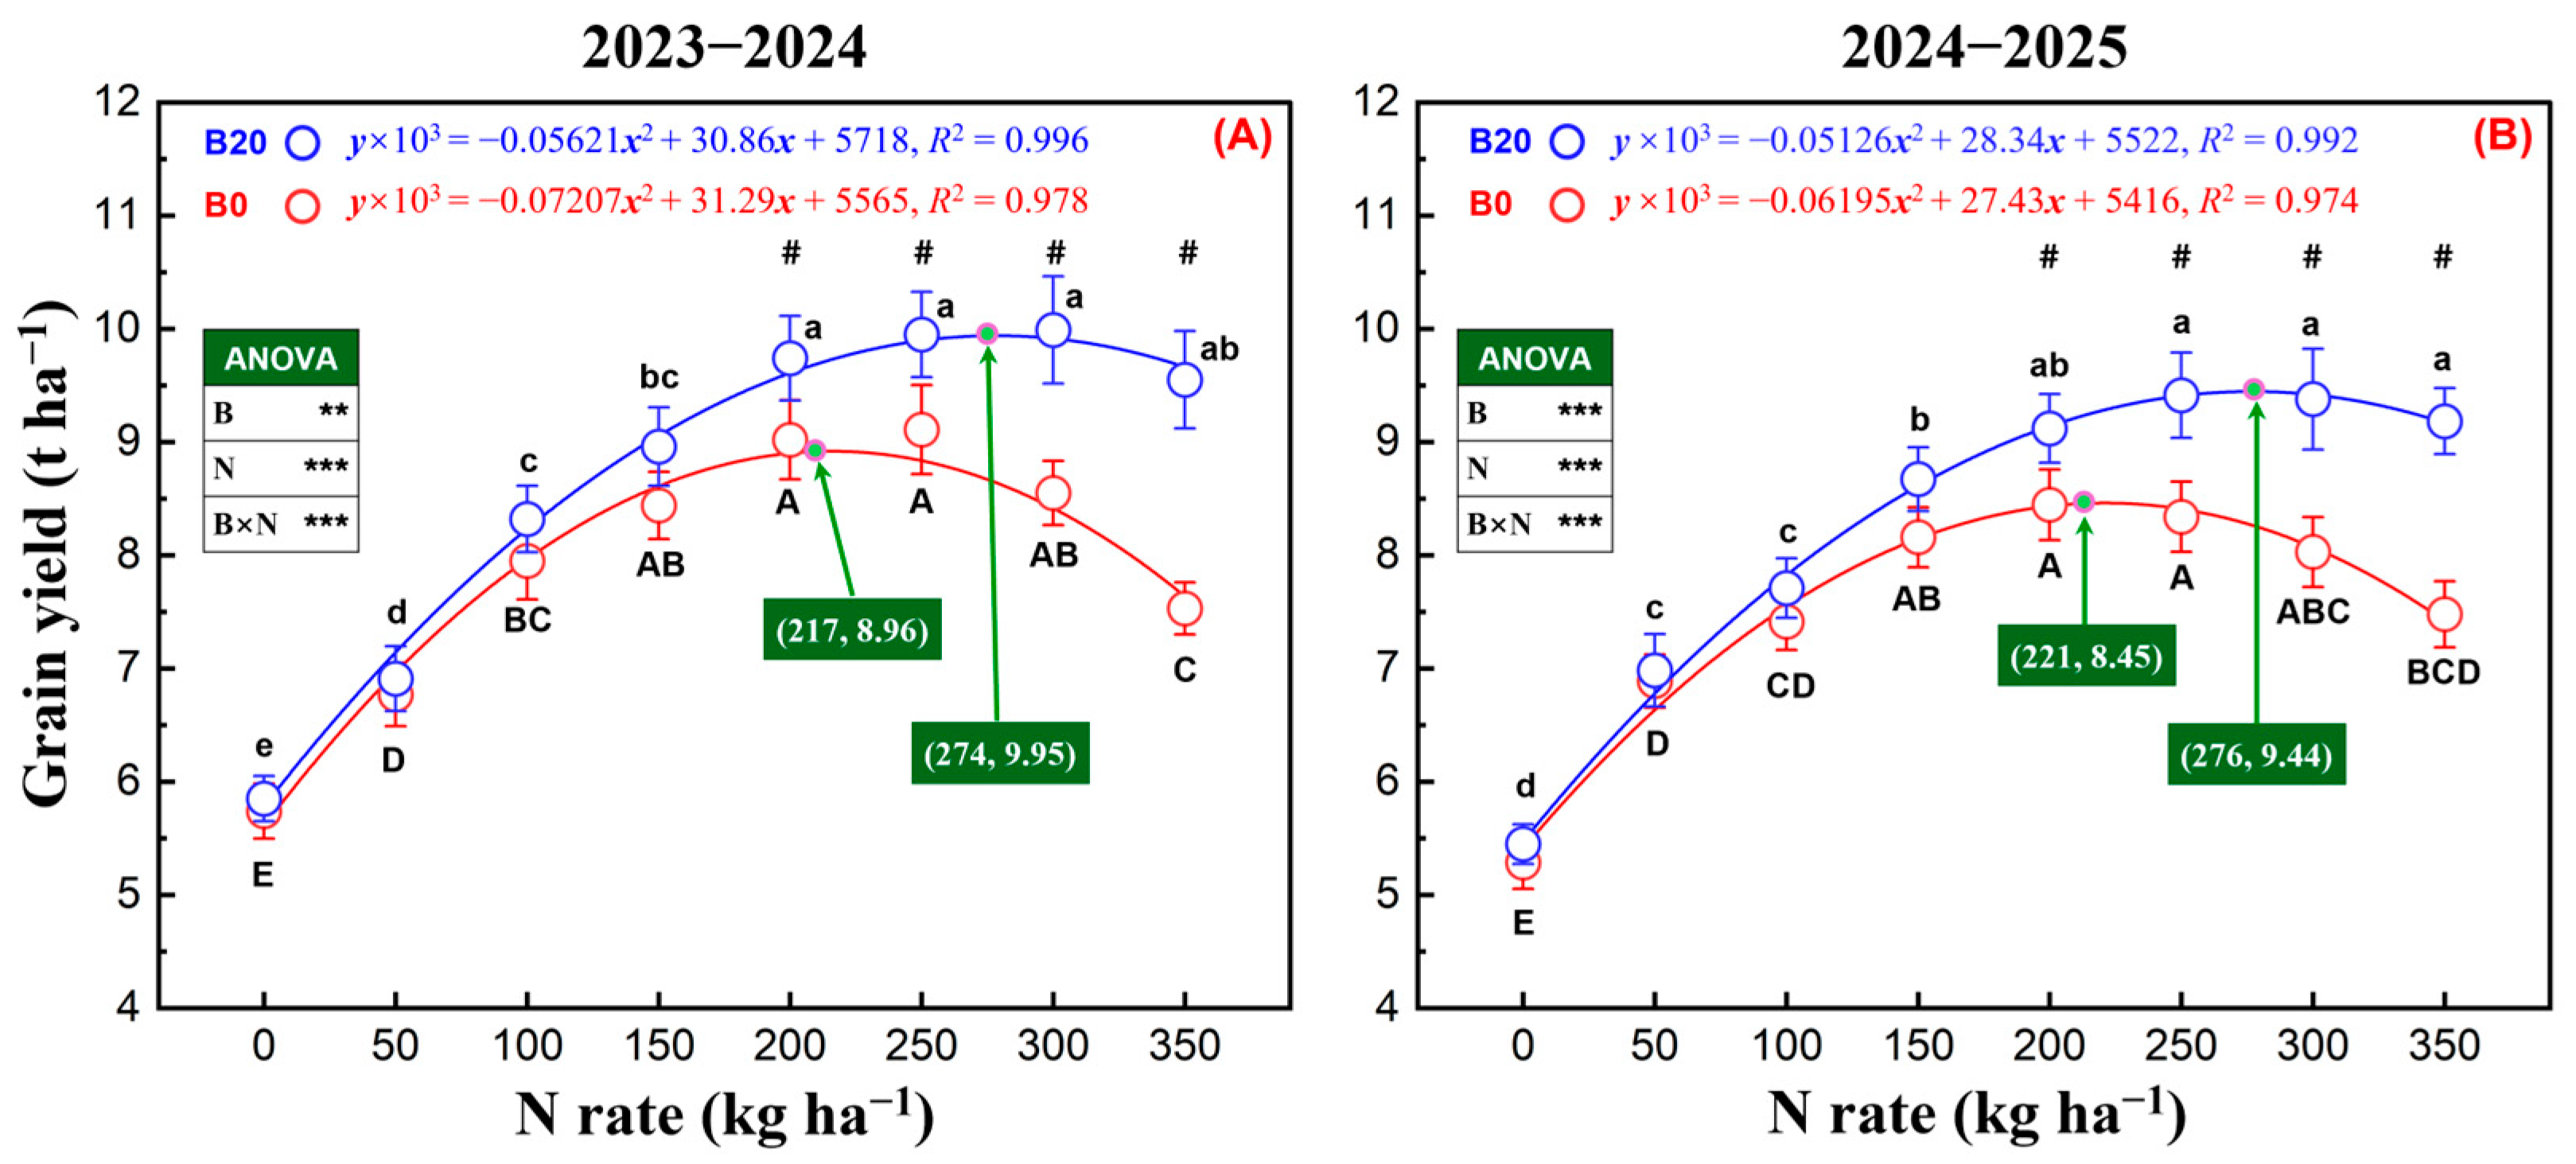
The biochar application, N rate, and their interaction significantly affected the grain yield in both growing seasons (Figure 1). Under both biochar treatments, the grain yield increased with the N rate and subsequently plateaued or declined, but the response differed markedly between B0 and B20. No significant difference between B0 and B20 was detected at N rates of 0–150 kg N ha−1, whereas B20 produced significantly greater yields than B0 at 200–350 kg N ha−1 in both seasons. At the highest N rates, the yield declined markedly under B0, whereas B20 maintained comparatively high yields over a wider N range. The quadratic models explained 97.4–99.6% of yield variation. Fitted yield-maximizing N rates under B0 and B20 were 217.1 and 274.5 kg N ha−1 in 2023–2024 and 221.4 and 276.4 kg N ha−1 in 2024–2025, respectively. The corresponding predicted maximum yields were 8.96 and 9.95 t ha−1 in the first season and 8.45 and 9.44 t ha−1 in the second. The B20–B0 differences in the fitted yield-maximizing N rate were 57.4 (95% CI, 38.4–80.0) and 55.1 (34.9–79.7) kg N ha−1, while the predicted maximum-yield differences were 1.0 (0.70–1.29) and 1.0 (0.79–1.19) t ha−1, respectively.
Figure 1.
Grain yield responses of winter wheat to N application rate under biochar treatments during the 2023–2024 (A) and 2024–2025 (B) growing seasons. Symbols and error bars represent means ± standard deviations (n = 4). Solid lines represent quadratic regression fits. Green markers and arrows indicate the fitted maximum yield, with values in parentheses denoting the corresponding yield-maximizing N rate (kg N ha−1) and predicted grain yield (t ha−1), respectively. Within each biochar treatment, different uppercase letters for B0 and lowercase letters for B20 indicate significant differences among N rates according to Tukey’s HSD test (p < 0.05). The symbol # indicates a significant difference between B0 and B20 at the same N rate (p < 0.05). Insets show the significance of the main effects of biochar (B), N rate (N), and their interaction (B × N) based on split-plot ANOVA. ** and *** indicate significance at p < 0.01 and p < 0.001, respectively.
3.2. Sink Establishment and Grain Filling
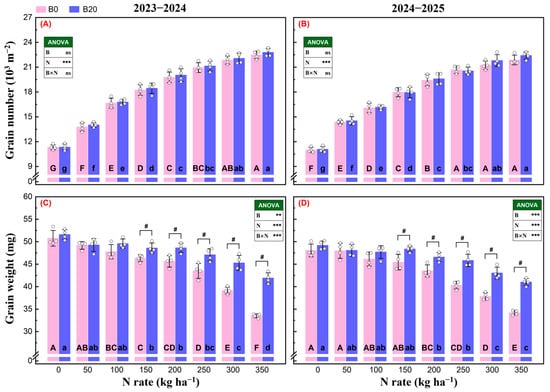
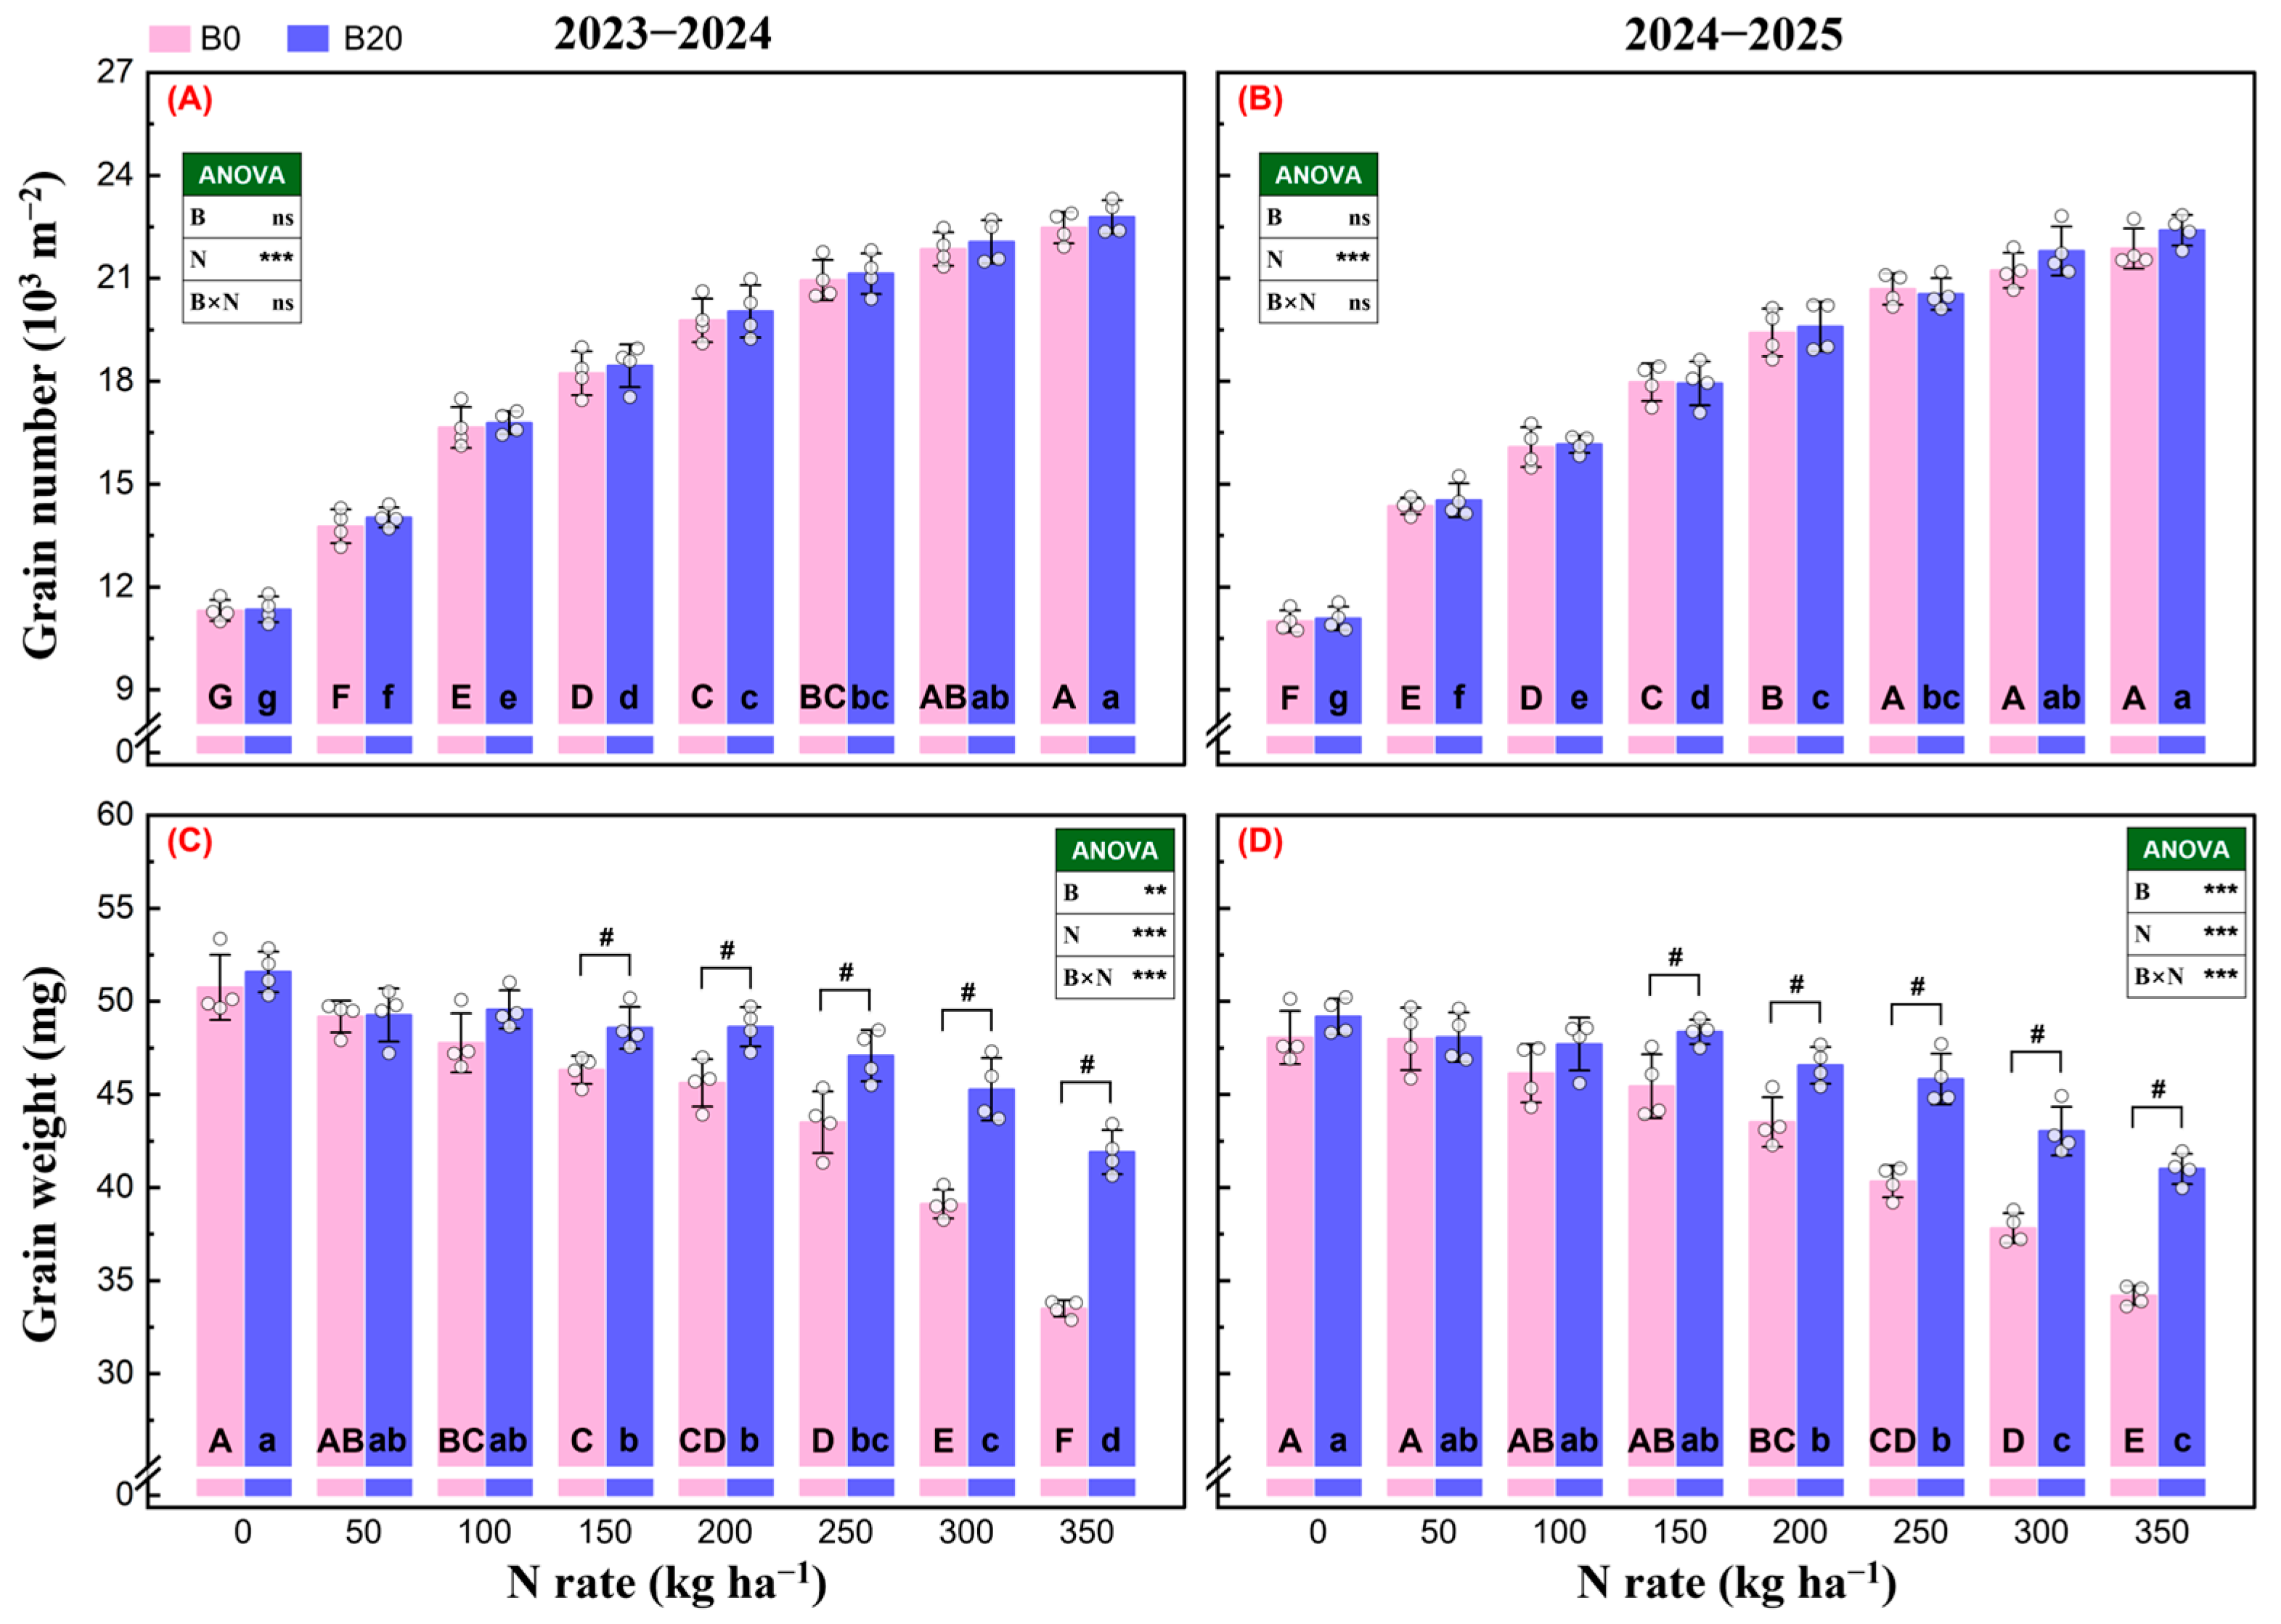
The N rate significantly affected the GN in both growing seasons, whereas neither the biochar main effect nor the B × N interaction was significant (Figure 2A,B). The GN increased progressively with the N rate, rising from approximately 11 × 103 grains m−2 under N0 to more than 22 × 103 grains m−2 at the highest N rates. No significant differences in GN were detected between B0 and B20 at any individual N rate. In contrast, the GW was significantly affected by biochar, the N rate, and their interaction in both seasons (Figure 2C,D). The GW generally declined with an increasing N rate, but the magnitude of this reduction differed between the two biochar treatments. The GW did not differ significantly between B0 and B20 at N rates of 0–100 kg N ha−1, whereas B20 maintained a significantly greater GW than B0 at 150–350 kg N ha−1 in both seasons. Thus, the decline in GW under a moderate-to-high N supply was less pronounced under B20.
Figure 2.
Effects of N application rate and biochar on grain number and grain weight of winter wheat during the 2023–2024 and 2024–2025 growing seasons. Panels (A,B) show grain number in 2023–2024 and 2024–2025, respectively, whereas panels (C,D) show grain weight in the corresponding seasons. B0 and B20 represent biochar application rates of 0 and 20 t ha−1, respectively. Bars and error bars represent means ± standard deviations (n = 4), and open circles indicate individual plot observations. Within each biochar treatment, different uppercase letters for B0 and lowercase letters for B20 indicate significant differences among N rates according to Tukey’s HSD test (p < 0.05). The symbol # indicates a significant difference between B0 and B20 at the same N rate (p < 0.05). Insets show the significance of the main effects of biochar (B), N rate (N), and their interaction (B × N) based on split-plot ANOVA. ns, **, and *** indicate nonsignificance and significance at p < 0.01 and p < 0.001, respectively.
3.3. Dry Matter Production, Translocation, and Partitioning
The N rate significantly affected the DMA, DMM, and HI in both growing seasons (Table 1). The DMA increased progressively with the N supply and generally approached a plateau at 250–350 kg N ha−1. The biochar effect on DMA was nonsignificant in 2023–2024 and significant but relatively small in 2024–2025, whereas the B × N interaction was nonsignificant in both seasons. The DMM initially increased with the N rate but plateaued or declined under an excessive N supply. Unlike the DMA, the DMM was significantly affected by biochar and the B × N interaction in both seasons. B20 produced a significantly greater DMM than B0 at 200–350 kg N ha−1 in 2023–2024 and at 150–350 kg N ha−1 in 2024–2025. Across these N rates, the increases under B20 ranged from 5.9% to 13.7% in the first season and from 5.2% to 12.9% in the second season. HI generally declined with an increasing N rate, particularly under B0. Within B0, the lowest HI values occurred at the higher N rates, whereas no significant differences among N rates were detected under B20. The biochar main effect on HI was nonsignificant in 2023–2024 but significant in 2024–2025, and the B × N interaction was nonsignificant in both seasons.
Table 1.
Effects of N rate and biochar on dry matter accumulation at anthesis and maturity and harvest index of winter wheat during the 2023–2024 and 2024–2025 growing seasons.
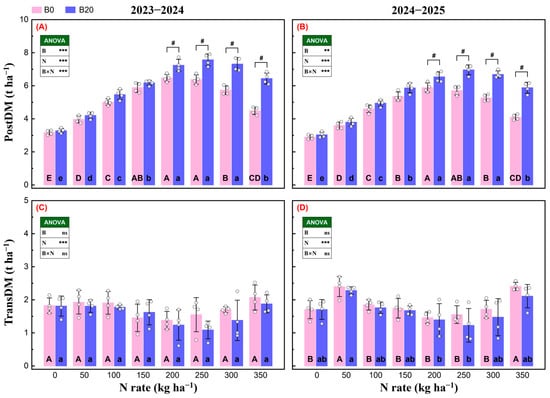
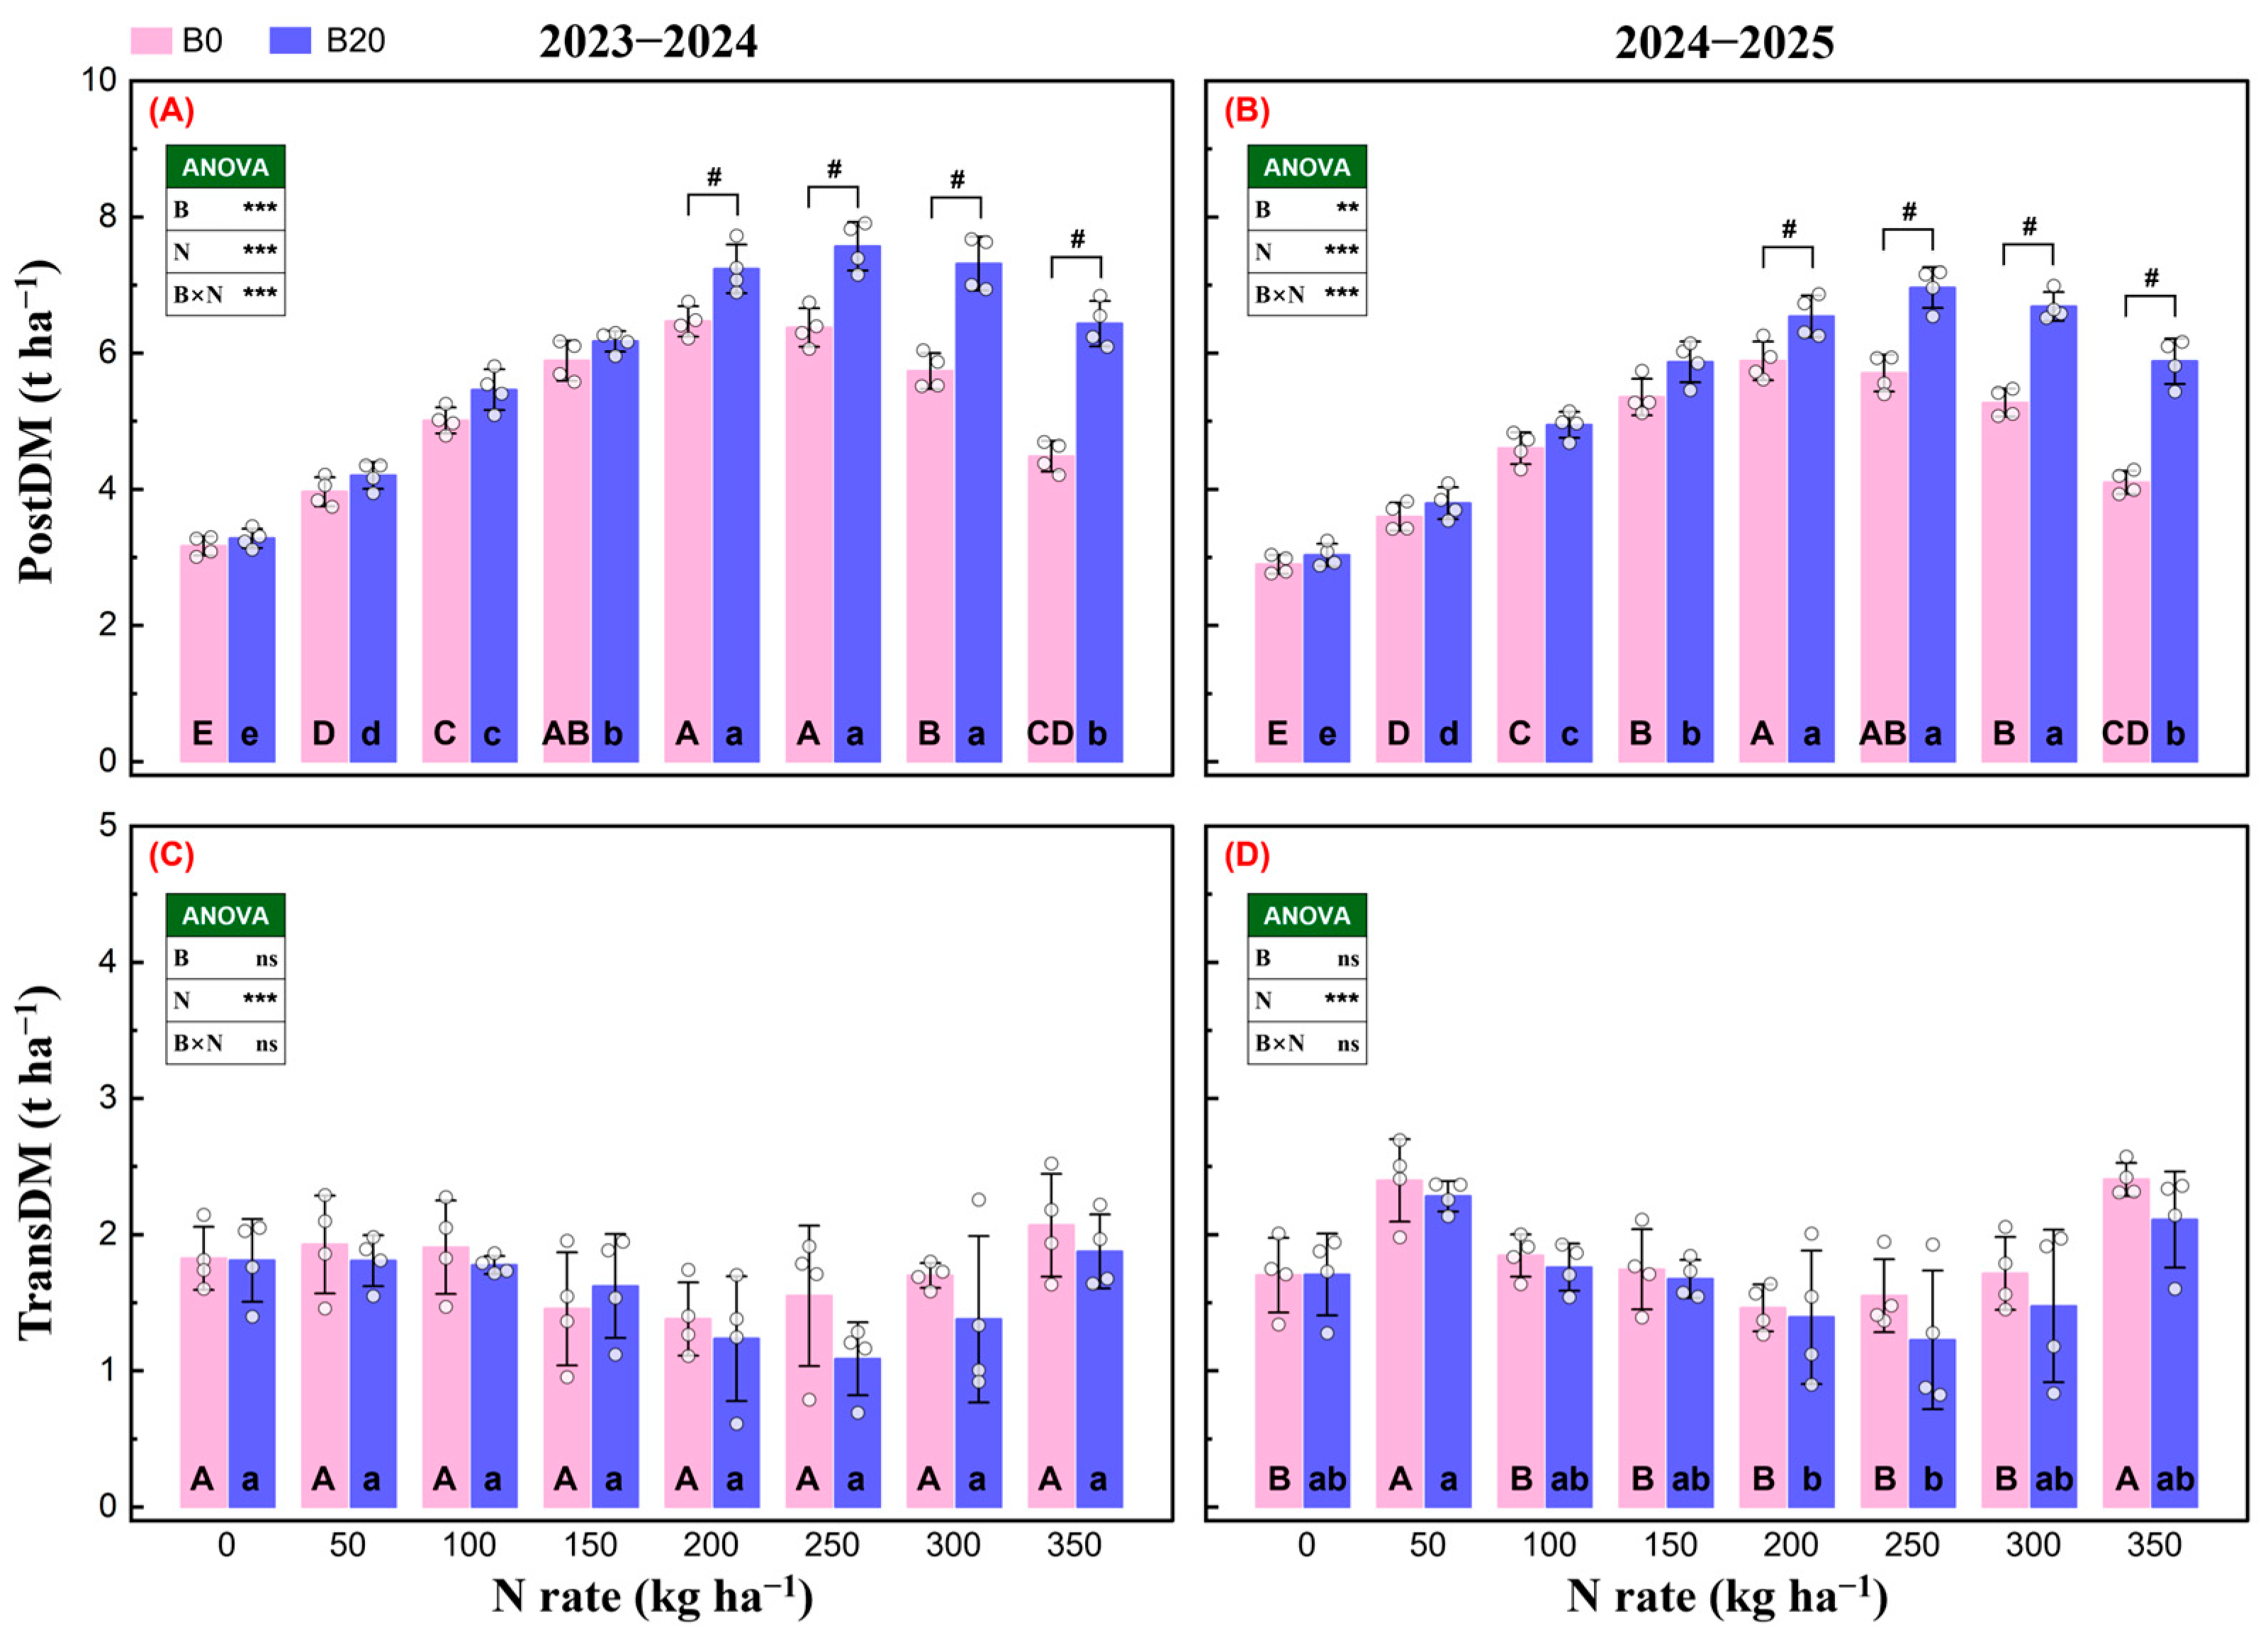
PostDM was significantly affected by biochar, the N rate, and their interaction in both seasons (Figure 3A,B). PostDM initially increased with the N rate but declined at the highest N rates, with a more pronounced decline under B0. It did not differ significantly between B0 and B20 at 0–150 kg N ha−1 but was significantly greater under B20 at 200–350 kg N ha−1. Relative to B0, B20 increased PostDM by 11.9–43.5% in 2023–2024 and by 11.0–43.4% in 2024–2025 across these higher N rates. In comparison, TransDM was affected by N rate but not by biochar or the B × N interaction in either season (Figure 3C,D), and no significant differences between B0 and B20 were detected at any individual N rate.
Figure 3.
Effects of N application rate and biochar on post-anthesis dry matter production and apparent pre-anthesis dry matter translocation in winter wheat during the 2023–2024 and 2024–2025 growing seasons. Panels (A,B) show post-anthesis dry matter production (PostDM) in 2023–2024 and 2024–2025, respectively, whereas panels (C,D) show apparent pre-anthesis dry matter translocation (TransDM) in the corresponding seasons. B0 and B20 represent biochar application rates of 0 and 20 t ha−1, respectively. Bars and error bars represent means ± standard deviations (n = 4), and open circles indicate individual plot observations. Within each biochar treatment, different uppercase letters for B0 and lowercase letters for B20 indicate significant differences among N rates according to Tukey’s HSD test (p < 0.05). The symbol # indicates a significant difference between B0 and B20 at the same N rate (p < 0.05). Insets show the significance of the main effects of biochar (B), N rate (N), and their interaction (B × N) based on split-plot ANOVA. ns, **, and *** indicate nonsignificance and significance at p < 0.01 and p < 0.001, respectively.
3.4. Post-Anthesis N Acquisition and Canopy Persistence
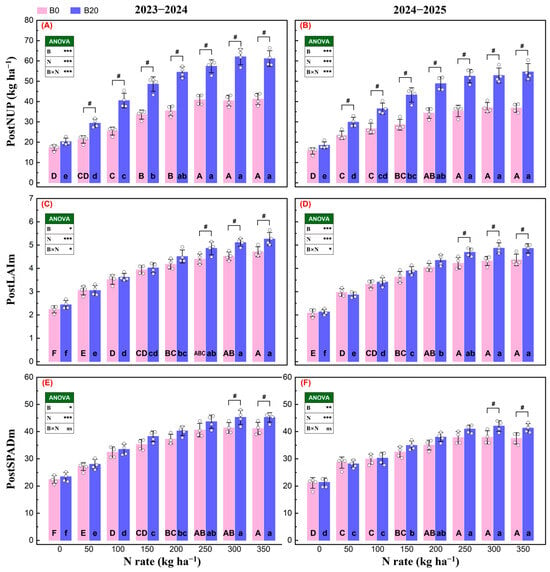
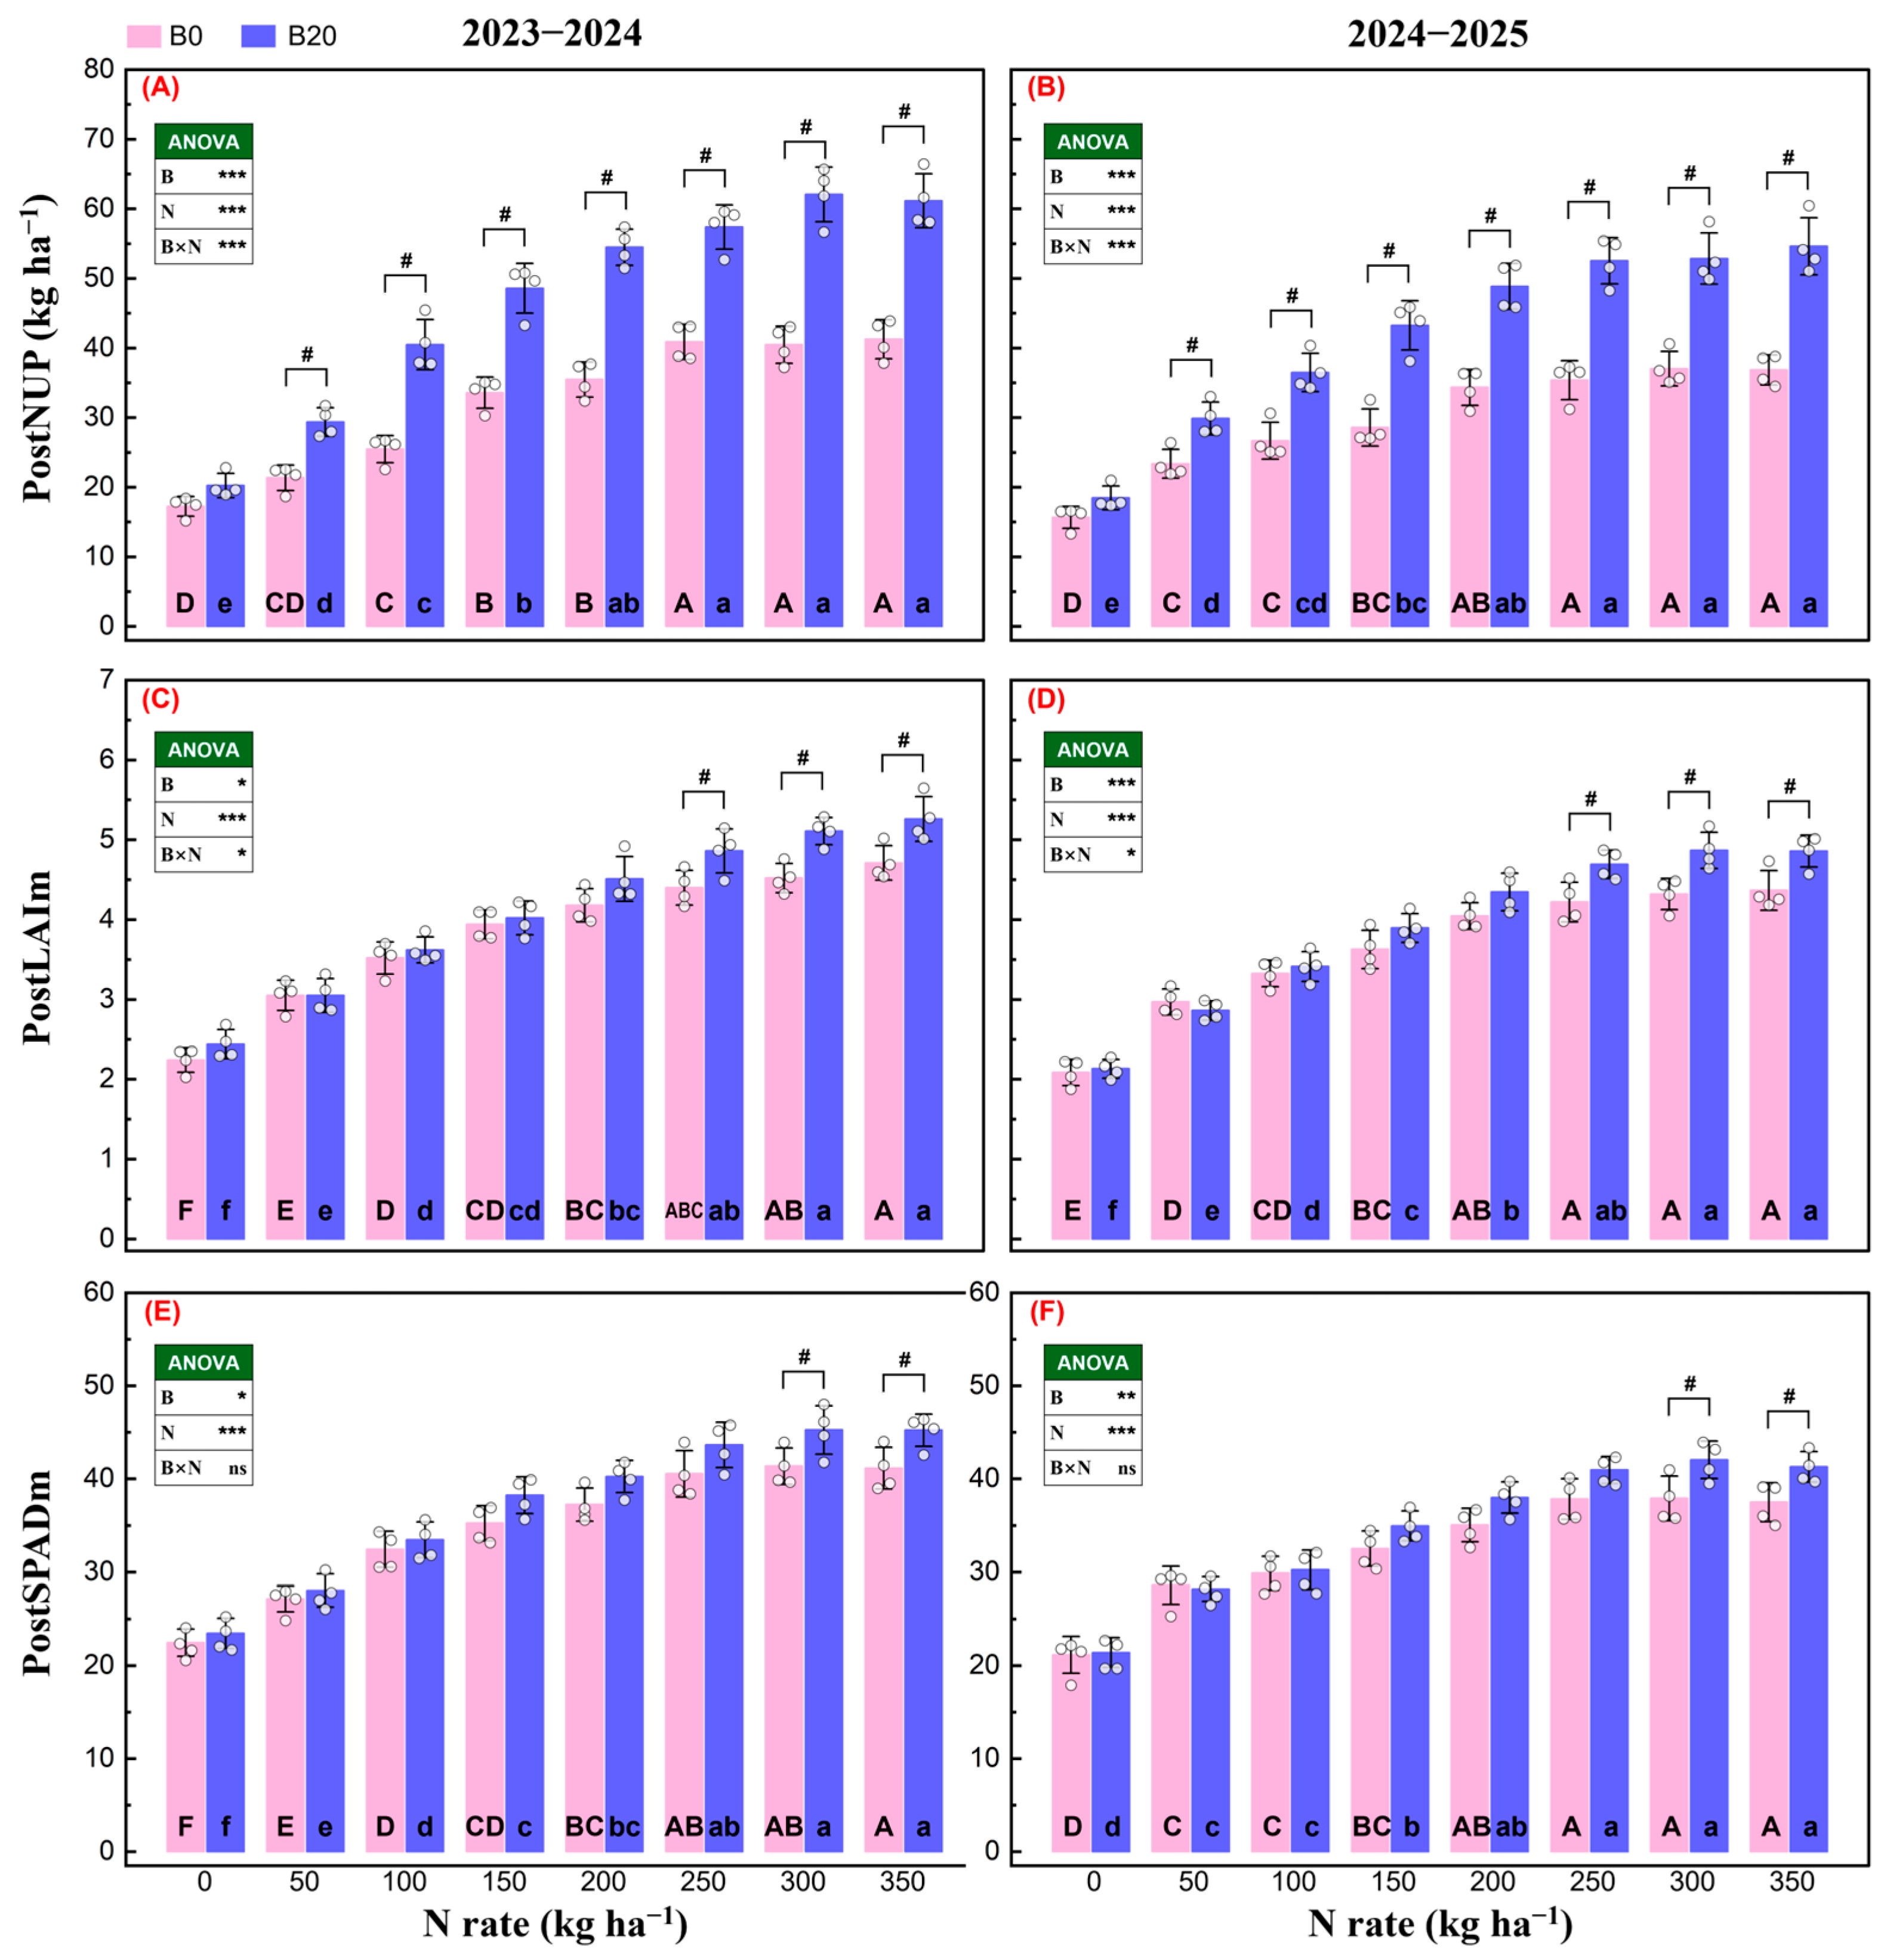
PostNUP was significantly affected by biochar, the N rate, and their interaction in both growing seasons (Figure 4A,B). PostNUP increased markedly with the N rate and generally approached a plateau at 250–350 kg N ha−1. At N0, PostNUP did not differ significantly between B0 and B20. At all fertilized N rates, however, B20 produced significantly greater PostNUP than B0. The difference between the two treatments generally widened as N supply increased, and PostNUP reached a substantially higher plateau under B20. Although B20 increased PostNUP at all fertilized N rates (50–350 kg N ha−1), significant yield advantages were detected only at 200–350 kg N ha−1.
Figure 4.
Effects of N application rate and biochar on post-anthesis N uptake and canopy persistence of winter wheat during the 2023–2024 and 2024–2025 growing seasons. Panels (A,B) show post-anthesis N uptake (PostNUP), panels (C,D) show mean post-anthesis leaf area index (PostLAIm), and panels (E,F) show mean post-anthesis SPAD value (PostSPADm) in 2023–2024 and 2024–2025, respectively. Bars and error bars represent means ± standard deviations (n = 4), and open circles indicate individual plot observations. Within each biochar treatment, different uppercase letters for B0 and lowercase letters for B20 indicate significant differences among N rates according to Tukey’s HSD test (p < 0.05). The symbol # indicates a significant difference between B0 and B20 at the same N rate (p < 0.05). Insets show the significance of the main effects of biochar (B), N rate (N), and their interaction (B × N) based on split-plot ANOVA. ns, *, **, and *** indicate nonsignificance and significance at p < 0.05, p < 0.01, and p < 0.001, respectively.
PostLAIm increased progressively with the N rate and was significantly affected by biochar, the N rate, and their interaction in both seasons (Figure 4C,D). The differences between B0 and B20 were relatively small at 0–200 kg N ha−1, whereas B20 maintained a significantly greater PostLAIm at 250–350 kg N ha−1 in both seasons.
PostSPADm also increased with the N rate before approaching a plateau at the higher N rates (Figure 4E,F). Biochar and the N rate significantly affected PostSPADm, whereas their interaction was nonsignificant in both seasons. No significant difference between B0 and B20 was detected at 0–250 kg N ha−1, but B20 maintained a significantly greater PostSPADm at 300 and 350 kg N ha−1 in both seasons.
3.5. Whole-Season N Uptake and N Use Efficiencies
The N rate significantly affected NUPA and NUPM in both growing seasons (Table 2). NUPA increased progressively with the N rate and generally approached a plateau at 250–350 kg N ha−1. However, neither the biochar main effect nor the B × N interaction was significant, and no significant differences in NUPA were detected between B0 and B20 at any individual N rate. In contrast, NUPM was significantly increased by biochar in both seasons. B20 produced significantly greater NUPM than B0 at 100–350 kg N ha−1 in 2023–2024 and at 150–350 kg N ha−1 in 2024–2025. At 350 kg N ha−1, B20 increased NUPM from 285.9 to 306.1 kg N ha−1 in the first season and from 272.3 to 294.4 kg N ha−1 in the second season. The B × N interaction was non-significant in 2023–2024 but significant in 2024–2025.
Table 2.
Effects of N rate and biochar on aboveground N uptake and N use efficiencies of winter wheat during the 2023–2024 and 2024–2025 growing seasons.
NUEG remained relatively stable at low-to-moderate N rates but declined as the N supply increased further, particularly under B0. The N rate significantly affected NUEG in both seasons, whereas the biochar effect was significant only in 2024–2025 and the B × N interaction only in 2023–2024. At 350 kg N ha−1, B20 maintained a significantly greater NUEG than B0, increasing it from 26.3 to 31.2 kg kg−1 in 2023–2024 and from 27.5 to 31.2 kg kg−1 in 2024–2025. A significant difference was also detected at 300 kg N ha−1 in the second season.
AEN, REN, and PFPN generally declined with an increasing N rate. Biochar significantly affected all three indices in 2023–2024, whereas its main effect in 2024–2025 was significant only for PFPN. The effects of biochar on AEN and REN were therefore less consistent between seasons. In contrast, B20 maintained significantly greater PFPN than B0 at 200–350 kg N ha−1 in both seasons. Across these N rates, B20 increased PFPN by 8.0–27.0% in 2023–2024 and by 8.1–22.4% in 2024–2025.
3.6. Soil Water Consumption and Water Use Efficiency
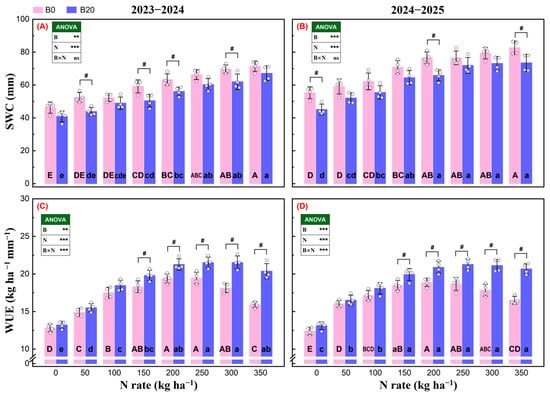
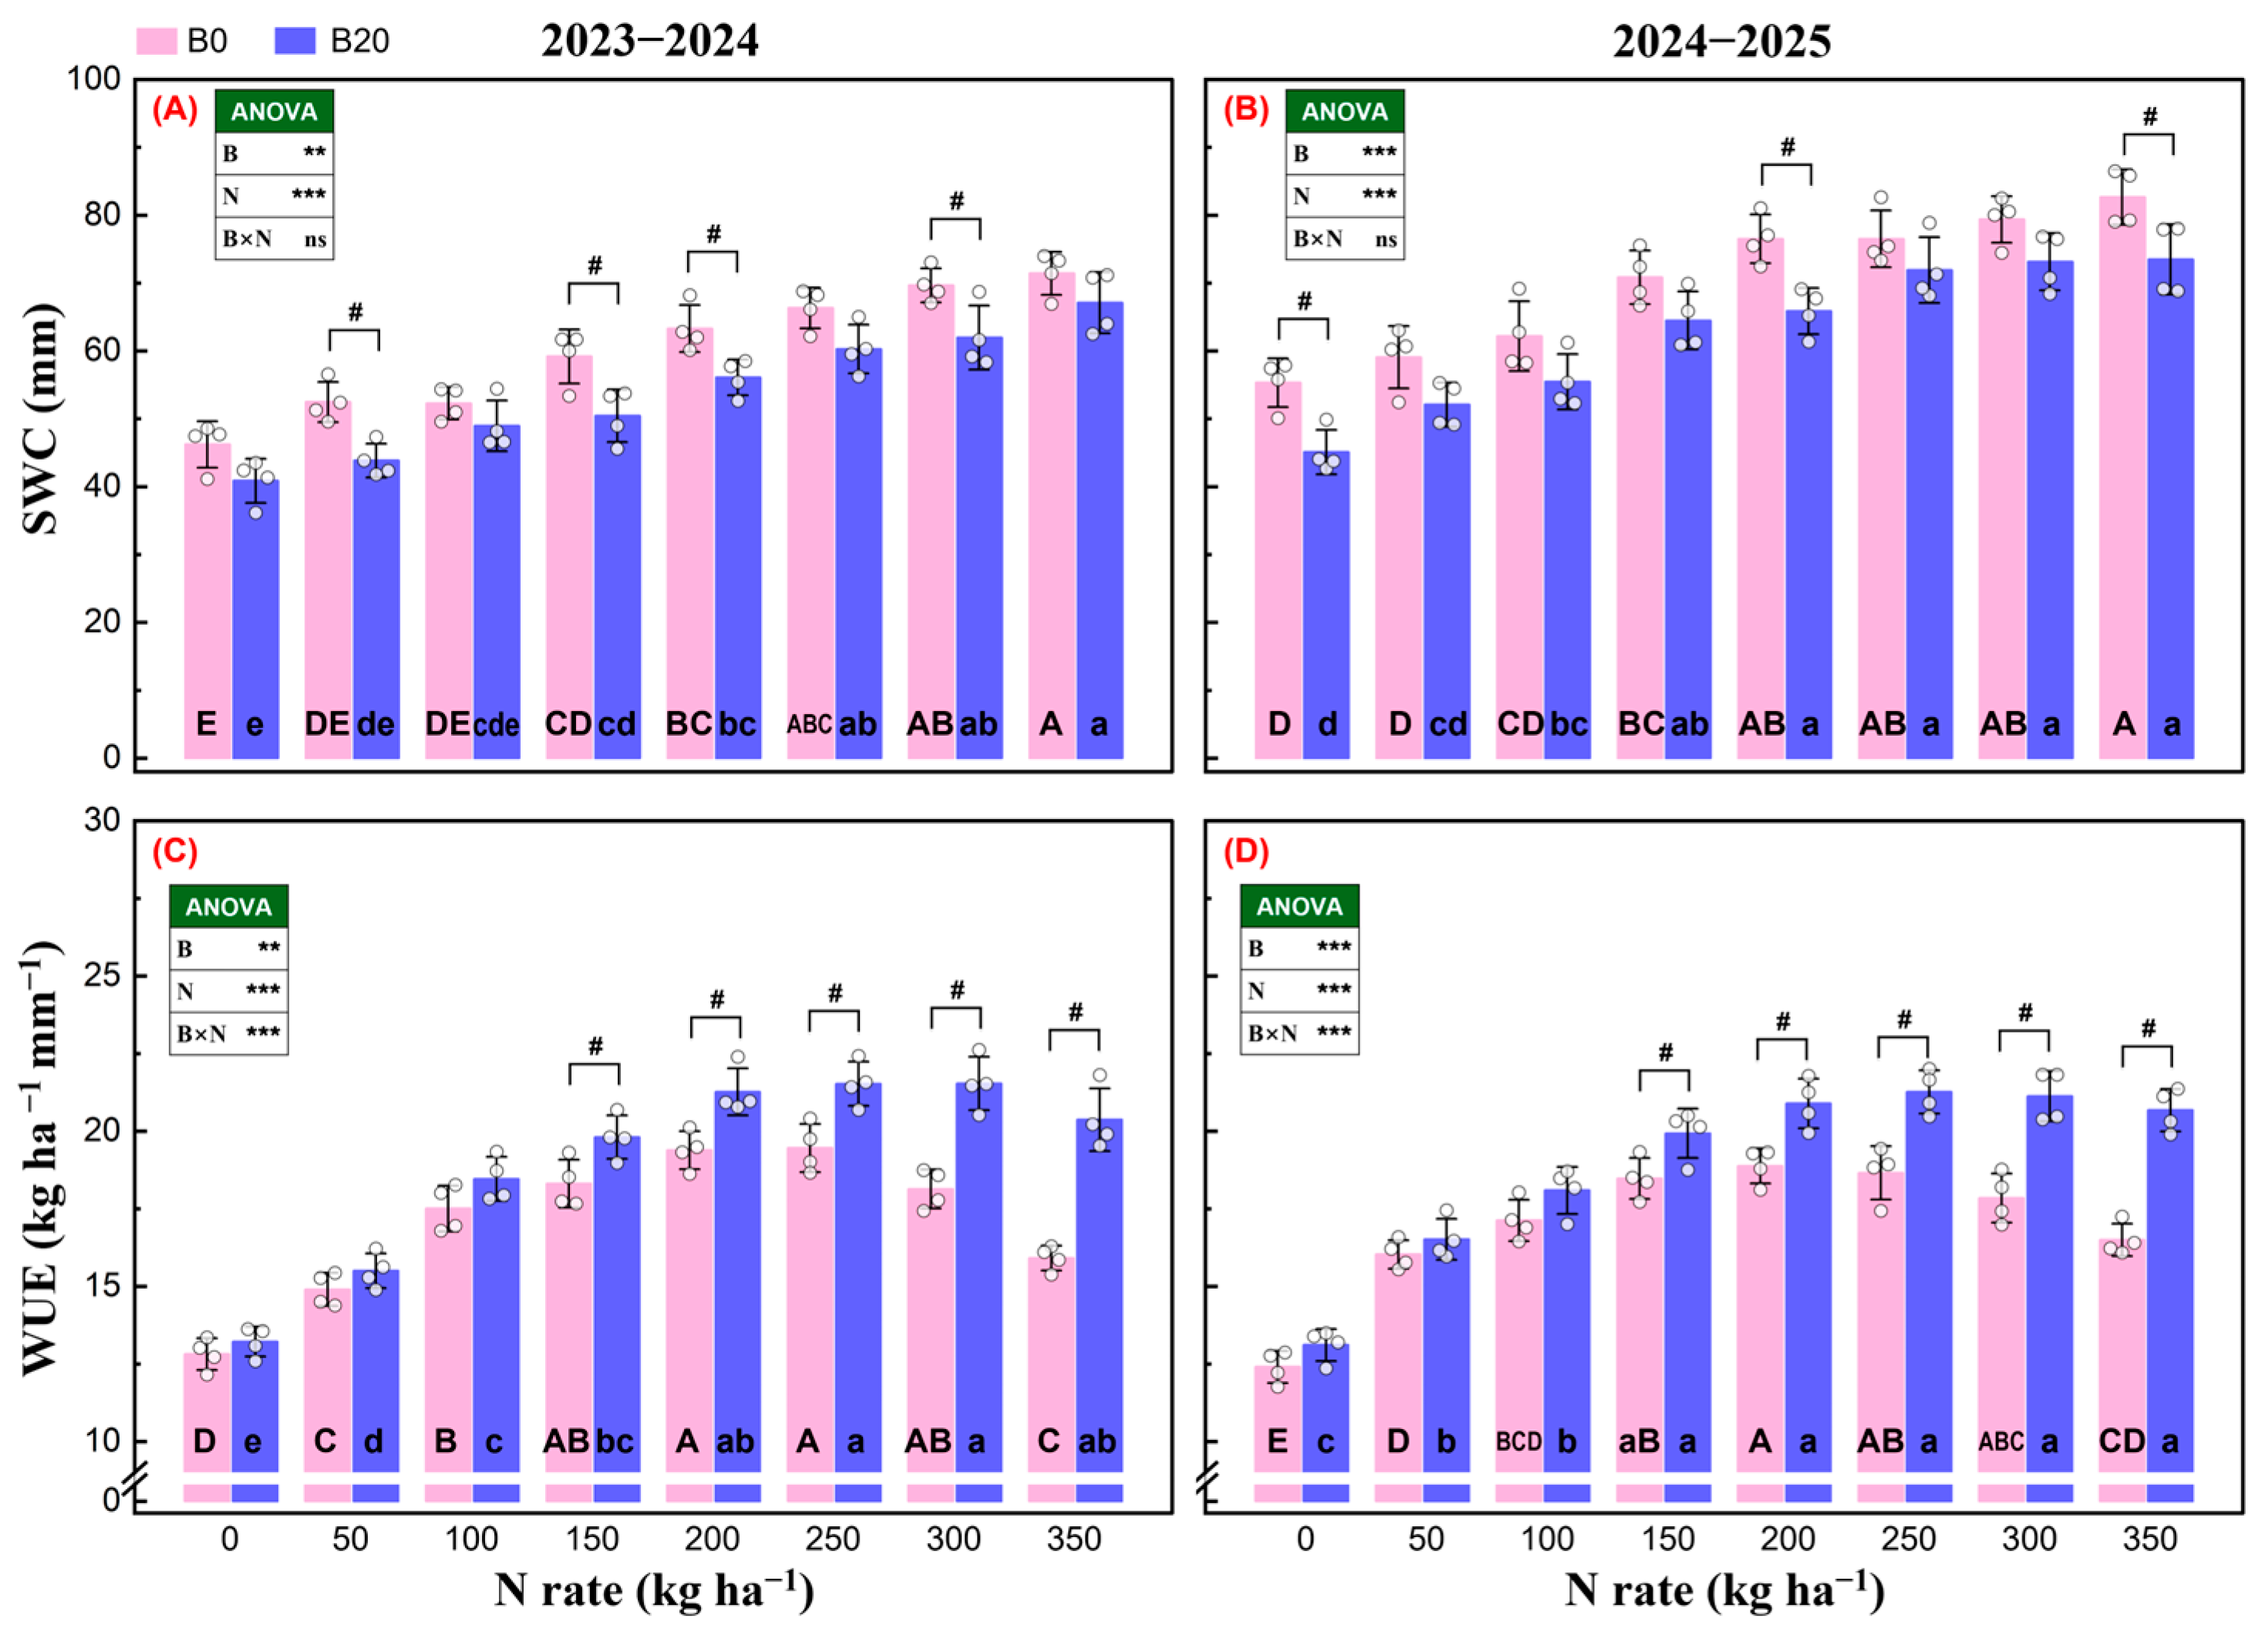
SWC was significantly affected by biochar and the N rate in both growing seasons, whereas the B × N interaction was nonsignificant (Figure 5A,B). SWC generally increased with the N rate and was lower under B20 than under B0, with significant differences detected at several individual N rates in each season.
Figure 5.
Effects of N rate and biochar on soil water consumption and water-use efficiency of winter wheat during the 2023–2024 and 2024–2025 growing seasons. Panels (A,B) show growing-season soil water consumption (SWC), whereas panels (C,D) show water use efficiency (WUE) in 2023–2024 and 2024–2025, respectively. Bars and error bars represent means ± standard deviations (n = 4), and open circles indicate individual plot observations. Within each biochar treatment, different uppercase letters for B0 and lowercase letters for B20 indicate significant differences among N rates according to Tukey’s HSD test (p < 0.05). The symbol # indicates a significant difference between B0 and B20 at the same N rate (p < 0.05). Insets show the significance of the main effects of biochar (B), N rate (N), and their interaction (B × N) based on split-plot ANOVA. ns, **, and *** indicate nonsignificance and significance at p < 0.01 and p < 0.001, respectively.
WUE was significantly affected by biochar, the N rate, and their interaction in both seasons (Figure 5C,D). Under B0, WUE initially increased with the N rate, reached its highest level at approximately 200–250 kg N ha−1, and subsequently declined as the N supply increased further. Under B20, WUE also increased with the N rate but remained relatively high over a wider N range, particularly at 200–350 kg N ha−1. No significant differences between B0 and B20 were detected at 0–100 kg N ha−1, whereas B20 produced a significantly greater WUE at 150–350 kg N ha−1 in both seasons.
3.7. Integrated Drivers and Pathways of Grain Yield Formation
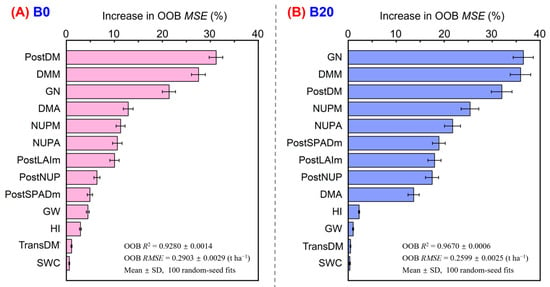
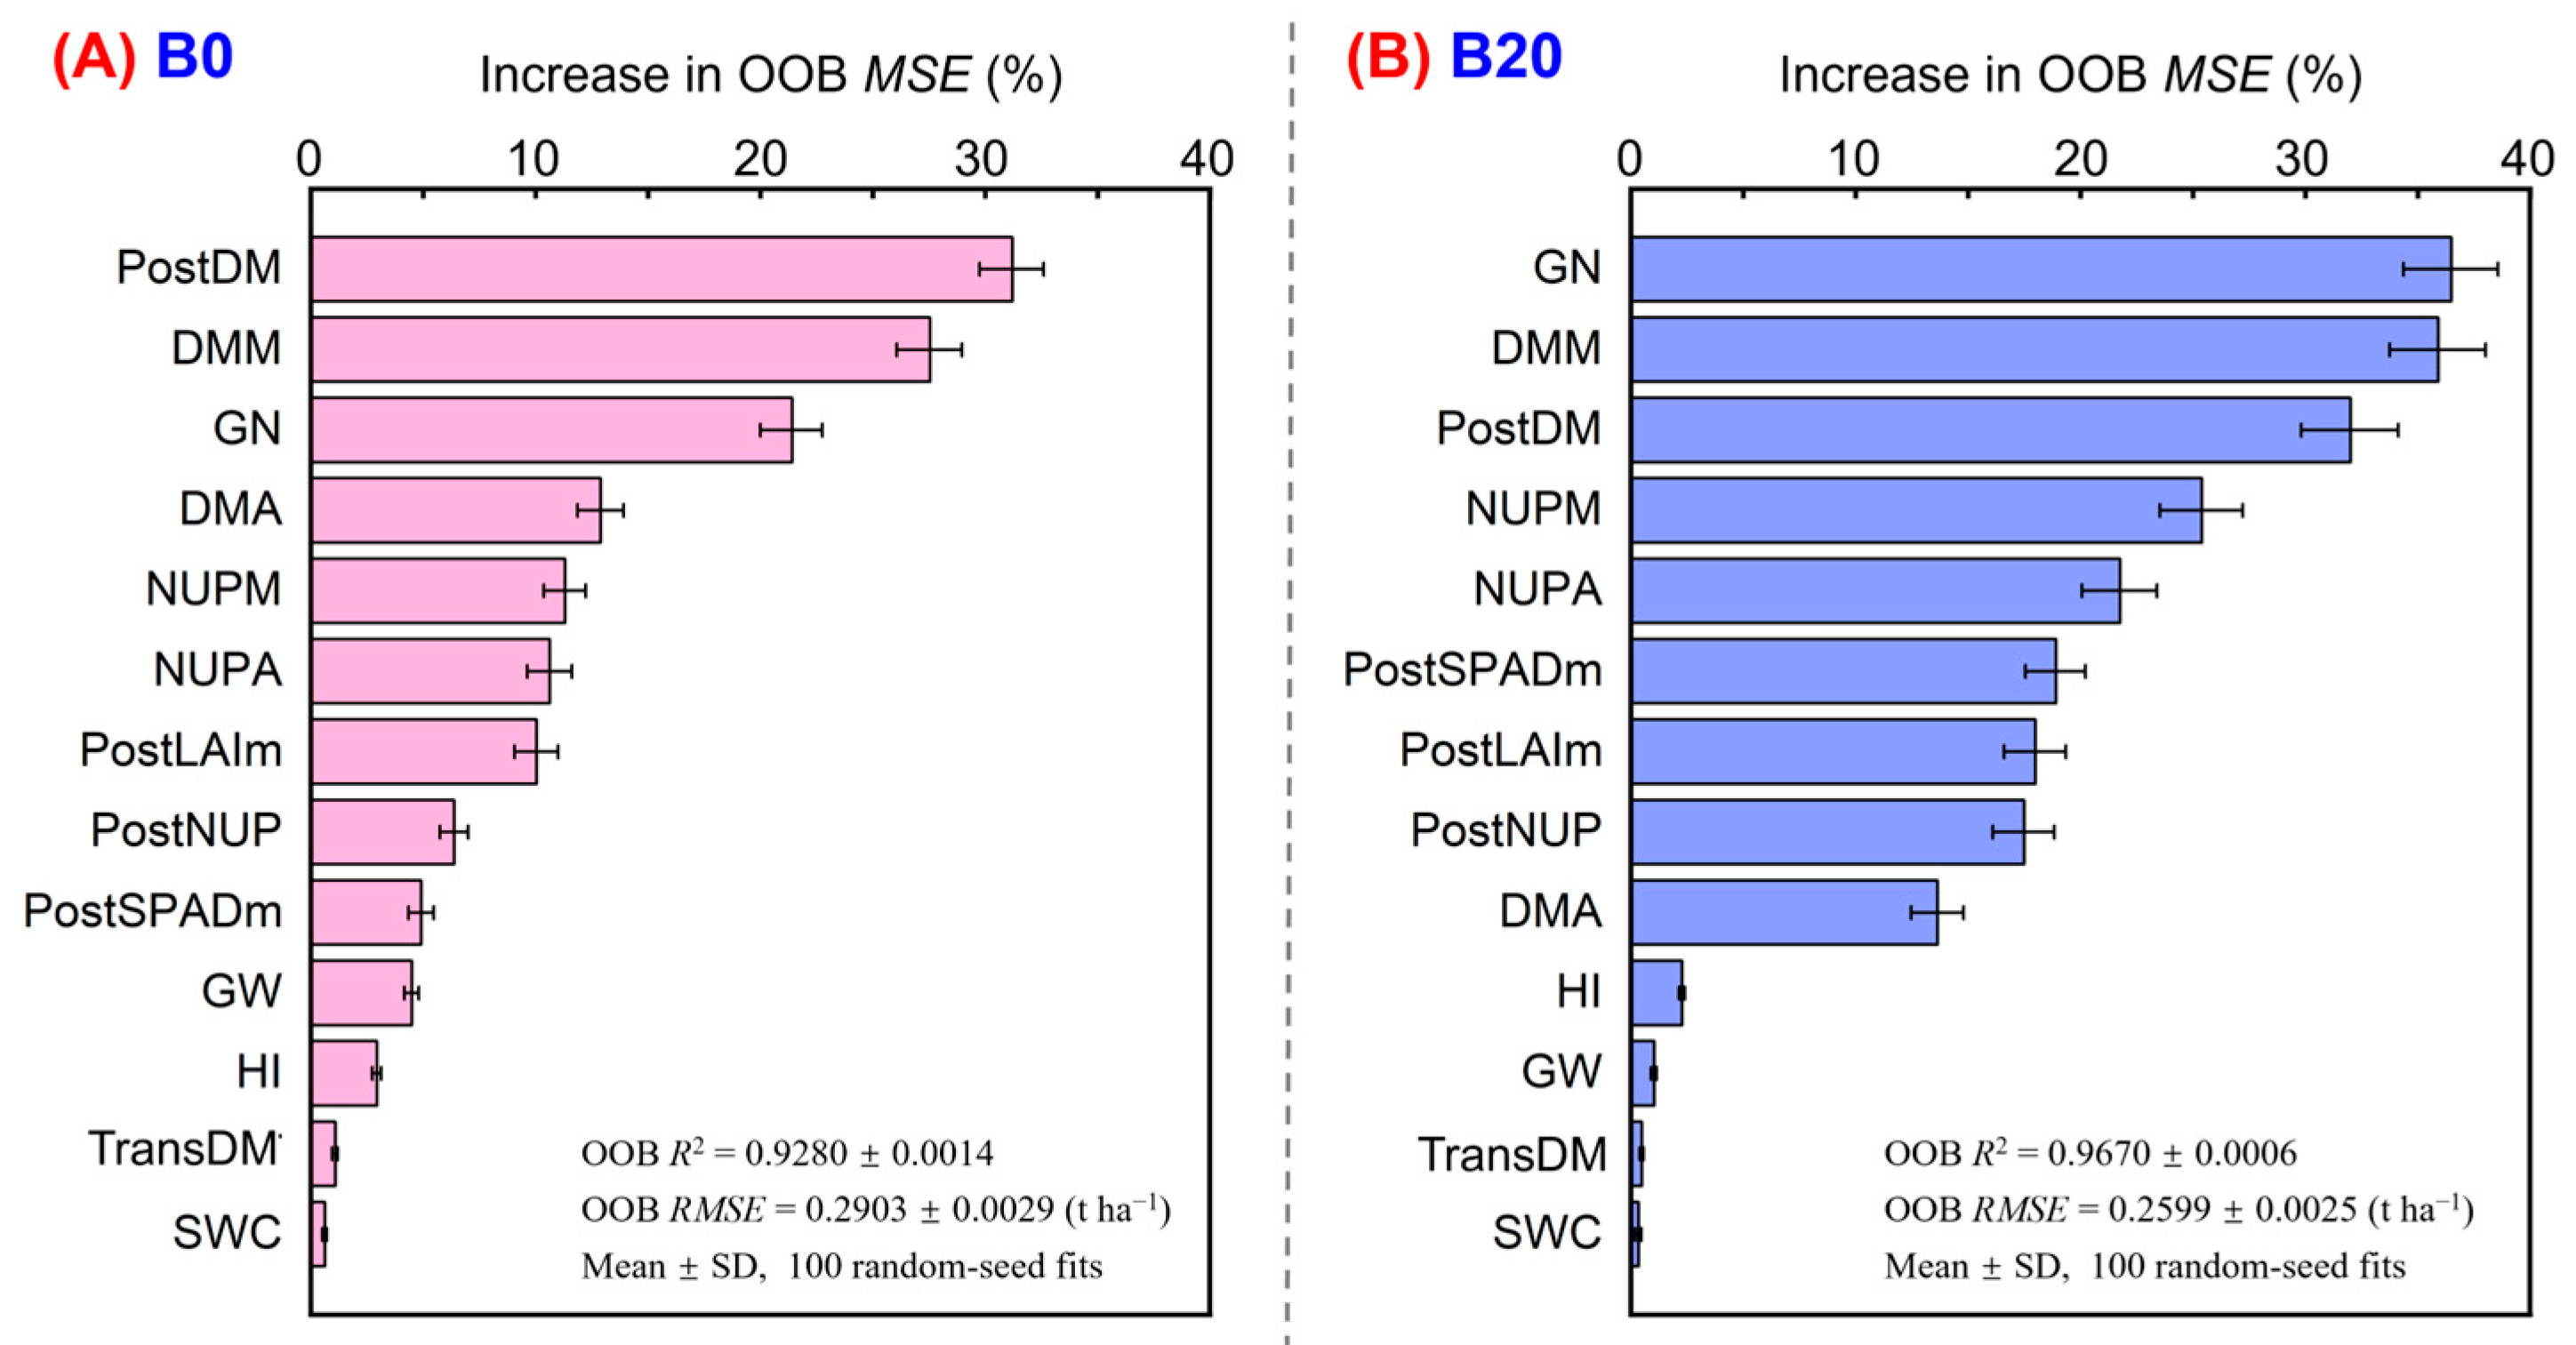
The RF models showed a high and stable predictive performance under both biochar treatments (Figure 6). PostDM, DMM, and GN were the three most important predictors under B0, with PostDM ranking first (Figure 6A). Under B20, GN ranked first, followed by DMM and PostDM. NUPM, NUPA, PostNUP, PostLAIm, and PostSPADm also occupied higher positions in the variable-importance ranking under B20 (Figure 6B). The importance assigned to GN partly reflects its mathematical dependence on yield and therefore does not quantify an independent contribution to yield prediction.
Figure 6.
Random forest permutation importance of variables predicting winter wheat grain yield under B0 (A) and B20 (B). Models were fitted separately using 64 plot-level observations per biochar treatment pooled across both growing seasons and all N rates, including N0. Bars and error bars represent means ± standard deviations across 100 fits with different random seeds and 1000 trees per fit. Importance was calculated as the unscaled increase in OOB MSE following predictor permutation; values are displayed in units of 10−2. OOB R2 and RMSE are summarized across the same fits. Standard deviations describe algorithmic variability rather than sampling uncertainty. PostDM, post-anthesis dry matter production; DMM and DMA, dry matter accumulation at maturity and anthesis; GN, estimated grain number; NUPM and NUPA, aboveground N accumulation at maturity and anthesis; PostNUP, post-anthesis N accumulation; PostLAIm, mean post-anthesis leaf area index; PostSPADm, mean post-anthesis flag-leaf SPAD value; GW, grain weight; HI, harvest index; TransDM, apparent pre-anthesis dry matter translocation; SWC, growing-season soil water consumption.
Leave-one-block-out validation showed a retained predictive performance after predictor exclusion (Table S2). Removing GN, HI, TransDM, and PostDM reduced R2 from 0.919 to 0.875 under B0 and from 0.958 to 0.946 under B20. The further exclusion of DMM yielded R2 values of 0.851 and 0.936, with RMSE increasing from 0.308 to 0.418 and from 0.292 to 0.363 t ha−1, respectively. Whole-block bootstrap 95% confidence intervals for held-out PostDM importance were positive in both original models (Table S3). Thus, prediction was not wholly dependent on the excluded variables, although their inclusion improved accuracy. These results support retained predictive performance, while importance rankings remain descriptive because correlated predictors share predictive information.
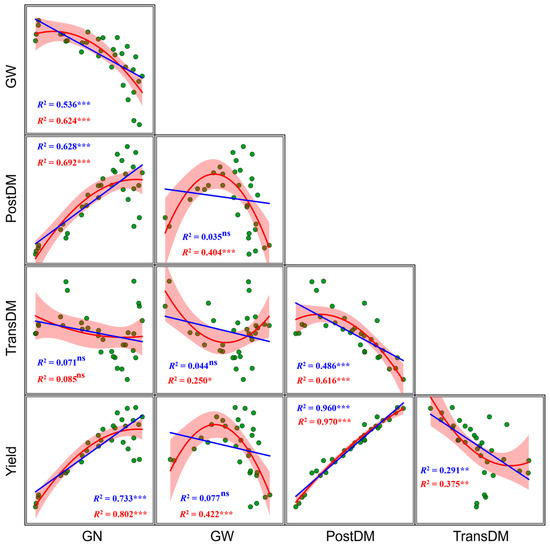
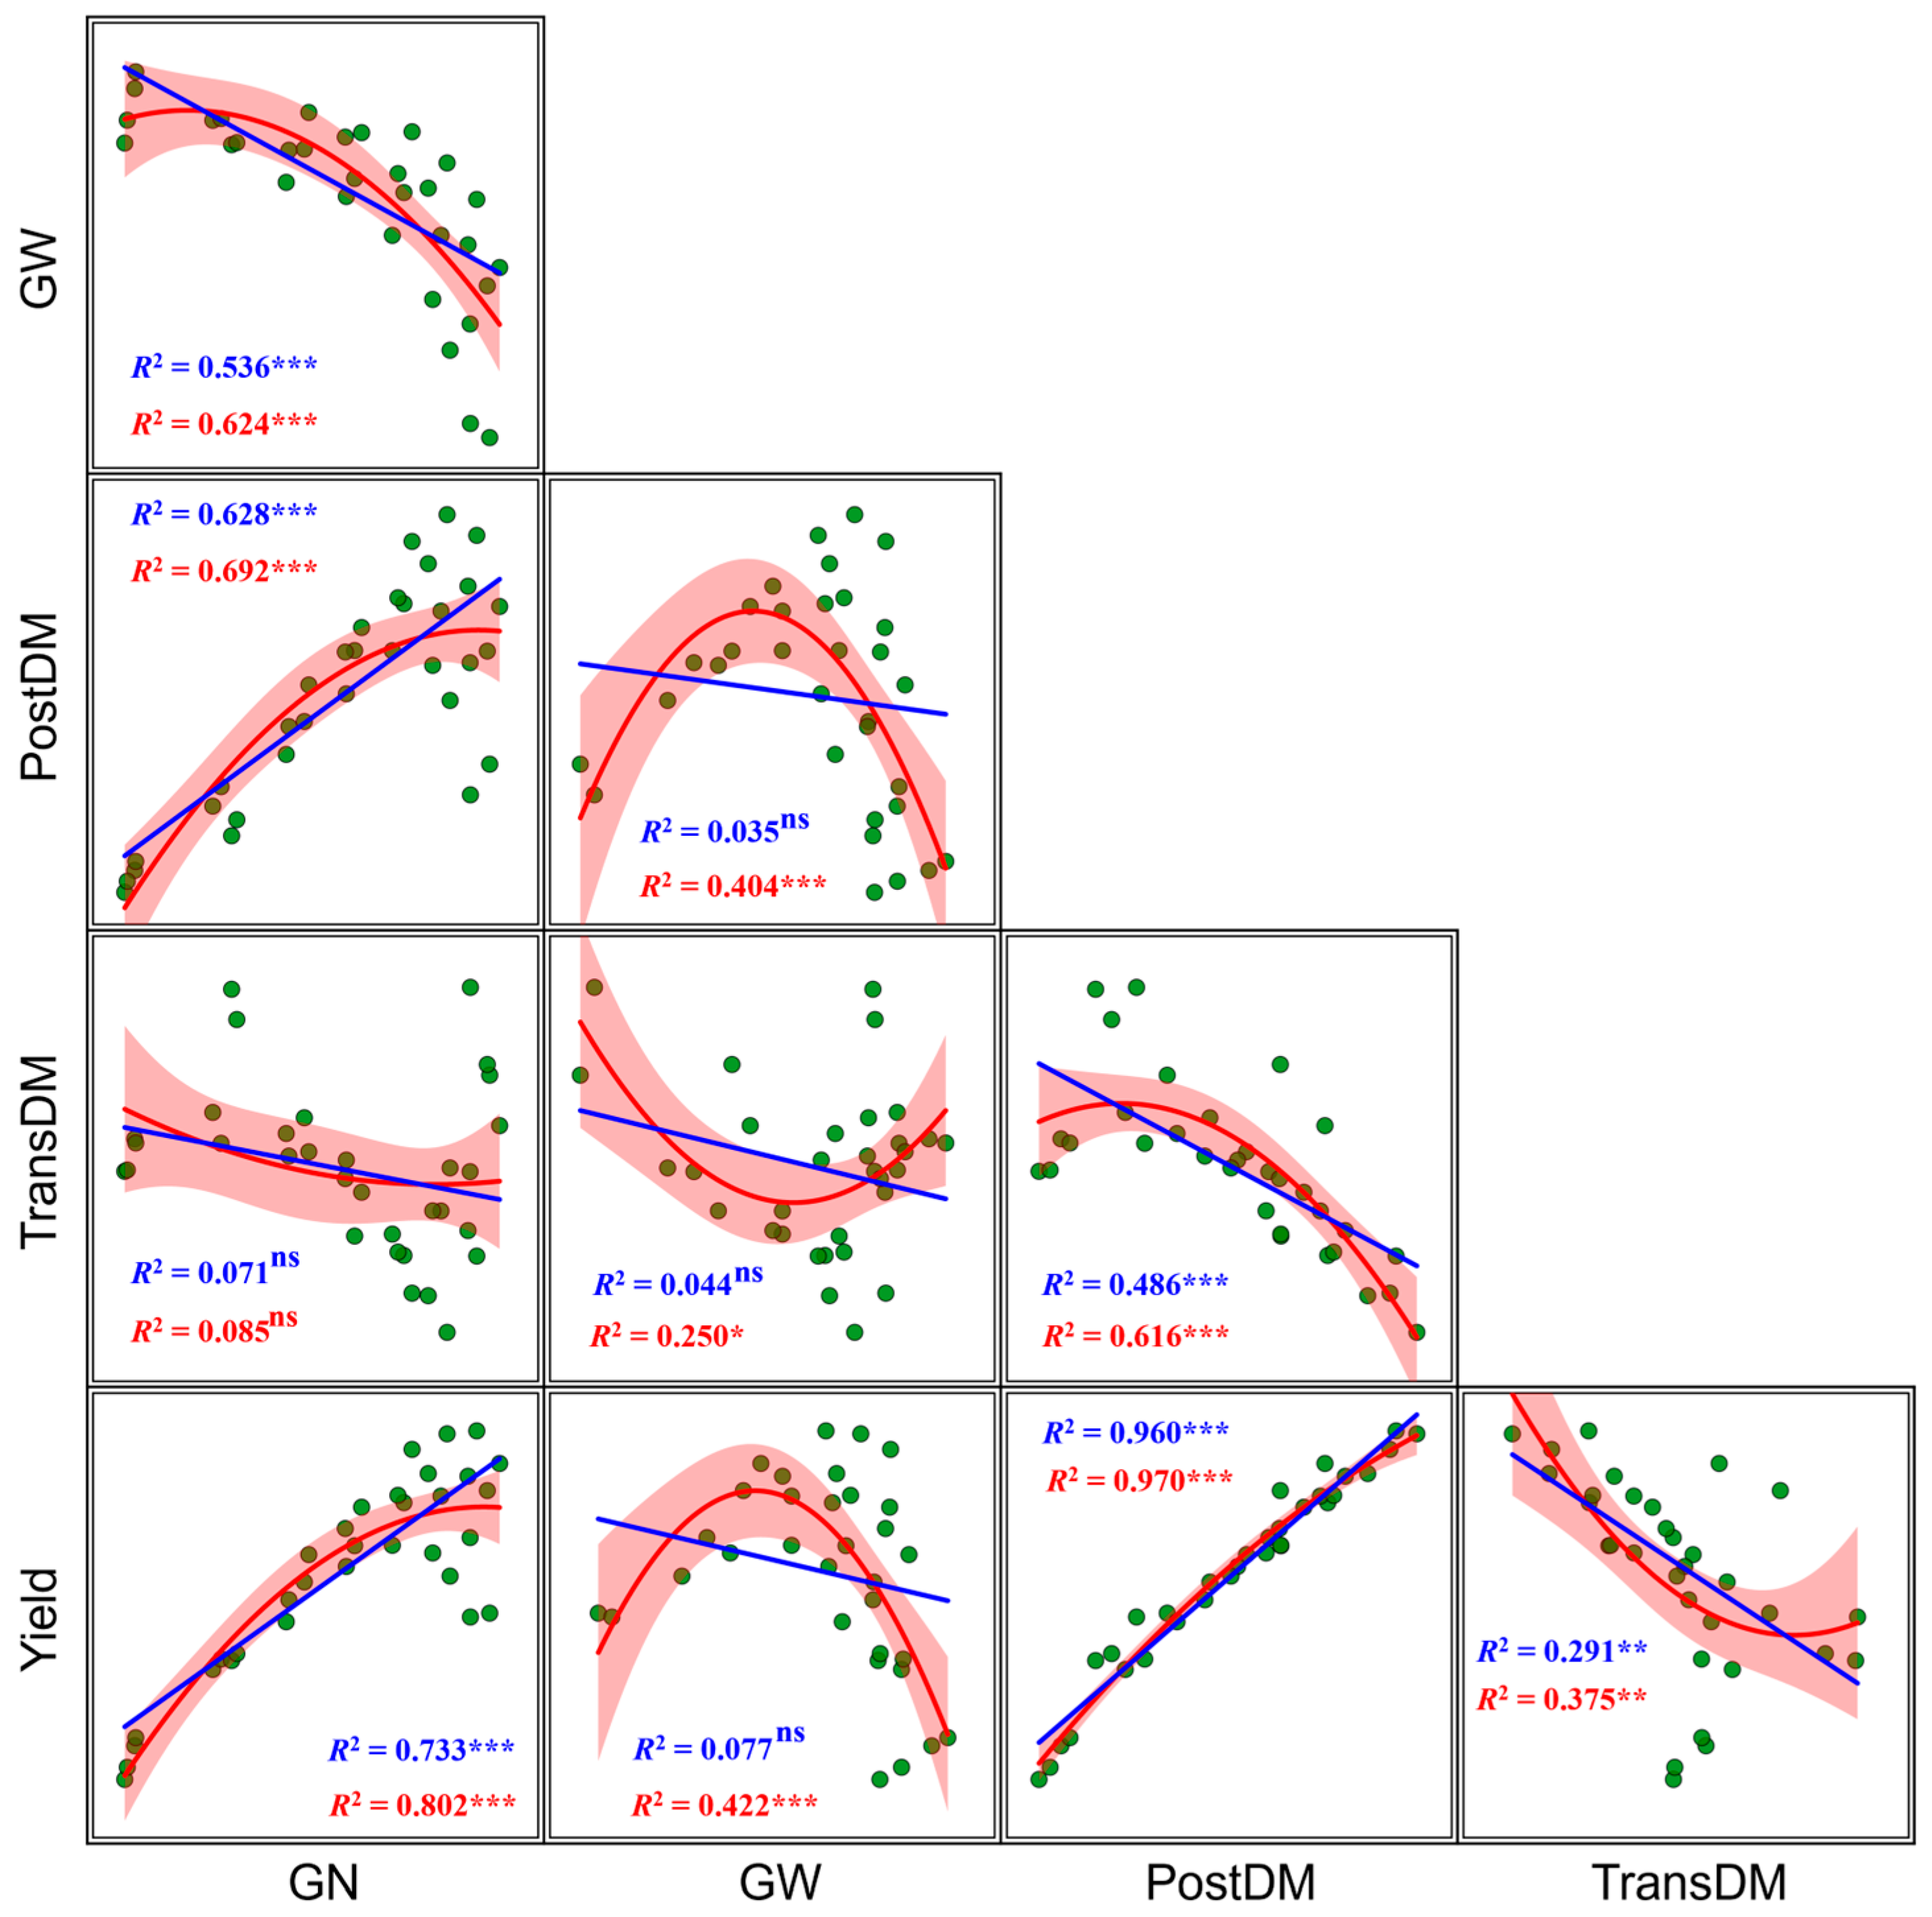
Pairwise regressions revealed both linear and nonlinear relationships among sink capacity, grain filling, and dry matter supply (Figure 7). GW decreased with increasing GN, with the linear and quadratic models explaining 53.6% and 62.4% of its variation, respectively. In contrast, PostDM increased with GN before approaching a plateau, and the corresponding models explained 62.8% and 69.2% of its variation. Yield was strongly associated with both GN and PostDM. The linear and quadratic relationships between GN and yield explained 73.3% and 80.2% of yield variation, respectively. The linear relationship between GW and yield was nonsignificant (R2 = 0.077), whereas the quadratic model explained 42.2% of yield variation. The strongest association was observed between PostDM and yield, for which the linear and quadratic models explained 96.0% and 97.0% of yield variation, respectively. TransDM was not significantly related to GN. Its quadratic relationship with GW explained 25.0% of the variation, while its linear and quadratic relationships with PostDM explained 48.6% and 61.6%, respectively. The corresponding relationships between TransDM and yield explained 29.1% and 37.5% of yield variation.
Figure 7.
Pairwise linear and quadratic relationships among grain number, grain weight, post-anthesis dry matter production, pre-anthesis dry matter translocation, and grain yield across biochar and N treatments. Each point represents the mean of a biochar × N rate combination in one growing season (n = 32). Blue lines indicate linear regressions, whereas red curves and shaded bands indicate quadratic regressions and their 95% confidence intervals, respectively. Blue and red R2 values correspond to the linear and quadratic models. ns, *, **, and *** indicate nonsignificance and significance at p < 0.05, p < 0.01, and p < 0.001, respectively. GN, grain number; GW, grain weight; PostDM, post-anthesis dry matter production; TransDM, apparent translocated dry matter.
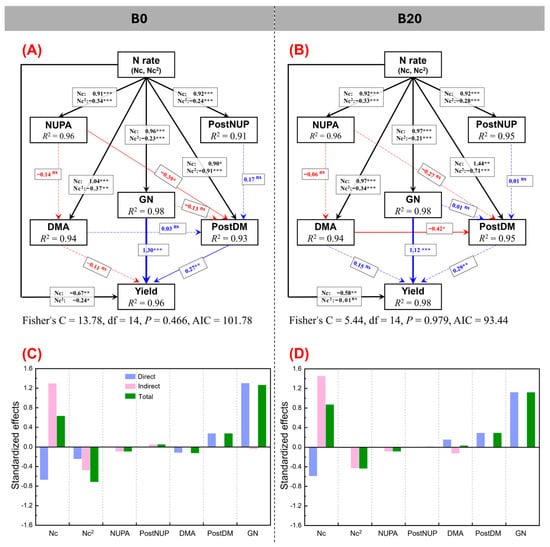
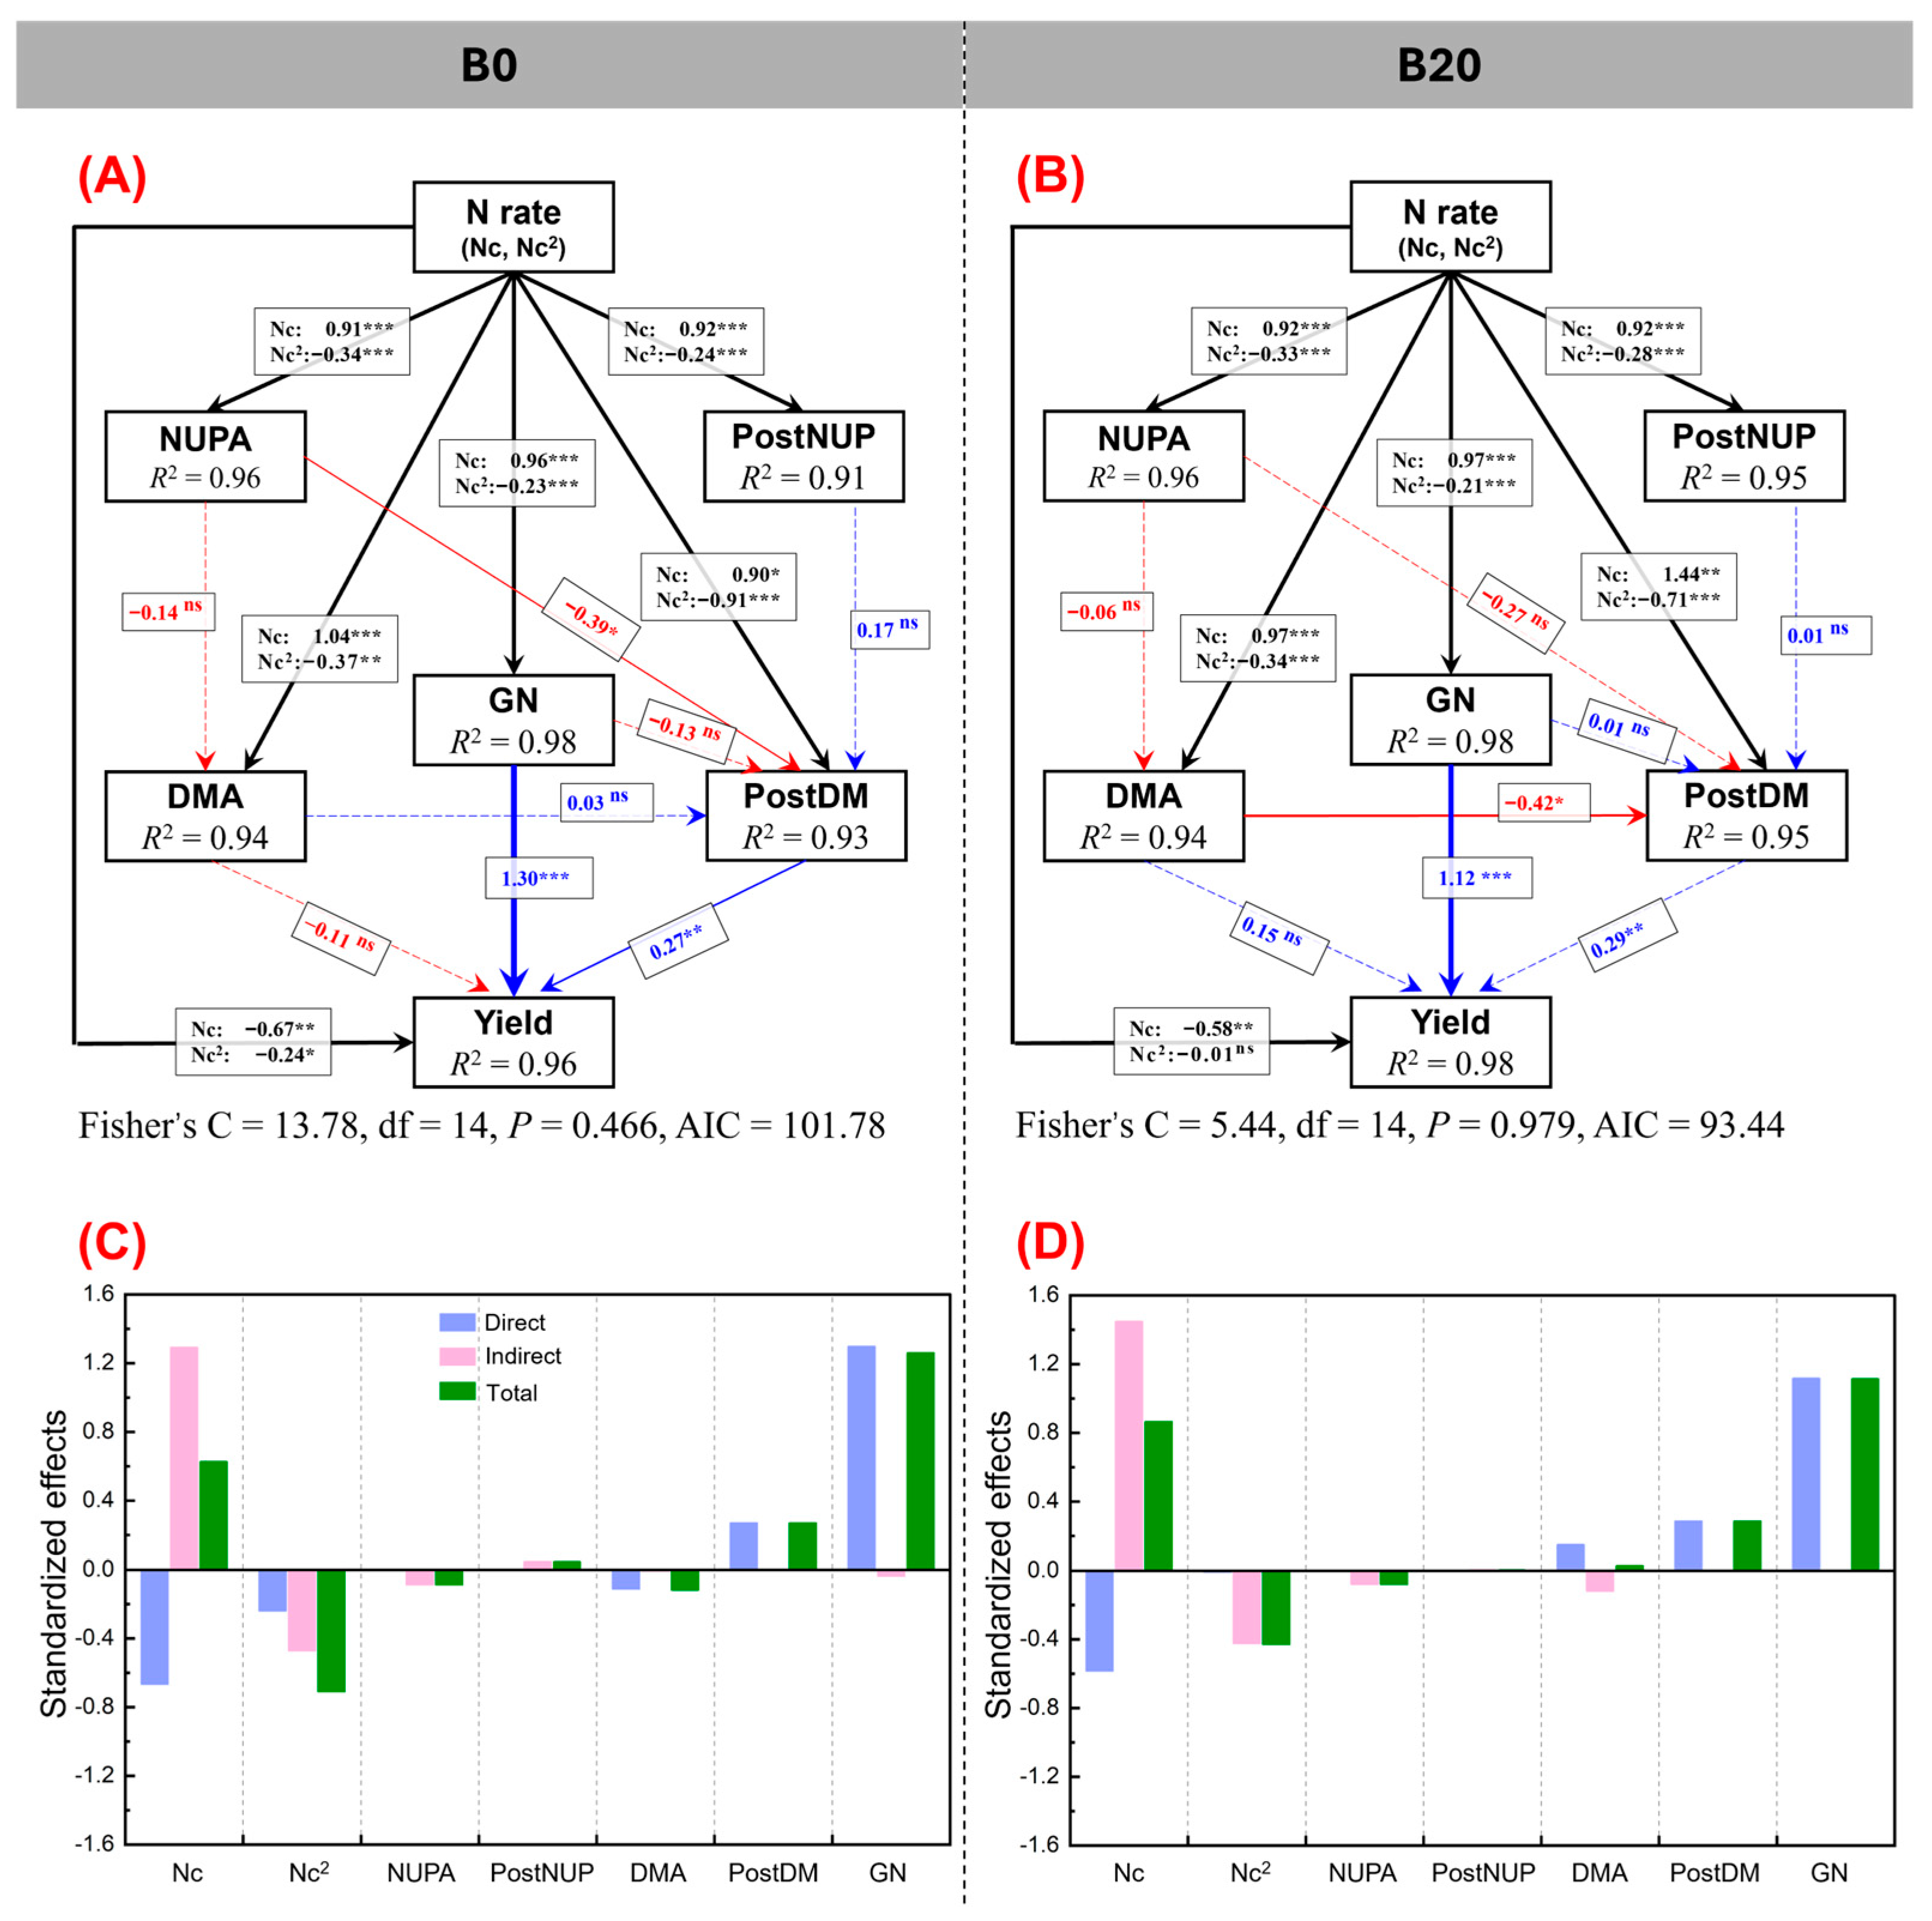
The PSEM showed the significant linear and quadratic effects of the N rate on N acquisition, biomass production, and sink establishment under both biochar treatments (Figure 8A,B). Under both B0 and B20, all selected variables showed positive linear but negative quadratic responses to the N rate, with the strongest positive Nc effect occurring for PostDM under B20. GN had the largest positive fitted coefficient in the yield equation under B0 and B20 (β = 1.30 and 1.12, respectively), while the corresponding coefficients for PostDM were 0.27 and 0.29. Because GN was derived from yield and GW, its fitted coefficients and model-derived direct, indirect, and total effects were interpreted descriptively rather than as independent causal effects. The conditional direct effects of Nc/Nc2 on yield were −0.67/−0.24 under B0 and −0.58/−0.01 under B20, with the quadratic direct effect being nonsignificant under B20 (Figure 8C,D). Nevertheless, the total effect of Nc remained positive and was numerically greater under B20 than under B0 (0.86 vs. 0.63), whereas the negative total effect of Nc2 was smaller under B20 (−0.43 vs. −0.71). The total effects of GN were 1.26 and 1.11 under B0 and B20, respectively, while those of PostDM were 0.27 and 0.29.
Figure 8.
Piecewise structural equation models describing the effects of N rate on grain yield formation under B0 (A) and B20 (B), and the corresponding standardized direct, indirect, and total effects on yield under B0 (C) and B20 (D). The models were fitted separately for each biochar treatment using plot-level observations from both growing seasons, with season included as a fixed effect and block nested within season as a random effect. Values adjacent to arrows are standardized path coefficients. Blue and red arrows indicate positive and negative paths, respectively; solid and dashed arrows indicate significant and nonsignificant paths, respectively. Black arrows represent the linear and quadratic effects of N rate. For each N-rate path, the upper and lower coefficients correspond to Nc and Nc2, respectively, where Nc is the centered N rate. All joint Wald tests for Nc + Nc2 were significant at p < 0.001. The R2 values within boxes indicate the variation explained by the component models. Panels (C,D) present the standardized direct, indirect, and total effects of each variable on yield. Model-fit statistics are presented below panels (A,B). ns, *, **, and *** indicate nonsignificance and significance at p < 0.05, p < 0.01, and p < 0.001, respectively. NUPA, aboveground N uptake at anthesis; PostNUP, post-anthesis N uptake; DMA, dry matter accumulation at anthesis; GN, grain number; PostDM, post-anthesis dry matter production.
Removing GN reduced the marginal R2 of the yield models from 0.962 to 0.932 under B0 and from 0.980 to 0.957 under B20. The further exclusion of PostDM yielded R2 values of 0.927 and 0.953, respectively (Table S4). In models excluding GN, the standardized PostDM–yield coefficients were 0.251 (block-bootstrap 95% CI, 0.058–0.496) under B0 and 0.263 (0.008–0.546) under B20. These coefficients remained positive in all eight leave-block refits, although p < 0.05 was retained in only four refits under B0 and five under B20 (Table S5). The positive association was therefore directionally consistent, but its statistical significance was sensitive to block removal. Predictor exclusion reduced collinearity, although substantial interdependence remained; path coefficients should consequently be interpreted as conditional associations (Tables S4–S6).
3.8. N-Dependent Patterns of Grain Number and Post-Anthesis Dry Matter Accumulation
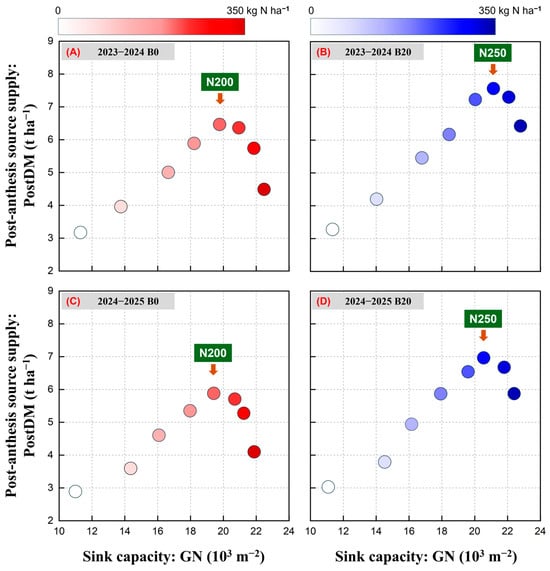
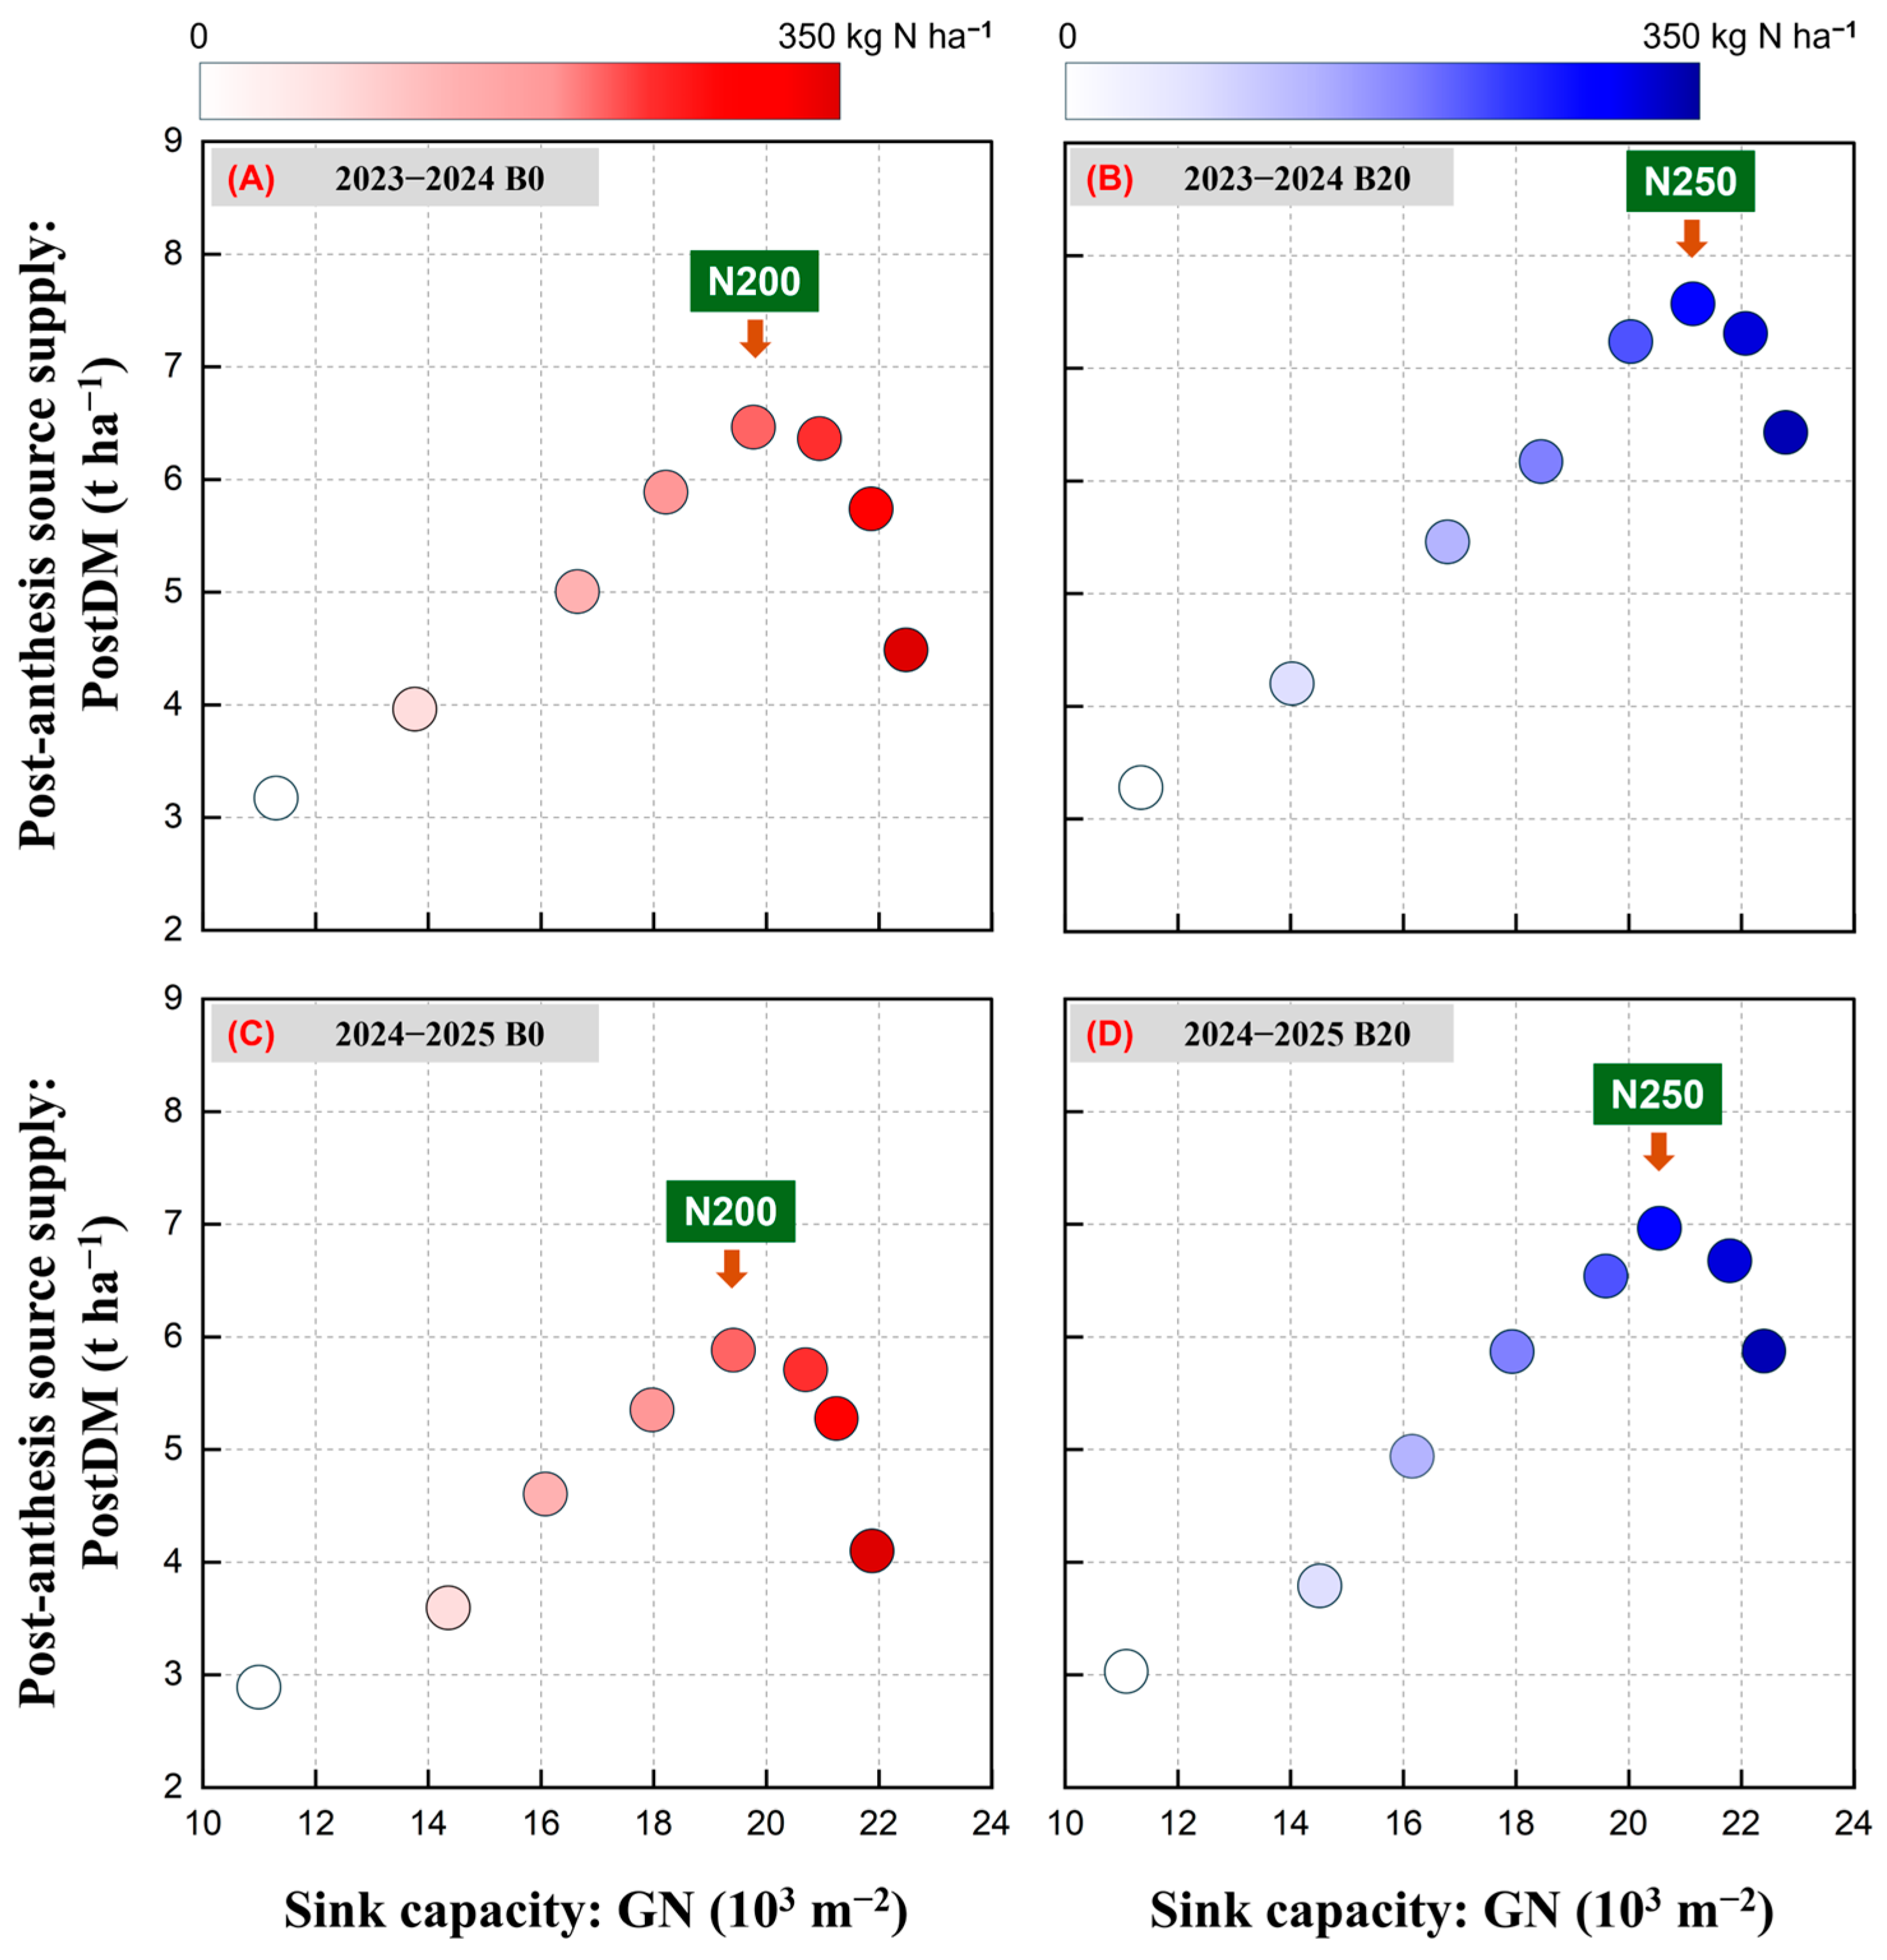
In both seasons, GN and PostDM treatment means increased concurrently from N0 to N200 under B0 (Figure 9A,C). At N200, the highest observed mean PostDM was 5.89–6.47 t ha−1, with corresponding GN values of approximately 19.5–19.8 × 10³ grains m−2. At higher tested N rates, GN continued to increase while PostDM declined.
Figure 9.
Relationships between sink capacity and post-anthesis source supply across N rates under B0 and B20 during the 2023–2024 (A,B) and 2024–2025 (C,D) growing seasons. Each point represents the mean of four replicates, and color gradients indicate increasing N rates from 0 to 350 kg N ha−1. The N200 and N250 annotations identify the treatments with the highest observed mean PostDM under B0 and B20, respectively. These annotations describe the sampled treatment means and do not represent statistically estimated breakpoints or confirmed physiological transition thresholds.
Under B20, concurrent increases in GN and PostDM extended through N250 (Figure 9B,D), where the highest observed mean PostDM was 6.97–7.57 t ha−1 and GN was approximately 20.5–21.0 × 10³ grains m−2. At N300 and N350, increasing GN was accompanied by declining PostDM. These trajectories describe the treatment means; N200 and N250 are observed peak locations among the tested rates, not statistically estimated change points.
4. Discussion
4.1. Biochar Reshapes the Yield Response to N Through Improved Grain-Sink Realization
A fundamental feature of cereal yield responses to N is a diminishing marginal return: the yield initially increases rapidly as the N limitation is alleviated, but the incremental benefit declines as the N supply approaches the crop demand, and the yield may plateau or decrease under an excessive N. This response is commonly represented by quadratic or asymptotic functions in winter wheat [4,34]. Consistently, the yield showed a strong quadratic response to N under both biochar treatments. However, B20 did not provide a uniform benefit across the N gradient. No significant yield advantage occurred at 0–150 kg N ha−1, whereas B20 consistently increased the yield at 200–350 kg N ha−1, indicating the dependence on a sufficient N supply [29,30]. B20 shifted the fitted yield-maximizing N rate from 217 to 274 kg N ha−1 in 2023–2024 and from 221 to 276 kg N ha−1 in 2024–2025. The predicted maximum yield increased by 0.99 t ha−1 in both seasons (11.0–11.7%), and the highest observed yield increased by 0.88–0.96 t ha−1 (9.7–11.4%). Thus, B20 raised the yield ceiling and extended the N range over which a high yield was maintained.
This advantage reflected the improved realization of the established sink rather than the formation of a larger sink at a given N rate. Increasing N progressively increased GN, but GN did not differ between B0 and B20 at any N rate. Across treatments, GW decreased as GN increased, with linear and quadratic models explaining 53.6% and 62.4% of the GW variation, respectively. This common wheat response may reflect a competition for assimilates, developmental or genetic trade-offs between grain number and potential size, and a greater proportion of intrinsically smaller grains as GN increases [9,35,36]. An enlarged grain population also increases the assimilate demand, and a reduced source-to-sink ratio can prevent grains from attaining their potential weight [8,11,12]. Therefore, the greater GW maintained by B20 at 150–350 kg N ha−1, without a corresponding increase in GN, indicates that biochar alleviated the grain weight penalty associated with an N-induced sink enlargement.
4.2. Post-Anthesis Source Maintenance and Grain-Sink Realization
Grain filling depends on current post-anthesis assimilates, represented here by PostDM, and pre-anthesis reserves subsequently remobilized from vegetative organs, represented by TransDM [14,15]. Whether an enlarged grain population increases the yield depends on whether these sources meet the sink demand [8,12,37]. TransDM responded to N but not to biochar or the B × N interaction, and did not differ between B0 and B20 at any N rate. In contrast, B20 increased PostDM by 11.9–43.5% in 2023–2024 and 11.0–43.4% in 2024–2025 at 200–350 kg N ha−1. This advantage coincided with greater maturity dry matter and a more stable harvest index at high N rates. B20 therefore supported grain filling primarily by sustaining post-anthesis dry matter production rather than by increasing the apparent remobilization of pre-anthesis reserves.
Greater PostDM under B20 coincided with enhanced PostNUP and canopy persistence. During grain filling, N remobilization supports grain protein accumulation but can reduce N retained in chlorophyll and photosynthetic machinery. Continued N uptake after anthesis can therefore help balance grain N demand with maintenance of source activity [38,39,40], whereas excessive dependence on remobilization may accelerate senescence and restrict current assimilation [17,19,41]. No significant biochar effect on N uptake at anthesis was detected, whereas B20 increased PostNUP at all fertilized N rates (50–350 kg N ha−1). However, the PostNUP response extended beyond the range of significant yield benefits: at 50–150 kg N ha−1, greater PostNUP was not accompanied by significant increases in PostDM or yield. Enhanced post-anthesis N accumulation therefore cannot, by itself, explain the yield response. At 200–350 kg N ha−1, greater PostNUP coincided with greater PostDM, GW, and yield, without a significant biochar effect on GN. This pattern is consistent with the improved realization of the N-expanded grain sink through sustained post-anthesis growth, while the causal contribution of additional N accumulation remains unresolved. Greater PostNUP represents a net increase in aboveground N after anthesis and does not, by itself, demonstrate an enhanced soil N availability or retention, reduced N losses, or improved root functioning. Biochar-derived N, P, and K could also have contributed to the crop responses, although their effective availability cannot be inferred from the reported total contents. The biochar’s pH of 9.5 warrants particular consideration because the initial soil pH was already 8.21 and 8.19 in the two seasons. A beneficial liming effect therefore cannot be assumed. Studies in alkaline soils have demonstrated contrasting effects of different biochars on ammonia volatilization and nutrient availability, indicating that these responses depend on material and soil properties [42,43]. Potential alkalization and changes in nutrient balance should therefore be considered, although neither was demonstrated in this experiment. Because post-application soil pH, mineral N dynamics, root traits, and N losses were not measured, the contributions of biochar-derived nutrients and changes in soil processes could not be separated.
Nevertheless, PSEM detected no independent PostNUP–PostDM pathway after accounting for nonlinear N responses and other pathways (β = 0.17 for B0 and 0.01 for B20; p > 0.05). PostNUP should therefore be interpreted as part of an integrated late-season response, not as the sole cause of greater PostDM.
The greater post-anthesis growth under B20 coincided with a lower seasonal soil-profile water depletion and higher WUE at 150–350 kg N ha−1. Changes in the soil structure and water retention could provide a resource context for these responses [30,44,45], but treatment-induced soil hydraulic changes were not quantified. SWC represents profile water depletion rather than crop transpiration, and WUE, calculated as yield divided by estimated ET, is an approximate field-scale measure. The nutrient inputs associated with biochar also require consideration. At 20 t ha−1, the amendment introduced estimated total inputs of 254 kg N, 46 kg P, and 210 kg K ha−1. Identical basal mineral P and K fertilizer rates therefore did not equalize total nutrient inputs between B0 and B20. Biochar nutrient release varies with feedstock, pyrolysis conditions, and soil environment [46]. B20 provided no significant yield advantage at N0 in either season, indicating no statistically detectable amendment benefit without mineral N fertilization under these conditions. This result does not exclude contributions from biochar-derived nutrients at higher N rates. Accordingly, the altered mineral N response is interpreted as a response to the whole biochar amendment.
4.3. Source–Sink Response Patterns and Their Agronomic Implications
RF, regression, and PSEM described associations among N supply, yield components, post-anthesis traits, and yield. GN and PostDM occupied prominent positions in these analyses, but the GN-related rankings and coefficients cannot independently establish its physiological contribution because GN was calculated from yield and GW. Accordingly, agreement among the analyses was not treated as independent confirmation of a causal GN–yield pathway. The source–sink interpretation instead draws on the treatment responses: B20 maintained greater GW and PostDM under high N, accompanied by greater canopy persistence, while estimated GN did not differ significantly between biochar treatments. These patterns are consistent with improved post-anthesis support for grain filling. The numerically larger total effect of centered linear N under B20 than B0 (0.86 vs. 0.63), together with its weaker negative quadratic effect (−0.43 vs. −0.71), describes differences within the fitted models rather than formally tested between-treatment contrasts.
These treatment responses are consistent with biochar modifying the N-dependent balance between grain-sink demand and post-anthesis growth. Coordinating sink development with assimilate supply is important for wheat yield formation [47,48,49]. Recent field and free-air CO2 enrichment studies support this framework, showing that an improved source–sink balance can increase the yield, whereas a greater N supply can enlarge GN while reducing the source availability per grain [50,51]. In the present study, GN and PostDM treatment means increased concurrently through N200 under B0 and N250 under B20; at higher tested rates, GN continued to increase while PostDM declined. Relative to each treatment’s observed PostDM maximum, reductions at N350 were 30.8% and 30.4% under B0 and 15.1% and 15.6% under B20 in the two seasons. Together with a greater GW under B20 at 150–350 kg N ha−1, these patterns are consistent with the better maintenance of post-anthesis growth under a high N. Reduced source-to-sink ratios can constrain the final GW, while insufficient post-anthesis supply can increase the reliance on pre-anthesis reserves [11,37]. Here, the apparent TransDM was unaffected by biochar, suggesting that the observed advantage was associated primarily with a greater PostDM. However, N200 and N250 identify observed maxima among treatments spaced at 50 kg N ha−1, rather than statistically estimated thresholds. Their difference does not establish a 50 kg N ha−1 shift in a physiological breakpoint. Accordingly, source–sink decoupling is used here only as a descriptive label for divergent GN and PostDM responses, not as a statistically confirmed physiological transition.
Agronomically, B20 should be regarded as modifying the crop responsiveness to N rather than replacing N fertilizer, consistent with evidence that biochar alone does not reliably increase the yield and that its benefits depend on its combination with mineral N [28,29,52]. At the respective N rates producing the highest observed yield, B20 increased WUE by 10.7% and 12.6%, while NUEG, AEN, and REN remained within 0–2.4% of B0 values; PFPN was 8.5–10.7% lower because the additional N input exceeded the proportional yield gain. Biochar therefore supported a higher-yielding and more water-efficient production state without improving every N-efficiency index. This trade-off agrees with winter-wheat evidence that coordinated biochar, irrigation, and N management optimized the yield, WUE, NUE, and economic return [53], and with maize studies demonstrating benefits from matching biochar with water-conserving cultivation or appropriate N rates [30,54]. Conversely, the absence of yield or NUE responses at a fertile temperate site confirms that biochar performance is context-dependent [31]. The fitted yield-maximizing N rates should therefore be interpreted only as model-derived values within the experimental range, rather than economically or environmentally optimal N rates or direct fertilizer recommendations. Practical use requires the site-specific optimization of biochar application and N rate and timing, together with an economic and environmental assessment, to sustain post-anthesis source activity without an unnecessary N surplus.
4.4. Limitations and Perspectives
This study included two independently randomized season–field experiments in one region, with one cultivar, biochar material, and application rate. The generalizability and persistence as biochar ages remain uncertain.
The mechanistic evidence was restricted to crop traits. Treatment-induced soil hydraulic changes, continuous water–N dynamics, post-application soil pH, root traits, and N losses were not quantified. Without nutrient-matched controls, biochar nutrient availability measurements, or source partitioning, biochar-derived nutrient contributions could not be separated from other amendment effects. Greater PostNUP indicates net aboveground N accumulation rather than demonstrated improvements in soil N availability or retention.
GN was derived from yield and GW; its mathematical coupling limits GN-related regressions, RF importance, and PSEM coefficients to descriptive interpretation. Initial profile mineral N was unmeasured, and topsoil total N cannot substitute for these stocks. Fitted yield-maximizing N rates are experiment-specific estimates under unquantified background N supply, rather than crop N requirements, economically or environmentally optimal rates, or fertilizer recommendations.
Despite bunds and separate irrigation, unmeasured runoff, drainage, groundwater contribution, and subsurface water–N transfer introduce uncertainty into ET, WUE, and treatment comparisons.
Future multi-site, multi-season studies should combine soil water–N monitoring, root phenotyping, and isotope tracing with assessments of N losses, greenhouse gas emissions, rotational carry-over, response persistence, and economic performance.
5. Conclusions
Across two growing seasons, biochar application reshaped the grain-yield response of irrigated winter wheat to N rather than providing a uniform yield increment. B20 increased the yield only at 200–350 kg N ha−1, raised the fitted yield-maximizing N rate by 55–57 kg N ha−1, and increased the predicted maximum yield by approximately 1.0 t ha−1. Because biochar did not increase GN at a given N rate, its yield advantage arose primarily from the more complete realization of the N-expanded grain sink, as reflected by the greater GW. This improvement was associated with sustained PostDM, post-anthesis N uptake, canopy persistence, and WUE under a high N, rather than a greater apparent remobilization of pre-anthesis reserves. The GN–PostDM treatment-mean patterns were consistent with the better maintenance of post-anthesis growth under a high N, but did not establish a statistically confirmed source–sink transition threshold. Biochar should therefore be regarded as a modifier of crop responsiveness to N, rather than a substitute for N fertilizer. It enabled a higher yield ceiling and greater WUE while broadly maintaining NUEG, AEN, and REN at the N rates producing the highest observed yield, although PFPN was lower because of the greater N input. The fitted yield-maximizing N rates apply to the experimental conditions and tested range and should not be interpreted as economically or environmentally optimal rates or direct fertilizer recommendations. Practical application requires a site-specific evaluation of economic returns and environmental risks.
Supplementary Materials
The following supporting information can be downloaded at: https://www.mdpi.com/article/10.3390/agriculture16202226/s1. Table S1: Bulk density of 0–200 soil layers in two seasons. Table S2: RF model performance and variable exclusion. Table S3: RF permutation importance with whole block bootstrap intervals. Table S4: PSEM model fit and influence diagnostics. Table S5: PostDM association with Yield before and after GN exclusion. Table S6: Yield predictors across the three PSEM structures.
Author Contributions
Conceptualization, Y.W. (Yuechao Wang) and X.Z.; methodology, Q.Y. and X.Z.; software, Y.W. (Yuechao Wang) and X.Z.; validation, Y.W. (Yuechao Wang); formal analysis, Q.Y., Y.W. (Yuxin Wu), Y.W. (Yonghui Wang), and W.Z.; investigation, Q.Y., Y.W. (Yuxin Wu), Y.W. (Yonghui Wang), W.Z., and X.Z.; resources, Y.W. (Yuechao Wang) and X.Z.; data curation, Q.Y.; writing—original draft preparation, Q.Y., Y.W. (Yonghui Wang), and W.Z.; writing—review and editing, Y.W. (Yuechao Wang) and X.Z.; visualization, Y.W. (Yuechao Wang) and X.Z.; supervision, Y.W. (Yuechao Wang); project administration, Y.W. (Yuechao Wang) and X.Z.; funding acquisition, Y.W. (Yuechao Wang) and X.Z. All authors have read and agreed to the published version of the manuscript.
Funding
This research was supported by the Shanxi Fundamental Research Program (Grant No. 202303021222074), the Shandong Province Major Agricultural Technology Collaborative Extension Program (Grant No. SDNYXTTG-2025-09), and the National Major Agricultural Science and Technology Project (Grant No. NK20220607).
Institutional Review Board Statement
Not applicable.
Data Availability Statement
The original contributions presented in this study are included in the article/Supplementary Materials. Further inquiries can be directed to the corresponding author.
Conflicts of Interest
The authors declare no conflicts of interest.
Abbreviations
The following abbreviations are used in this manuscript:
| GN | Grain number |
| GW | Grain weight |
| LAI | Leaf area index |
| SPAD | SPAD value |
| PostLAIm | Post-anthesis mean LAI |
| PostSPADm | Post-anthesis mean SPAD value |
| DMA | Dry matter at anthesis |
| DMM | Dry matter at maturity |
| PostDM | Post-anthesis dry matter production |
| TransDM | Apparent dry matter translocation |
| GDM | Grain dry matter at maturity |
| HI | Harvest index |
| NUPA | N uptake at anthesis |
| NUPM | N uptake at maturity |
| PostNUP | Post-anthesis N uptake |
| NUEG | N utilization efficiency for grain production |
| AEN | Agronomic efficiency of applied mineral N |
| REN | Apparent N recovery efficiency |
| PFPN | Partial factor productivity of applied mineral N |
| SWS | Soil water storage |
| SWC | Soil water consumption |
| WUE | Water use efficiency |
| RF | Random forest |
References
- Sinclair, T.R.; Horie, T. Leaf nitrogen, photosynthesis, and crop radiation use efficiency: A review. Crop Sci. 1989, 29, 90–98. [Google Scholar] [CrossRef] [Scilit]
- Gastal, F.; Lemaire, G. N uptake and distribution in crops: An agronomical and ecophysiological perspective. J. Exp. Bot. 2002, 53, 789–799. [Google Scholar] [CrossRef] [Scilit] [PubMed]
- Ma, L.; Ali, M.F.; Ren, X.; Han, W.; Lv, X.; Wang, S.; Pang, S.; Zhang, J.; Ding, N.; Feng, H.; et al. Improving nitrogen use efficiency in wheat: Integrating agronomic, genomics, and remote sensing for sustainable production. Plant Cell Environ. 2026, 49, 7131–7150. [Google Scholar] [CrossRef] [Scilit] [PubMed]
- Sylvester-Bradley, R.; Kindred, D.R. Analysing nitrogen responses of cereals to prioritize routes to the improvement of nitrogen use efficiency. J. Exp. Bot. 2009, 60, 1939–1951. [Google Scholar] [CrossRef] [Scilit] [PubMed]
- Li, X.; Noor, H.; Noor, F.; Ding, P.; Sun, M.; Gao, Z. Effect of soil water and nutrient uptake on nitrogen use efficiency, and yield of winter wheat. Agronomy 2024, 14, 819. [Google Scholar] [CrossRef] [Scilit]
- Wang, K.; Liu, H.; Gao, Z. Effects of nitrogen application at different levels by a sprinkler fertigation system on crop growth and nitrogen-use efficiency of winter wheat in the North China Plain. Plants 2024, 13, 1714. [Google Scholar] [CrossRef] [Scilit] [PubMed]
- Panyi, A.F.; Brorsen, B.W. Trends in the yield response to nitrogen of winter wheat in Oklahoma. Agric. Environ. Lett. 2024, 9, e20143. [Google Scholar] [CrossRef] [Scilit]
- Borrás, L.; Slafer, G.A.; Otegui, M.E. Seed dry weight response to source–sink manipulations in wheat, maize and soybean: A quantitative reappraisal. Field Crops Res. 2004, 86, 131–146. [Google Scholar] [CrossRef] [Scilit]
- Sadras, V.O. Evolutionary aspects of the trade-off between seed size and number in crops. Field Crops Res. 2007, 100, 125–138. [Google Scholar] [CrossRef] [Scilit]
- Zhou, X.; Qian, M.; Wang, F.; Liang, F.; Gao, D.; Feng, S.; Wang, Y.; Zhang, F.; Hu, X. Drip fertigation enhances nitrogen uptake and improves winter wheat yield and stability across planting densities. Plants 2026, 15, 1090. [Google Scholar] [CrossRef] [Scilit] [PubMed]
- Alvarez Prado, S.; Giménez, V.D.; Ciancio, N.; Alzueta, I.; Serrago, R.A.; Miralles, D.J. Grain growth and development in wheat (Triticum aestivum L.) and barley (Hordeum vulgare L.): Coordination between water content and source/sink ratio. Field Crops Res. 2023, 302, 109100. [Google Scholar] [CrossRef] [Scilit]
- Wu, X.; Liu, M.; Li, C.; McHugh, A.D.; Li, M.; Xiong, T.; Liu, Y.; Tang, Y. Source–sink relations and responses to sink–source manipulations during grain filling in wheat. J. Integr. Agric. 2022, 21, 1593–1605. [Google Scholar] [CrossRef] [Scilit]
- Rosati, A.; Benincasa, P. Revisiting source versus sink limitations of wheat yield during grain filling. Agron. J. 2023, 115, 3197–3205. [Google Scholar] [CrossRef] [Scilit]
- Schnyder, H. The role of carbohydrate storage and redistribution in the source–sink relations of wheat and barley during grain filling—A review. New Phytol. 1993, 123, 233–245. [Google Scholar] [CrossRef] [Scilit]
- Gebbing, T.; Schnyder, H. Pre-anthesis reserve utilization for protein and carbohydrate synthesis in grains of wheat. Plant Physiol. 1999, 121, 871–878. [Google Scholar] [CrossRef] [Scilit] [PubMed]
- Mi, G.; Tang, L.; Zhang, F.; Zhang, J. Is nitrogen uptake after anthesis in wheat regulated by sink size? Field Crops Res. 2000, 68, 183–190. [Google Scholar] [CrossRef] [Scilit]
- Distelfeld, A.; Avni, R.; Fischer, A.M. Senescence, nutrient remobilization, and yield in wheat and barley. J. Exp. Bot. 2014, 65, 3783–3798. [Google Scholar] [CrossRef] [Scilit] [PubMed]
- Teng, W.; He, X.; Tong, Y. Genetic control of efficient nitrogen use for high yield and grain protein concentration in wheat: A review. Plants 2022, 11, 492. [Google Scholar] [CrossRef] [Scilit] [PubMed]
- Gaju, O.; Allard, V.; Martre, P.; Le Gouis, J.; Moreau, D.; Bogard, M.; Hubbart, S.; Foulkes, M.J. Nitrogen partitioning and remobilization in relation to leaf senescence, grain yield and grain nitrogen concentration in wheat cultivars. Field Crops Res. 2014, 155, 213–223. [Google Scholar] [CrossRef] [Scilit]
- Cormier, F.; Foulkes, J.; Hirel, B.; Gouache, D.; Moënne-Loccoz, Y.; Le Gouis, J. Breeding for increased nitrogen-use efficiency: A review for wheat (T. aestivum L.). Plant Breed. 2016, 135, 255–278. [Google Scholar] [CrossRef] [Scilit]
- Gregersen, P.L.; Culetic, A.; Boschian, L.; Krupinska, K. Plant senescence and crop productivity. Plant Mol. Biol. 2013, 82, 603–622. [Google Scholar] [CrossRef] [Scilit] [PubMed]
- Havé, M.; Marmagne, A.; Chardon, F.; Masclaux-Daubresse, C. Nitrogen remobilization during leaf senescence: Lessons from Arabidopsis to crops. J. Exp. Bot. 2017, 68, 2513–2529. [Google Scholar] [CrossRef] [Scilit] [PubMed]
- Plett, D.C.; Ranathunge, K.; Melino, V.J.; Kuya, N.; Uga, Y.; Kronzucker, H.J. The intersection of nitrogen nutrition and water use in plants: New paths toward improved crop productivity. J. Exp. Bot. 2020, 71, 4452–4468. [Google Scholar] [CrossRef] [Scilit] [PubMed]
- Glaser, B.; Lehmann, J.; Zech, W. Ameliorating physical and chemical properties of highly weathered soils in the tropics with charcoal—A review. Biol. Fertil. Soils 2002, 35, 219–230. [Google Scholar] [CrossRef] [Scilit]
- Atkinson, C.J.; Fitzgerald, J.D.; Hipps, N.A. Potential mechanisms for achieving agricultural benefits from biochar application to temperate soils: A review. Plant Soil 2010, 337, 1–18. [Google Scholar] [CrossRef] [Scilit]
- Joseph, S.; Cowie, A.L.; Van Zwieten, L.; Bolan, N.; Budai, A.; Buss, W.; Cayuela, M.L.; Graber, E.R.; Ippolito, J.A.; Kuzyakov, Y.; et al. How biochar works, and when it does not: A review of mechanisms controlling soil and plant responses to biochar. GCB Bioenergy 2021, 13, 1731–1764. [Google Scholar] [CrossRef] [Scilit]
- Schmidt, H.P.; Kammann, C.; Hagemann, N.; Leifeld, J.; Bucheli, T.D.; Sánchez Monedero, M.A.; Cayuela, M.L. Biochar in agriculture—A systematic review of 26 global meta-analyses. GCB Bioenergy 2021, 13, 1708–1730. [Google Scholar] [CrossRef] [Scilit]
- Jeffery, S.; Verheijen, F.G.A.; van der Velde, M.; Bastos, A.C. A quantitative review of the effects of biochar application to soils on crop productivity using meta-analysis. Agric. Ecosyst. Environ. 2011, 144, 175–187. [Google Scholar] [CrossRef] [Scilit]
- Ye, L.; Camps-Arbestain, M.; Shen, Q.; Lehmann, J.; Singh, B.; Sabir, M. Biochar effects on crop yields with and without fertilizer: A meta-analysis of field studies using separate controls. Soil Use Manag. 2020, 36, 2–18. [Google Scholar] [CrossRef] [Scilit]
- Lv, Y.; Jiao, Y.; Cai, Z.; Zhang, Y.; Lu, Y.; Wang, J.; Liao, Y.; Zhang, G. Co-application of biochar and nitrogen fertilizer improves soil structure, water–nitrogen availability, and maize productivity under a ridge–furrow plastic film mulching system. Eur. J. Agron. 2026, 180, 128263. [Google Scholar] [CrossRef] [Scilit]
- Sixt, T.; Amann, M.; Schuster, J.; Hülsbergen, K.-J. Does biochar mixed with digestate affect crop yield, nitrogen use efficiency, and nitrate leaching? Eur. J. Agron. 2025, 169, 127698. [Google Scholar] [CrossRef] [Scilit]
- Congreves, K.A.; Otchere, O.; Ferland, D.; Farzadfar, S.; Williams, S.; Arcand, M.M. Nitrogen Use Efficiency Definitions of Today and Tomorrow. Front. Plant Sci. 2021, 12, 637108. [Google Scholar] [CrossRef] [Scilit] [PubMed]
- NY/T 3041-2016; Biochar-Based Fertilizer. China Agriculture Press: Beijing, China, 2016. (In Chinese)
- Ma, G.; Liu, W.; Li, S.; Zhang, P.; Wang, C.; Lu, H.; Wang, L.; Xie, Y.; Ma, D.; Kang, G. Determining the optimal N input to improve grain yield and quality in winter wheat with reduced apparent N loss in the North China Plain. Front. Plant Sci. 2019, 10, 181. [Google Scholar] [CrossRef] [Scilit] [PubMed]
- Acreche, M.M.; Slafer, G.A. Grain weight response to increases in number of grains in wheat in a Mediterranean area. Field Crops Res. 2006, 98, 52–59. [Google Scholar] [CrossRef] [Scilit]
- Xie, Q.; Sparkes, D.L. Dissecting the trade-off of grain number and size in wheat. Planta 2021, 254, 3. [Google Scholar] [CrossRef] [Scilit] [PubMed]
- Fang, L.; Struik, P.C.; Girousse, C.; Yin, X.; Martre, P. Source–sink relationships during grain filling in wheat in response to various temperature, water deficit, and nitrogen deficit regimes. J. Exp. Bot. 2024, 75, 6563–6578. [Google Scholar] [CrossRef] [Scilit] [PubMed]
- Jenner, C.F.; Ugalde, T.D.; Aspinall, D. The physiology of starch and protein deposition in the endosperm of wheat. Aust. J. Plant Physiol. 1991, 18, 211–226. [Google Scholar] [CrossRef] [Scilit]
- Kichey, T.; Hirel, B.; Heumez, E.; Dubois, F.; Le Gouis, J. In winter wheat (Triticum aestivum L.), post-anthesis nitrogen uptake and remobilisation to the grain correlates with agronomic traits and nitrogen physiological markers. Field Crops Res. 2007, 102, 22–32. [Google Scholar] [CrossRef] [Scilit]
- Bogard, M.; Allard, V.; Brancourt-Hulmel, M.; Heumez, E.; Machet, J.-M.; Jeuffroy, M.-H.; Gate, P.; Martre, P.; Le Gouis, J. Deviation from the grain protein concentration–grain yield negative relationship is highly correlated to post-anthesis N uptake in winter wheat. J. Exp. Bot. 2010, 61, 4303–4312. [Google Scholar] [CrossRef] [Scilit] [PubMed]
- Hawkesford, M.J. Genetic variation in traits for nitrogen use efficiency in wheat. J. Exp. Bot. 2017, 68, 2627–2632. [Google Scholar] [CrossRef] [Scilit] [PubMed]
- Amin, A.E.A.Z. Carbon sequestration, kinetics of ammonia volatilization and nutrient availability in alkaline sandy soil as a function on applying calotropis biochar produced at different pyrolysis temperatures. Sci. Total Environ. 2020, 726, 138489. [Google Scholar] [CrossRef] [Scilit] [PubMed]
- Alazzaz, A.; Usman, A.R.A.; Ahmad, M.; Ibrahim, H.M.; Elfaki, J.; Sallam, A.S.; Akanji, M.A.; Al-Wabel, M.I. Potential short-term negative versus positive effects of olive mill-derived biochar on nutrient availability in a calcareous loamy sand soil. PLoS ONE 2020, 15, e0232811. [Google Scholar] [CrossRef] [Scilit] [PubMed]
- Blanco-Canqui, H. Biochar and soil physical properties. Soil Sci. Soc. Am. J. 2017, 81, 687–711. [Google Scholar] [CrossRef] [Scilit]
- Razzaghi, F.; Obour, P.B.; Arthur, E. Does biochar improve soil water retention? A systematic review and meta-analysis. Geoderma 2020, 361, 114055. [Google Scholar] [CrossRef] [Scilit]
- Piash, M.I.; Iwabuchi, K.; Itoh, T.; Uemura, K. Release of essential plant nutrients from manure- and wood-based biochars. Geoderma 2021, 397, 115100. [Google Scholar] [CrossRef] [Scilit]
- Reynolds, M.; Foulkes, M.J.; Slafer, G.A.; Berry, P.; Parry, M.A.J.; Snape, J.W.; Angus, W.J. Raising yield potential in wheat. J. Exp. Bot. 2009, 60, 1899–1918. [Google Scholar] [CrossRef] [Scilit] [PubMed]
- Foulkes, M.J.; Slafer, G.A.; Davies, W.J.; Berry, P.M.; Sylvester-Bradley, R.; Martre, P.; Calderini, D.F.; Griffiths, S.; Reynolds, M.P. Raising yield potential of wheat. III. Optimizing partitioning to grain while maintaining lodging resistance. J. Exp. Bot. 2011, 62, 469–486. [Google Scholar] [CrossRef] [Scilit] [PubMed]
- Slafer, G.A.; Savin, R.; Sadras, V.O. Coarse and fine regulation of wheat yield components in response to genotype and environment. Field Crops Res. 2014, 157, 71–83. [Google Scholar] [CrossRef] [Scilit]
- Dai, Y.; Liao, Z.; Pei, S.; Zhang, F.; Li, Z.; Fan, J.; Cui, Y. Winter wheat source–sink relationships under various planting modes, complementary irrigation, and planting densities. Agron. J. 2024, 116, 2483–2497. [Google Scholar] [CrossRef] [Scilit]
- Manderscheid, R.; Dier, M. Effect of N and CO2 supply on source size per grain at anthesis and its relationship with grain growth in wheat. J. Agron. Crop Sci. 2023, 209, 273–285. [Google Scholar] [CrossRef] [Scilit]
- Jaufmann, E.; Schmid, H.; Hülsbergen, K.-J. Effects of biochar in combination with cattle slurry and mineral nitrogen on crop yield and nitrogen use efficiency in a three-year field experiment. Eur. J. Agron. 2024, 156, 127168. [Google Scholar] [CrossRef] [Scilit]
- Zhang, P.; Wang, M.; Yu, L.; Xu, J.; Cai, H. Optimization of water and nitrogen management in wheat cultivation affected by biochar application—Insights into resource utilization and economic benefits. Agric. Water Manag. 2024, 304, 109093. [Google Scholar] [CrossRef] [Scilit]
- Li, Z.; Wang, B.; Liu, Z.; Zhang, P.; Yang, B.; Jia, Z. Ridge–furrow planting with film mulching and biochar addition can enhance spring maize yield and water and nitrogen use efficiency by promoting root growth. Field Crops Res. 2023, 303, 109139. [Google Scholar] [CrossRef] [Scilit]

Disclaimer/Publisher’s Note: The statements, opinions and data contained in all publications are solely those of the individual author(s) and contributor(s) and not of MDPI and/or the editor(s). MDPI and/or the editor(s) disclaim responsibility for any injury to people or property resulting from any ideas, methods, instructions or products referred to in the content. |
© 2026 by the authors. Licensee MDPI, Basel, Switzerland. This article is an open access article distributed under the terms and conditions of the Creative Commons Attribution (CC BY) license.