


Abstract
Accurate fruit detection and counting are fundamental requirements in the development of reliable computer vision applications for yield estimation. This work was conceived to provide farmers with a farmer-friendly approach for automatic grape bunch detection. This study exploits the free demo version of the Roboflow 3.0 platform to train five state-of-the-art computer vision models with RGB images of white and red grape bunches, acquired with a smartphone in the field, and compares their performance. The results were evaluated both quantitatively, in terms of precision, recall, and AP@50 calculated on the validation set, and qualitatively on the test set. The models that achieved the best performances, also in the presence of overlapping clusters, were Roboflow 3.0 Object Detection and YOLOv11, reaching precisions of 86.6% and 88%, respectively, for the detection of white bunches, and of 85.7% and 89.9% for red bunches. This study highlights the possibility of developing highly accurate computer vision models for table grape bunch detection using the Roboflow platform, offering an accessible and user-friendly tool for non-expert users, including farmers.
1. Introduction
According to the report drawn up by the Institute of Services for the Agricultural and Food Market (ISMEA), Italy is the leading European producer and exporter of table grape, with approximately 47,700 hectares covered in 2024 [1]. Its cultivation is concentrated in the southern regions, particularly in Apulia region, which accounts for around 60% of the national production, followed by Sicily (35%) and Basilicata (5%) [1]. The Italian table grape supply chain provides a product availability of approximately 800,000 tons, with exports generating around 820 million euros in annual revenue, driving the economy of fruit sector in southern Italy [1,2]. Nowadays, there is an always increasing interest among the farmers for accurate table grape yield estimation, since traditional methods based on visual inspection and manual counting are time consuming, labour-intensive, prone to error, and do not capture spatial variability [3]. For these reasons, there is the need to develop digital tools based on computer vision models that can reliably estimate table grape yield. Computer vision can provide affordable and versatile solutions for fruit detection and counting, ensuring great accuracy [4]. According to Clingeleffer et al. [5], approximately 70% of grape yield is explained by the number of clusters per vine; thus, reliable fruit detection and counting are fundamental requirements in the development of computer vision models for accurate yield estimation. Unlike other fruits such as apples or oranges, which are typically easier to detect individually, grape bunches often suffer from occlusion by canopy foliage, overlapping each other, and exhibit important variability in colour, size, and shape [6]. It is important to note that fruit detection using bounding boxes provides a reliable estimation of fruit shape and spatial occupancy for fruits with regular shapes, such as oranges and apples; however, this approach may be insufficient for grape clusters [7]. These characteristics make it challenging to accurately identify and count grape clusters.
In very recent years, the spread of deep learning techniques in the agricultural sector has made possible the development of increasingly accurate object detection models for different applications [8,9,10,11]. Deep learning-based object detection techniques can be mainly divided into two families: the Faster Region-based Convolutional Neural Network (R-CNN) architecture and the Single-Shot Detector (SSD) meta-architecture [12]. Faster R-CNN performs object detection in two stages; in the first stage, a region proposal network generates candidate regions, and in the second stage, bounding box regression and object classification are performed. Bargoti et al. [13] and Rahnemoonfar et al. [14], using Faster R-CNNs, achieved accurate results in the detection of a wide set of fruits, including peppers, melons, oranges, apples, mangoes, avocados, strawberries, and almonds. In contrast, the SSD meta-architecture uses single feed-forward Convolutional Neural Networks (CNNs) to simultaneously predict classes and bounding boxes in a single stage. Sa et al. [15] perform tomato counting using a single CNN. Chen et al. [16] presented a deep learning pipeline for counting apples and oranges. Chen et al. [17] showed that multi-layer SSDs can effectively handle the detection of fruits in different poses, shapes, and illumination conditions, confirming the robustness of this approach in outdoor environments. The You Only Look Once (YOLO) architecture belongs to the SSD family and addresses object detection as a single regression problem [18]. Using YOLO, the input images are resized to a lower resolution and processed by a single CNN, providing detection results according to a predefined confidence threshold. Since its development in 2016, several new versions of YOLO have been released, always improving the detection performance of the algorithm [19,20]. Nowadays, YOLO is the most employed architecture in the agricultural sector, including applications in fruit detection [21,22,23] and weed and pest disease identification [24,25].
One of the main advantages of deep learning techniques is their ability to generalize, which is expressed in the concept of transfer learning. It is a widely employed machine learning approach in which a model pre-trained on a large and generic dataset, like COCO or ImageN, is successively fine-tuned on a task-specific dataset [26]. The underlying idea is that the pre-trained model has already learned general features, such as edges, textures, and shapes, that can be effectively reused for a new task.
Despite the rapid progress in the development of accurate computer vision models for fruit detection and counting, their adoption in operational agricultural contexts is very limited. This is due to several factors, including the limited technological background and the low level of digital skills of farmers and field technicians, the advanced average age of farmers, and the lack of technological infrastructures in agricultural settings capable of supporting the computational burden required by complex computer vision algorithms [27]. In general, scientific studies conducted on grape cluster detection and counting have been performed with the aim of developing highly accurate computer vision models using very sophisticated deep learning techniques and high-quality datasets, which must be pre-processed using advanced techniques to improve model performance and robustness [28]. Such conditions are difficult to achieve in real field conditions and, as a result, the development of these models usually remains confined to academic research. In this context, simple applicability and accessibility are key requirements for the adoption of computer vision models in field applications carried out directly by farmers. The novelty of this study lies in the adopted methodological paradigm, as it was conceived from the perspective of a farmer with no experience with computer vision models and having only a smartphone to acquire medium-quality RGB images. This approach was carried out to provide farmers with a farmer-friendly solution for automatic grape detection, overcoming the high costs and complexity of use of advanced technologies. Following this paradigm, this study focuses on comparing the performance of five pretrained computer vision models for the automatic detection of red and white table grape bunches. The models took as input the RGB images captured in the field with the smartphone and were trained using the free demo version of the Roboflow 3.0 platform. The results obtained in study point out that even when medium-quality RGB images and free software for models’ training, it is possible to develop accurate computer vision models for table grape bunch detection, offering an affordable and accessible tool for farmers.
2. Materials and Methods
2.1. Roboflow 3.0 Platform and Employed Object Detection Models
The workflow presented in this study was entirely carried out using the Roboflow 3.0 platform [29], a full-stack computer vision infrastructure that helps developers of all skill levels in the development of computer vision applications. This platform is particularly adapted for non-expert users, since it aims to simplify the workflow by providing tools for AI-assisted labelling, data preprocessing, model training, and deployment. In this study, the free demo version of Roboflow 3.0 was used to demonstrate that reliable results can also be obtained using pre-trained models, showing the feasibility of developing computer vision-based applications for free. The computer vision models developed in this study are based on the supervised learning paradigm, in which the model is trained on a dataset containing labelled target objects. This approach provides the model with the necessary informative content to learn during the training process. After the training, the model can identify the target object in unseen images.
In this study, five state-of-the-art object detection models were trained and their performance compared for grape bunch detection. The models employed were: Roboflow 3.0 Object Detection [30], YOLOv12 [31], YOLOv11 [32], YOLO-NAS (Neural Architecture Search) [33], and RF-DETR (Roboflow DETR) [34]. Roboflow 3.0 Object Detection is the latest free model developed by Roboflow and is optimized for small and low-quality datasets. YOLOv12 is the latest release of the YOLO family. It has demonstrated a higher accuracy over the COCO (Common Object in Context) dataset compared to YOLOv11 [35], representing a good compromise between accuracy and speed. YOLOv11 is recognized for its robustness and stability in real-world applications [36]. YOLO-NAS is optimized for deploying hardware and is very stable and fast on large datasets [37]. RF-DETR has a transformer-based design developed by Roboflow [38]; it is an optimized version of the DETR architecture and generalizes well on small datasets, offering very robust performance in applications involving occlusions, numerous objects, and small objects.
The hyperparameters employed by the models, such as the learning rate, epochs, number of layers, and the optimizer, were automatically set by the Roboflow platform. All the tested models were trained using the COCOn checkpoint, which provides pre-trained weights from the COCO dataset, enhancing the models’ ability to quickly adapt to specific detection and achieve improved performance [39]. Both the confidence threshold and the overlap threshold were set to 50% for all the tested models.
2.2. Workflow in the Roboflow 3.0 Platform
The models received as input a set of RGB images containing table grape bunches. They were manually labelled and used for the training. At the end of the process, the model was able to correctly detect grape bunches in new images given as input. The workflow followed in this study is composed of several steps: data collection, image labelling, dataset splitting, preprocessing and data augmentation, model training, and performance evaluation.
2.2.1. Dataset Definition
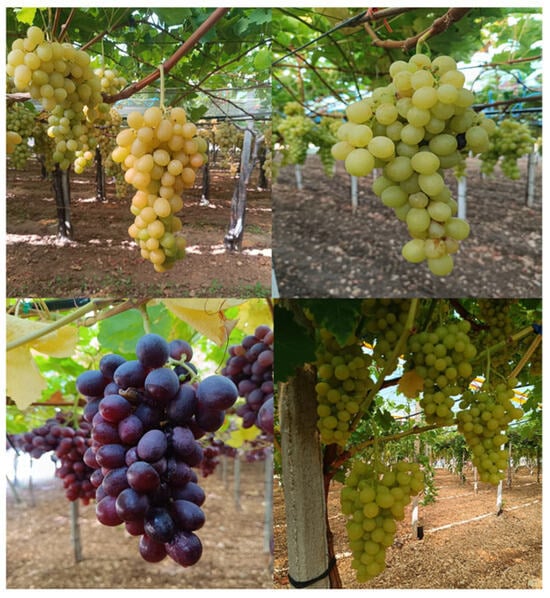
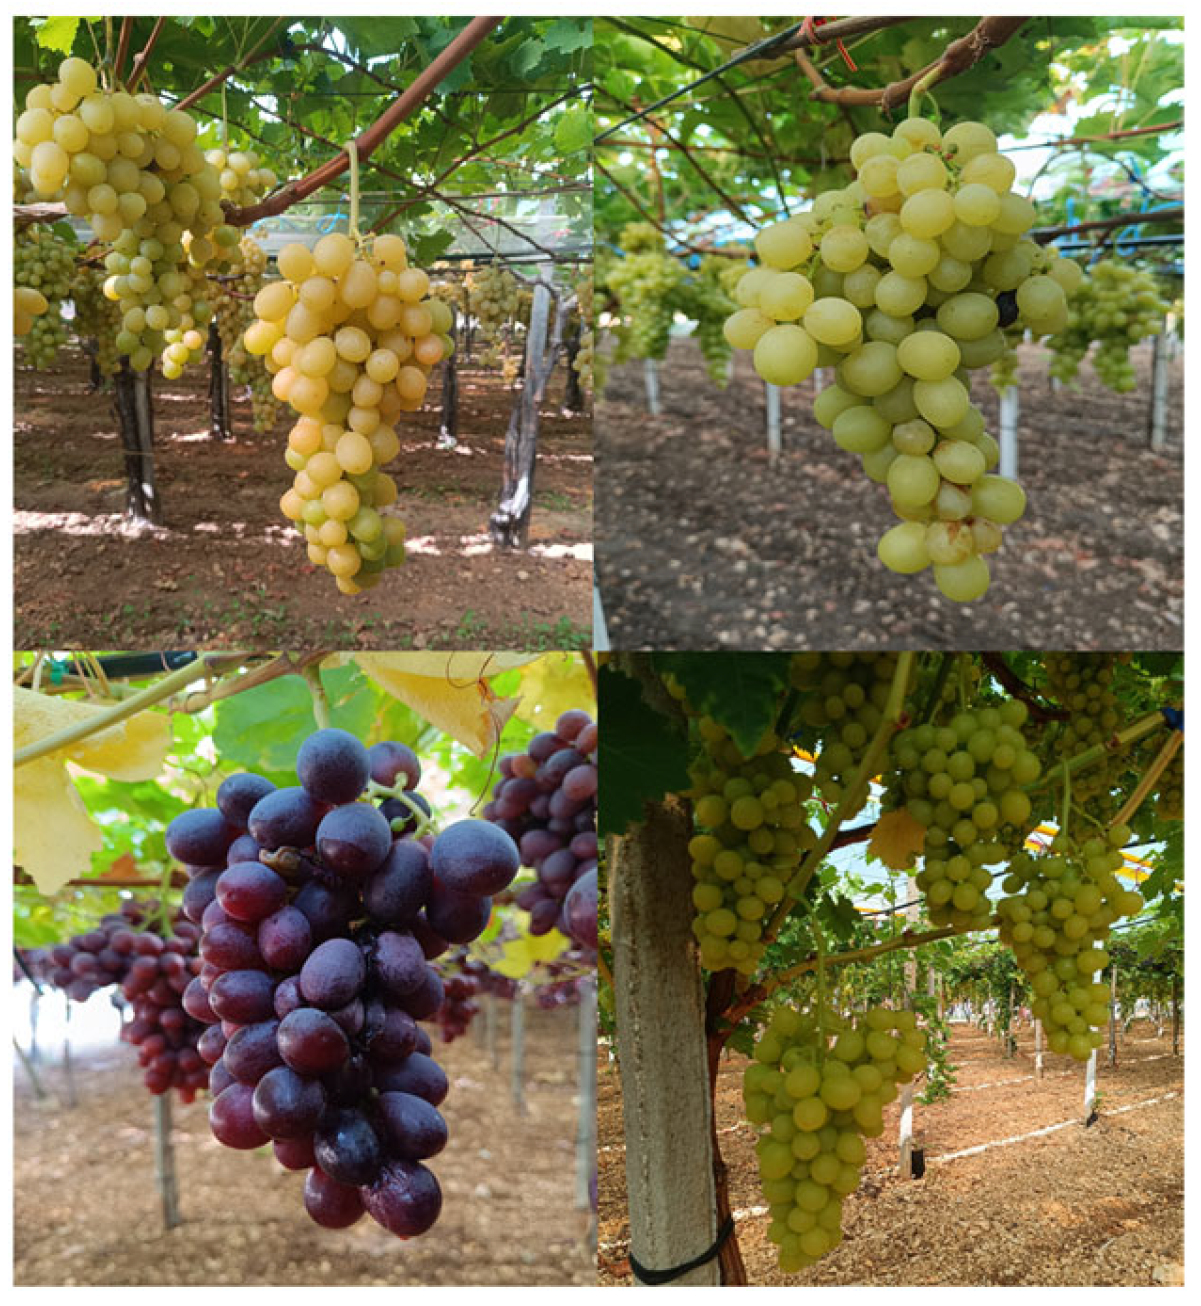
The RGB images of table grape bunches taken of white and red cultivars (Italia, Allison, Millenium) at different phenological stages were collected in several vineyards located in the countryside of Noicattaro (41°02′ N, 16°59′ E), Apulia region, Southern Italy. The initial dataset included 150 images acquired in July and August 2025, and it is publicly available online [40]. Some examples of images captured in the field and included in the dataset are shown in Figure 1. The vine training system typically employed in the Apulia region for table grape production is the “pergolato” or “tendone”. It is characterized by a continuous horizontal overhead canopy plane, sustained by a trellis system consisting of wooden stakes placed near each vine and two orthogonal steel wires attached 1.7–1.8 m above ground level, along with a grid of steel wires that supports the shoots. The structure is covered with anti-hail nets and plastic films to protect the grapes and control ripening time, optimizing both yield and fruit quality [41]. The standard vine spacing is 2.5 m × 2.5 m. In tendone-trained vineyards, the canopy is located at approximately 1.90 m above the soil surface and is divided by a horizontal grid of steel wires into two distinct layers: an upper layer consisting mainly of leaves and a lower one with the grape clusters [42]. Consequently, in tendone-trained vineyards, bunch occlusion caused by the presence of leaves is reduced; however, the issue of overlapping bunches remains a significant challenge.
Figure 1.
RGB images of table grape bunches of different varieties and at different ripening stages captured in the field with Xiaomi Redmi Note 11 Pro (Xiaomi Inc., Beijing, China) smartphone included in the dataset.
A Xiaomi Redmi Note 11 Pro smartphone was used to take pictures of grape bunches. This device has a 108 MP RGB main camera with a focal distance of 9 mm and a field of view of 118°. The acquired images had a resolution of 3082 × 4096 pixels. The camera features digital image stabilization and an autofocus function. It features a bright f/1.9 aperture paired with a 1/1.52” sensor, allowing the acquisition of detailed images even in challenging low-light conditions.
The images were captured in the morning under varying lighting conditions and from different points of view. The camera-to-bunch distance was variable in the range 0.4–1.0 m. The dataset consists of 150 images, of which 65 contain red grape varieties, and 85 contain white grape varieties.
The assessment of the dataset image quality has been performed using different metrics. Overall, the dataset exhibited a good illumination quality, with an average brightness value of 116, indicating that the images are slightly underexposed but still within the suitable range for the development of robust computer vision applications. The low brightness standard deviation (std = 11.9) suggests uniform lighting conditions across images, which is highly beneficial for object detection tasks. The mean contrast level of the dataset was 45, which represents a satisfactory value that allows the distinction of local details and edges. Furthermore, the low contrast variability (std = 6.5) indicates a homogeneous dataset, which contributes to more stable and reliable model training.
For the evaluation of the sharpness, the Variance of Laplacian (VoL) and the Tenengrad measures have been used. The VoL of the dataset is 406.4 ± 247.8, and the Tenengrad is 4.0 × 10⁹ ± 1.9 × 10⁹, reflecting the average sharpness level of the images. These values are generally adequate for computer vision applications, indicating that the images are sufficiently sharp, although not exceptionally detailed. The relatively high standard deviation indicates the heterogeneity of the dataset. The non-exceptional image quality metrics obtained were expected, as no standardized acquisition approach was followed to capture the images. This choice was intentionally made to realistically reproduce the typical conditions of real field environments.
2.2.2. Image Labelling
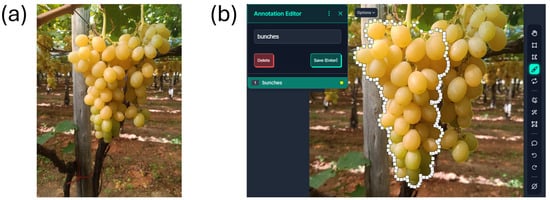
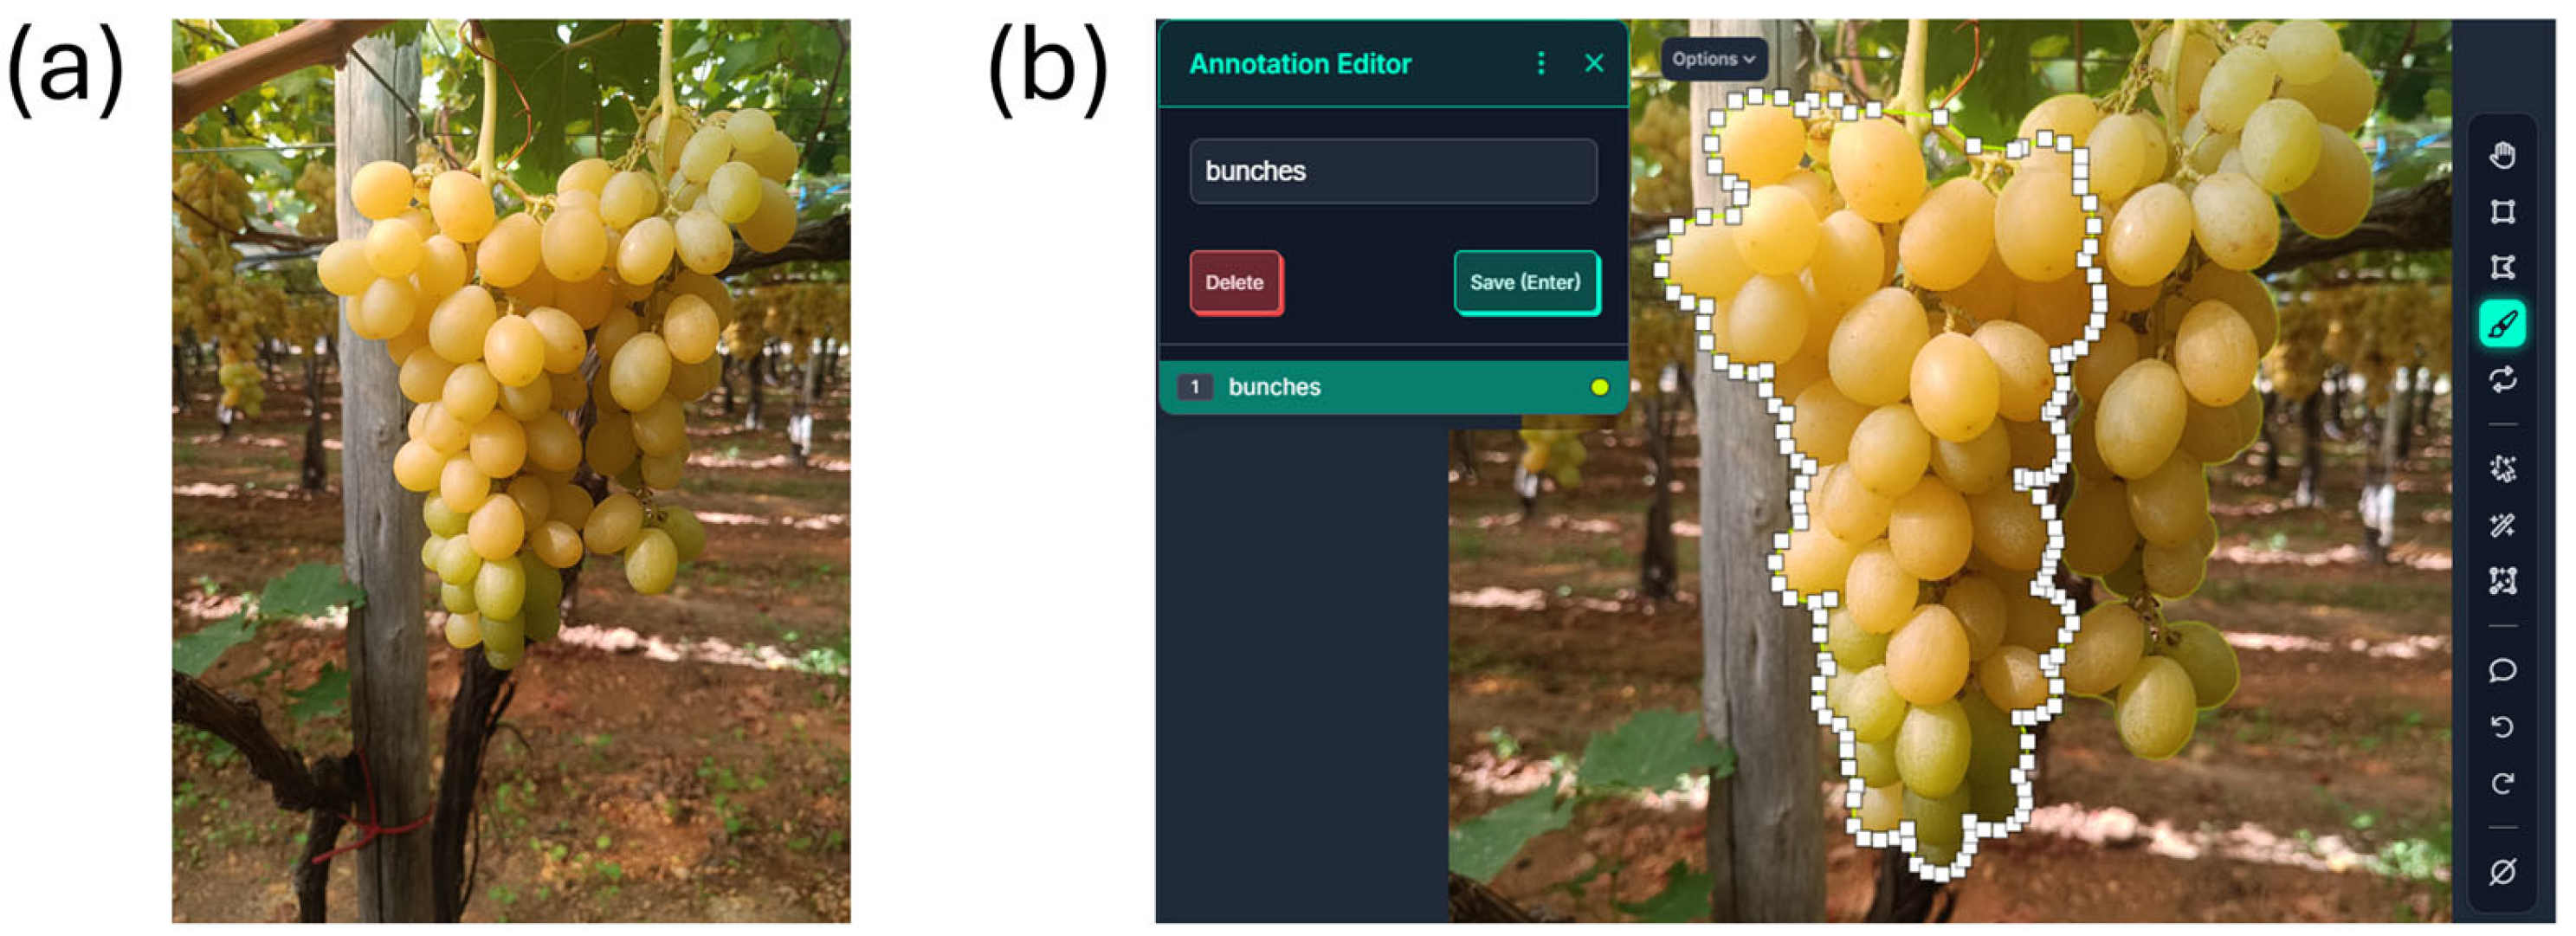
This step is crucial for the accuracy of the trained computer vision models [43]. Each grape bunch was manually annotated in the Roboflow 3.0 platform and assigned a unique label “Bunch”. The Roboflow platform provides a user-friendly annotation interface, named Roboflow Annotate, in which users can choose among different annotation methods, including manual bounding boxes, manual polygons, and semi-automatic approaches based on AI techniques such as Segment Anything Models (SAM). In this study, manual polygon annotation was selected as an annotation method since it provides the highest fidelity for complex object boundaries, such as those of grape bunches. The number of annotated bunches in the entire dataset was 366. A representative example of the grape bunches labelling process using the Roboflow Annotate interface is shown in Figure 2.
Figure 2.
(a) Example of an original image included in the dataset; (b) Example of the grape bunches labelling process using the Roboflow Annotate interface. The polygon was manually drawn and labelled as “Bunch”. The white squares represent the points manually drawn.
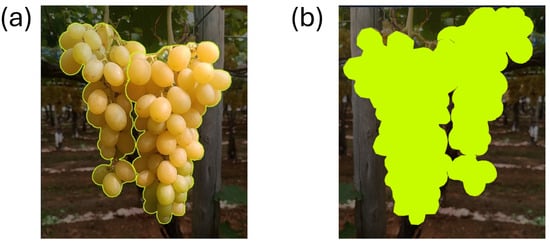
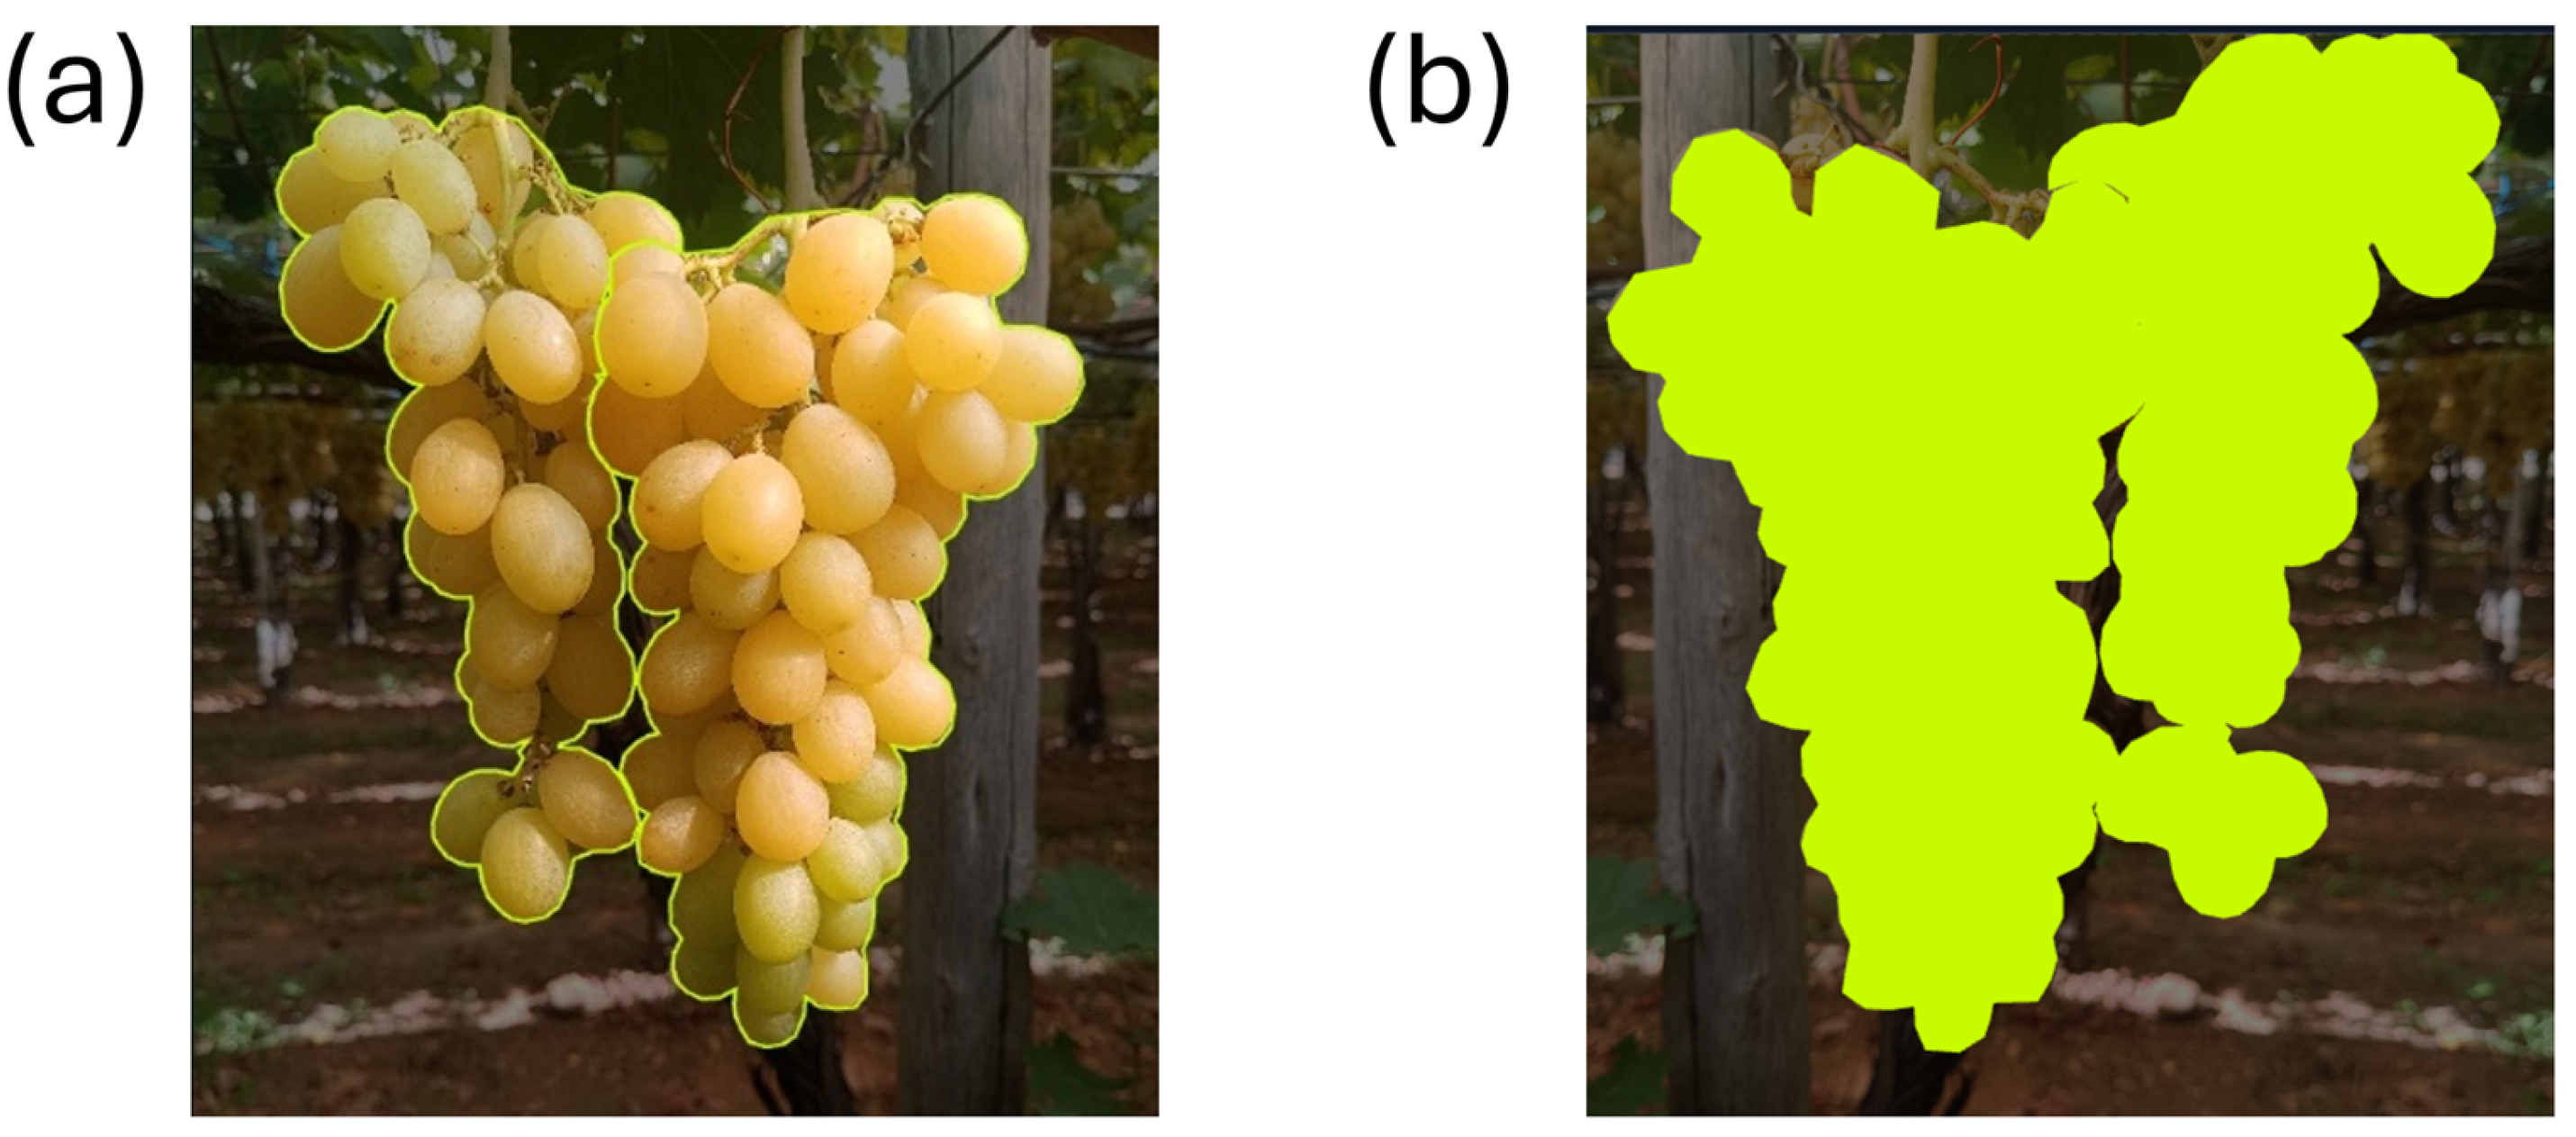
The polygon was manually drawn around each bunch and then saved. Although this approach is time-consuming, it provides the differences among the bunches in size and shape as well as their overlapping, defining a reliable ground truth for the supervised learning process. Figure 3a reports two annotated “Bunches” outlined with a yellow contour line, while Figure 3b presents the corresponding segmentation masks.
Figure 3.
(a) Image labelled with the two “Bunches”; (b) The yellow areas represent the corresponding segmentation masks.
The segmentation masks can be employed to retrieve the actual size of the clusters, knowing the camera-to-bunch distance. In this study, the size of the cluster was not assessed because the images were acquired at a variable distance.
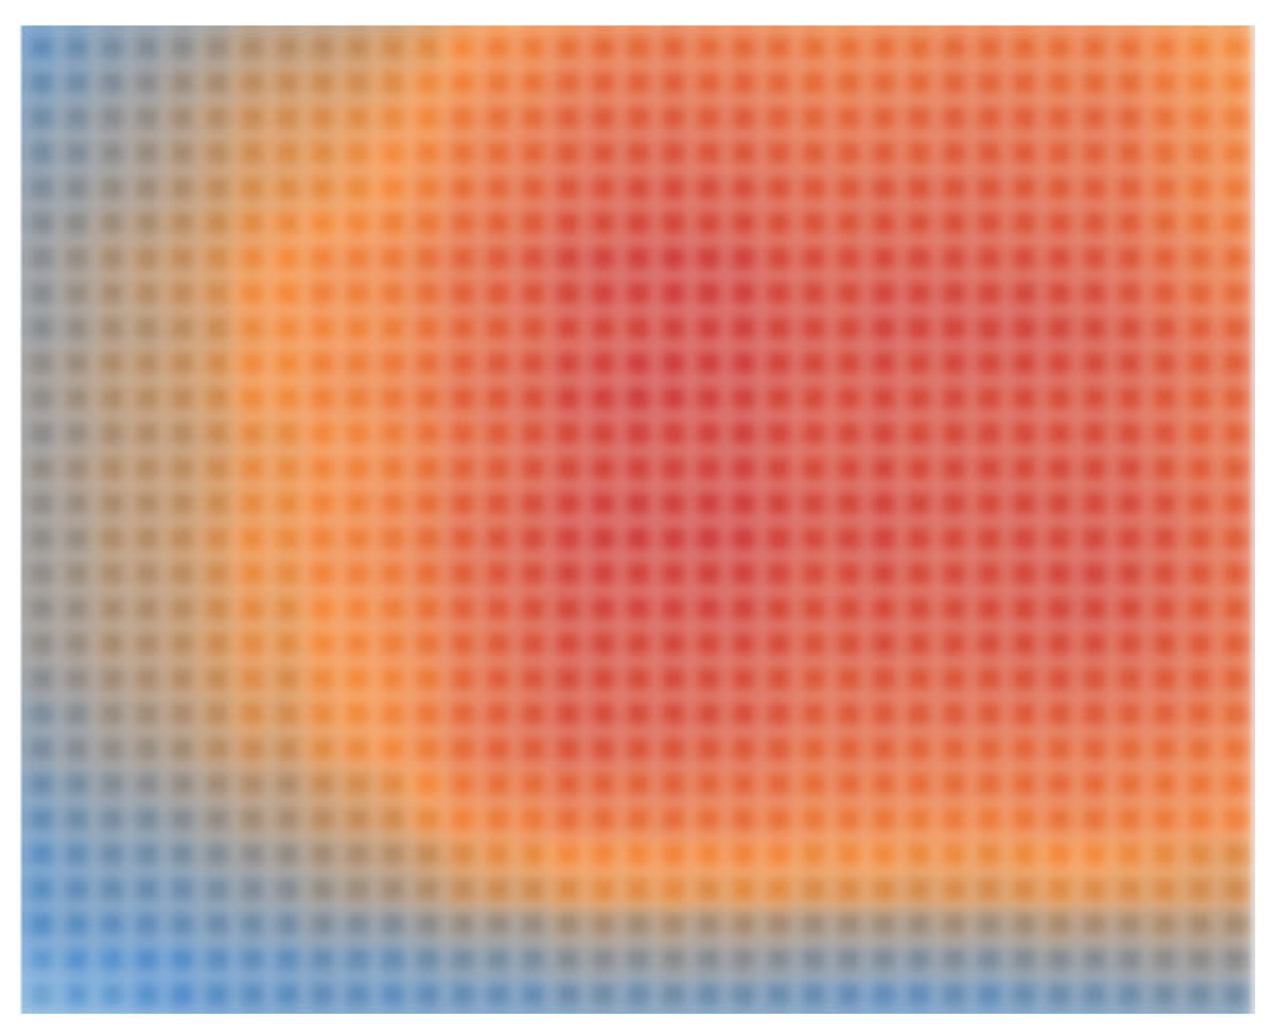
The annotation heat map reports the spatial distribution of the annotated bunches in the images of the dataset. The areas depicted in red indicate the presence of more bunches’ annotations, while blue areas represent the ones with few annotations.
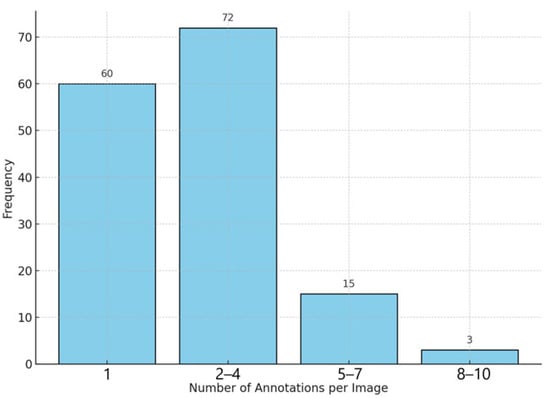
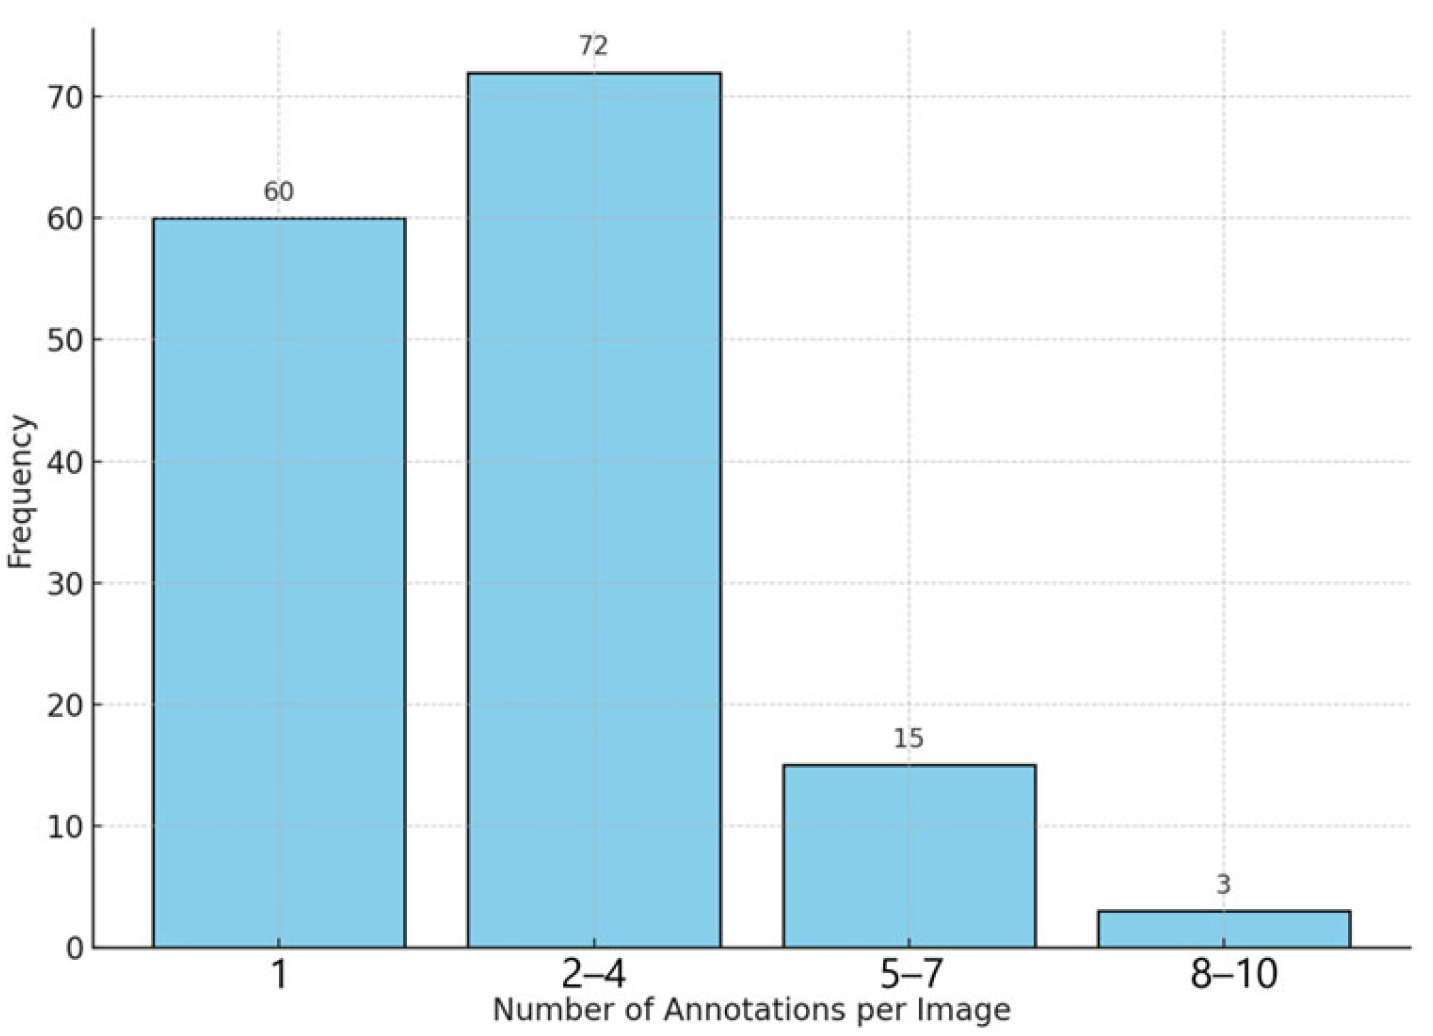
Figure 4 highlights that the annotated bunches are almost uniformly distributed within the images of the dataset. The number of bunches annotated per image is reported in the bar plots presented in Figure 5.
Figure 4.
Annotation heat map reporting the spatial distribution of the annotated bunches within the images of the dataset. Red areas indicate the presence of more bunches’ annotations, while blue areas represent the ones with few annotations.
Figure 5.
Distribution of the number of annotated bunches per image in the dataset.
As shown in Figure 5, in most images of the dataset, the number of annotated bunches was one (40%) or between two and four (48%). Only a few images were included between five and seven (10%) or more (2%).
2.2.3. Dataset Preparation
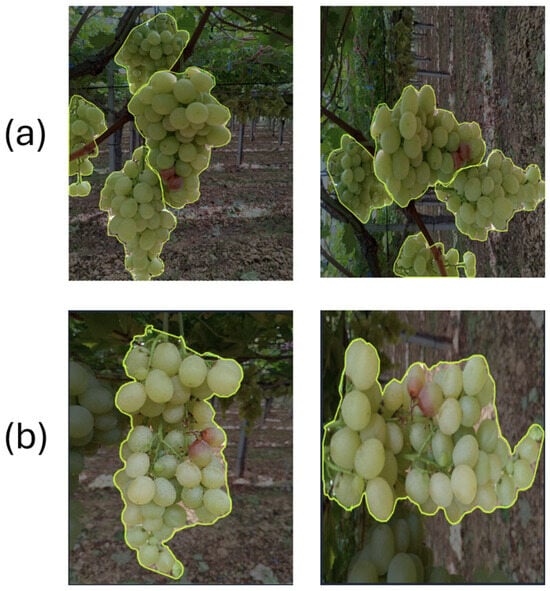
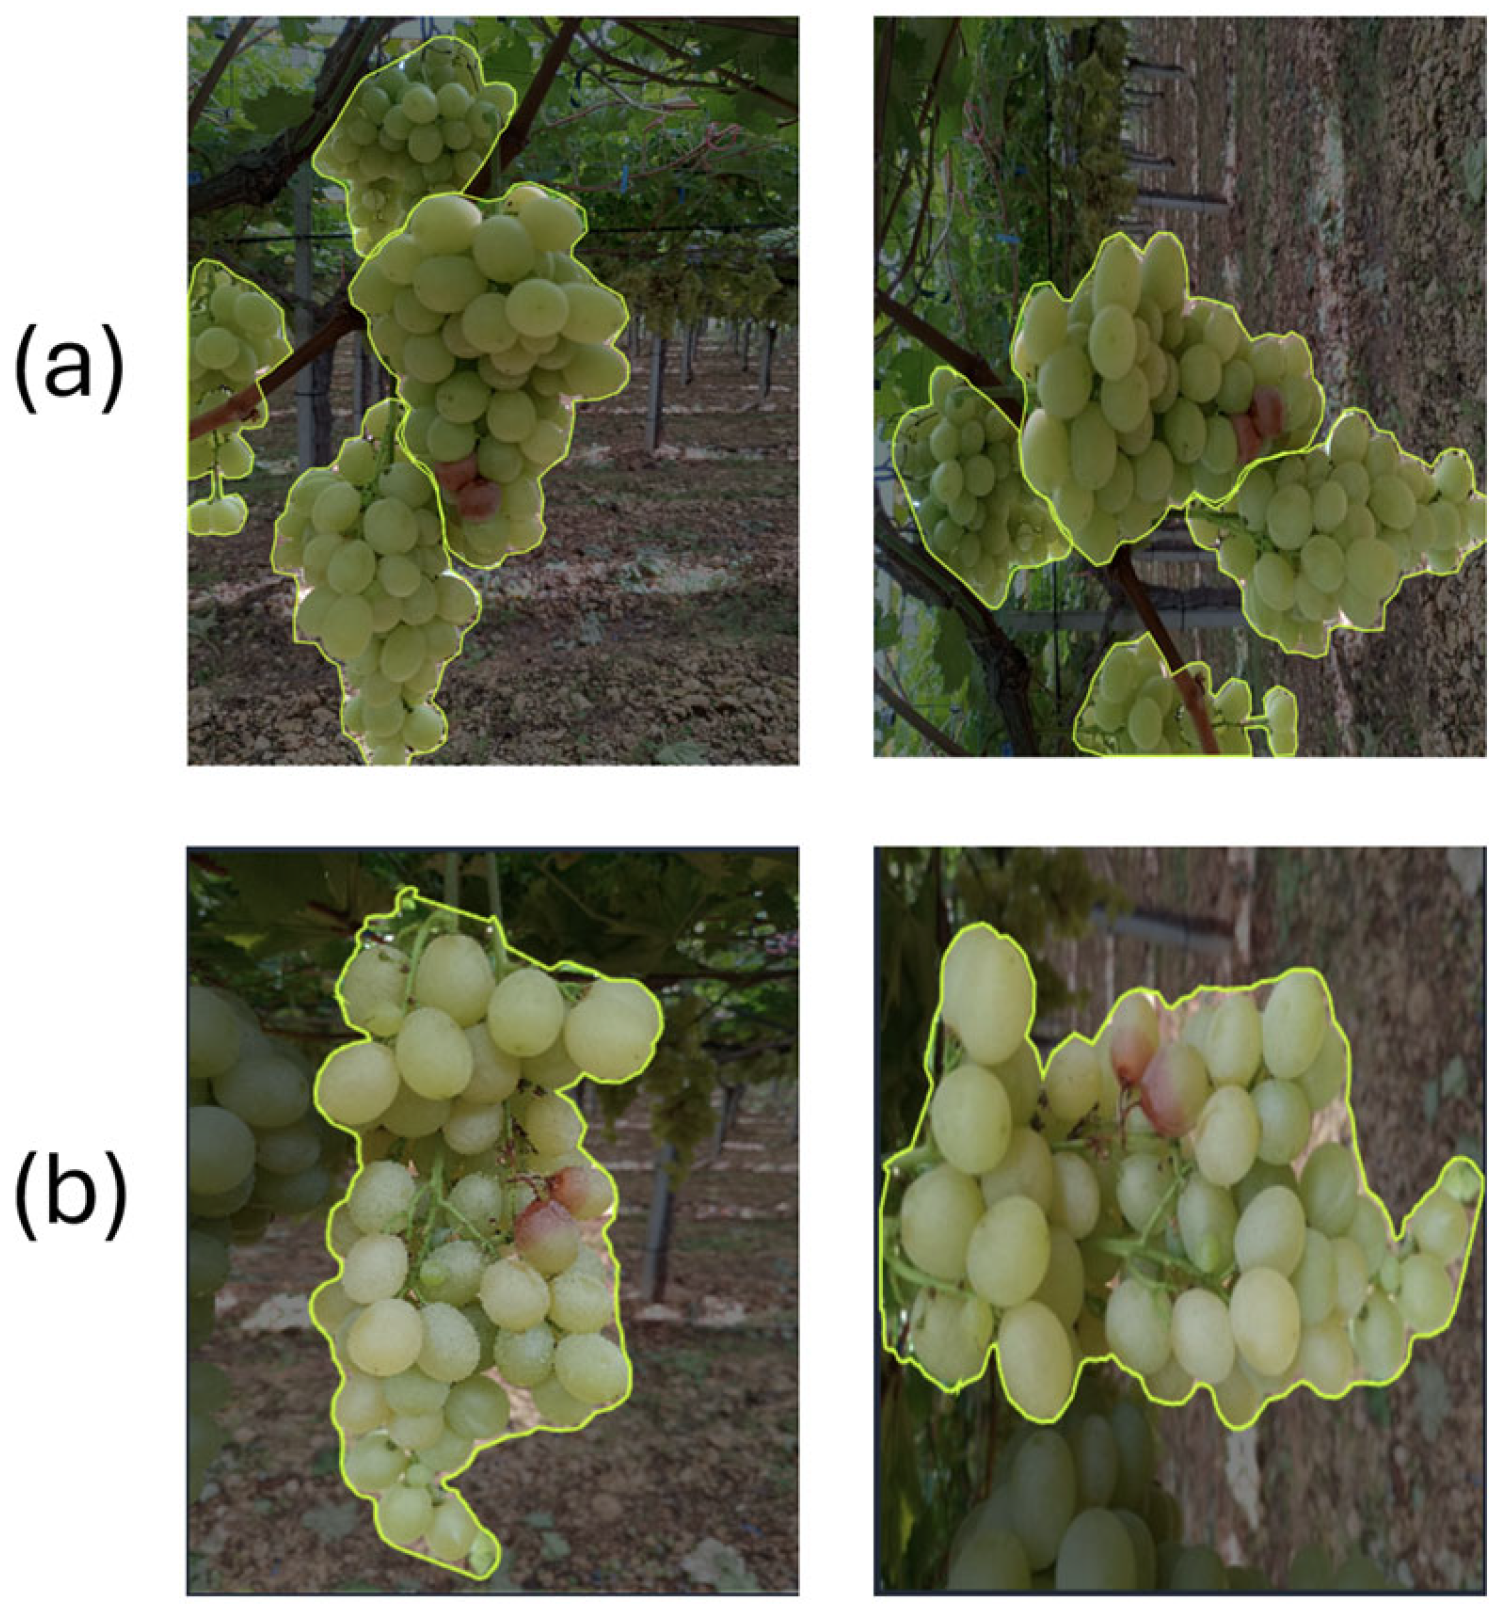
To properly train a computer vision model, it is necessary to split the dataset into three distinct subsets named the training set, validation set, and test set, respectively. This ensures a correct evaluation of the model performance and prevents overfitting phenomena [44]. The training set includes the images used directly for the training process, enabling the model to learn and extract relevant features of the target object to detect. The validation set is used during training to monitor the model’s performance, tune hyperparameters, and prevent overfitting. The test set consists of images excluded from training and validation phases and is used at the end of the training to assess the model’s capability to generalize to unseen data given as input to the model. In this study, for all the considered models, the dataset was divided as follows: 70% of the images were assigned to the training set, 20% to the validation set, and 10% to the test set. The original dataset was normalized, standardized, and expanded using pre-processing and data augmentation techniques to improve the robustness of the model [45]. During the pre-processing step, images were resized to a uniform resolution, eliminating inhomogeneities in image size. In particular, the images were resized to 640 × 640 pixels, except for the RF-DETR model, which required input images of dimension 512 × 512 pixels. Moreover, since some images were not perfectly vertically aligned, an automatic auto-orientation process of pixel data was applied. Successively, data augmentation was performed to artificially increase the dataset dimension and its richness, simulating different acquisition conditions. New images were generated through 90° clockwise and counterclockwise rotations, and the scale of the original images was included in the dataset. An example of an image generated in the data augmentation step through 90° counterclockwise rotation, scaling, and a 90° counterclockwise rotation is shown in Figure 6.
Figure 6.
(a) Example of an original image present in the dataset (on the (left)) and corresponding image generated in the data augmentation step through 90° counterclockwise rotation (on the (right)); (b) Example of an original image present in the dataset (on the (left)) and corresponding image generated in the data augmentation step through a scale and a 90° counterclockwise rotation (on the (right)). Thanks to data augmentation, the dataset reached a total of 320 images. The transformed images aim to improve the predictive capacity of the model and its ability to generalize.
2.2.4. Models’ Performance Evaluation
To assess the overall performance of the trained computer vision models, the most widely adopted metrics in object detection were used, i.e., precision, recall, and Average Precision (AP) [46]. Precision quantifies the proportion of correctly predicted instances among all the instances detected by the model. This metric assesses the model’s ability to avoid false positives. Recall measures the proportion of correctly detected bunches with respect to the number of annotated bunches present in the image. This metric assesses the model’s ability to successfully identify most of the grapes present in the image. The AP is a robust indicator that synthesizes both accuracy and completeness of predictions. The AP can be calculated considering the Intersection over Union (IoU). This parameter quantifies the overlap between a predicted bounding box and the corresponding ground-truth annotation. The AP@50 represents the average accuracy considering an IoU threshold of 0.50; instead, the AP@50:95 measures the average accuracy calculated across multiple IoU thresholds, ranging from 0.50 to 0.95. The latter is a more stringent metric compared to the AP@50, as it requires greater accuracy in predicting bounding box localization.
Beyond quantitative metrics computed on the validation set, a qualitative analysis has been conducted on the test set. The number of the predicted bounding boxes was compared with the ground-truth annotations to assess the detection accuracy of the trained models.
3. Results
Table 1 summarizes the detection performance metrics (Precision, Recall, AP@50, and inference time) obtained on the validation set by the five object detection models employed in this study (Roboflow 3.0 Object Detection, RF-DETR, YOLOv12, YOLOv11, YOLO-NAS), considering white and red grape varieties, after a training process of 300 epochs.
Table 1.
Performance metrics achieved by the considered computer vision models on white and red bunches.
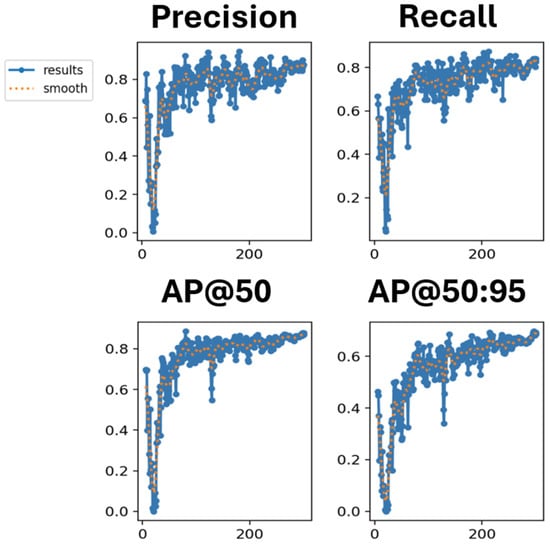
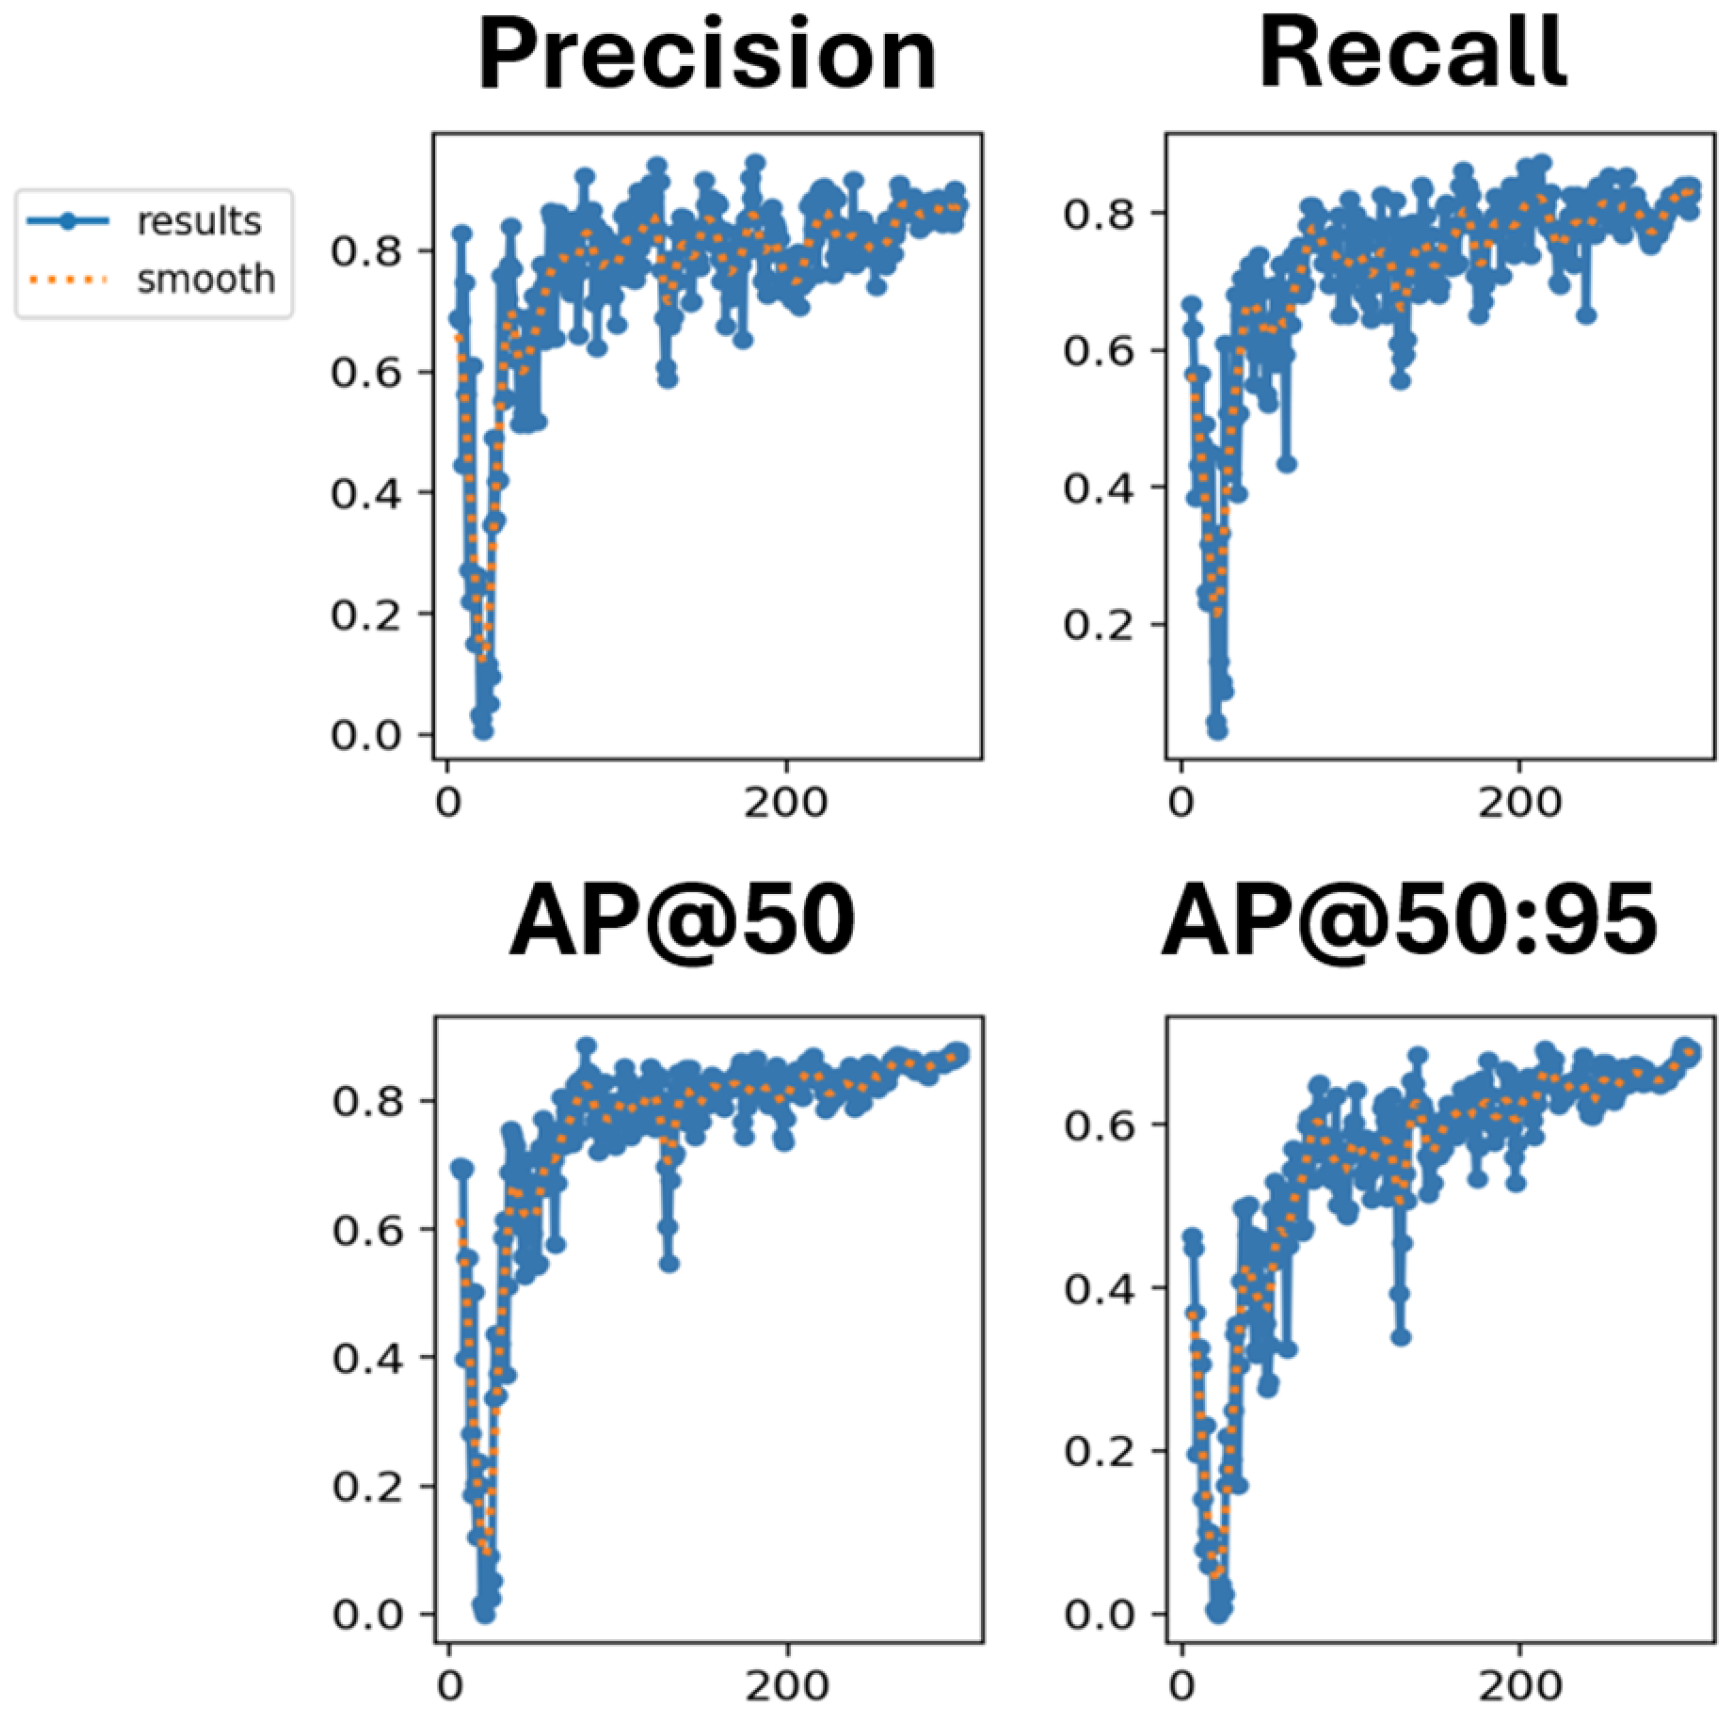
Table 1 highlights that all the models achieve acceptable performance; however, notable differences emerge among them to balance the metrics across the two varieties. Roboflow 3.0 Object Detection provided stable and balanced performance across both grape varieties, achieving a great precision (86.6% for white bunches and 85.7% for red bunches) and the highest recall for white bunches (84.0%), indicating few missed detections. RF-DETR performed better on red bunches, reaching a high precision (83.2%) and AP@50 (84.7%). YOLOv12 model showed competitive performance, especially for red grapes, reaching the highest recall (87.7%) and AP@50 (88.9%). However, its precision is slightly lower compared to the Robflow 3.0 Object Detection model, suggesting a higher rate of false positives. YOLOv11 achieved the best precision for both varieties (88% for white bunches and 89.9% for red bunches). However, the recall dropped to 76.9% for red bunches, indicating a tendency to miss a portion of the target. Lastly, the YOLO-NAS model exhibited the lowest performance for both white and red bunch detection (precision of 76.8% and 73.5%, respectively), highlighting the limited suitability of this architecture for grape cluster detection in the presence of small datasets. All the object detection models investigated have inference times of about 30 min, except for YOLO-NAS, which takes four times longer. YOLO-NAS has a high computational complexity and a heavy and complex backbone, with a lot of parameters. Compared with newer architectures, such as YOLOv11/12 and the Roboflow-developed models, which are optimized for obtaining short inference time, it is not optimized for lightweight applications and suffers from prolonged inference time. The trend of Precision, Recall, AP@50, and AP@50:95 during the training process of the Roboflow 3.0 Object Detection model on white bunches is reported in Figure 7. In each graph, the blue solid line indicates the obtained results, and the orange dashed line represents the smoothed curve.
Figure 7.
Precision, Recall, AP@50, and AP@50:95 obtained during the training process of the Roboflow 3.0 Object Detection model.
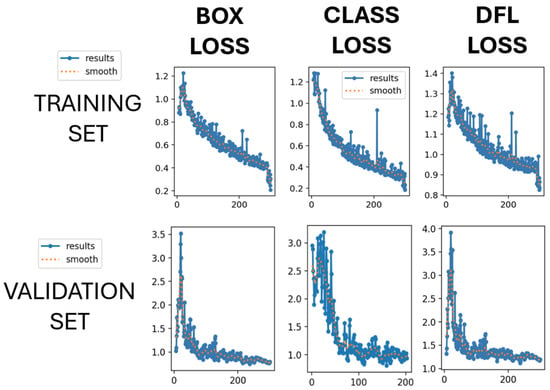
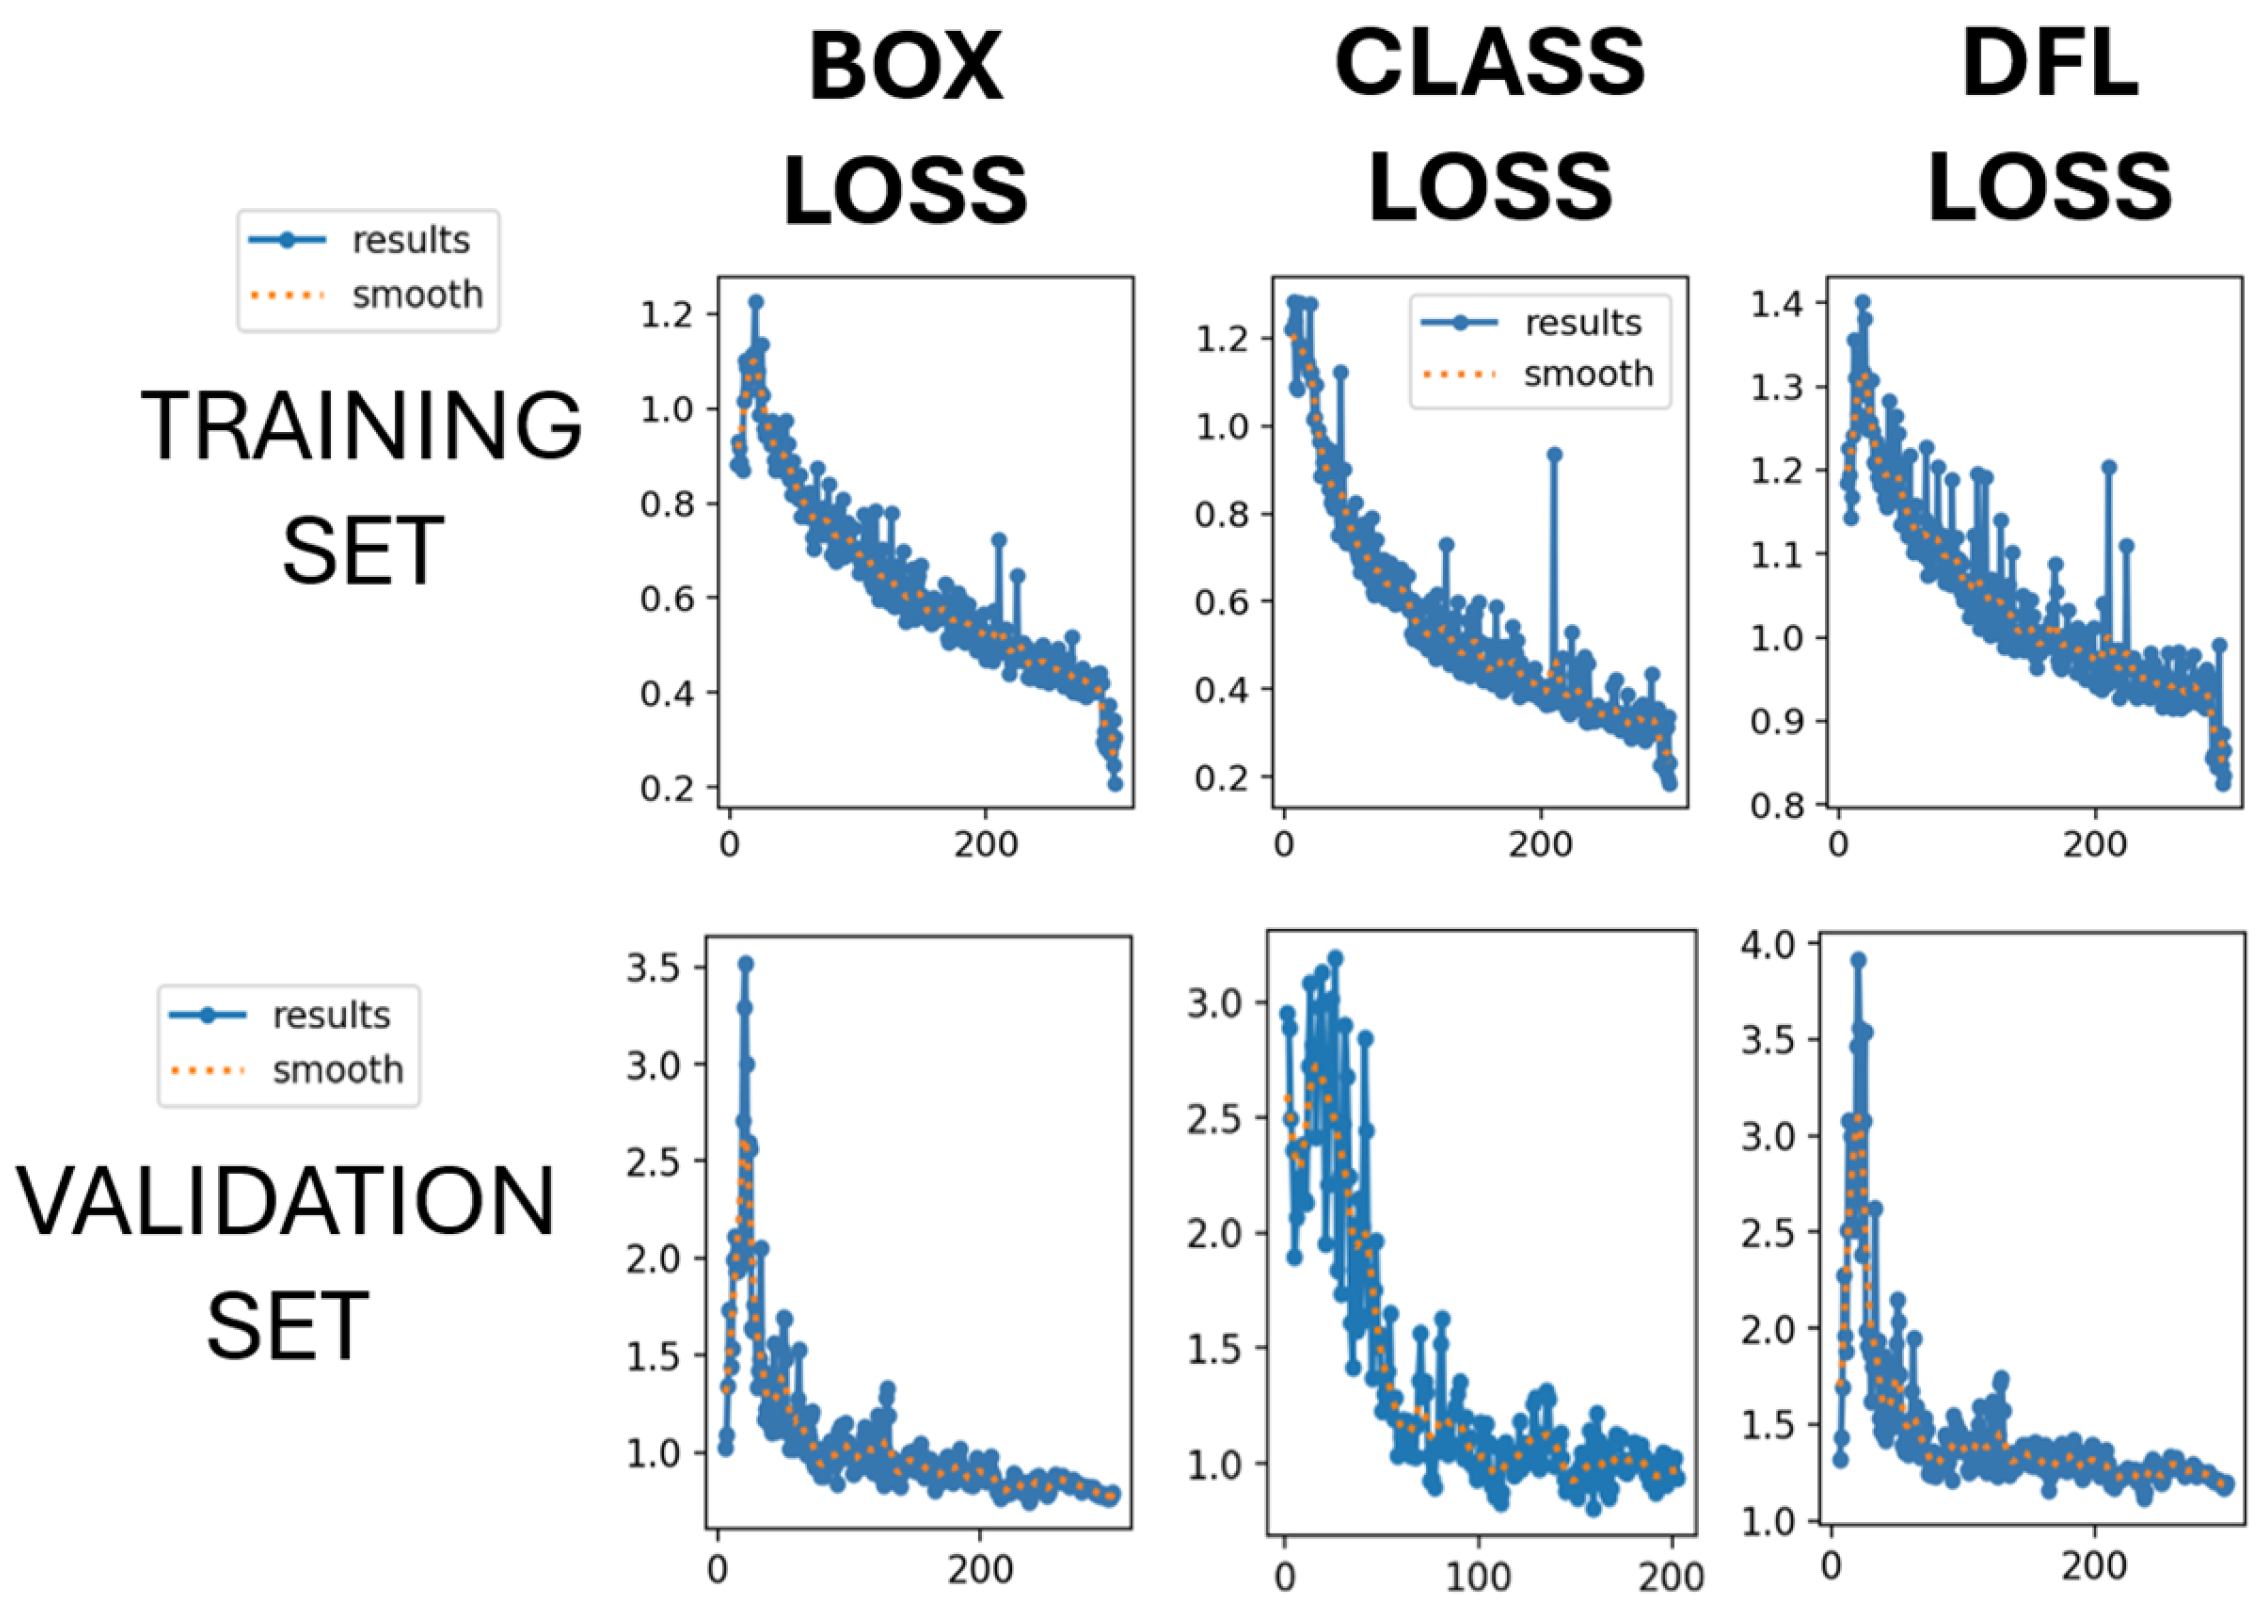
The performance of the Roboflow 3.0 Object Detection model tends to settle after about 100 epochs, stabilizing at ~0.86 for precision and ~0.81 for recall. The concurrent rise in precision and recall and their convergence to high values demonstrated the model’s effective quick learning process for grape bunch detection. After 100 epochs, the AP@50 gradually converged to about ~0.87, indicating a high accuracy in bounding box localization. As expected, the AP@50:95 reached a lower value (~0.69), reflecting the more stringent requirement. The simultaneous and monotonic improvements of all the considered metrics demonstrated a stable, well-balanced, and robust learning process. These results highlight the quality of the training process and the ability of the model to generalize to new input images. Moreover, Box Loss, Class Loss, and Distribution Focal Loss (DFL) were evaluated for the Roboflow 3.0 Object Detection model [47]. Box Loss measures distance and overlap between the predicted bounding box and the ground-truth box, quantifying the error in position, size, and shape. Class Loss evaluates the model’s accuracy to correctly classify the detected objects, and it is usually computed using a probabilistic approach based on Cross-Entropy. Distribution Focal Loss (DFL) is used to refine bounding box predictions, particularly for objects that are difficult to discriminate, obtaining sub-pixel precision. The trends of these three loss components for both training and validation sets are reported in Figure 8. In each graph, the blue solid line indicates the obtained results during training, and the orange dashed line represents the smoothed curve.
Figure 8.
Box Loss, Class Loss, and DFL of the train and validation sets obtained during the training process of the Roboflow 3.0 Object Detection model.
Figure 8 shows that a convergent monotonic decrease was obtained for the Box Loss, Class Loss, and DFL for the training set, indicating effective optimization and the model’s continuous learning capability. Box Loss decreased from 1.2 to 0.3, indicating progressive improvements in bounding box accuracy. At the same time, Class Loss decreased from 1.2 to 0.3, highlighting a strong enhancement in classification accuracy during training. Finally, DFL was reduced from 1.4 to 0.9, confirming increased precision in predicting bounding box boundaries. Concerning the validation set, as expected, a significant initial variance was observed in the first 50 epochs for all the losses, due to the small size of the dataset. However, during the training, all losses showed decreasing trends, demonstrating the model’s ability to generalize well to unseen input images. The Box Loss and Class Loss on the validation set converged to 0.9, while the DFL stabilizes at 1.2, suggesting that most generalization errors stem from classification rather than localization. The convergence of losses, both in the training and validation sets, highlights the effectiveness and stability of the training process, as well as the absence of overfitting, since both sets show similar trends.
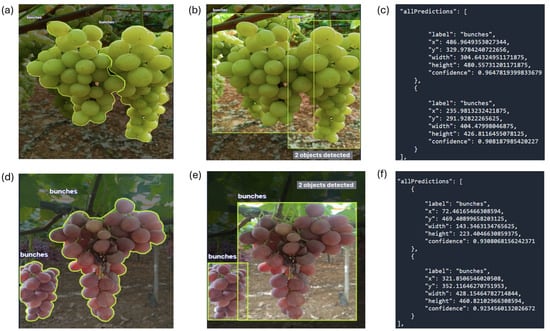
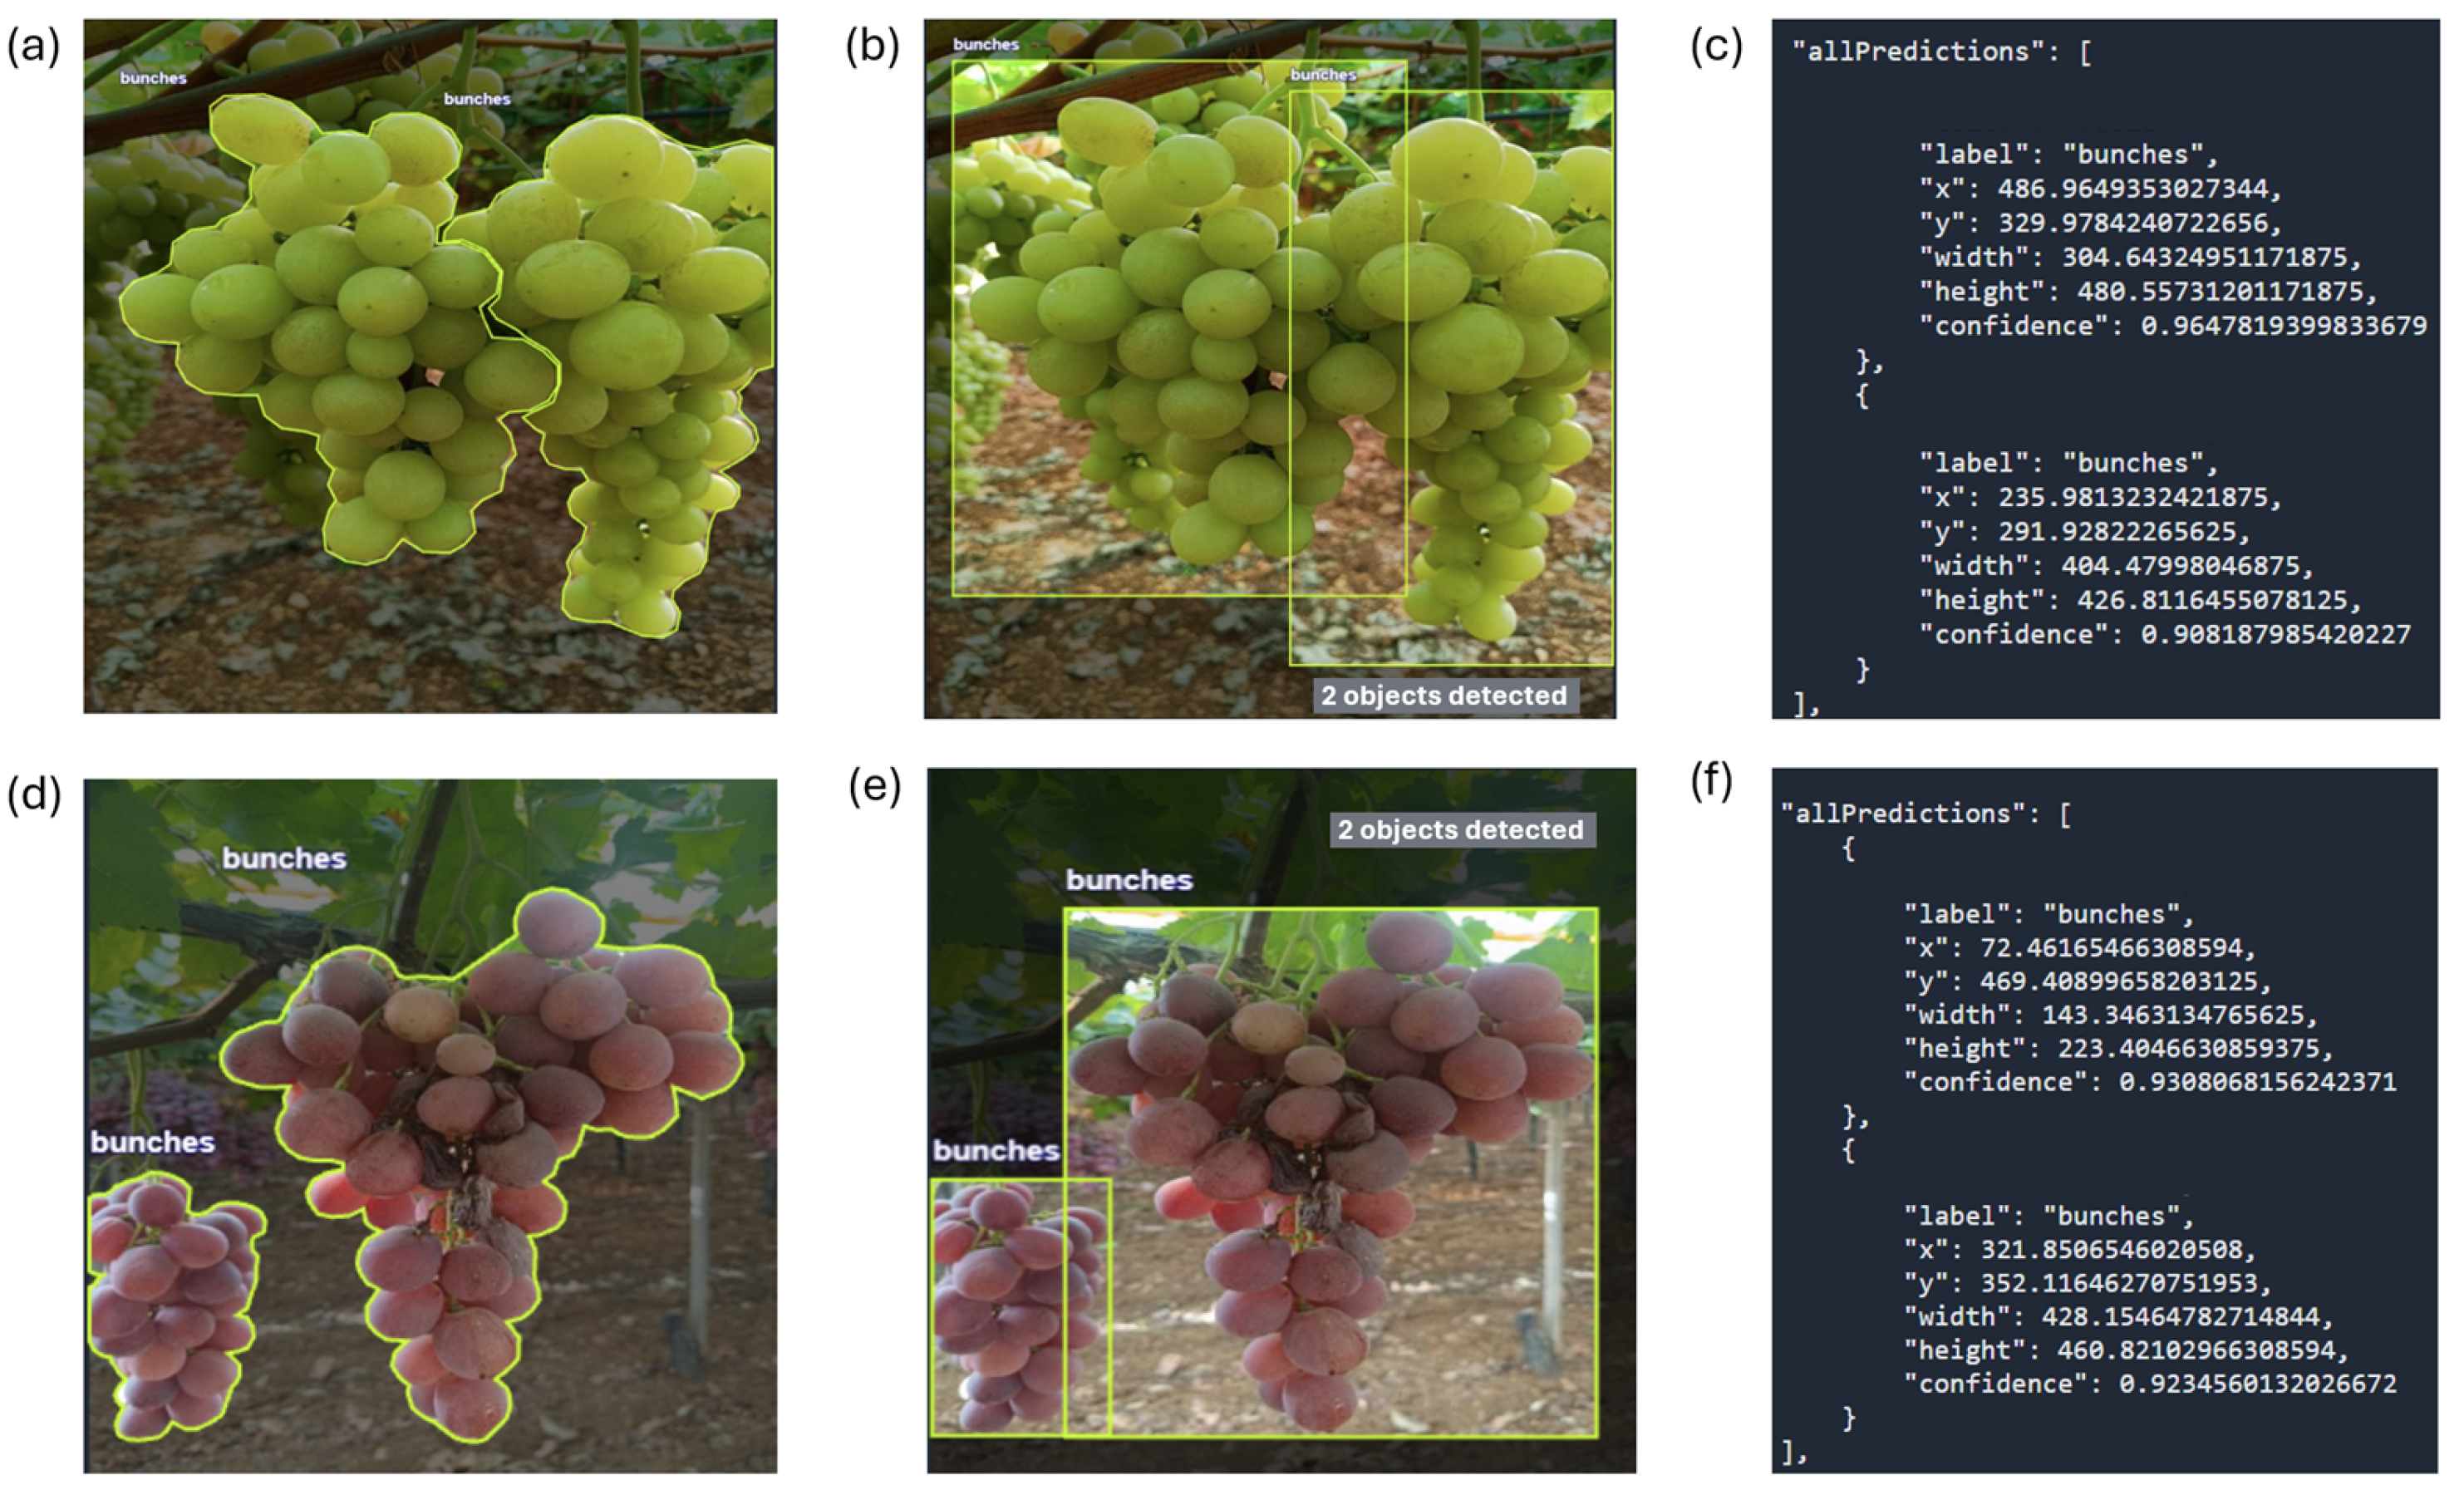
Furthermore, a qualitative analysis to assess the detection accuracy of the trained models has been carried out on some images included in the test set, comparing the number of predicted bounding boxes with the ground-truth annotations. An example of the predictions after training the Roboflow 3.0 Object Detection model, in case of clearly visible and non-overlapping white and red bunches, is presented in Figure 9b,c, together with the corresponding ground truth measurement (Figure 9a).
Figure 9.
(a,d) Annotated images of the test set; (b,e) predictions of the Roboflow 3.0 Object Detection model; (c,f) output information about the predictions.
Figure 9b shows that the Roboflow 3.0 Object Detection model correctly detects the two white bunches annotated in the test set image (panel (a)) with a high confidence level (over 0.90). Figure 9d shows the labelled test image containing two red bunches, and panel (e) shows the predicted red bunches. Panels (c) and (f) report the x and y position, as well as the width and height of the predicted bunches in pixels. It is important to note that, in case of clearly visible and non-overlapping bunches (as the case presented in Figure 9), Roboflow 3.0 Object Detection, YOLOv11, YOLOv12, and YOLO-NAS models correctly detect the bunches for both the white and red varieties. Due to the Roboflow platform’s limitation, it is not possible to visualize the predictions generated by the RF-DETR model in the web-based preview interface.
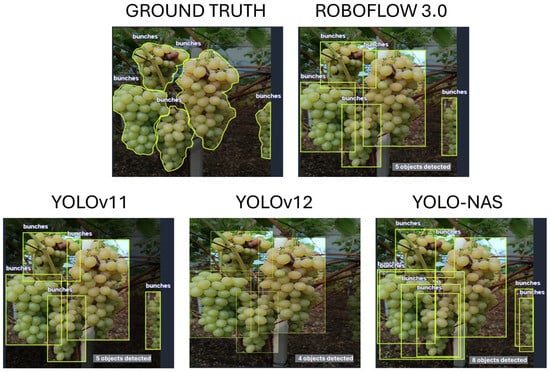
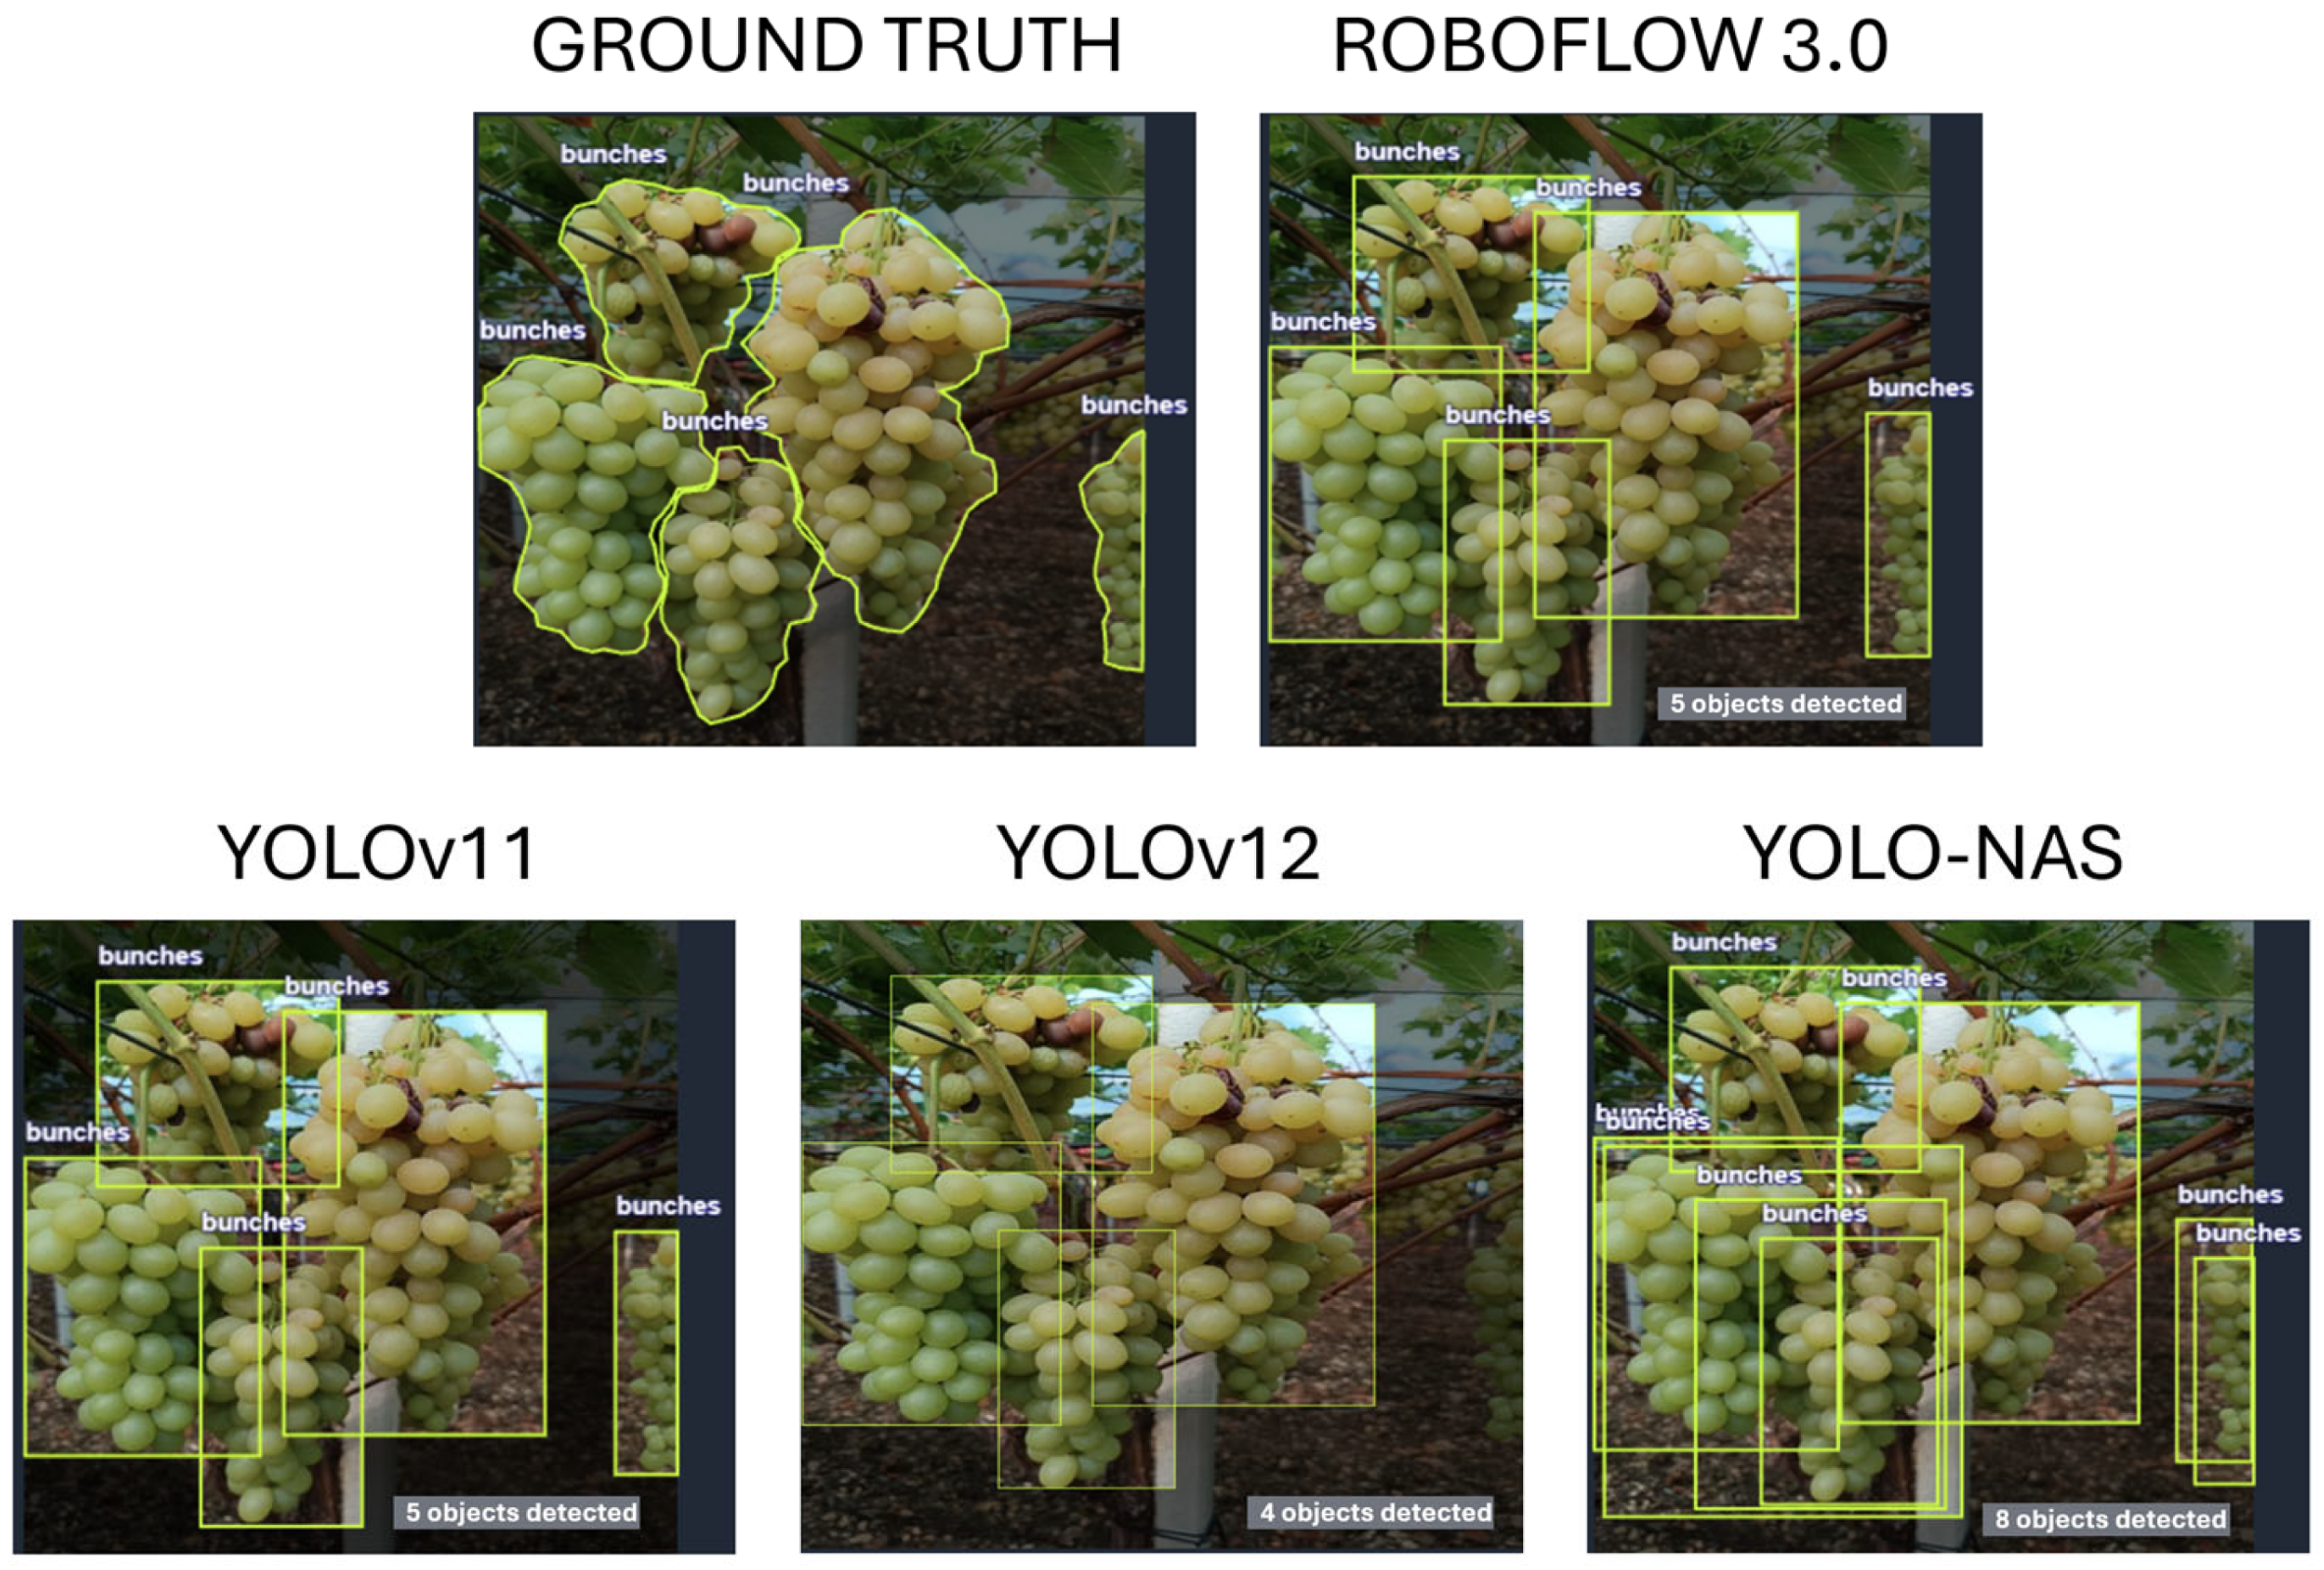
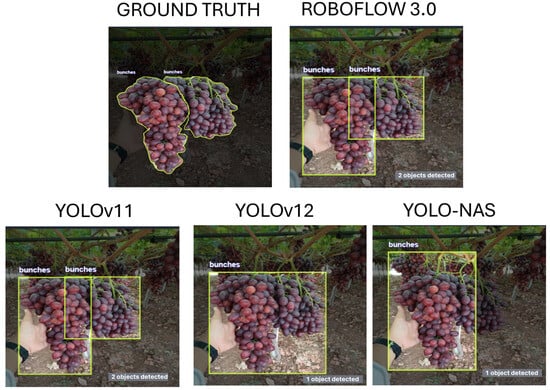
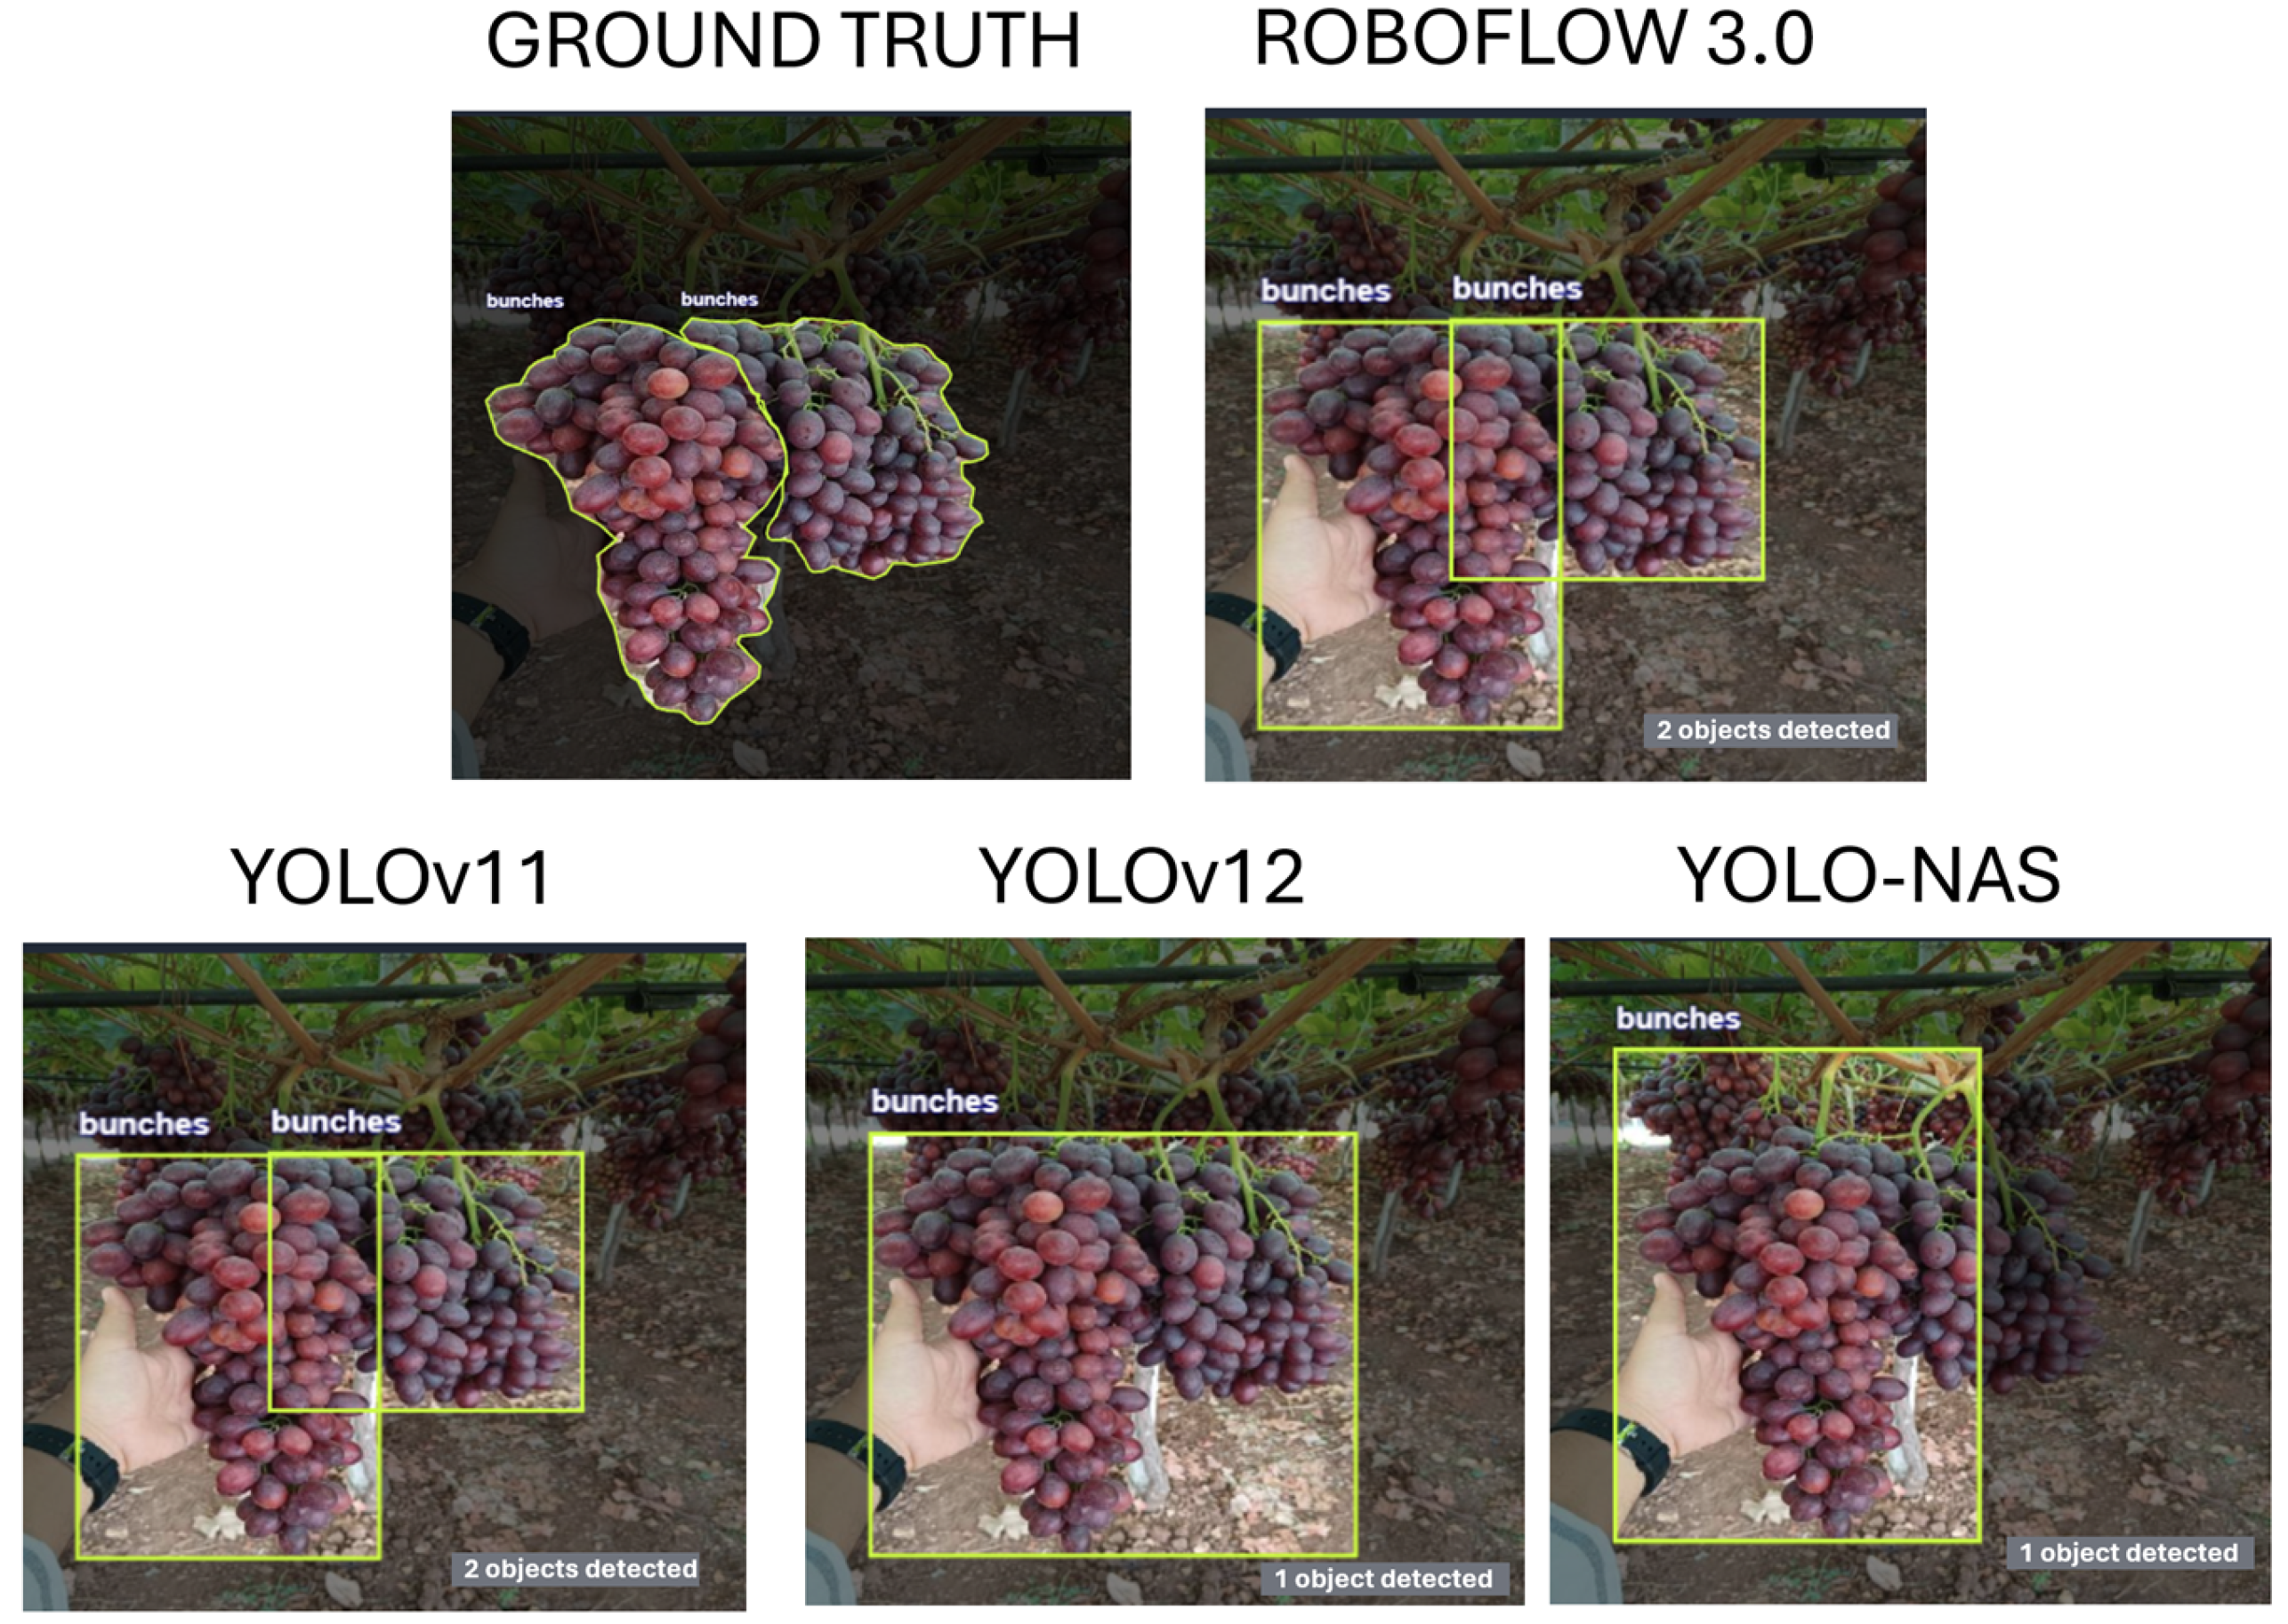
The accuracy of detection of the trained computer vision models has also been analyzed in the challenging case of overlapping clusters. The recognition effect graph for each trained model in the detection and counting of white bunches is presented in Figure 10. Due to the Roboflow platform’s limitation, it is not possible to visualize the predictions generated by the RF-DETR model in the web-based preview interface.
Figure 10.
Recognition effect graph of each trained model for the detection and counting of white bunches.
Figure 10 highlights that in the ground-truth image of the test set, five different grape clusters have been annotated. Four central bunches heavily overlap each other, and the fifth is partially visible on the right. The Roboflow 3.0 Object Detection mode and YOLOv11 models effectively recognize all five bunches, with a confidence level over 0.90 for all five bunches, suggesting that these models also exploit contextual information and confirming the obtained high metrics. The YOLOv12 model recognizes the four overlapping bunches, but it fails to detect the partially visible grape, indicating that the model is less robust to truncated objects. This result is in line with the lower recall obtained for this model (81.6%). The YOLO-NAS model produces multiple bounding boxes in the same regions, which leads to incorrect bunch separation and detection. This is confirmed by the low precision and AP@50 of this model.
The recognition effect graph for each trained model in the detection and counting of red bunches is presented in Figure 11.
Figure 11.
Recognition effect graph of each trained model for the detection and counting of red bunches.
Figure 11 shows that two overlapping grape clusters have been annotated in the ground truth image included in the test set. Also in this case, the Roboflow 3.0 Object Detection mode and YOLOv11 models successfully detect the two overlapping bunches, producing two separate bounding boxes. In particular, YOLOv11 achieves a confidence level of over 0.93, indicating the model’s suitability in these challenging conditions. In contrast, the YOLOv12 model fails to distinguish between the two overlapping bunches and identifies one big cluster containing both. Similarly, the YOLO-NAS model incorrectly identifies only one of the two annotated bunches.
4. Discussion
4.1. Comparison of the Obtained Results with the Literature
The metrics adopted in this study to evaluate the performance of the tested models are widely used in computer vision. The metrics obtained were compared with those reported in the literature using several object detection models. In 2021, Sozzi et al. [22] evaluated the automatic detection of white grape varieties on a dataset of 2985 images using different YOLO models. The best performance was obtained using the YOLOv5x model, reaching a precision and a recall of 77% and 72%, respectively. In 2023, Shen et al. [48] used a lightweight version of YOLOv5 to detect overlapping white grape clusters starting from videos captured directly in the field and achieving a mAP@50 of 82.3%. Aguilar et al. [49] compared the performance of several models of Single Shot Detectors (SSD) on a dataset of 1929 images containing white grape bunches at different phenological stages. They found that the best model for medium and big bunch detection was SSD MobileNet-V1, which reached a precision of 61.7% and a recall of 87%. Santos et al. [50] developed an R-CNN and obtained a precision of 87% and a recall of 83%, considering an IoU of 0.5. Li et al. [51] compared different object detection models (YOLO, CNN, and SSD300) on white and purple-red grape images. They found that SSD300 performed better on purple-red grapes (precision of 88% and recall of 89%), while YOLOv4 performed better (precision of 89% and recall of 93%) on white grapes. To the authors’ knowledge, no scientific studies are present in the literature in which the latest models developed by Roboflow (Roboflow 3.0 Object Detection and RF-DETR) and YOLO (YOLOv11, YOLOv12, and YOLO-NAS) have been used for grape bunch detection. Sapkota et al. [52] evaluated the performance of RF-DETR and YOLOv12 models for the detection of green fruits using RGB images collected by an autonomous rover, obtaining very similar results in terms of precision and recall (86% and 88%, respectively). The results obtained in this study using the considered models are consistent with those presented in the literature. The Roboflow 3.0 Object Detection model achieved stable and well-balanced results across both grape varieties, with high precision and recall. In particular, the Roboflow 3.0 Object Detection model was able to correctly detect the bunches even in overlapping conditions. In contrast, RF-DETR performed better on red bunches, achieving high precision (83.2%) and AP@50 (84.7%). The YOLO family exhibited strong performances as well. YOLOv12 achieved the best results for red bunches detection, reaching the highest recall (87.7%) and AP@50 (88.9%); however, in the case of overlapping bunches, it failed to correctly separate them. YOLOv11 reached the highest precision for both grape varieties (88% for white bunches and 89.9% for red bunches) but a slightly lower recall (82.6% for white bunches and 76.9% for red bunches); it performs particularly well in the presence of overlapping bunches. In contrast, YOLO-NAS exhibited the lowest performance for both white and red bunch detection (precision of 76.8% and 73.5%, respectively) and was unable to correctly identify overlapping bunches. Overall, the results obtained in this study highlight the superior performance of the Roboflow 3.0 Object Detection and YOLOv11 models under challenging conditions, which are the most representative of real operating conditions. It is worth noting that, although the dataset used in this study is much smaller compared to [22], the performance obtained by the YOLO-based models considered in this study is considerably higher compared to [22], thanks to the improved overall accuracy achieved by the latest YOLO models.
4.2. Applicability of the Proposed Approach in Real Operating Conditions
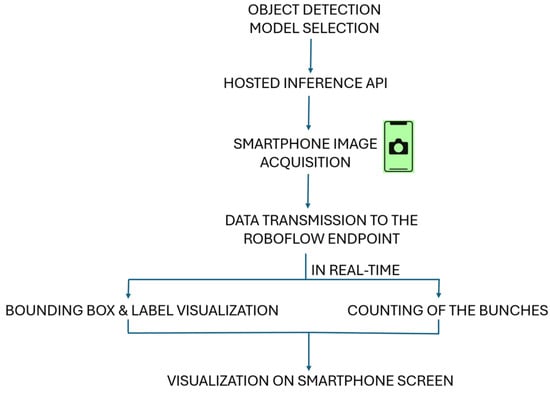
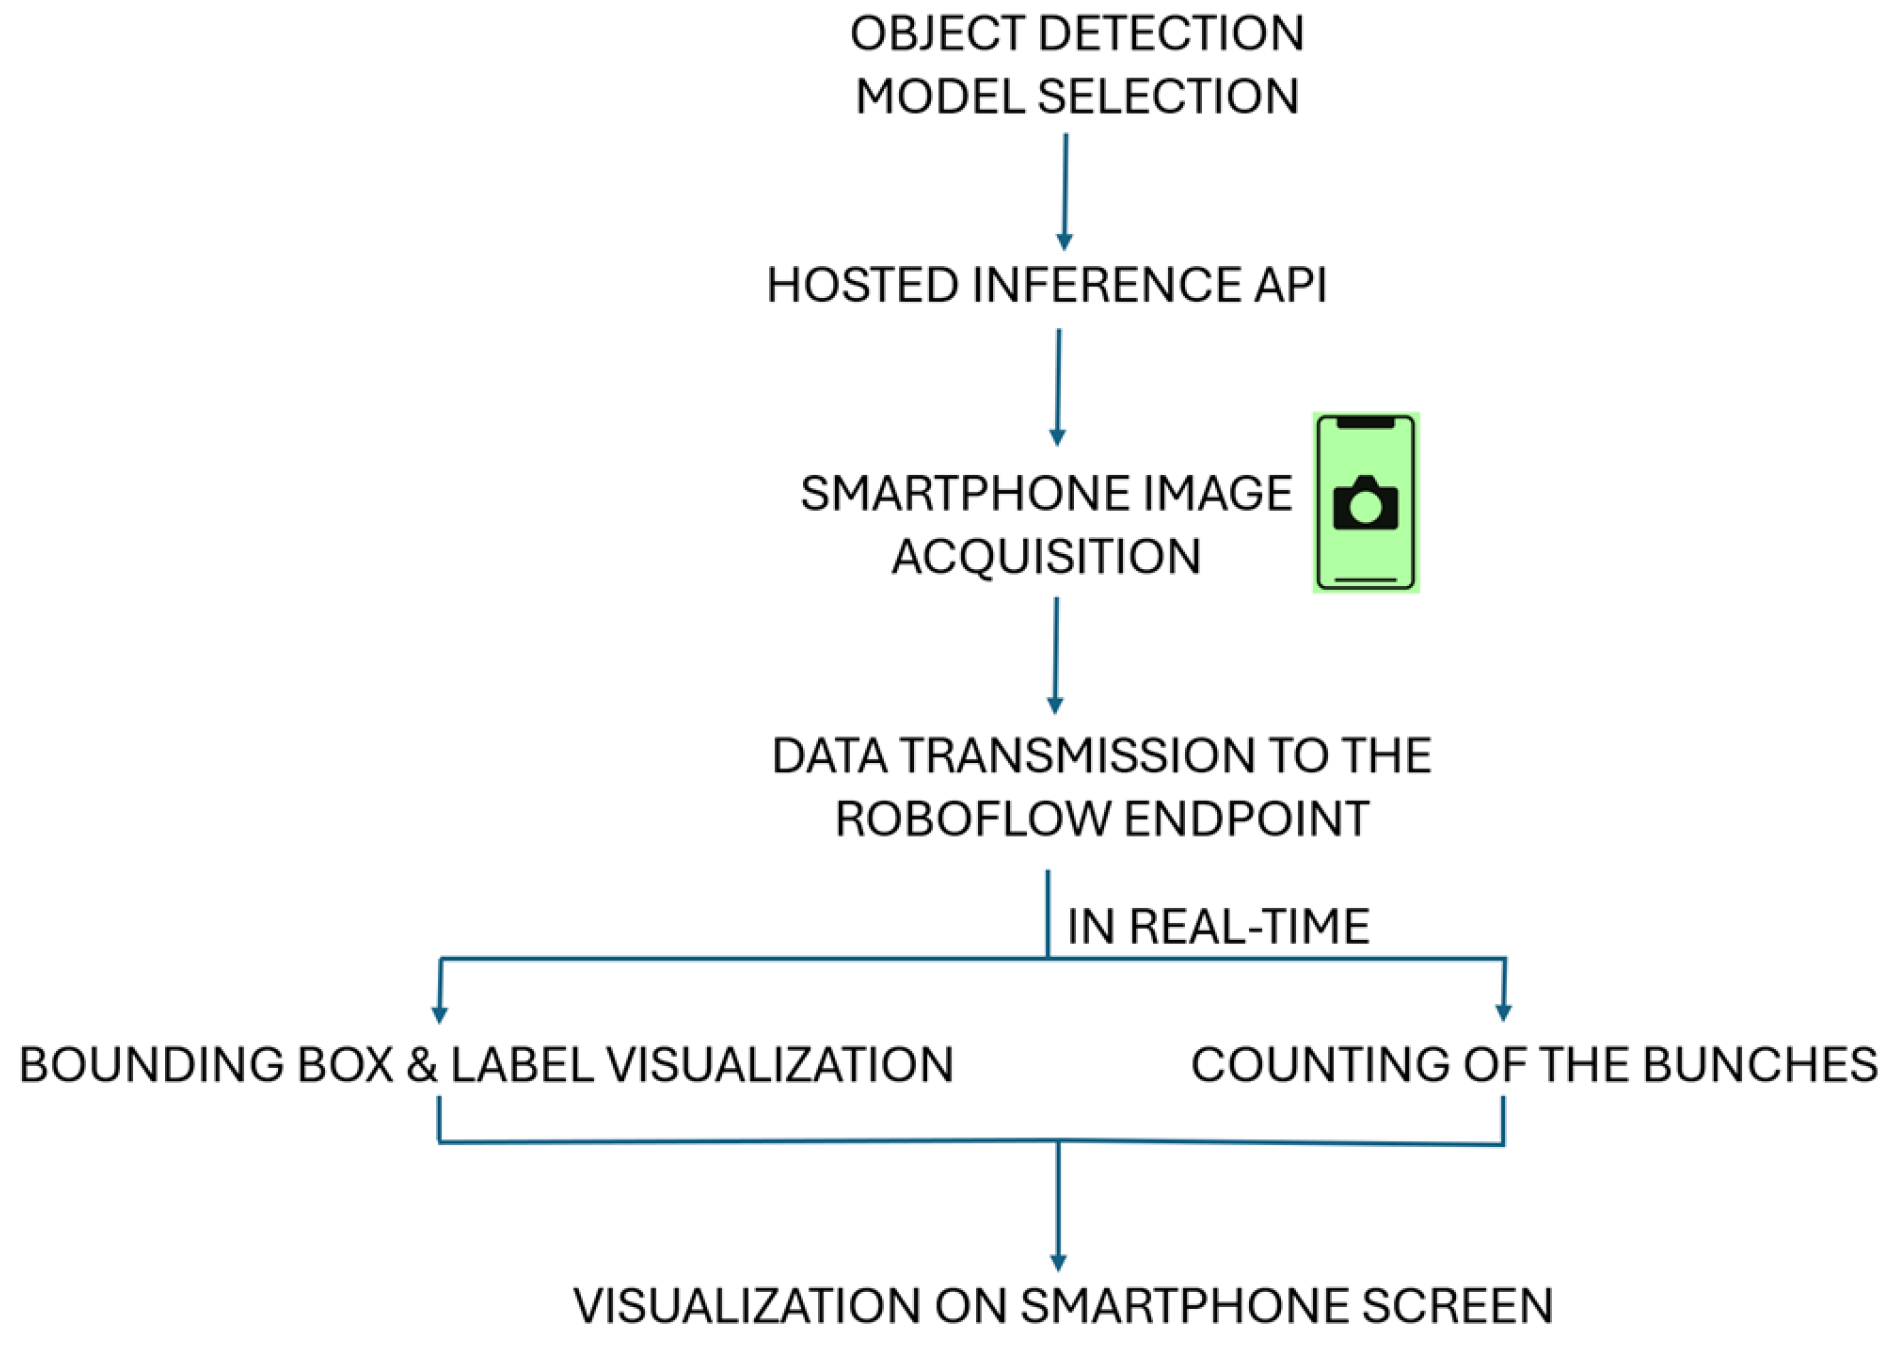
The computer vision models trained in this study using the Roboflow 3.0 platform can be deployed in various computing platforms, including smartphones and edge devices such as NVIDIA Jetson systems or Raspberry Pi, for real-time and in-field applications. The deployment can be performed using two strategies: execute the model locally on the device, ensuring low latency and offline features, or leverage cloud-based inference via the Roboflow REST API, which transmits data to a remote server for processing [53]. The first strategy requires deep knowledge, instead the second one is simpler and can also be performed by non-expert users. The choice of deployment strategy depends on operational constraints, such as latency, connectivity, and computational resources. A simplified scheme of the deployment using the cloud-based inference via the hosted inference API is reported in Figure 12.
Figure 12.
Simplified scheme of deployment using the cloud-based inference via a hosted inference API.
The images captured using a smartphone are transmitted in real time to the cloud for inference. Bunch counting, along with bounding box and label visualization, is displayed to the user on the smartphone. The main operational difficulty that a farmer can encounter in deployment is related to the API integration; however, in the new update, the Roboflow platform provides a QR code feature that allows a trained model to be used directly on a mobile device without manual API integration. Other barriers to successful deployment include the need for a stable internet connection, to avoid failed inference requests and non-real-time behaviour; image acquisition consistency, in terms of motion blur and camera-to-bunch distance; and correct result interpretation.
In the author’s opinion, this study points out that the Roboflow platform represents a viable solution for non-expert users, including farmers, since it is intuitive and user-friendly. The platform can be used for semi-automatic labelling, training pre-trained models, and for their subsequent deployment on mobile devices for fruit detection tasks. In this work, the free demo version of the Roboflow 3.0 platform was used, highlighting that the development of accurate fruit detection models can be performed at no cost by leveraging pre-trained models. This approach allows the implementation of a farmer-friendly solution for automatic grape detection.
Testing real-world operating scenarios of the computer vision models trained in this study and their deployment on a mobile device will be carried out in the next vineyard vegetative season, which in Apulia takes place from the end of July to the end of September. During these tests, varying operating environmental conditions will be considered, including different times of acquisition, light conditions, distance from the bunch and viewpoint, and background, to evaluate models’ detection stability and accuracy. Furthermore, field tests will be carried out to evaluate the detection accuracy of the trained models by counting the grape clusters within a sample area.
5. Conclusions
This study compared five state-of-the-art computer vision models trained using the free demo version of the Roboflow 3.0 platform, with the aim of automatically detecting white and red table grape bunches. The images used to train and test the models were acquired directly in the field using a smartphone. The results obtained in this study confirm the robustness and reliability of the computer vision-based approach for grape bunch detection, even when trained with a small dataset that includes medium-quality RGB images. High detection accuracy was reached on the test set, including the challenging scenario with overlapping grape bunches, especially with the Roboflow 3.0 Object Detection, YOLOv11, and YOLOv12. This points out the suitability of these architectures for the detection of white and red table grape bunches during training. Overall, this study demonstrates the feasibility of developing accurate computer vision models for free in the Roboflow platform, offering a simple and accessible solution for non-expert users, including farmers. Future research will focus on the deployment of the trained models on a mobile device and on the evaluation of their performance under operating field conditions.
Author Contributions
Conceptualization, F.V., G.P. and F.P.; methodology, F.P.; software, F.V. and F.P.; validation, F.P.; formal analysis, F.S. and F.P.; investigation, F.P.; resources, G.P.; data curation, F.P.; writing—original draft preparation, F.P.; writing—review and editing, F.V., G.P., F.S.; S.P. and F.P.; visualization, F.P.; supervision, F.P.; project administration, S.P.; funding acquisition, S.P. All authors have read and agreed to the published version of the manuscript.
Funding
This research was carried out within the Agritech National Research Centre and received funding from the European Union Next-GenerationEU (PIANO NAZIONALE DI RIPRESA E RESILIENZA (PNRR)—MISSIONE 4 COMPONENTE 2, INVESTIMENTO 1.4—D.D. 1032 17 June 2022, CN00000022). CUP H93C22000440007. This manuscript reflects only the authors’ views and opinions; neither the European Union nor the European Commission can be considered responsible for them.
Data Availability Statement
The original data presented in the study are openly available in the Grape Dataset at https://universe.roboflow.com/franc-uzdtk/grapes-riejc-sznrg (accessed on 10 June 2024).
Conflicts of Interest
The authors declare no conflicts of interest.
References
- ISMEA Report n. 2/2024, Focus Uva da Tavola. Available online: https://www.ismeamercati.it (accessed on 15 October 2025).
- Seccia, A.; Viscecchia, R.; De Devitiis, B.; Nardone, G.; Bimbo, F. Italy Sweet Revolution: How Club Grapes Are Transforming the Table Grape Market. In Proceedings of the 45th World Congress of Vine and Wine, Dijon, France, 14–18 October 2024. [Google Scholar]
- Laurent, C.; Oger, B.; Taylor, J.A.; Scholasch, T.; Metay, A.; Tisseyre, B. A review of the issues, methods and perspectives for yield estimation, prediction and forecasting in viticulture. Eur. J. Agron. 2021, 130, 126339. [Google Scholar] [CrossRef] [Scilit]
- Khan, Z.; Shen, Y.; Liu, H. Object detection in agriculture: A comprehensive review of methods, applications, challenges, and future directions. Agriculture 2025, 15, 1351. [Google Scholar] [CrossRef] [Scilit]
- Clingeleffer, P.R.; Martin, S.; Krstic, M.; Dunn, G.M. Crop development, crop estimation and crop control to secure quality and production of major wine grape varieties. In A National Approach: Final Report to Grape and Wine Research & Development Corporation; Grape and Wine Research & Development Corporation: Adelaide, Australia, 2001. [Google Scholar]
- Ferro, M.V.; Catania, P. Technologies and innovative methods for precision viticulture: A comprehensive review. Horticulturae 2023, 9, 399. [Google Scholar] [CrossRef] [Scilit]
- Yu, Y.; Zhang, K.; Liu, H.; Yang, L.; Zhang, D. Real-time visual localization of the picking points for a ridge-planting strawberry harvesting robot. IEEE Access 2020, 8, 116556–116568. [Google Scholar] [CrossRef] [Scilit]
- Izquierdo-Bueno, I.; Moraga, J.; Cantoral, J.M.; Carbú, M.; Garrido, C.; González-Rodríguez, V.E. Smart viniculture: Applying artificial intelligence for improved winemaking and risk management. Appl. Sci. 2024, 14, 10277. [Google Scholar] [CrossRef] [Scilit]
- Quiñones, R.; Banu, S.M.; Gultepe, E. GCNet: A Deep Learning Framework for Enhanced Grape Cluster Segmentation and Yield Estimation Incorporating Occluded Grape Detection with a Correction Factor for Indoor Experimentation. J. Imaging 2025, 11, 34. [Google Scholar] [CrossRef] [Scilit]
- Olorunshola, O.; Jemitola, P.; Ademuwagun, A. Comparative study of some deep learning object detection algorithms: R-CNN, fast R-CNN, faster R-CNN, SSD, and YOLO. Nile J. Eng. Appl. Sci. 2023, 1, 70–80. [Google Scholar] [CrossRef] [Scilit]
- Noran, S.O. Leguminous seeds detection based on convolutional neural networks: Comparison of Faster R-CNN and YOLOv4 on a small custom dataset. Artif. Intell. Agric. 2023, 8, 30–45. [Google Scholar] [CrossRef] [Scilit]
- Koirala, A.; Walsh, K.B.; Wang, Z.; McCarthy, C. Deep learning—Method overview and review of use for fruit detection and yield estimation. Comput. Electron. Agric. 2019, 162, 219–234. [Google Scholar] [CrossRef] [Scilit]
- Bargoti, S.; Underwood, J.P. Image segmentation for fruit detection and yield estimation in apple orchards. J. Field Robot. 2017, 34, 1039–1060. [Google Scholar] [CrossRef] [Scilit]
- Rahnemoonfar, M.; Sheppard, C. Deep count: Fruit counting based on deep simulated learning. Sensors 2017, 17, 905. [Google Scholar] [CrossRef] [Scilit]
- Sa, I.; Ge, Z.; Dayoub, F.; Upcroft, B.; Perez, T.; McCool, C. Deepfruits: A fruit detection system using deep neural networks. Sensors 2016, 16, 1222. [Google Scholar] [CrossRef] [Scilit]
- Chen, S.W.; Shivakumar, S.S.; Dcunha, S.; Das, J.; Okon, E.; Qu, C.; Taylor, C.J.; Kumar, V. Counting apples and oranges with deep learning: A data-driven approach. IEEE Robot. Autom. Lett. 2017, 2, 781–788. [Google Scholar] [CrossRef] [Scilit]
- Chen, J.; Wu, J.; Wang, Z.; Qiang, H.; Cai, G.; Tan, C.; Zhao, C. Detecting ripe fruits under natural occlusion and illumination conditions. Comput. Electron. Agric. 2021, 190, 106450. [Google Scholar] [CrossRef] [Scilit]
- Redmon, J.; Divvala, S.; Girshick, R.; Farhadi, A. You only look once: Unified, real-time object detection. In Proceedings of the IEEE Conference on Computer Vision and Pattern Recognition, Las Vegas, NV, USA, 26 June–1 July 2016; pp. 779–788. [Google Scholar]
- Alif, M.A.R.; Hussain, M. YOLOv1 to YOLOv10: A comprehensive review of YOLO variants and their application in the agricultural domain. arXiv 2024, arXiv:2406.10139. [Google Scholar] [CrossRef] [Scilit]
- Ali, M.L.; Zhang, Z. The YOLO framework: A comprehensive review of evolution, applications, and benchmarks in object detection. Computers 2024, 13, 336. [Google Scholar] [CrossRef] [Scilit]
- Bresilla, K.; Perulli, G.D.; Boini, A.; Morandi, B.; Grappadelli, L.C.; Manfrini, L. Single-Shot Convolution Neural Networks for Real-Time Fruit Detection Within the Tree. Front. Plant Sci. 2019, 10, 611. [Google Scholar] [CrossRef] [Scilit]
- Sozzi, M.; Cantalamessa, S.; Cogato, A.; Kayad, A.; Marinello, F. Automatic Bunch Detection in White Grape Varieties Using YOLOv3, YOLOv4, and YOLOv5 Deep Learning Algorithms. Agronomy 2022, 12, 319. [Google Scholar] [CrossRef] [Scilit]
- Tian, Y.; Yang, G.; Wang, Z.; Wang, H.; Li, E.; Liang, Z. Apple detection during different growth stages in orchards using the improved YOLO-V3 model. Comput. Electron. Agric. 2019, 157, 417–426. [Google Scholar] [CrossRef] [Scilit]
- Dong, Q.; Sun, L.; Han, T.; Cai, M.; Gao, C. PestLite: A novel YOLO-based deep learning technique for crop pest detection. Agriculture 2024, 14, 228. [Google Scholar] [CrossRef] [Scilit]
- Upadhyay, A.; Sunil, G.C.; Das, S.; Mettler, J.; Howatt, K.; Sun, X. Multiclass weed and crop detection using optimized YOLO models on edge devices. J. Agric. Food Res. 2025, 22, 102144. [Google Scholar] [CrossRef] [Scilit]
- Kuan, Y.N.; Goh, K.M.; Lim, L.L. Systematic review on machine learning and computer vision in precision agriculture: Applications, trends, and emerging techniques. Eng. Appl. Artif. Intell. 2025, 148, 110401. [Google Scholar] [CrossRef] [Scilit]
- Dibbern, T.; Romani, L.A.S.; Massruhá, S.M.F.S. Main drivers and barriers to the adoption of Digital Agriculture technologies. Smart Agric. Technol. 2024, 8, 100459. [Google Scholar] [CrossRef] [Scilit]
- Sumathi, K.; Vinod, V. Classification of fruits ripeness using cnn with multivariate analysis by sgd. Neural Netw. World 2022, 6, 319–332. [Google Scholar] [CrossRef] [Scilit]
- Gallagher, J. Announcing Roboflow Train 3.0. Available online: https://blog.roboflow.com/roboflow-train-3-0/ (accessed on 1 September 2025).
- Ahmad, S.; Imran, S.B.; Asad, U.; Zeb, A. Performance Evaluation of Modern Object Detection Models for Automated Fruit Recognition in Smart Agriculture. In Proceedings of the 2025 11th International Conference on Mechatronics and Robotics Engineering (ICMRE), Lille, France, 24–26 February 2025; IEEE: New York, NY, USA, 2025; pp. 36–41. [Google Scholar]
- YOLOv12 on Roboflow 3.0 Platfom. YOLOv12 Object Detection Model: What is, How to Use. Available online: https://roboflow.com/model/yolov12 (accessed on 10 October 2025).
- YOLOv11 on Roboflow 3.0 Platfom. YOLO11 Object Detection Model: What is, How to Use. Available online: https://roboflow.com/model/yolo11 (accessed on 10 October 2025).
- YOLO-NAS on Roboflow 3.0 Platfom. Use YOLO-NAS to Build Computer Vision Applications. Available online: https://roboflow.com/workflows/block/yolo-nas (accessed on 10 October 2025).
- RF-DETR on Roboflow 3.0 Platfom. RF-DETR Object Detection Model: What is, How to Use. Available online: https://roboflow.com/model/rf-detr (accessed on 10 October 2025).
- Tian, Y.; Ye, Q.; Doermann, D. Yolov12: Attention-centric real-time object detectors. arXiv 2025, arXiv:2502.12524. [Google Scholar]
- Khanam, R.; Hussain, M. Yolov11: An overview of the key architectural enhancements. arXiv 2024, arXiv:2410.17725. [Google Scholar] [CrossRef] [Scilit]
- Terven, J.; Córdova-Esparza, D.M.; Romero-González, J.A. A comprehensive review of yolo architectures in computer vision: From yolov1 to yolov8 and yolo-nas. Mach. Learn. Knowl. Extr. 2023, 5, 1680–1716. [Google Scholar] [CrossRef] [Scilit]
- Robinson, I.; Robicheaux, P.; Popov, M.; Ramanan, D.; Peri, N. RF-DETR: Neural Architecture Search for Real-Time Detection Transformers. arXiv 2025, arXiv:2511.09554. [Google Scholar]
- Lin, T.; Maire, M.; Belongie, S.; Hays, J.; Perona, P.; Ramanan, D.; Doll, P.; Zitnick, C.L. Microsoft COCO: Common Objects in Context. Computer Vision—ECCV 2014. Lect. Notes Comput. Sci. 2014, 8693, 740–755. [Google Scholar]
- Table Grape Dataset on Roboflow 3.0 Platform. Table Grape Dataset. Available online: https://universe.roboflow.com/franc-uzdtk/grapes-riejc-sznrg/browse?queryText=&pageSize=50&startingIndex=0&browseQuery=true (accessed on 10 June 2025).
- Pascuzzi, S.; Paciolla, F.; Popeo, G.; Quartarella, T.; Vicino, F.; Farella, A. Study and setting-up of autonomous terrestrial rover suitable for monitoring activities in “tendone” trained vineyards. In Proceedings of the 24th International Scientific Conference Engineering for Rural Development, Jelgava, Latvia, 21–23 May 2025. [Google Scholar]
- Pascuzzi, S.; Cerruto, E. Spray deposition in “tendone” vineyards when using a pneumatic electrostatic sprayer. Crop Prot. 2014, 68, 1–11. [Google Scholar] [CrossRef] [Scilit]
- Siam, A.F.K.; Bishshash, P.; Nirob, M.A.S.; Mamun, S.B.; Assaduzzaman, M.; Noori, S.R.H. A comprehensive image dataset for the identification of lemon leaf diseases and computer vision applications. Data Brief 2025, 58, 111244. [Google Scholar] [CrossRef] [Scilit] [PubMed]
- Babaei, H.; Zamani, M.; Mohammadi, S. The impact of data splitting methods on machine learning models: A case study for predicting concrete workability. Mach. Learn. Comput. Sci. Eng. 2025, 1, 21. [Google Scholar] [CrossRef] [Scilit]
- Kumar, S.; Asiamah, P.; Jolaoso, O.; Esiowu, U. Enhancing Image Classification with Augmentation: Data Augmentation Techniques for Improved Image Classification. arXiv 2025, arXiv:2502.18691. [Google Scholar] [CrossRef] [Scilit]
- Upadhyay, A.; Chandel, N.S.; Singh, K.P.; Chakraborty, S.K.; Nandede, B.M.; Kumar, M.; Subeesh, A.; Upendar, K.; Salem, A.; Elbeltagi, A. Deep learning and computer vision in plant disease detection: A comprehensive review of techniques, models, and trends in precision agriculture. Artif. Intell. Rev. 2025, 58, 92. [Google Scholar] [CrossRef] [Scilit]
- Terven, J.; Cordova-Esparza, D.M.; Romero-González, J.A.; Ramírez-Pedraza, A.; Chávez-Urbiola, E.A. A comprehensive survey of loss functions and metrics in deep learning. Artif. Intell. Rev. 2025, 58, 195. [Google Scholar] [CrossRef] [Scilit]
- Shen, L.; Su, J.; He, R.; Song, L.; Huang, R.; Fang, Y.; Song, Y.; Su, B. Real-time tracking and counting of grape clusters in the field based on channel pruning with YOLOv5s. Comput. Electron. Agric. 2023, 206, 107662. [Google Scholar] [CrossRef] [Scilit]
- Aguiar, A.S.; Magalhães, S.A.; dos Santos, F.N.; Castro, L.; Pinho, T.; Valente, J.; Martins, R.; Boaventura-Cunha, J. Grape Bunch Detection at Different Growth Stages Using Deep Learning Quantized Models. Agronomy 2021, 11, 1890. [Google Scholar] [CrossRef] [Scilit]
- Santos, T.T.; De Souza, L.L.; dos Santos, A.A.; Avila, S. Grape detection, segmentation, and tracking using deep neural networks and three-dimensional association. Comput. Electron. Agric. 2020, 170, 105247. [Google Scholar] [CrossRef] [Scilit]
- Li, P.; Chen, J.; Chen, Q.; Huang, L.; Jiang, Z.; Hua, W.; Li, Y. Detection and picking point localization of grape bunches and stems based on oriented bounding box. Comput. Electron. Agric. 2025, 233, 110168. [Google Scholar] [CrossRef] [Scilit]
- Sapkota, R.; Cheppally, R.H.; Sharda, A.; Karkee, M. RF-DETR Object Detection vs YOLOv12: A Study of Transformer-based and CNN-based Architectures for Single-Class and Multi-Class Greenfruit Detection in Complex Orchard Environments Under Label Ambiguity. arXiv 2025, arXiv:2504.13099. [Google Scholar]
- How to Deploy Computer Vision Models: Best Practices. Available online: https://blog.roboflow.com/deploy-computer-vision-models/ (accessed on 15 December 2025).

Disclaimer/Publisher’s Note: The statements, opinions and data contained in all publications are solely those of the individual author(s) and contributor(s) and not of MDPI and/or the editor(s). MDPI and/or the editor(s) disclaim responsibility for any injury to people or property resulting from any ideas, methods, instructions or products referred to in the content. |
© 2026 by the authors. Licensee MDPI, Basel, Switzerland. This article is an open access article distributed under the terms and conditions of the Creative Commons Attribution (CC BY) license.