


Abstract
Rice diseases and pest-related damage severely threaten agricultural productivity and global food security. While deep learning has advanced automated crop diagnostics, distinguishing visually similar disease symptoms and damage patterns remains challenging due to subtle visual variations and complex backgrounds. To address this challenge, we introduce DASO-RiceNet (Dual-Attention Semantic Optimization Network), a deep learning framework for fine-grained rice disease and damage classification. The architecture utilizes a multi-stage residual backbone for feature extraction and a sequential dual-attention module combining channel and spatial attention to emphasize diagnostically relevant features while suppressing background information. Evaluated on a ten-class rice disease and damage dataset under a consistent experimental protocol, DASO-RiceNet achieved an accuracy of 0.965, macro precision of 0.963, macro recall of 0.966, macro F1-score of 0.964, and micro F1-score of 0.965, outperforming the evaluated CNN- and transformer-based baseline models. Furthermore, Grad-CAM and LIME provided qualitative insights into model predictions, with the examined examples showing attention to visually apparent symptom-related regions. These results demonstrate the potential of DASO-RiceNet for automated rice disease and damage classification and precision-agriculture applications.
1. Introduction
Rice diseases remain a persistent threat to crop productivity, grain quality, and farmer income, making timely and reliable diagnosis an important challenge in digital agriculture. Diseases such as bacterial leaf blight, blast, brown spot, and sheath blight can spread rapidly under favorable environmental conditions and significantly reduce agricultural productivity if not identified at early stages [1,2,3]. Consequently, the development of automated and intelligent rice disease recognition systems has become an important research direction in precision agriculture.
Automated image-based disease recognition, however, remains a challenging computer vision problem. Rice disease symptoms frequently appear as small, irregular, or visually overlapping lesions with high inter-class similarity [4]. In practical agricultural environments, disease diagnosis is further complicated by illumination variations, complex backgrounds, occlusion, leaf orientation changes, and symptom co-occurrence. Earlier lesion-based studies demonstrated that fine-grained disease recognition strongly depends on accurate local feature extraction, particularly when multiple disease symptoms appear simultaneously on the same leaf [5]. Similarly, large-scale field investigations with multi-crop datasets have indicated that environmental variability and real-field image complexity strongly influence categorization robustness and generalization performance [6]. Recent studies on plant disease detection also reveal that complex backgrounds and visually identical symptoms are still substantial challenges for effective disease diagnosis under natural situations [7,8,9].
Deep convolutional neural networks (CNNs) have achieved significant improvements in automatic plant disease recognition by replacing manual feature engineering with learned hierarchical representations [10]. Some early prominent research showed that the CNN-based methods could efficiently recognize several categories of plant diseases, which made deep learning the dominating paradigm for agricultural image analysis [11,12,13]. Too et al. [14] compared several deep CNN architectures, including VGG16, InceptionV4, ResNet, and DenseNet, for plant disease classification and demonstrated that DenseNet provided strong feature learning capability with improved parameter efficiency and stable convergence behavior. More recently, Naduvinamani et al. [15] introduced a hybrid deep transfer learning framework integrating DenseNet, EfficientNet, ResNet, BiLSTM, and attention modules for cotton and rice disease classification. Although these approaches demonstrated strong performance, many existing frameworks still struggle to effectively distinguish visually similar disease categories under complex field conditions.
Several studies have explored transfer learning and advanced CNN architectures for rice disease recognition. Simhadri and Kondaveeti [2] investigated transfer learning using multiple pretrained CNN models for rice crop disease classification and demonstrated the effectiveness of pretrained deep CNNs for agricultural disease recognition. Recently, Bijlwan et al. [16] explored transfer learning approaches for insect-pest and rice disease classification using EfficientNet architectures and field-acquired datasets collected under practical agricultural conditions. Their findings confirmed the usefulness of transfer learning for crop disease diagnosis in real farming environments; however, the framework primarily focused on transfer learning–based classification without explicitly incorporating multi-level feature fusion and explainability mechanisms for fine-grained disease discrimination. Similarly, Haridasan et al. [4] introduced a computer vision–based rice disease recognition system combining image processing, CNNs, and support vector machines (SVM) for disease classification. Zhou et al. [10] further investigated deep learning for recognizing multi-symptomatic rice leaf blast under dual-scenario field conditions and demonstrated that transfer learning and data augmentation substantially improved recognition robustness under practical agricultural environments.
The architectural evolution of CNN backbones has further improved feature extraction capability in visual recognition systems. Residual networks alleviate optimization difficulties in deep architectures by learning residual mappings, thereby enabling stronger semantic feature extraction and more stable gradient propagation [17,18]. Dense connectivity improves feature reuse and information flow by directly connecting earlier feature representations with later layers, allowing compact yet expressive feature learning [19]. Although these architectures improve representation capability, they do not explicitly guide the network toward the most informative disease-related channels or lesion regions.
Attention mechanisms address this limitation by adaptively emphasizing important features while suppressing irrelevant information. Channel attention mechanisms such as Squeeze-and-Excitation (SE) networks recalibrate channel-wise feature responses according to their global importance, whereas spatial attention mechanisms focus on disease-relevant image regions [20,21,22]. Saeed et al. [22] proposed a multiple Vision Transformer (ViT)-based framework for rice leaf disease classification, demonstrating that transformer architectures can improve robustness and discriminative feature learning for visually similar disease categories. Recent studies demonstrated that integrating SE, CBAM, and transformer-based attention modules into CNN architecture improves robustness under challenging field conditions [7,23]. Similarly, Yang et al. [8] proposed an enhanced GoogLeNet architecture integrating residual learning and Efficient Channel Attention (ECA) mechanisms for rice disease recognition under natural environments. Wang et al. [9] further developed an attention-based depthwise separable neural network for rice disease classification, demonstrating that attention-guided feature learning significantly improved disease localization and classification performance. In addition, Alfred et al. [24] proposed a Detectron2-enhanced Mask R-CNN framework for precise instance segmentation of rice blast disease, highlighting the importance of lesion localization and multi-scale feature representation for practical agricultural disease monitoring.
Another important challenge in plant disease recognition is multi-scale and multi-level feature representation. Rice disease symptoms are not expressed uniformly across all visual scales; early-stage lesions often require shallow texture-sensitive features, whereas advanced disease symptoms require deeper semantic abstraction. Consequently, multi-level and multi-scale fusion strategies have become increasingly important in modern computer vision systems [25]. Recent studies have shown that combining hierarchical feature representations with adaptive feature refinement substantially improves disease recognition under small-lesion and complex background conditions [26,27,28]. These findings highlight the importance of hierarchical feature representation for distinguishing visually similar rice disease categories. However, the effectiveness of combining shallow and deep feature representations may depend on the specific disease characteristics and network architecture, motivating further investigation of the most discriminative feature level.
Despite recent advances in CNN- and transformer-based approaches, accurately distinguishing visually similar rice leaf diseases remains challenging because of subtle lesion characteristics, complex background interference, and high inter-class similarity. Although attention mechanisms have improved feature representation, many existing methods either employ attention at a single stage or lack sufficient interpretability for practical agricultural applications. These limitations motivate the development of a robust and explainable deep learning framework capable of learning disease-relevant semantic features while maintaining reliable classification performance.
To address these challenges, this study proposes DASO-RiceNet (Dual-Attention Semantic Optimization Network), a deep learning framework for fine- grained rice disease and damage classification that applies SE-based channel recalibration followed by spatial attention specifically to the deepest semantic feature representation (Y4) of the residual backbone, enabling targeted refinement of high-level disease features before classification. The proposed architecture employs a residual backbone to extract semantic feature representations, followed by a sequential dual-attention module consisting of channel attention and spatial attention to adaptively enhance disease-relevant features while suppressing redundant background information. The refined feature representation is subsequently utilized by a lightweight classification head for disease prediction. To improve transparency of the decision-making process, Grad-CAM [29] and LIME [30] are incorporated to provide visual explanations of the learned feature representations by highlighting disease-relevant lesion regions. The proposed framework is evaluated against representative convolutional neural network and transformer-based architectures under a consistent experimental protocol to assess its classification performance, robustness, and interpretability for automated rice disease diagnosis in precision agriculture.
The main contributions of this study are summarized as follows:
- •
- A dual-attention framework, DASO-RiceNet, is proposed for fine-grained rice disease and damage classification by integrating a residual backbone with a sequential dual-attention module consisting of channel attention followed by spatial attention.
- •
- The proposed framework is comprehensively evaluated against representative CNN-based (CNN baseline, ResNet50, and DenseNet121) and transformer-based (Vision Transformer and Swin Transformer) architectures under a common experimental protocol to provide a standardized comparison.
- •
- Quantitative performance analysis, confusion matrices, and qualitative Grad-CAM and LIME visualizations are used to evaluate the proposed framework. For the illustrated examples, the explainability analyses indicate that model predictions are influenced by visually apparent symptom-related image regions.
2. Materials and Methods
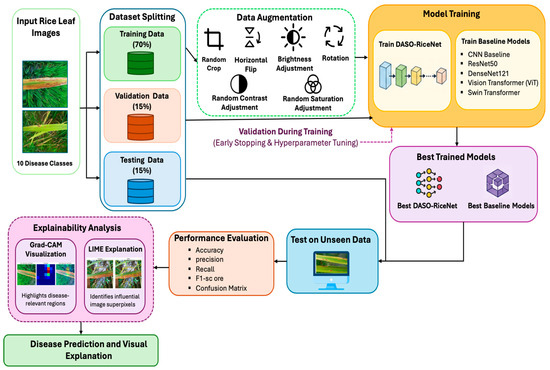
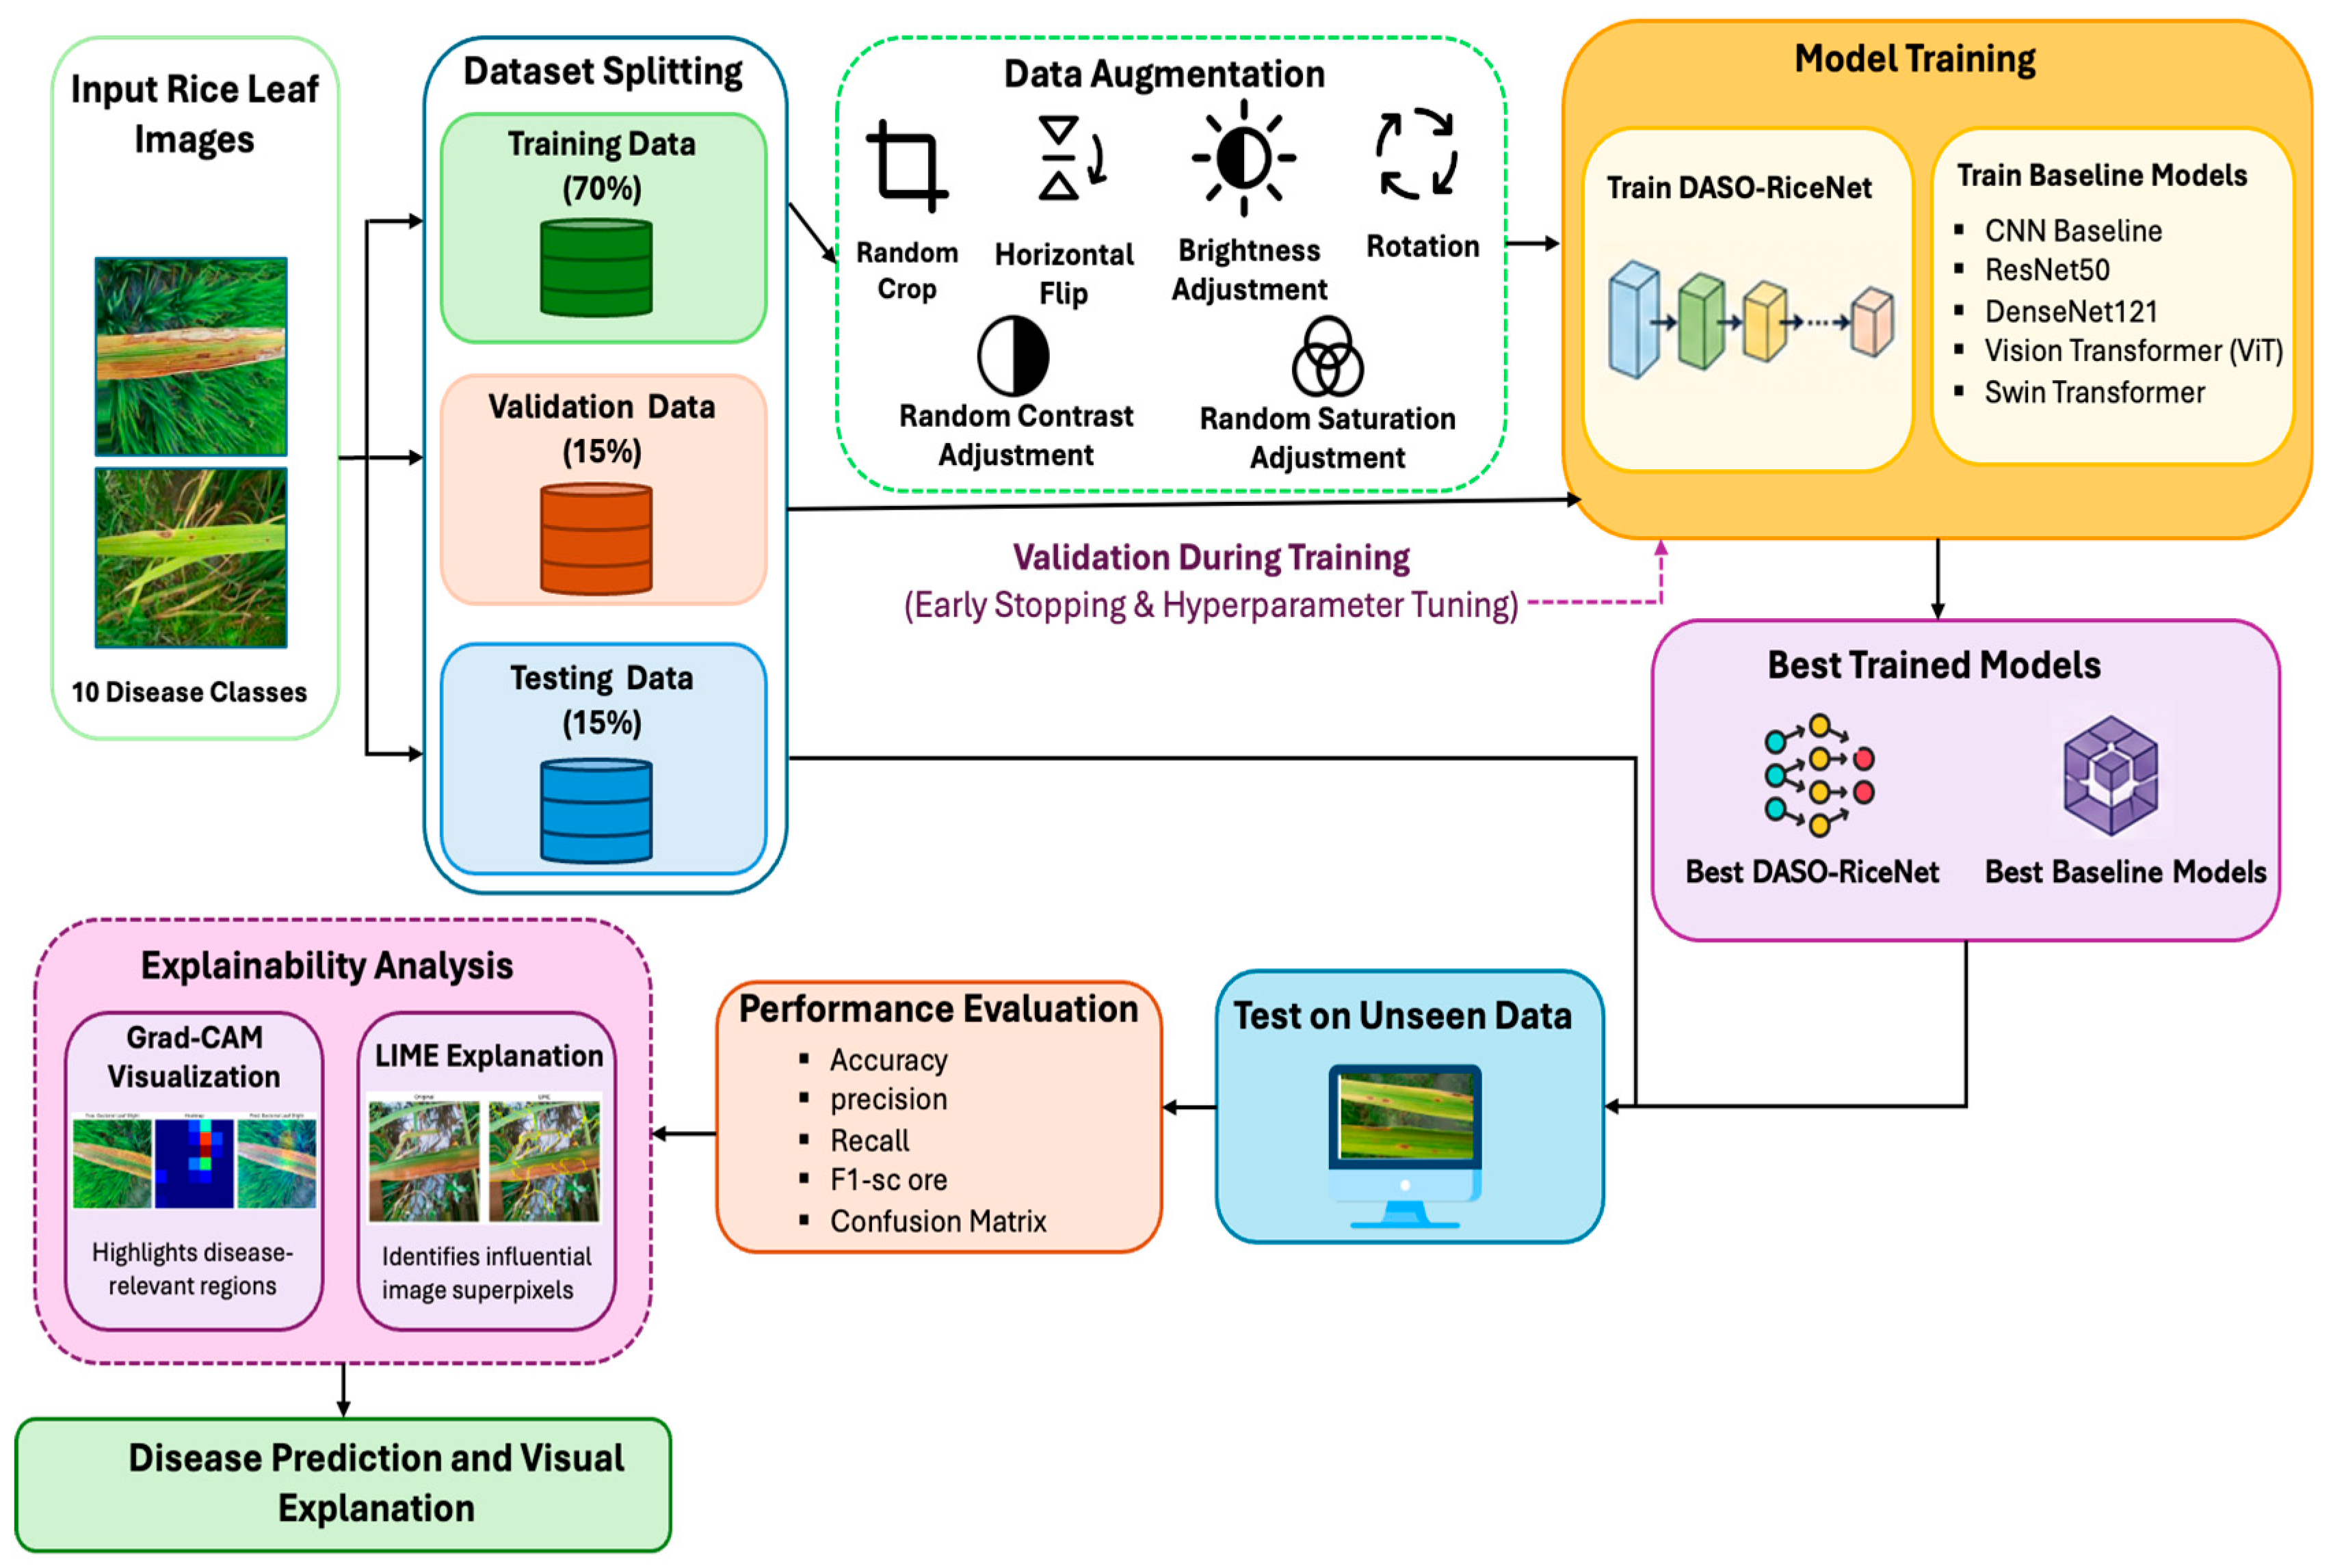
The overall workflow starts with gathering rice leaf image data, which is subsequently partitioned into separate training, validation, and testing partitions. To mitigate overfitting and improve the robustness of network generalization, data augmentation strategies are implemented exclusively on the training subset. Following this setup, both the proposed DASO-RiceNet framework and selected benchmark models—comprising a standard CNN baseline, ResNet50, DenseNet121, ViT, and Swin Transformer—are trained using the compiled data. The performance of these trained networks is systematically measured on an unseen testing split using standard classification criteria (accuracy, precision, recall, and F1-score). To ensure interpretability, the final pipeline incorporates Grad-CAM and LIME, which isolate the specific disease-centric image patches that drive the model’s diagnostic outputs, as structured in Figure 1.
Figure 1.
Overall methodology flow of the proposed DASO-RiceNet framework for rice disease and damage classes.
2.1. Dataset Description
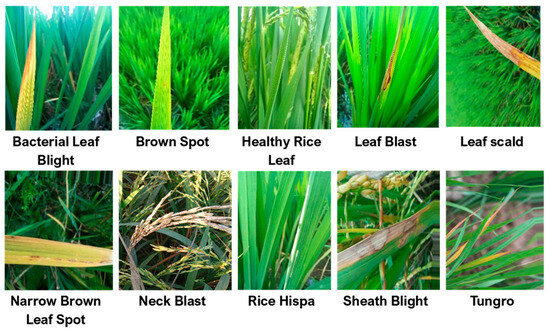
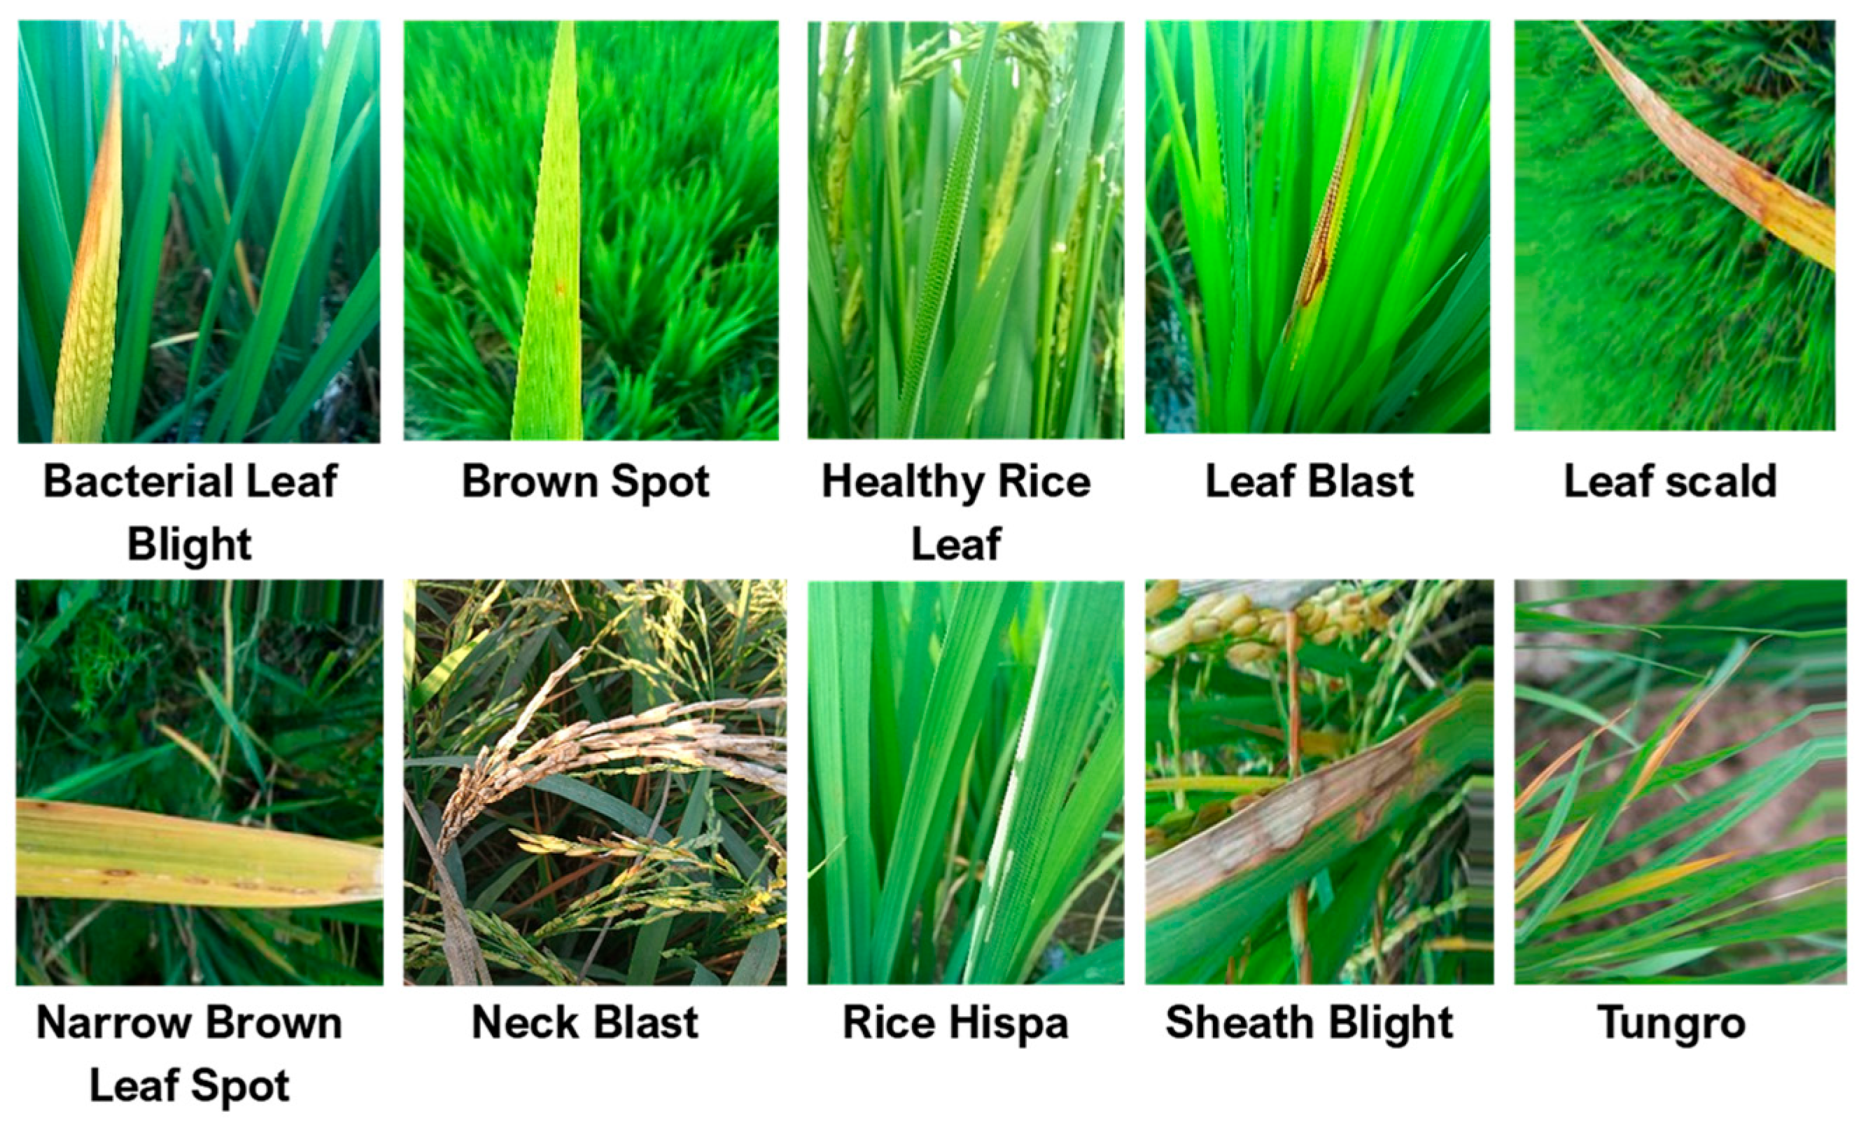
The dataset utilized in this study is publicly available on Kaggle and contains rice leaf images from ten classes, including nine abnormal categories associated with diseases or pest-induced damage and one healthy class, with 13,529 images. The dataset was accessed in March 2026, and all model training, validation, testing, and evaluation experiments were conducted between March and July 2026. The images exhibit variations in illumination, background complexity, leaf orientation, and disease severity, introducing visual variability into the classification task. The dataset covers common rice diseases, including Bacterial Leaf Blight, Brown Spot, and Leaf Blast, characterized by different visual symptoms such as lesions, discoloration, and leaf damage patterns. Figure 2 presents representative samples illustrating the variability in disease appearance and imaging conditions.
Figure 2.
Representative samples of rice disease and damage class images used for model training and evaluation.
As shown in Table 1, the dataset has a moderate class imbalance, where some illness categories have more samples than others. Moreover, the occurrence of visually similar diseases like Brown Spot and Narrow Brown Leaf Spot leads to large inter-class similarity, making proper classification a tough task. More complex data is due to variations in background circumstances and imaging environments. These issues reflect the requirement for strong deep learning models to capture fine-grained and discriminative characteristics. This motivates the proposed DASO-RiceNet architecture, which combines hierarchical residual feature extraction with sequential channel and spatial attention for discriminative semantic feature refinement.
Table 1.
Class-wise distribution of the rice disease and damage dataset across training, validation, and test subsets.
2.2. Data Preprocessing and Augmentation
All rice leaf images were resized to a fixed resolution of 224 × 224 pixels to provide a uniform input size for DASO-RiceNet and all baseline models. The dataset was partitioned into training (70%), validation (15%), and testing (15%) subsets using a class-wise, stratified splitting procedure with a fixed random seed of 42, thereby preserving the relative class distribution across the three subsets. The same partitions were used for all evaluated models to ensure a consistent comparison. The exact class-wise numbers of training, validation, and test images are reported in Table 1.
Prior to partitioning, the dataset was screened for potential duplicate images to minimize the risk of data leakage. To further assess cross-partition similarity, exact duplicates were screened using file hashing, while near-duplicate candidates were identified using perceptual hashing (pHash) with a Hamming-distance threshold of ≤4. Flagged test images matching the training set were excluded for an additional sensitivity analysis without model retraining. The public dataset does not provide metadata identifying individual plants, leaves, acquisition sessions, or source groups; therefore, group-level partitioning based on these factors was not feasible. The training subset was used for model optimization, the validation subset for performance monitoring and model selection, and the test subset was reserved for final performance evaluation.
Data augmentation was applied only to the training set to improve model generalization and reduce overfitting. The augmentation pipeline included random horizontal flipping, random rotation with a factor of 0.15 (corresponding to rotations within approximately ±54°, where 0.15 represents a fraction of a full rotation), random zoom with a factor of 0.15, random contrast adjustment with a factor of 0.15, random brightness adjustment with a maximum delta of 0.15, and random saturation adjustment within the range of 0.8–1.2. Validation and test images were not augmented. For models trained from scratch using the standard image pipeline, pixel values were rescaled from [0, 255] to [0, 1] by dividing by 255. For ImageNet-pretrained ResNet50 and DenseNet121, the corresponding TensorFlow/Keras model-specific preprocess_input functions were applied to ensure compatibility with their pretrained weights.
2.3. Proposed DASO-RiceNet Architecture
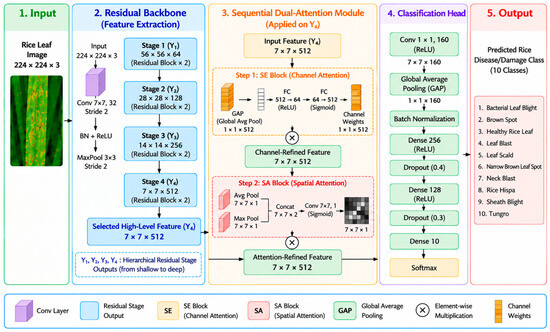
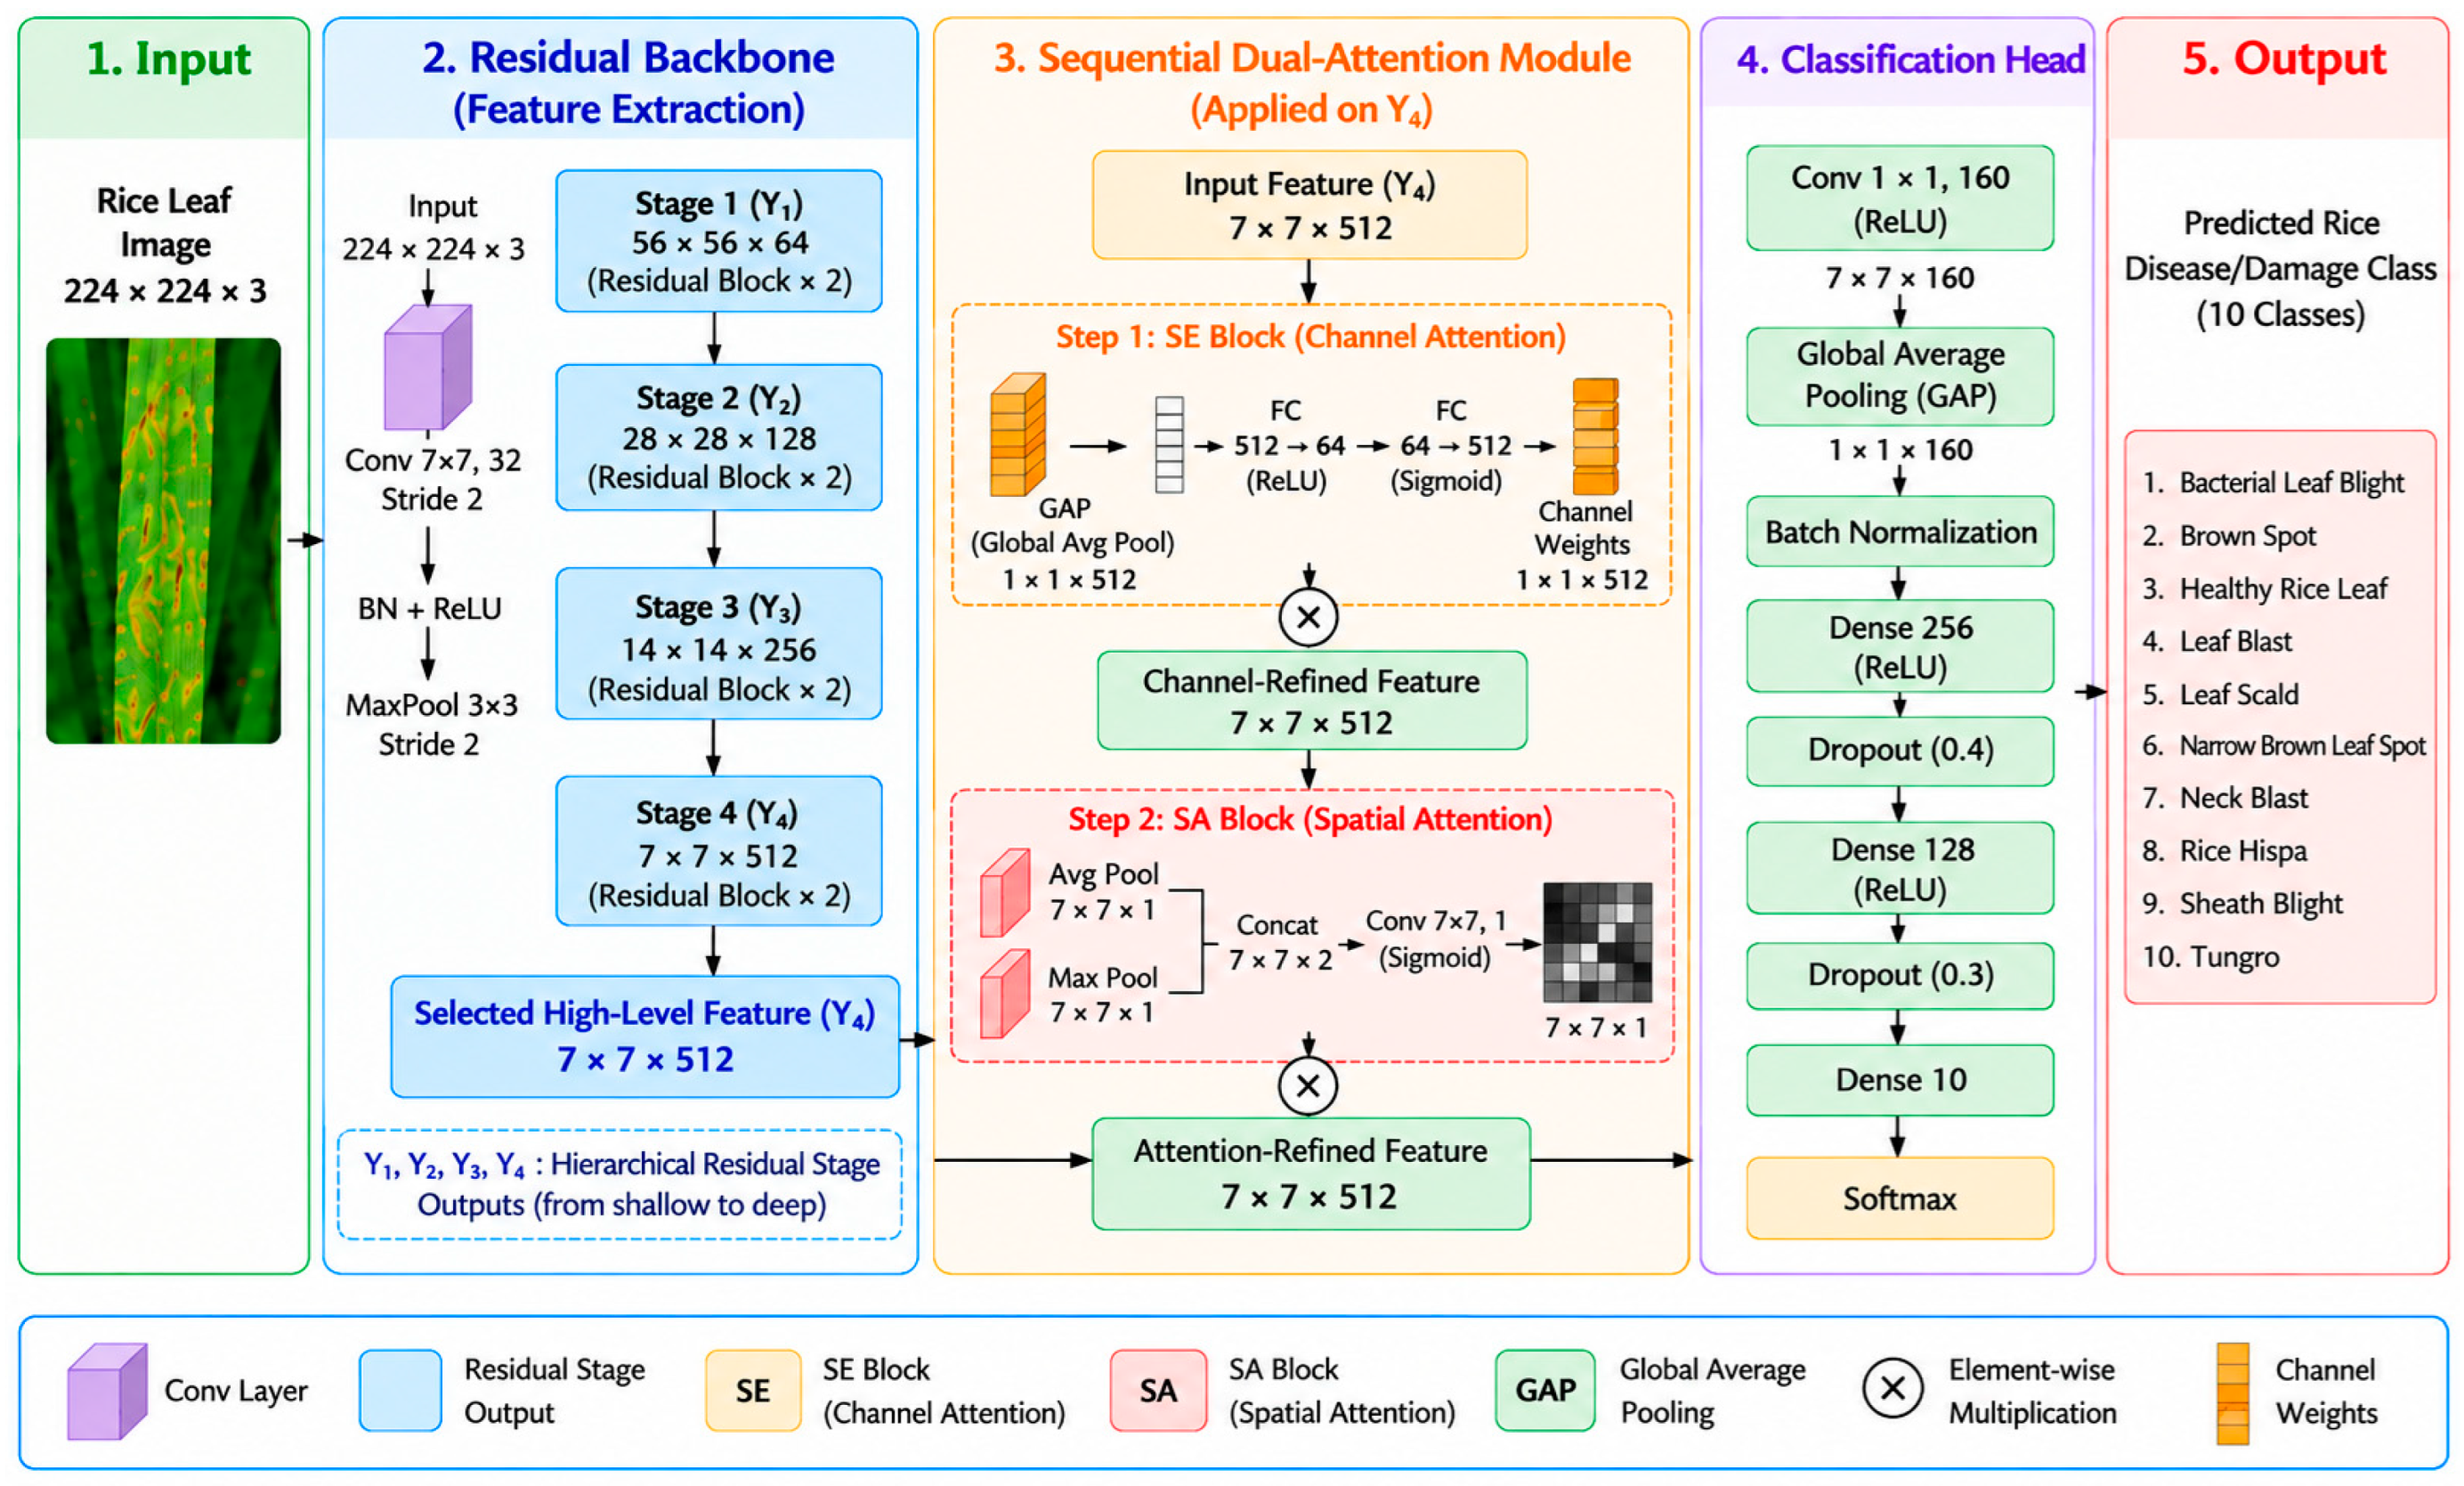
The complete structural configuration of the proposed DASO-RiceNet architecture is illustrated in Figure 3. The network is sequentially organized into five distinct pipelines: an initial image input stage, a multi-stage residual backbone for feature extraction, an integrated sequential dual-attention module applied directly to the high-level feature maps, a classification head, and a final ten-class output projection layer.
Figure 3.
Overall architecture of the proposed DASO-RiceNet for fine- rice disease and damage classes.
2.3.1. Input Processing and Residual Backbone
The proposed DASO-RiceNet begins by extracting hierarchical feature representations from raw rice leaf images using a deep residual learning backbone. The network accepts an input image of size 224 × 224 × 3, which is first processed by a 7 × 7 convolutional layer with 32 filters and a stride of 2, followed by batch normalization (BN), a rectified linear unit (ReLU) activation, and a 3 × 3 max-pooling layer with a stride of 2. This initial processing stage captures low-level visual features, including edges, textures, and lesion boundaries, while reducing the spatial dimensions of the feature maps.
The resulting feature maps are subsequently passed through a residual backbone consisting of four progressive stages (Stage 1–Stage 4). Each stage contains two residual blocks, with output channel dimensions of 64, 128, 256, and 512, respectively. Spatial downsampling is performed at the first residual block of Stages 2–4 using a stride of 2, whereas Stage 1 preserves the spatial resolution. Shortcut projections are employed when the feature dimensions or spatial resolution change, facilitating gradient propagation through the network. The residual learning process is formulated as
where denotes the input feature map, represents the residual mapping learned by the convolutional layers with learnable parameters , and is the output feature map after residual learning. The outputs of the four residual stages are denoted as , , , and , with dimensions of 56 × 56 × 64, 28 × 28 × 128, 14 × 14 × 256, and 7 × 7 × 512, respectively. The backbone generates hierarchical feature representations. As illustrated in Figure 3, only the deepest representation, , is passed to the subsequent sequential dual-attention module. Thus, the architecture does not explicitly fuse shallow and deep feature maps.
2.3.2. Sequential Dual-Attention Module
A sequential dual-attention module is applied to the deepest backbone feature representation to refine the extracted semantic features. The module consists of two consecutive operations: Squeeze-and-Excitation (SE) channel attention followed by spatial attention (SA). The implementation applies both attention operations directly in sequence to the deepest feature representation.
- Step 1: Squeeze-and-Excitation (SE) Block (Channel Attention)
Inter-channel interdependencies are explicitly modeled by sending the input feature map through a SE block to adaptively recalibrate channel-wise responses. A global average pooling (GAP) operation is first used to compress the spatial dimensions of into a channel descriptor:
where represents the global channel descriptor vector, while and denote the height and width of the feature map (), respectively. These descriptors are subsequently processed through two fully connected (FC) layers utilizing ReLU and Sigmoid activations to generate the optimal channel attention weights:
where and are the learnable weights of the FC layers, denotes the ReLU activation function, and represents the sigmoid gating function. The channel-refined feature map () is then obtained via element-wise multiplication () between the generated weights () and the original feature map:
where represents the recalibrated, channel-refined feature map.
In DASO-RiceNet, the SE block operates on , which has dimensions of 7 × 7 × 512. GAP therefore produces a 512-dimensional channel descriptor. A channel-reduction ratio of is used, reducing the descriptor from 512 to 64 dimensions through the first fully connected layer and subsequently restoring it from 64 to 512 dimensions through the second fully connected layer. ReLU and sigmoid activations are used for the first and second fully connected layers, respectively. The resulting channel-wise attention weights recalibrate the 512 feature channels before the representation is passed to the spatial-attention block. This exactly corresponds to the dynamically calculated bottleneck in your implementation.
- Step 2: Spatial Attention (SA) Block
The channel-refined feature map is subsequently processed by a SA block to emphasize disease-affected regions while suppressing irrelevant background information. Spatial attention is generated by applying average pooling and max pooling along the channel dimension, producing complementary spatial descriptors that capture informative lesion patterns. These descriptors are concatenated and passed through a convolutional layer with one output channel followed by a sigmoid activation to generate the spatial attention map:
where denotes a convolution operation with a kernel, [ ; ] represents channel-wise concatenation, and is the sigmoid activation function.
The generated spatial attention map is multiplied element-wise with the channel-refined feature map to obtain the final attention-refined representation:
The resulting attention-refined representation retains dimensions of 7 × 7 × 512 and is subsequently passed to the projection and classification head.
2.3.3. Classification Head and Output
Following sequential channel and spatial attention refinement, the resulting 7 × 7 × 512 feature representation is projected using a 1 × 1 convolutional layer with 160 filters and ReLU activation, producing a 7 × 7 × 160 feature map. Global average pooling is then applied to obtain a 160-dimensional feature vector, followed by batch normalization.
The resulting feature vector is passed through a 256-unit fully connected layer with ReLU activation, followed by a dropout rate of 0.4. A second 128-unit fully connected layer with ReLU activation is then applied, followed by a dropout rate of 0.3. Finally, a fully connected output layer with 10 units and softmax activation generates the probability distribution over the ten rice disease and damage classes. The softmax probability for class is calculated as
where denotes the feature vector obtained after global average pooling, and represent the learnable weight vector and bias associated with class , respectively, and denotes the total number of classes.
The predicted class corresponds to the class with the highest posterior probability. By combining hierarchical residual feature extraction with sequential channel- and spatial-attention refinement of the deepest semantic representation, DASO-RiceNet provides a structured framework for fine-grained rice disease and damage classification.
2.4. Baseline Models
Five representative deep learning architectures were selected as baseline models for comparison with the proposed DASO-RiceNet, including a conventional CNN, ResNet50, DenseNet121, ViT, and Swin Transformer. These models represent convolutional, residual, densely connected, and transformer-based feature-learning strategies commonly used for image classification.
The CNN was implemented from scratch and comprised four convolutional blocks with 32, 64, 128, and 256 filters, respectively. Each block used a 3 × 3 convolution with ReLU activation, batch normalization, and 2 × 2 max pooling. Global average pooling was followed by a 128-unit fully connected layer with ReLU activation, dropout of 0.5, and a 10-unit softmax output layer. ResNet50 [17] was initialized using ImageNet-pretrained weights with the original classification layer removed. The convolutional backbone was frozen during training, while the task-specific classification head consisted of global average pooling, a 128-unit fully connected layer with ReLU activation, dropout of 0.5, and a 10-unit softmax output layer. DenseNet121 [19] was similarly initialized with ImageNet-pretrained weights, and its convolutional backbone was frozen during training. Its classification head consisted of global average pooling, a 256-unit fully connected layer with ReLU activation, dropout of 0.5, and a 10-unit softmax output layer.
Two transformer-based architectures were also included for comparison. Vision Transformer (ViT) [31] was implemented from scratch and trained from random initialization. Each 224 × 224 input image was divided into 16 × 16 non-overlapping patches, resulting in 196 patch tokens with an embedding dimension of 64. The architecture contained four transformer encoder blocks with four attention heads per block, an MLP hidden dimension of 128, and dropout of 0.1. The classification head comprised global average pooling, a 256-unit fully connected layer with ReLU activation, dropout of 0.4, and a 10-unit softmax output layer. These settings correspond to the implemented ViT configuration. Swin Transformer [32] was also implemented from scratch and trained from random initialization. It employed a 4 × 4 patch size, window size of 7, initial embedding dimension of 64, stage depths of [2, 2, 4, 2], and [2, 4, 8, 16] attention heads across the four stages, with an MLP ratio of 2.0 and dropout of 0.1. The classification head consisted of layer normalization, global average pooling, a 256-unit fully connected layer with ReLU activation, dropout of 0.4, and a 10-unit softmax output layer.
All models were evaluated using the same dataset partition and independent test set to maintain a consistent evaluation protocol. A common training configuration was adopted using the Adam optimizer with an initial learning rate of 1 × 10⁻⁴, a batch size of 16, and a maximum of 25 training epochs. A random seed of 42 was used to improve reproducibility. Model-specific hyperparameter optimization was not performed; therefore, the common training configuration was used to standardize the experimental conditions rather than to imply that these hyperparameters were individually optimal for every architecture.
2.5. Training Configuration
To maintain a consistent experimental protocol, the proposed DASO-RiceNet and benchmark models were evaluated using the same dataset partition and independent test set. A common training configuration was adopted using the Adam optimizer with an initial learning rate of 1 × 10⁻⁴, a batch size of 16, and a maximum of 25 epochs. Categorical cross-entropy was used as the loss function for multi-class classification. Model checkpoints corresponding to the highest validation accuracy were retained, and early stopping was applied to reduce overfitting. A random seed of 42 was used to improve reproducibility. Model-specific hyperparameter optimization was not performed; therefore, the common training configuration was intended to standardize the experimental conditions rather than to imply that the selected hyperparameters were individually optimal for each architecture. Table 2 summarizes the principal training hyperparameters used in the experiments.
Table 2.
Training hyperparameter configuration used for DASO-RiceNet and baseline models.
2.6. Experimental Environment
The proposed DASO-RiceNet and all baseline models were implemented in Python using TensorFlow (version 2.7.0) and Keras (version 2.7.0). Data preprocessing, model evaluation, and statistical analysis were performed using NumPy (version 1.20.1), Pandas (version 1.2.4), and Scikit-learn (version 0.24.1), while Matplotlib (version 3.3.4) was used for result visualization. All experiments were conducted on a workstation equipped with an Intel Core i7 processor, 32 GB RAM, and an NVIDIA GeForce RTX 4060 GPU, running the Windows 11 (64-bit) operating system.
2.7. Evaluation Metrics
The classification efficacy of the proposed DASO-RiceNet model and the selected baseline architectures was validated using standard statistical assessment criteria: accuracy, precision, recall, and F1-score. These indicators offer a comprehensive diagnostic evaluation by accounting for both overall predictive correctness and individual class-wise performance trends.
Accuracy quantifies the proportion of correctly classified instances relative to the total number of evaluated samples. Precision represents the ratio of correctly assigned positive instances to the overall number of samples predicted as positive. Recall, or sensitivity, measures the framework’s capability to isolate true positive instances from the entire pool of actual positive cases. The F1-score serves as the harmonic mean combining precision and recall, delivering a balanced assessment of overall classification stability. Throughout these mathematical formulations, TP, TN, FP, and FN correspond to true positives, true negatives, false positives, and false negatives, respectively. The mathematical expressions defining these indicators are formulated as follows:
In addition, 95% confidence intervals (Cis) for classification accuracy were calculated using the Wilson score method to characterize the uncertainty associated with performance on the held-out test set.
2.8. Explainability Method (Grad-CAM)
To improve the transparency and interpretability of the proposed DASO-RiceNet, two complementary explainability techniques, Gradient-weighted Class Activation Mapping (Grad-CAM) and Local Interpretable Model-agnostic Explanations (LIMEs), were employed to analyze the model’s decision-making process.
2.8.1. Grad-CAM
Grad-CAM was utilized to visualize the regions influencing model predictions. It generates class-specific activation maps using the gradients of the target class with respect to the final convolutional feature maps. The resulting heatmap is calculated as
where and denote the feature maps and their corresponding importance weights, respectively.
The generated heatmap is then enlarged and overlaid on the original image, highlighting the most relevant locations affecting the prediction. In this study, Grad-CAM was used to visualize image regions influencing DASO-RiceNet predictions and to qualitatively examine whether the resulting activation patterns corresponded to visually apparent symptom-related regions in the illustrated samples.
2.8.2. LIME
To complement Grad-CAM, we integrated Local Interpretable Model-agnostic Explanations (LIME) to deliver granular, instance-specific insights into how the network arrives at its decisions. LIME operates by segmenting the input image into structurally coherent patches, or superpixels, and fitting a locally weighted surrogate model to approximate the complex classifier’s behavior around that specific sample. By evaluating the model’s response to variations in these superpixels, LIME quantifies the relative weight each region holds in driving the final classification.
The mathematical formulation for the LIME optimization problem is expressed as
In this objective function, represents the complex target classifier, while denotes the simplified surrogate model chosen from the interpretable family . The loss function measures how faithfully the surrogate model mimics the original classifier within the defined proximity space of the target sample . The term acts as a regularization penalty to limit the complexity of the surrogate model, ensuring it remains easily interpretable.
While Grad-CAM uses gradient information to visualize activation patterns associated with model predictions, LIME employs a perturbation-based approach to identify image regions that influence individual predictions. Together, these methods provide complementary qualitative perspectives on the image regions influencing DASO-RiceNet predictions. For the illustrated samples, the resulting visualizations may indicate correspondence between model-influential regions and visually apparent symptom-related regions; however, they do not constitute quantitative validation of biological relevance or localization accuracy.
3. Results
This section presents the experimental results of the proposed DASO-RiceNet and provides a comprehensive performance analysis through quantitative evaluation, confusion matrix analysis, ablation studies, and explainability methods. The results are further compared with representative deep learning models to demonstrate the effectiveness, robustness, and interpretability of the proposed framework.
3.1. Overall Performance
Table 3 presents the comparative classification performance of the evaluated models in terms of accuracy, macro-averaged precision, recall, and F1-score, micro-averaged F1-score, and the 95% confidence interval (CI) for accuracy. Among the CNN-based baseline models, Simple CNN, ResNet50, and DenseNet121 achieved accuracies of 0.909, 0.899, and 0.908, respectively. Their macro F1-scores were 0.906, 0.900, and 0.908, respectively, indicating broadly comparable performance among the CNN-based architectures. Among the transformer-based models, ViT exhibited the lowest overall performance, with an accuracy of 0.892 and a macro F1-score of 0.886. In contrast, SwinTransformer achieved substantially better classification performance, attaining an accuracy of 0.932, macro precision of 0.932, macro recall of 0.932, macro F1-score of 0.931, and micro F1-score of 0.932.
Table 3.
Overall performance comparison of models for rice disease and damage classes.
The proposed DASO-RiceNet achieved the highest observed performance among all evaluated models, with an accuracy of 0.965, macro precision of 0.963, macro recall of 0.966, macro F1-score of 0.964, and micro F1-score of 0.965. Its accuracy was associated with a 95% CI of 0.956–0.972, compared with 0.921–0.942 for SwinTransformer, the strongest benchmark. DASO-RiceNet therefore achieved an absolute accuracy improvement of approximately 0.033 over SwinTransformer on the held-out test set. This improvement can be attributed to the hierarchical feature extraction provided by the residual backbone and the sequential refinement of the deepest semantic representation through channel and spatial attention mechanisms. Channel attention adaptively emphasizes informative feature channels associated with disease characteristics, whereas spatial attention highlights diagnostically relevant regions within the leaf while suppressing redundant background information. This complementary refinement enables DASO-RiceNet to capture more discriminative disease representations and effectively distinguish visually similar rice leaf disease classes, resulting in improved and more consistent classification performance.
To assess the potential influence of cross-partition image similarity, an additional sensitivity analysis was conducted. Exact file hashing identified 11 unique test images with exact duplicate matches to the training set, while perceptual hashing (pHash; Hamming distance ≤4) identified 105 additional unique test images as near-duplicate similarity candidates. Thus, 116 unique test images were flagged across the two screening criteria. These 116 images were excluded, and the trained DASO-RiceNet was reevaluated on the remaining 1917 test images without retraining. The model achieved an accuracy of 0.962, weighted precision of 0.962, weighted recall of 0.962, and weighted F1-score of 0.962. The comparable performance observed after excluding the flagged images suggests that the classification results were not solely attributable to the identified cross-partition similarity candidates.
3.2. Class-Wise Analysis
Table 4 presents a detailed class-wise recall comparison across the evaluated models to assess their diagnostic sensitivity for specific rice leaf conditions. A granular analysis reveals that all frameworks achieved perfect detection (1.000) for Neck Blast and near-perfect performance for Tungro. However, the baseline models exhibited notable performance degradation when identifying visually challenging conditions. Specifically, Narrow Brown Leaf Spot (NBLS) and Bacterial Leaf Blight proved difficult for several conventional models. The CNN and ViT achieved relatively low recall values of 0.715 and 0.722, respectively, for NBLS, while ResNet50 showed the lowest recall for Bacterial Leaf Blight at 0.775.
Table 4.
Class-wise recall comparison of different models.
In contrast, DASO-RiceNet demonstrated consistently strong diagnostic sensitivity across the evaluated disease classes. It substantially mitigated the sensitivity deficits observed in the baseline models, correctly identifying 0.939 of Bacterial Leaf Blight cases and 0.965 of NBLS cases. The proposed model also achieved a recall of 0.927 for Brown Spot, outperforming CNN (0.884), ResNet50 (0.888), DenseNet121 (0.892), SwinTransformer (0.854), and ViT (0.794). Furthermore, DASO-RiceNet achieved perfect recall (1.000) for Healthy Rice Leaf, Neck Blast, and Tungro. Overall, these results demonstrate the robust class-level sensitivity of DASO-RiceNet, with reduced false-negative predictions even for visually similar and challenging rice leaf disease classes.
Table 5 presents the computational complexity and inference efficiency of DASO-RiceNet and the evaluated baseline architectures. DASO-RiceNet contains 11.389 M total parameters, of which 11.380 M are trainable, and requires 3.421 GFLOPs for a single forward pass. In comparison, ResNet50 exhibits the highest computational cost at 7.752 GFLOPs, followed by DenseNet121 at 5.701 GFLOPs, whereas the CNN baseline, ViT, and Swin Transformer require 1.486, 0.311, and 2.438 GFLOPs, respectively.
Table 5.
Computational complexity and inference efficiency of the evaluated models.
DASO-RiceNet achieved an inference latency of 18.435 ms/image and a throughput of 54.245 images/s. Under the same hardware and measurement protocol, its inference latency was lower than that of ResNet50 (40.842 ms/image), DenseNet121 (69.169 ms/image), and Swin Transformer (27.761 ms/image), while the CNN baseline and ViT exhibited lower latency and higher throughput. These results indicate that DASO-RiceNet does not represent the computationally lightest architecture; rather, it provides a practical trade-off between classification performance and computational requirements.
3.3. Confusion Matrix Analysis
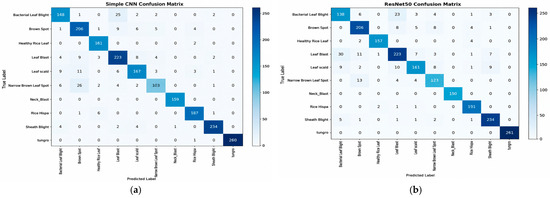
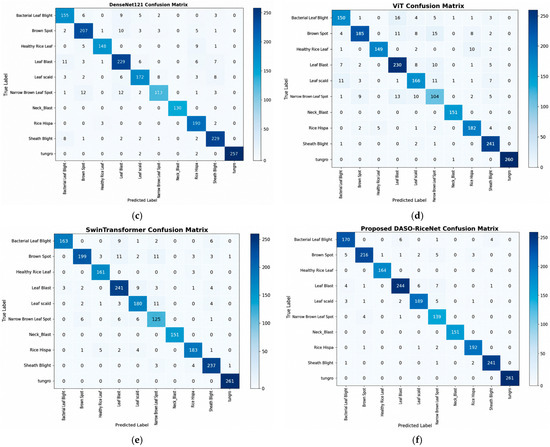
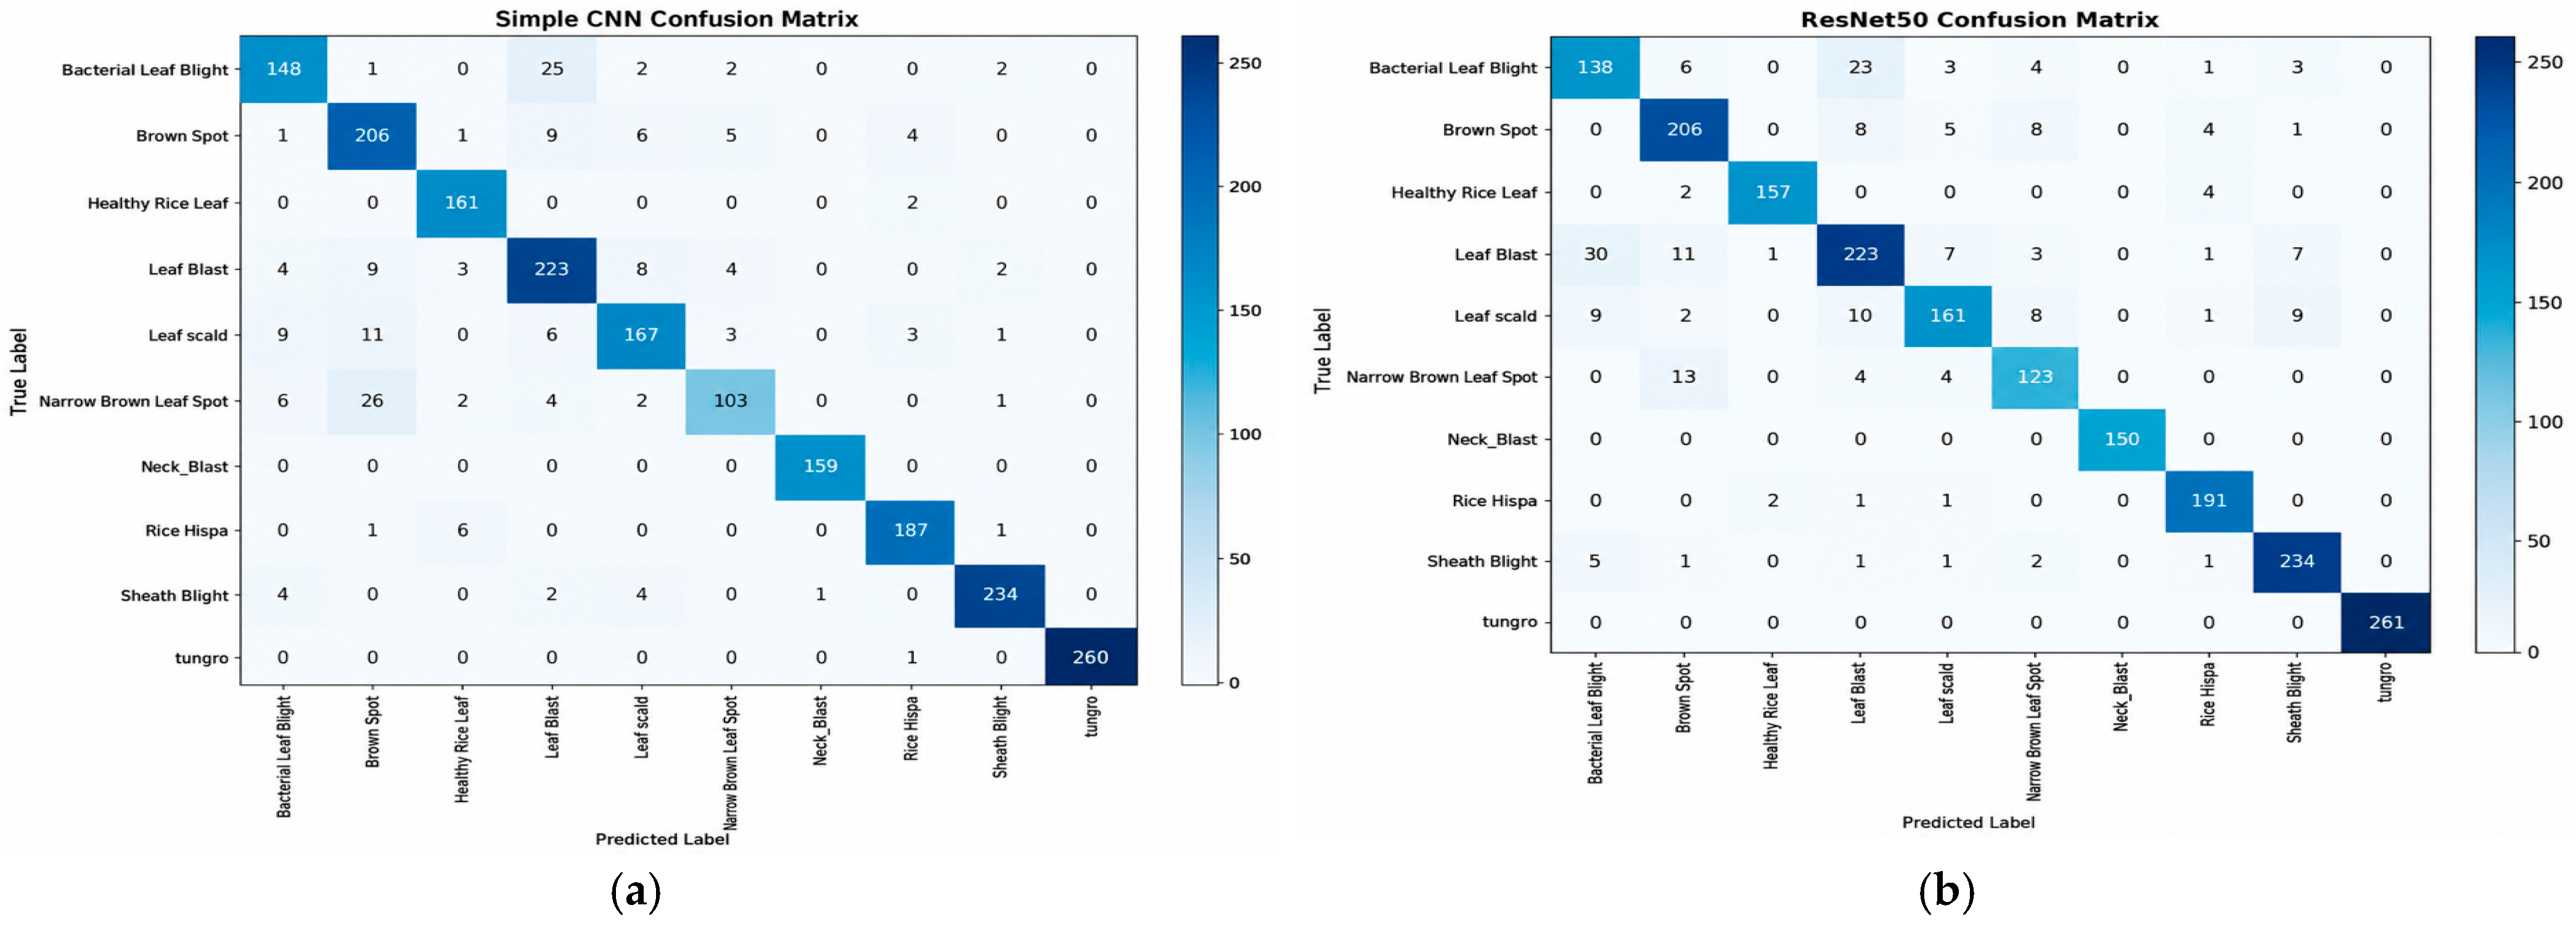
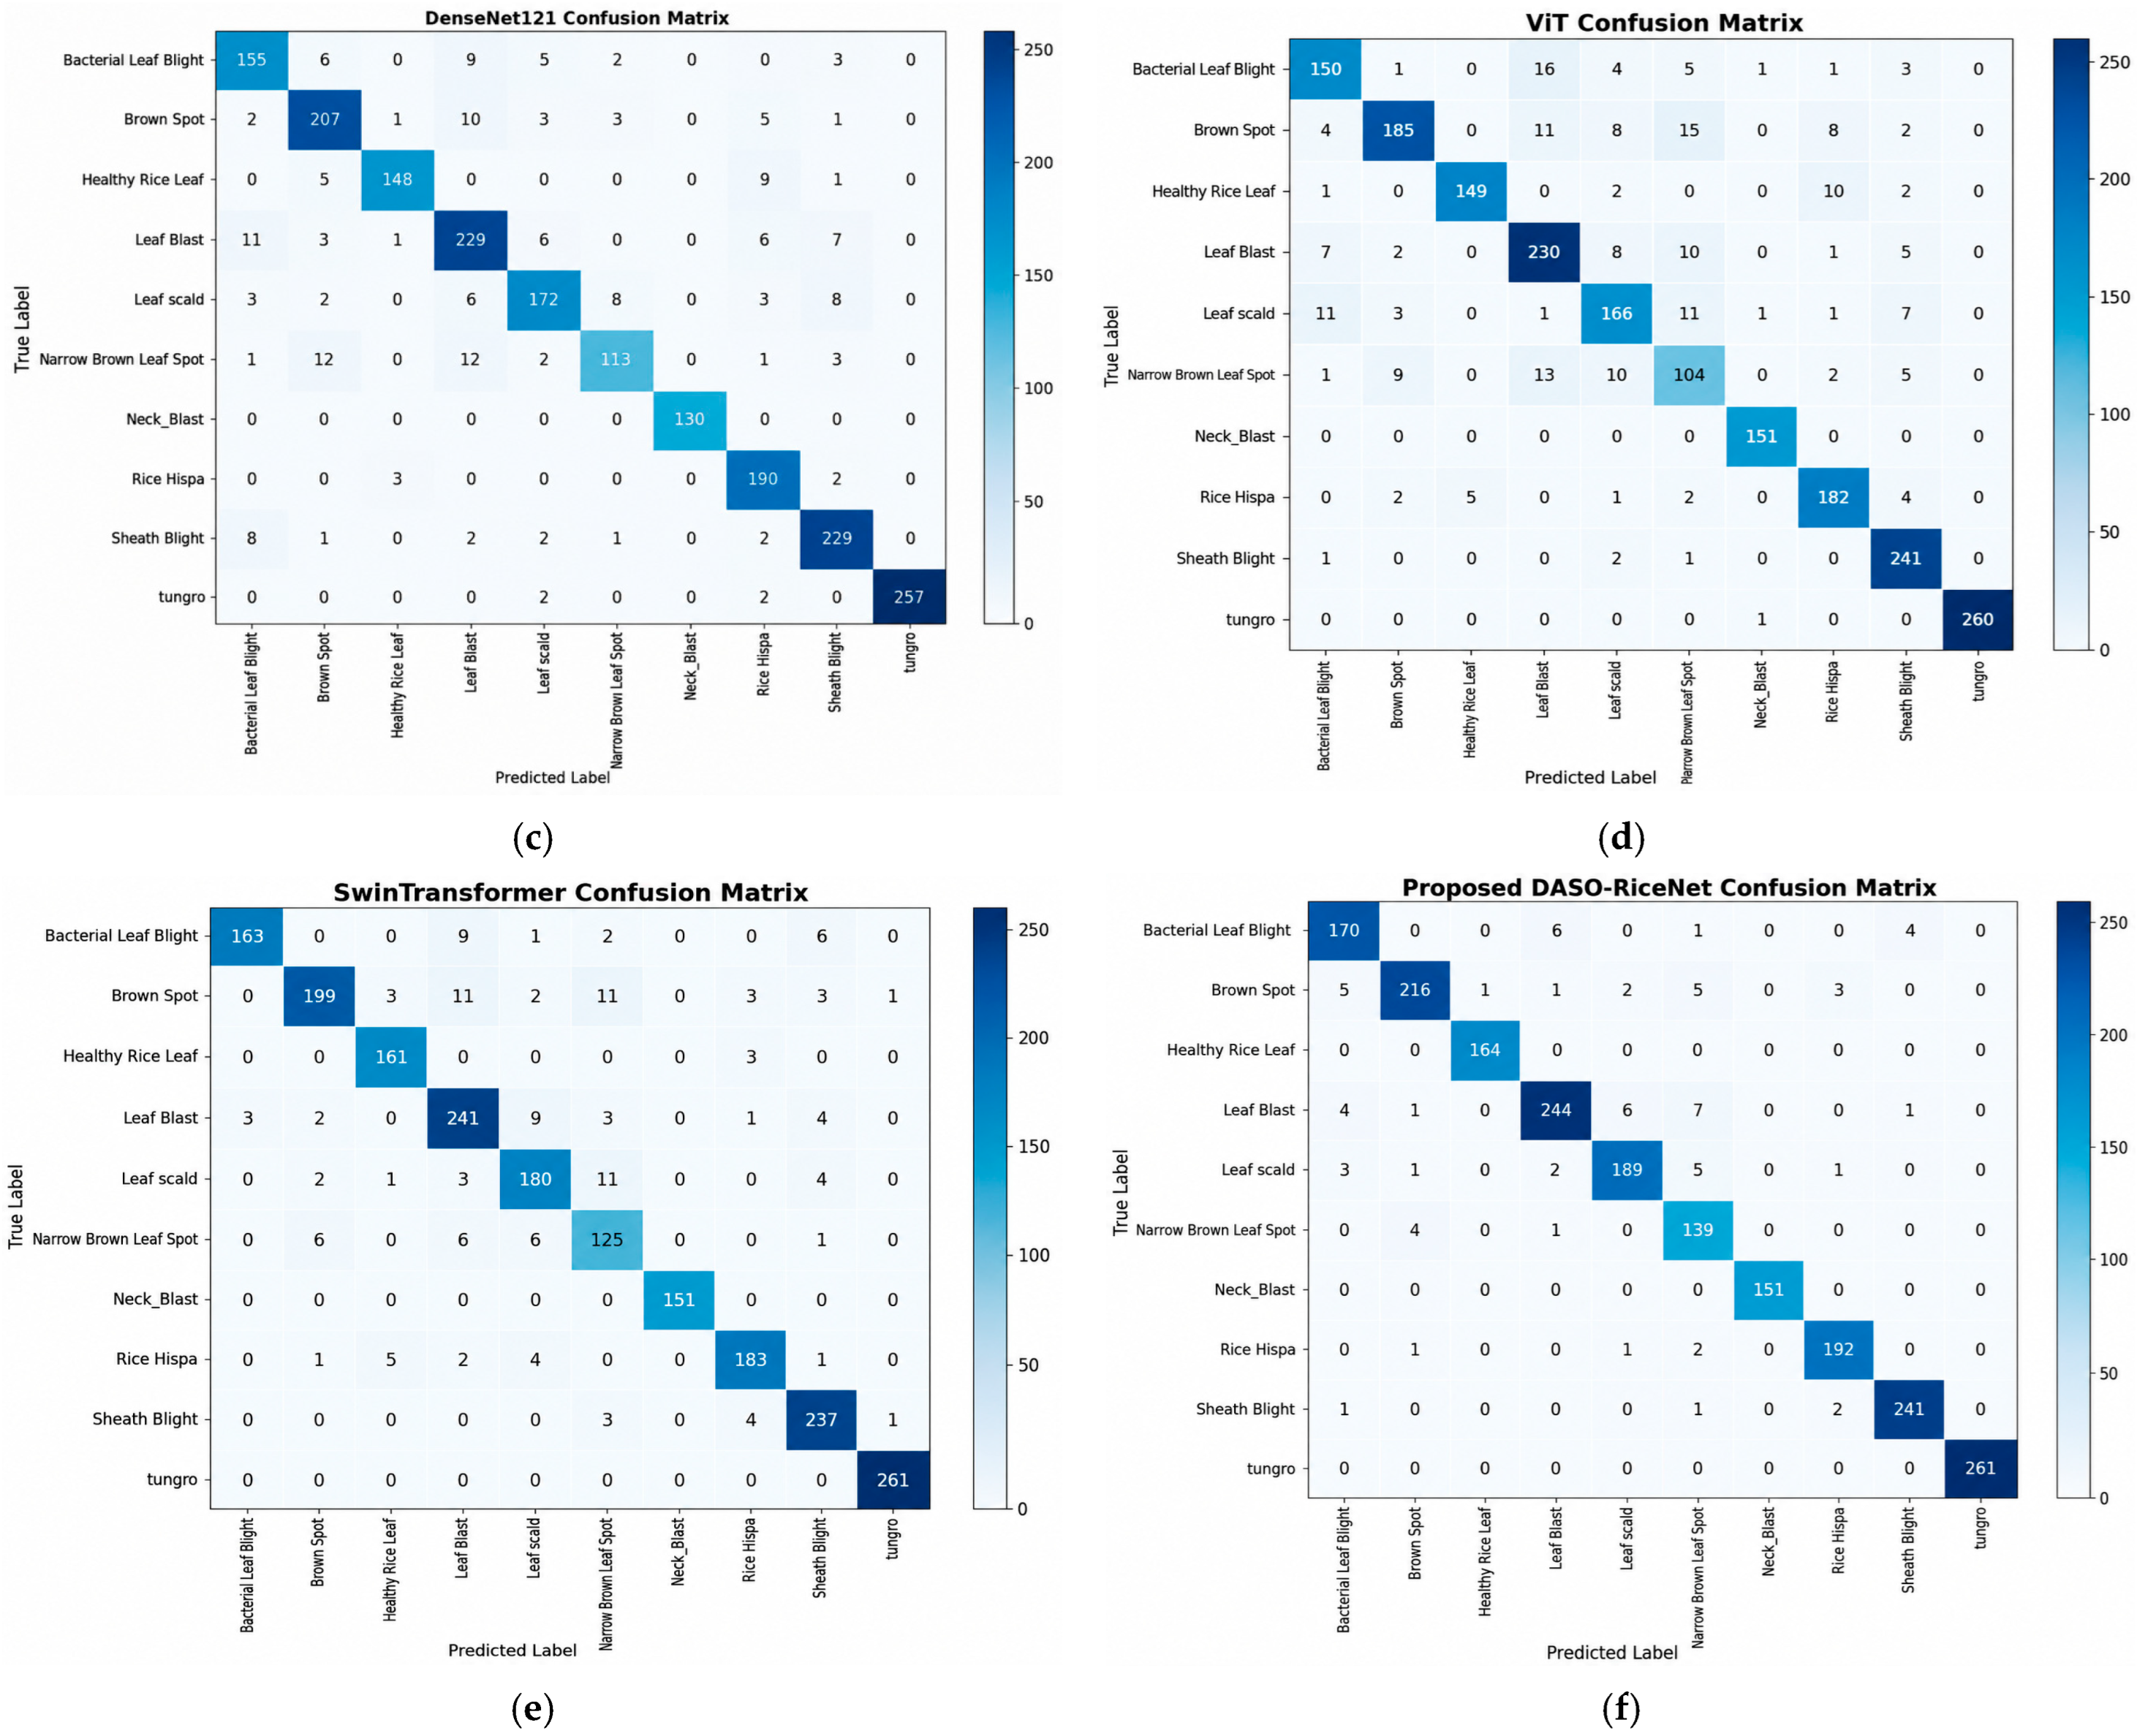
The confusion matrices provided in Figure 4 offer a deeper visual insight into the classification behavior and inter-class errors of the evaluated models. An examination of the diagonal elements across all matrices reveals that the proposed DASO-RiceNet achieves the highest concentration of true positive predictions, drastically minimizing misclassifications compared to the baseline and transformer architectures. For easily distinguishable categories such as Neck Blast and Tungro, virtually all models demonstrated strong performance, with DASO-RiceNet achieving flawless classification (151 and 261 correct instances, respectively).
Figure 4.
Confusion matrices of the evaluated architectures: (a) Simple CNN, (b) ResNet50, (c) DenseNet121, (d) ViT, (e) Swin Transformer, and (f) Proposed DASO-RiceNet.
However, substantial disparities emerge in visually complex classes. For instance, the Bacterial Leaf Blight class was frequently misidentified as Leaf Blast by the Simple CNN (25 instances) and the standard ViT (16 instances). DASO-RiceNet effectively mitigates this issue, successfully identifying 170 instances with minimal leakage. Similarly, the Narrow Brown Leaf Spot class caused notable confusion in baseline configurations, most notably in the Simple CNN, which misclassified 26 instances as Brown Spot. The proposed DASO-RiceNet sharply resolves this inter-class ambiguity, accurately capturing 139 true positive instances while restricting Brown Spot confusion to just 4 cases. These visual distributions indicate that the sequential dual-attention refinement of the high-level representation enables DASO-RiceNet to extract discriminative features for separating highly localized and morphologically similar disease symptoms.
3.4. Training Performance Analysis
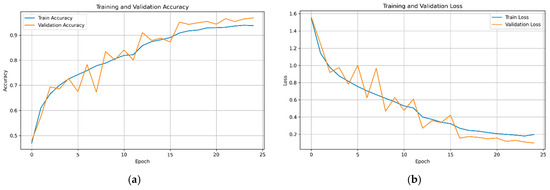
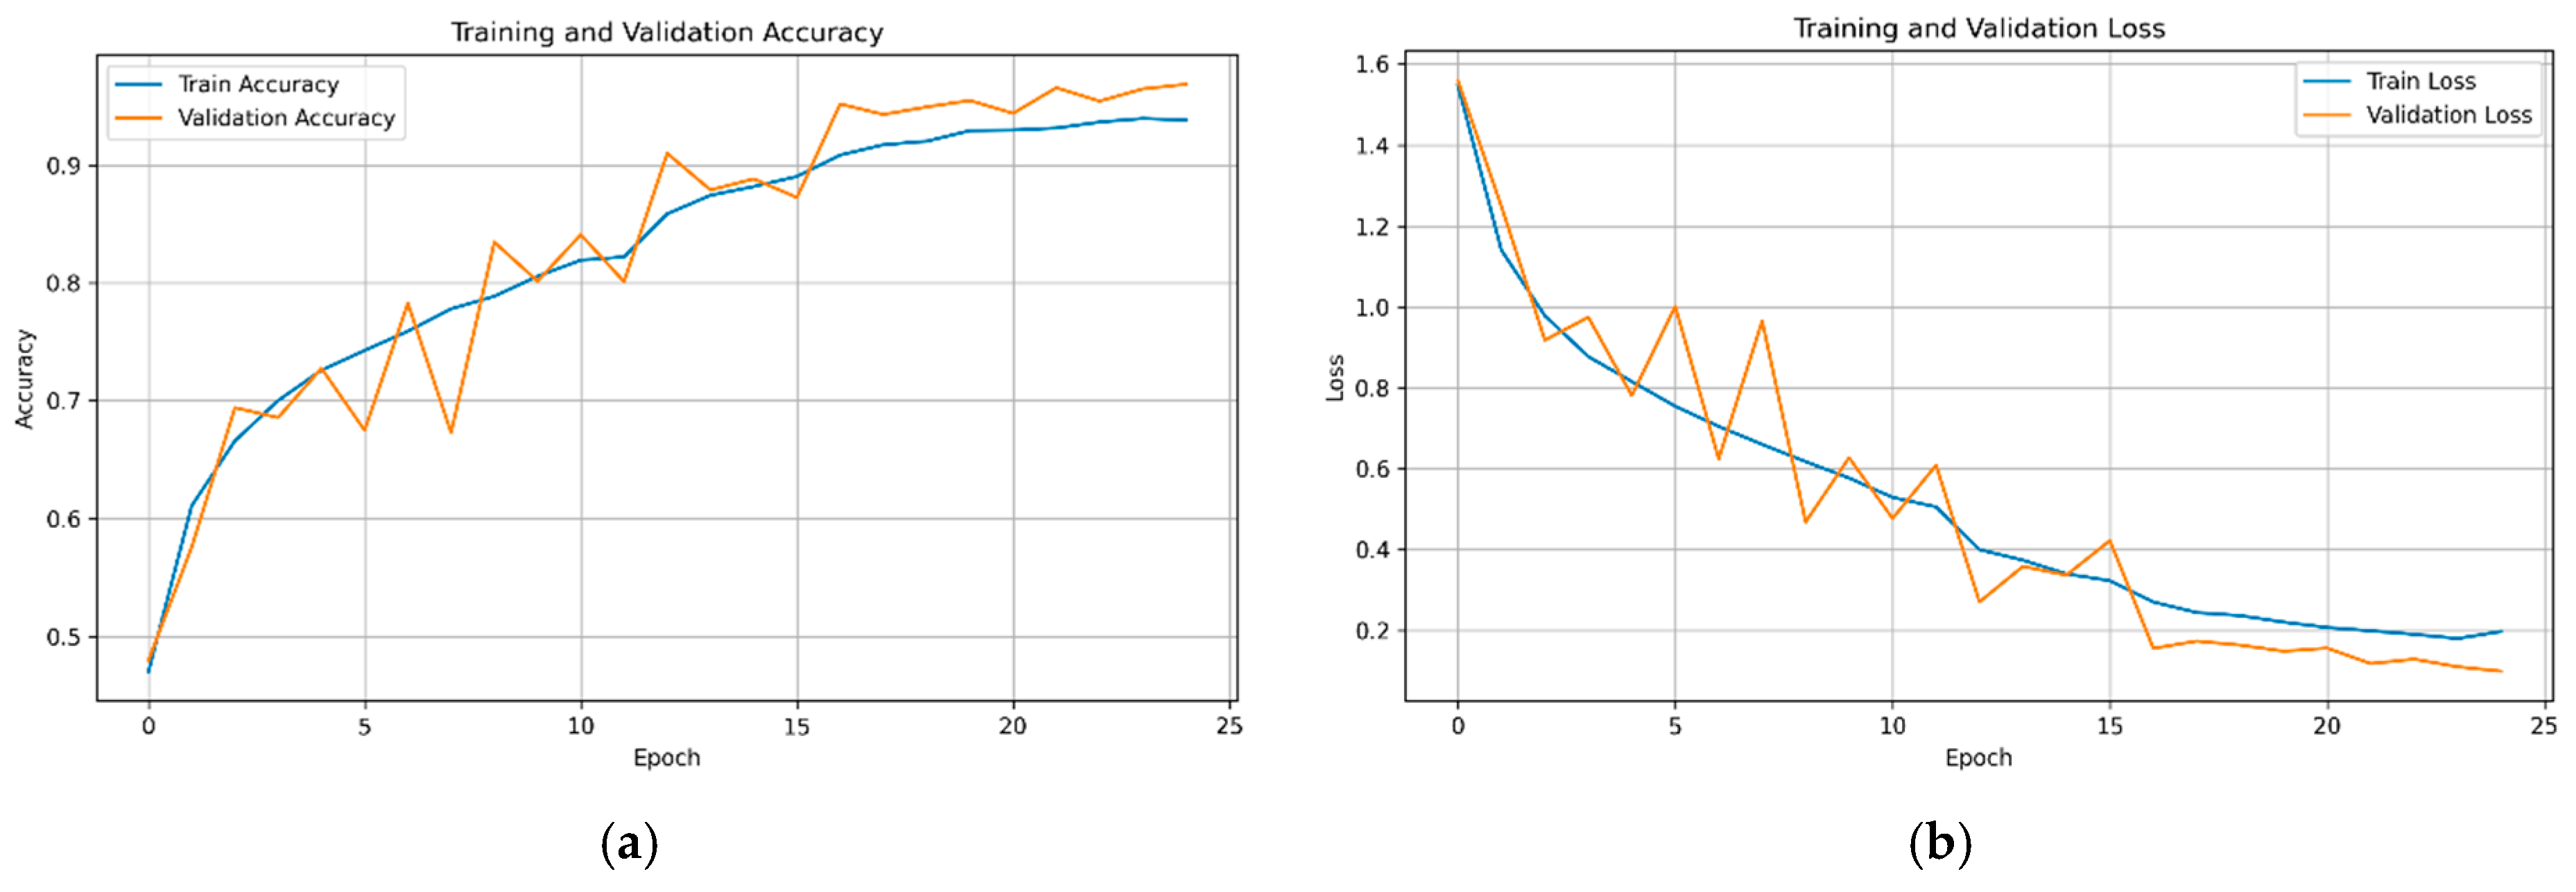
Figure 5 illustrates the training dynamics of the proposed DASO-RiceNet framework, plotting classification accuracy and loss values across successive training epochs. The model exhibits robust, steady convergence, characterized by a progressive increase in both training and validation accuracy alongside a corresponding decline in loss. Although minor fluctuations occur in the validation accuracy during the intermediate epochs, the overall trajectory remains highly consistent, confirming a stable learning trajectory. Notably, the minimal divergence between the training and validation curves highlights strong generalization capabilities and a well-mitigated risk of overfitting. These training trends indicate stable optimization of the proposed DASO-RiceNet architecture, which combines hierarchical residual feature extraction with sequential channel- and spatial-attention refinement of the deepest semantic representation.
Figure 5.
Training and validation accuracy and loss curves of the proposed DASO-RiceNet model: (a) training and validation accuracy; (b) training and validation loss.
3.5. Ablation Study
A layer-wise ablation study was conducted to determine whether the deepest semantic representation () or the aggregation of multiple residual-stage representations provides more effective features for rice leaf disease classification. Table 6 summarizes the performance metrics for each structural variant.
Table 6.
Layer-wise feature representation analysis of DASO-RiceNet using different residual backbone outputs.
The experimental results show that the proposed DASO configuration—utilizing the isolated high-level semantic feature layer ()—achieves the highest performance across all metrics, with an accuracy of 0.965 and an F1-score of 0.964. Integrating intermediate feature maps in the variant slightly reduces accuracy to 0.959. While incorporating an additional intermediate layer () partially recovers this loss to reach 0.962 accuracy, expanding the fusion mechanism to all four layers () triggers a sharp performance drop, yielding the lowest accuracy (0.938) and F1-score (0.939).
These findings confirm that while intermediate feature layers maintain relatively stable classification capabilities, shallower, low-level features like introduce excessive semantic noise and redundant background information. This compromises the network’s discriminative focus, verifying that the isolated high-level semantic feature design of the proposed DASO model () is the optimal configuration.
To quantify the contribution of individual attention components, an attention-specific ablation study was conducted while maintaining the same residual backbone and classification head. As shown in Table 7, the backbone without attention achieved an accuracy of 0.948, while the SE-only and SA-only configurations achieved 0.952 and 0.938, respectively. The proposed DASO-RiceNet with sequential SE→SA attention achieved the highest overall performance, attaining an accuracy, precision, recall, and F1-score of 0.965, 0.963, 0.966, and 0.964, respectively. In comparison, the reverse SA→SE configuration achieved an accuracy of 0.964, while CBAM achieved 0.963. These results demonstrate that the proposed sequential dual-attention configuration effectively combines channel-wise feature recalibration with spatial refinement and provides improved classification performance compared with the individual attention modules and alternative attention configurations.
Table 7.
Attention-specific ablation analysis of DASO-RiceNet under different attention configurations.
3.6. Explainability Analysis
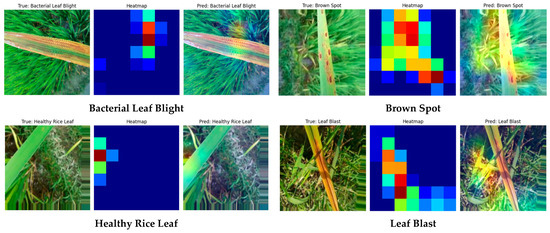
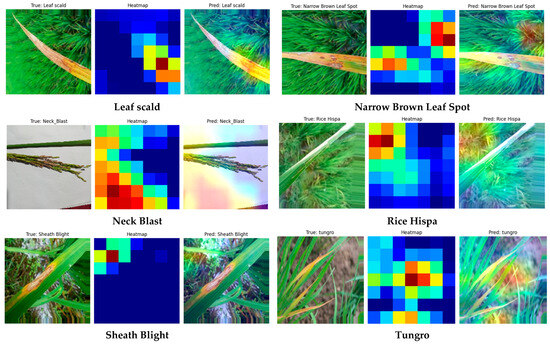
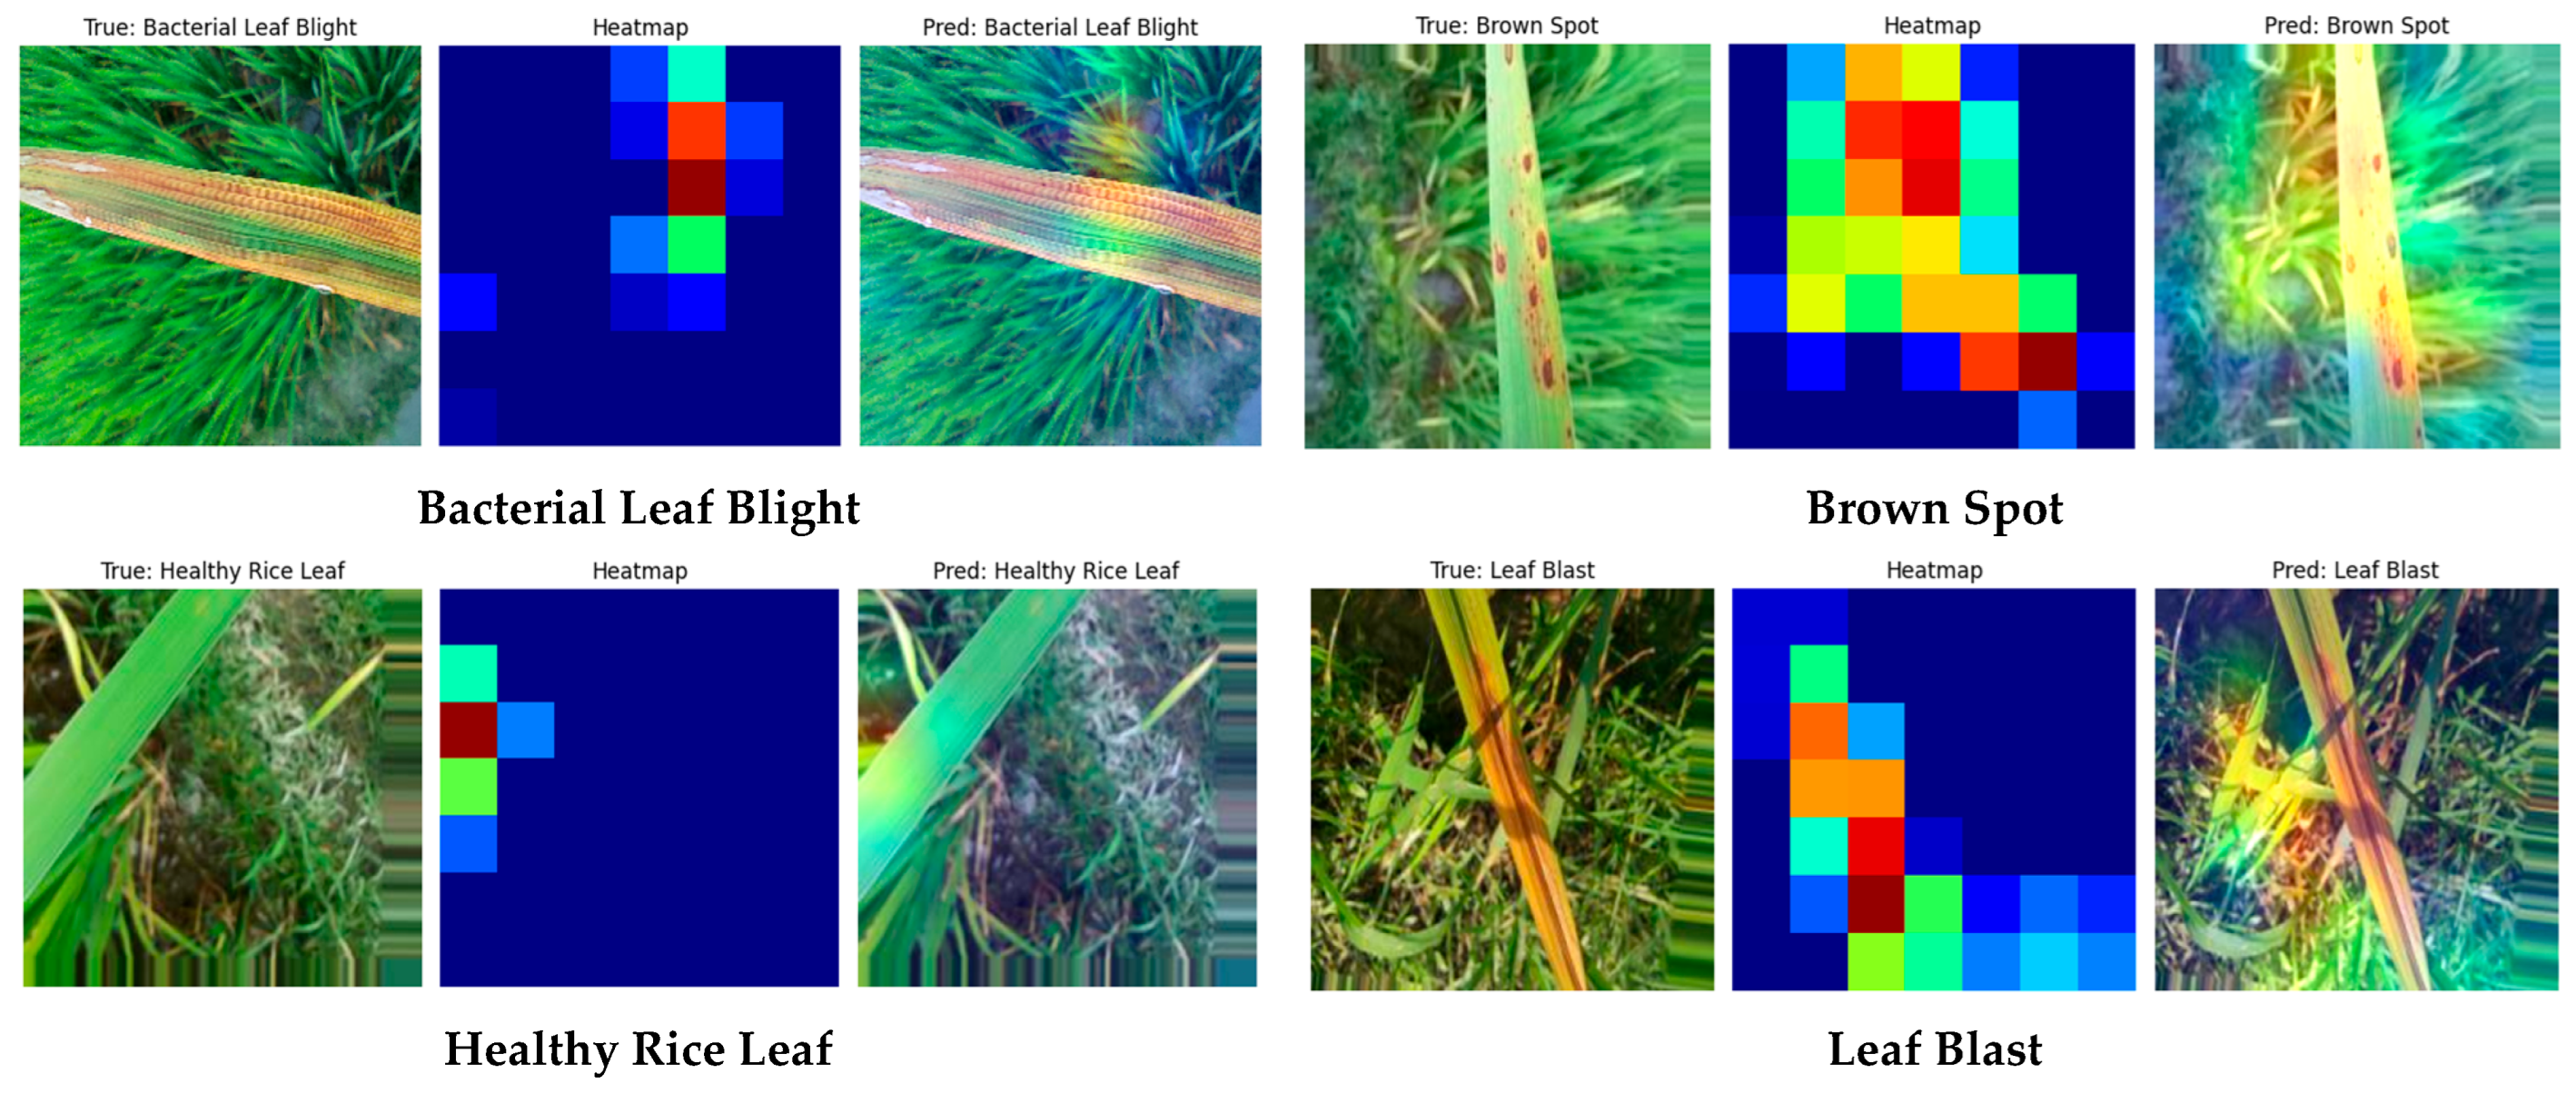
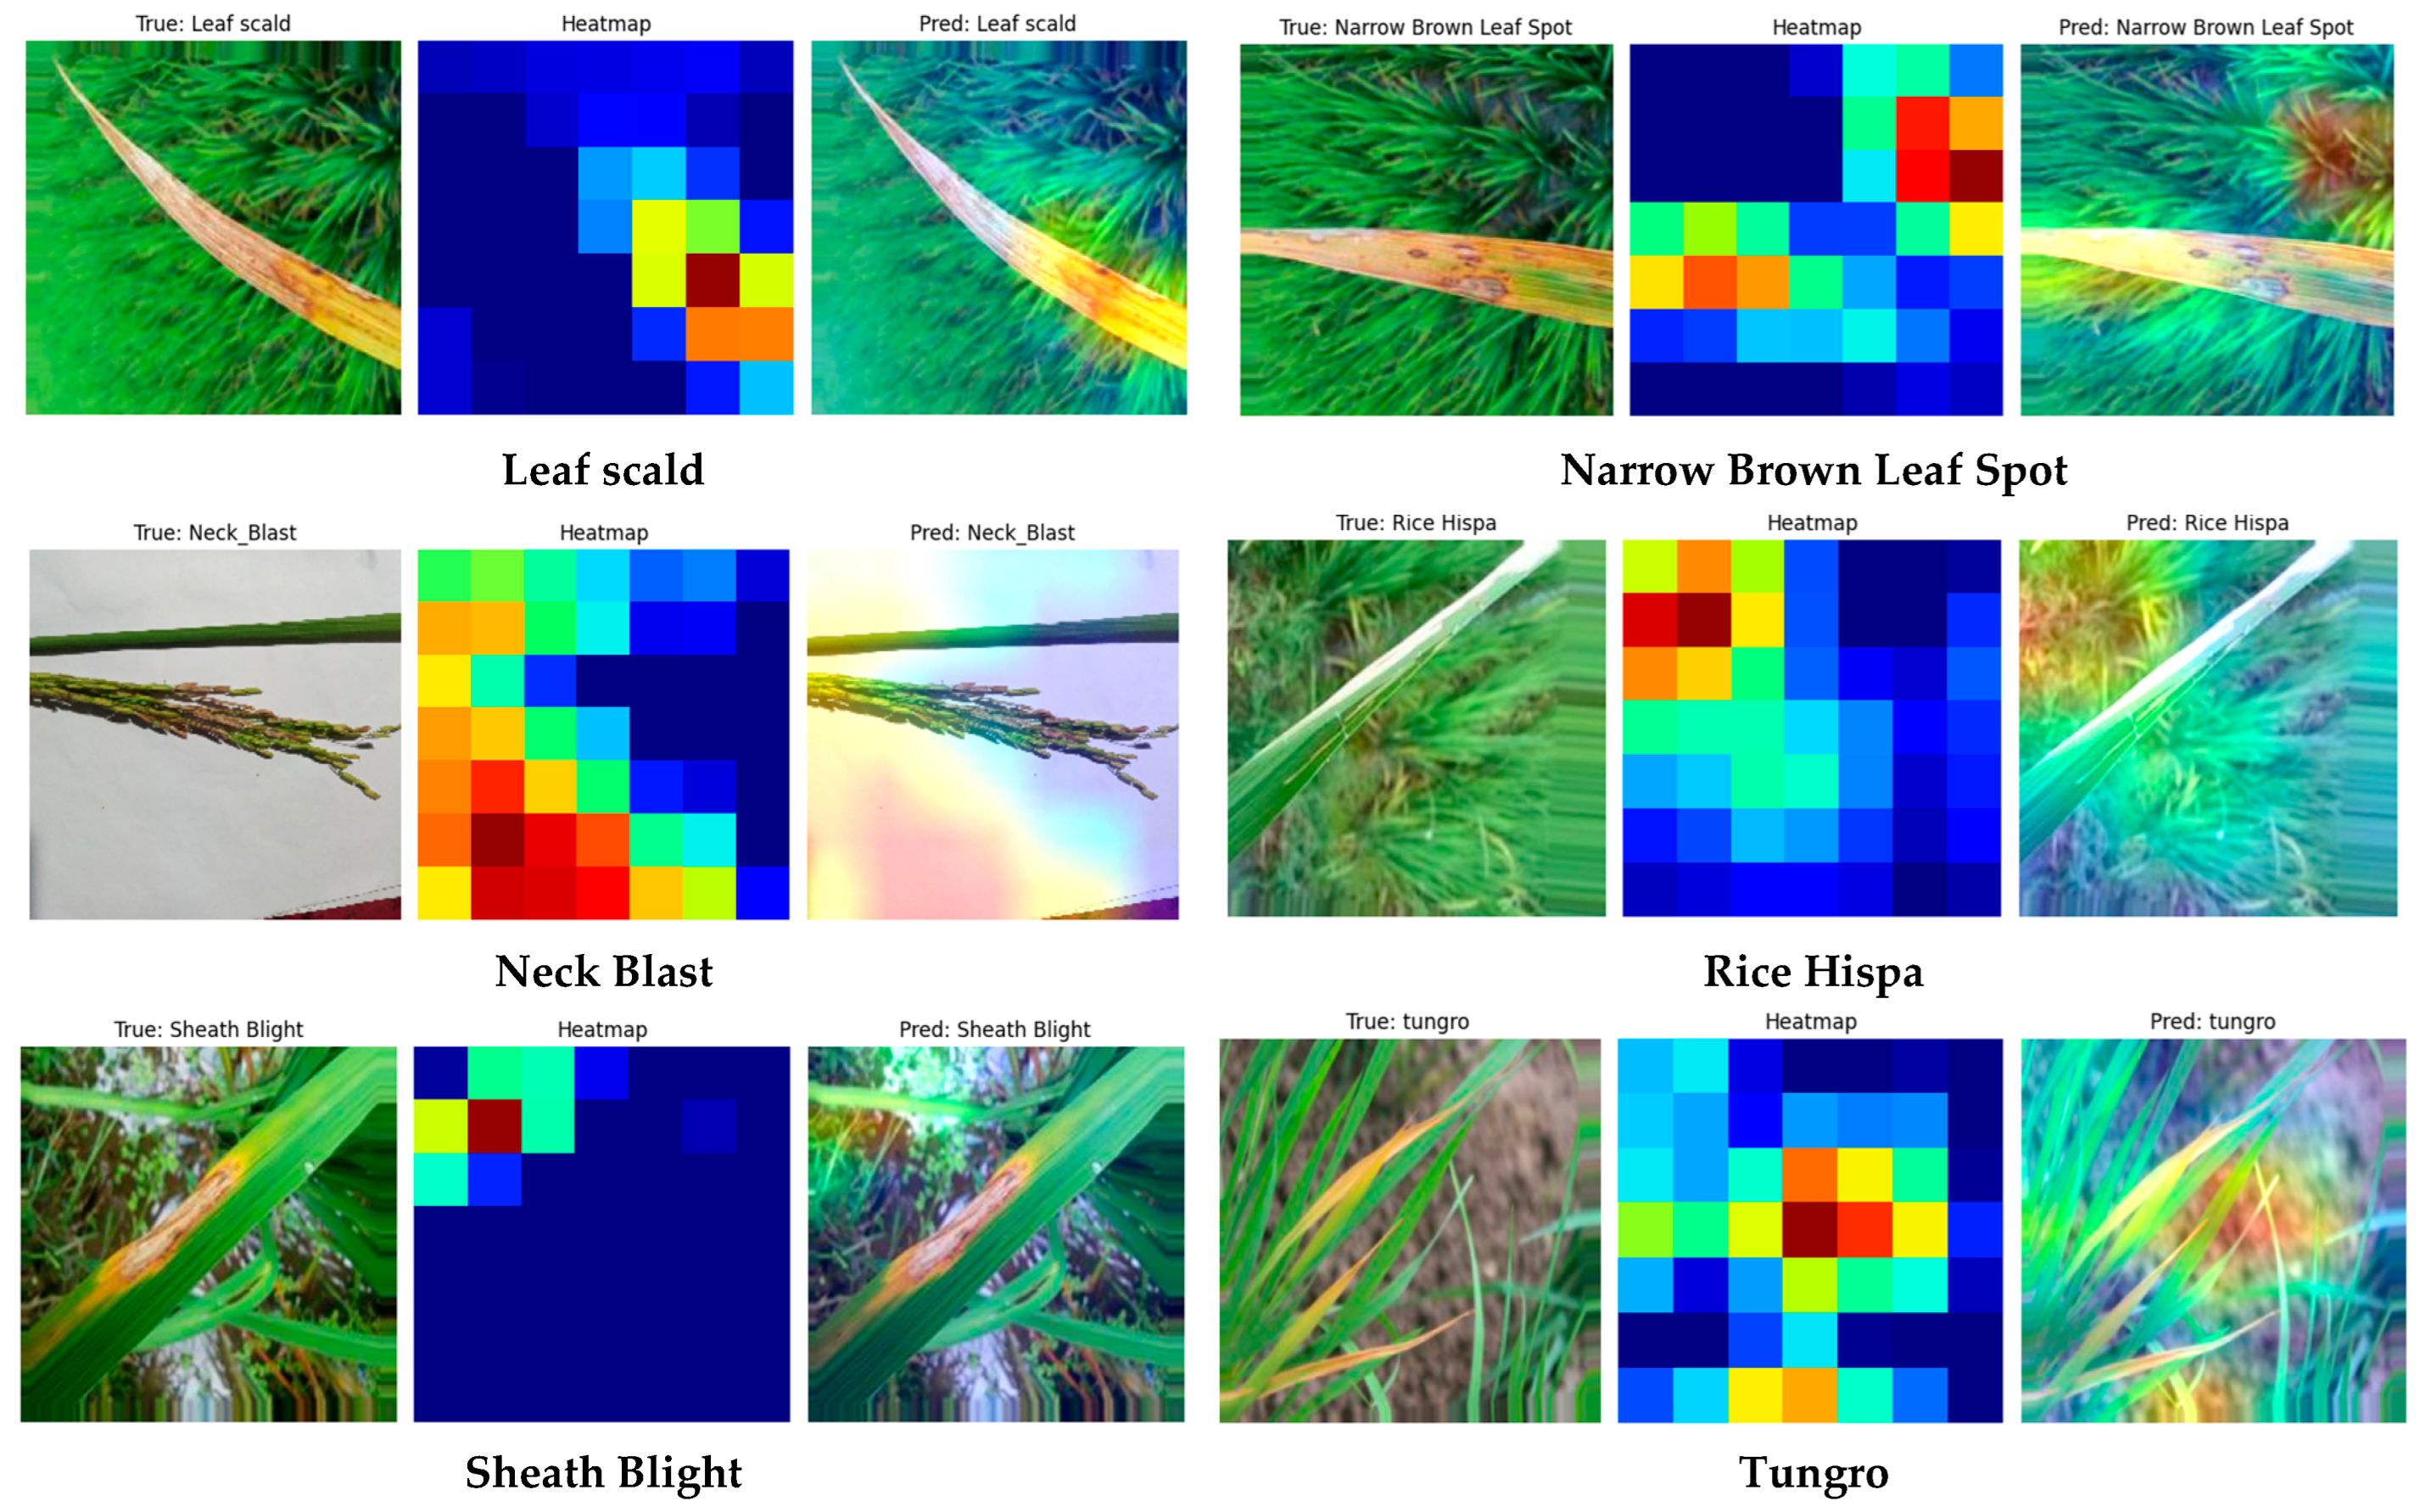
Figure 6 presents Grad-CAM visualizations of the proposed DASO-RiceNet for samples randomly selected from the test set across the ten rice disease and damage classes. Random selection was used to reduce potential selection bias in the qualitative analysis. For the illustrated disease samples, stronger activation regions generally correspond to visually apparent symptoms such as lesions and discolored areas. In Bacterial Leaf Blight, Leaf Scald, Brown Spot, and Leaf Blast, the activation maps show responses around visible affected regions. Similar patterns can be observed for Narrow Brown Leaf Spot, Neck Blast, Rice Hispa, Sheath Blight, and Tungro. In the illustrated Healthy Rice Leaf sample, the activation is comparatively dispersed. These observations suggest that, for the presented examples, the model’s predictions are influenced by symptom-related image regions. However, the Grad-CAM results represent qualitative explanations and should not be interpreted as quantitative validation of lesion localization or biological relevance.
Figure 6.
Grad-CAM visualizations of the proposed DASO-RiceNet model for rice disease and damage classes.
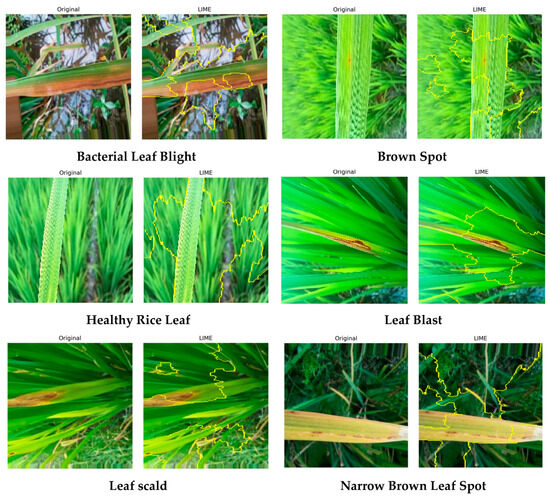
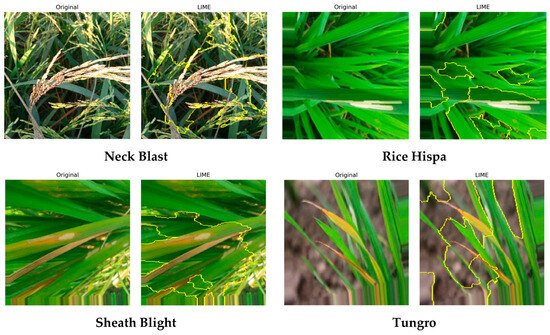
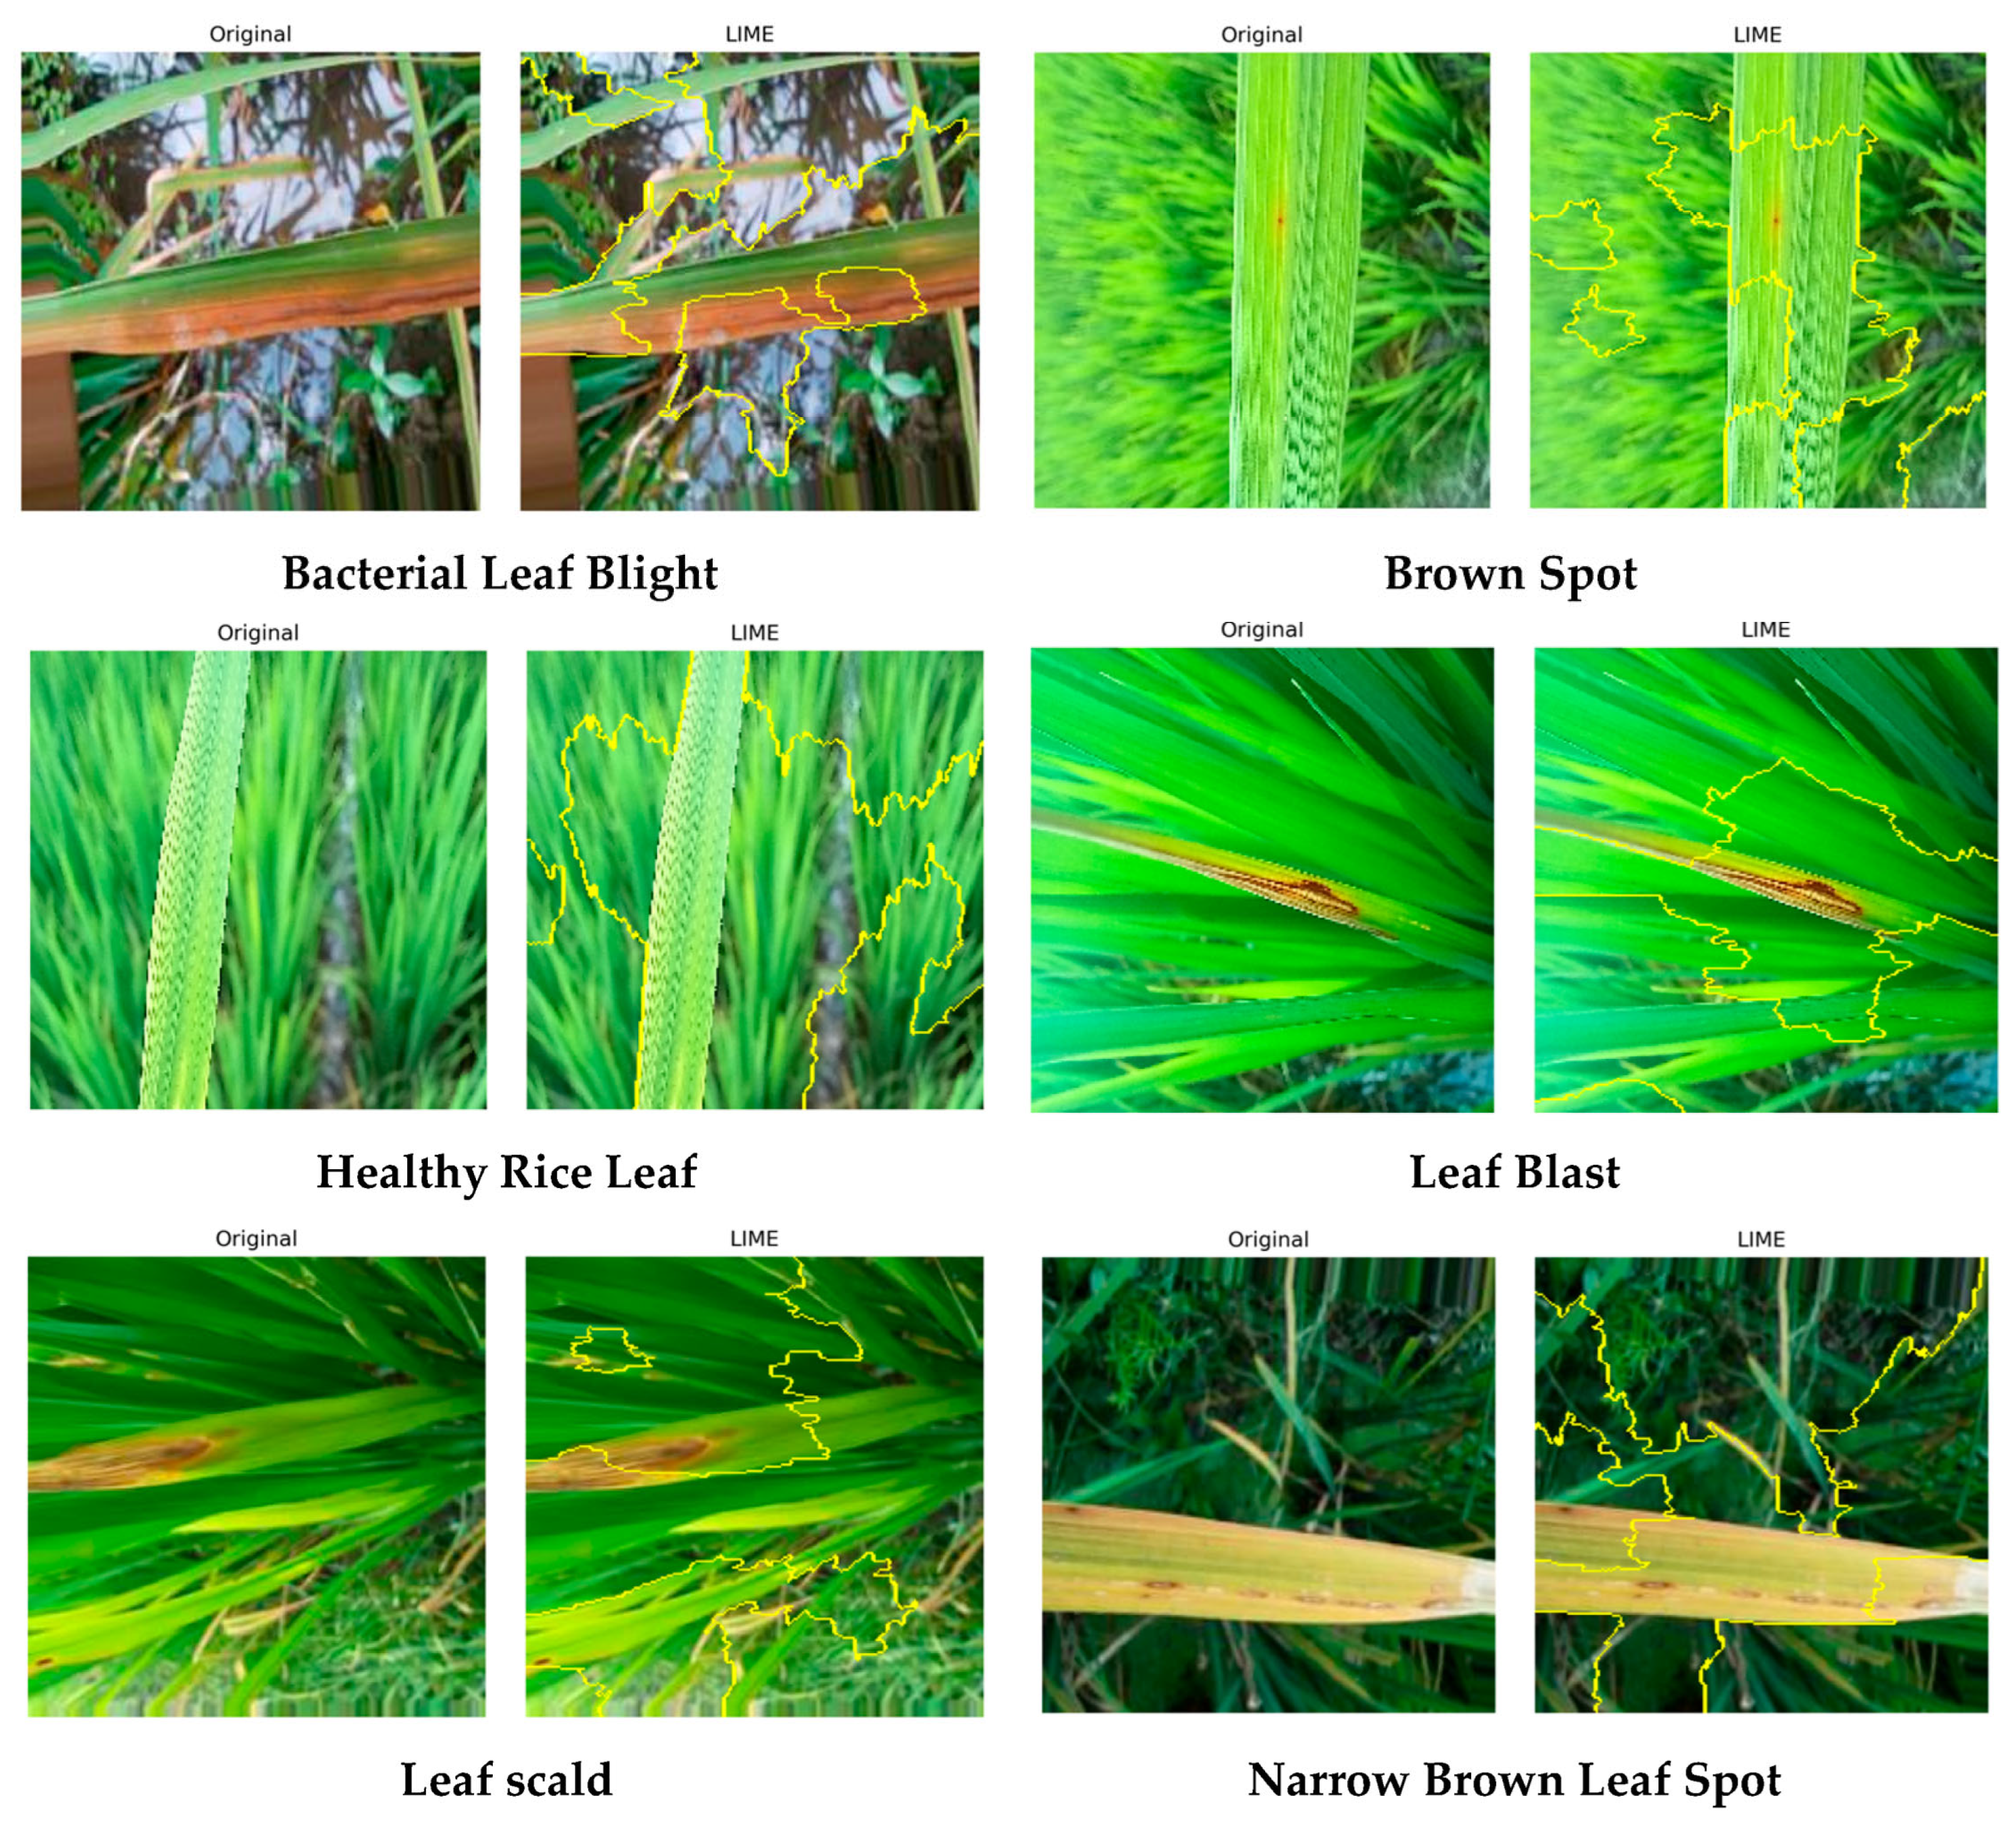
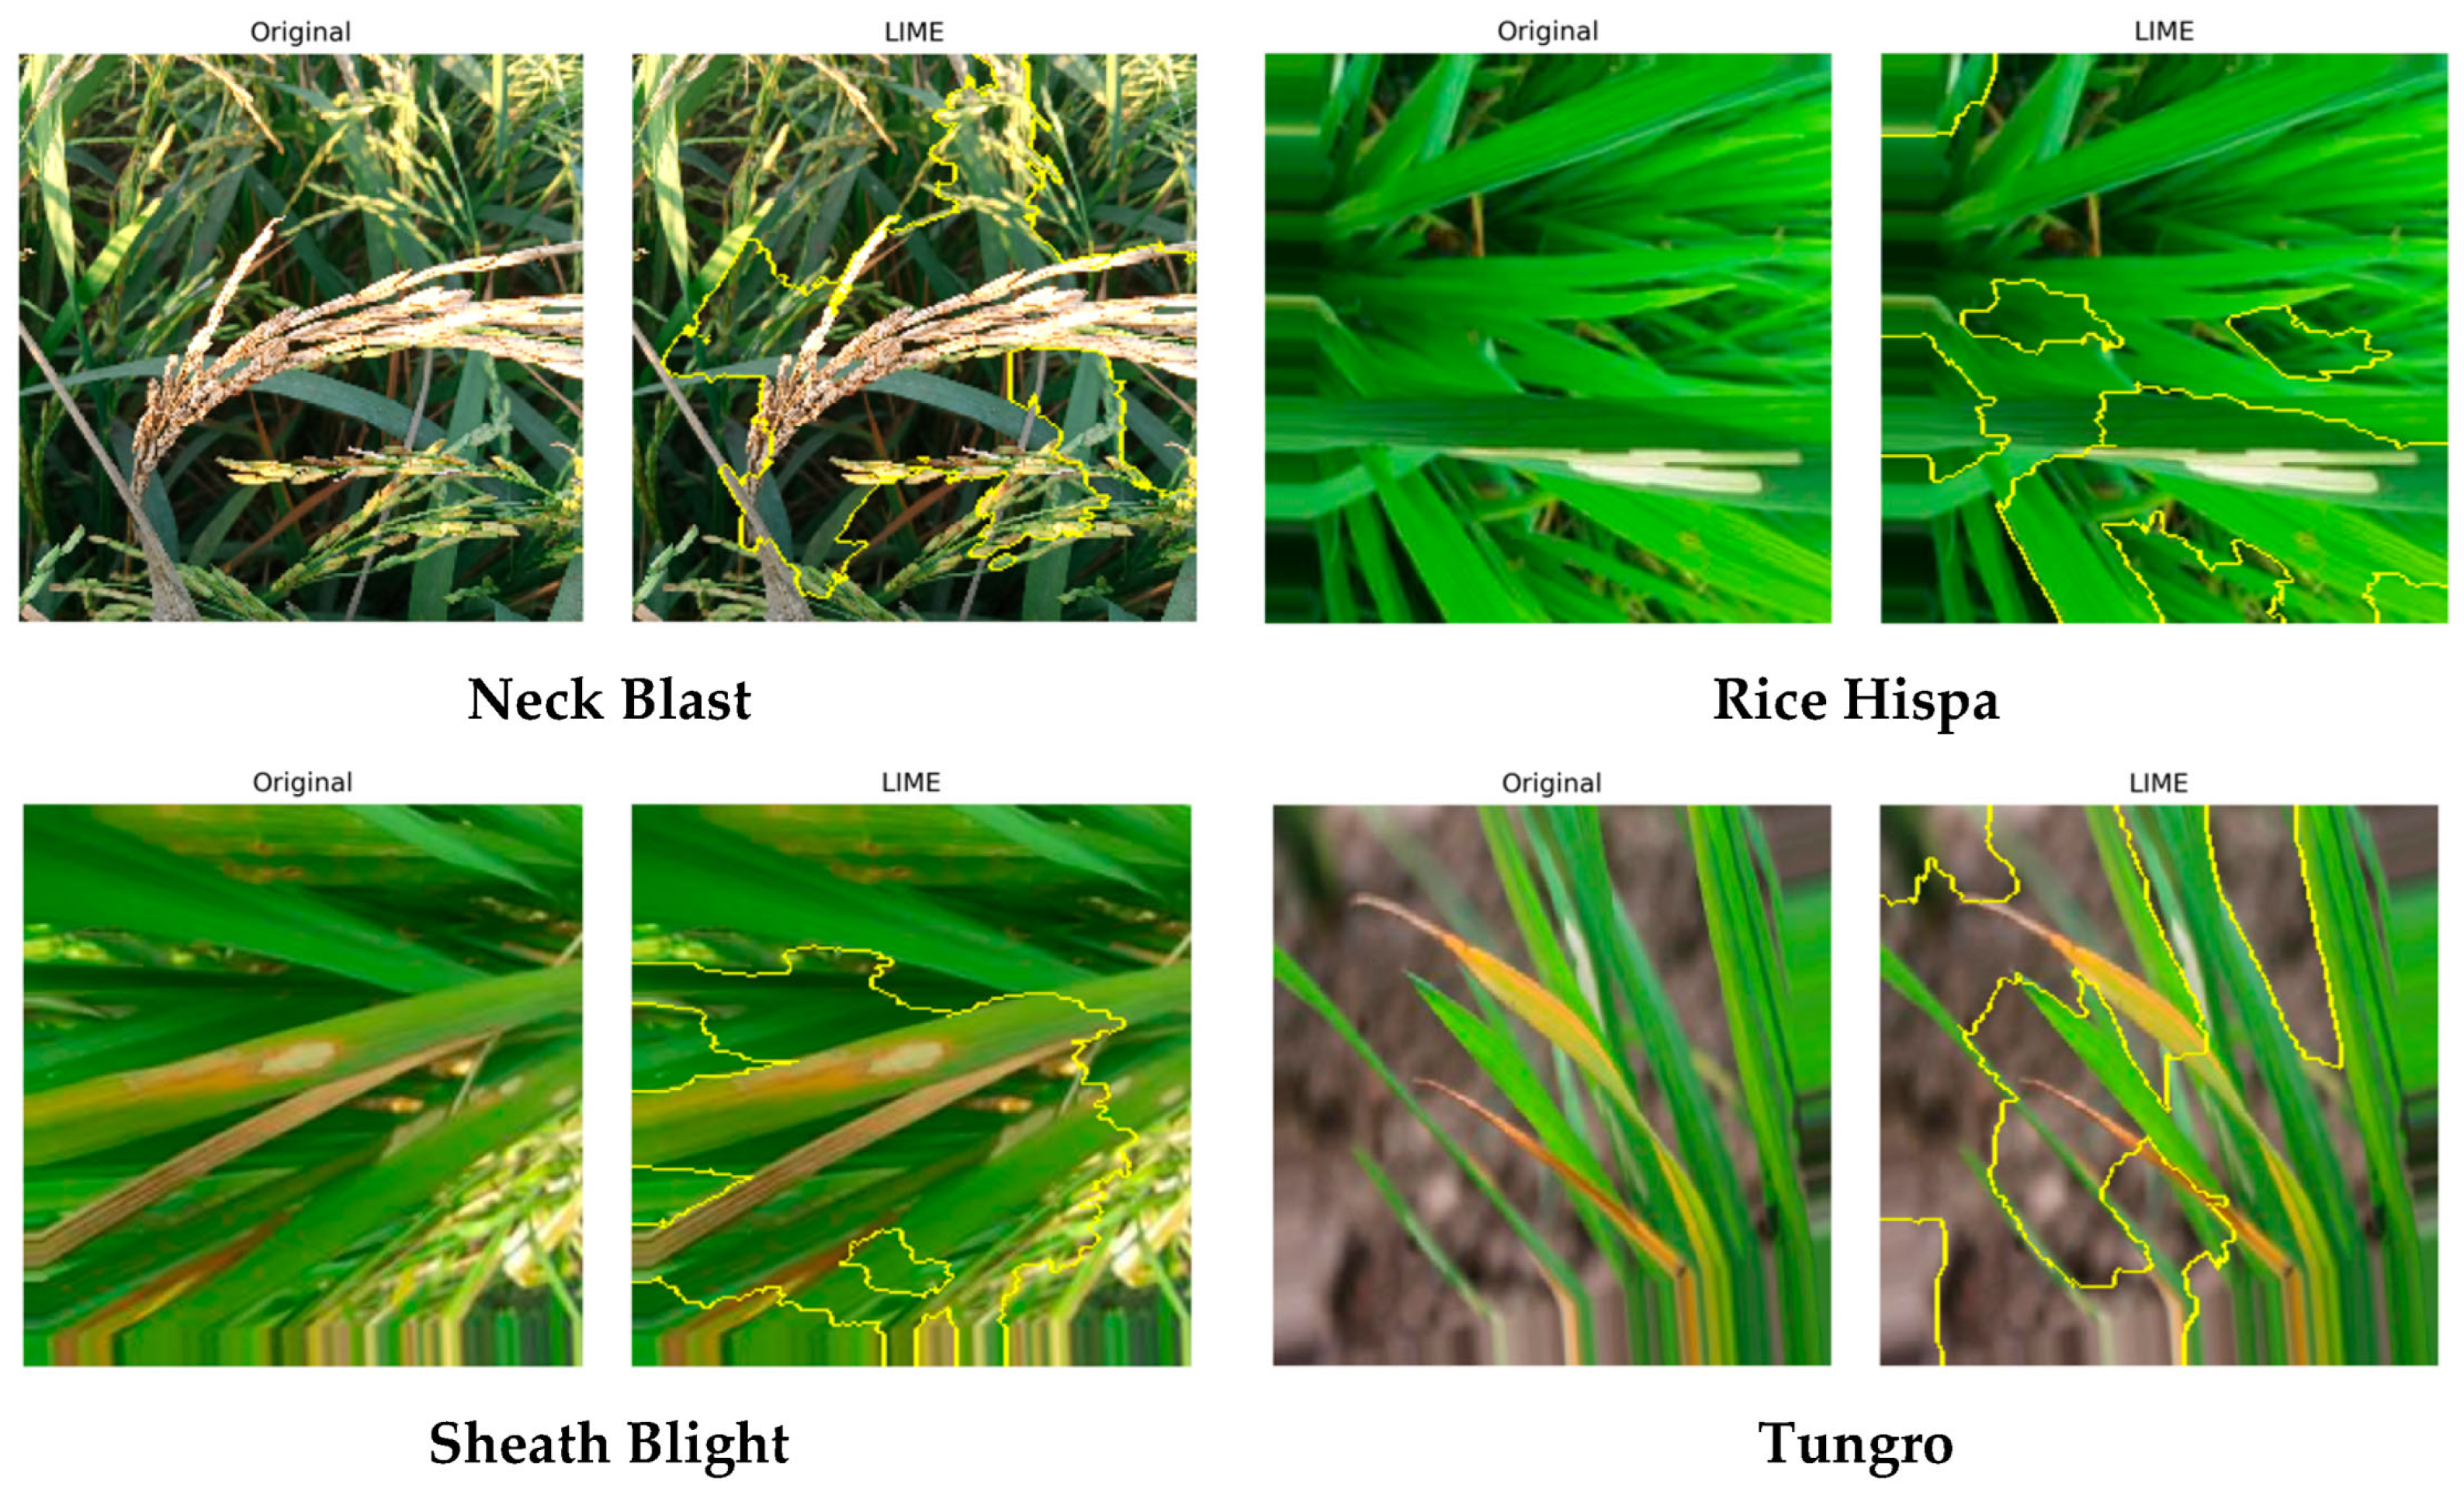
Figure 7 presents LIMEs for samples randomly selected from the test set across the ten rice disease and damage classes. The left column shows the original input images, while the right column highlights influential superpixels, with yellow boundaries indicating regions contributing to the corresponding model predictions. For several illustrated disease samples, including Bacterial Leaf Blight, Brown Spot, Leaf Blast, Leaf Scald, and Narrow Brown Leaf Spot, influential superpixels overlap with visually apparent lesions, necrotic regions, or discolored tissues. Similar associations with visible symptom-related regions are observed in the examples of Neck Blast, Rice Hispa, Sheath Blight, and Tungro. The Healthy Rice Leaf example shows a more dispersed distribution of influential regions. These LIMEs provide qualitative insight into the image regions contributing to individual predictions.
Figure 7.
LIME visualizations for representative samples of the ten rice disease and damage classes. For each sample, the original image is shown alongside its corresponding LIME explanation. The yellow contours delineate the superpixel boundaries identified by LIME, highlighting image regions used to interpret the model’s prediction. These explanations indicate the localized regions associated with the model’s classification decision.
Overall, the Grad-CAM and LIME visualizations provide qualitative evidence that, for the randomly selected examples shown in Figure 6 and Figure 7, DASO-RiceNet predictions are influenced by visually apparent symptom-related regions. Nevertheless, these instance-level visualizations do not establish that the model consistently relies on biologically relevant regions across the entire test set. Quantitative validation using expert-annotated lesion regions, ground-truth segmentation masks, or systematic localization metrics would be required to establish the biological relevance and localization reliability of the explanations.
4. Discussion
The proposed DASO-RiceNet achieved the highest classification performance among all evaluated models, with an overall accuracy of 0.965, precision of 0.963, recall of 0.966, and an F1-score of 0.964 on the 10-class rice disease and damage dataset. Compared with the CNN baseline, ResNet50, DenseNet121, Vision Transformer (ViT), and Swin Transformer, DASO-RiceNet demonstrated superior discriminative capability, particularly for visually similar disease categories. The improved performance can be attributed to the sequential dual-attention mechanism, in which channel attention first enhances informative semantic features and spatial attention subsequently emphasizes disease-relevant lesion regions while suppressing redundant background information. Previous studies have also reported that integrating channel and spatial attention improves feature representation and classification performance in plant disease recognition tasks [7]. Similarly, Hu et al. [33] demonstrated that attention-based feature enhancement effectively improves fine-grained lesion discrimination. The present results further confirm that refining the deepest semantic representation through sequential dual attention provides highly discriminative features for rice leaf disease classification.
The confusion matrix analysis (Figure 4) further demonstrates the effectiveness of DASO-RiceNet in reducing inter-class confusion. The proposed framework achieved noticeable improvements for visually similar diseases, particularly Brown Spot, Leaf Blast, Leaf Scald, and Narrow Brown Leaf Spot, where conventional CNN-based models frequently produced incorrect predictions. The layer-wise feature analysis further revealed that utilizing only the deepest semantic feature representation () achieved higher classification performance than combining shallow and deep feature maps. This observation suggests that high-level semantic representations provide more discriminative information than multi-level feature aggregation for fine-grained rice disease and damage classification. Similar challenges in distinguishing visually related rice diseases have also been reported by Zhang et al. [34], highlighting the importance of learning highly discriminative semantic representations.
The explainability analyses provide additional qualitative insight into the prediction behavior of DASO-RiceNet. The Grad-CAM visualizations (Figure 6) highlight activation regions that, in the randomly selected examples, generally correspond to visually apparent disease symptoms, while the LIMEs (Figure 7) identify influential superpixels contributing to individual predictions. The consistency of these qualitative observations suggests that the model’s predictions for the illustrated samples are influenced by symptom-related image regions. Similar observations have been reported by Sudhakar et al. [35], where attention-guided visualizations showed correspondence with disease lesion regions. However, these instance-level explanations do not constitute quantitative validation of biological relevance or localization accuracy. Further evaluation using expert-annotated lesion regions or ground-truth segmentation masks would be required to systematically assess explanation reliability.
Table 8 provides a contextual comparison of DASO-RiceNet with published approaches addressing 10- class rice disease and damage. Lu et al. [36] reported an accuracy of 0.955 using a deep CNN evaluated with 10-fold cross-validation. Elakya et al. [37] reported an accuracy of 0.940 using a CNN with stratified cross-validation on a paddy disease image dataset. Dhanya and Mythili [38] reported a best validation accuracy of 0.930 using InceptionV3 with spatial attention, while their InceptionV3 framework incorporating spatial and channel attention reported the best validation accuracy of 0.965. In the present study, DASO-RiceNet achieved a test accuracy of 0.965. Although all selected studies address 10- class rice disease and damage, these numerical results are not directly comparable because of differences in dataset composition, sample size, class definitions, data distributions, preprocessing procedures, data partitioning, training strategies, and evaluation protocols. Therefore, Table 8 is intended to provide descriptive context regarding the range of performance reported in 10-class rice disease and damage rather than to establish a direct performance ranking. Within the experimental setting of the present study, the results indicate that the proposed sequential dual-attention mechanism provides effective discriminative feature refinement.
Table 8.
Comparison of DASO-RiceNet with recent rice disease and damage classification methods.
The computational analysis further provides a quantitative assessment of the performance–complexity trade-off of DASO-RiceNet. The proposed model contains 11.389 M total parameters, of which 11.380 M are trainable, and requires 3.421 GFLOPs for a single forward pass. DASO-RiceNet achieved an inference latency of 18.435 ms/image and a throughput of 54.245 images/s under the same hardware and evaluation protocol used for all models. Its computational cost in terms of GFLOPs was lower than that of ResNet50 (7.752 GFLOPs) and DenseNet121 (5.701 GFLOPs), while its inference latency was lower than that of ResNet50 (40.842 ms/image), DenseNet121 (69.169 ms/image), and Swin Transformer (27.761 ms/image). However, the CNN baseline and ViT exhibited lower computational requirements and higher inference throughput. Therefore, DASO-RiceNet should not be interpreted as the computationally lightest architecture; rather, the results indicate a practical trade-off between classification performance and computational requirements.
Nevertheless, several limitations should be acknowledged. The publicly available dataset may not fully represent uncontrolled real-field conditions and does not provide plant-, leaf-, or acquisition-level metadata for group-based partitioning. Although duplicate and perceptual-similarity screening was conducted and the sensitivity analysis showed comparable performance after excluding flagged test images, residual cross-partition similarity cannot be completely excluded. Future studies should therefore validate DASO-RiceNet using group-aware partitions and independently collected field datasets.
In addition, the current framework is limited to single-label classification using RGB images and has not been evaluated for mixed disease infections or multimodal sensing data. In addition, model-specific hyperparameter optimization was not performed for the baseline architectures. Although all models were evaluated using the same dataset partition and independent test set, different CNN- and transformer-based architectures may benefit from architecture-specific training configurations. Therefore, the baseline comparison should be interpreted within the standardized experimental setting adopted in this study. Although the computational analysis demonstrated a practical performance–complexity trade-off, DASO-RiceNet is not the computationally lightest among the evaluated architectures, and its suitability for resource-constrained edge devices has not yet been experimentally established. Therefore, further model optimization and direct evaluation on embedded or edge-computing hardware are required before practical deployment.
Future work will focus on validating DASO-RiceNet using large-scale field datasets collected under diverse environmental conditions. Lightweight optimization techniques, including pruning, quantization, and knowledge distillation, will be investigated to reduce computational requirements and facilitate deployment on mobile and edge-computing platforms. In addition, integrating multimodal sensing modalities, such as hyperspectral and thermal imaging, together with lightweight transformer modules, will be investigated to further improve disease discrimination. The optimized framework will subsequently be evaluated on resource-constrained hardware in terms of inference latency, memory requirements, energy consumption, and real-time processing capability.
5. Conclusions
This study proposed DASO-RiceNet, a hierarchical dual-attention network for automatic rice disease and damage classes. The proposed model achieved higher classification performance than the evaluated CNN- and transformer-based baselines, with an accuracy of 0.965. Computational analysis showed that DASO-RiceNet requires 3.421 GFLOPs and achieves an inference latency of 18.435 ms/image, indicating a practical trade-off between classification performance and computational requirements. Grad-CAM and LIME provided qualitative insight into the model’s predictions, with randomly selected examples showing attention patterns associated with visually apparent symptom-related regions. Future work will focus on independent field validation, lightweight model optimization, quantitative explainability assessment, multimodal data integration, and evaluation on resource-constrained edge platforms.
Author Contributions
Conceptualization, A.K.S. and Y.-F.H.; methodology, A.K.S.; software, A.K.S.; validation, A.K.S., Y.-F.H., and C.-H.C.; formal analysis, A.K.S.; investigation, A.K.S.; resources, Y.-F.H. and C.-H.C.; data curation, A.K.S.; writing—original draft preparation, A.K.S.; writing—review and editing, Y.-F.H. and C.-H.C.; visualization, A.K.S.; supervision, Y.-F.H.; project administration, Y.-F.H.; funding acquisition, Y.-F.H. and C.-H.C. All authors have read and agreed to the published version of the manuscript.
Funding
This research was funded by the National Science and Technology Council (NSTC), Taiwan, under Grant No. NSTC 114-2221-E-324-005.
Institutional Review Board Statement
Not applicable.
Data Availability Statement
The dataset analyzed during this study is publicly available from the Kaggle repository: Rice Leaf Disease Dataset at https://www.kaggle.com/datasets/pavanireddyg/rice-leaf-disease-dataset (accessed on 15 March 2026).
Conflicts of Interest
The authors declare no conflicts of interest.
References
- Savary, S.; Willocquet, L.; Pethybridge, S.J.; Esker, P.; McRoberts, N.; Nelson, A. The Global Burden of Pathogens and Pests on Major Food Crops. Nat. Ecol. Evol. 2019, 3, 430–439. [Google Scholar] [CrossRef] [Scilit] [PubMed]
- Simhadri, C.G.; Kondaveeti, H.K. Automatic Recognition of Rice Leaf Diseases Using Transfer Learning. Agronomy 2023, 13, 961. [Google Scholar] [CrossRef] [Scilit]
- Liu, J.; Wang, X. Plant Diseases and Pests Detection Based on Deep Learning: A Review. Plant Methods 2021, 17, 22. [Google Scholar] [CrossRef] [Scilit] [PubMed]
- Haridasan, A.; Thomas, J.; Raj, E.D. Deep Learning System for Paddy Plant Disease Detection and Classification. Environ. Monit. Assess. 2023, 195, 120. [Google Scholar] [CrossRef] [Scilit] [PubMed]
- Arnal Barbedo, J.G. Plant Disease Identification from Individual Lesions and Spots Using Deep Learning. Biosyst. Eng. 2019, 180, 96–107. [Google Scholar] [CrossRef] [Scilit]
- Picon, A.; Seitz, M.; Alvarez-Gila, A.; Mohnke, P.; Ortiz-Barredo, A.; Echazarra, J. Crop Conditional Convolutional Neural Networks for Massive Multi-Crop Plant Disease Classification over Cell Phone Acquired Images Taken on Real Field Conditions. Comput. Electron. Agric. 2019, 167, 105093. [Google Scholar] [CrossRef] [Scilit]
- Duhan, S.; Gulia, P.; Gill, N.S.; Shukla, P.K.; Khan, S.B.; Almusharraf, A.; Alkhaldi, N. Investigating Attention Mechanisms for Plant Disease Identification in Challenging Environments. Heliyon 2024, 10, e29802. [Google Scholar] [CrossRef] [Scilit] [PubMed]
- Yang, L.; Yu, X.; Zhang, S.; Long, H.; Zhang, H.; Xu, S.; Liao, Y. GoogLeNet Based on Residual Network and Attention Mechanism Identification of Rice Leaf Diseases. Comput. Electron. Agric. 2023, 204, 107543. [Google Scholar] [CrossRef] [Scilit]
- Wang, Y.; Wang, H.; Peng, Z. Rice Diseases Detection and Classification Using Attention Based Neural Network and Bayesian Optimization. Expert Syst. Appl. 2021, 178, 114770. [Google Scholar] [CrossRef] [Scilit]
- Zhou, H.; Cai, D.; Lin, L.; Huang, D.; Wu, B. Recognition of Multi-Symptomatic Rice Leaf Blast in Dual Scenarios by Using Convolutional Neural Networks. Smart Agric. Technol. 2025, 11, 100867. [Google Scholar] [CrossRef] [Scilit]
- Mohanty, S.P.; Hughes, D.P.; Salathé, M. Using Deep Learning for Image-Based Plant Disease Detection. Front. Plant Sci. 2016, 7, 215232. [Google Scholar] [CrossRef] [Scilit] [PubMed]
- Pan, N.; Yang, W.; Luo, Y.; Wang, Y. Identification of Leaf Disease Based on Memristor Convolutional Neural Networks. IEEE Access 2024, 12, 115197–115203. [Google Scholar] [CrossRef] [Scilit]
- Pai, P.; Amutha, S.; Patil, S.; Shobha, T.; Basthikodi, M.; Shafeeq, B.M.A.; Gurpur, A.P. Deep Learning-Based Automatic Diagnosis of Rice Leaf Diseases Using Ensemble CNN Models. Sci. Rep. 2025, 15, 27690. [Google Scholar] [CrossRef] [Scilit] [PubMed]
- Too, E.C.; Yujian, L.; Njuki, S.; Yingchun, L. A Comparative Study of Fine-Tuning Deep Learning Models for Plant Disease Identification. Comput. Electron. Agric. 2019, 161, 272–279. [Google Scholar] [CrossRef] [Scilit]
- Naduvinamani, A.; Rudagi, J.M.; Anandhalli, M. A Multi-Stage Deep Learning Model with Fuzzy Logic for Plant Disease Classification in Cotton and Rice. Int. J. Intell. Eng. Syst. 2025, 18, 700–715. [Google Scholar] [CrossRef] [Scilit]
- Bijlwan, A.; Ranjan, R.; Pokhariyal, S.; Govind, A.; Singh, M.; Singh, K.P.; Singh, R.K.; Rajput, R.K.S.; Srivastava, R.K. Enhancing Rice Disease and Insect-Pest Detection through Augmented Deep Learning with Transfer Learning Techniques. Smart Agric. Technol. 2025, 11, 100954. [Google Scholar] [CrossRef] [Scilit]
- He, K.; Zhang, X.; Ren, S.; Sun, J. Deep Residual Learning for Image Recognition. In Proceedings of the 2016 IEEE Conference on Computer Vision and Pattern Recognition (CVPR); IEEE: New York, NY, USA, 2016; pp. 770–778. [Google Scholar]
- Lee, S.-H.; Jiang, Q.-W.; Cheng, C.-H.; Tsai, Y.-S.; Huang, Y.-F. Boosting Rice Disease Diagnosis: A Systematic Benchmark of Five Deep Convolutional Neural Network Models in Precision Agriculture. Agriculture 2025, 15, 2494. [Google Scholar] [CrossRef] [Scilit]
- Huang, G.; Liu, Z.; Van DerMaaten, L.; Weinberger, K.Q. Densely Connected Convolutional Networks. In Proceedings of the 2017 IEEE Conference on Computer Vision and Pattern Recognition (CVPR); IEEE: New York, NY, USA, 2017; pp. 2261–2269. [Google Scholar]
- Hu, J.; Shen, L.; Sun, G. Squeeze-and-Excitation Networks. In Proceedings of the 2018 IEEE/CVF Conference on Computer Vision and Pattern Recognition; IEEE: New York, NY, USA, 2018; pp. 7132–7141. [Google Scholar]
- Woo, S.; Park, J.; Lee, J.-Y.; Kweon, I.S. CBAM: Convolutional Block Attention Module. In Proceedings of the European Conference on Computer Vision; Springer: Berlin/Heidelberg, Germany, 2018; pp. 3–19. [Google Scholar]
- Saeed, J.N.; Hussein, M.K. A Multi-ViTs-Based Approach for Automatic Rice Leaf Disease Classification. Iraqi J. Sci. 2025, 66, 3938–3950. [Google Scholar] [CrossRef] [Scilit]
- Zeng, W.; Li, M. Crop Leaf Disease Recognition Based on Self-Attention Convolutional Neural Network. Comput. Electron. Agric. 2020, 172, 105341. [Google Scholar] [CrossRef] [Scilit]
- Alfred, R.; Leo, J.; Kaijage, S.F. Detectron2-Enhanced Mask R-CNN for Precise Instance Segmentation of Rice Blast Disease in Tanzania: Supporting Timely Intervention and Data-Driven Severity Assessment. Smart Agric. Technol. 2025, 12, 101301. [Google Scholar] [CrossRef] [Scilit]
- Lin, T.-Y.; Dollar, P.; Girshick, R.; He, K.; Hariharan, B.; Belongie, S. Feature Pyramid Networks for Object Detection. In Proceedings of the 2017 IEEE Conference on Computer Vision and Pattern Recognition (CVPR); IEEE: New York, NY, USA, 2017; pp. 936–944. [Google Scholar]
- Sunil, C.K.; Jaidhar, C.D.; Patil, N. Tomato Plant Disease Classification Using Multilevel Feature Fusion with Adaptive Channel Spatial and Pixel Attention Mechanism. Expert Syst. Appl. 2023, 228, 120381. [Google Scholar] [CrossRef] [Scilit]
- Dai, W.; Zhu, W.; Zhou, G.; Liu, G.; Xu, J.; Zhou, H.; Hu, Y.; Liu, Z.; Li, J.; Li, L. AISOA-SSformer: An Effective Image Segmentation Method for Rice Leaf Disease Based on the Transformer Architecture. Plant Phenomics 2024, 6, 0218. [Google Scholar] [CrossRef] [Scilit] [PubMed]
- Wang, Y.; Zhang, P.; Tian, S. Tomato Leaf Disease Detection Based on Attention Mechanism and Multi-Scale Feature Fusion. Front. Plant Sci. 2024, 15, 1382802. [Google Scholar] [CrossRef] [Scilit] [PubMed]
- Selvaraju, R.R.; Cogswell, M.; Das, A.; Vedantam, R.; Parikh, D.; Batra, D. Grad-CAM: Visual Explanations from Deep Networks via Gradient-Based Localization. In Proceedings of the 2017 IEEE International Conference on Computer Vision (ICCV); IEEE: New York, NY, USA, 2017; pp. 618–626. [Google Scholar]
- Kondaveeti, H.K.; Simhadri, C.G. Evaluation of Deep Learning Models Using Explainable AI with Qualitative and Quantitative Analysis for Rice Leaf Disease Detection. Sci. Rep. 2025, 15, 31850. [Google Scholar] [CrossRef] [Scilit] [PubMed]
- Dosovitskiy, A.; Beyer, L.; Kolesnikov, A.; Weissenborn, D.; Zhai, X.; Unterthiner, T.; Dehghani, M.; Minderer, M.; Heigold, G.; Gelly, S.; et al. An Image Is Worth 16X16 Words: Transformers for Image Recognition At Scale. In Proceedings of the ICLR 2021—9th International Conference on Learning Representations, Virtual Event, 3–7 May 2021. [Google Scholar]
- Liu, Z.; Lin, Y.; Cao, Y.; Hu, H.; Wei, Y.; Zhang, Z.; Lin, S.; Guo, B. Swin Transformer: Hierarchical Vision Transformer Using Shifted Windows. In Proceedings of the 2021 IEEE/CVF International Conference on Computer Vision (ICCV); IEEE: New York, NY, USA, 2021; pp. 9992–10002. [Google Scholar] [CrossRef] [Scilit]
- Hu, K.; Zheng, X.; Su, X.; Wu, L.; Liu, Y.; Deng, Z. Identification of Rice Leaf Disease Based on DepMulti-Net. Front. Plant Sci. 2025, 16, 1522487. [Google Scholar] [CrossRef] [Scilit] [PubMed]
- Zhang, P.; Li, R.; Liu, Y.; Sun, G.; Wen, C. I-GhostNetV3: A Lightweight Deep Learning Framework for Vision-Sensor-Based Rice Leaf Disease Detection in Smart Agriculture. Sensors 2026, 26, 1025. [Google Scholar] [CrossRef] [Scilit] [PubMed]
- Sudhakar, R.; Nithya, K.; Dhivyaa, C.R.; Sharmila, C. High-Performance Parallel Multi-Scale Attention Network with Explainable AI for Intelligent Diagnosis of Leaf Diseases in Agricultural Systems. Sci. Rep. 2025, 15, 42060. [Google Scholar] [CrossRef] [Scilit] [PubMed]
- Lu, Y.; Yi, S.; Zeng, N.; Liu, Y.; Zhang, Y. Identification of Rice Diseases Using Deep Convolutional Neural Networks. Neurocomputing 2017, 267, 378–384. [Google Scholar] [CrossRef] [Scilit]
- R, E.; Gopalakrishnan, A.; Balakrishnan, A.; K, S. Advanced Techniques in Paddy Disease Detection: Boosting Classification Accuracy with Stratified Cross-Validation. Paddy Water Environ. 2026, 24, 155–169. [Google Scholar] [CrossRef] [Scilit]
- Dhanya, R.; Mythili, S. Rice Leaf Disease Diagnosis through Deep Learning: An InceptionV3 Approach with Spatial Attention for Sustainable Agriculture and Food Security. Arch. Technol. Sci. 2026, 35, 27–48. [Google Scholar] [CrossRef] [Scilit]
- Dhanya, R.; Mythil, S. Enhanced Rice Leaf Disease Detection Through InceptionV3 Integration with Dual Attention and GRAD-CAM Explainability. Int. Res. J. Adv. Eng. Hub. 2026, 4, 805–814. [Google Scholar] [CrossRef] [Scilit]

Disclaimer/Publisher’s Note: The statements, opinions and data contained in all publications are solely those of the individual author(s) and contributor(s) and not of MDPI and/or the editor(s). MDPI and/or the editor(s) disclaim responsibility for any injury to people or property resulting from any ideas, methods, instructions or products referred to in the content. |
© 2026 by the authors. Licensee MDPI, Basel, Switzerland. This article is an open access article distributed under the terms and conditions of the Creative Commons Attribution (CC BY) license.