


Abstract
Severe soil salinization and low fertility significantly constrain sustainable agricultural development in the Yellow River Delta, one of the three major estuarine deltas in China. Despite their ecological importance, the regional-scale spatial interactions between soil salinity and nutrients, particularly regarding their vertical variability, remain poorly understood. This study analyzed 228 soil samples from 76 sites distributed across a distinct salinity gradient, which was determined by constructing a spatial salinity distribution map after sampling. Samples were collected at three depths (0–15, 15–30, and 30–45 cm) to investigate the spatial distribution of soil organic carbon (SOC), total nitrogen (TN), and the C/N ratio, along with their underlying driving factors. SOC and TN exhibited similar spatial patterns, with higher values distributed along both banks of the Yellow River. Horizontally, SOC and TN in the 0–15 cm layer decreased gradually from west to east, whereas the 15–30 cm and 30–45 cm layers showed an opposite trend, increasing eastward. Vertically, SOC and TN contents declined significantly with soil depth (p < 0.05), although the magnitude of this decline varied regionally: the 0–15 cm layer in the western area contained markedly higher nutrient levels than deeper layers, while vertical variation was less pronounced in the eastern and estuarine regions. Both variables were positively associated with total phosphorus (TP), available potassium (AK), soil moisture content (MC), clay content, and pH, but negatively correlated with electrical conductivity (EC), particularly in the 0–15 cm layer. Our results highlight that soil texture, moisture, and salinity affect the spatial heterogeneity and vertical decline of SOC and TN in the Yellow River Delta. Future research should focus on the long-term temporal distribution of the coupling of multiple elements under changing hydrological and salinity regimes.
1. Introduction
The Yellow River Delta, one of China’s major estuarine deltas, covers approximately 8243 km2, with farmland accounting for about 52% of this area [1,2]. Formed by intensive sediment deposition, the delta has experienced distinct developmental stages driven by frequent river channel shifts and massive upstream sediment delivery, creating a clear soil chronosequence from older soils in the south to younger soils in the north and east [3]. Concurrently, interactions between hydroclimatic stressors (shallow groundwater, seawater intrusion) and human activities (agricultural expansion, saline irrigation, intensive groundwater extraction) have made this region one of the most severely affected by soil salinization in China [4,5,6,7,8].
Increasing soil salt concentrations significantly suppress nutrient cycling processes and constrain carbon and nitrogen transformations. Excessive accumulation of salts induces swelling and dispersion of soil particles and disrupts aggregate structure, which ultimately reduces the physical protection of soil organic carbon (SOC), accelerating its decomposition and loss [9]. Increased salinity (to 2.0‰) can decrease SOC in cotton fields by ~17.5% [10]. Beyond direct physical disruption of soil structure, salinity can indirectly affect soil nutrient cycling via plant and microbial pathways [11]. For instance, soil salinization suppresses crop growth and reduces biomass and yield, thereby diminishing soil organic matter inputs and constraining soil carbon sequestration. Conversely, salinity reduction enhances plant-derived carbon inputs and sequestration [12,13]. In addition, diminished microbial biomass constrains the availability of precursors required for stable SOC formation, resulting in a net decline in SOC [14]. High salinity suppresses nitrification processes [15], thereby hindering nitrogen transformation and limiting total nitrogen (TN) availability. The C/N ratio, as a soil fertility indicator closely related to SOC and TN, is regulated by a combination of climatic, hydrological, edaphic, vegetative, and agronomic factors [16,17].
Most existing studies in the Yellow River Delta have focused on surface soils or plot scales, leaving the spatial interactions between soil salinity and nutrient accumulation across larger regional scales insufficiently understood. For instance, some studies examined the spatial distribution of TN and available potassium (AK), but those analyses were restricted to the 0–15 cm layer [18]. Similarly, investigations of the spatial distribution of SOC were also limited to the top layer (0–20 cm) [19,20], thereby overlooking the variations across the soil profile. Previous studies have explored the effects of groundwater level and salinity gradients on SOC and TN accumulation in the estuary; however, these investigations were geographically limited and could not capture regional variability [17,21]. Additionally, some work has examined both horizontal and vertical patterns of soil nutrients, but it did not explicitly address spatial differentiation in vertical variation across the delta [21,22]. Although the spatial heterogeneity and vertical distribution of soil physicochemical properties have been investigated in a coastal reclamation area in Yancheng [23], the corresponding patterns in the Yellow River Delta remain poorly understood. Moreover, although land-use types are widely recognized as critical determinants of soil nutrient accumulation, their specific regulatory effects on nutrient vertical variation distribution under contrasting salinity gradients remain to be clarified.
To address the above knowledge gaps, we investigated the spatial (sampling interval <10 km) and vertical (0–45 cm) distributions of SOC, TN, and the C/N ratio across the Yellow River Delta and identified the key environmental factors controlling these patterns. Specifically, the objectives are to: (1) characterize the horizontal and vertical variation distribution of SOC, TN, and the C/N ratio at different soil depths; (2) examine the relationships between soil nutrients and physicochemical properties; and (3) evaluate the influence of land use and environmental factors on nutrient accumulation in saline soils.
2. Materials and Methods
2.1. Study Area
This study is located in the alluvial plain of the middle and lower reaches of the Yellow River, specifically in Shandong Province, China, which features a warm-temperate continental monsoon climate. The average annual temperature is approximately 12.1 °C, and the average annual precipitation is about 551.6 mm [24]. The altitude ranges from −6 m to 110 m. The region has been shaped by the natural evolution of the Yellow River, characterized by periodic sedimentation, frequent channel shifts, and avulsion at the estuary [19,25]. The region features a complex mosaic of hills, gentle slopes, and depressions. The main crops are winter wheat, corn, cotton, rice, and soybeans [26,27,28]. The main soil types in this region are coastal saline fluvo-aquic soil and solonchaks [25]. Silt loam is the dominant soil texture in the area (Figure S1). Seasonal alternations drive the repeated upward movement and leaching of salts, resulting in the widespread occurrence of soil salinization [29].
2.2. Soil Sampling and Analysis
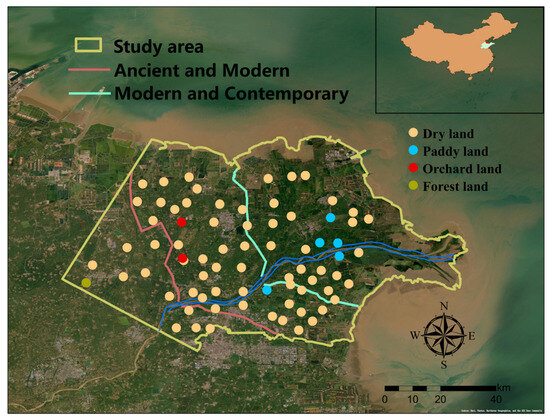
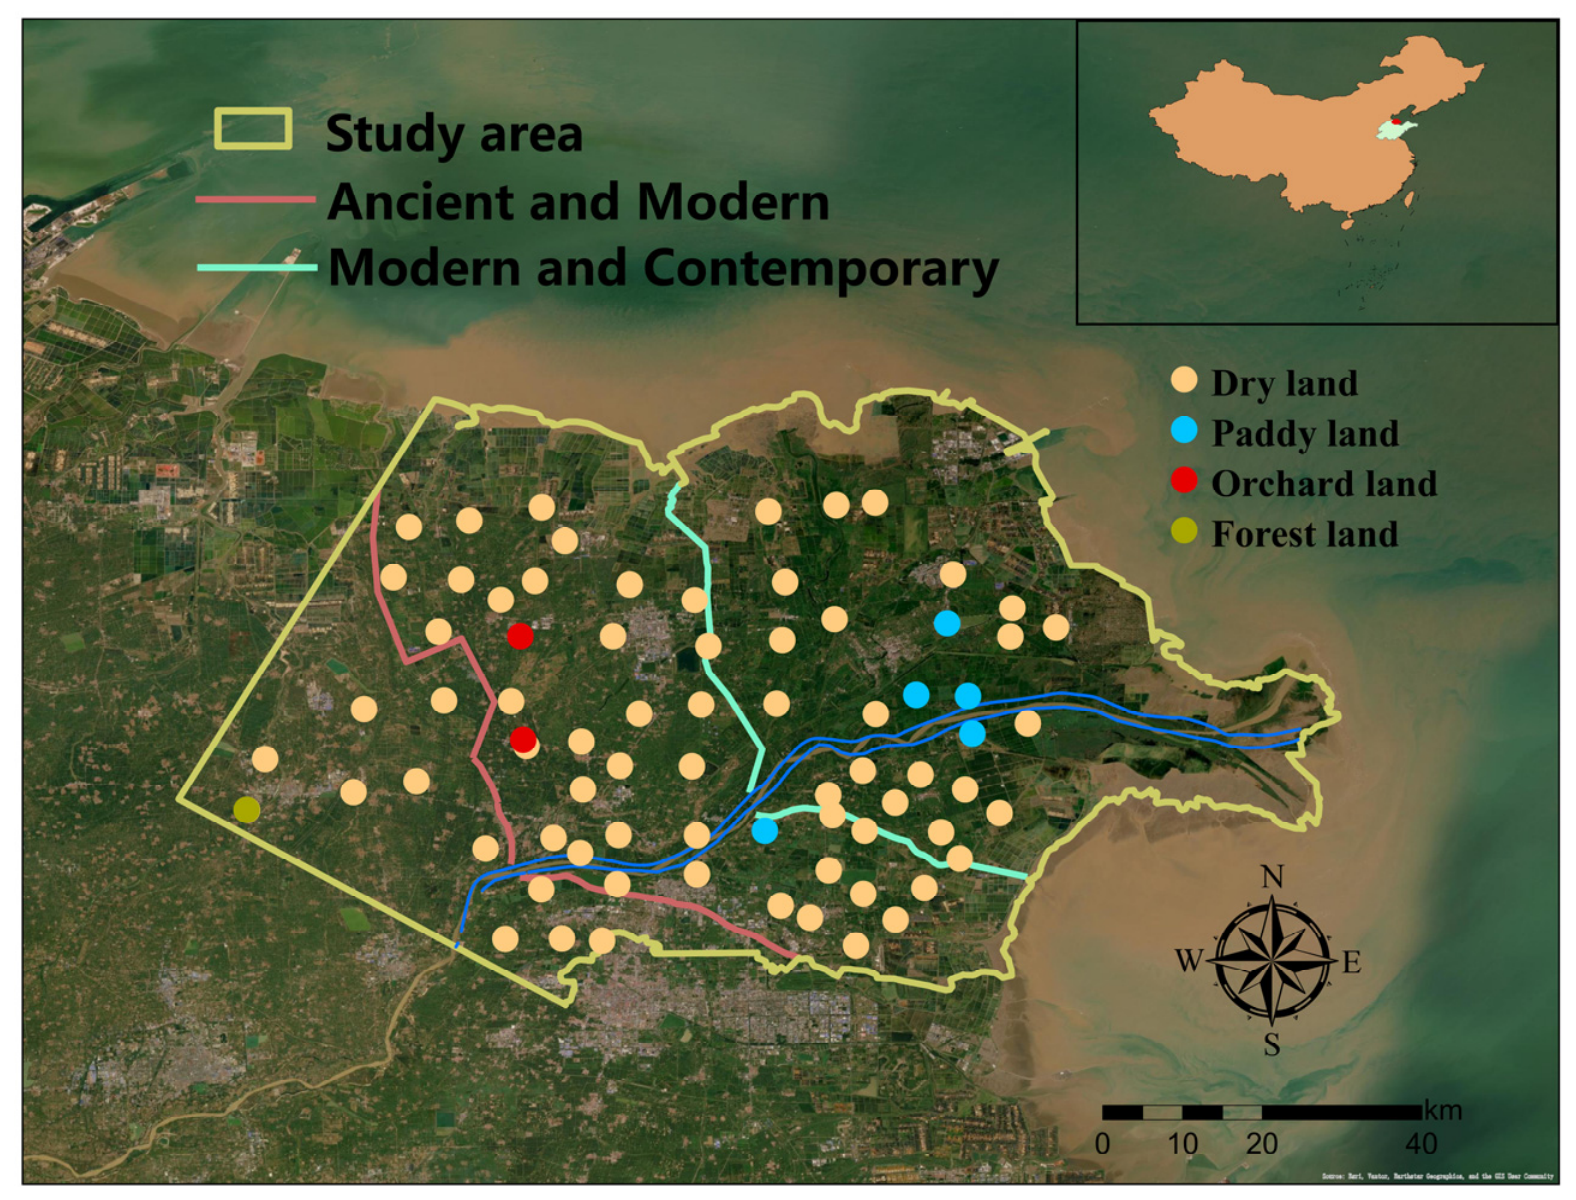
In April 2025, soil samples were collected from 76 sites across the study area using a grid point distribution method adjusted for field accessibility, with an inter-site spacing of 3–10 km (Figure 1). Following the classification criteria for the Yellow River Delta proposed by Ye et al. [30], these sites were categorized by their formation periods, i.e., Ancient (12 sites), Modern (39 sites), and Contemporary (25 sites), as well as their land-use types, including dry land (68 sites), paddy land (5 sites), orchard land (2 sites), and forest land (1 site).
Figure 1.
Location of the study area and distribution of sampling sites across different land use types.
At each sampling point, undisturbed soil samples were collected using cutting rings (50 mm in diameter, 50 mm in height, 100 cm3 in volume) from three soil layers: 0–15 cm, 15–30 cm, and 30–45 cm. Soil bulk density was determined by the oven-drying method [31].
At each sampling location, the soil profile was stratified into three layers with 15 cm increments. From each layer, three replicate subsamples were collected from the lateral margins and the central position (The distance between the lateral margins and the center position is 50 cm.), pooled in self-sealing polyethylene bags, and thoroughly mixed to form a composite sample, resulting in a total of 228 samples. After air-drying, the samples were placed in sealed plastic bags and stored at 4 °C to inhibit microbial activity. Prior to analysis, the sample was first coarsely sieved using a 10-mm sieve, then passed through a 2-mm stainless steel sieve for further sieving to remove plant debris and stones. SOC was determined using the dichromate oxidation method [32]. Carbonates were removed by adding 2 mol/L HCl dropwise until no further bubbling was observed. After centrifugation and removal of the supernatant, the residue was washed repeatedly with deionized water (3–5 times) until neutral, then dried at 60–80 °C and weighed. Chloride interference was masked by the addition of silver sulfate during digestion. A correction factor of 1.04 was used to adjust the oxidation results. TN was measured by the Kjeldahl method [33]. Total phosphorus (TP) was determined using the molybdenum-antimony colorimetric method [34]. AK was measured with a flame photometer. Available phosphorus (AP) was extracted with NaHCO3 and then analyzed using the Mo-Sb colorimetric method with a spectrophotometer (Shimadzu UV2550, Kyoto, Japan) [35]. Soil particle size distribution was determined by laser diffraction using a Mastersizer 2000 (Malvern Instruments, Malvern, UK). Soil pH and electrical conductivity (EC) were measured in a 1:5 soil-to-water (Mass ratio) suspension using a pH meter and the four-electrode method, respectively [36]. MC was determined using the oven-drying method (105 °C).
Vertical variation distribution was calculated by ΔEC, ΔSOC, ΔTN, and ΔC/N, which denote the changes in EC, SOC, TN, and C/N ratios between different soil layers, respectively. The calculation formulas are as follows:
where ECD and ECu refer to the EC values in the deeper and upper soil layers, respectively. Given the three soil layers in this study, three ΔEC values were computed: ΔEC between layers of 0–15 cm and 15–30 cm, 15–30 cm and 30–45 cm, and 0–15 cm and 30–45 cm. ΔSOC, ΔTN, and ΔC/N were calculated in the same way.
2.3. Statistical Analysis
Statistical analyses were carried out using SPSS version 27.0.1 and R software (version 4.6.1). The coefficient of variation (CV) was classified according to the criteria of Nielsen et al. [37]: CV ≤ 10% indicates low variability, 10–100% indicates moderate variability, and ≥ 100% indicates high variability. Pearson correlation coefficients were calculated to determine the correlations among soil variables. To compare soil physicochemical properties among the three depth intervals (0–15, 15–30, and 30–45 cm), one-way analysis of variance (ANOVA) was performed, followed by Tukey’s honestly significant difference (HSD) test at the 0.05 significance level. Spatial interpolations of EC and nutrient contents were performed using Empirical Bayesian Kriging (EBK) within ArcGIS Pro (version 3.0.2) (WGS 1984 geographic coordinate system; no data transformation; power semivariogram model). The cross-validation statistics for the EBK procedure are provided in Table S1.
3. Results
3.1. Spatial Distribution of SOC, TN, and C/N Ratio
3.1.1. Descriptive Statistics
Descriptive statistics for EC, pH, SOC, TN, and the C/N ratio across the three soil layers are summarized in Table 1. EC has CV values exceeding 100% in all layers, indicating spatial heterogeneity and increasing with depth from 112.83% in the 0–15 cm layer to 130.80% in the 30–45 cm layer. Mean EC values decreased slightly with depth, from 454 ± 513 μS cm−1 in the 0–15 cm layer to 364 ± 476 μS cm−1 at 30–45 cm. In contrast, soil pH exhibited very low variability (CV = 3.51–4.32%) and increased slightly with depth, ranging from 8.19 ± 0.29 to 8.38 ± 0.36.
Table 1.
Statistical summary of soil salinity and nutrients in the study region.
SOC and TN displayed moderate to high variability, and both declined significantly with increasing soil depth (p < 0.05). SOC decreased from 7.96 ± 2.93 g kg−1 in the 0–15 cm layer to 3.21 ± 2.04 g kg−1 at 30–45 cm, while TN decreased from 0.82 ± 0.29 g kg−1 to 0.34 ± 0.22 g kg−1. Their spatial variability also increased with depth, as indicated by the rising CV values. In contrast, the soil C/N ratio remained relatively stable across the soil profile, with moderate variability (CV = 12.49–13.54%) and mean values ranging from 9.61 to 9.89. One-way ANOVA indicated significant differences in SOC and TN among soil layers (p < 0.05), whereas the C/N ratio did not differ significantly with depth.
3.1.2. Horizontal Spatial Patterns
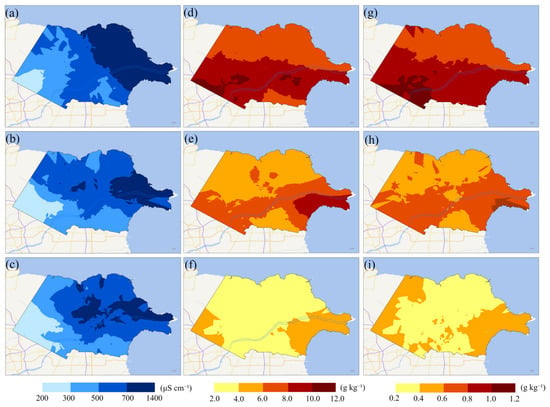
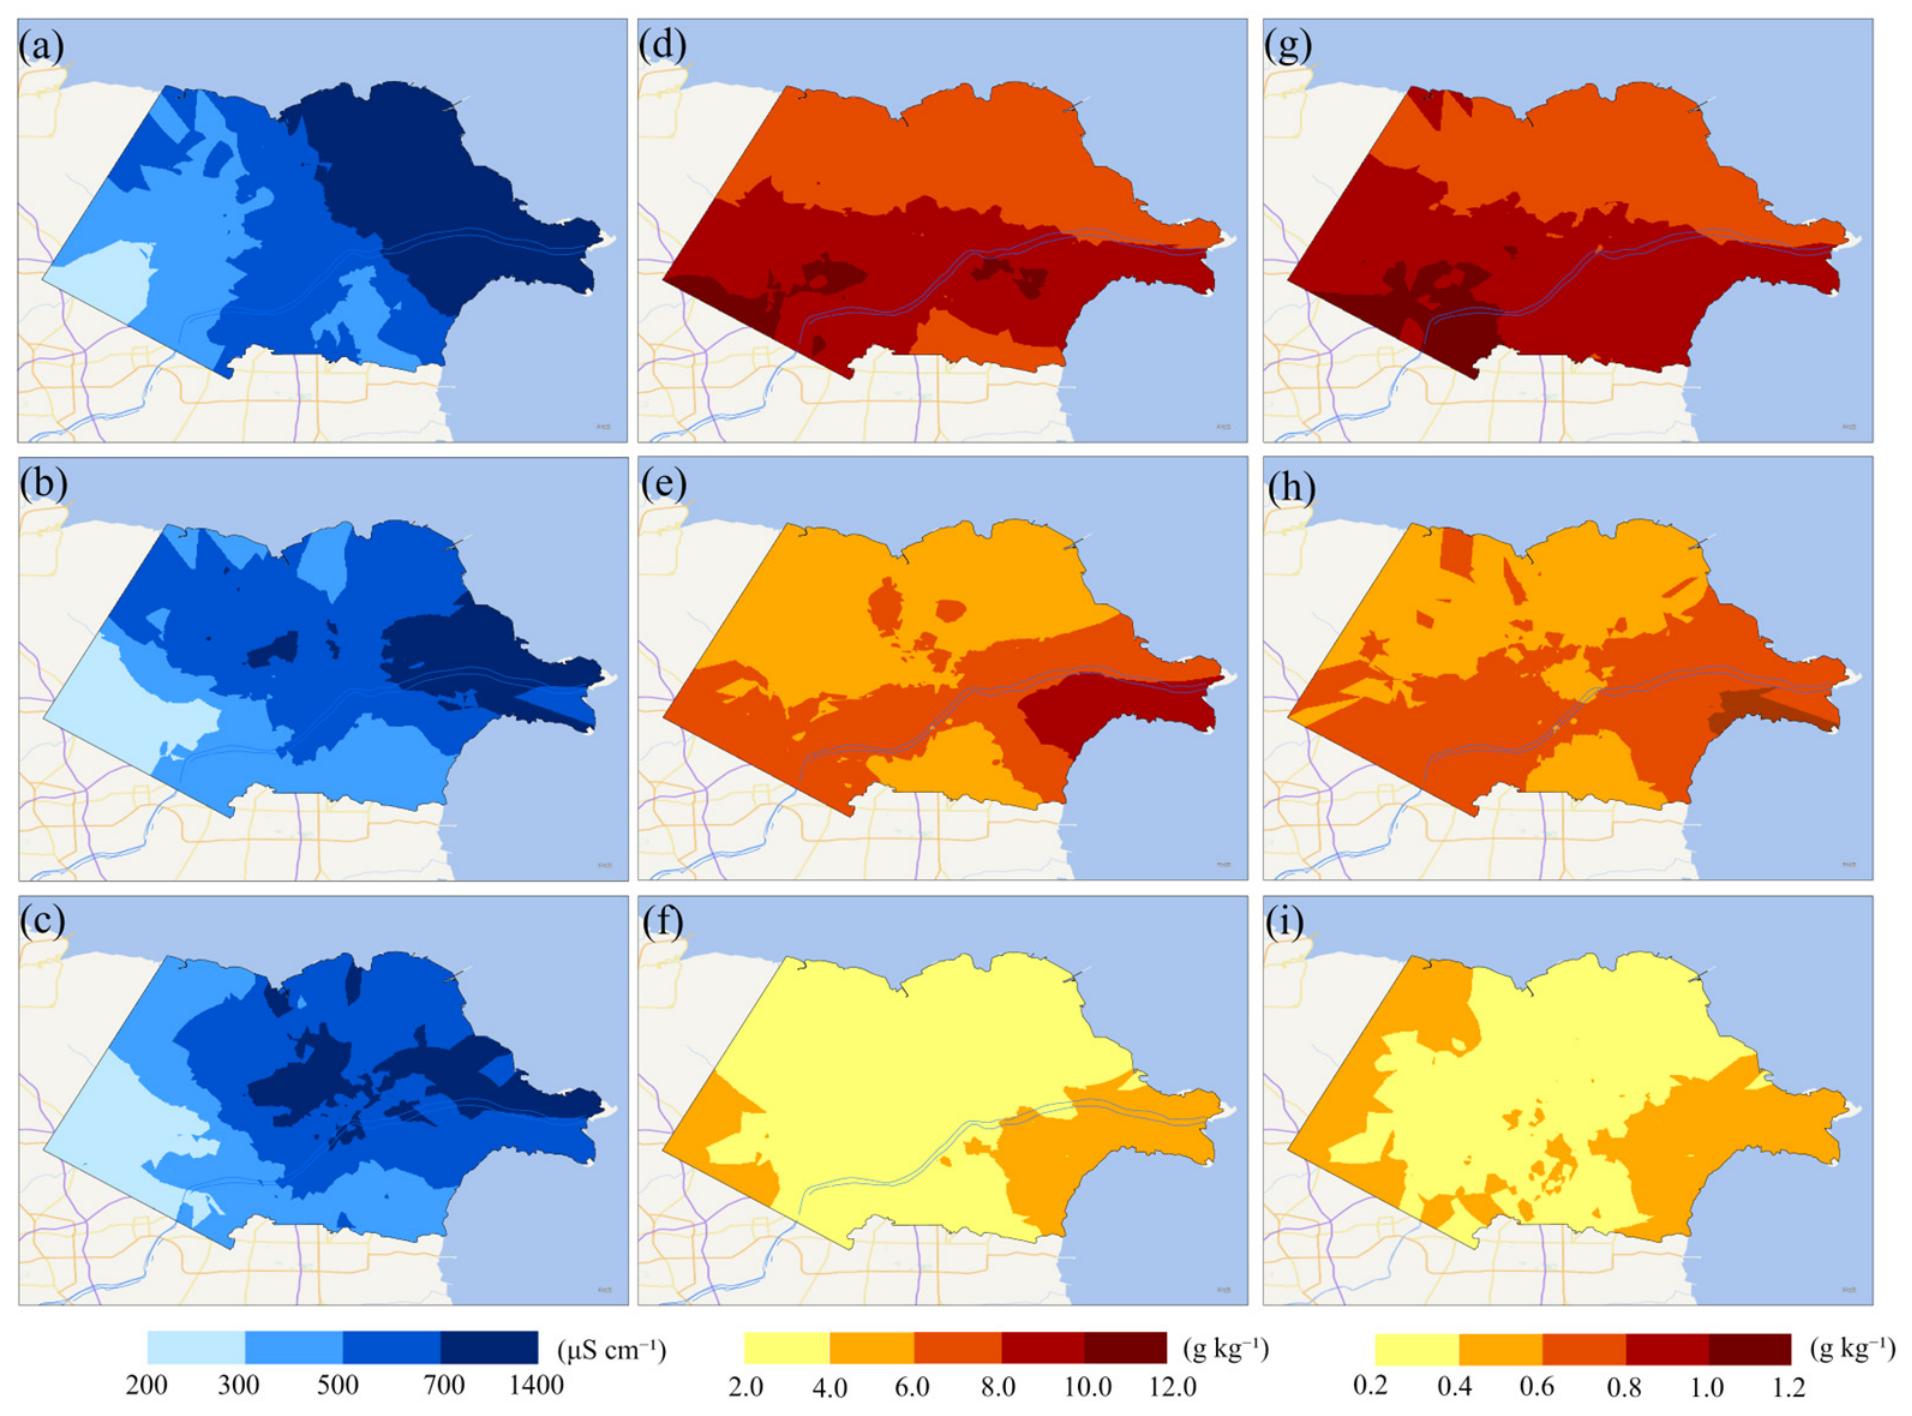
The spatial distributions of EC, SOC, and TN across the three soil layers are shown in Figure 2. EC exhibited a clear west–east gradient in the 0–15 cm layer, with lower values in the western region (200–300 μS cm−1) and markedly higher values in the eastern coastal areas (700–1400 μS cm−1). In deeper layers (15–30 cm and 30–45 cm), high EC values were primarily concentrated along both banks of the Yellow River and in coastal areas, indicating stronger salt accumulation in these regions.
Figure 2.
Spatial distributions of soil EC (a–c), SOC (d–f), and TN (g–i) across different depths. Panels (a,d,g), (b,e,h), and (c,f,i) represent soil depths of 0–15, 15–30, and 30–45 cm, respectively.
SOC and TN displayed similar spatial patterns across the study area. In the 0–15 cm layer, higher nutrient concentrations were mainly distributed along both banks of the Yellow River, with values gradually decreasing from west to east. Western regions generally exhibited SOC values of 10–12 g kg−1 and TN values of 1.00–1.20 g kg−1, whereas eastern areas showed lower concentrations. In the 15–30 cm layer, high SOC and TN contents remained concentrated along the Yellow River corridor and near the estuary. In the 30–45 cm layer, nutrient contents decreased overall but relatively higher values were still observed in the western region and around the estuary.
Spatially, the distribution of SOC closely mirrored that of TN across all layers, indicating a strong coupling between SOC and TN in the region. In contrast, the spatial distribution of the C/N ratio showed relatively weak variability. Although some regional differences were observed, particularly near the estuary and coastal areas, the C/N ratio across the entire study area remained within a relatively narrow range of 8.5–12.5 for all soil layers (Figure S2).
3.1.3. Vertical Variation
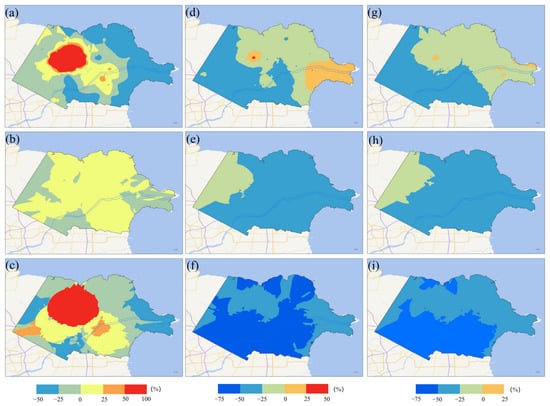
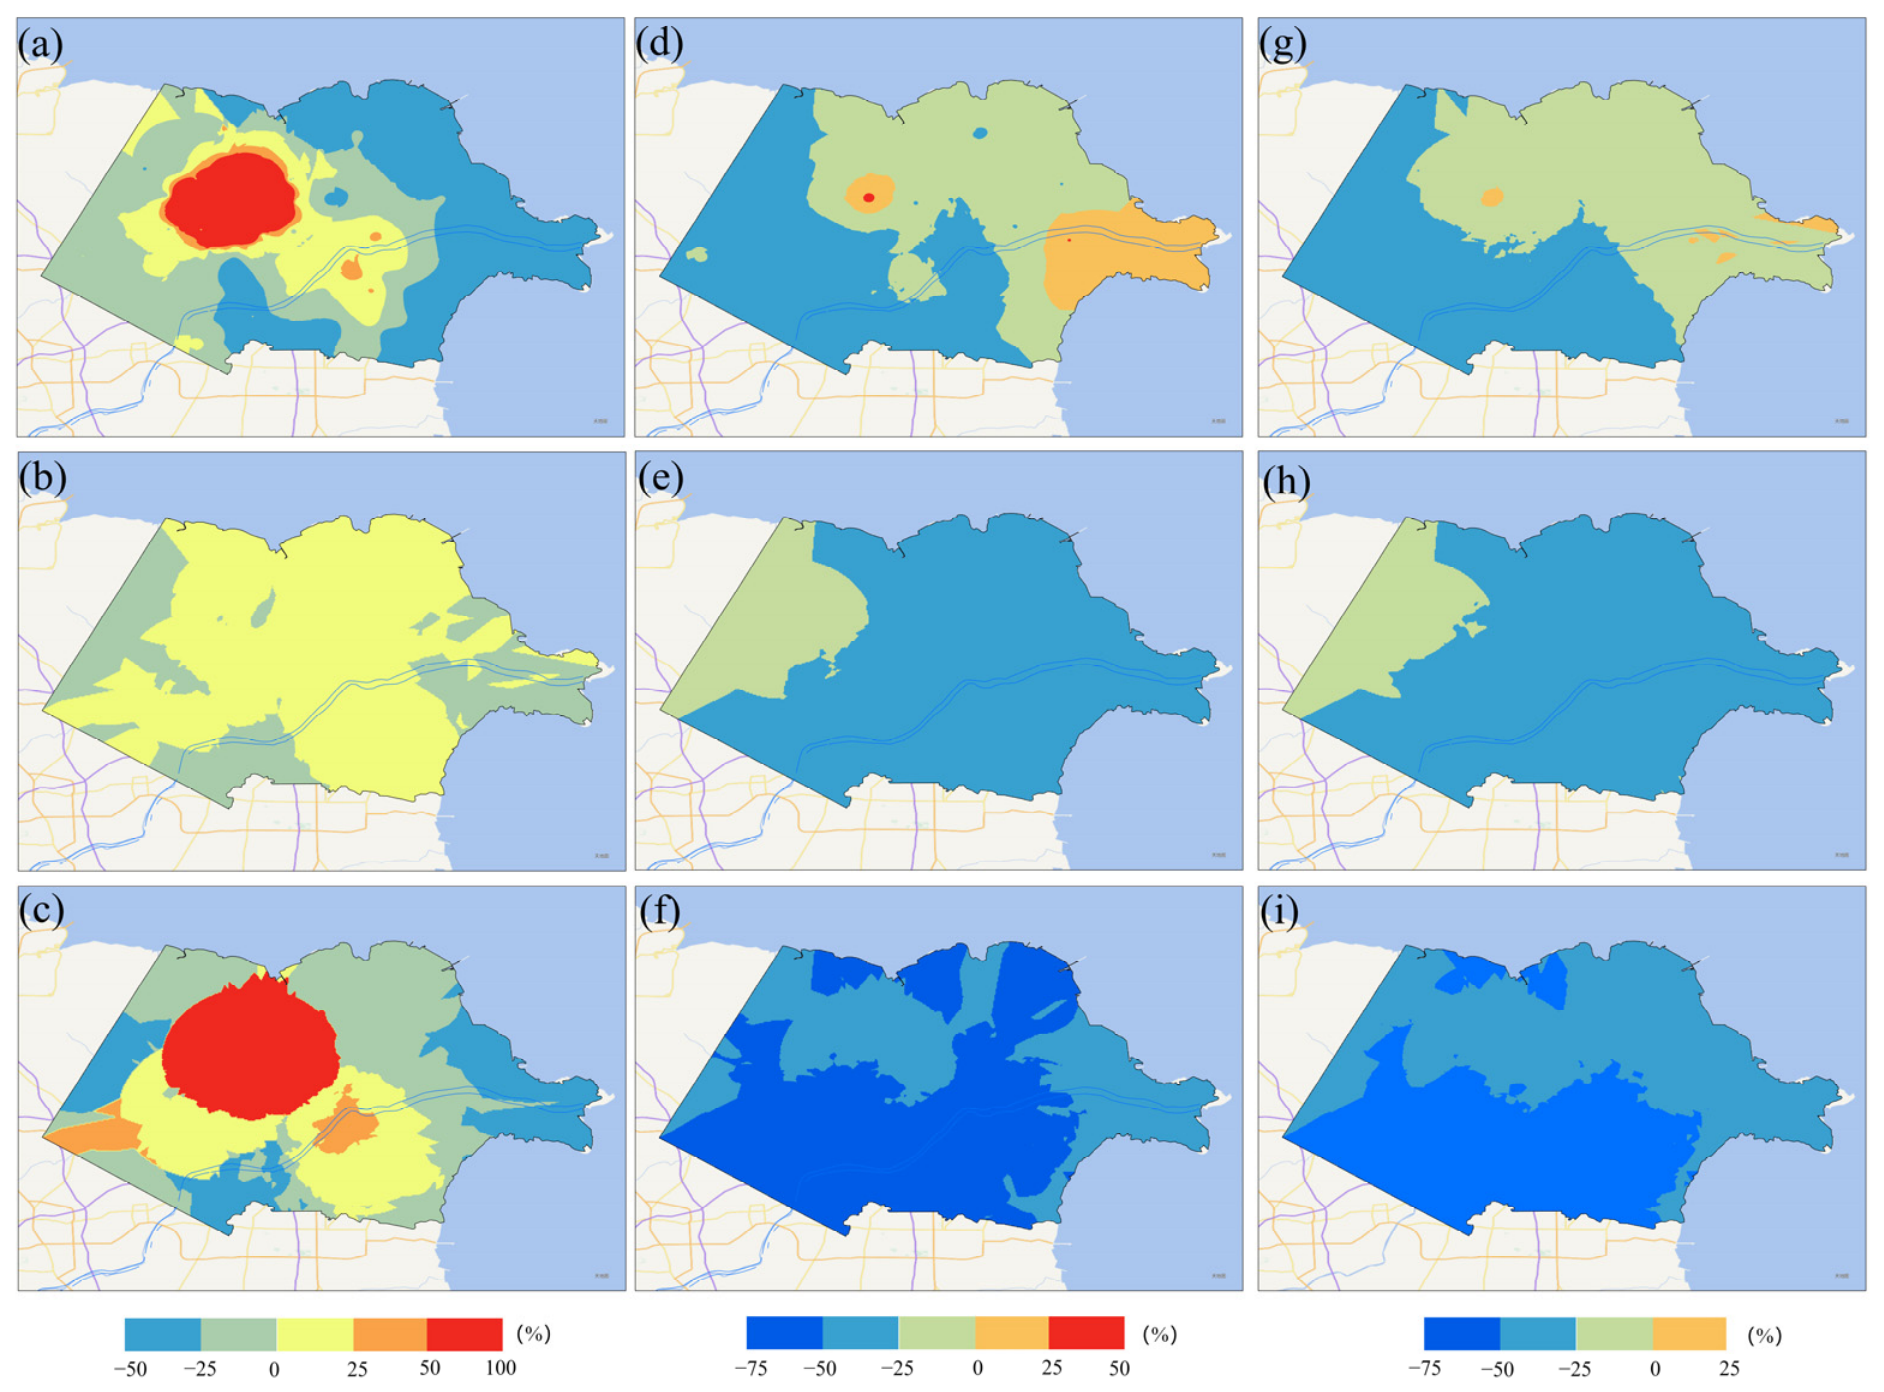
The spatial patterns of vertical variation in EC, SOC, and TN were presented in Figure 3. EC exhibited clear depth-related changes, particularly in coastal regions. Pronounced vertical differences between the 0–15 cm and 15–30 cm layers were mainly observed near the Yellow River estuary, whereas inland areas showed relatively small changes with depth. It is worth noting that in the central part of the study area, the salinity in the 15–30 cm layer was even higher than that in the 0–15 cm layer. In most regions, EC in the 30–45 cm layer exceeded that in the 15–30 cm layer, indicating salt accumulation in deeper soil layers.
Figure 3.
Vertical variation in EC (a–c), SOC (d–f), and TN (g–i) across different soil layers. Panels (a,d,g), (b,e,h), and (c,f,i) represent soil layers between 0–15 cm and 15–30 cm, 15–30 cm and 30–45 cm, and 0–15 cm and 30–45 cm, respectively.
Although descriptive statistics indicated an overall decrease in SOC and TN with depth, their vertical variation spatial patterns varied regionally. The difference in SOC between the 15–30 cm layer and the 0–15 cm layer decreased from west to east. In the western region, the SOC content in the 15–30 cm layer was 25% to 50% lower than that in the 0–15 cm layer, whereas in the eastern and coastal areas, the difference in SOC content between the two layers became smaller. In some localized areas near the estuary, the SOC content in the 15–30 cm layer even exceeded that in the 0–15 cm layer. For the 30–45 cm layer, SOC content was consistently lower than that in the overlying layers across most of the study area. However, the difference in SOC between the 30–45 cm layer and the 0–15 cm layer gradually decreased from west to east, indicating weaker vertical variation in coastal regions. The vertical variation distribution patterns of TN were largely consistent with those of SOC.
Compared with SOC and TN, the C/N ratio showed relatively minor vertical variation (Figure S2). Although localized increases or decreases were observed in some regions, the overall differences among soil layers were small.
3.2. Correlation Analysis of SOC, TN, and C/N Ratio
3.2.1. Factors Controlling Horizontal Spatial Patterns
Correlation analysis between soil nutrients and physicochemical properties is presented in Table 2. SOC and TN were strongly and positively correlated with each other across all soil layers (p < 0.01), indicating close coupling between SOC and TN. In the 0–15 cm layer, neither SOC nor TN showed significant correlations with the C/N ratio, whereas in deeper layers (15–30 cm and 30–45 cm) SOC and TN exhibited positive relationships with C/N.
Table 2.
Pearson correlation coefficients of soil SOC, TN, and C/N ratios across soil layers in the study region.
SOC and TN showed significant positive correlations with TP, AK, and AP across most soil layers. MC was also positively correlated with SOC and TN, with particularly strong relationships in the 0–15 cm layer. By contrast, EC was negatively correlated with SOC and TN only in the 0–15 cm layer; in deeper layers, the correlations were positive but not significant. Unlike EC, pH exhibited a positive correlation with SOC and TN in the 0–15 cm layer, whereas negative correlations were observed in deeper layers.
The influence of soil texture became more pronounced with increasing depth. In the 0–15 cm layer, soil texture showed no significant relationships with SOC or TN. However, in deeper layers (15–30 cm and 30–45 cm), clay content was strongly positively correlated with SOC and TN, while sand content showed significant negative correlations. These results suggest that finer soil textures may favor the accumulation of SOC and TN in deeper soil layers.
3.2.2. Factors Influencing Vertical Variation
The relationships between vertical variation in soil nutrients and other physicochemical factors are summarized in Table 3. Across all depth intervals, changes in SOC and TN were highly positively correlated with each other (p < 0.01), indicating consistent vertical responses of SOC and TN.
Table 3.
Pearson correlation coefficients of ΔSOC, ΔTN, and ΔC/N ratios across soil layers in the study region.
Vertical variation in SOC and TN was also significantly associated with changes in TP, AK, AP, EC, and clay content (p < 0.01). In contrast, vertical variation in pH was negatively correlated with SOC and TN, with the strength of this relationship increasing with depth. For the C/N ratio, significant correlations with environmental factors were relatively limited, with a positive relationship with clay content observed only in the 15–30 cm vs. 0–15 cm interval.
3.3. Effects of Formation Period and Land Use Type
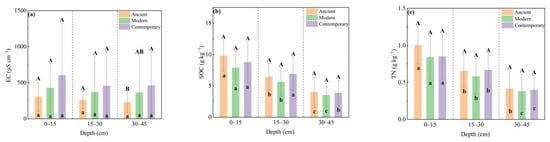
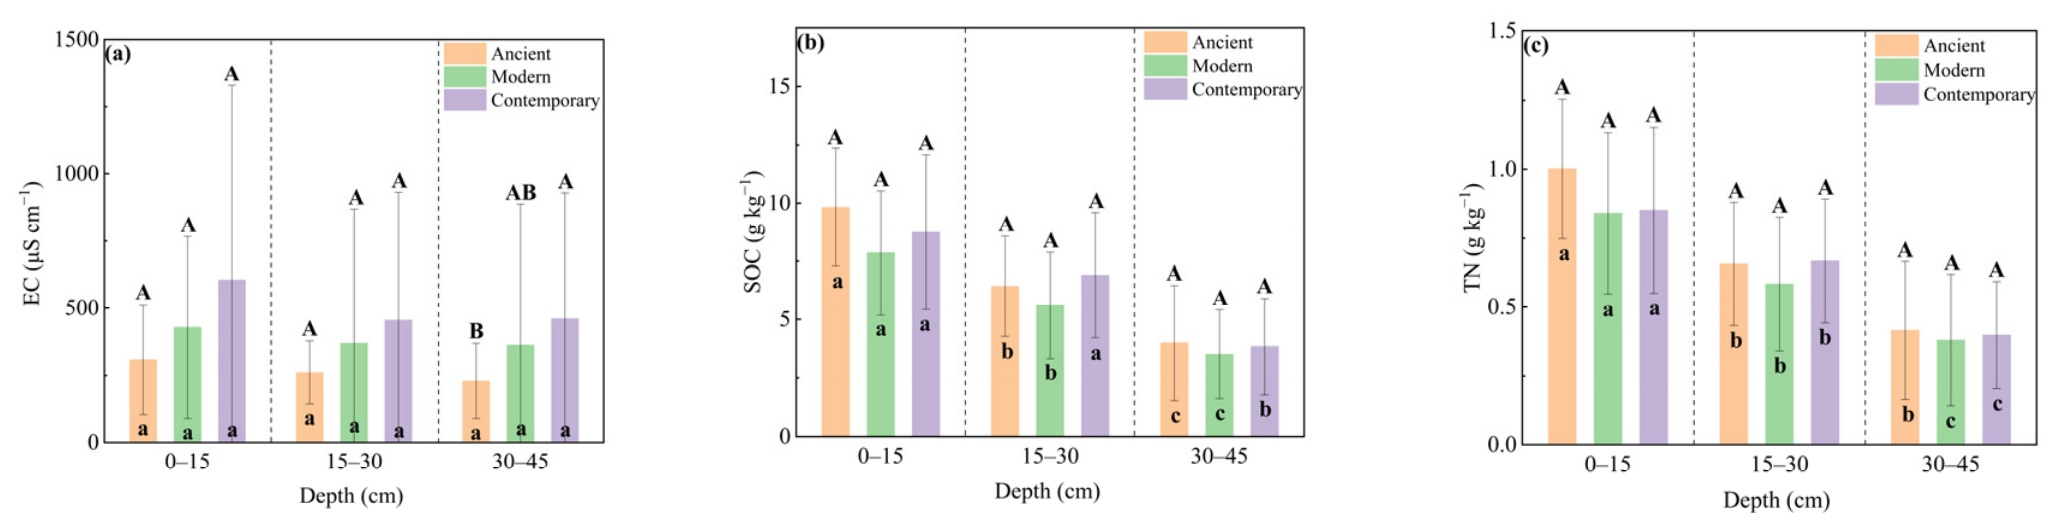
Across the three formation periods (ancient, modern, and contemporary), Figure 4a shows that EC consistently followed the order contemporary > modern > ancient, with significant differences between contemporary and both modern and ancient periods (p < 0.05), but these significant differences were observed only in the 0–15 cm layer. Within each period, EC decreased gradually with increasing soil depth. Figure 4b indicates that SOC did not differ significantly among periods within any soil layer; however, for all periods, SOC decreased significantly with depth (p < 0.05). Figure 4c reveals that TN did not differ significantly among periods within any soil layer, but within each period TN decreased significantly with depth (p < 0.05). Figure S3a demonstrates that the C/N ratio exhibited no significant differences either across periods within the same soil layer or across soil layers within the same period.
Figure 4.
Variations in EC, SOC, and TN across different formation periods and soil depths. (a) Variations in EC among different soil layers during different formation periods; (b) Variations in SOC among different soil layers during different formation periods; (c) Variations in TN among different soil layers during different formation periods. Uppercase letters (A, B) denote variations across different formation periods within the same soil layer, whereas lowercase letters (a, b, c) denote variations across different soil layers within the same formation period. Ancient (12 sites), Modern (39 sites), and Contemporary (25 sites).
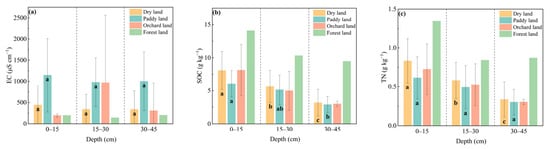
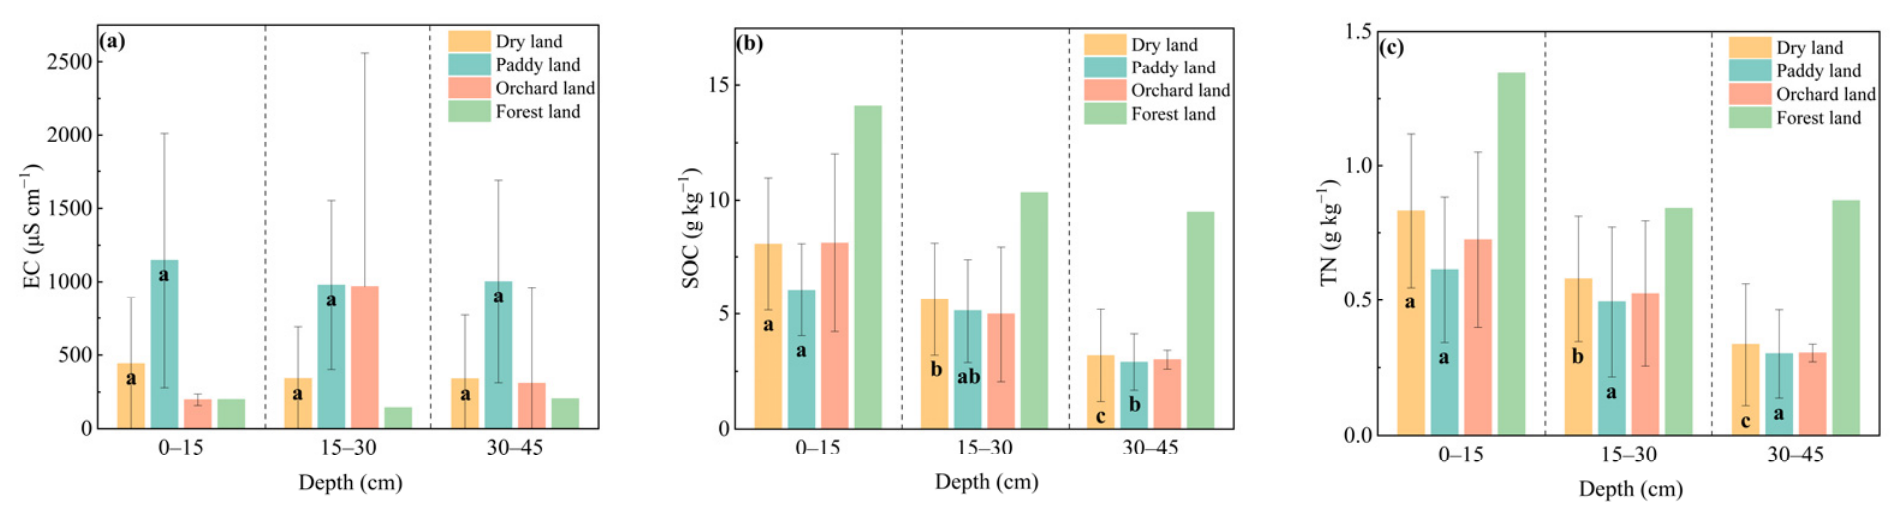
Land use types influenced soil EC (Figure 5a). Paddy land exhibited the highest EC across all soil layers, whereas forest land consistently exhibited the lowest. (Note: Because forest land was limited to a single sampling site (n = 1), all observations for this category throughout this study are considered preliminary and preclude robust statistical comparisons.) Drylands maintained moderate and stable EC levels, while orchards displayed an anomalous EC peak in the 15–30 cm layer. Notably, while EC varied significantly among land use types, differences across depths within each specific land use were not significant.
Figure 5.
Variations in EC, SOC, and TN across different land use types and soil depths. (a) Variations in EC across different soil layers under different land use types; (b) Variations in SOC across different soil layers under different land use types; (c) Variations in TN across different soil layers under different land use types. Lowercase letters (a, b, c) denote variations across different soil layers within the same land use type. Dry land (68 sites), paddy land (5 sites), orchard land (2 sites), and forest land (1 site). Owing to the large sample size imbalances across land use types, ANOVA was not conducted.
Regarding soil nutrients, forest land recorded the highest SOC across all layers (Figure 5b). Dryland SOC decreased significantly with depth; paddy land and orchards had relatively low SOC with no significant differences between the 15–30 cm and 30–45 cm layers. Similarly, forest land showed the highest TN content with a slight decline with depth (Figure 5c). Dryland TN decreased significantly among all three layers; paddy land showed no significant depth differences, while orchard TN gradually decreased from the 0–15 cm layer. Finally, Figure S3b demonstrates that no significant differences in soil C/N ratio were found either across soil horizons within the same land use type or across land use types within the same soil horizon.
4. Discussion
4.1. Horizontal Distribution and Influencing Factors of Spatial Patterns
The higher SOC and TN concentrations observed along the Yellow River’s banks can be explained by the relationships shown in Table 2. In the surface layer (0–15 cm), nutrient contents were significantly negatively correlated with EC (p < 0.01) and positively correlated with MC (p < 0.01). Freshwater from the river tends to lower soil salinity and maintain higher moisture levels in adjacent areas, and these correlations imply that freshwater supply is a plausible factor contributing to elevated nutrient levels. Moreover, this pattern may result from a combination of natural processes, including upstream erosion and sediment transport, estuarine accumulation, and agricultural runoff. Specifically, erosion materials from upstream and downstream areas, including plant and animal residues, are transported by water flow to the estuary [38] and deposited under elevated salinity and altered hydrodynamic regimes caused by seawater intrusion [39], thereby providing a sustained external nutrient supply to the estuarine zone [25,38]. In addition to these natural processes, abundant water resources along both banks of the Yellow River support relatively intensive agricultural fertilization, which also significantly contributes to nutrient enrichment in the 0–15 cm layer [40].
The elevated SOC and TN in the western and eastern regions relative to the central area likely result from distinct processes. The western region corresponds to the older Yellow River Delta, long-term cultivation and soil amelioration may have historically enhanced nutrient retention. In the eastern estuarine zone, tidal deposition of macroalgae and marine organism debris, combined with seawater intrusion, could supply additional organic matter [41,42]; subsequent evaporation under high temperatures may concentrate salts to supersaturation, triggering surface salt crystallization [43], while elevated salinity might suppress microbial decomposition of residues [44], potentially favoring SOC preservation [22,45]. It should be noted that several potentially influential factors, including salt crystallization dynamics, microbial activity, and organic residue inputs, were not measured in the present study. Consequently, the interpretations offered here are preliminary and require further validation through specifically designed experiments.
4.2. Vertical Variation Distribution and Controlling Factors
The decline in SOC and TN with increasing soil depth is a widespread pattern across farmland in the Yellow River Delta [22,46,47,48]. Meanwhile, a study from Yancheng City in China also showed the similar trend [23]. Yu et al. (2016) [22] reported a continuous decline in SOC and TN contents in the 0–30 cm farmland soil layer between 1855 and 2016. However, our records reveal a distinct reversal of this trend. Specifically, the average SOC content in the 0–30 cm layer increased from 4.76 g kg−1 to 7.39 g kg−1, while TN content rose from 0.51 g kg−1 to 0.76 g kg−1, suggesting a possible recovery in nutrient levels over the past decades.
The west-to-east reduction in nutrient differences between the 0–15 cm and 15–30 cm layers may be closely linked to salinization processes. Figure 3a reveals a gradual decline in the vertical EC difference from inland to coastal sites. Consistent with this pattern, Table 3 shows a significant positive correlation between vertical differences in EC and those in nutrient content. As the EC contrast narrows westward to eastward, reaching as low as 50% to 25% near the estuary, the corresponding nutrient contrast also diminishes; when the EC difference is negative, the overall distinction between the two layers is further reduced. Moreover, earlier studies suggest that high salinity in coastal zones may influence organic matter by modulating the flocculation–dispersion behavior of soil particles. Concurrently, salt ion toxicity inhibits microbial activity and plant productivity, slowing organic matter decomposition and thereby weakening vertical nutrient variation between soil layers [49,50]. In contrast, the vertical variation in nutrient content in the 15–30 cm and 30–45 cm layers were significantly lower than that in the upper layer. Based on the trends in EC variation between layers shown in Table 1 and the positive correlation between EC and nutrient variation shown in Table 3, it can be concluded that the reduction in vertical EC variation largely explains the decrease in nutrient differences between these two soil layers.
The evaluated forest site consistently stored the highest SOC and TN among the evaluated land uses. This occurs because continuous organic inputs from litter fall and root turnover are protected from rapid decomposition by a thick litter layer and minimal anthropogenic disturbance. However, this nutrient pool is sensitive to land-use conversion; for example, forest clearing can reduce surface (0–10 cm) carbon stocks by up to 63%, and native forests store 26.4% to 84.4% more SOC and 27.1% to 82.4% more TN than bare soils, croplands, and plantations [51,52]. Among the remaining land uses, dryland SOC and TN in the 0–15 cm layer exceed those in paddy land. This disparity arises because drylands receive substantial organic matter inputs from straw incorporation, whereas paddy lands experience salinity levels far exceed the critical threshold (3.95 g kg−1) that triggering SOC decline [53,54]. While these underlying mechanisms align with established ecological principles, the reliance on a single forest plot implies that these peak nutrient levels should be treated as a site-specific observation pending broader regional verification.
Soil C/N ratios in the study area ranged narrowly from 8 to 12 across all layers, reflecting low spatial variability and a stable local equilibrium between SOC and TN. While broader studies have documented marked spatial and vertical heterogeneity, including latitudinal gradients [55], depth-dependent fluctuations driven by surface accumulation and downward migration [17], and significant land use effects [56], the constrained range observed here indicates that carbon and nitrogen pools maintain a relatively stable spatial balance at the local landscape scale.
4.3. Limitations
Despite the valuable insights provided by this study regarding the spatial distribution of soil nutrients and their controlling factors in the Yellow River Delta, several limitations should be acknowledged. First, the data were collected from a single sampling campaign and therefore do not capture seasonal or interannual variability. Future work should include repeated sampling across multiple seasons and years to assess the temporal stability of the observed patterns. Second, sample sizes were highly unbalanced across land-use types (e.g., farmland n = 68, forested land n = 1), which reduces the statistical power and reliability of cross-group comparisons. Third, spatial autocorrelation among sampling points may exist, as neighboring samples are likely to be more similar than distant ones. Although the linear mixed-effects model partially accounts for this by treating sites as random effects, residual spatial dependence may not have been fully addressed. Fourth, spatial interpolation in areas with low sampling density is subject to considerable uncertainty, and the resulting spatial patterns should be interpreted with caution. Finally, we lacked detailed information on site-specific management history (e.g., fertilization records, cultivation duration, and irrigation practices), making it difficult to disentangle the effects of land use from those of management intensity. Collectively, these constraints limit the strength of causal inference. Future research should address these issues through multi-season and multi-year sampling, more balanced experimental designs, collection of management records, and explicit modeling of spatial structure.
5. Conclusions
This study conducted a comprehensive assessment of the horizontal and vertical variation distribution of soil salinity and nutrients in the Yellow River Delta. Salinity does not simply inhibit nutrient accumulation; rather, it interacts with soil moisture to shape the surface enrichment and deep layer migration of nutrients, resulting in contrasting spatial distribution patterns between the western and eastern parts of the delta. This finding suggests that soil fertility management in the region should account for the east–west contrast: in western agricultural areas, priority should be given to maintaining surface organic matter to prevent carbon and nitrogen losses under progressive salinization; in eastern coastal wetlands, more attention should be paid to the availability of nutrients in deeper layers to mitigate environmental risks from leaching. Future research should incorporate dynamic water salt transport models to further explore how seasonal salinity fluctuations affect nutrient turnover, thereby offering more practical guidance for the ecological restoration of saline–alkali lands.
Supplementary Materials
The following supporting information can be downloaded at: https://www.mdpi.com/article/10.3390/agriculture16171844/s1, Figure S1: Soil texture distribution of sampling sites (N = 76) across three depth intervals. Figure S2: Spatial distribution and vertical gradients of soil C/N ratios. Panels (a–c) illustrates the horizontal distribution of C/N ratios at 0–15, 15–30, and 30–45 cm depths, respectively. Panels (d–f) shows the vertical variations (C/N) between the 0–15/15–30 cm, 15–30/30–45 cm, and 0–15/30–45 cm layers. Figure S3: Differences in C/N ratios across different formation periods (a) and land use types (b). Uppercase letters denote variations across different formation periods within the same soil layer, whereas lowercase letters denote variations across different soil layers within the same formation period. Table S1: Results of Cross-Validation for Empirical Bayesian Kriging Interpolation.
Author Contributions
Conceptualization, Y.L. and L.R.; methodology, Y.L.; software, Y.L.; validation, Y.L.; formal analysis, Y.L.; investigation, Y.L. and Y.D.; resources, L.R.; data curation, Y.L.; writing—original draft preparation, Y.L.; writing—review and editing, L.R., S.Z., Y.D. and L.L.; visualization, Y.L.; supervision, L.R. and S.Z.; project administration, L.R.; funding acquisition, L.R. and S.Z. All authors have read and agreed to the published version of the manuscript.
Funding
This study was supported by the National Natural Science Foundation of China (42377308, 42320104006), the Shandong Provincial Natural Science Foundation (ZR2025MS605), and the Inner Mongolia Natural Science Foundation Project (2024LHMS04010). The APC was funded by the Shandong Provincial Natural Science Foundation (ZR2025MS605). Author Lin Lin is a Chargée de recherches (CR)/Postdoctoral Researcher of the Fonds de la Recherche Scientifique-FNRS.
Data Availability Statement
The raw data supporting the conclusions of this article will be made available by the authors on request.
Acknowledgments
We would like to thank Yilong Qiao and Yantao Yang for their assistance with field sampling. I am also deeply grateful to my family for their constant encouragement and understanding.
Conflicts of Interest
The authors declare no conflicts of interest.
Abbreviations
The following abbreviations are used in this manuscript:
| SOC | Soil organic carbon |
| TN | Soil total nitrogen |
| TP | Soil total phosphorus |
| AK | Soil available potassium |
| AP | Soil available phosphorus |
| MC | Soil moisture content |
| EC | Electrical conductivity |
| BD | Soil bulk density |
References
- Song, C.; Ren, H.; Huang, C. Estimating Soil Salinity in the Yellow River Delta, Eastern China—An Integrated Approach Using Spectral and Terrain Indices with the Generalized Additive Model. Pedosphere 2016, 26, 626–635. [Google Scholar] [CrossRef] [Scilit]
- Gan, Y.; Huang, X.; Li, S.; Liu, N.; Li, Y.C.; Freidenreich, A.; Wang, W.; Wang, R.; Dai, J. Source quantification and potential risk of mercury, cadmium, arsenic, lead, and chromium in farmland soils of Yellow River Delta. J. Clean. Prod. 2019, 221, 98–107. [Google Scholar] [CrossRef] [Scilit]
- Li, D.; Ning, Z.; Oost, K.V.; Daniel, W.; Li, Y.N.; Cui, B.; Doetterl, S. Low organic carbon storage of sediment due to frequent river course changes in Yellow River Delta. Catena 2025, 260, 109427. [Google Scholar] [CrossRef] [Scilit]
- Chi, Y.; Sun, J.; Liu, W.; Wang, J.; Zhao, M. Mapping coastal wetland soil salinity in different seasons using an improved comprehensive land surface factor system. Ecol. Indic. 2019, 107, 105517. [Google Scholar] [CrossRef] [Scilit]
- Hu, Q.; Zhao, Y.; Hu, X.; Qi, J.; Suo, L.; Pan, Y.; Song, B.; Chen, X. Effect of saline land reclamation by constructing the “Raised Field-Shallow Trench” pattern on agroecosystems in Yellow River Delta. Agric. Water Manag. 2022, 261, 107345. [Google Scholar] [CrossRef] [Scilit]
- Tran, D.Q.; Le, K.N.; Durand-Morat, A.; Nguyen, N.N.T.; Bairagi, S.K.; Huynh, M.V.T.; Tran, T.V. Is it worth it? Land-fallowing and saltwater intrusion control under uncertainty. Sci. Total Environ. 2025, 966, 178711. [Google Scholar] [CrossRef] [Scilit] [PubMed]
- Yin, C.-Y.; Zhao, J.; Chen, X.-B.; Li, L.-J.; Liu, H.; Hu, Q.-L. Desalination characteristics and efficiency of high saline soil leached by brackish water and Yellow River water. Agric. Water Manag. 2022, 263, 107461. [Google Scholar] [CrossRef] [Scilit]
- Sun, Y.; Shi, J.; Liu, X.; Zhao, L.; Yang, G.; Tao, Q.; Zhong, S.; Zhang, Q.; Miao, F. Strategic inter-cropping for saline agriculture: Quantifying the impact of Medicago sativa–Festuca arundinacea ratios on soil properties and crop performance. Front. Plant Sci. 2025, 16, 1737387. [Google Scholar] [CrossRef] [Scilit] [PubMed]
- Daliakopoulos, I.N.; Tsanis, I.K.; Koutroulis, A.; Kourgialas, N.N.; Varouchakis, A.E.; Karatzas, G.P.; Ritsema, C.J. The threat of soil salinity: A European scale review. Sci. Total Environ. 2016, 573, 727–739. [Google Scholar] [CrossRef] [Scilit] [PubMed]
- Liu, D.; Gong, H.; Li, J.; Liu, Z.; Wang, L.; Ouyang, Z.; Xu, L.; Wang, T. Continuous crop rotation increases soil organic carbon stocks in river deltas: A 40-year field evidence. Sci. Total Environ. 2024, 906, 167749. [Google Scholar] [CrossRef] [Scilit] [PubMed]
- Etesami, H.; Glick, B.R. Halotolerant plant growth–promoting bacteria: Prospects for alleviating salinity stress in plants. Environ. Exp. Bot. 2020, 178, 104124. [Google Scholar] [CrossRef] [Scilit]
- Zhao, X.; Sun, J.; Liu, C.; Zhang, E.; Zhao, G.; Chen, Q. Mechanisms of plant-derived and microbial residue carbon in coastal wetland soils in response to salinity gradients. Catena 2025, 256, 109108. [Google Scholar] [CrossRef] [Scilit]
- Bhardwaj, A.K.; Mishra, V.K.; Singh, A.K.; Arora, S.; Srivastava, S.; Singh, Y.P.; Sharma, D.K. Soil salinity and land use-land cover interactions with soil carbon in a salt-affected irrigation canal command of Indo-Gangetic plain. Catena 2019, 180, 392–400. [Google Scholar] [CrossRef] [Scilit]
- Hassani, A.; Smith, P.; Shokri, N. Negative correlation between soil salinity and soil organic carbon variability. Proc. Natl. Acad. Sci. USA 2024, 121, e2317332121. [Google Scholar] [CrossRef] [Scilit] [PubMed]
- Yang, C.; Chen, Y.; Sun, W.; Zhang, Q.; Diao, M.; Sun, J. Extreme soil salinity reduces N and P metabolism and related microbial network complexity and community immigration rate. Environ. Res. 2025, 264, 120361. [Google Scholar] [CrossRef] [Scilit] [PubMed]
- Corral-Fernández, R.; Parras-Alcántara, L.; Lozano-García, B. Stratification ratio of soil organic C, N and C:N in Mediterranean evergreen oak woodland with conventional and organic tillage. Agric. Ecosyst. Environ. 2013, 164, 252–259. [Google Scholar] [CrossRef] [Scilit]
- Guan, Y.; Bai, J.; Wang, J.; Wang, W.; Wang, X.; Zhang, L.; Li, X.; Liu, X. Effects of groundwater tables and salinity levels on soil organic carbon and total nitrogen accumulation in coastal wetlands with different plant cover types in a Chinese estuary. Ecol. Indic. 2021, 121, 106969. [Google Scholar] [CrossRef] [Scilit]
- Xu, Y.; Wang, X.; Bai, J.; Wang, D.; Wang, W.; Guan, Y. Estimating the spatial distribution of soil total nitrogen and available potassium in coastal wetland soils in the Yellow River Delta by incorporating multi-source data. Ecol. Indic. 2020, 111, 106002. [Google Scholar] [CrossRef] [Scilit]
- Wang, Y.; Sun, Y.; Wang, Q.; Fu, P.; Liu, Y.; Wang, F.; Meng, F. Exploring the spatial heterogeneity of soil organic carbon and the influence of coastal factors: A case study in the Yellow River Delta, China. Sci. Total Environ. 2025, 959, 178234. [Google Scholar] [CrossRef] [Scilit] [PubMed]
- Dai, P.; Yang, L.; Wang, Z.; Dai, J.; Li, J. Spatial distribution of soil organic carbon and its drivers in the Shandong section of the yellow river basin, China. J. Soils Sediments 2025, 25, 2153–2166. [Google Scholar] [CrossRef] [Scilit]
- Wang, J.; Bai, J.; Zhao, Q.; Lu, Q.; Xia, Z. Five-year changes in soil organic carbon and total nitrogen in coastal wetlands affected by flow-sediment regulation in a Chinese delta. Sci. Rep. 2016, 6, 21137. [Google Scholar] [CrossRef] [Scilit] [PubMed]
- Yu, J.; Zhan, C.; Li, Y.; Zhou, D.; Fu, Y.; Chu, X.; Xing, Q.; Han, G.; Wang, G.; Guan, B. Distribution of carbon, nitrogen and phosphorus in coastal wetland soil related land use in the Modern Yellow River Delta. Sci. Rep. 2016, 6, 37940. [Google Scholar] [CrossRef] [Scilit] [PubMed]
- Sun, Q.; Chen, C.; Yao, Y.; Wu, H.; Zhang, M.; Jin, L.; Zhou, H.; Meng, T.; Peng, H. Soil Properties of Reclaimed Coastal Saline–Alkali Farmland in a Chinese Province: Spatial Variability and Soil Profiles. Agriculture 2026, 16, 638. [Google Scholar] [CrossRef] [Scilit]
- Xu, G.; Song, J.; Zhang, Y.; Lv, Y.; Han, G. Enhancement of phosphorus storage capacity of sediments by coastal wetland restoration, Yellow River Delta, China. Mar. Pollut. Bull. 2020, 150, 110666. [Google Scholar] [CrossRef] [Scilit] [PubMed]
- Guo, B.; Liu, Y.; Fan, J.; Lu, M.; Zang, W.; Liu, C.; Wang, B.; Huang, X.; Lai, J.; Wu, H. The salinization process and its response to the combined processes of climate change–human activity in the Yellow River Delta between 1984 and 2022. Catena 2023, 231, 107301. [Google Scholar] [CrossRef] [Scilit]
- Dong, H.; Li, W.; Tang, W.; Zhang, D. Early plastic mulching increases stand establishment and lint yield of cotton in saline fields. Field Crops Res. 2009, 111, 269–275. [Google Scholar] [CrossRef] [Scilit]
- Song, C.; Song, J.; Wu, Q.; Shen, X.; Hu, Y.; Hu, C.; Li, W.; Wang, Z. Effects of applying river sediment with irrigation water on salinity leaching during wheat-maize rotation in the Yellow River Delta. Agric. Water Manag. 2023, 276, 108032. [Google Scholar] [CrossRef] [Scilit]
- Chen, Q.; Cao, X.; Li, Y.; Sun, Q.; Dai, L.; Li, J.; Guo, Z.; Zhang, L.; Ci, L. Functional carbon nanodots improve soil quality and tomato tolerance in saline-alkali soils. Sci. Total Environ. 2022, 830, 154817. [Google Scholar] [CrossRef] [Scilit] [PubMed]
- Fu, Z.; Wang, P.; Sun, J.; Lu, Z.; Yang, H.; Liu, J.; Xia, J.; Li, T. Composition, seasonal variation, and salinization characteristics of soil salinity in the Chenier Island of the Yellow River Delta. Glob. Ecol. Conserv. 2020, 24, e01318. [Google Scholar] [CrossRef] [Scilit]
- Ye, Q.H.; Chen, S.P.; Huang, C.; Chang, J.; Liu, Q.S. Evolution patterns of the modern and recent Yellow River delta and issues and suggestions for estuary management. In Proceedings of the 8th National Symposium on Coastal and Estuarine Sciences and the Meeting of the Coastal and Estuarine Sciences Council, Shanghai, China, 21–22 November 2024. [Google Scholar]
- Grossman, R.B.; Reinsch, T.G. 2.1 Bulk Density and Linear Extensibility. In Methods of Soil Analysis; American Society of Agronomy: Madison, WI, USA, 2002; pp. 201–228. [Google Scholar]
- Sparks, D.L.; Page, A.L.; Helmke, P.A.; Loeppert, R.H.; Soltanpour, P.N.; Tabatabai, M.A.; Johnston, C.T.; Sumner, M.E. Methods of Soil Analysis: Part 3—Chemical Methods; American Society of Agronomy: Madison, WI, USA, 1996. [Google Scholar]
- Bremner, J.; Tabatabai, M. Use of an ammonia electrode for determination of ammonium in Kjeldahl analysis of soils. Commun. Soil Sci. Plant Anal. 1972, 3, 159–165. [Google Scholar] [CrossRef] [Scilit]
- Murphy, J.; Riley, J.P. A modified single solution method for the determination of phosphate in natural waters. Anal. Chim. Acta 1962, 27, 31–36. [Google Scholar] [CrossRef] [Scilit]
- Bao, S.D. Soil and Agricultural Chemistry Analysis; China Agricultural Press: Beijing, China, 2000. [Google Scholar]
- Nadler, A.; Frenkel, H. Determination of Soil Solution Electrical Conductivity from Bulk Soil Electrical Conductivity Measurements by the Four-Electrode Method. Soil Sci. Soc. Am. J. 1980, 44, 1216–1221. [Google Scholar] [CrossRef] [Scilit]
- Nielsen, D.R.; Bouma, J. Soil Spatial Variability; Centre for Agricultural Publishing and Documentation: Wageningen, The Netherlands, 1985. [Google Scholar]
- Li, H.; Guan, Q.; Sun, Y.; Wang, Q.; Liang, L.; Ma, Y.; Du, Q. Spatiotemporal analysis of the quantitative attribution of soil water erosion in the upper reaches of the Yellow River Basin based on the RUSLE-TLSD model. Catena 2022, 212, 106081. [Google Scholar] [CrossRef] [Scilit]
- Wang, X.-C.; Yue, F.-J.; Li, S.-L.; Li, X.-Z.; Lang, Y.-C.; Hu, J.; Ding, H.; Liu, C.-Q. Spatial variations in water chemical components in a coastal zone of northern China: Insights from environmental isotopes. J. Hydrol. 2022, 612, 128054. [Google Scholar] [CrossRef] [Scilit]
- Liu, Y.; Guo, B.; Lu, M.; Zang, W.; Yu, T.; Chen, D. Quantitative distinction of the relative actions of climate change and human activities on vegetation evolution in the Yellow River Basin of China during 1981–2019. J. Arid Land 2023, 15, 91–108. [Google Scholar] [CrossRef] [Scilit]
- Ye, Y. Chapter 14—Sea Level Change, Sea Water Intrusion, and Coastal Land Subsidence. In Marine Geo-Hazards in China; Elsevier: Amsterdam, The Netherlands, 2017; pp. 587–656. [Google Scholar]
- Fadili, A.; Najib, S.; Mehdi, K.; Riss, J.; Malaurent, P.; Makan, A. Geoelectrical and hydrochemical study for the assessment of seawater intrusion evolution in coastal aquifers of Oualidia, Morocco. J. Appl. Geophys. 2017, 146, 178–187. [Google Scholar] [CrossRef] [Scilit]
- Zhou, F.; Yang, J.; Ju, W.; Zhou, Z.; Ma, Q. Study on the hydro-thermal-salt-mechanical coupling characteristics of sulfate saline soil under freeze-thaw cycles. Cold Reg. Sci. Technol. 2024, 226, 104289. [Google Scholar] [CrossRef] [Scilit]
- Haj-Amor, Z.; Araya, T.; Kim, D.-G.; Bouri, S.; Lee, J.; Ghiloufi, W.; Yang, Y.; Kang, H.; Jhariya, M.K.; Banerjee, A.; et al. Soil salinity and its associated effects on soil microorganisms, greenhouse gas emissions, crop yield, biodiversity and desertification: A review. Sci. Total Environ. 2022, 843, 156946. [Google Scholar] [CrossRef] [Scilit] [PubMed]
- Yu, J.; Dong, H.; Li, Y.; Wu, H.; Guan, B.; Gao, Y.; Zhou, D.; Wang, Y. Spatiotemporal Distribution Characteristics of Soil Organic Carbon in Newborn Coastal Wetlands of the Yellow River Delta Estuary. Clean–Soil Air Water 2013, 42, 311–318. [Google Scholar] [CrossRef] [Scilit]
- Meng, L.; Qu, F.; Bi, X.; Xia, J.; Li, Y.; Wang, X.; Yu, J. Elemental stoichiometry (C, N, P) of soil in the Yellow River Delta nature reserve: Understanding N and P status of soil in the coastal estuary. Sci. Total Environ. 2021, 751, 141737. [Google Scholar] [CrossRef] [Scilit] [PubMed]
- Tang, Z.; Wang, D.; Tian, X.; Bi, X.; Zhou, Z.; Luo, F.; Ning, R.; Li, J. Exploring the factors influencing the carbon sink function of coastal wetlands in the Yellow River Delta. Sci. Rep. 2024, 14, 28938. [Google Scholar] [CrossRef] [Scilit] [PubMed]
- Cao, Q.; Wang, X.; Chu, X.; Zhao, M.; Wang, L.; Song, W.; Li, P.; Zhang, X.; Xu, S.; Han, G. Effects of Vegetation Restoration Age on Soil C: N: P Stoichiometry in Yellow River Delta Coastal Wetland of China. Chin. Geogr. Sci. 2024, 34, 1045–1059. [Google Scholar] [CrossRef] [Scilit]
- Jia, W.; Chu, X.; Wang, X.; Li, P.; Lu, A.; Zhao, M.; Lu, F.; Huang, W.; Yu, D.; Song, W.; et al. Spatial distribution of soil organic carbon across diverse vegetation types in a tidal wetland. Mar. Pollut. Bull. 2024, 209, 117203. [Google Scholar] [CrossRef] [Scilit] [PubMed]
- Sun, Z.; Mou, X.; Sun, W. Potential effects of tidal flat variations on decomposition and nutrient dynamics of Phragmites australis, Suaeda salsa and Suaeda glauca litter in newly created marshes of the Yellow River estuary, China. Ecol. Eng. 2016, 93, 175–186. [Google Scholar] [CrossRef] [Scilit]
- Girmay, G.; Singh, B.R.; Mitiku, H.; Borresen, T.; Lal, R. Carbon stocks in Ethiopian soils in relation to land use and soil management. Land Degrad. Dev. 2008, 19, 351–367. [Google Scholar] [CrossRef] [Scilit]
- Tesfaye, M.A.; Bravo, F.; Ruiz-Peinado, R.; Pando, V.; Bravo-Oviedo, A. Impact of changes in land use, species and elevation on soil organic carbon and total nitrogen in Ethiopian Central Highlands. Geoderma 2016, 261, 70–79. [Google Scholar] [CrossRef] [Scilit]
- Zhou, R.; Chen, W.; Gunina, A.; Kumar, A.; Wang, M.; Kuzyakov, Y.; Tian, J. Carbon sequestration through straw amendment: Multi-pool dynamics within soil organic carbon. Geoderma 2025, 461, 117471. [Google Scholar] [CrossRef] [Scilit]
- Ma, D.; Ju, W.; Zhao, W.; He, Z.; Li, R.; Sun, W.; Yang, R.; Zhang, Y.; Chen, J. Salt effects on soil organic carbon in irrigated farmland in arid region. Geoderma 2025, 464, 117628. [Google Scholar] [CrossRef] [Scilit]
- Wu, X.; Cai, C.; Yuan, Z.; Li, D.; Zhou, J.; Huang, C. Contributions of climate and soil properties to geographic variations of soil organic matter across the East Asian monsoon region. Soil Tillage Res. 2023, 234, 105845. [Google Scholar] [CrossRef] [Scilit]
- Zhao, F.; Sun, J.; Ren, C.; Kang, D.; Deng, J.; Han, X.; Yang, G.; Feng, Y.; Ren, G. Land use change influences soil C, N and P stoichiometry under ‘Grain-to-Green Program’ in China. Sci. Rep. 2015, 5, 10195. [Google Scholar] [CrossRef] [Scilit] [PubMed]

Disclaimer/Publisher’s Note: The statements, opinions and data contained in all publications are solely those of the individual author(s) and contributor(s) and not of MDPI and/or the editor(s). MDPI and/or the editor(s) disclaim responsibility for any injury to people or property resulting from any ideas, methods, instructions or products referred to in the content. |
© 2026 by the authors. Licensee MDPI, Basel, Switzerland. This article is an open access article distributed under the terms and conditions of the Creative Commons Attribution (CC BY) license.