


Abstract
Agricultural production is an important source of global carbon emissions, yet differences in system boundaries and emission factors among previous studies have limited comparisons across crops and regions. This study investigated the distribution, emission sources, and regional disparities of agricultural carbon emissions across 31 major crop-producing provinces in China, using a unified life cycle assessment (LCA) framework based on agricultural input, crop production, and agronomic data in 2024. Carbon emissions per unit area (CEA) and per unit yield (CEY) were quantified under consistent accounting boundaries, and the contributions of different emission sources together with their spatial characteristics were discussed. CEA generally showed higher values in the central and eastern regions of China and Xinjiang, but lower values in southwestern and northeastern China. Xinjiang contributed the highest total carbon emissions (about 1.6 × 10⁵ t), primarily because extensive cotton cultivation requires intensive irrigation, mechanized operations, and plastic-film mulching, leading to high emissions from fertilizer use, energy consumption, and agricultural film. Rice exhibited the highest carbon emissions (accounting for 30% of all 11 types of crops), followed by cotton and tobacco, while soybeans, rapeseed, and sugar beets had relatively low emission intensities. Fertilizer production and application were the dominant emission sources for most upland crops, while methane emissions from flooded paddy fields accounted for the largest share of rice carbon emissions. Spatial clustering analysis further indicated that high-emission regions were concentrated in central and eastern China, while northeastern China formed distinct low-emission clusters. This study provided a consistent assessment of carbon emissions from major crops across China, offering a reference basis for formulating emission reduction strategies for different crops and regions.
1. Introduction
The continuous increase in greenhouse gas (GHG) emissions, including carbon dioxide (CO2), methane (CH4), and nitrous oxide (N2O), has intensified global warming and posed substantial challenges to the sustainable development of human society [1]. Compared with forestry and other land uses, agricultural production is an important source of GHG emissions through agricultural input manufacturing, energy consumption, and field processes, which have caused approximately 8.1 Gt CO2-eq globally (about 14% of total anthropogenic GHG emissions) [2]. China is one of the world’s largest agricultural producers [3], and its agricultural production has long been characterized by a high-input, high-output pattern, relying heavily on fertilizers, pesticides, agricultural film, irrigation, and mechanized operations [4]. Although this high-input of production factors has contributed substantially to guaranteeing grain production and protecting food security, it has also resulted in considerable GHG emissions and increasing environmental pressures, further intensifying the conflict between agricultural production and sustainable development [5]. Therefore, accurately quantifying the carbon footprint of crop production is a premise for identifying major emission sources and developing effective mitigation strategies.
Several methods have been developed to quantify agricultural carbon emissions, including emission-factor accounting [6], life cycle assessment (LCA) [7], input–output analysis [8], and field measurement [9]. The emission-factor method is suitable for large-scale assessments based on statistical data but is highly dependent on the selected emission factors [10]. Input–output analysis can capture indirect emissions associated with economic activities but lacks the resolution to represent crop-specific production processes. Field measurements provide direct estimates of GHG emissions under specific environmental conditions but are costly and difficult to apply at regional and national scales. Among these methods, LCA provides a more comprehensive framework for evaluating the environmental impacts of crop production. It can typically trace the entire process from the extraction and production of agricultural inputs to crop production at the farm gate, covering the consumption and emissions of resources throughout the process. Carbon footprint assessment, as a specific application of LCA in the evaluation of climate change, converts different GHGs into carbon dioxide equivalents according to their global warming potentials. Meanwhile, this approach can account for upstream emissions from agricultural input production, energy consumption during field operations, and direct emissions from cropland. Among direct cropland emissions, N2O and CH4 are important components of the carbon footprint of crop production. N2O is mainly associated with nitrogen transformation in agricultural soils, while CH4 emissions are particularly important in flooded rice systems. Field GHG emissions are highly sensitive to environmental conditions and can exhibit substantial spatial and temporal variability. Griffis et al. [11] showed that warmer and wetter conditions can enhance N2O emissions, demonstrating the strong sensitivity of agricultural N2O emissions to environmental conditions. Jia et al. [12,13] further demonstrated that variations in soil hydrological conditions and transport processes can substantially affect GHG production and emissions. CH4 emissions are mainly associated with flooded rice cultivation, where anaerobic soil conditions promote methanogenesis, and their magnitude is strongly influenced by flooding duration and water-management practices [14]. These findings indicated that direct field GHG emissions can vary considerably with soil, climatic, hydrological, and management conditions. LCA is therefore suitable for identifying stages with high carbon emissions and comparing the environmental performance of different crops and production regions.
Numerous studies have quantified the carbon footprints of crop production using LCA. However, the results of existing studies are not always directly comparable. First, system boundaries differ substantially. Some studies include only agricultural-input production and energy consumption; others additionally consider seed production, machinery operation, irrigation electricity, agricultural film, direct and indirect N2O emissions, paddy CH4 emissions, residue management, or changes in soil organic carbon. For example, Hillier et al. [15] quantified the contributions of major farming operations, including fertilizer and pesticide production, soil preparation, and harvesting, to the carbon footprints of arable crops in the United Kingdom, and discovered that nitrogen has a significant impact on the carbon emissions of different arable crops. Grassini and Cassman [16] estimated the carbon footprint of maize production in the United States by accounting for emissions from fertilizer and pesticide inputs, agricultural machinery, and irrigation electricity, and demonstrated that regional differences in irrigation energy use were a major source of variation in GHG emissions. Second, large differences exist in the selection of emission factors. Factors for fertilizer manufacture, pesticides, diesel, electricity, and other agricultural inputs may be obtained from international databases, national inventories, field experiments, or individual studies, resulting in different estimates even when the same crop and region are evaluated. Gan et al. [17] estimated emission factors using a combination of field measurements and the published literature, and found that diversified rotations reduced the carbon footprint of durum wheat in Canada by 15–25% compared with continuous wheat. Cheng et al. [18] adopted emission factors from multiple sources, including IPCC guidelines, BP China energy statistics, national reports, and the published literature, revealing that carbon efficiency showed a decreasing trend in China during 2003–2007. Xu and Lan [19] adopted emission factors from multiple published studies and IPCC guidelines, and recalculated energy-related factors based on national electricity and fuel statistics to analyze the carbon emissions of the three main crops in southern China. Third, different versions of the Intergovernmental Panel on Climate Change global warming potential coefficients have been adopted to convert CH4 and N2O into CO2 equivalents. Chen et al. [20] adopted the IPCC Fourth Assessment Report (AR4) coefficients (CH4 = 25 and N2O = 298), whereas more recent studies have applied the IPCC Fifth Assessment Report (AR5) or Sixth Assessment Report (AR6) coefficients [21,22]. Differences in system boundaries, emission factors, global warming potential coefficients, and functional units can therefore obscure actual spatial and crop-specific differences and reduce the comparability of published carbon-footprint estimates.
Existing studies focused on individual crops or several representative crops; therefore, there was still a lack of a unified life-cycle list and parameter system covering major crops across China. This limited the comparability among crops and provinces and made it difficult determine the emission reduction measures to be implemented for specific crops and regions. The objectives of this study were to (1) establish a consistent carbon-footprint accounting framework for 11 major crops in China by applying consistent system boundaries, agricultural input categories, emission factors, and GHG characterization coefficients; (2) quantify and compare total carbon emissions, carbon emissions per unit cultivated area and carbon emissions per unit yield across different crops and provinces, and (3) identify dominant emission sources and factors causing regional disparities to support targeted low-carbon agricultural management.
2. Materials and Methods
2.1. Study Region
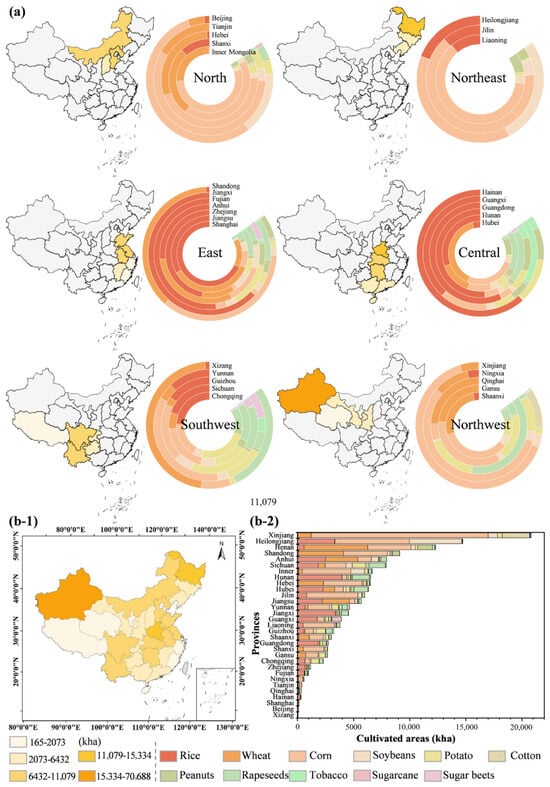
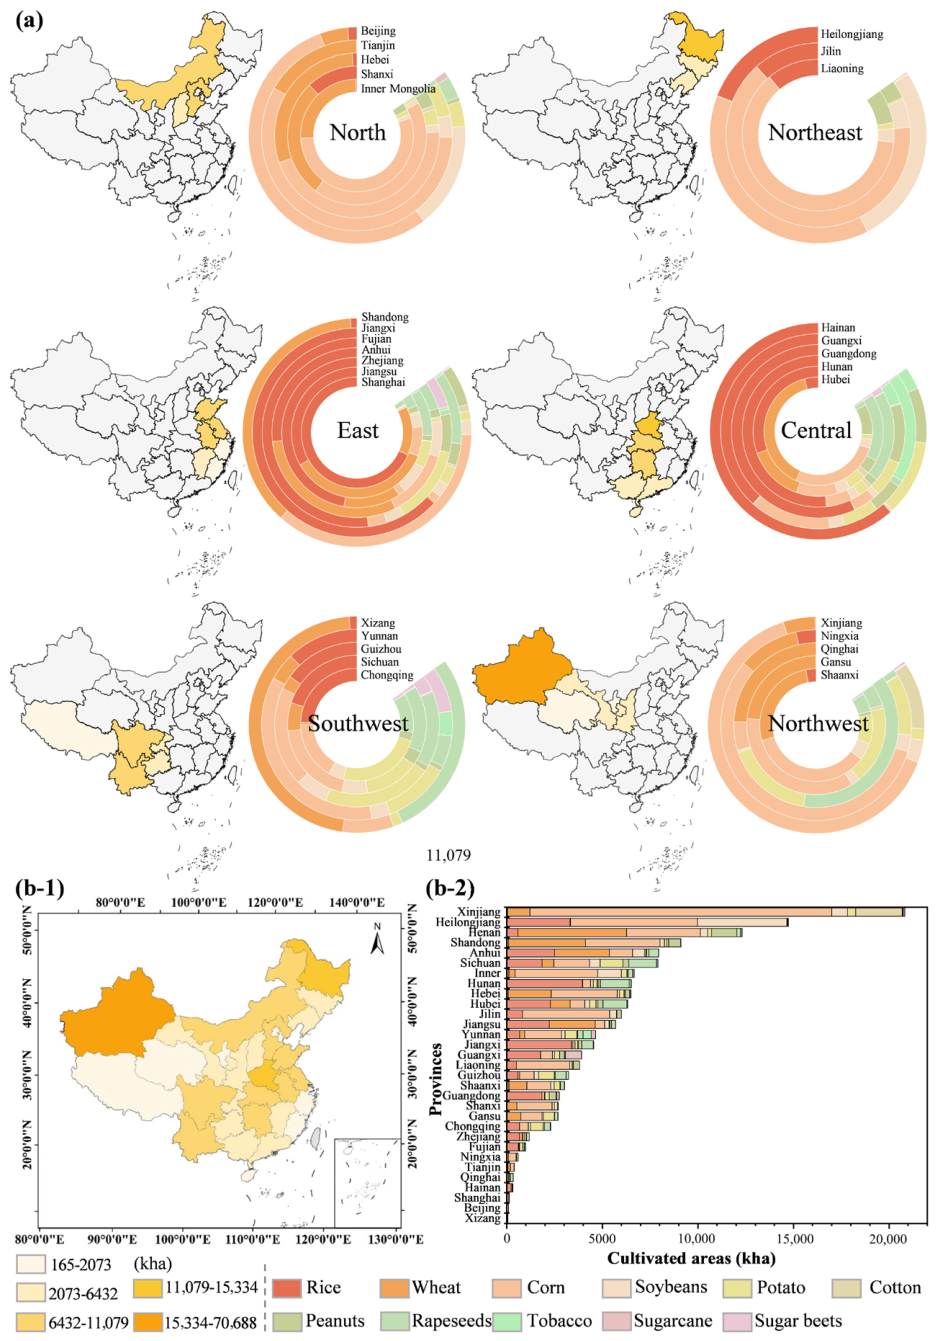
To calculate the latest agricultural carbon emissions in China, this study selected 2024 as the reference year, as it provided the most comprehensive and up-to-date data on agricultural inputs, crop production, and agronomic management. The 31 major crop-producing provinces of China were covered, and 11 major crops were selected in this study, including rice, wheat, corn, soybean, potato, cotton, peanuts, rapeseed, sugarcane, sugar beets, and tobacco (Figure 1). These crops accounted for approximately 92% of the national agricultural cultivated area, representing the dominant cropping systems in China. The crop area in this study refers to the annual cultivated area, meaning that when the same land is planted with the same crop more than once within a year, each cropping cycle is included in the annual sown area. Among the selected crops, this mainly applies to rice in double- and triple-cropping systems.
Figure 1.
(a) The cultivated area and cropping structures in 31 major crop-producing provinces of China. (b-1) The total cultivated area of each province. (b-2) Crop composition of each province.
As shown in Figure 1a, the cultivated area of the selected crops reflects obvious regional differences in crop composition. Rice is mainly cultivated in eastern and central regions of China, and wheat and corn dominate in northern, northeastern, and northwestern China. Cotton cultivation is highly concentrated in Xinjiang, while tobacco and rapeseed are primarily distributed in central and southwestern China, respectively. Figure 1(b-1,b-2) presents the total cultivated area of 31 major crop-producing provinces and the cropping structure of each province, with relatively large cultivated areas concentrated in regions such as Xinjiang, Heilongjiang, and Shandong. These regional differences in cultivated area and cropping structure influence the spatial distribution of agricultural carbon emissions and therefore require further carbon footprint accounting and spatial analysis.
2.2. An Agricultural Carbon Emission Accounting Framework with Unified Boundaries and Factors
This study developed an agricultural carbon emission accounting framework with unified system boundaries and emission factors. The carbon emissions (CEp,c) were quantified from three components: agricultural material inputs (CEAM,p,c), energy consumption (CEE,p,c), and soil biochemical processes (CES,p,c), as follows:
where CEE,p,c is carbon emissions of crop c in province p (kg CO2-eq); CEAM,p,c, CEE,p,c, and CES,p,c represent carbon emissions from agricultural material inputs, energy consumption, and soil biochemical processes of crop c in province p, respectively (kg CO2-eq).
- (1)
- Carbon emissions from agricultural material inputs
Agricultural material inputs include the production and application of fertilizers, pesticides, agricultural film, diesel fuel, seeds, and labor. The corresponding carbon emissions were calculated as follows:
where EF1, EF2, EF3, and EF4 are the emission factors for nitrogen, phosphorus, potassium, and compound fertilizers, respectively (kg CO2-eq/kg); EF5, EF6, EF9 and EF10 are the emission factors for pesticides, film, seeds, and labor, respectively (kg CO2-eq/kg), as detailed in Table 1; ANFp,c, APFp,c, AKFp,c, and ACFp,c are the application rates of nitrogen, phosphorus, potassium, and compound fertilizers for crop c in province p (kg); APp,c, AAp,c, ASp,c, and ALp,c are the application rates of pesticides, agricultural film, seeds, and labor input for crop c in province p, respectively (kg, man/day). Different crops and provinces use the same emission factor values.
Table 1.
Carbon emission factors for different inputs or sources used in this study.
- (2)
- Carbon emissions from energy consumption
Energy-related carbon emissions include diesel fuel consumed by agricultural machinery and electricity used for irrigation. These emissions were calculated as follows:
where EF7 and EF8 are the emission factors for diesel fuel and electricity (kg CO2-eq/L, kg CO2-eq/kWh); EMp,c is diesel consumption by agricultural machinery of crop c in province p (L/kg); EIp,c is irrigation electricity consumption of crop c in province p (kWh/m3); Yp,c is the crop yield of crop c in province p (kg); WDp,c is the irrigation water demand of crop c in province p (m3).
- (3)
- Carbon emissions from soil biochemical processes
Carbon emissions from soil biochemical processes consist of direct N2O emissions induced by nitrogen fertilizer application and CH4 emissions from flooded rice cultivation. These emissions were calculated as follows:
where 298 and 25 are the 100-year global warming potential of N2O and CH4, according to IPCC (2007) [10]. is the factor of direct N2O emission for synthetic nitrogen fertilizer (0.01 kg N2O–N/kg), according to IPCC (2007) [10]. Np,c is the amount of nitrogen fertilizer applied to crop c in province p (kg N). is the factor of CH4 emission (1.30 kg CH4/ha/day), according to IPCC (2007) [10]. Tp,c is the cultivation period of crop c under flooded conditions in province p (days), where c = 1 (i.e., rice). Ap,c is the harvested area of crop c in province p (ha), where c = 1 (i.e., rice).
- (4)
- Carbon emissions per unit area and per unit yield of province p
2.3. Selection of System Boundaries and Emission Factors
This study collected 26 published studies on crop carbon footprint in China and statistically summarized them according to crop types as shown in Table S1 in Supplementary Materials. The table included the system boundaries, emission factors for agricultural inputs, greenhouse gas characterization factors, accounting standards, and carbon emission sources adopted in each study. Although all these studies employed the life cycle assessment (LCA) method, there were significant differences in the calculated carbon footprints of each crop. Specifically, obvious differences were observed in the selection of system boundaries among previous studies. Most studies consistently included the production and application of fertilizers, pesticides, plastic film, diesel fuel, and irrigation electricity. However, different studies have significant differences in whether to include aspects such as seed production and processing, labor input, agricultural machinery, and direct field emissions (CH4 and N2O) in the accounting system, leading to different system boundaries.
In addition, the selection of emission factors for various agricultural inputs also varies. For example, the emission factor for nitrogen fertilizer production ranged from 1.5 to 8.3 kg CO2-eq kg−1 N among different studies. The emission factors for pesticides, plastic film, diesel fuel, and irrigation electricity also differed considerably because of the use of different data sources and accounting standards. The inconsistency of these calculation indicators obviously reduced the comparability of the carbon footprint estimates across different crops and regions. Therefore, this study established a unified life cycle accounting framework by adopting the same system boundaries, standardized emission factors, and GHG conversion method for major crops in China.
The system boundary of this study covered both the production and use stages of 10 major agricultural inputs, including fertilizers (nitrogen, phosphorus, potassium, and compound fertilizers), pesticides, agricultural film, diesel fuel consumed by agricultural machinery, irrigation electricity, seed production and processing, and labor inputs. The selection of emission factors (EFs) for the system boundaries is based on the literature presented in Table S1. This study adopted three approaches to determine the standardized values of each emission factor. (1) For P fertilizer, K fertilizer, compound fertilizer, diesel fuel, irrigation electricity, and seeds, the China average method was adopted, in which the average of the reported EFs from multiple studies was calculated and used as the representative value. This approach was selected because the reported EFs for these inputs showed relatively limited variation across the collected literature, and averaging multiple estimates can reduce the influence of individual studies. Zhang et al. [23] also used a similar method of averaging to calculate the EF of the compound fertilizer. (2) For N fertilizer, pesticides, and agricultural film, the weighted average method was adopted. This method was selected because these sources showed relatively large variations among the reported EFs, making a simple arithmetic mean less representative of the overall literature evidence. A similar weighted-integration approach was adopted by Zhang et al. [24], who integrated a large amount of empirical data and the literature to derive weighted emission factors for different stages of the N fertilizer life cycle in China. (3) For labor, the widely adopted value method was used, which adopted the EF commonly reported. This method was selected because the EF for labor was highly consistent among the collected studies [25,26]. The specific values of each emission factor are shown in Table 1.
2.4. Data Collection
Data used for carbon footprint accounting were collected and organized into three categories: agricultural input data, crop production, and agronomic data. Agricultural input data were primarily collected from the National Agricultural Product Cost and Income Data Compilation [27] and the China Statistical Yearbook 2025 [28]. Input quantities of fertilizers, seeds, agricultural plastic film, labor, diesel, pesticides, and irrigation electricity were estimated based on the National Agricultural Product Cost and Income Data Compilation. Specifically, fertilizer, seed, plastic film, and labor inputs were directly obtained from the statistical records, while diesel, pesticide, and irrigation electricity consumption were derived from expenditure data and corresponding unit prices. Diesel prices were obtained from the National Development and Reform Commission (https://www.ndrc.gov.cn/xwdt/xwfb/202409/t20240920_1393111.html, accessed on 1 June 2026), pesticide prices were sourced from the China Price Information Network (https://www.chinaprice.cn/qt/55057.jhtml, accessed on 1 June 2026), and the electricity price for agricultural production was collected from the official websites of provincial Development and Reform Commissions. The unit prices of diesel, pesticides, and electricity used are provided in Table S2 in Supplementary Materials. Crop production and agronomic data, including cultivated area (Sp,c), crop yield (Yp,c), and the rice cultivation period under flooded conditions (Tp,1), were collected. Cultivated area (Sp,c) and crop yield (Yp,c) for the 11 major crops in each province were obtained from the China Statistical Yearbook 2025 [28], which are detailed in Tables S3 and S4 in Supplementary Materials. The rice cultivation period under flooded conditions (Tp,1) for each rice-growing region was obtained from the agro-meteorological observations released by the China Meteorological Administration (CMA) (https://www.cma.gov.cn/en, accessed on 1 June 2026).
2.5. Statistical Analysis
- (1)
- Emission-factor sensitivity analysis
To evaluate the influence of emission-factor selection on the carbon emission estimates, a one-at-a-time sensitivity analysis was performed. Each emission factor was independently varied by 10%, while all other parameters were held constant. The resulting relative changes in total carbon emissions were calculated to quantify the sensitivity of the estimates to individual emission factors, with the detailed calculation provided in Text S1 in Supplementary Materials. At the national level, the responses of total carbon emissions under 10% perturbation scenarios were evaluated. At the provincial level, the +20% perturbation scenario was selected to characterize regional differences in the response of total carbon emissions to individual emission factors.
- (2)
- Correlation and variance decomposition analysis
Pearson correlation analysis was conducted to examine the relationships among different emission components across provinces. The correlation coefficients among carbon emissions of fertilizer, pesticide, agricultural film, energy, seeds, labor, N2O, and CH4 were calculated to identify the coordinated variations among major agricultural emission sources. Statistical significance was evaluated at the 0.05 level.
Furthermore, variance decomposition analysis was performed to quantify the contribution of individual emission components to interprovincial variation in total carbon emissions. Since total carbon emissions were calculated as the sum of emissions from individual sources, the contribution of each emission component was quantified based on its covariance with total carbon emissions, with the detailed calculation provided in Text S2 in Supplementary Materials.
- (3)
- Spatial clustering characteristics analysis
Spatial clustering characteristics of crop carbon emissions were analyzed using Local Indicators of Spatial Association (LISA) and Getis–Ord Gi* hotspot analysis [29,30]. The LISA analysis was applied to identify local spatial clustering patterns, including High–High, Low–Low, High–Low and Low–High clusters of carbon emissions per unit area (CEA) and per unit yield (CEY). The Getis–Ord Gi* statistic was further used to detect statistically significant hotspots and cold spots of both CEA and CEY across provinces in China. These analyses provide a basis for understanding the spatial heterogeneity of agricultural carbon emissions and for developing region-specific carbon mitigation strategies. All spatial analyses and map visualizations were performed using ArcGIS (v10.8) software.
3. Results
3.1. Spatial Distribution of Carbon Emissions and Contributions of Agricultural Inputs of Major Crops
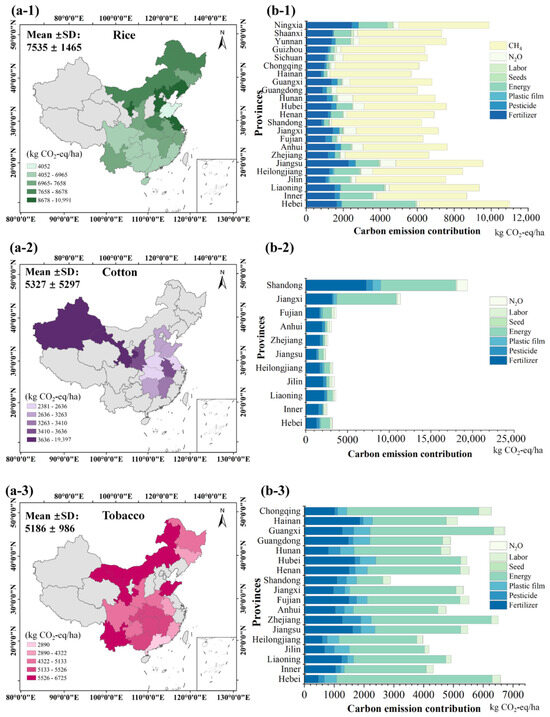
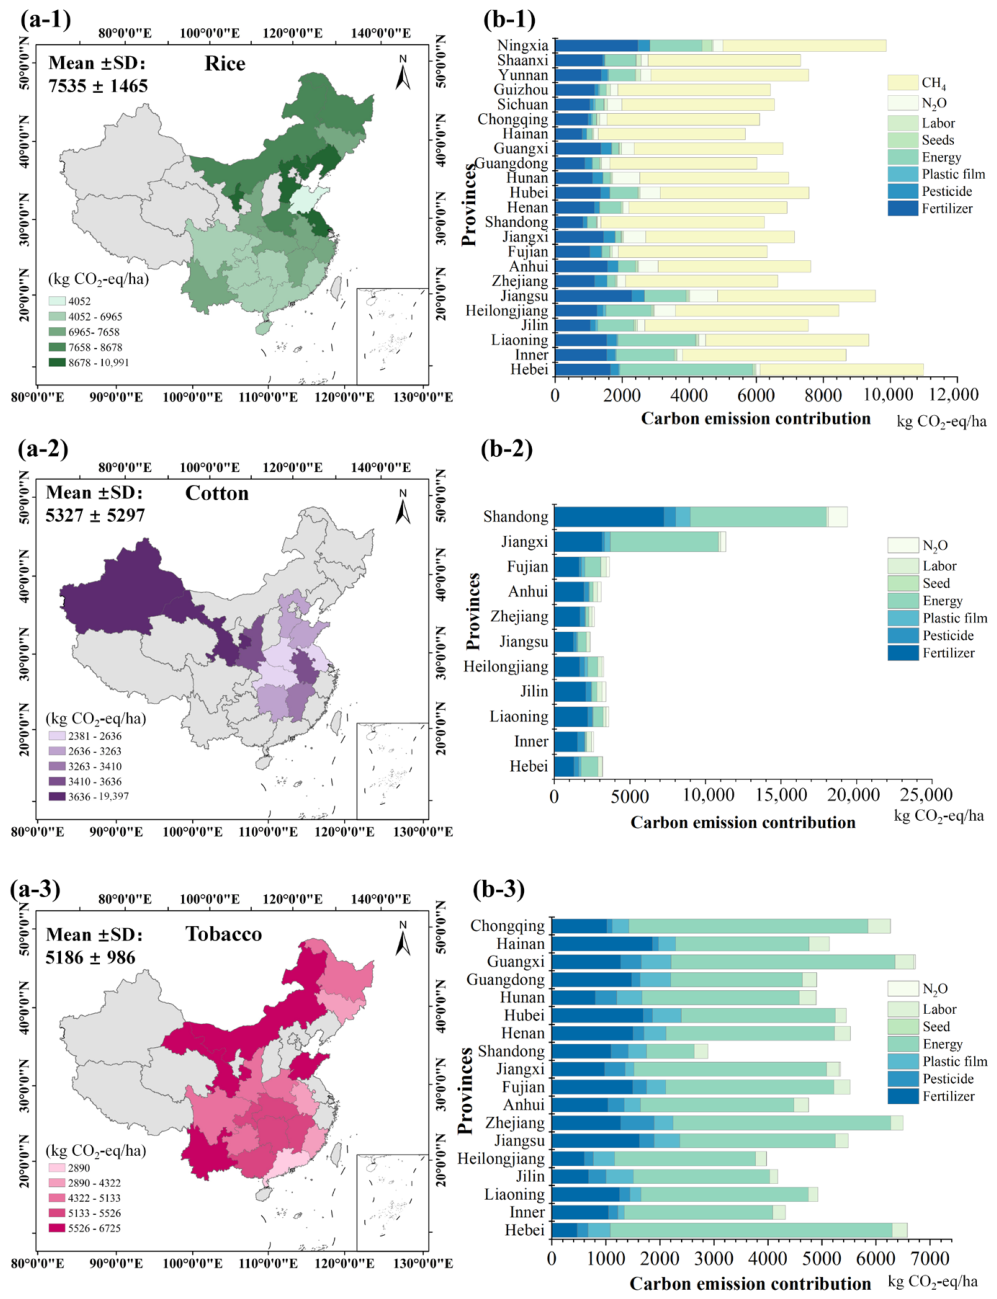
This study revealed pronounced spatial distribution in carbon emissions among the 11 major crops across China, with great differences in both emission intensity and the contributions of agricultural inputs among crop types and provinces. Figure 2(a-1) showed that rice exhibited the highest carbon emissions per unit area (7535 ± 1465 kg CO2-eq ha−1), as shown in Figure 2(a-1) mainly because continuous flooding during the growing season created anaerobic soil conditions that stimulated CH4 production. According to the emission source composition (Figure 2(b-1)), CH4 accounted for approximately 40% of total rice carbon emissions, making it the largest emission source. In addition, rice cultivation involves multiple management practices, including seedling raising, transplanting, repeated irrigation, and intensive field operations, which increase diesel consumption and the use of fertilizers and irrigation electricity. Moreover, double-cropping systems are widely adopted in southern China [31]. Their annual resource input is much higher than that of the single-cropping system, and this further aggravates the carbon emissions.
Figure 2.
(a-1–a-3) spatial distributions of the carbon emissions per unit area for rice, cotton, and tobacco in China. (b-1–b-3) carbon emission contributions for rice, cotton, and tobacco in China.
Cotton and tobacco exhibited similarly high carbon emissions, both exceeding 5000 kg CO2-eq ha−1 and ranking second only to rice (Figure 2(a-2,a-3)), mainly because both are high-input commercial crops characterized by intensive management throughout the growing season [32,33]. Their production generally involves multiple fertilizer applications, frequent pest and disease control, irrigation, and repeated field operations, resulting in higher diesel and energy consumption. Furthermore, their long growth periods will increase the cumulative demand for field operations and agricultural inputs. Cotton production also relies on plastic film mulching, particularly in the major production regions of northwestern China, which results in an increase in carbon emissions from agricultural films.
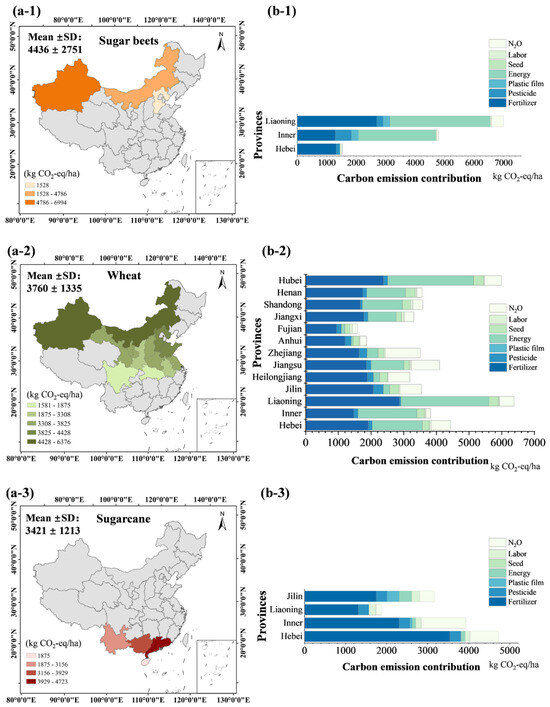
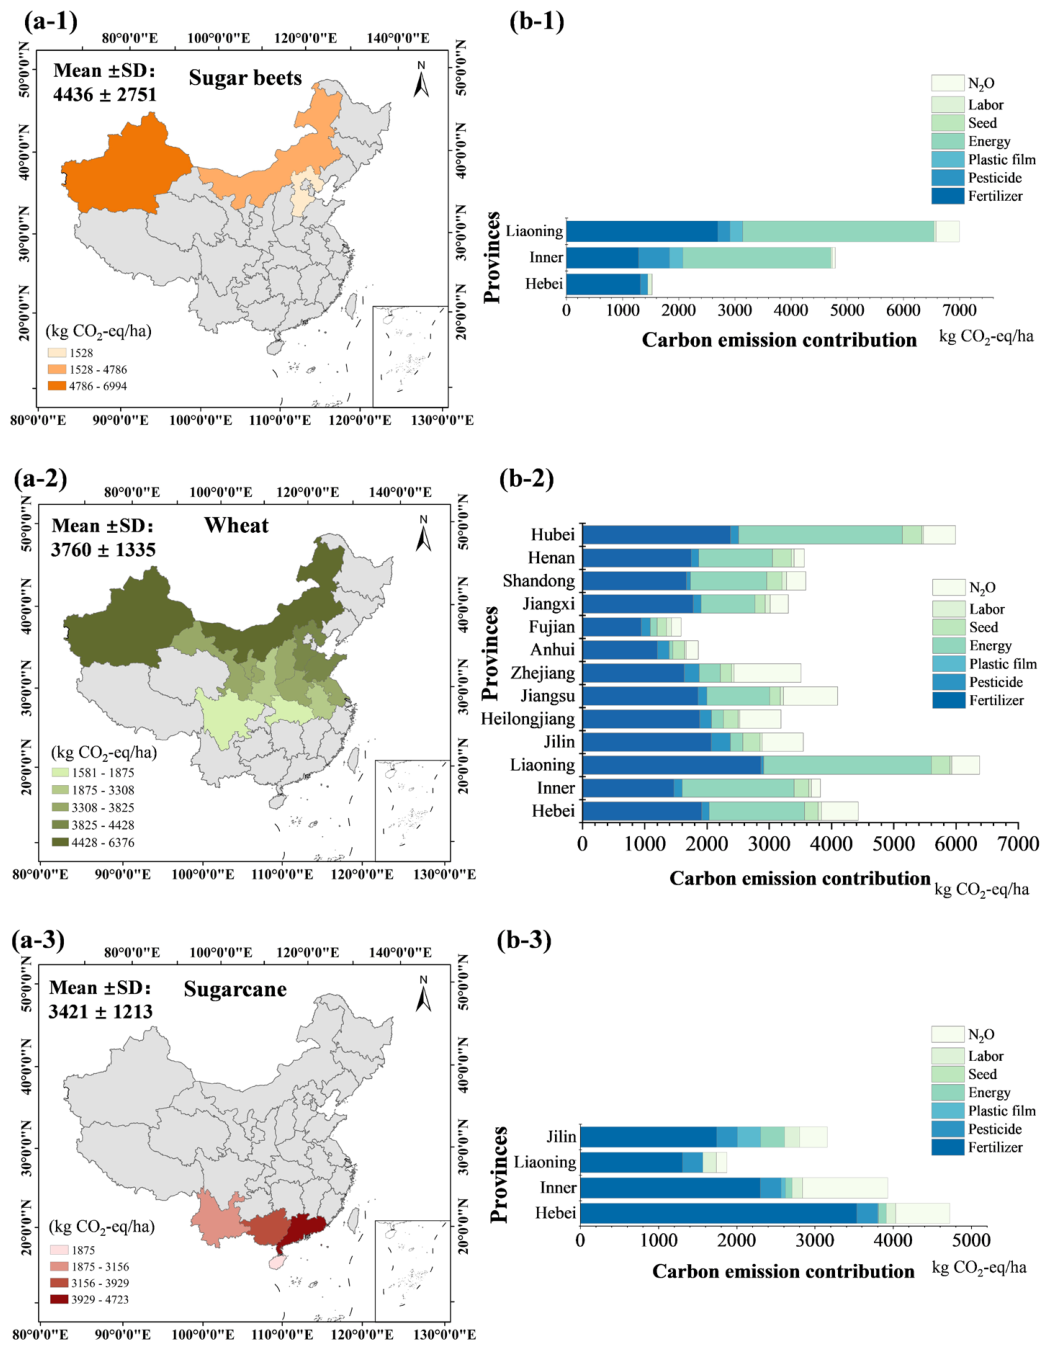
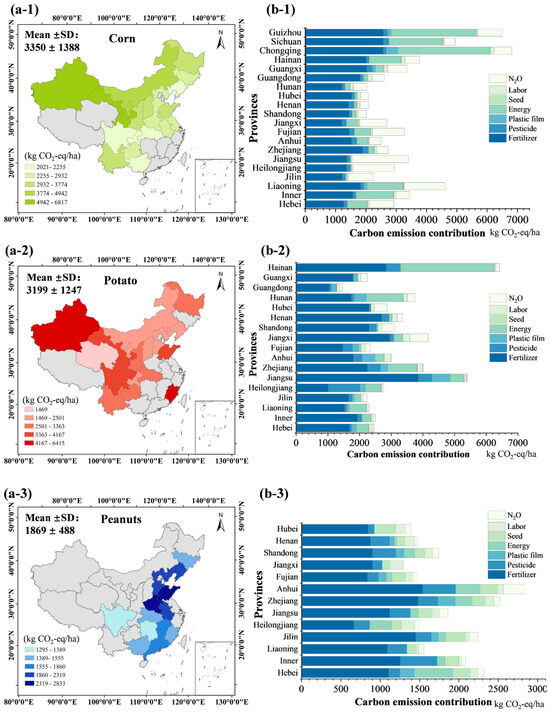
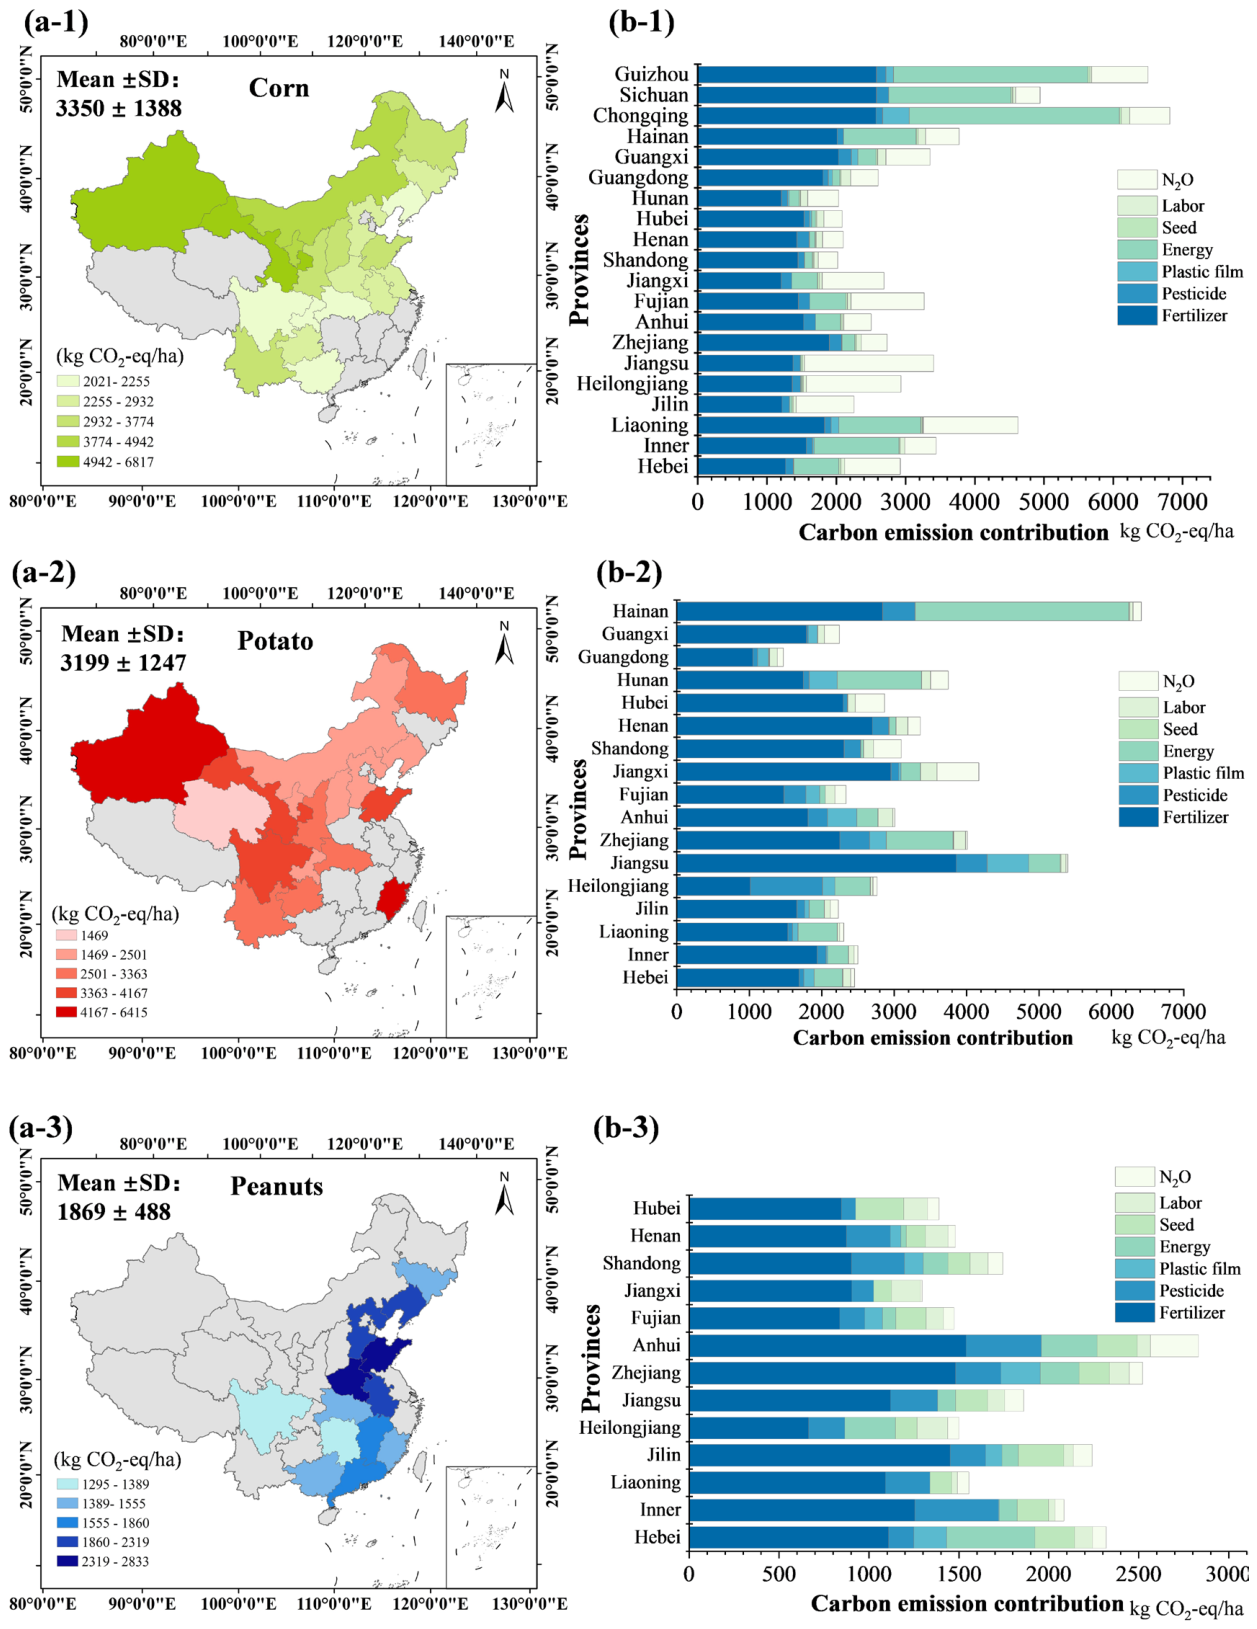
By comparison, wheat, corn, and potato exhibited moderate emission levels, as shown in Figure 3(a-2) and Figure 4(a-1,a-2), because their carbon footprints were dominated by fertilizer production and field management rather than crop-specific biological emissions. Although nitrogen fertilizer remained the largest emission source, their shorter growth duration and lower irrigation requirements limited overall resource consumption. Sugar beets and sugarcane are cultivated in relatively few provinces; their carbon emissions per unit area remain comparatively high. This pattern is primarily associated with the intensive management required for these sugar crops. Both crops have relatively long growing seasons and require substantial fertilizer inputs to sustain high biomass accumulation and sugar production. In addition, irrigation, mechanized field operations, and energy consumption during cultivation further increase carbon emissions. As shown in Figure 3(b-1,b-2), fertilizer was the dominant emission source for both crops, while energy use also made a big contribution, indicating that nutrient management and energy efficiency are key opportunities for reducing emissions in sugar-crop production systems.
Figure 3.
(a-1–a-3) spatial distributions of the carbon emissions per unit area for sugar beets, wheat, and sugarcane in China. (b-1–b-3) carbon emission contributions for sugar beets, wheat, and sugarcane in China.
Figure 4.
(a-1–a-3) spatial distributions of the carbon emissions per unit area for corn, potato, and peanuts in China. (b-1–b-3) carbon emission contributions for corn, potato, and peanuts in China.
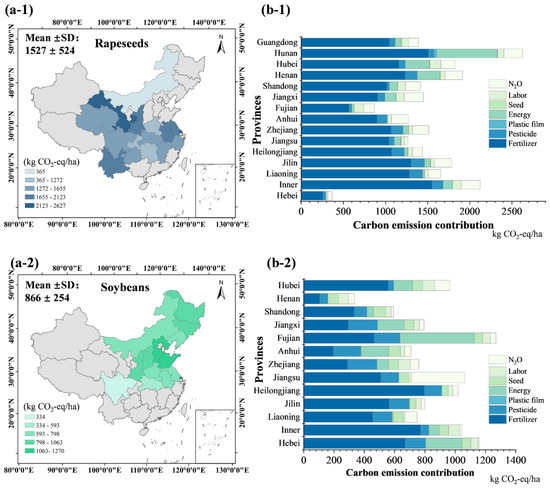
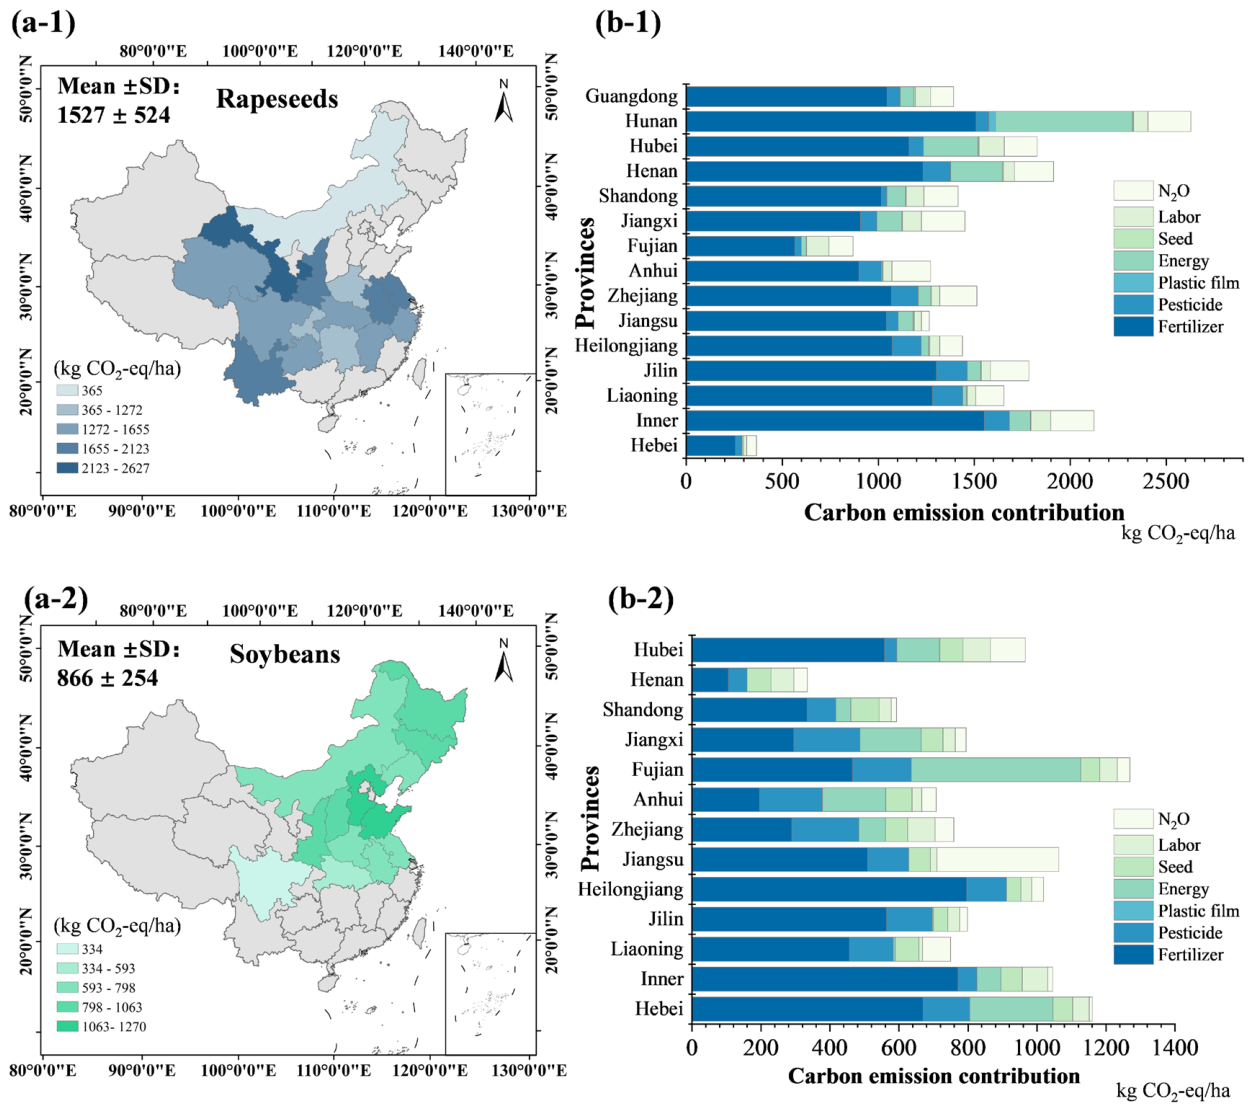
Peanuts, rapeseed, and soybeans exhibited relatively low carbon emissions, all below 2000 kg CO2-eq ha−1, as shown in Figure 4(a-1) and Figure 5(a-1,a-2). One important reason is their lower demand for synthetic nitrogen fertilizer than grain and commercial crops. Fertilizer production and application are among the largest contributors to agricultural carbon emissions; therefore, reduced fertilizer inputs directly lower upstream emissions and fertilizer-induced N2O emissions. In particular, soybeans, as a leguminous crop, can obtain part of their nitrogen requirement through biological nitrogen fixation, substantially reducing the dependence on synthetic nitrogen fertilizers [34]. In addition, these crops generally require lower inputs of irrigation, mechanized operations, and agricultural film than crops such as rice, cotton, and tobacco, further reducing their overall carbon emissions.
Figure 5.
(a-1,a-2) Spatial distributions of the carbon emissions per unit area for rapeseed and soybean in China. (b-1,b-2) Carbon emission contributions for rapeseed and soybean in China.
These findings suggested that carbon mitigation strategies should be differentiated according to crop-specific emission mechanisms and regional production characteristics. Improving fertilizer use efficiency remains the most effective mitigation pathway for most crops. In rice production, priority should be given to alleviating methane emissions by improving water resource management. For commercial crops such as tobacco and cotton, enhancing energy efficiency and reducing plastic film consumption are expected to provide additional opportunities for reducing agricultural carbon emissions [35].
3.2. Total Carbon Emission Pathways Across Major Crops
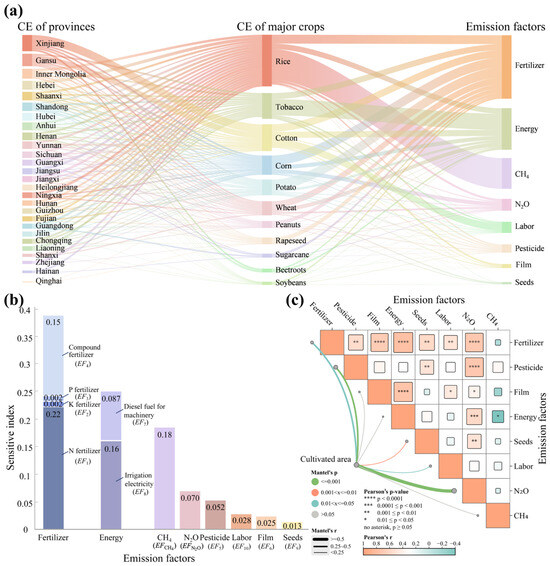
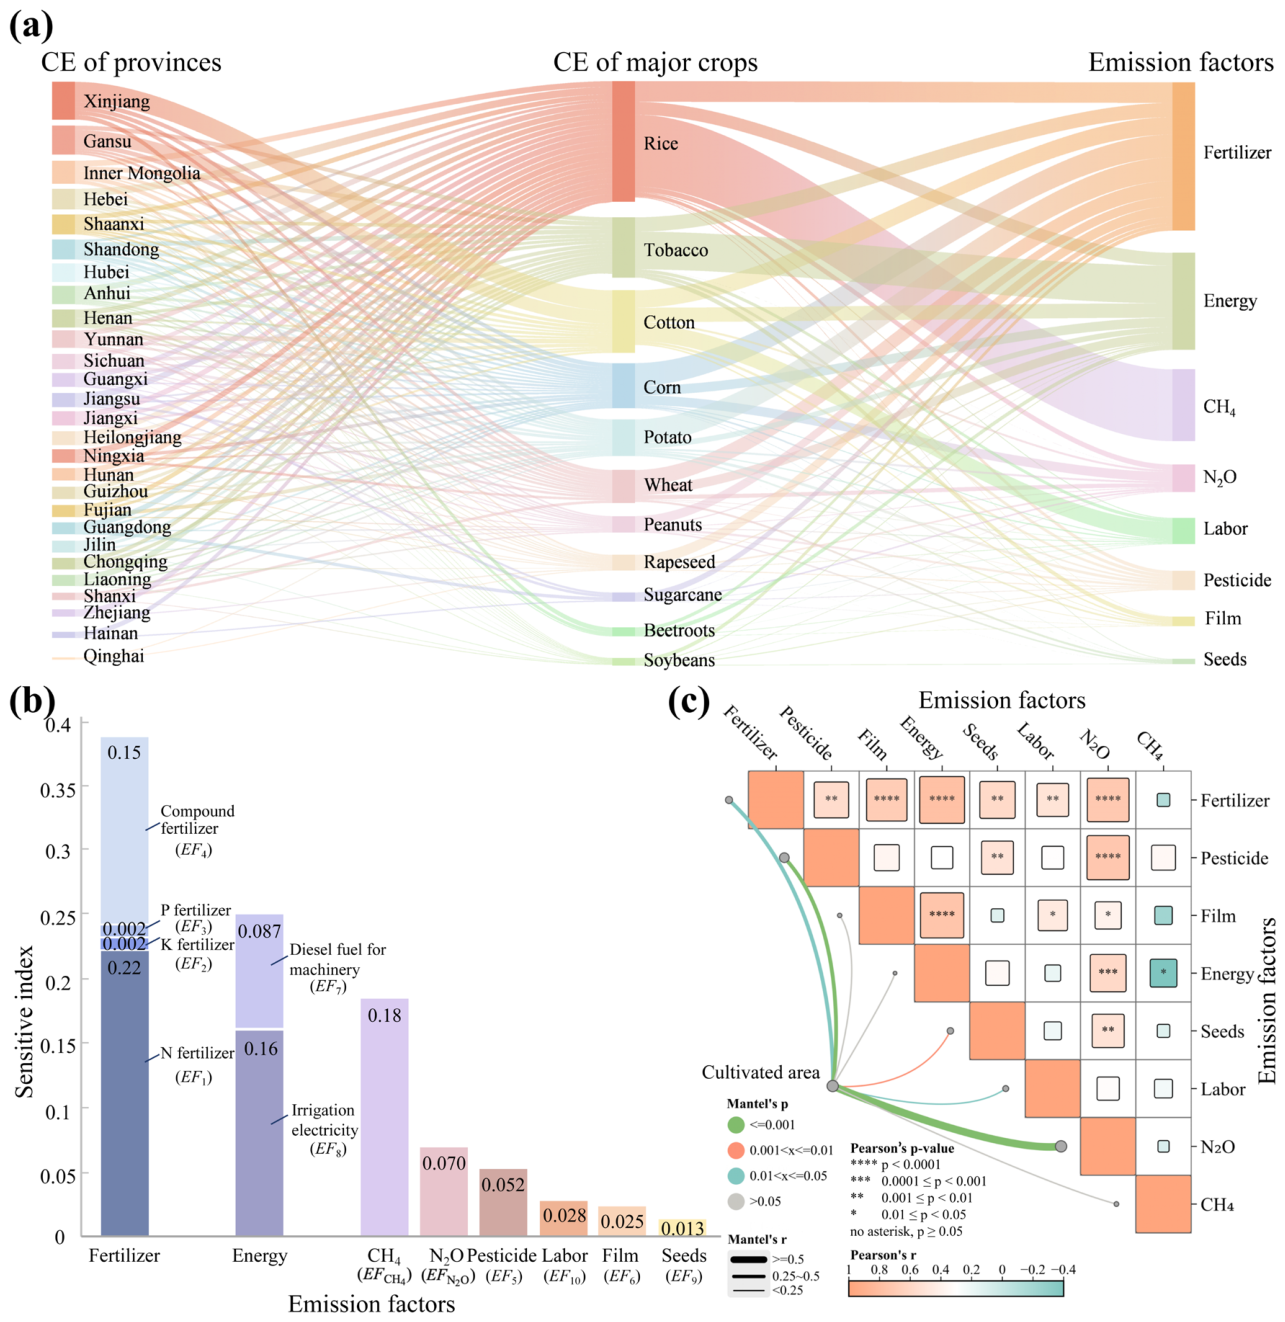
Figure 6a summarizes the flow of carbon emissions from provinces through crop types to different emission sources, providing an overview of the national carbon emission structure. Xinjiang, Gansu, Inner Mongolia, and Hebei accounted for the largest proportions of total crop carbon emissions in China. Total carbon emissions are influenced not only by emission intensity but also by cropping area and crop composition [36]. Xinjiang contributed the most because cotton occupies a large proportion of its cultivated land [32]. Cotton production in the region depends heavily on irrigation, mechanized operations, and plastic-film mulching, resulting in substantial emissions associated with fertilizer use, energy consumption, and plastic film. Gansu and Inner Mongolia also made large contributions due to their extensive cultivation of wheat, maize, potato, and sugar beets [37,38]. Although these crops do not generate methane emissions, their large cultivated areas and intensive fertilizer use result in considerable total carbon emissions. Hebei exhibited a similar pattern, with wheat and maize accounting for most of the provincial emissions through their extensive cultivated area and relatively high fertilizer inputs. These results suggest that provincial carbon emissions are determined by both the scale of crop production and the intensity of agricultural inputs, rather than by the carbon intensity of individual crops alone.
Figure 6.
(a) Carbon emission (CE, kg CO2-eq) composition of 11 major crops in China. (b) Sensitivity index of total carbon emissions to a 10% change in each emission factor (EFi). (c) Correlations among emission factors and their relationships with cultivated area.
Fertilizer production and application constituted the largest carbon emission pathway across almost all crops, followed by energy consumption. By contrast, emissions associated with seeds, labor, pesticides, and plastic film contributed relatively small proportions to total emissions. The covariance analysis further revealed that energy consumption and fertilizer inputs were the two dominant contributors to the provincial variation in total carbon emissions, accounting for 48.0% and 36.4% of the variance, respectively, as shown in Table S5 in Supplementary Materials. Together, these two emission sources accounted for 84.4% of the covariance-based contribution to the observed interprovincial variation, indicating that differences in energy consumption and fertilizer inputs were the primary factors underlying the spatial heterogeneity of agricultural carbon emissions. In contrast, N2O, pesticides, plastic film, labor, and seed inputs each contributed less than 7% to the interprovincial variation. Rice was the only crop in which CH4 represented a major emission pathway, and rice carbon emissions accounted for approximately 30% of all major crops. This large contribution was associated not only with its high emission intensity, but also with the multiple-cropping systems practiced in some rice-producing regions. Under double- or triple-cropping systems, the same cropland supports multiple rice production cycles within a year. The additional production cycles involve repeated agricultural inputs and field CH4 emissions, thereby increasing the annual total carbon emissions from rice production.
To further assess the robustness of the carbon emission estimates to the selection of emission factors, a one-at-a-time sensitivity analysis was conducted by independently varying each emission factor by 10% while keeping all other parameters unchanged. As shown in Figure 6b, nitrogen fertilizer had the greatest influence on the estimated national carbon emissions, with a 10% change in its emission factor resulting in a sensitivity index of 0.22, followed by CH4 (0.18), irrigation electricity (0.16), and compound fertilizer (0.15). In contrast, phosphorus fertilizer, potassium fertilizer, agricultural film, seeds, and labor had relatively limited effects on the national estimates. These results indicate that the selection of nitrogen fertilizer, irrigation electricity, and compound fertilizer emission factors has a relatively greater influence on the estimated national carbon emissions, while the estimates are less sensitive to the other emission factors. At the provincial level, the +20% perturbation scenario further revealed clear spatial differences in the response of total carbon emissions to each emission factor (Figure S1 in Supplementary Materials). Compound fertilizer generally showed the strongest influence across most provinces, while energy sensitivity was more obvious in Gansu and Xinjiang. The sensitivity of nitrogen fertilizer and diesel for machinery use is relatively low in some provinces, while the sensitivity of other emission factors is almost not sensitive.
The correlation analysis provided further insight into the relationships among planting scale and agricultural inputs (Figure 6c). Significant positive associations between cultivated area and several agricultural inputs indicate that larger production scale is generally accompanied by greater input use, while the significant associations of fertilizer with N2O and energy consumption with agricultural film suggest the coupling of multiple emission sources within intensive production systems. Overall, the correlation analysis indicated that differences in production scale, crop composition, and agricultural input intensity are closely associated with the observed regional heterogeneity in crop carbon emissions.
3.3. Spatial Clustering Characteristics of Crop Carbon Emissions in China
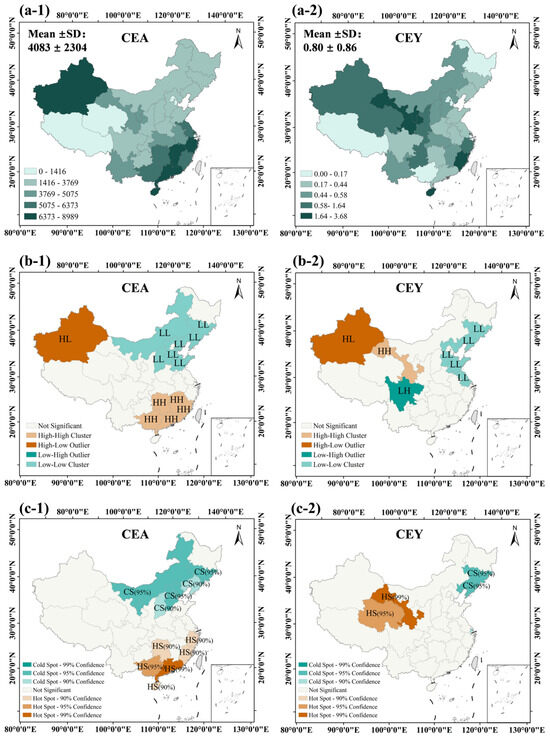
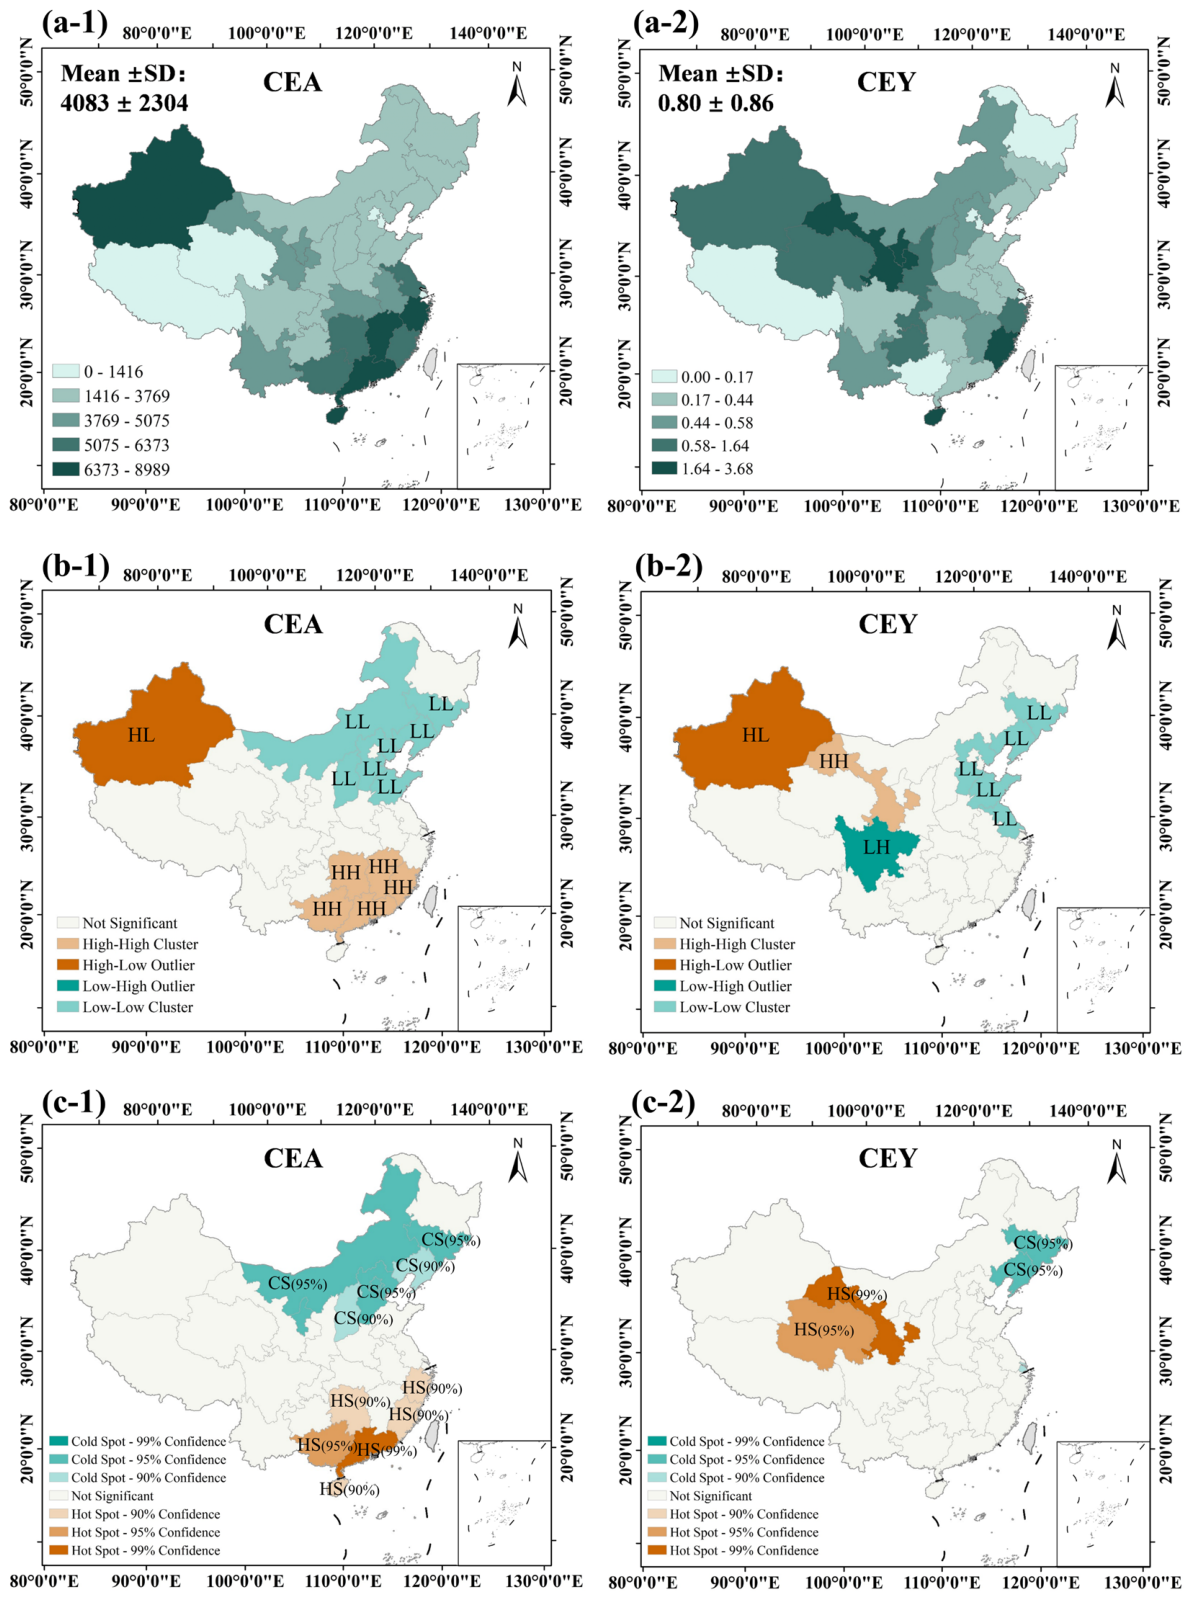
Figure 7 illustrates the spatial distribution, clustering, and cold-hot spot analysis of carbon emissions across China. Overall, carbon emission intensity exhibited a pattern of higher values in the central and eastern coastal regions and Xinjiang, and lower values in southwestern and northeastern China, as shown in Figure 7(a-1,a-2). The highest carbon emission intensity (>6373 kg CO2-eq ha−1) was mainly concentrated in Xinjiang and the central and eastern coastal provinces, including Guangdong, Fujian, and Hainan, while low-intensity regions (<1416 kg CO2-eq ha−1) were primarily distributed in Qinghai, Tibet, and parts of Northeast China.
Figure 7.
Spatial distributions of the annual total mean carbon emissions (a-1) per unit area and (a-2) per unit yield in China. (b-1) Local spatial clustering of carbon emissions per unit area (CEA). High–High (HH) clusters were identified in Guangxi, Guangdong, Hunan, Jiangxi, and Fujian, representing a concentration of high values surrounded by high values; Low–Low (LL) clusters were identified in Inner Mongolia, Liaoning, Jilin, Hebei, Tianjin, Shanxi, Shandong, and Jiangsu, representing a concentration of low values surrounded by low values; and a High–Low (HL) cluster was identified in Xinjiang, representing a high-value province surrounded by low-value provinces. (b-2) Local spatial clustering of carbon emissions per unit yield (CEY). A HH cluster was identified in Gansu; LL clusters were identified in Jilin, Liaoning, Hebei, and Shandong; an HL cluster was identified in Xinjiang; and a Low–High (LH) cluster was identified in Sichuan, representing a low-value province surrounded by high-value provinces. (c-1) Hotspot analyses of carbon emissions per unit area (CEA). Hot spots (HS) were identified in Guangdong (99% confidence), Guangxi (95% confidence), and Hunan, Zhejiang, Fujian, and Hainan (90% confidence), representing a statistically significant concentration of high values; cold spots (CSs) were identified in Inner Mongolia, Jilin and Hebei (95% confidence), and Liaoning and Shanxi (90% confidence), representing a statistically significant concentration of low values. (c-2) Hotspot analyses of carbon emissions per unit yield (CEY). HS were identified in Gansu (99% confidence) and Qinghai (95% confidence); CSs were identified in Liaoning and Jilin (95% confidence).
To further characterize the regional clustering characteristics of crop carbon emissions in China, Local Indicators of Spatial Association (LISA) and Getis–Ord Gi* hotspot analyses were performed for carbon emissions per unit cultivated area (CEA) and per unit yield (CEY) (Figure 7(b-1,b-2)). The results revealed evident spatial clustering patterns, indicating that agricultural carbon emissions are jointly influenced by regional cropping systems, agricultural input intensity, and production efficiency rather than being randomly distributed.
The LISA analysis of CEA revealed pronounced local clustering characteristics (Figure 7(c-1,c-2)). High–High clusters were mainly concentrated in central and eastern China, indicating that provinces with relatively high carbon emissions were surrounded by neighboring provinces with similarly high emission levels. This regional clustering is associated with the concentration of rice, tobacco, peanuts, sugarcane, and other high-input crops in southern China. In particular, intensive fertilizer application, irrigation, and energy consumption, together with methane emissions from rice cultivation, jointly contributed to the formation of continuous high-emission regions. In Guangdong, Fujian, and Hainan, favorable subtropical and tropical climatic conditions also support multiple cropping cycles annually [39], which further increases agricultural inputs and carbon emissions.
Unlike the High–High clusters in central and eastern China, Xinjiang was identified as a High–Low outlier, indicating that although the province exhibited relatively high carbon emissions, its neighboring provinces mainly maintained lower emission levels. This isolated high-emission characteristic is primarily attributed to the unique cropping structure of Xinjiang, where cotton cultivation occupies a dominant proportion of the cultivated area. Extensive plastic-film mulching, intensive irrigation, mechanized operations [32], and relatively high fertilizer inputs essentially increased carbon emissions, making it the highest carbon emission intensity in China [40]. Although the Northeast region is one of the major grain-producing areas in China, with corn and soybeans being the dominant crops and large-scale agricultural production being widespread [41], due to its relatively low crop rotation index and high mechanization level, the carbon emission intensity is relatively low. Therefore, the low-low type clusters are mainly distributed in the Northeast region [42].
The hotspot analysis further confirmed the spatial clustering characteristics identified by the LISA analysis (Figure 7(c-1,c-2)). CEA hotspots were primarily distributed in central and eastern China, but cold spots were mainly concentrated in northeastern China, suggesting that agricultural production systems with similar input intensities tend to form continuous regional carbon-emission patterns. Compared with CEA, the coverage range of CEY has significantly decreased and become more dispersed. This difference indicates that variations in crop productivity modified the spatial pattern of carbon emissions when expressed on a yield basis. Provinces with relatively high area-based carbon emissions did not necessarily exhibit high carbon emissions per unit yield because greater crop yields reduced carbon emissions allocated to each unit of agricultural production. This difference highlights that CEA primarily reflects the carbon intensity of land use and CEY reflects the carbon efficiency of agricultural production. Therefore, regions with intensive agricultural inputs may still achieve relatively low yield-based carbon emissions if high crop productivity is maintained.
Overall, the different spatial patterns of CEA and CEY demonstrated that agricultural carbon emissions emerge from the combined effects of production scale, crop composition, and the intensity and coupling of agricultural inputs. Therefore, carbon mitigation strategies should simultaneously improve agricultural input efficiency and crop productivity [43]. For central and eastern China, priority should be given to improving fertilizer management, irrigation efficiency, and methane mitigation in paddy fields [44]; while in Xinjiang, by optimizing cotton planting methods, reducing the use of plastic films and improving the efficiency of irrigation energy utilization, greater emission reduction potential can be achieved [14].
4. Conclusions
This study evaluated the carbon emissions of 11 major crops across 31 provincial-level regions in China by using a unified agricultural carbon emission framework based on life cycle assessment. The results demonstrated great differences in carbon emission intensity among crop types. Rice exhibited the highest carbon emission intensity, reaching approximately 7535 ± 1465 kg CO2-eq ha−1 and accounting for approximately 30% of the total carbon emissions from the 11 major crops in China, followed by cotton (5327 ± 5297 kg CO2-eq ha−1) and tobacco (5186 ± 986 kg CO2-eq ha−1). The production and application of fertilizers are the dominant emission sources for most dryland crops. The covariance decomposition analysis indicates that energy consumption and fertilizer input, respectively, account for 48.0% and 36.4% of the total carbon emission variation among provinces, which are the main driving factors for regional differences. Distinct spatial heterogeneity was identified across China. Carbon emission intensity was generally higher in central and eastern China and Xinjiang, while southwestern and northeastern China showed relatively low levels. These findings further suggested that future emission reduction strategies should be tailored to regional production systems and crop characteristics rather than adopting a uniform approach. For major rice-producing regions, priority should be given to promoting water-saving techniques such as intermittent irrigation to reduce methane emissions from paddy fields; for the Xinjiang cotton region, efforts should focus on developing mulched drip irrigation and promoting biodegradable plastic film to lower irrigation energy consumption and film carbon emissions; at the national level, continuous efforts should be made to reduce fertilizer use while improving efficiency and to promote renewable energy substitution in agricultural irrigation power systems. This study was based on the latest available year, and future studies should consider interannual variations and uncertainties to improve the accuracy of national crop carbon footprint assessments.
Supplementary Materials
The following supporting information can be downloaded at: https://www.mdpi.com/article/10.3390/agriculture16171835/s1, Table S1: Carbon emission factors of agricultural inputs used in previous studies (Part I)/(Part II); Table S2: The unit prices of diesel, pesticides and electricity price for agricultural production; Table S3: Cultivated area of major crops by province in China (Sp,c, 103 ha); Table S4: Yield of major crops by province in China (Yp,c, kg ha−1); Table S5: Contribution of emission sources to provincial variation in total carbon emissions; Table S6: Local spatial clustering patterns of carbon emissions per unit cultivated area (CEA) and per unit yield (CEY) across China; Table S7: Hotspot analyses of carbon emissions per unit cultivated area (CEA) and per unit yield (CEY) across China; Table S8: Total carbon emissions by each province and their rankings; Figure S1: Provincial responses of total carbon emissions to a 20% increase in each emission factors; Text S1: Calculation of sensitivity index of emission factors; Text S2: Calculation of variance analysis of emission factors. References [45,46,47,48,49,50,51,52,53,54,55,56,57,58,59,60,61,62,63,64,65] are mentioned in Supplementary Materials.
Author Contributions
Conceptualization, X.S. and H.C.; methodology, H.X.; formal analysis, L.Q.; investigation, X.L.; resources, H.X.; writing—original draft preparation, X.S. and H.C.; writing—review and editing, X.S.; visualization, X.S. and S.J.; supervision, H.C.; project administration, H.C. All authors have read and agreed to the published version of the manuscript.
Funding
This work was supported by the National Natural Science Foundation of China (Grant No. 52479076 and 42177365), and Jiangsu Provincial Water Conservancy Technology Project (Grant No. 2025030, 2026023, and 2025031). This study was also sponsored by the Qing Lan Project of Jiangsu Province, the Qing Lan Project of Yangzhou University, China, and the High-end Talent Support Program of Yangzhou University.
Data Availability Statement
The original contributions presented in this study are included in the article. Further inquiries can be directed to the corresponding author.
Acknowledgments
The authors thank the anonymous reviewers for their valuable comments and suggestions on this article.
Conflicts of Interest
Author Libo Qiu was employed by the company Jiangsu Province Water Engineering Sci-Tech Consulting Corp., Ltd. The remaining authors declare that the research was conducted in the absence of any commercial or financial relationships that could be construed as a potential conflict of interest.
References
- WMO. WMO Greenhouse Gas Bulletin No. 19; World Meteorological Organization (WMO): Geneva, Switzerland, 2023. [Google Scholar]
- FAO. Greenhouse Gas Emissions from Agrifood Systems Global, Regional and Country Trends, 2000–2022; Food and Agriculture Organization of the United Nations (FAO): Rome, Italy, 2024. [Google Scholar]
- Han, G.; Liu, T. Exploring Green Grain Production Pathways: Evidence from Farmland and Agricultural Service Scale Operations in China. Front. Sustain. Food Syst. 2025, 9, 1557321. [Google Scholar] [CrossRef] [Scilit]
- Zhang, W.; Cao, G.; Li, X.; Zhang, H.; Wang, C.; Liu, Q.; Chen, X.; Cui, Z.; Shen, J.; Jiang, R.; et al. Closing Yield Gaps in China by Empowering Smallholder Farmers. Nature 2016, 537, 671–674. [Google Scholar] [CrossRef] [Scilit]
- Lal, R. Carbon Emission from Farm Operations. Environ. Int. 2004, 30, 981–990. [Google Scholar] [CrossRef] [Scilit]
- The Intergovernmental Panel on Climate Change (IPCC). 2006 IPCC Guidelines for National Greenhouse Gas Inventories; Institute for Global Environmental Strategies (IGES): Hayama, Japan, 2006. [Google Scholar]
- ISO 14040; Environmental Management—Life Cycle Assessment—Principles and Framework. International Organization for Standardization (ISO): Geneva, Switzerland, 2006.
- Wiedmann, T. A Review of Recent Multi-Region Input–Output Models Used for Consumption-Based Emission and Resource Accounting. Ecol. Econ. 2009, 69, 211–222. [Google Scholar] [CrossRef] [Scilit]
- Rochette, P.; Eriksen-Hamel, N.S. Chamber Measurements of Soil Nitrous Oxide Flux: Are Absolute Values Reliable? Soil Sci. Soc. Am. J. 2008, 72, 331–342. [Google Scholar] [CrossRef] [Scilit]
- The Intergovernmental Panel on Climate Change (IPCC). 2007 IPCC Guidelines for National Greenhouse Gas Inventories; Institute for Global Environmental Strategies (IGES): Hayama, Japan, 2007. [Google Scholar]
- Griffis, T.J.; Chen, Z.; Baker, J.M.; Wood, J.D.; Millet, D.B.; Lee, X.; Venterea, R.T.; Turner, P.A. Nitrous Oxide Emissions Are Enhanced in a Warmer and Wetter World. Proc. Natl. Acad. Sci. USA 2017, 114, 12081–12085. [Google Scholar] [CrossRef] [Scilit]
- Jia, M.; Lapen, D.R.; Su, D.; Mayer, K.U. Modeling of Dual-Permeability Gas and Solute Reactive Transport in Macroporous Agricultural Soils with a Focus on GHG Cycling and Emissions. J. Hydrol. 2023, 620, 129408. [Google Scholar] [CrossRef] [Scilit]
- Jia, M.; Lapen, D.R.; Su, D.; Mayer, K.U. Multi-Domain Reactive Transport Modeling of GHG Emissions From Macroporous Agricultural Soils With a Focus on N2O Hotspots and Hot Moments. WATER Resour. Res. 2025, 61, e2025WR040588. [Google Scholar] [CrossRef] [Scilit]
- Cheng, H.; Shu, K.; Zhu, T.; Wang, L.; Liu, X.; Cai, W.; Qi, Z.; Feng, S. Effects of Alternate Wetting and Drying Irrigation on Yield, Water and Nitrogen Use, and Greenhouse Gas Emissions in Rice Paddy Fields. J. Clean. Prod. 2022, 349, 131487. [Google Scholar] [CrossRef] [Scilit]
- Hillier, J.; Hawes, C.; Squire, G.; Hilton, A.; Wale, S.; Smith, P. The Carbon Footprints of Food Crop Production. Int. J. Agric. Sustain. 2009, 7, 107–118. [Google Scholar] [CrossRef] [Scilit]
- Grassini, P.; Cassman, K. High-Yield Maize with Large Net Energy Yield and Small Global Warming Intensity. Proc. Natl. Acad. Sci. USA 2012, 109, 1074–1079, Correction in Proc. Natl. Acad. Sci. USA 2012, 109, 4021. https://doi.org/10.1073/pnas.1201296109. [Google Scholar] [CrossRef] [Scilit]
- Gan, Y.; Liang, C.; Wang, X.; McConkey, B. Lowering Carbon Footprint of Durum Wheat by Diversifying Cropping Systems. Field Crops Res. 2011, 122, 199–206. [Google Scholar] [CrossRef] [Scilit]
- Cheng, K.; Pan, G.; Smith, P.; Luo, T.; Li, L.; Zheng, J.; Zhang, X.; Han, X.; Yan, M. Carbon Footprint of China’s Crop Production—An Estimation Using Agro-Statistics Data over 1993–2007. Agric. Ecosyst. Environ. 2011, 142, 231–237. [Google Scholar] [CrossRef] [Scilit]
- Xu, X.; Lan, Y. Spatial and Temporal Patterns of Carbon Footprints of Grain Crops in China. J. Clean. Prod. 2017, 146, 218–227. [Google Scholar] [CrossRef] [Scilit]
- Chen, X.; Ma, C.; Zhou, H.; Liu, Y.; Huang, X.; Wang, M.; Cai, Y.; Su, D.; Muneer, M.A.; Guo, M.; et al. Identifying the Main Crops and Key Factors Determining the Carbon Footprint of Crop Production in China, 2001–2018. Resour. Conserv. Recycl. 2021, 172, 105661. [Google Scholar] [CrossRef] [Scilit]
- Wang, X.; Chen, Y.; Chen, X.; He, R.; Guan, Y.; Gu, Y.; Chen, Y. Crop Production Pushes up Greenhouse Gases Emissions in China: Evidence from Carbon Footprint Analysis Based on National Statistics Data. Sustainability 2019, 11, 4931. [Google Scholar] [CrossRef] [Scilit]
- Liang, D.; Lu, X.; Zhuang, M.; Shi, G.; Hu, C.; Wang, S.; Hao, J. China’s Greenhouse Gas Emissions for Cropping Systems from 1978–2016. Sci. Data 2021, 8, 171, Correction in Sci. Data 2023, 10, 122. https://doi.org/10.1038/s41597-023-02027-z. [Google Scholar] [CrossRef] [Scilit]
- Xiao, X.; Hu, X.; Liu, Y.; Lu, C. Long-Term Annual Changes in Agricultural Carbon Footprints and Associated Driving Factors in China from 2000 to 2020. Agronomy 2025, 15, 453. [Google Scholar] [CrossRef] [Scilit]
- Zhang, W.; Dou, Z.; He, P.; Ju, X.; Powlson, D.; Chadwick, D.; Norse, D.; Lu, Y.; Zhang, Y.; Wu, L.; et al. New Technologies Reduce Greenhouse Gas Emissions from Nitrogenous Fertilizer in China. Proc. Natl. Acad. Sci. USA 2013, 110, 8375–8380. [Google Scholar] [CrossRef] [Scilit]
- Xue, J.-F. Dynamics of Carbon Footprint of Maize Production with Different Functional Units in Shanxi Province, China. Pak. J. Agri. Sci. 2018, 55, 489–496. [Google Scholar] [CrossRef] [Scilit]
- Liang, H.; Cheng, Z.; Zhao, R.; Wang, F.; Shi, H.; Li, Y.; Wang, Z.; Bai, L.; Wang, Y.; Zhang, J.; et al. Interannual Evolution Characteristics of the Carbon and Nitrogen Footprints of Maize Production in Inner Mongolia. Agronomy 2024, 14, 1273. [Google Scholar] [CrossRef] [Scilit]
- National Development and Reform Commission (NDRC). National Agricultural Product Cost and Income Data Compilation 2025; China Statistics Press: Beijing, China, 2025.
- National Bureau of Statistics of China (NBS). China Statistical Yearbook 2025; China Statistics Press: Beijing, China, 2025.
- Getis, A.; Ord, J.K. The Analysis of Spatial Association by Use of Distance Statistics. Geogr. Anal. 1992, 24, 189–206. [Google Scholar] [CrossRef] [Scilit]
- Anselin, L. Local Indicators of Spatial Association—LISA. Geogr. Anal. 1995, 27, 93–115. [Google Scholar] [CrossRef] [Scilit]
- Xue, J.-F.; Pu, C.; Liu, S.-L.; Zhao, X.; Zhang, R.; Chen, F.; Xiao, X.-P.; Zhang, H.-L. Carbon and Nitrogen Footprint of Double Rice Production in Southern China. Ecol. Indic. 2016, 64, 249–257. [Google Scholar] [CrossRef] [Scilit]
- Huang, W.; Wu, F.; Han, W.; Li, Q.; Han, Y.; Wang, G.; Feng, L.; Li, X.; Yang, B.; Lei, Y.; et al. Carbon Footprint of Cotton Production in China: Composition, Spatiotemporal Changes and Driving Factors. Sci. Total Environ. 2022, 821, 153407. [Google Scholar] [CrossRef] [Scilit]
- Ti, J.; Zheng, Y.; Duan, W.; Zhao, H.; Qin, Y.; Yin, G.; Xie, L.; Dong, W.; Lu, X.; Song, Z. Carbon Footprint of Tobacco Production in China through Life-Cycle-Assessment: Regional Compositions, Spatiotemporal Changes and Driving Factors. Ecol. Indic. 2024, 165, 112216. [Google Scholar] [CrossRef] [Scilit]
- Root, R. Organization of a Plant-Arthropod Association in Simple and Diverse Habitats: The Fauna of Collards (Brassica-Oleracea). Ecol. Monogr. 1973, 43, 95–120. [Google Scholar] [CrossRef] [Scilit]
- Cheng, K.; Yan, M.; Nayak, D.; Pan, G.X.; Smith, P.; Zheng, J.F.; Zheng, J.W. Carbon Footprint of Crop Production in China: An Analysis of National Statistics Data. J. Agric. Sci. 2015, 153, 422. [Google Scholar] [CrossRef] [Scilit]
- Feng, B.; Zhuo, L.; Mekonnen, M.M.; Marston, L.T.; Yang, X.; Xu, Z.; Liu, Y.; Wang, W.; Li, Z.; Li, M.; et al. Inputs for Staple Crop Production in China Drive Burden Shifting of Water and Carbon Footprints Transgressing Part of Provincial Planetary Boundaries. Water Res. 2022, 221, 118803. [Google Scholar] [CrossRef] [Scilit]
- Wen, Y.; Liu, J.; Dhital, Y.; Wu, X.; Song, L.; Zhu, Y.; Chen, P.; Li, W.; Wang, Z. Integrated Effects of Plastic Film Residues on Cotton Growth and Field Carbon Sequestration under Drip Irrigation in Arid Oasis Regions. Agric. Ecosyst. Environ. 2022, 339, 108131. [Google Scholar] [CrossRef] [Scilit]
- Liu, Y.; Gu, W.; Liu, B.; Zhang, C.; Wang, C.; Yang, Y.; Zhuang, M. Closing Greenhouse Gas Emission Gaps of Staple Crops in China. Environ. Sci. Technol. 2022, 56, 9302–9311. [Google Scholar] [CrossRef] [Scilit]
- Meng, F.; Chen, H.; Tan, Y.; Xiong, W. Changes in Crop Mix and the Effects on Agricultural Carbon Emissions in China. Int. J. Agric. Sustain. 2024, 22, 2335141. [Google Scholar] [CrossRef] [Scilit]
- Yang, Y.; Chang, W.; Jules, K.K. Re-Estimating China’s Cotton Green Production Efficiency with Climate Factors: An Empirical Analysis Using County-Level Panel Data from Xinjiang. Sustainability 2025, 17, 3379. [Google Scholar] [CrossRef] [Scilit]
- Chen, J.-S.; Li, H.-R.; Tian, Y.-G.; Deng, P.-P.; Oladele, O.P.; Bai, W.; Dang, Y.P.; Zhao, X.; Zhang, H.-L. Greenhouse Gas Emissions and Mitigation Potential of Crop Production in Northeast China. Eur. J. Agron. 2024, 161, 127371. [Google Scholar] [CrossRef] [Scilit]
- Wang, C.; Yu, Q.; Zhan, B.; Gao, P.; Guo, B.; Chu, Y.; Chen, Y.; Bian, P. Activity Quantification and Assessment of Recycled Concrete Powder Based on the Contributions of the Dilution Effect, Physical Effect and Chemical Effect. J. Clean. Prod. 2024, 442, 140918. [Google Scholar] [CrossRef] [Scilit]
- Cheng, H.; Wang, A.; Zhang, J.; Nong, X.; Jiang, X.; Wu, H.; Chen, Z.; Wang, M.; Cheng, J. Divergent Responses of Optimal Land and Water Allocation to Different Hydrological Regimes in the Agricultural Water-Food-Carbon Nexus System. J. Hydrol. 2025, 653, 132730. [Google Scholar] [CrossRef] [Scilit]
- Cheng, H.; Sun, S.; Jiang, W.; Yu, Q.; Ma, W.; Feng, S.; Wang, F.; Xu, Z. Identifying Agronomic Strategy for a Low-Carbon Economy Under the Effects of Climate Change by Using a Simulation-Optimization Hybrid Model. Agronomy 2025, 15, 1980. [Google Scholar] [CrossRef] [Scilit]
- Li, H.; Xu, Y.; Gao, W.; Cui, J.; Chen, Y. Carbon Budget of Diversified Cropping Systems in Southwestern China: Revealing Key Crop Categories and Influencing Factors under Different Classifications. Environ. Res. 2024, 255, 119189. [Google Scholar] [CrossRef] [Scilit]
- Li, J.; Yang, W.; Wang, Y.; Li, Q.; Liu, L.; Zhang, Z. Carbon Footprint and Driving Forces of Saline Agriculture in Coastally Reclaimed Areas of Eastern China: A Survey of Four Staple Crops. Sustainability 2018, 10, 928. [Google Scholar] [CrossRef] [Scilit]
- Su, C.; Wu, H.; Li, M.; Liu, Y.; Zhang, Y.; Zou, S. Spatiotemporal Carbon Footprints of Primary Grain Production in the Huaihe River Basin. Acta Sci. Circumst. 2025, 45, 452–462. [Google Scholar] [CrossRef]
- Han, Y.; Xi, W.; Xu, J.; Yao, G. Carbon Footprint of Main Grain Crop Production in Hubei and Jiangsu Provinces, 2005–2019. Sustainability 2024, 16, 6449. [Google Scholar] [CrossRef] [Scilit]
- Zhang, L.; Xu, X. Difference in Carbon Footprint between Single- and Double-Cropping Rice Production in China, 2003–2016. Environ. Sci. Pollut. Res. 2021, 28, 27308–27317. [Google Scholar] [CrossRef] [Scilit]
- Wu, X.; Fan, Y.; Bao, Y.; Wang, S. An Integrated Analysis for Spatio-Temporal Evolution of Food Water-Carbon-Energy Footprint and Its Sustainable Production in Northwest China. J. Environ. Manag. 2025, 373, 123754. [Google Scholar] [CrossRef] [Scilit]
- Cui, J.; Sui, P.; Wright, D.L.; Wang, D.; Sun, B.; Ran, M.; Shen, Y.; Li, C.; Chen, Y. Carbon Emission of Maize-Based Cropping Systems in the North China Plain. J. Clean. Prod. 2019, 213, 300–308. [Google Scholar] [CrossRef] [Scilit]
- Yan, M.; Cheng, K.; Luo, T.; Yan, Y.; Pan, G.; Rees, R.M. Carbon Footprint of Grain Crop Production in China—Based on Farm Survey Data. J. Clean. Prod. 2015, 104, 130–138. [Google Scholar] [CrossRef] [Scilit]
- Wang, H.; Yang, Y.; Zhang, X.; Tian, G. Carbon Footprint Analysis for Mechanization of Maize Production Based on Life Cycle Assessment: A Case Study in Jilin Province, China. Sustainability 2015, 7, 15772–15784. [Google Scholar] [CrossRef] [Scilit]
- Saeed, Q.; Niu, J.; Xu, J.; Mustafa, A.; Zhang, S.; Yang, X. Carbon Footprint of Major Wheat Growing Areas of Guanzhong Plain Shaanxi Province of China Based on Farm Survey Data: A Nitrogen Dilemma. Soil Use Manag. 2025, 41, e70105. [Google Scholar] [CrossRef] [Scilit]
- Ma, F.; He, M.; Li, Y.; Wang, Y.; Peng, Z.; Xu, Y.; Zhao, B.; Zhang, J. Peanut Oil Is More Environmentally Sustainable than Rapeseed Oil from a Carbon and Nitrogen Footprint Perspective in China. PeerJ 2025, 13, e19941. [Google Scholar] [CrossRef] [Scilit]
- Yao, J. Carbon and Nitrogen Footprint of Three Major Oil Crops in China: Composition, Spatial and Temporal Characteristics and Driving Factors Analysis. Master’s Thesis, Henan Agricultural University, Zhengzhou, China, 2023. [Google Scholar]
- He, S.; Chen, Y.; Xiang, W.; Chen, X.; Wang, X.; Chen, Y. Carbon and Nitrogen Footprints Accounting of Peanut and Peanut Oil Production in China. J. Clean. Prod. 2021, 291, 125964. [Google Scholar] [CrossRef] [Scilit]
- Li, Y.; Wu, W.; Yang, J.; Cheng, K.; Smith, P.; Sun, J.; Xu, X.; Yue, Q.; Pan, G. Exploring the Environmental Impact of Crop Production in China Using a Comprehensive Footprint Approach. Sci. Total Environ. 2022, 824, 153898. [Google Scholar] [CrossRef] [Scilit]
- Sun, X.; Qian, L.; Cao, Y.; Wang, M.; Li, N.; Pang, R.; Si, T.; Yu, X.; Zhang, X.; Zuza, E.J.; et al. Exploration of the Optimal Low-Carbon Peanut Rotation System in South China. Agric. Syst. 2024, 221, 104145. [Google Scholar] [CrossRef] [Scilit]
- Zhang, Q.; Hong, J.; Zhang, T.; Tian, X.; Geng, Y.; Chen, W.; Zhai, Y.; Liu, W.; Shen, X.; Bai, Y. Environmental Footprints of Soybean Production in China. Environ. Dev. Sustain. 2023, 25, 9047–9065. [Google Scholar] [CrossRef] [Scilit]
- Xu, Z.; Fu, Z.; Zhai, Z.; Yang, X.; Meng, F.; Feng, X.; Zhong, J.; Dai, Y.; Xu, W.; Cheng, J.; et al. Comparative Evaluation of Carbon Footprints between Rice and Potato Food Considering the Characteristic of Chinese Diet. J. Clean. Prod. 2020, 257, 120463. [Google Scholar] [CrossRef] [Scilit]
- Xu, Z.; Xu, W.; Peng, Z.; Yang, Q.; Zhang, Z. Effects of Different Functional Units on Carbon Footprint Values of Different Carbohydrate-Rich Foods in China. J. Clean. Prod. 2018, 198, 907–916. [Google Scholar] [CrossRef] [Scilit]
- Zhang, S.; Wang, X.; Awais, M. Carbon Flux Estimation for Potato Production: A Literature-Based Study. Atmosphere 2025, 16, 764. [Google Scholar] [CrossRef] [Scilit]
- Xie, Y.; Wu, Q.; He, T.; Que, Y.; Chen, R.; Chen, N.; Que, Y. Structure and Changing Trends of Carbon Footprint in Sugarcane. Environ. Res. Lett. 2025, 20, 064003. [Google Scholar] [CrossRef] [Scilit]
- Wang, X.; Feng, Y.; Yu, L.; Shu, Y.; Tan, F.; Gou, Y.; Luo, S.; Yang, W.; Li, Z.; Wang, J. Sugarcane/Soybean Intercropping with Reduced Nitrogen Input Improves Crop Productivity and Reduces Carbon Footprint in China. Sci. Total Environ. 2020, 719, 137517. [Google Scholar] [CrossRef] [Scilit]

Disclaimer/Publisher’s Note: The statements, opinions and data contained in all publications are solely those of the individual author(s) and contributor(s) and not of MDPI and/or the editor(s). MDPI and/or the editor(s) disclaim responsibility for any injury to people or property resulting from any ideas, methods, instructions or products referred to in the content. |
© 2026 by the authors. Licensee MDPI, Basel, Switzerland. This article is an open access article distributed under the terms and conditions of the Creative Commons Attribution (CC BY) license.