


Abstract
In the realm of precision agriculture, agricultural UAV path planning is challenging because the UAV must avoid obstacles, follow uneven terrain, and satisfy multiple flight constraints simultaneously. Differential evolution (DE) has been widely adopted for this problem because of its simple structure and effective optimization capability. However, existing DE-based methods often become trapped in local optima and cannot effectively balance exploration and exploitation in complex search environments. To address these issues, this paper proposes a reinforcement learning-based multi-strategy differential evolution algorithm, named PPOMSDE. By introducing Proximal Policy Optimization (PPO) to construct a multi-dimensional state pool and an action pool, PPOMSDE enables adaptive strategies for individuals, improving strategy selection during the search process. An independent multi-buffer is adopted to ensure strict data isolation and efficient learning to avoid strategy confusion. In addition, an adaptive triplet mechanism which partitions the population into fitness-based tiers (best, medium, and worst) assigns different control parameters and mutation strategies to individuals with different fitness levels, improving the balance between global exploration and local exploitation. Extensive experiments on the CEC’2014 and CEC’2017 benchmark suites demonstrate the effectiveness of PPOMSDE. The proposed method achieves the lowest average performance ranks of 1.39 on the combined 10-D and 30-D CEC’2014 benchmarks and 1.03 on the 10-D CEC’2017 benchmarks. In agricultural UAV path planning, PPOMSDE generates safer and smoother flight paths while maintaining accurate terrain-following flight, reducing the overall cost by an average of 22.42% compared with ISDE, L-SHADE, SHADE, and ISHACDE.
1. Introduction
UAV has witnessed widespread deployment across a multitude of domains, such as image information acquisition [1], ecological anomaly detection [2], agricultural ground platform navigation [3], and ground cover recognition [4], due to its high flexibility and strong adaptability. Driven by the advancements in modern industry and technological frontiers, computational models in practical UAV applications commonly display characteristics such as high dimensionality, nonlinearity, and complex constraints. Among these problems, UAV path planning is a classic challenging optimization task [5]. UAV path planning aims to find an efficient path from the start point to the destination while avoiding threat regions under physical constraints [6].
Specifically, in agricultural applications, this task is challenging because of complex 3D terrain and strict operational constraints [7]. During practical field operations, agricultural UAVs must safely bypass various hazards in a three-dimensional environment. Meanwhile, they must maintain the overall cost-effectiveness and efficiency of the planned flight trajectory [8]. As agricultural mission profiles become increasingly elaborate and the operational scope broadens, the corresponding search space undergoes an exponential explosion, triggering a substantial escalation in computational overhead [9]. As a result, finding the global optimum in these complex high-dimensional environments remains challenging. This limits the search efficiency and optimization performance of existing algorithms [10].
Traditional methods for agricultural UAV, such as A*, D*, and Rapidly Exploring Random Tree Star (RRT*), show good performance in low-dimensional environments [11]. However, in environments with dense obstacles and complex fitness landscapes, these methods can easily become trapped in local optima. Meanwhile, metaheuristic algorithms, exemplified by DE, Genetic Algorithm (GA), and Particle Swarm Optimization (PSO), mimic natural selection mechanisms or swarm intelligence. They demonstrate strong global search ability and adaptability in solving nonlinear path planning problems with multiple constraints [12]. Among them, the DE algorithm has been extensively studied owing to its uncomplicated design and reliable execution [13].
However, practical agricultural environments are much more complex than idealized optimization scenarios. Varying canopy density, irregular crop distributions, and different obstacles continuously alter the optimization landscape during UAV path planning. These factors produce highly multimodal and non-stationary search spaces, where the balance between exploration and exploitation becomes difficult to maintain. Conventional DE algorithms usually rely on fixed or manually designed mutation strategies. Once the population diversity decreases, they tend to converge prematurely to local optima and cannot adapt their search behavior according to the current evolutionary state. Consequently, their optimization performance deteriorates in complicated agricultural scenarios. These limitations have motivated extensive research on improving the adaptability of DE for UAV path planning. Recent investigations on solving UAV path planning problems based on DE can be summarized into three categories: hybrid mechanisms, parameter adaptation, and reinforcement learning (RL).
Methods based on hybrid mechanisms enhance path search ability by introducing other algorithm frameworks into the mutation strategies of DE. For example, Tu et al. integrate DE into the iterative process of the marine predators algorithm [14]; Huang et al. introduce a challenger mechanism based on DE operators into PSO for path optimization [15]; Yu et al. integrate DE and gray wolf optimizer to harmonize local exploitation and global exploration [16]; and Zhao et al. merge DE and gradient descent into the artificial hummingbird algorithm for route generation [17]. The operator combination and mutation logic of these algorithms are usually based on predefined heuristic rules. Such combinations of heuristic methods can perform well on specific problems. However, when facing extremely complex terrains, the lack of real-time quantitative perception of the population evolutionary state leads to imprecise strategy switching and unstable performance.
Methods based on parameter adaptation use historical information to dynamically tune key control settings. Cao et al. analyze population distribution characteristics and extracts parameter information to guide the optimization process [18]. Zhou et al. adopt a multi-stage parameter adaptation mechanism to capture evolutionary features in different dimensions and apply targeted strategies [19]. Freitas et al. directly generate smooth and differentiable paths using parameterized non-uniform rational B-spline curves [20]. However, these parameter adaptation methods mainly rely on the statistical memory of historical samples. Such simple feedback mechanisms cannot accurately capture fine-grained changes in the fitness distribution, such as skewness and kurtosis. Applying the same parameter adaptation rules to individuals in different states makes it difficult to provide refined support, especially in the later stage of complex optimization. In addition, these methods are typically designed using manually defined heuristic update rules. As a result, their decision process is difficult to generalize to dynamic optimization environments, limiting their ability to adapt to rapidly changing population states.
The third category focuses on intelligent planning frameworks based on RL. Currently, combining RL with evolutionary algorithms has become a popular research direction. Examples include the Q-learning-based multi-strategy cuckoo search algorithm [21], a dendrite net learning multi-objective artificial bee colony algorithm [22] and an online-learning metaheuristic algorithm integrated with a PPO mechanism [23]. For the DE algorithm, researchers have also attempted to introduce RL or hybrid mechanisms to achieve automated algorithm design. Yu et al. use RL to evaluate generated offspring and compare them with their parents, enabling adaptive parameter adjustment [24]. Zhang et al. adopt an RL strategy according to a multi-armed bandit framework to adaptively allocate mutation operators, enhancing solution precision while safeguarding population diversity [25]. Ding et al. proposed a distributed PPO framework for the joint adaptation of mutation strategies and control parameters [26]. In the domain of path planning, Reda et al. utilized Deep Q-Networks (DQN) to dynamically switch DE operators, combining this with external cubic spline interpolation to generate smooth trajectories [27]. However, most existing RL-assisted frameworks mainly regulate population-level information or act directly on specific problem instances. As a result, the evolutionary trajectory of each individual is not clearly captured. This limitation makes it difficult to coordinate population diversity with convergence speed effectively. Furthermore, they often adopt fully coupled online-learning paradigms that lead to unstable training, and lack the fine-grained spatial perception required for highly complex 3D environments.
This paper presents an RL-based multi-strategy differential evolution algorithm, named PPOMSDE. PPOMSDE utilizes PPO from deep reinforcement learning (DRL) to construct a multi-dimensional state pool by extracting the spatial positions and fitness values of the population. This construction effectively resolves the problem of insufficient complex state perception and enhances the capability of the proposed model to perceive the current optimization environment. Multiple improvement strategies are designed to enhance the performance of optimization. Moreover, an independent experience buffer for each individual is introduced to guarantee data isolation. Building upon these foundations, the PPOMSDE algorithm uses a triplet mechanism to complement the automated algorithm design within reinforcement learning, achieving both global dynamic perturbation and localized refinement throughout the optimization procedure. Extensive experiments on benchmarks and agricultural UAV path planning validate PPOMSDE’s higher solution quality and robustness. The main contributions of this work are encapsulated below:
- The PPO algorithm from RL is introduced into DE, enabling a framework for the automated design of algorithmic mechanics. This approach exploits the policy-learning capability of PPO, endowing the DE algorithm with the capacity to autonomously select optimal mutation operators in response to real-time evolutionary states.
- Multi-dimensional state and action pools are designed. Multi-dimensional features, including fitness skewness, kurtosis, and local neighborhood distribution, are introduced to enhance state perception. Additionally, an external archive mechanism is utilized to improve the effectiveness of mutation actions.
- PPOMSDE is compared with seven DE variants and two basic evolutionary algorithms benchmarked against the CEC‘2014, CEC’2017, and agricultural UAV path planning evaluation suites to demonstrate its operational excellence in practical settings.
The remainder of this paper is organized as follows: Section 2 details the problem of agricultural UAV path planning, along with overviews of DE and PPO. Section 3 introduces the proposed PPOMSDE algorithm. Section 4 provides a comprehensive evaluation of PPOMSDE on the CEC’2014 and CEC’2017 benchmark suites, as well as in diverse agricultural UAV path-planning scenarios. Finally, Section 5 concludes the paper.
2. Preliminaries
2.1. Problem Description
2.1.1. Route Representation
In UAV path planning, the spatial locations of every flight node on path are defined as . For a full flight path containing n path points, the path is mathematically formulated as:
Within the evolutionary framework, every candidate solution corresponds to an entire flight route. During the initialization phase, these candidate solutions are generated entirely at random within the predefined operational boundaries. Such infeasible paths are naturally penalized through the cost evaluation mechanism during the evolutionary process. Throughout this study, the UAV trajectory is parameterized in a reduced-dimensional form. By using equal intervals along the x-axis, monotonicity in the x-direction is ensured, thereby simplifying the 3D path search to a two-dimensional optimization problem.
Under this encoding scheme, has a clear physical meaning: the first half controls the horizontal shifting of routing, while the second half governs the climbing profile. The representation is defined below:
Although the optimization is performed in a two-dimensional search space, each candidate solution is reconstructed into a three-dimensional path during fitness evaluation, ensuring that all constraints are evaluated in the original 3D environment.
2.1.2. Objective Function
Agricultural UAV path planning seeks to identify a minimum-cost route within a given region. Considering the UAV physical limits and complex terrain, restrictions on vertical height limits, minimal interval distance, and navigational orientation are imposed. A composite objective function is adopted to measure the computational performance. Specifically, it includes path length penalty, threat cost penalty, height cost penalty, and path smoothness penalty [28]. The path length cost penalty is defined by:
where is the waypoint of the path, and computes the direct spatial gap separating consecutive coordinates. To evaluate the navigational risk, the hazard cost is established by the following expression:
where is the total count of threat regions, is the vector two adjacent navigational coordinates and , and denotes the safety evaluation function, which computes the cost based on the direct spatial separation between the two path points. The formulation is given as follows:
where is the radius of the collision zone of the threat, is the radial distance from the collision center to the boundary of the risk zone, and is the collision penalty. For the UAV, the collision zone is defined as a no-fly region that must be strictly avoided, while the risk zone represents a buffer region indicating potential threat exposure. is the UAV diameter, which is used to evaluate the positional dynamics between the UAV and the threat margins.
To ensure flight safety and maintain an ideal altitude, three uniformly distributed sampling points are generated along each flight segment j to evaluate terrain variations. The altitude cost of each segment is calculated as the average penalty of these three sampling points. In this study, the use of three sampling points represents a compromise between computational efficiency and evaluation accuracy. The sampling density is a configurable parameter rather than an inherent limitation of the proposed method. For terrains with sharper elevation variations, additional sampling points can be introduced to improve terrain-clearance assessment without changing the PPOMSDE optimization framework. The path height cost is established by:
where is the penalty function, and represents the actual relative altitude above ground at the sampling point of the flight segment:
where denotes the actual elevation from the underlying Digital Elevation Model (DEM) at that coordinate. To strictly penalize flight operations outside of the safe altitude range, the penalty function is defined in a dynamic gradient form:
where and represent the minimum safe altitude and the maximum effective altitude, respectively, while denotes the ideal relative altitude. is the base penalty for boundary violations, and is the gradient penalty coefficient. This mechanism guides the UAV to maintain a stable mean altitude inside the allowable limits. The path smoothing cost is calculated using the following expression:
where and are the horizontal heading change and vertical climb angle of the UAV, respectively. The formulations are given as follows:
where and denote the projections of two consecutive flight segments onto the horizontal x-y plane, respectively. Thus, by combining the four costs above, the total cost is defined as:
where is the weighting coefficient for the cost terms.
2.2. Differential Evolution
The DE optimizer applies a fixed mutation strategy in each iteration to optimize the problem. Generally, the framework of a standard DE comprises a sequence of four fundamental operations: initialization, followed by iterative cycles of mutation, crossover, and selection [29]. These procedures are elaborated as follows:
- (1)
- Initialization:
To launch the optimization process, a population is initially generated via a uniform distribution, ensuring that candidate solutions are scattered comprehensively across the predefined search boundaries. Mathematically, the candidate solution takes the form of a vector:
where signifies the problem dimension of the candidate. The specific initialization method is as follows:
where is the dimension of , and are the supremum and infimum limits of the positional parameter, and signifies a random value drawn uniformly from within .
- (2)
- Mutation:
In this step, a new mutant vector is constructed by applying scaled differences between selected individuals to a specific target vector, as dictated by the chosen evolutionary strategy. Frequently employed mutation schemes include the following:
- DE/rand/1
- DE/best/1
- DE/best/2
- DE/current-to-best/1
- DE/rand-to-best/1
- DE/current-to-rand/1
- (3)
- Crossover:
The trial vector is synthesized by swapping elements between the corresponding present candidate and perturbed vector . The crossover procedure is expressed as:
where denotes the positional parameter of the trial solution during generation , denotes the dimension of the individual, and is the element belonging to the mutant vector. Meanwhile, stands as a stochastic integer chosen from , incorporated to guarantee the transfer of a minimum of one component from the mutant solution. The rate at which variables are accepted from the mutated entity is determined by , a stochastic control parameter defined within . After binomial crossover, each trial vector component is clipped to its corresponding lower or upper bound when a boundary violation occurs.
- (4)
- Selection:
The objective scores of both the target entity and the recently produced trial vector undergo evaluation, whereupon the superior performer is retained for the succeeding iteration. According to the following criterion:
where denotes the candidate at the iteration, and denotes the trial vector of the candidate in the iteration.
2.3. Proximal Policy Optimization
RL has been integrated into global optimization problems and has demonstrated strong potential for automatically composing metaheuristic algorithms [30]. PPO is a policy-based DRL method. The agent continuously improves its decision-making through policy learning. As a result, the agent gradually converges to the optimal solution in complex optimization tasks. Specifically, PPO combines the advantages of the stochastic policy and the value baseline. The policy function generates actions and traverses the environment, while the value function quantifies the cumulative reward expectation under the current policy. In this framework, the actor network selects actions that maximize the expected return, and the critic network estimates the corresponding state value to provide guidance for policy updates.
Within the Markov decision process (MDP) framework [31], the PPO agent learns through continuous interaction with the environment. At each algorithmic iteration, state, action, reward, and the corresponding log probability of the action are stored in an experience buffer. This buffer records complete interaction trajectories and provides data for subsequent batch updates, thereby improving sample efficiency and reducing training variance.
During policy optimization, PPO introduces a clipping mechanism to constrain the update magnitude, preventing excessive policy changes and improving training stability and convergence. All sampled data are extracted from the experience buffer and aggregated to compute the Return and Advantage, which are used to construct batch training samples, for multiple iterations of updating the policy and value networks.
Finally, the model parameters are updated by optimizing the overall loss function of PPO, which is prescribed below:
where denotes the surrogate clipping objective, evaluates the state-value estimation error, and serves as the entropy regularization term. and are hyperparameters that regulate the significance of individual loss components. The clipped policy loss is formulated as:
where is the policy update ratio, is the advantage function, and represents a hyperparameter designed to bound the magnitude of the policy updates. The policy update ratio is defined as follows:
where and signify the conditional probabilities of executing action at state for the new and old policies, respectively. The advantage function is defined as follows:
where represents the value estimation for executing action in state , and is the value at . Consequently, the loss function for the value network , is formulated as follows:
where is the state value function, and is the target value. After computing the total loss function , the parameters of the policy and value networks are updated via backpropagation (BP). This alternating process of experience collection and policy refinement iterates until the maximum training iterations are fulfilled, after which the final optimized network architecture is retained for deployment.
3. The Proposed PPOMSDE
This section introduces the overall framework and core components of the proposed algorithm. Several RL algorithms, such as DQN [32], Advantage Actor–Critic (A2C) [33], and Soft Actor–Critic (SAC) [34], have been successfully applied to sequential decision-making problems. However, their characteristics differ in terms of policy optimization and training stability. DQN is a value-based method designed for discrete action spaces, but its performance may deteriorate in highly non-stationary environments due to Q-value overestimation and unstable learning. A2C improves learning efficiency through an actor–critic architecture, but unconstrained policy updates may lead to oscillatory convergence. SAC is mainly designed for continuous action spaces and introduces entropy regularization to improve exploration, resulting in additional computational overhead.
In contrast, PPO employs a clipped surrogate objective to restrict policy updates, thereby improving training stability while maintaining implementation simplicity. Since the proposed framework formulates mutation strategy selection as a discrete decision problem under continuously changing population states, stable policy optimization is more important than aggressive policy updates. Therefore, PPO provides a suitable balance between stability, learning efficiency, and computational cost, making it an appropriate choice for adaptive mutation strategy selection in the proposed PPOMSDE framework.
Figure 1a presents the overall framework of PPOMSDE. The proposed algorithm starts with the initialization of the neural network architectures and control parameters. During the training phase, the framework iteratively performs trajectory sampling to collect interaction data. These data are utilized to compute the advantage function and the expected return, which subsequently drive the gradient-based updates for the actor and critic networks. Following the update, the experience buffers are cleared to ensure fresh data collection for the next epoch. After the algorithm model has been trained, it can be used in the testing phase to solve actual optimization problems.
Figure 1.
The overall framework of PPOMSDE. (a) presents the overall flowchart; (b) details the data sample mechanism of training phase; (c) denotes the test phase.
Figure 1b details the data sample mechanism, which facilitates the interaction between the RL agent and the population evolution process. After initializing the population, a comprehensive state is extracted from the states features for each individual at generation . The critic network processes the state to output a value estimate, representing the expected cumulative reward. Simultaneously, the actor network maps the state to a probability distribution over the actions pool, and outputs a specific action . The predefined action pool is composed of multiple DE variation operators, and parameter adaptation is also introduced to enhance the performance of actions. Each individual generates a mutant vector when performing its action in the environment module, and then obtains a new population through crossover and selection operators. This process will also return rewards and terminal indicator . All interaction results are stored in a multi-buffer system, where separate buffers correspond to different individuals, ensuring a diverse set of trajectories for PPOMSDE optimization. The process will continuously cycle and store trajectories, until the maximum number of iterations is reached. The population will be initialized and the above loop will be repeated. After a predefined number of episodes, the data collection phase will proceed to the network optimization phase.
As shown in Figure 1c, the test phase begins with population initialization, establishing the starting candidate solutions in the search space. At each generation , a state vector is extracted for the individual through the states features module. The pre-trained actor network processes the state to select the most suitable strategy from the actions pool. The actions in the action pool during the testing phase are jointly influenced by the triplet mechanism and parameter adaptation. In the environment module, individuals generate mutant vectors by using the selected actions. Through crossover and selection operators, a new population is generated for the next generation. Once the condition is satisfied, the test process is terminated and the solution of the current optimization problem is output. The main modules of the proposed algorithm are explained as follows.
3.1. Parameter Adaptation Scheme
Based on the effects of the diverse settings of and on the exploitation and exploration of the DE algorithm, PPOMSDE builds on the parameter adaptation mechanism [35]. It restricts the generation range of at different stages to balance the progress of exploitation and exploration. The specific procedure proceeds as:
where and denote the mutation scaling factor and crossover rate generated for the individual at the current iteration . and denote values chosen randomly from the historical memory pools and . Both repositories share a uniform capacity and are designated to record the historical average parameters ( and ). and denote random variables sampled from the Cauchy and normal distributions, respectively. The threshold separates the two evolutionary stages of . and are the standard deviations.
During the crossover process, determines the proportion of genes that the offspring inherits from the mutant individual. In the early stage, is restricted within the range of 0.6 to 1. This means that the offspring inherits more features from the mutant individual. It helps the algorithm perform a wide search in the optimization landscape and averts the phenomenon of premature convergence. In the later stage, is not restricted. This allows the offspring to retain more advantageous genes from the parent. As a result, the algorithm performs a more refined local search around promising regions and improves convergence accuracy.
In this study, the generation range of F is not as restricted as that of CR. Instead, based on the experimental results reported in [36], the parameters are set as and . These values have been proven to be effective with support from extensive experimental data. In addition, more constraints are introduced later to match different values and roles of under different individual positions.
To effectively utilize fitness deviation, the hierarchical weighting mechanism proposed in hierarchically controlled differential evolution [37] is adopted. According to the following expression, the weight of each individual is calculated based on its normalized deviation:
where signifies the weight assigned to the individual at generation . corresponds to the objective value of the individual, and is the average objective value of the current population. The specific calculation is expressed as:
The parameter adaptation scheme dictates that solutions outperforming the mean fitness receive elevated weighting factors. Conversely, individuals exhibiting minor fitness deviations are assigned diminished importance. All weights are strictly normalized to 1. Therefore, better-performing members have a greater likelihood of being chosen to contribute to the next evolutionary cycle. The detailed generation process is as follows:
where denotes the weighted Lehmer mean. and represent the sets of successful scaling factors and crossover rates recorded in the current generation. and indicate the number of elements within these successful sets, while and correspond to the successful parameter value. Lastly, and denote the updated historical memory values for the step.
3.2. State Representation
The state features formulated in this research are classified into three primary categories: The first category aims to describe the global distribution of the population and the fitness distribution. It captures the dynamic differences during episodes of premature convergence or subsequent evasion of sub-optimal traps. It reflects the global diversity across the swarm. The second category focuses on the search dynamics of individuals and their relative positions in the population. It is used to evaluate the effectiveness of individual improvement. The third category describes the overall evolutionary progress of the algorithm or the duration of stagnation. These three types of features work together. They provide a basis for strategy selection under different evolutionary states. The state composition is as follows:
where denotes the state of the individual at the iteration. represent the 11 features designed in this study, which collectively constitute the state vector. The specific feature configurations and their associated parameters are detailed in Table 1 and Table 2. To provide comprehensive state perception, the proposed features are organized into three complementary categories: population distribution and fitness landscape (, , , , ), individual evolutionary status (, , , ), and evolution progress and stagnation (, ). These three categories describe the optimization process from the perspectives of the global population, individual behavior, and temporal evolution, enabling the PPO agent to perceive the current search state comprehensively and select appropriate mutation strategies.
Table 1.
Designed state feature vector.
Table 2.
Symbols utilized to formulate the characteristics presented in Table 1.
The first category describes the global characteristics of the population and the fitness landscape. Global diversity and local diversity indicate whether the population is widely exploring the search space or gradually converging. Standard deviation , skewness , and kurtosis characterize the statistical properties of the fitness distribution from different perspectives. Together, these features describe the dispersion, asymmetry, and concentration of the population, allowing the agent to better estimate the current search landscape and adjust the exploration intensity accordingly.
The second category focuses on the evolutionary status of each individual. Relative improvement measures the optimization gain obtained after the previous action and provides direct feedback on the effectiveness of the selected mutation strategy. The quartile-based fitness deviations (, ) describe the relative position of an individual within the current population. They enable the agent to distinguish high-quality, average, and inferior individuals, thereby supporting differentiated strategy selection for individuals with different evolutionary states.
The third category provides temporal information about the optimization process. Stop time records the number of consecutive generations during which an individual has not improved, making it an effective indicator of local stagnation. Search stage represents the current progress of the optimization process. Together, these two features allow the agent to consider both the local search status and the global evolutionary stage. As a result, the policy can encourage stronger exploration for stagnant individuals while gradually shifting from global exploration to local exploitation as the optimization proceeds.
Since the state variables are derived from different cost terms and statistical indicators, their numerical ranges may vary significantly. To eliminate the influence of different scales, all extracted state features are standardized before being input into the PPO network. Specifically, for each individual, the 11 state features are standardized independently using the mean and standard deviation calculated from its own state vector. This individual-wise standardization transforms each state vector to have zero mean and unit variance before it is input into the PPO network. It ensures that each feature has a comparable numerical scale, preventing features with larger magnitudes from dominating the policy learning process and improving the stability of network training. By integrating these three types of features, the agent can fully perceive the evolutionary state from multiple dimensions. It can then accurately identify and select the most appropriate search strategy.
3.3. Action and Triplet Mechanism
The actions are represented as different mutation operations in the proposed algorithm. During the training phase, the mathematical formulas of each action operator are provided in Table 3. Within Table 3, represents a candidate solution drawn from the best-performing individuals in the present iteration. identifies a vector randomly drawn from the population. is a vector arbitrarily drawn within the combined collection . represents the swarm at the generation, and the individuals eliminated in the ongoing generation are systematically archived within . is designed to counteract intense selection pressure, ensuring that promising individuals are not prematurely discarded from the evolutionary process. Consequently, this mechanism serves to preserve essential population diversity for subsequent evolutionary phases. The capacity of is , where denotes a hyperparameter. When the size of exceeds its maximum capacity, individuals in are randomly removed to keep its size within the limit. This random replacement maintains a diverse collection of historical search directions and prevents the archive from becoming dominated by highly similar elite solutions, thereby improving the diversity of mutation vectors throughout the evolutionary process.
Table 3.
Designed mutation operators.
During the test phase, this study introduces a triplet mechanism inspired by the Triple Competitive DE (TCDE) proposed by Yang et al. [38]. Unlike TCDE, which strictly fixes the mutation strategy for each individual based on its assigned tier, PPOMSDE leverages this grouping mechanism with a distinctly different execution logic. In this study framework, the mutation strategies are dynamically selected by the PPO agent, and the triplet mechanism is applied merely to modify specific components of these chosen strategies. Specifically, it substitutes targeted reference vectors within the selected mutation equation based on the individual’s group to better guide the evolutionary direction. This integration ensures that the algorithm benefits from hierarchical parameter control while fully maintaining the adaptive flexibility of reinforcement learning-based strategy selection.
First, the population is randomly partitioned into triplets. If the population is not divided exactly into triplets, the remaining individuals will be directly retained in the next population. Dictated by the fitness evaluations of individuals, they are defined as , the medium individual , and the worst individual . Then, according to the number of triplets, three groups of scaling factors and crossover rates values are synthesized iteratively based on the parameter adaptation method in Section 3.1. The parameters within each group are sorted. The smallest values are assigned to , the middle values are assigned to , and the largest values are assigned to . This hierarchical parameter control mechanism enables differentiated search behaviors. The high-quality individual is assigned smaller values of and . It performs fine-grained search in its neighborhood and enhances local exploitation. In contrast, the inferior individual is assigned larger parameter values. The detailed triplet mechanism is shown in Figure 2. It uses larger step sizes to expand the search range and improve global exploration. This layered mechanism aims to coordinate exploration and exploitation. It avoids destroying the existing solution structure of high-quality individuals due to excessive perturbation. At the same time, it encourages inferior individuals to evade premature convergence. As a result, it improves the overall search efficiency and convergence performance.
Figure 2.
The framework of triplet mechanism.
For the high-quality individual , a more fine-grained search is required to enhance local exploitation. In addition to generating relatively small values of and , a coefficient is introduced to parameters . This prevents the solution structure from being damaged by excessive perturbation. The specific operations are detailed in Table 4. In Table 4, is the individual classified as within the triplet, and is the parameter assigned to .
Table 4.
Modified action pool.
For the medium individual , the definition of is modified to . This aims to guide it toward high-quality regions by learning from better individuals. The specific operations are detailed in Table 5. In Table 5, is the individual classified as within the triplet, and is the parameter assigned to . denotes the individual relative to within the triplet.
Table 5.
Modified action pool.
For the inferior individual , based on redefining , the definition of is further modified to . In this way, it learns from better individuals within the triplet and is guided to evolve toward more promising directions. The specific operations are detailed in Table 6. In Table 6, is the individual classified as within the triplet, and is the parameter assigned to . denotes the individual relative to within the triplet.
Table 6.
Modified action pool.
During the evaluation of each triplet, if a trial vector successfully outperforms its corresponding parent (whether it is classified as , or ), the eliminated parent is temporarily recorded in a generational archive list. Once all triplets in the population have completed their mutation, crossover, and selection operations for the current generation , this temporary list is merged into the global external archive . To maintain computational efficiency and prevent excessive accumulation of outdated solutions, the maximum capacity of is restricted to . If the size of the merged archive exceeds this predefined threshold, individuals within are randomly removed to meet the constraint. The solutions preserved in are subsequently utilized in the mutation actions, which continuously injects historical diversity into the search process and significantly assists the triplets in escaping local optima.
Notably, the triplet mechanism is intentionally excluded from the PPOMSDE training phase to maintain a stationary MDP. If the dynamic grouping of the triplet mechanism were active during training, the environmental dynamics would become highly non-stationary. Specifically, the reward of an individual would be heavily coupled not only with its selected action but also with its randomly assigned group role (, , ) and the corresponding parameter perturbations. This coupling prevents the PPOMSDE agent from accurately evaluating the true value of its policy decisions, leading to high variance and unstable training. To address this, a decoupled paradigm of stable training and dynamic deployment is adopted. During the training phase, a unified and unperturbed environment is utilized to ensure that the agent learns a robust and unbiased baseline mapping from state features to mutation strategies. In the testing phase, the triplet mechanism is introduced as a deterministic heuristic booster, similar to test-time augmentation (TTA). It dynamically refines the selected actions and allocates targeted parameters based on the current population hierarchy.
The triplet mechanism works independently of the PPO policy. It does not change the mutation strategy selected by the PPO agent; rather, it adjusts the control parameters according to the fitness level of each individual. Inferior individuals are encouraged to explore a larger search region, while superior individuals focus on local refinement. As a result, the PPO framework provides adaptive strategy selection, and the triplet mechanism further improves the execution of these strategies. Their combination enhances the balance between exploration and exploitation, helping the algorithm escape local optima and achieve more stable convergence.
3.4. Reward Design
The reward mechanism is vital for the agent to evaluate action efficacy in RL. Following the state and action space definitions, new individuals are generated via evolutionary operations. In the proposed algorithm, the reward is quantified based on the objective value enhancement exhibited by the active candidate relative to the initial fitness . Specifically, the reward function captures the incremental improvement over the starting fitness value, formulated as follows:
To improve the stability of PPO training across optimization problems with significantly different fitness scales, the reward is first normalized using the initial best fitness. This normalization provides a consistent reward scale across different optimization problems and prevents the reward magnitude from varying substantially among benchmark functions. However, since the reward is computed for each individual, many individuals have fitness values much larger than the initial best fitness, especially during the early stage of evolution. As a result, the normalized reward may become an excessively large negative value. PPO is sensitive to such extreme reward signals because they produce large advantage estimates, which can dominate policy updates and increase gradient variance. Therefore, the normalized reward is further clipped to the interval . This clipping prevents abnormal reward values from overwhelming the learning process and improves the stability of policy optimization. Although clipping compresses the reward magnitude, PPO updates are based on the estimated advantage rather than the immediate reward alone. Therefore, the policy can still distinguish different optimization behaviors through accumulated returns while maintaining stable learning performance.
3.5. Multi-Buffer Training Mechanism
In the standard PPO algorithm, a single buffer cannot distinguish the features and rewards of individuals. At each iteration, the environment outputs the features, actions, and rewards of all individuals. When multiple individuals are stored in the buffer within the same time step, they may be incorrectly assigned a sequential temporal order due to the storage process. Therefore, the PPO network is required to allocate and maintain an independent buffer for each individual in the population [39]. This study constructs a multiple buffer set to provide a data-isolated learning environment for each individual. Although crossover combines genetic information from multiple individuals, the generated transition is always assigned to the target individual because the state observation, action selection, reward evaluation, and state transition are all defined with respect to the same decision-making subject. Therefore, crossover only affects the evolutionary search process and does not cause experience mixing among different buffers. The structure of the buffer is defined as . The detailed meanings of these components are shown in Table 7.
Table 7.
Buffer structure composition.
In this study, the complete evolutionary process from population initialization to reaching the predefined evaluation threshold is defined as one training episode. Within each episode, the current policy network with old parameters interacts sequentially with different environments to obtain stable experience data sequences. After completing training episodes, the algorithm independently extracts the trajectory from each buffer. The network parameters are then sequentially updated for each individual. During the evolutionary progression, interaction data (states, actions, rewards) is recorded independently into isolated buffers, preventing temporal crossover between different individuals. Once episodes are completed, the algorithm enters the optimization phase, where it sequentially extracts the temporal trajectory from each buffer to perform gradient descent on the actor and critic networks. Upon completing the sequential updates across all individuals, a global synchronization is executed: the parameters of the old policy network are updated to match the newly optimized policy network . Immediately following this parameter synchronization, all individual buffers are explicitly cleared simultaneously. This update procedure ensures that the subsequent episodes will strictly collect fresh trajectories driven by the updated policy, thereby maintaining a stable and unbiased advantage estimation.
The model weights undergo successive refinement by driving down the aggregate objective function sequentially for each individual buffer. Benefiting from the multi-buffer structure, the updating process can extract the experience trajectories of individuals independently. This mechanism enables the algorithm to obtain diverse training samples within a single optimization cycle and effectively avoids over fitting caused by sample correlation. For the individual, the raw cumulative discounted return at time step is calculated via Monte Carlo estimation based on its independent evolutionary trajectory:
where is the terminal step of the individual’s trajectory, and is the discount factor. Functionally, γ controls the contribution of future rewards to the cumulative return, balancing short-term improvements and long-term optimization. The parameter is a summation index representing the future time-step offset relative to the current step . It dictates the exponential decay factor applied to the future rewards . This decay mechanism, implemented via Monte Carlo return estimation, ensures that immediate fitness improvements are prioritized over distant future outcomes in the agent’s state-value evaluation. To reduce variance and stabilize the sequential training process, the returns are standardized locally within the individual’s specific trajectory:
where is the standardized cumulative discounted return, and denote the expected value and statistical dispersion regarding the raw reward signals specific to the individual, while acts as a numerical stabilizer to avoid zero denominators. The advantage function for the individual is then computed as:
where is the value estimated by the critic network at state . Therefore, during the policy update phase, the formulation of clipped surrogate objective in the total loss , optimized exclusively for the individual, is redefined as:
where is the expectation over the temporal trajectory of the single individual. The policy update ratio in the buffer is expressed as:
where and indicate the likelihoods of executing maneuver given the updated and baseline strategies at state , respectively. Upon deriving the aggregate loss for the individual, gradient descent via BP is employed to concurrently update the trainable parameters of both the actor and critic architectures for optimization epochs. After completing the updates for all individuals sequentially, the old policy network parameters are synchronized to prepare for the next evolutionary cycle.
4. Experimental Results
4.1. Experimental Setup
To evaluate the proposed method, comprehensive simulation studies are conducted to assess the optimization performance of PPOMSDE. To provide a thorough evaluation, PPOMSDE is benchmarked against seven advanced DE derivatives, including TCDE [38], ESADE [40], ISDE [41], ISHACDE [42], HCDE [37], SHADE [43] and L-SHADE [44] as well as the basic DE and PSO algorithms. Two widely used benchmark suites, CEC’2014 [45] and CEC’2017 [46], are employed. The CEC’2014 suite comprises 30 benchmark problems, classified into four structural groups. The CEC’2017 suite includes 29 benchmark problems and follows the same four categories.
In all experiments, the optimization landscape is evaluated on 10-D and 30-D instances of the CEC’2014 suite and on 10-D instances of the CEC’2017 suite. Parameter analysis is performed on seven hyperparameters to determine suitable parameter settings for PPOMSDE. In addition, the action components are analyzed separately, and eight action schemes are designed to verify the effectiveness of the proposed components. Section 4.6 further presents ablation studies to evaluate the contributions of the adaptive parameters, the PPO strategy, and the triplet mechanism. All experiments were implemented in Python 3.9 using PyTorch 2.2.0 with CUDA 11.8, and were conducted on a computer equipped with an Intel Core i9-13900HX CPU and an NVIDIA RTX 4060 Laptop GPU.
To further demonstrate its practical applicability, PPOMSDE and the compared algorithms are applied to agricultural UAV path planning in five complex environments. For a fair comparison, the population size of all algorithms is fixed at 50. For parameter settings, ESADE adopts the six mutation operators introduced in Section 2.2, while the remaining algorithms use the parameter settings recommended in their original publications. The maximum number of fitness evaluations (MaxFE) is set to 50,000 for the UAV path-planning tasks and to Dim×5000 for all benchmark experiments. No fixed random seed was specified in the experiments. Each independent run used a separately generated random initialization and random sequence. Each algorithm is executed independently 30 times. The mean, standard deviation, average rank, and the results of the Wilcoxon rank-sum test at a significance level of p = 0.05 are reported. The detailed parameter settings are listed in Table 8.
Table 8.
Parameter settings.
For each task category, a unified PPO model is trained and subsequently used for all test problems within that category. Specifically, separate models are trained for the 10-D CEC’2014 suite, the 30-D CEC’2014 suite, the 10-D CEC’2017 suite, and the UAV path-planning scenarios. After offline training, the corresponding policy is frozen and applied to all functions or scenarios in the same category without further updates. The MaxFE used in each offline training episode is identical to that used in one test run, namely Dim×5000 for the benchmark functions and 50,000 for the UAV path-planning scenarios. The function evaluations consumed during offline training are counted separately and are not included in the test-stage MaxFE budget. When an algorithmic component or parameter setting is changed in the action analysis, ablation study, or parameter analysis, a new model is retrained for the corresponding task category before testing.
4.2. Comparison over CEC’2014
4.2.1. Comparison over 10-D Instances of the CEC’2014
The CEC’2014 benchmark functions are utilized to gauge the search ability, the capability of escaping local optima, and the exploitation performance of algorithms. Figure 3 shows the convergence results of all algorithms on several representative benchmark functions and Table 9 presents the , , and of algorithms over 30 independent runs. Among all 10-D CEC’2014 test functions, PPOMSDE achieves the first rank on all functions. For the unimodal function F1–F3, PPOMSDE, TCDE, ISDE, ISHACDE, SHADE, and L-SHADE all reach the theoretical optimum or achieve results very close to it. In contrast, other advanced algorithms such as HCDE tend to generate excessive perturbations, limiting their convergence accuracy when dealing with extremely narrow global optimum regions. For the multimodal functions F4–F16, algorithms like ISHACDE and TCDE are prone to premature convergence due to historical dependence or predefined static weights. In contrast, PPOMSDE dynamically adjusts mutation strategies based on real-time population state perception. This allows PPO to quickly identify the global optimum direction, achieving high accuracy on functions like F4 and F5. For the highly complex hybrid and composition functions F17–F30, some comparison algorithms such as ISDE attempt to use Double Deep Q-Network (DDQN) for strategy control. However, due to the lack of long-term reward modeling, ISDE is susceptible to premature convergence within sub-optimal basins when navigating highly rugged fitness landscapes such as F27 and F30. PPOMSDE leverages the generalization ability of reinforcement learning to dynamically orchestrate the equilibrium between global spatial traversal and localized refinement. The Wilcoxon rank-sum test further verifies the superiority of PPOMSDE. Compared with SHADE and L-SHADE, PPOMSDE achieves significantly better results on 25 benchmark functions. Against TCDE and ISDE, PPOMSDE outperforms them on 14 functions and performs comparably on the remaining 16, demonstrating its robustness across the 10-D CEC’2014 benchmark suite.
Figure 3.
Convergence curves of representative functions on the 10-D CEC’2014.
Table 9.
The result of the 10-D CEC’2014.
4.2.2. Comparison over 30-D Instances of the CEC’2014
In the 30-D search space, PPOMSDE demonstrates robust optimization performance across most benchmark functions. It achieves particularly strong results on the complex hybrid functions (F20–F22) and composition functions (F29 and F30), where it consistently outperforms DE, PSO, TCDE, and HCDE. Moreover, PPOMSDE effectively avoids the premature convergence observed in advanced algorithms such as SHADE, L-SHADE, and ISDE, indicating its ability to maintain a better balance between global exploration and local exploitation in complex high-dimensional landscapes. Although PPOMSDE performs competitively on all benchmark functions, it does not achieve the best results on several problems, including the unimodal function F1, the multimodal functions F8–F11, and the hybrid and composition functions F18, F27, and F28. These functions feature narrow global optimum regions, highly irregular landscapes, or numerous local optima, posing significant challenges for evolutionary algorithms. This performance gap may be attributed to the limited diversity of the mutation operators in the current action pool, whose search characteristics are less suitable for these landscapes. In future work, more advanced mutation operators will be incorporated into the action pool to further enhance the optimization capability of PPOMSDE on these challenging problems. The Wilcoxon rank-sum test further supports the effectiveness of PPOMSDE by showing statistically significant improvements over most compared algorithms. Figure 4 shows the convergence results of all algorithms on several representative benchmark functions. These results indicate that the proposed reinforcement learning framework provides robust and reliable optimization performance for high-dimensional optimization problems (Table 10).
Figure 4.
Convergence curves of representative functions on the 30-D CEC’2014.
Table 10.
The result of the 30-D CEC’2014.
4.3. Comparison over 10-D Instances of the CEC’2017
The present segment further assesses the optimization efficacy of PPOMSDE alongside the compared algorithms using the 10-D CEC’2017 benchmark suite. Table 11 reports the , , and of each algorithm over 30 runs. Figure 5 shows the convergence results of all algorithms on several representative benchmark functions.
Table 11.
The result of 10-D CEC’2017.
Figure 5.
Convergence curves of representative functions on the 10-D CEC’2017.
The results show that PPOMSDE has a clear competitive advantage. It ranks first on all evaluation instances excluding F4. Regarding the unimodal landscapes F1 along with F2, PPOMSDE, TCDE, ISDE, ISHACDE, SHADE and L-SHADE all converge to the theoretical optimum. This verifies their strong local exploitation ability. For the multimodal functions, TCDE performs well and even outperforms PPOMSDE on F4. This is due to its triplet competition mechanism, which effectively maintains population diversity and adapts well to specific fitness landscapes. However, its single strategy mechanism lacks the ability to switch strategies dynamically in changing environments. As a result, it shows weaker search accuracy and robustness compared to PPOMSDE, as observed in F9 and the hybrid test problems. When tackling the composition functions, the merit of PPOMSDE becomes more significant. In particular, for F23, F25, F28, and F29, PPOMSDE shows a remarkable proficiency in evading premature convergence. In contrast, TCDE, ISDE, and ISHACDE achieve similar performance on functions such as F20–F22, but they exhibit a higher susceptibility to local stagnation. Overall, the results from both benchmark suites clearly demonstrate the competitive edge of PPOMSDE in addressing complex problems.
4.4. Parameter Analysis and Implementation Details
4.4.1. Parameter Sensitivity Analysis
To identify appropriate parameter settings for PPOMSDE, a parameter sensitivity analysis is conducted on its seven key hyperparameters. Four representative benchmark functions from the CEC’2014 suite, namely F1, F11, F22, and F29, are selected to represent the four function categories. The experiments are performed in both 10-D and 30-D search spaces. For each parameter setting, the average rank obtained over all test cases is recorded and used to determine the final parameter configuration.
The learning rate of the actor network is first evaluated using four candidate values: 0.0001, 0.0003, 0.0005, and 0.001. According to the results in Table 12, 0.0003 achieves the best average rank of 1.75 and is therefore selected as the final setting.
Table 12.
Sensitivity of the actor network.
For the critic network, four learning rates (0.0001, 0.0005, 0.001, and 0.003) are investigated. According to the results in Table 13, 0.001 achieves the best average rank of 1.375. As the learning rate deviates from 0.001, the optimization performance gradually declines. Therefore, 0.001 is adopted in the subsequent experiments.
Table 13.
Sensitivity of the critic network.
The PPO clipping parameter is examined using four candidate values (0.1, 0.15, 0.2, and 0.3). According to the results in Table 14, achieves the best average rank of 1.625. Smaller clipping values limit the policy update and reduce learning efficiency, whereas larger values lead to less stable policy updates. As a result, the optimization performance gradually decreases as deviates from 0.2. Therefore, is adopted in all subsequent experiments.
Table 14.
Sensitivity of the PPO clipping parameter.
The discount factor is evaluated with values of 0.95, 0.99, 0.995, and 0.999. According to the results in Table 15, achieves the best average rank (1.50), indicating an effective balance between immediate and long-term rewards.
Table 15.
Sensitivity of the discount factor.
The number of PPO epochs is tested using four values (3, 5, 8, and 10). The best performance in Table 16 is obtained with , which achieves an average rank of 1.625 and is therefore selected for network updates.
Table 16.
Sensitivity of the PPO epochs.
For the external archive capacity coefficient , four candidate values (1.2, 1.4, 1.8, and 2.0) are considered. According to the results in Table 17, as the external archive capacity coefficient deviates from 1.4, the optimization performance gradually declines. The setting of achieves the best average rank of 1.75 and is adopted as the final archive capacity.
Table 17.
Sensitivity of the external archive capacity coefficient .
The perturbation weight in the triplet mechanism is evaluated using four candidate values: 0.6, 0.7, 0.8, and 0.9. According to the results in Table 18, achieves the best performance with the lowest average rank of 1.375. When is smaller than 0.8, the local search is insufficient, leading to reduced optimization performance. In contrast, a larger value introduces stronger perturbations, which may reduce the search stability. Therefore, is selected for all subsequent experiments.
Table 18.
Sensitivity of the perturbation weight.
According to the above experimental results, the final PPO parameter settings are listed in Table 19. The actor network maps the 11-dimensional state space to a five-dimensional discrete action probability distribution through two hidden layers (64 units each) with Tanh activation functions, followed by a softmax output layer. The critic network shares a similar architecture but maps to a single continuous value estimating the state value. Table 19 summarizes the key training configurations and network architectures utilized in this study.
Table 19.
PPO hyperparameter settings.
4.4.2. Implementation Details and Computational Complexity
During the offline training phase, the state feature extraction for each generation requires calculating the Euclidean distances between all individuals to assess local neighborhood density , which incurs a computational cost of . A forward pass of the actor network to select strategies for the entire population requires . The fundamental evolutionary operations take . Therefore, the execution cost per generation is bounded by .
Periodically, the multi-buffer framework sequentially calculates advantages and performs backpropagation for each individual over its collected trajectory. For optimization epochs, the backpropagation cost across the entire population is . represents the maximum number of weight parameters in the neural network, which dictates the complexity of a single network inference or backpropagation step. Aggregating these components over generations and episodes, the total offline training time complexity is .
During the testing phase, policy network updates and multi-buffer storage operations are entirely bypassed. The computational overhead primarily stems from state extraction, the triplet sorting mechanism, and actor network forward inference. Sorting the population by fitness to divide them into , , and takes . Consequently, for a complete optimization run consisting of iterations, the testing time complexity is .
It is undeniable that the proposed PPOMSDE introduces additional algorithmic overhead compared to standard DE algorithms. However, the practical cost–benefit tradeoff strongly favors the proposed approach. The offline training phase, while computationally intensive, is a one-time sunk cost. Once trained, the RL agent operates purely in inference mode, meaning the online deployment overhead scales linearly with the network width and is easily handled by modern processors.
4.5. Analysis of Action Components
4.5.1. Validation of Mutation Strategies
This section evaluates the effectiveness of the mutation operators used in PPOMSDE. Four representative functions from the CEC’2014 benchmark suite, namely F1, F11, F22, and F29, are selected for evaluation in both the 10-D and 30-D search spaces. First, the five mutation operators introduced in Section 3.3 are removed one at a time to construct Plan 1 to Plan 5. Then, three additional mutation operators, namely DE/best/2, DE/best/1, and DE/rand-to-best, are added to the original action pool to construct Plan 6 to Plan 8. These eight comparative schemes are designed to verify whether the current action combination is appropriate. Table 20 lists all the algorithm components used in this study.
Table 20.
Action sets evaluated in the experiments.
Table 21 presents the experimental results of the nine schemes on the representative benchmark functions F1, F11, F22, and F29 in both 10-D and 30-D search spaces. Among all schemes, Plan 9 achieves the best overall performance with the optimal average rank of 1.0. Removing any of the five original mutation operators (Plan 1 to Plan 5) results in performance degradation on most benchmark functions. For example, on the 30-D F1 function, PPOMSDE obtains the best objective value of (1.86 × 10⁴), whereas the results of Plan 1 to Plan 5 range from 4.55 × 10⁴ to 6.32 × 10⁴. These results indicate that each mutation operator contributes to the optimization performance and that the five operators complement each other during the search process. Adding extra mutation operators (Plan 6 to Plan 8) also fails to improve the optimization performance. In particular, Plan 6, which introduces DE/best/2, achieves the worst average rank of 6.625. This suggests that an overly large action pool makes policy learning more difficult and reduces the accuracy of action selection. Overall, the experimental results demonstrate that the current combination of five mutation operators provides the most effective balance between exploration and exploitation, making it the most suitable action pool for PPOMSDE.
Table 21.
Experimental results of different action pool configurations.
4.5.2. Probability Variations in Action Operators
This study records the probability variations in action selection on the 10-D CEC’2014, 30-D CEC’2014, and 10-D CEC’2017 benchmark suites to illustrate the evolution of action distributions over successive iterations.
As shown in Figure 6, the evolutionary dynamics of the action operators are analyzed across four different types of test functions on the 10-D CEC’2014. During the initial phase of the optimization process, Action 1 and Action 3 dominate the selection probability. This preference enables the algorithm to converge rapidly toward promising regions. In the middle and later stages of the search, the selection probability of Action 4 significantly increases. This strategic shift enhances the exploration capability of the population, effectively facilitating the escape from local optima. Furthermore, the specific probability distributions of operator selection exhibit distinct patterns that adapt dynamically to the varying landscape characteristics of different function types.
Figure 6.
Action probability curves on the 10-D CEC’2014 benchmark suite.
Furthermore, Figure 7 illustrates the probability variations in action selection on the more challenging 30-D CEC’2014 benchmark suite. Compared to the 10-D scenarios, the action distributions in high-dimensional landscapes exhibit more complex and task-specific dynamic behaviors. For unimodal functions with relatively straightforward landscapes, PPOMSDE achieves rapid convergence and maintains strong search stability. Consequently, exploitation-oriented operators, particularly Action 1, quickly establish dominance, and the selection probabilities among the various operators remain remarkably stable throughout the optimization process. Conversely, when addressing highly complex or multimodal functions, the algorithm demonstrates a distinctive phased adaptation strategy. During the initial and intermediate stages, operators like Action 3 and Action 5 maintain higher selection probabilities to navigate the expansive search space and preserve population diversity. As the iterations progress into the later stages, the frequency of selecting exploratory operators, notably Action 4, significantly increases to help the population escape from severe high-dimensional local optima.
Figure 7.
Action probability curves on the 30-D CEC’2014 benchmark suite.
According to the results in Figure 8, the action selection probabilities on the 10-D CEC’2017 benchmark suite reveal further distinct behaviors. Due to the shifted and highly rotated landscape features of the CEC’2017 functions, the advantageous operators undergo a noticeable shift. Unlike the patterns observed in the CEC’2014 suite, Action 1 gradually starts to dominate the selection probability during the middle stage of the optimization process. This indicates that after the initial global exploration, the population successfully locates promising sub-regions. Consequently, the reinforcement learning agent extensively utilizes the strong exploitation capability of Action 1 to accelerate convergence and perform rapid localized refinement. This adaptive shifting behavior further demonstrates the flexibility of PPOMSDE in dynamically adjusting its search strategies to accommodate entirely different evaluation environments.
Figure 8.
Action probability curves on the 10-D CEC’2017 benchmark suite.
4.6. Ablation Study of the PPOMSDE
To verify the effectiveness of each component in PPOMSDE, ablation studies are conducted in this section. Three key components are evaluated separately, including the PPO-based action selection framework, the adaptive parameter mechanism, and the triplet mechanism. The experiments are performed on the 10-D and 30-D CEC’2014 benchmark suite using four representative functions (F1, F11, F22, and F29). The results are summarized in Table 22.
Table 22.
Ablation study results.
As shown in Table 22, the complete PPOMSDE achieves the best overall performance among all variants. Removing any component leads to performance degradation, confirming that each module contributes to the optimization performance. Compared with the complete PPOMSDE, the w/o PPO variant achieves worse results on several benchmark functions, especially the composition function F29, demonstrating the effectiveness of the PPO-based action selection framework. Removing the adaptive parameter mechanism (w/o Adaptive) degrades the optimization performance on most benchmark functions, particularly in the 30-D experiments, demonstrating the importance of adaptive parameter adjustment. Similarly, removing the triplet mechanism (w/o Triplet) also leads to worse optimization results, especially on the hybrid and composition functions, confirming its contribution to maintaining population diversity and search effectiveness. Overall, the ablation results verify that the PPO-based action selection framework, the adaptive parameter mechanism, and the triplet mechanism all play important roles in the performance of PPOMSDE.
4.7. Implementation of the PPOMSDE for Agricultural UAV Path Planning
4.7.1. Scenario Settings
To validate the proposed framework in realistic agricultural applications, it is evaluated against a complex agricultural environment with undulating topography, utilizing a high-fidelity DEM representation. Five hillside threat scenarios exhibiting varying degrees of complexity are constructed (the configurations are detailed in Table 23 and Table 24). The purpose is to evaluate the algorithmic proficiency to generate optimal, terrain-adaptive routes across varying agricultural setups. All tests take place within a stationary setting, where in the locations of hazards and contextual parameters are fixed throughout the optimization phase. The total count of trajectory control points is established at . It should be emphasized that agricultural UAV experiments in this study are simulation-based. Wind disturbances, sensing and localization uncertainties, communication delays, and detailed vehicle dynamic constraints are not explicitly considered in the experiments. Therefore, the presented results primarily evaluate the optimization capability of PPOMSDE under controlled conditions. According to the encoding method in Section 2.1, the problem dimension for all optimization algorithms, including PPOMSDE, is set to . Furthermore, the specific parameters governing the cost functions are summarized in Table 25. Every method undergoes 30 independent trial runs for each scenario, bounded by a computational budget of 50,000 evaluations alongside a consistent swarm size of 50. The findings are summarized utilizing , , and , as shown in Table 26.
Table 23.
Threat information.
Table 24.
Threat configuration for the scenario.
Table 25.
Cost function and simulation parameters.
Table 26.
The result of UAV agricultural path planning.
4.7.2. Comparison with Advanced Algorithms
According to Table 26, PPOMSDE achieves the best average fitness values among all compared baseline algorithms in the first four test scenarios. In Scenario 5, although PPOMSDE is slightly outperformed by ISDE but remains highly competitive. Furthermore, the statistical results reveal that PPOMSDE consistently maintains its standard deviation at an extremely low level, ranging between 5.51 × 100 and 1.53 × 10². This highlights its outstanding robustness and search stability over multiple independent runs, sharply contrasting with the severe performance degradation seen in basic algorithms like PSO. Notably, among the compared methods, ISDE and L-SHADE show strong competitiveness on specific tasks, yet PPOMSDE demonstrates the most stable comprehensive performance. In essence, the reinforcement learning framework endows PPOMSDE with a self-organizing search trajectory, ensuring highly reliable optimization performance irrespective of problem complexity.
Unlike general UAV path planning, complex agricultural applications require the flight altitude to maintain a strict, constant distance from the uneven terrain. This terrain-following requirement makes path planning more challenging. As shown in Figure 9 and Figure 10, advanced algorithms can generate feasible trajectories, whereas basic algorithms such as DE and PSO fail to find feasible paths under these conditions. Figure 9 shows that PPOMSDE consistently generates high-quality feasible paths in all five test environments and demonstrates superior performance relative to the compared algorithms. Figure 10 further presents the corresponding flight paths. Compared with the paths generated by the other algorithms, the routes planned by PPOMSDE are smoother and shorter. They also pass safely through narrow corridors between multiple hillside threat regions, resulting in more efficient trajectories. Both the quantitative results and the path planning examples demonstrate the effectiveness of PPOMSDE for complex agricultural UAV path planning. These results confirm that the proposed method has strong potential for 3D path planning in smart agriculture.
Figure 9.
Overhead perspective of the generated flight routes.
Figure 10.
Comparison plot of generated three-dimensional flight routes.
The reported average cost reduction was calculated using four advanced DE variants: ISDE, L-SHADE, SHADE, and ISHACDE. For each comparison algorithm a, the reduction in scenario s was calculated as , where denotes the mean cost over 30 independent runs. The reduction percentages were first averaged across the five scenarios for each algorithm and then averaged across the four algorithms. The corresponding reductions were 12.43%, 20.18%, 21.33%, and 35.75%, yielding an overall average reduction of 22.42%.
5. Conclusions
This paper presents a multi-strategy differential evolution algorithm based on a triplet mechanism and PPO, named PPOMSDE. By introducing the PPO reinforcement learning framework, the agent perceives a multi-dimensional state space and guides individuals to select optimal strategies from a designed action pool. An independent multi-buffer is adopted to update each individual’s experience separately. In addition, a parameter adaptation mechanism is integrated, and the triplet mechanism is introduced in the deployment phase. It assigns targeted control parameters to individuals of different quality (best, medium, and worst) and refines mutation actions. This design better guides the evolutionary process and improves the equilibrium coordinating global discovery with localized fine-tuning. On the standard benchmark suites, PPOMSDE achieved the lowest average performance ranks of 1.39 for the combined 10-D and 30-D CEC’2014 instances and 1.03 for the 10-D CEC’2017 instances. For practical agricultural UAV applications, the algorithm demonstrated exceptional capability in generating safe, smooth, and precise terrain-following trajectories across diverse hillside scenarios. Notably, PPOMSDE established new quantitative performance bounds by reducing the overall path planning cost by an average of 22.42% compared with ISDE, L-SHADE, SHADE, and ISHACDE.
Future research will investigate more advanced reinforcement learning algorithms to further improve policy learning stability in complex optimization problems [47]. Furthermore, the proposed framework will be extended toward an online actor–critic reinforcement learning architecture to enable continuous policy updates and adaptive path planning in response to dynamic and non-stationary agricultural environments [48]. More flexible path-encoding strategies based on waypoint-location optimization will be investigated to improve maneuverability in complex terrain. More realistic agricultural operating conditions will be incorporated into the simulation environment, including wind disturbances, sensing and localization uncertainty, communication delays, and practical UAV dynamic constraints. Since the agricultural UAV experiments presented in this study are entirely simulation-based, field experiments using real UAV platforms on farmland remain necessary. These experiments will be conducted to evaluate the robustness, real-time feasibility, and engineering applicability of the proposed method under uncertain environmental conditions. In addition, the deployment of the framework on edge-computing platforms will be investigated to support real-time applications. Reinforcement learning methods integrated with fuzzy logic will be explored to improve decision-making under uncertain agricultural environments.
Author Contributions
Conceptualization, P.C. and C.Q.; methodology, P.C.; software, P.C.; validation, P.C., Z.M. and Y.T.; formal analysis, P.C.; investigation, P.C.; resources, P.C.; data curation, P.C.; writing—original draft preparation, P.C.; writing—review and editing, C.Q.; visualization, P.C.; supervision, P.C.; project administration, C.Q.; funding acquisition, C.Q. All authors have read and agreed to the published version of the manuscript.
Funding
This work was supported in part by the Natural Science Foundation of Jiangsu Province, China (BK20250739).
Data Availability Statement
The original contributions presented in this study are included in the article. Further inquiries can be directed to the corresponding author.
Conflicts of Interest
The authors declare no conflicts of interest.
Abbreviations
The following abbreviations are used in this manuscript:
| DE | Differential evolution |
| UAV | Unmanned aerial vehicles |
| PPO | Proximal policy optimization |
| RRT* | Rapidly exploring random tree star |
| GA | Genetic algorithm |
| PSO | Particle swarm optimization |
| RL | Reinforcement learning |
| DRL | Deep reinforcement learning |
| MDP | Markov decision process |
| BP | Backpropagation |
| TTA | Test-time augmentation |
| DEM | Digital elevation model |
| TCDE | Triple competitive differential evolution |
| ESADE | Differential evolution with evolutionary scale adaptation |
| ISDE | Indicator-based self-learning differential evolution |
| ISHACDE | Independent Success History Adaptation Competitive Differential Evolution |
| HCDE | Hierarchically controlled differential evolution |
References
- Guo, X.; Ou, Y. A unmanned aerial vehicle-based image information acquisition technique for the middle and lower sections of rice plants and a predictive algorithm model for pest and disease detection. Agriculture 2025, 15, 790. [Google Scholar] [CrossRef] [Scilit]
- Gao, C.; Ji, X. Monitoring of wheat fusarium head blight on spectral and textural analysis of UAV multispectral imagery. Agriculture 2023, 13, 293. [Google Scholar] [CrossRef] [Scilit]
- Zhao, J.; Fan, S. Research status and development trends of deep reinforcement learning in the intelligent transformation of agricultural machinery. Agriculture 2025, 15, 1223. [Google Scholar] [CrossRef] [Scilit]
- Du, X.; Huang, D. Recognition of plastic film in terrain-fragmented areas based on drone visible light images. Agriculture 2024, 14, 736. [Google Scholar] [CrossRef] [Scilit]
- Tan, L.; Zhang, H. A robust multiple unmanned aerial vehicles 3D path planning strategy via improved particle swarm optimization. Comput. Electr. Eng. 2023, 111, 108947. [Google Scholar] [CrossRef] [Scilit]
- Hu, G.; Zhong, J. SaCHBA_PDN: Modified honey badger algorithm with multi-strategy for UAV path planning. Expert Syst. Appl. 2023, 223, 119941. [Google Scholar] [CrossRef] [Scilit]
- Fu, H.; Li, Z. Path Planning for Agricultural UAVs Based on Deep Reinforcement Learning and Energy Consumption Constraints. Agriculture 2025, 15, 943. [Google Scholar] [CrossRef] [Scilit]
- Fei, H.; Liu, R. Three-dimensional path planning for unmanned aerial vehicles based on hybrid multi-strategy dung beetle optimization algorithm. Agriculture 2025, 15, 1156. [Google Scholar] [CrossRef] [Scilit]
- Toscano, F.; Fiorentino, C. Recent Developments and Future Prospects in the Integration of Machine Learning in Mechanised Systems for Autonomous Spraying: A Brief Review. AgriEngineering 2025, 7, 142. [Google Scholar] [CrossRef] [Scilit]
- Liu, X.; Li, G. Agricultural UAV trajectory planning by incorporating multi-mechanism improved grey wolf optimization algorithm. Expert Syst. Appl. 2023, 233, 120946. [Google Scholar] [CrossRef] [Scilit]
- Fan, J.; Chen, X. UAV trajectory planning based on bi-directional APF-RRT* algorithm with goal-biased. Expert Syst. Appl. 2023, 213, 119137. [Google Scholar] [CrossRef] [Scilit]
- Jiang, Y.; Xu, X.X. Evolutionary computation for unmanned aerial vehicle path planning: A survey. Artif. Intell. Rev. 2024, 57, 267. [Google Scholar] [CrossRef] [Scilit]
- Wang, W.; Ye, C. SGGTSO: A spherical vector-based optimization algorithm for 3D UAV path planning. Drones 2023, 7, 452. [Google Scholar] [CrossRef] [Scilit]
- Tu, B.; Wang, F. 3D path planning for UAV based on a hybrid algorithm of marine predators algorithm with quasi-oppositional learning and differential evolution. Egypt. Inform. J. 2024, 28, 100556. [Google Scholar] [CrossRef] [Scilit]
- Huang, C.; Zhou, X. Adaptive cylinder vector particle swarm optimization with differential evolution for UAV path planning. Eng. Appl. Artif. Intell. 2023, 121, 105942. [Google Scholar] [CrossRef] [Scilit]
- Yu, X.; Jiang, N. A hybrid algorithm based on grey wolf optimizer and differential evolution for UAV path planning. Expert Syst. Appl. 2023, 215, 119327. [Google Scholar] [CrossRef] [Scilit]
- Zhao, H.; Li, L. Multi-UAV Path Planning Using Improved Artificial Hummingbird Algorithm Based on Differential Evolution and Gradient Descent. IEEE Trans. Consum. Electron. 2025, 72, 558–569. [Google Scholar]
- Cao, Z.; Xu, K. An adaptive population size based Differential Evolution by mining historical population similarity for path planning of unmanned aerial vehicles. Inf. Sci. 2024, 666, 120432. [Google Scholar] [CrossRef] [Scilit]
- Zhou, R.; Meng, Z. Parameter Adaptive Differential Evolution with Multi-strategy for 3D Unmanned Aerial Vehicle Path Planning. IEEE Internet Things J. 2026, 13, 13709–13719. [Google Scholar] [CrossRef] [Scilit]
- Freitas, E.J.; Cohen, M.W. DE3D-NURBS: A differential evolution-based 3D path-planner integrating kinematic constraints and obstacle avoidance. Knowl.-Based Syst. 2024, 300, 112084. [Google Scholar] [CrossRef] [Scilit]
- Yu, X.; Luo, W. Reinforcement learning-based multi-strategy cuckoo search algorithm for 3D UAV path planning. Expert Syst. Appl. 2023, 223, 119910. [Google Scholar] [CrossRef] [Scilit]
- Huang, C.; Peng, Y. A Dendrite Net learning Multi-objective Artificial Bee Colony Algorithm for UAV Path Planning. Appl. Soft Comput. 2025, 189, 114449. [Google Scholar]
- Zhao, F.; Yang, T. An online learning metaheuristic algorithm with proximal policy optimization mechanism. Expert Syst. Appl. 2025, 289, 128403. [Google Scholar] [CrossRef] [Scilit]
- Yu, X.; Xu, P. Reinforcement learning-based differential evolution algorithm for constrained multi-objective optimization problems. Eng. Appl. Artif. Intell. 2024, 131, 107817. [Google Scholar] [CrossRef] [Scilit]
- Zhang, Y.; Du, G. Manifold-Aware Triple Cooperative Multi-Population Differential Evolution with Reinforcement Learning for Irregular 3D UAV Path Planning. Knowl.-Based Syst. 2026, 341, 115863. [Google Scholar] [CrossRef] [Scilit]
- Ding, W.; Qian, M. Differential evolution with joint adaptation of mutation strategies and control parameters via distributed proximal policy optimization. Tsinghua Sci. Technol. 2024, 31, 101–124. [Google Scholar] [CrossRef] [Scilit]
- Reda, M.; Onsy, A. A novel reinforcement learning-based multi-operator differential evolution with cubic spline for the path planning problem. Artif. Intell. Rev. 2025, 58, 142. [Google Scholar] [CrossRef] [Scilit]
- Guan, J.; Ye, S. MSCPSO: A multi-strategy cooperative particle swarm optimization algorithm for UAV path planning. Expert Syst. Appl. 2026, 310, 131034. [Google Scholar] [CrossRef] [Scilit]
- Reyes-Dávila, E.; Haro, E.H.; Casas-Ordaz, Á.; Oliva, D.; Avalos, O. Differential Evolution: A Survey on Their Operators and Variants. Arch. Comput. Methods Eng. 2025, 32, 83–112. [Google Scholar] [CrossRef] [Scilit]
- Shakya, A.K.; Pillai, G. Reinforcement learning algorithms: A brief survey. Expert Syst. Appl. 2023, 231, 120495. [Google Scholar] [CrossRef] [Scilit]
- He, J.; Zhao, H. Nearly minimax optimal reinforcement learning for linear markov decision processes. In Proceedings of the International Conference on Machine Learning, Honolulu, HI, USA, 23–29 July 2023; pp. 12790–12822. [Google Scholar]
- Mazraeh, H.D.; Parand, K. An innovative combination of deep Q-networks and context-free grammars for symbolic solutions to differential equations. Eng. Appl. Artif. Intell. 2025, 142, 109733. [Google Scholar] [CrossRef] [Scilit]
- Shen, S.; Cai, C. Joint mean-field game and multiagent asynchronous advantage actor-critic for edge intelligence-based IoT malware propagation defense. IEEE Trans. Dependable Secur. Comput. 2025, 22, 3824–3838. [Google Scholar] [CrossRef] [Scilit]
- Wen, S.; Shu, Y. A deep residual reinforcement learning algorithm based on Soft Actor-Critic for autonomous navigation. Expert Syst. Appl. 2025, 259, 125238. [Google Scholar] [CrossRef] [Scilit]
- Piotrowski, A.P.; Piotrowska, A.E. Experimental survey of L-SHADE and SHADE-based adaptive differential evolution algorithms. Swarm Evol. Comput. 2026, 101, 102286. [Google Scholar] [CrossRef] [Scilit]
- Piotrowska, A.E.; Piotrowski, A.P. Improving scale parameters in successful-history-based adaptive differential evolution algorithms. Appl. Soft Comput. 2025, 187, 114288. [Google Scholar] [CrossRef] [Scilit]
- Sun, L.; Song, Z. Hierarchically controlled differential evolution algorithm. Expert Syst. Appl. 2025, 290, 128383. [Google Scholar] [CrossRef] [Scilit]
- Yang, Q.; Qiao, Z. Triple competitive differential evolution for global numerical optimization. Swarm Evol. Comput. 2024, 84, 101450. [Google Scholar] [CrossRef] [Scilit]
- Wang, W.; Xu, X. UAV-assisted content caching for human-centric consumer applications in IoV. IEEE Trans. Consum. Electron. 2024, 70, 927–938. [Google Scholar] [CrossRef] [Scilit]
- Zhang, S.X.; Hu, X.R. Differential evolution with evolutionary scale adaptation. Swarm Evol. Comput. 2024, 85, 101481. [Google Scholar] [CrossRef] [Scilit]
- Zhao, F.; Zhou, H. A self-learning differential evolution algorithm with population range indicator. Expert Syst. Appl. 2024, 241, 122674. [Google Scholar] [CrossRef] [Scilit]
- Zhong, R.; Hussien, A.G. Space mission trajectory optimization via competitive differential evolution with independent success history adaptation. Appl. Soft Comput. 2025, 171, 112777. [Google Scholar] [CrossRef] [Scilit]
- Tanabe, R.; Fukunaga, A. Success-history based parameter adaptation for differential evolution. In Proceedings of the 2013 IEEE Congress on Evolutionary Computation, Cancun, Mexico, 20–23 June 2013; pp. 71–78. [Google Scholar]
- Tanabe, R.; Fukunaga, A.S. Improving the search performance of SHADE using linear population size reduction. In Proceedings of the 2014 IEEE Congress on Evolutionary Computation (CEC), Beijing, China, 6–11 July 2014; pp. 1658–1665. [Google Scholar]
- Liang, J.J.; Qu, B.Y. Problem Definitions and Evaluation Criteria for the CEC 2014 Special Session and Competition on Single Objective Real-Parameter Numerical Optimization; Technical Report; Computational Intelligence Laboratory, Zhengzhou University: Zhengzhou, China; Nanyang Technological University: Singapore, 2014; p. 635. [Google Scholar]
- Wu, G.; Mallipeddi, R. Problem Definitions and Evaluation Criteria for the CEC 2017 Competition on Constrained Real-Parameter Optimization; Technical Report; National University of Defense Technology: Changsha, China; Kyungpook National University: Daegu, Republic of Korea; Nanyang Technological University: Singapore, 2017; p. 9. [Google Scholar]
- Liu, H.; Long, X. Adaptive multi-UAV cooperative path planning based on novel rotation artificial potential fields. Knowl.-Based Syst. 2025, 317, 113429. [Google Scholar] [CrossRef] [Scilit]
- Hazem, Z.B. A fuzzy-TD3 hybrid reinforcement learning framework for robust trajectory tracking of the Mitsubishi RV-2AJ robotic arm. Sci. Rep. 2026, 16, 12269. [Google Scholar] [CrossRef] [Scilit] [PubMed]
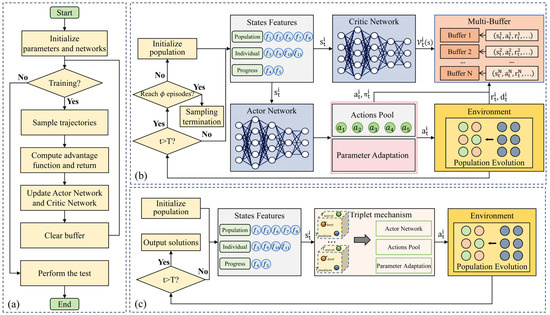
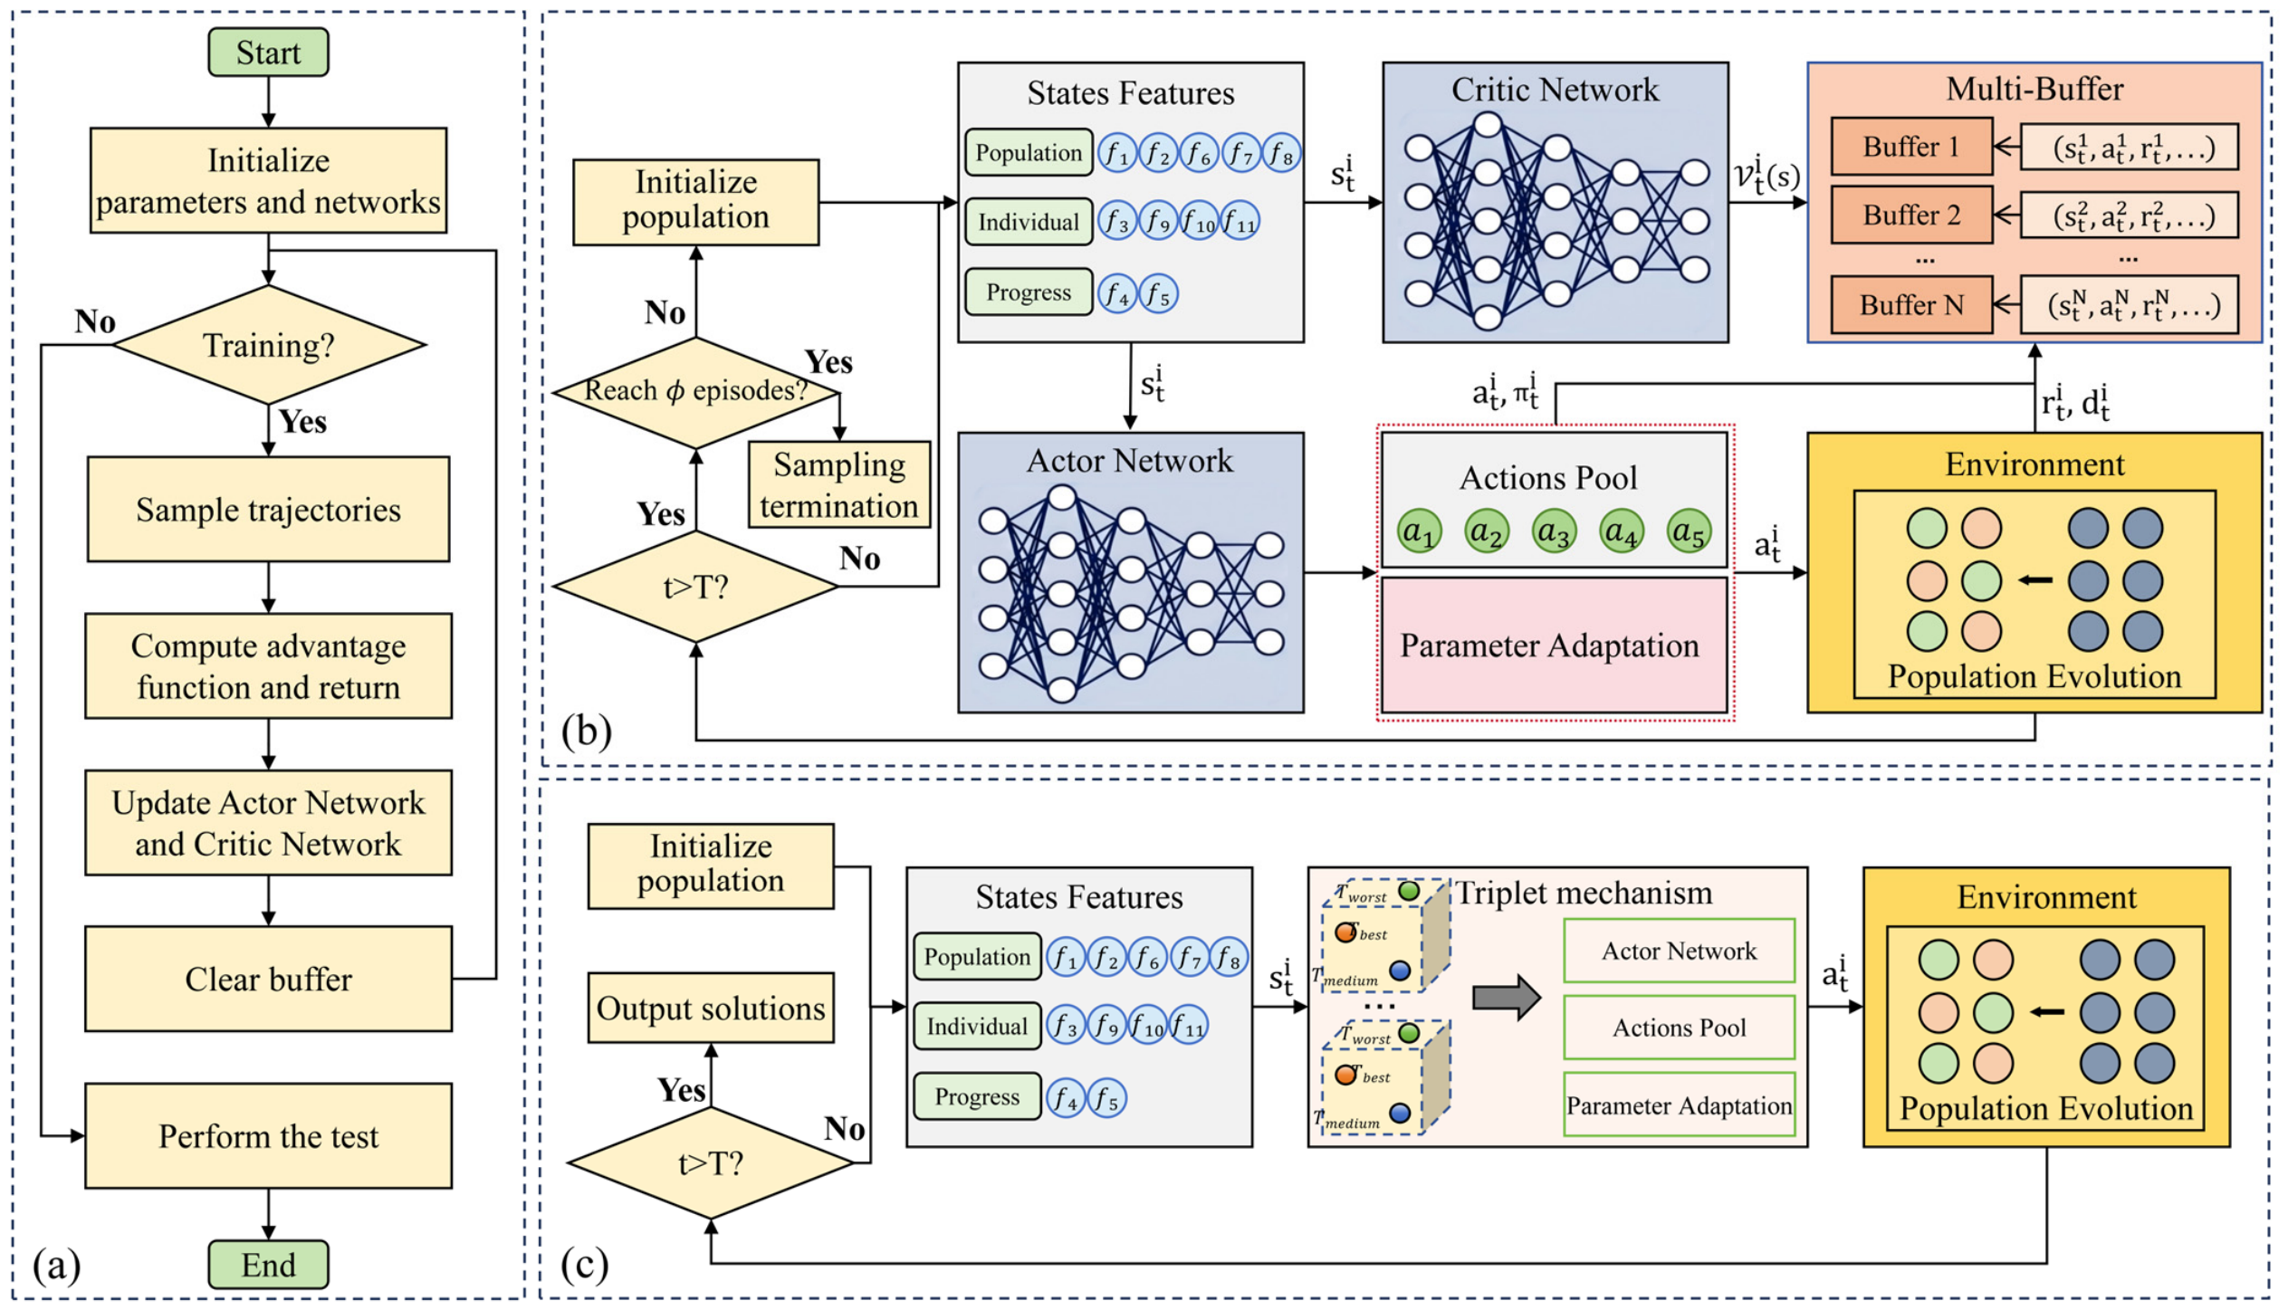
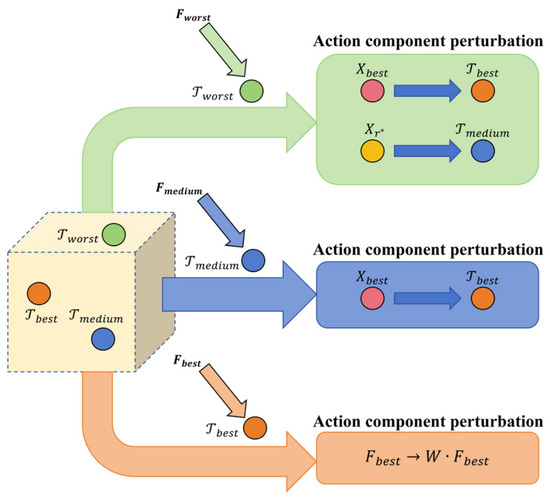
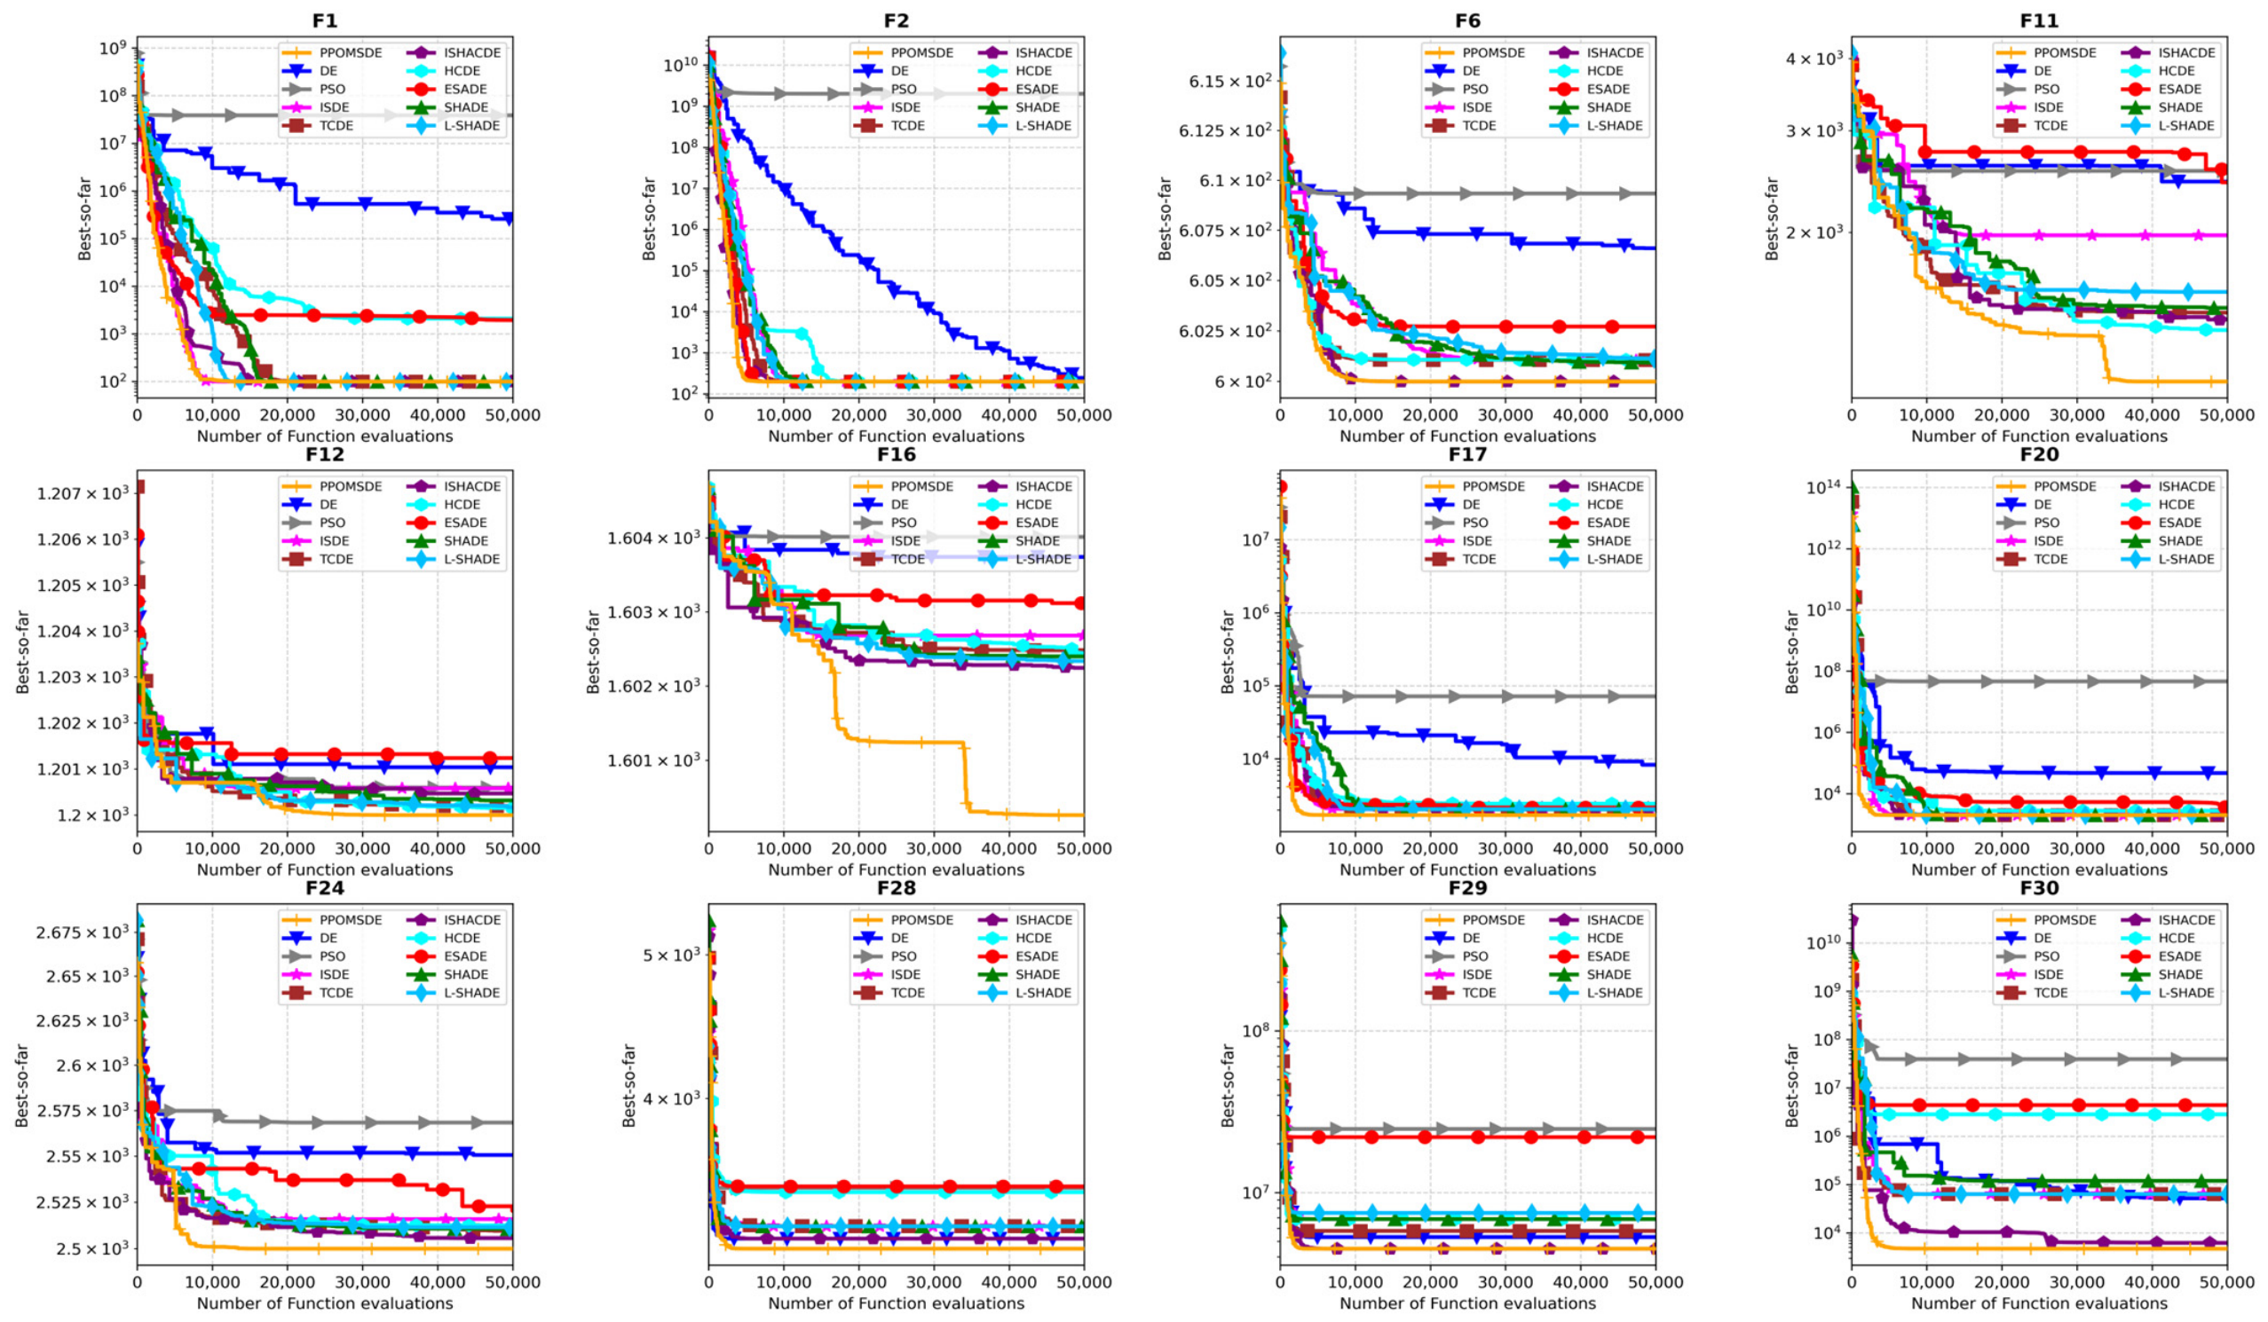
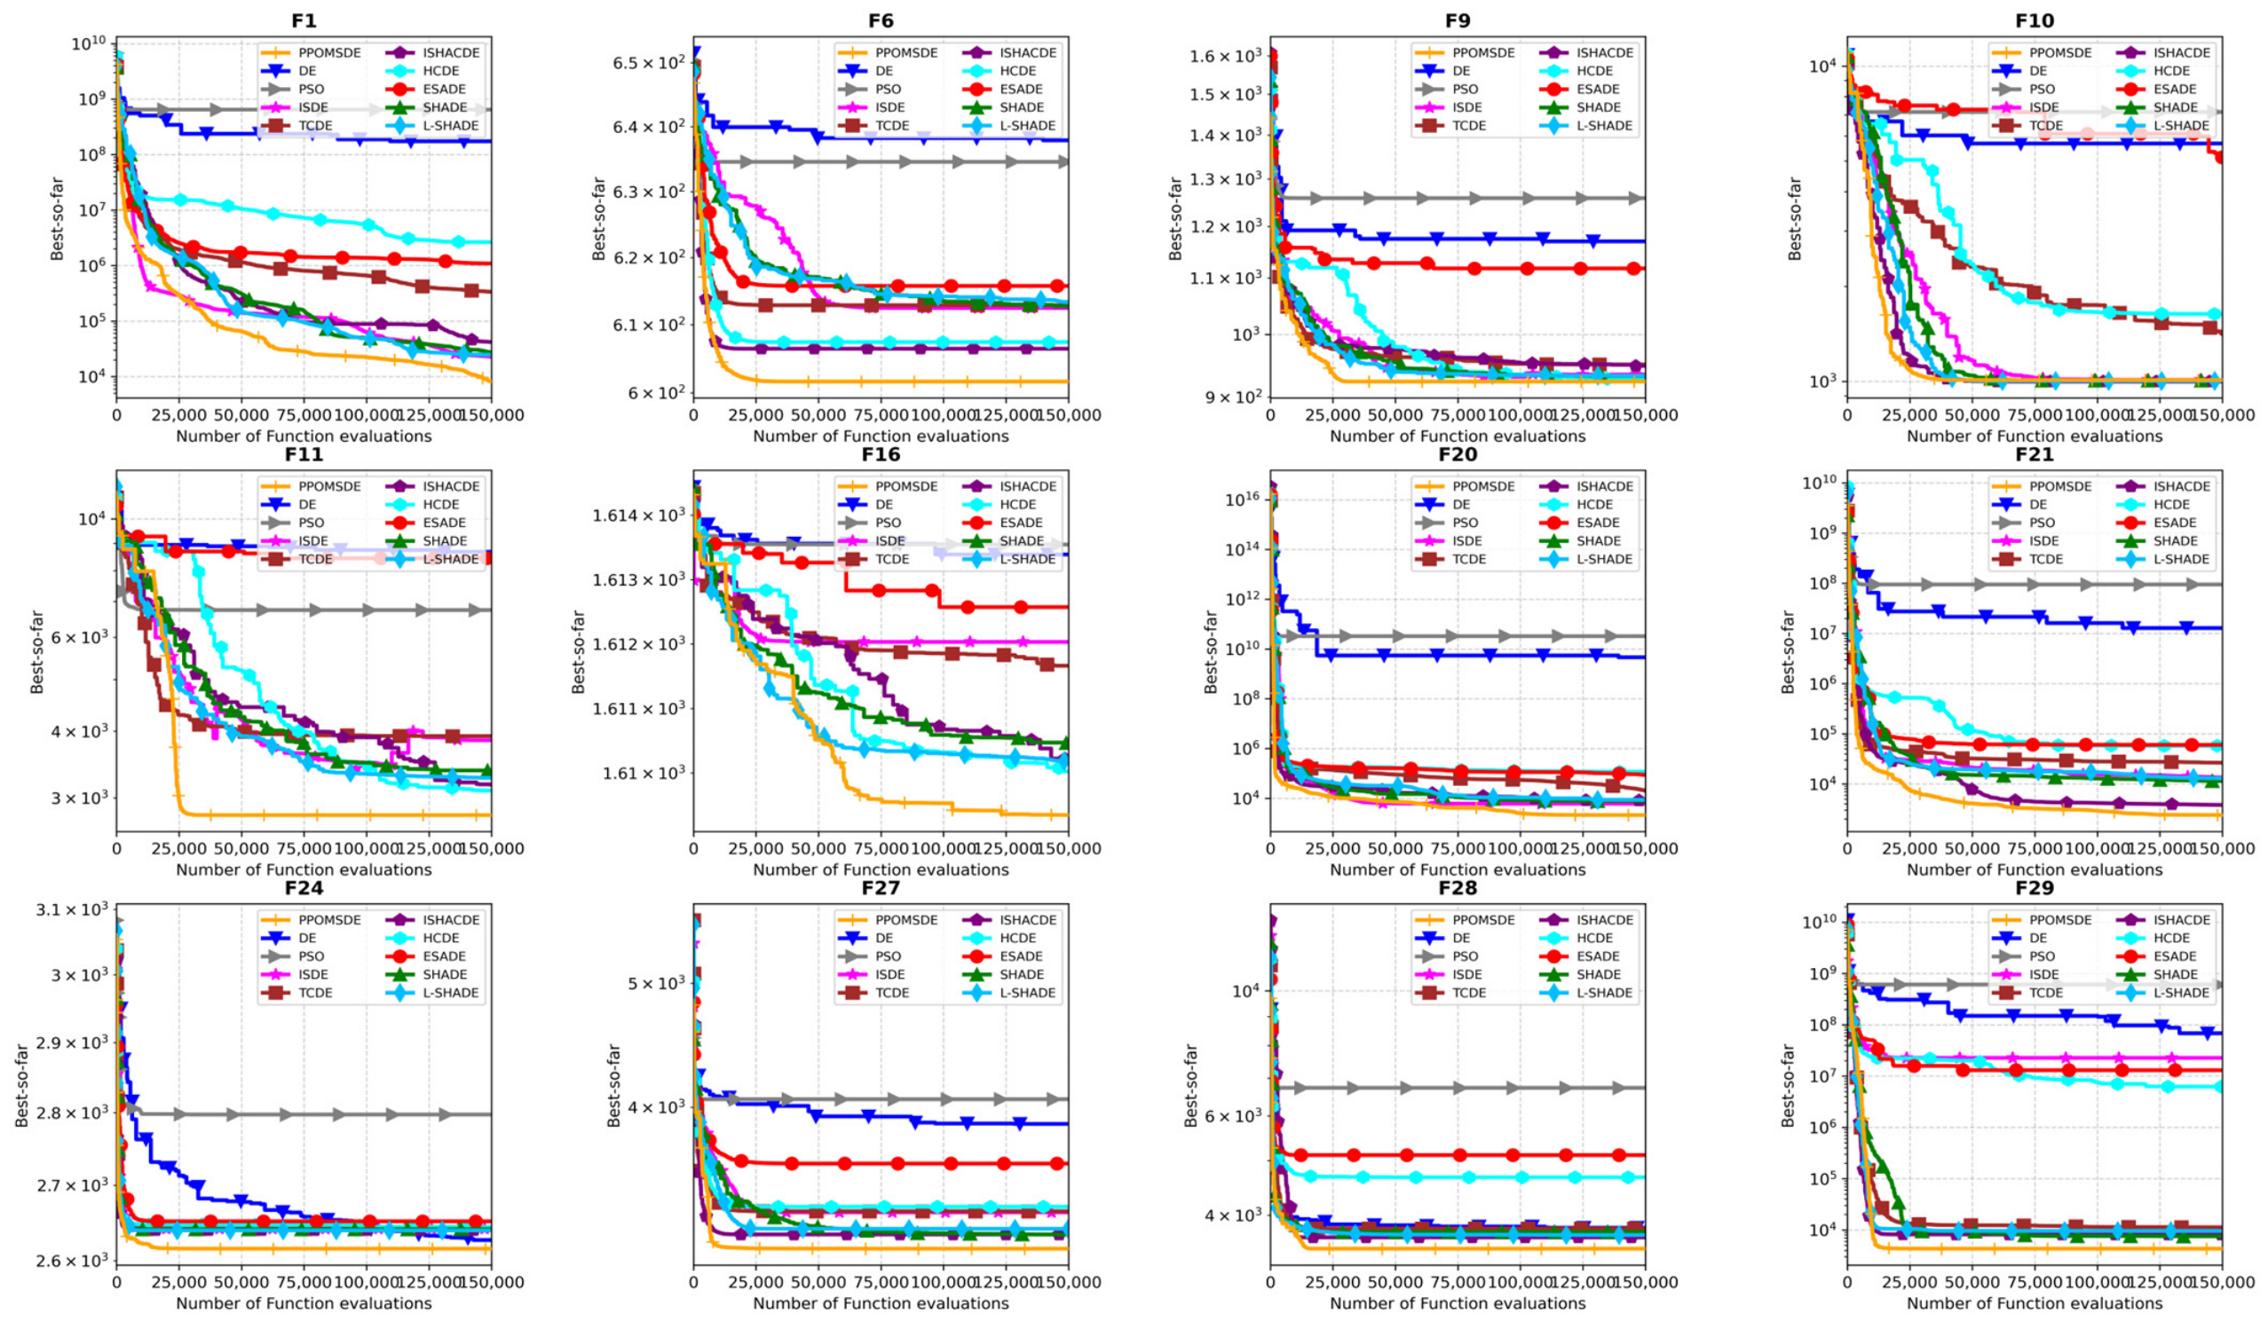
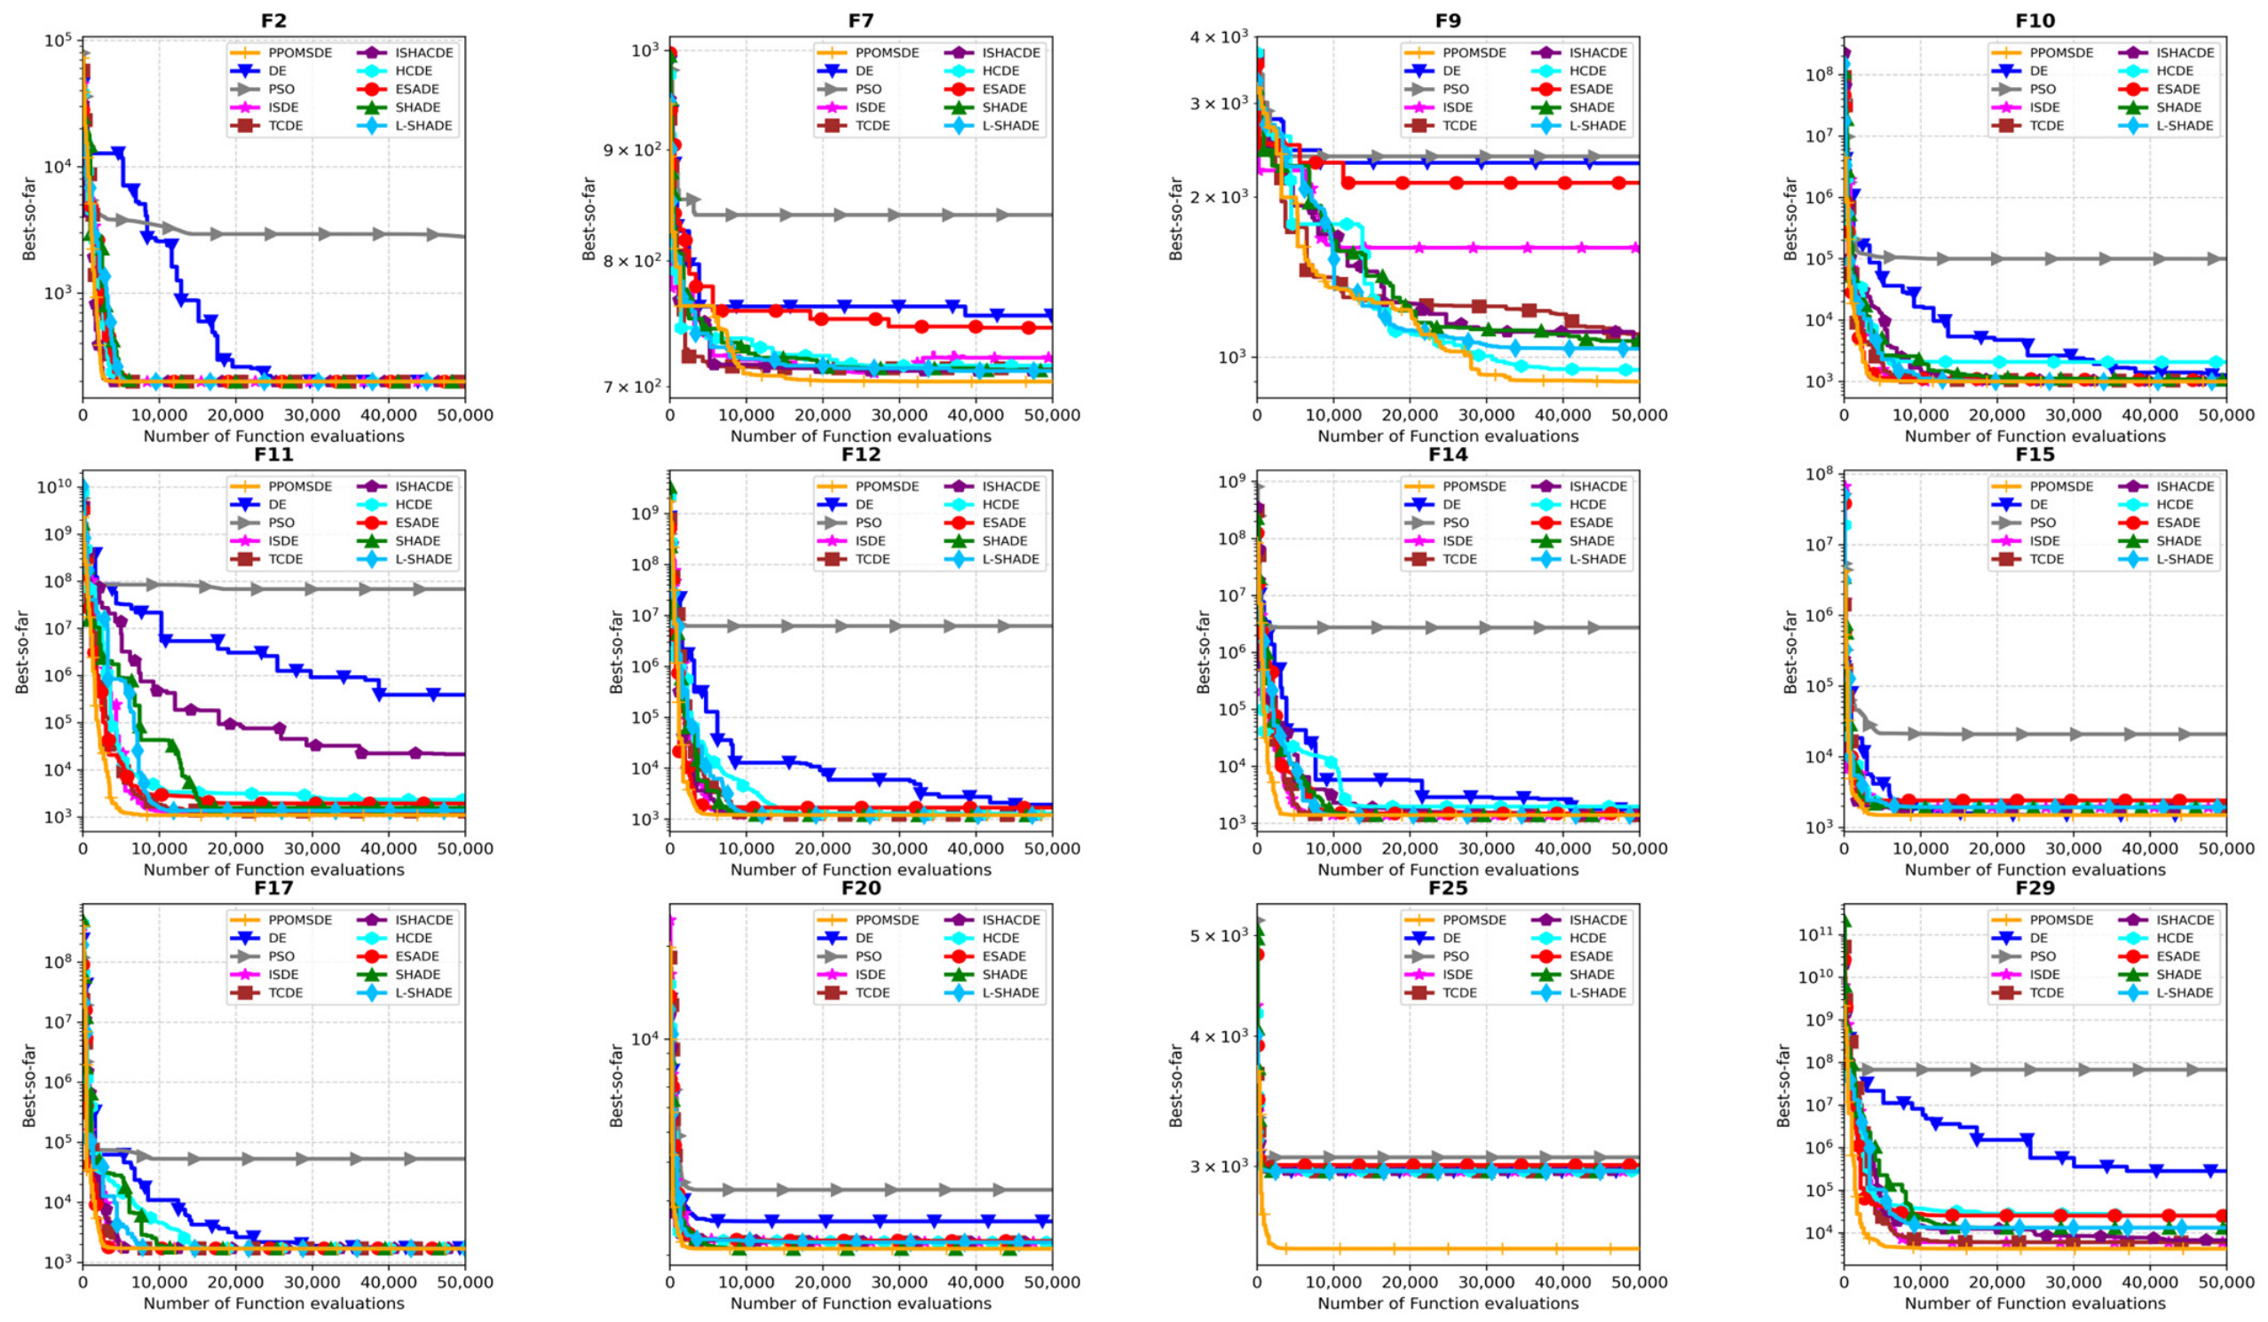
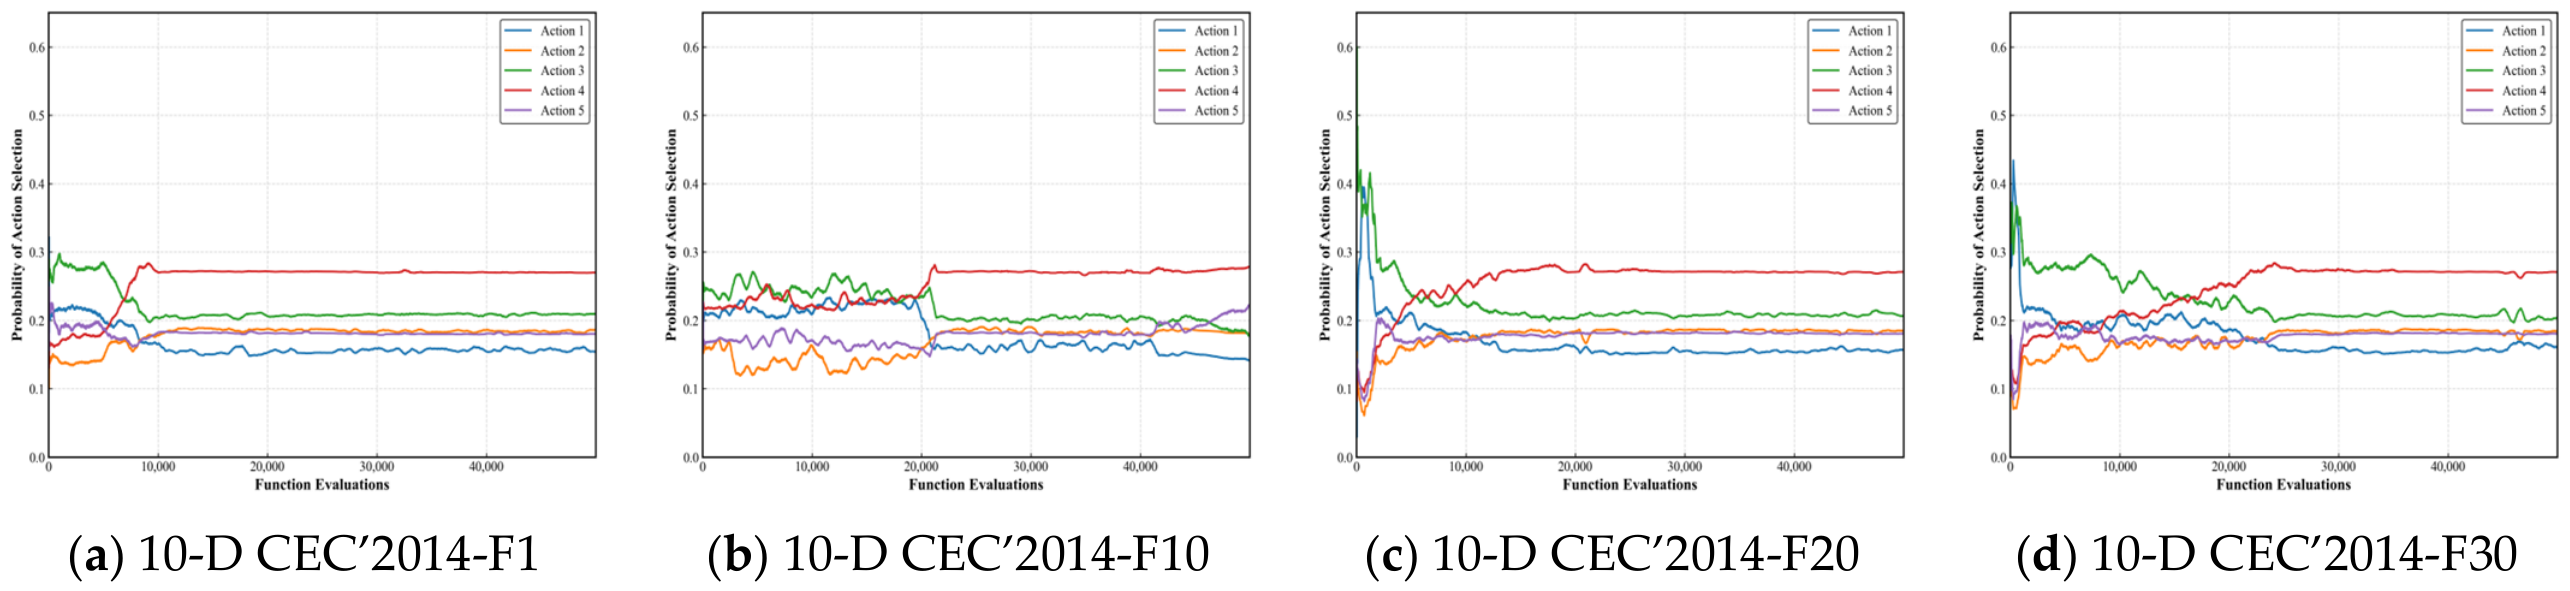
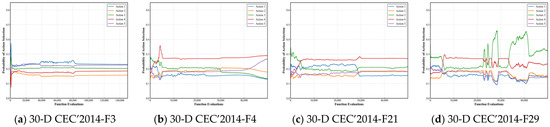
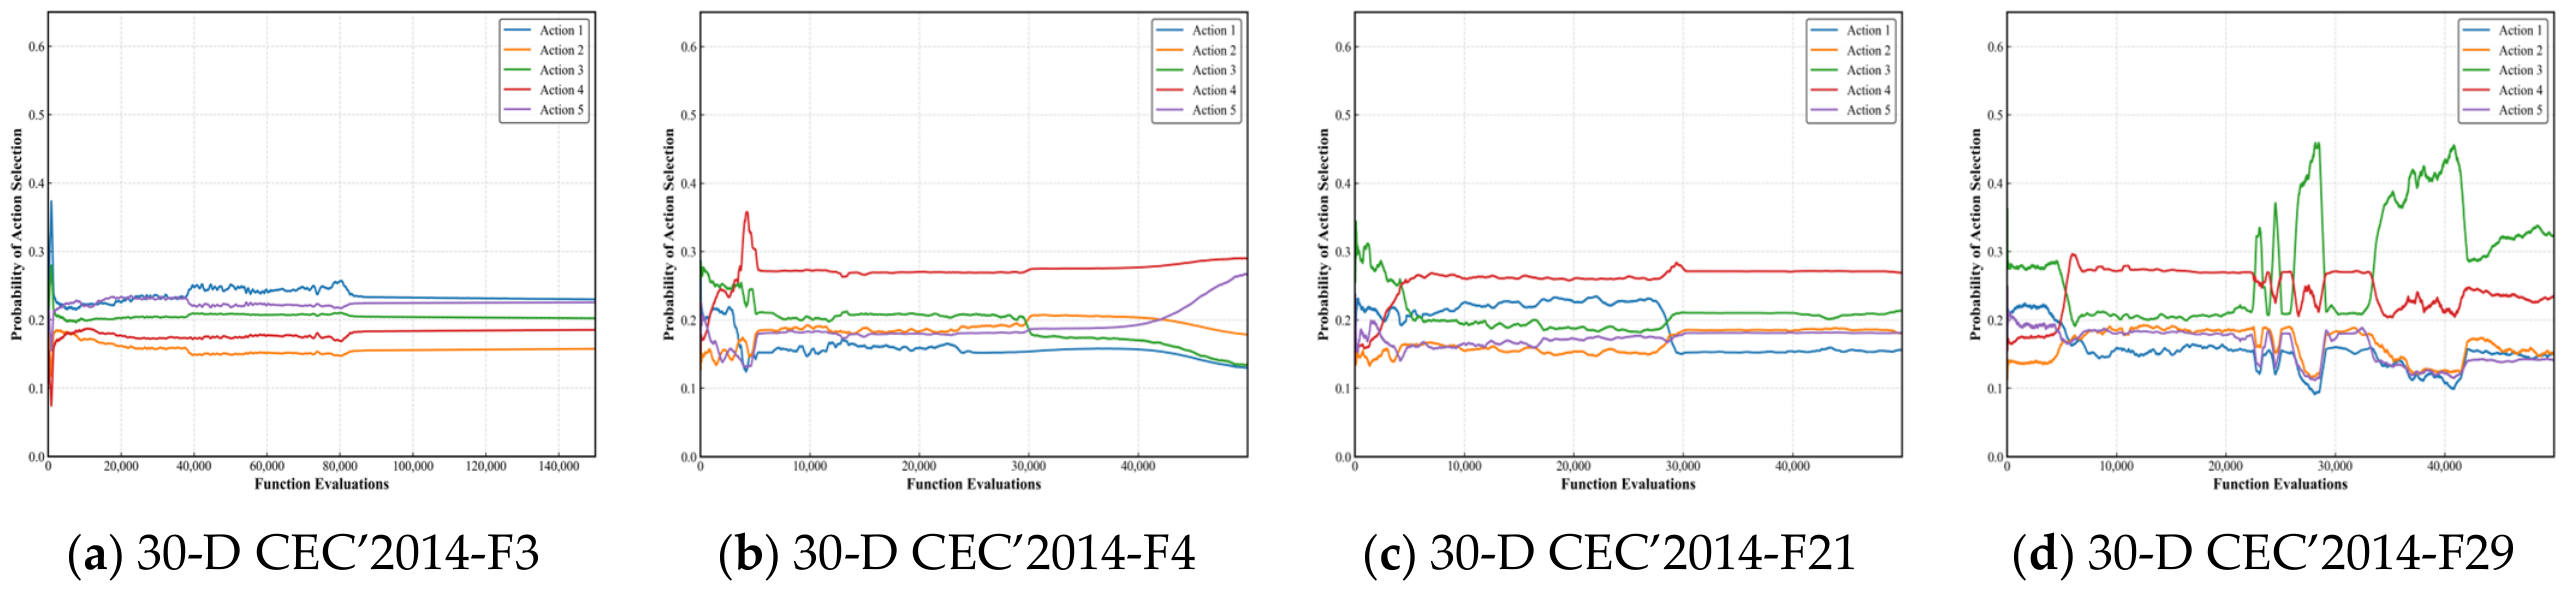
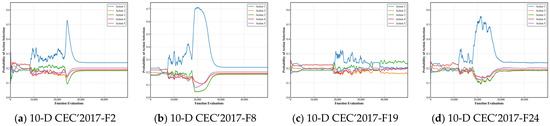
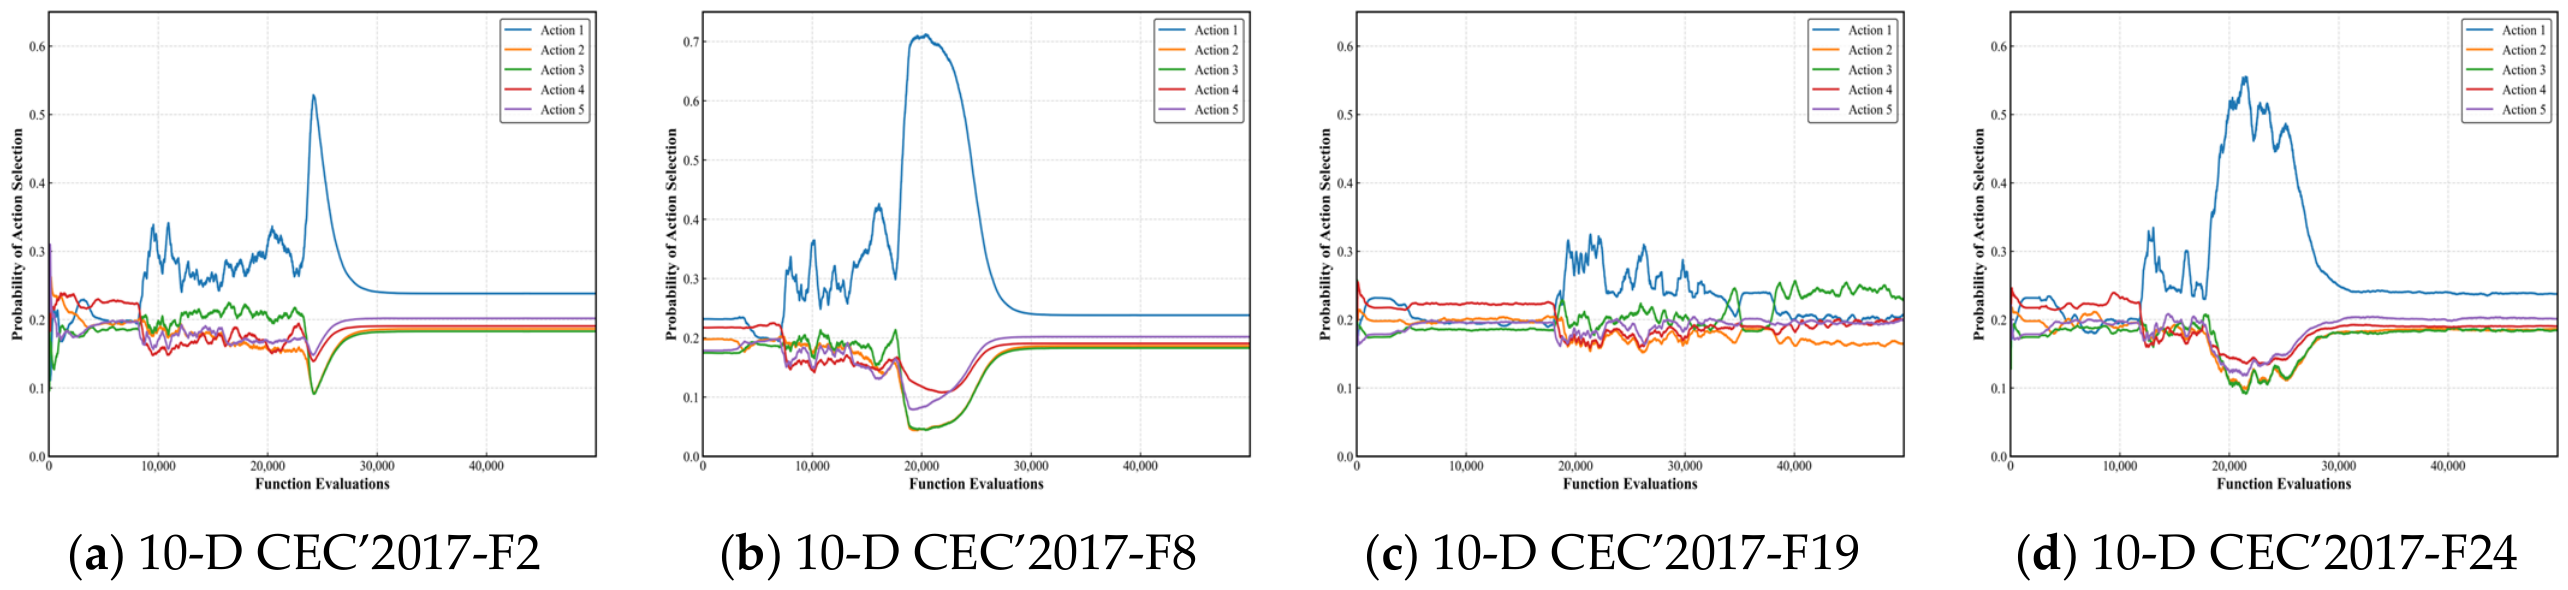
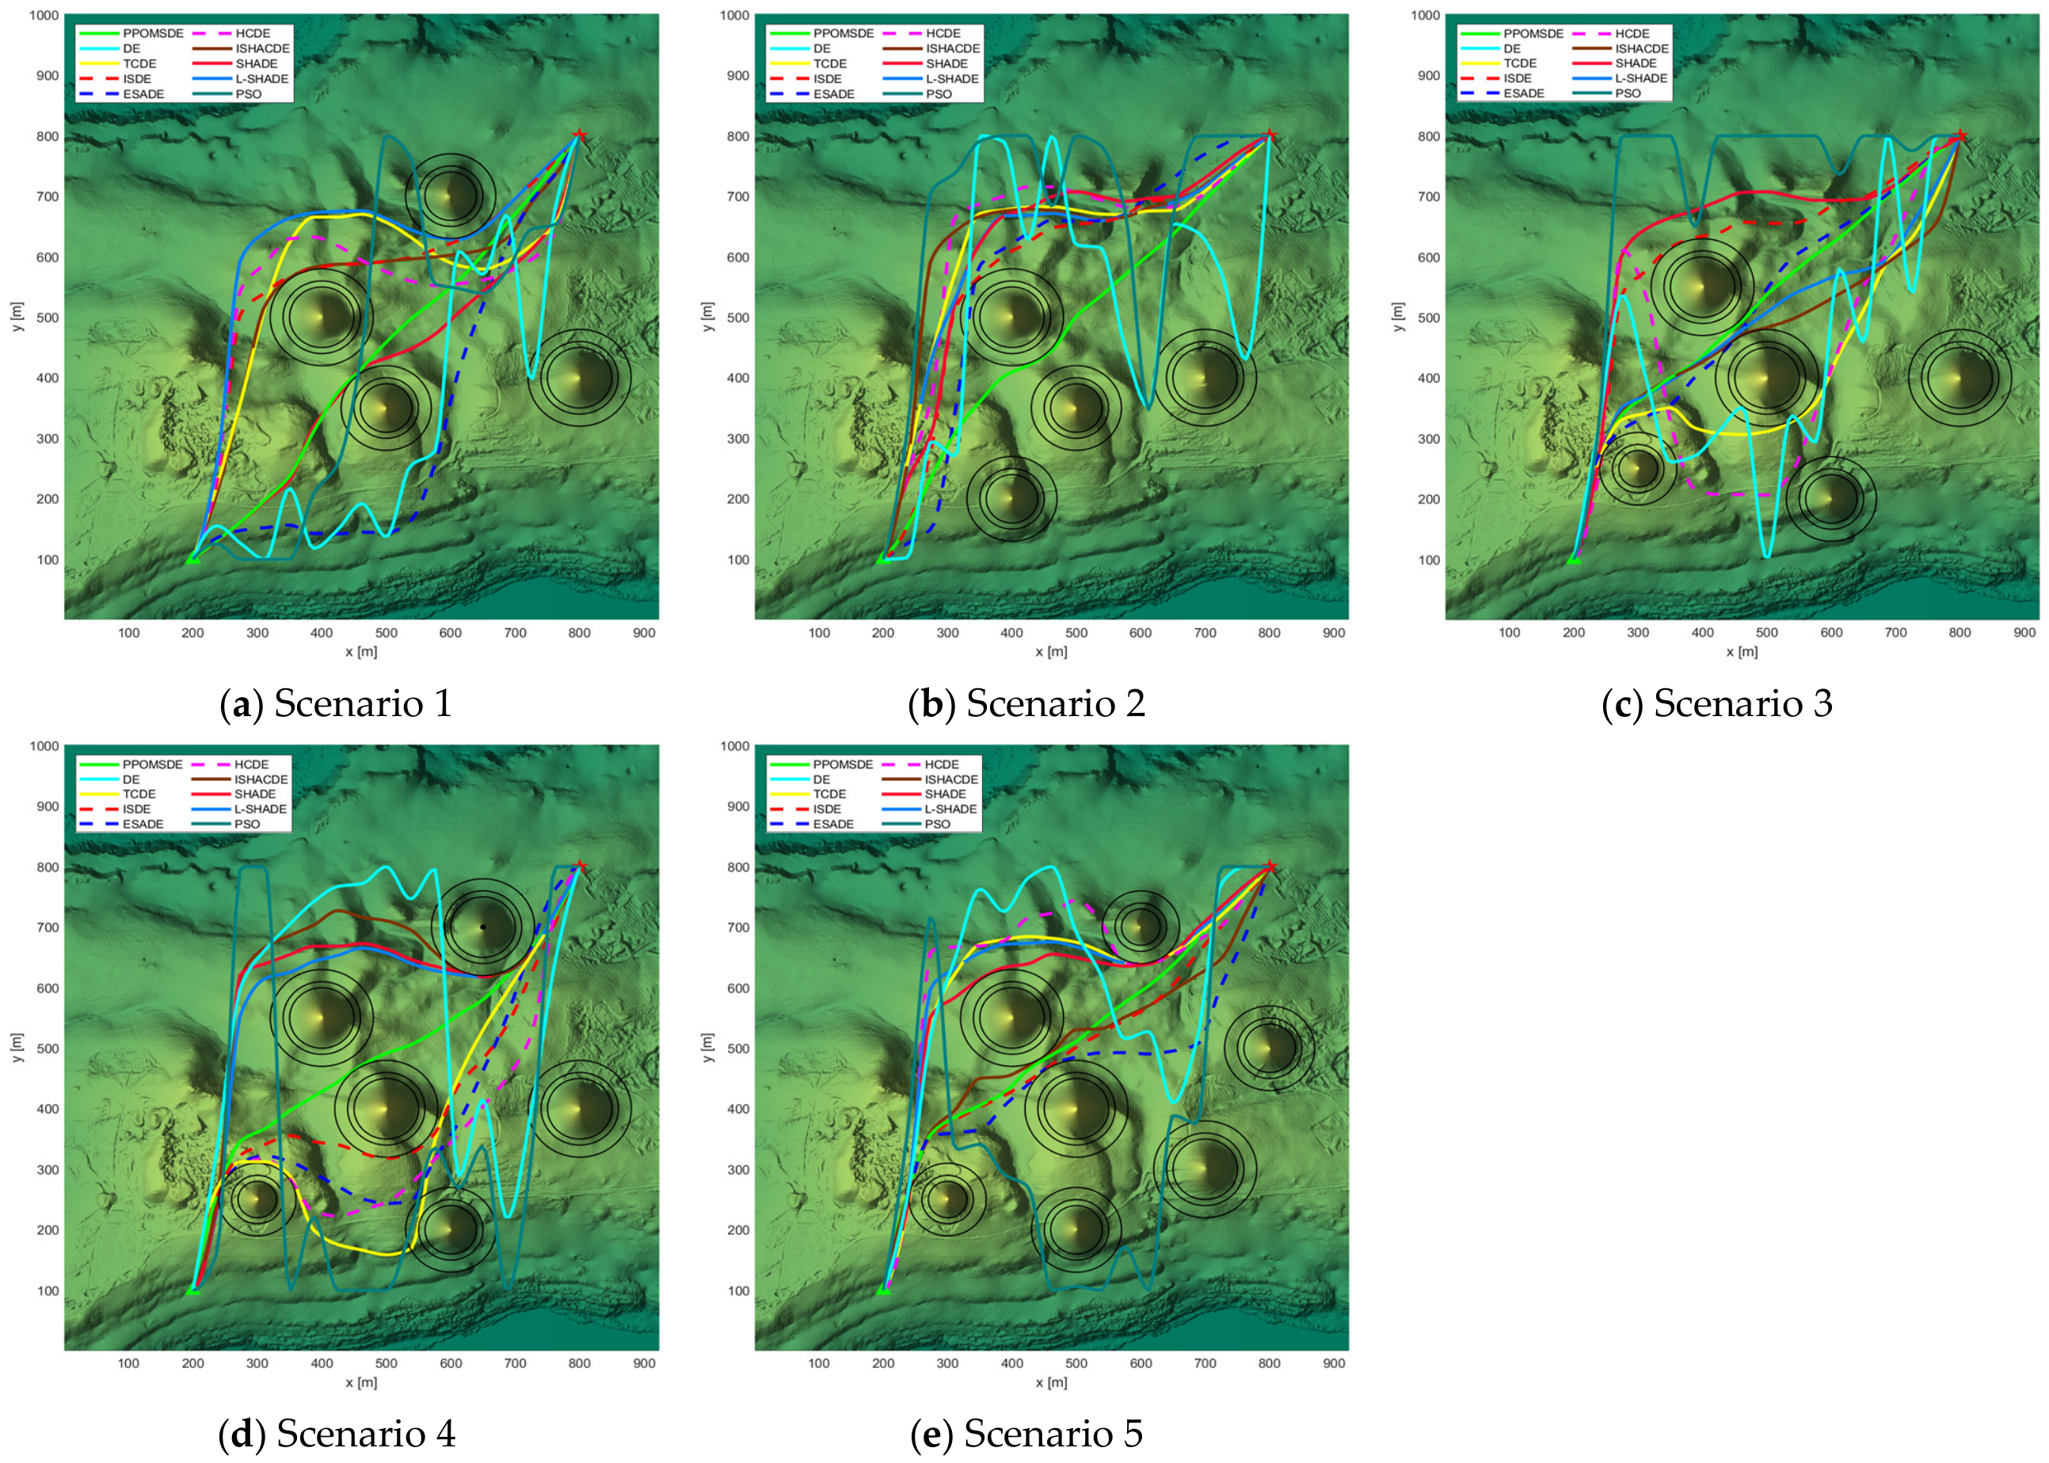
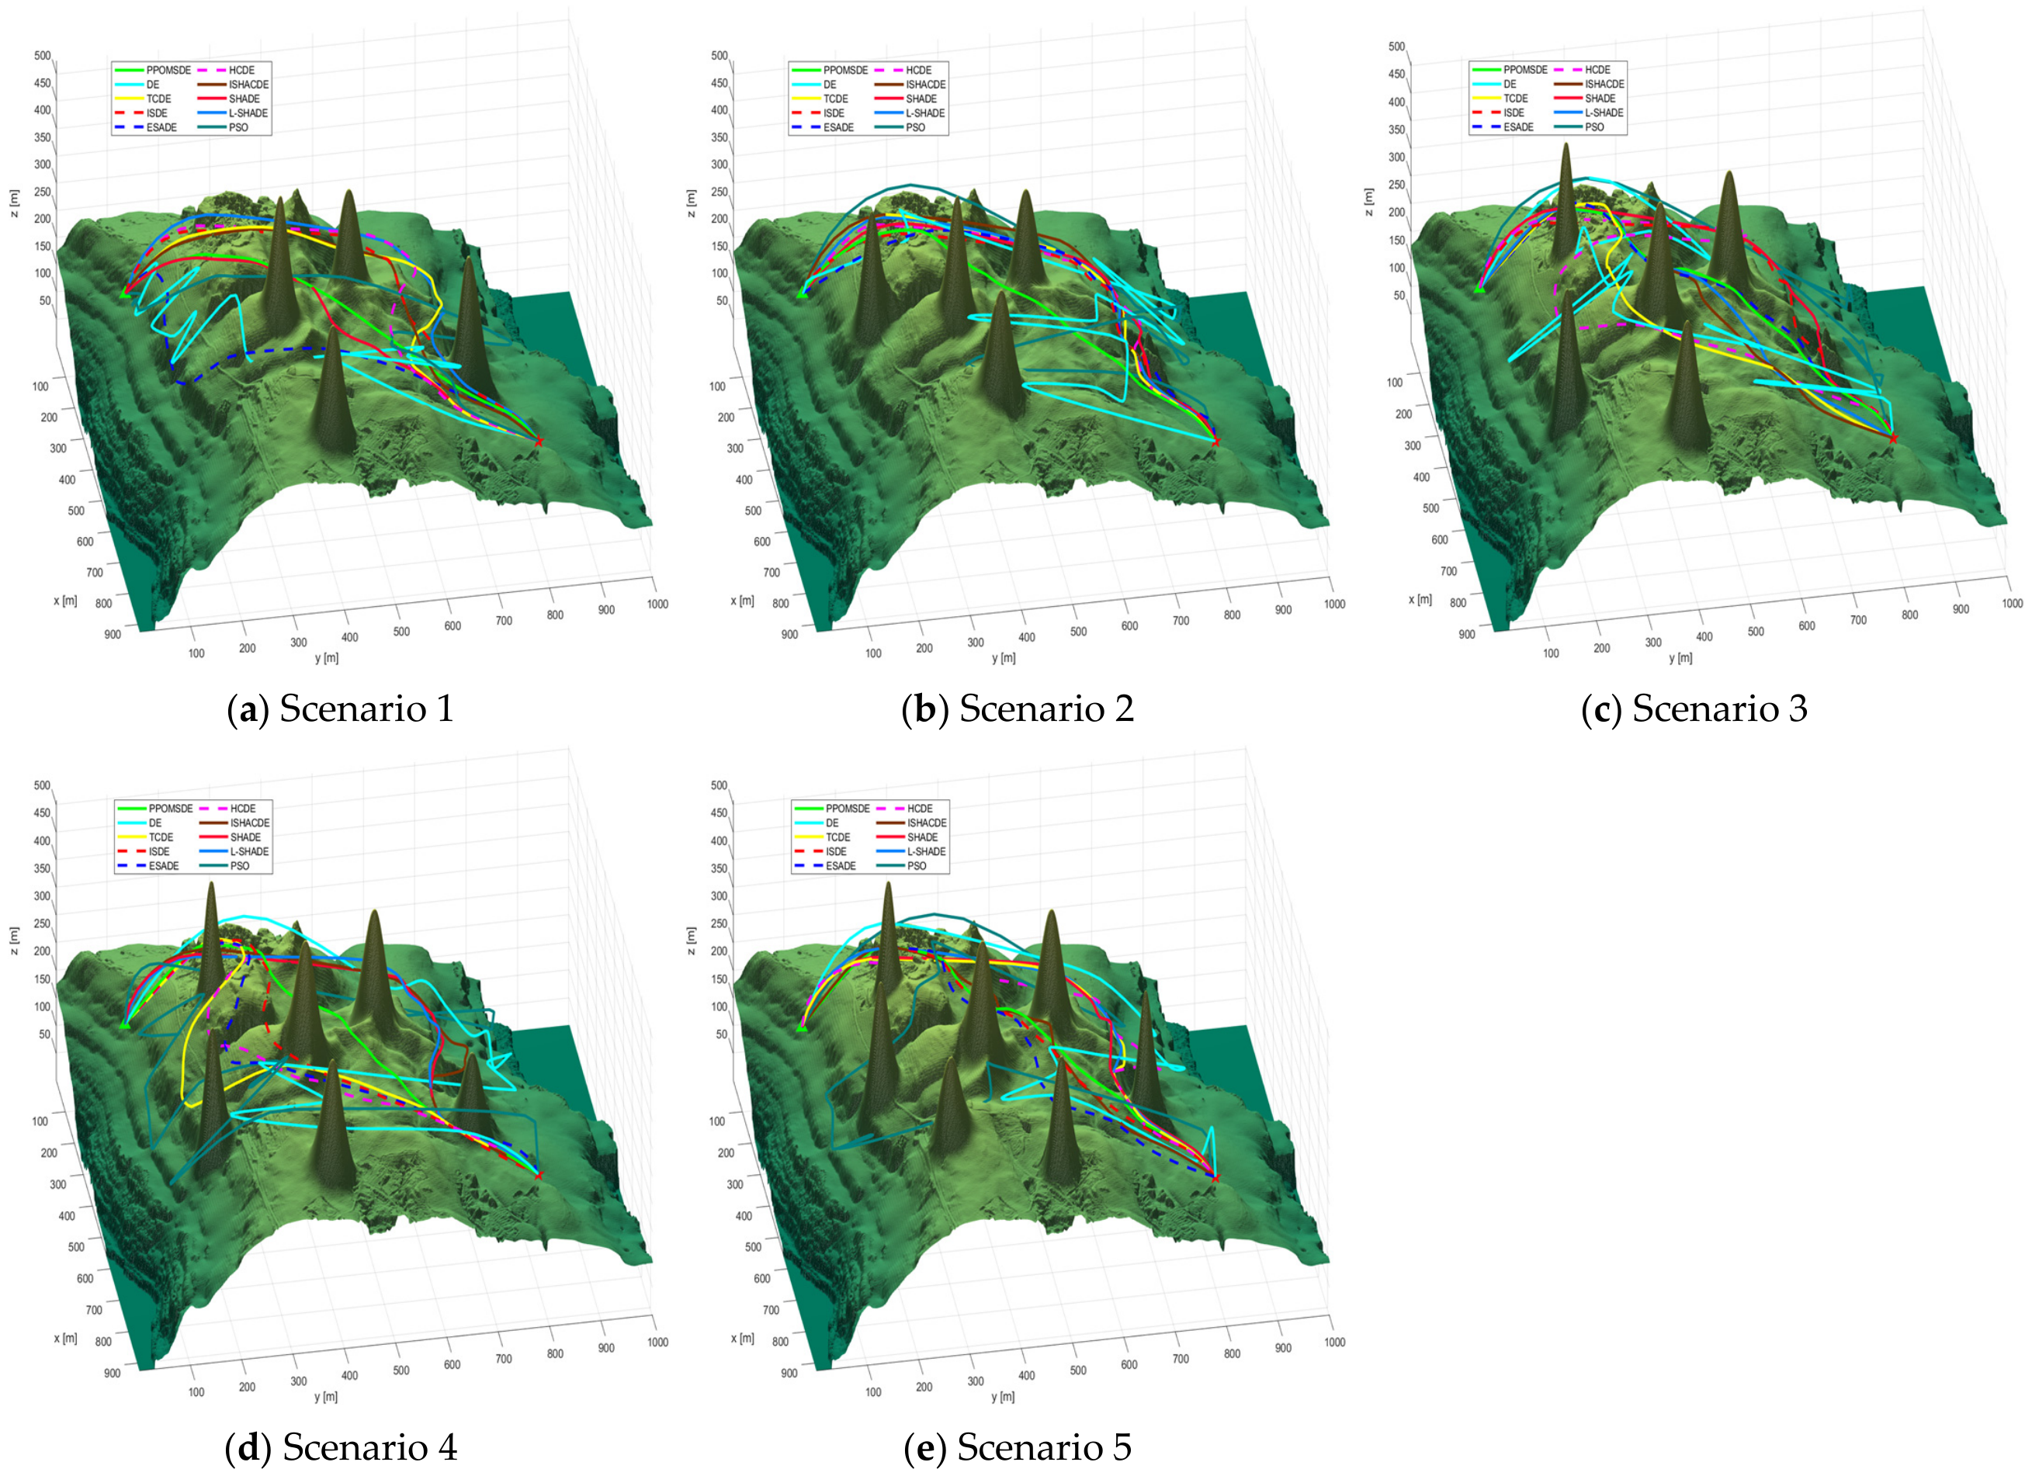

Disclaimer/Publisher’s Note: The statements, opinions and data contained in all publications are solely those of the individual author(s) and contributor(s) and not of MDPI and/or the editor(s). MDPI and/or the editor(s) disclaim responsibility for any injury to people or property resulting from any ideas, methods, instructions or products referred to in the content. |
© 2026 by the authors. Licensee MDPI, Basel, Switzerland. This article is an open access article distributed under the terms and conditions of the Creative Commons Attribution (CC BY) license.