


Abstract
Mountain dairy farms rely heavily on locally produced forage and are therefore vulnerable to wildlife pressure on permanent grasslands. This single-farm pilot case study quantifies the farm-level economic effects of damage caused by red deer (Cervus elaphus) on a dairy farm in Slovenia’s Pohorje mountain region. A simulation-based cost assessment framework links deer grazing and winter trampling to forage loss, ration energy and protein supply, milk yield, production costs, and a farm-budget revenue-to-cost indicator. Under the baseline assumptions, one adult deer causes an estimated annual loss of EUR 270.52, whereas the modal presence of 10 deer results in total damage of EUR 2705.24 and reduces the financial result by 8.69%. The study’s novelty lies in tracing direct grassland losses and indirect, nutrition-mediated milk losses within a single auditable farm-level accounting chain. We also audit an archived exploratory Monte Carlo workbook to document its intended uncertainty inputs. Because the financial-output formulas are incomplete, the workbook does not support reproducible probability statements. As the framework is calibrated to a single farm, the deterministic results are conditional case-study estimates and are not intended for regional generalization, forecasting, or econometric inference.
1. Introduction
Milk production is a central component of European agriculture, contributing to food security, rural incomes, and the stability of agricultural markets. Although the largest volumes originate from more intensive lowland systems, dairy farming in mountain regions remains important because it combines food production with landscape maintenance, limits land abandonment, and supports settlement in less-favored areas [1,2]. The long-term viability of these systems is increasingly shaped by interactions between agricultural land use and large herbivores across Europe [3,4,5,6].
In this broader European context, mountain dairy systems depend particularly heavily on permanent grasslands because rugged terrain, shorter growing seasons, and limited mechanization constrain alternative forage production. In 2024, Slovenia produced approximately 609,000 tonnes of cow’s milk across about 7900 agricultural holdings [7]. Permanent grasslands are both a core forage resource and a source of wider ecosystem services, including biodiversity conservation, carbon storage, water regulation, erosion control, pollination, and cultural landscape values [8,9].
This dependence on grassland creates a direct pathway through which wildlife can affect mountain dairy farming. Red deer (Cervus elaphus) and wild boar (Sus scrofa) are among the most relevant species in European grassland agroecosystems. Grazing, browsing, rooting, and trampling can reduce biomass, damage the sward, alter plant composition, compact soil, and lower infiltration capacity. These effects reduce both the quantity and quality of forage available to livestock [3,4,5,6,10].
The effects extend from the grassland to the dairy herd. When forage availability no longer meets the ration’s energy and protein requirements, potential milk yield declines, and nutritional stress may increase animal-health and management risks [11,12]. Mountain farms may be especially vulnerable because production depends heavily on locally produced roughage, while replacement feed can be costly or logistically difficult to obtain.
From an economic perspective, wildlife damage affects both costs and revenues. Lower roughage yields can increase the need for purchased feed or constrain herd output, while reduced milk production lowers sales revenue and raises unit production costs. Transport costs, feed-price volatility, and repeated damage add further uncertainty. Compensation schemes may offset part of the visible direct loss, but they often exclude indirect production losses, additional labor, animal-health costs, and opportunity costs [5,12,13,14,15].
Although wildlife damage in agriculture has been studied extensively, most analyses focus on crop losses, direct grassland damage, or wildlife population management. Evidence that follows the full causal chain from wildlife use of grassland through forage loss and ration constraints to milk output and farm financial performance remains limited, particularly for mountain dairy systems with restricted capacity for feed substitution and production adjustment [4,10]. This gap motivates a farm-level simulation-based cost assessment framework that makes the biological and accounting relationships explicit rather than extrapolating directly to a regional population of farms.
Recent dairy research shows that milk output can vary substantially with forage type and feeding structure, supporting the need to make the nutrition-to-milk pathway explicit when economic losses are attributed to forage deficits [11]. Input-oriented variable-returns-to-scale data envelopment analysis (VRS DEA) has been used to benchmark the efficiency of dairy farms with multiple inputs [16]. However, because the present dataset contains only one farm, DEA cannot be validly estimated; the reported performance indicator is therefore interpreted as a farm-budget revenue-to-cost ratio rather than a frontier-based technical-efficiency score.
The scientific novelty of this study lies in integrating, within a single auditable farm-level chain, three components that are commonly assessed separately: (i) wildlife-related forage removal and winter sward damage; (ii) the nutrition-mediated effect of reduced forage availability on potential milk output; and (iii) the resulting change in farm financial performance. The retained exploratory Monte Carlo workbook is treated as an archival uncertainty specification rather than as a validated stochastic model. The study therefore contributes a transparent framework for quantifying indirect production losses alongside visible grassland damage and explicitly identifies the information required for a reproducible uncertainty extension.
Accordingly, this single-farm pilot study evaluates how wildlife pressure can affect the economics of milk production on a mountain dairy farm. The analysis links grassland damage to forage availability, ration composition, milk yield, production costs, and farm-level financial performance. Using a deterministic simulation-based cost assessment framework and cost–benefit analysis (CBA), the study compares a counterfactual no-damage scenario with a damage scenario calibrated to a long-established dairy farm in the Pohorje region. The archived Monte Carlo workbook is examined separately to document its intended input uncertainty and limitations regarding reproducibility. The aim is to evaluate a transparent assessment structure and identify the parameters and data controls required before the framework is applied to other farms, rather than to estimate regional effects, forecast wildlife damage, or perform econometric inference. The following analytical propositions are examined:
- -
- Within the framework assumptions, the economic value of grassland damage increases as the number of red deer using the case-farm grasslands increases.
- -
- Reduced roughage availability lowers the feed available per cow and, through the ration calculation, reduces potential milk production.
- -
- Wildlife-related damage lowers the farm-level revenue-to-cost ratio, with and without subsidies.
2. Materials and Methods
2.1. Study Area and Description of the Production System
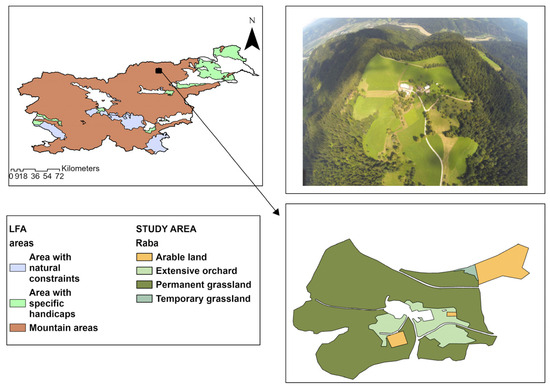
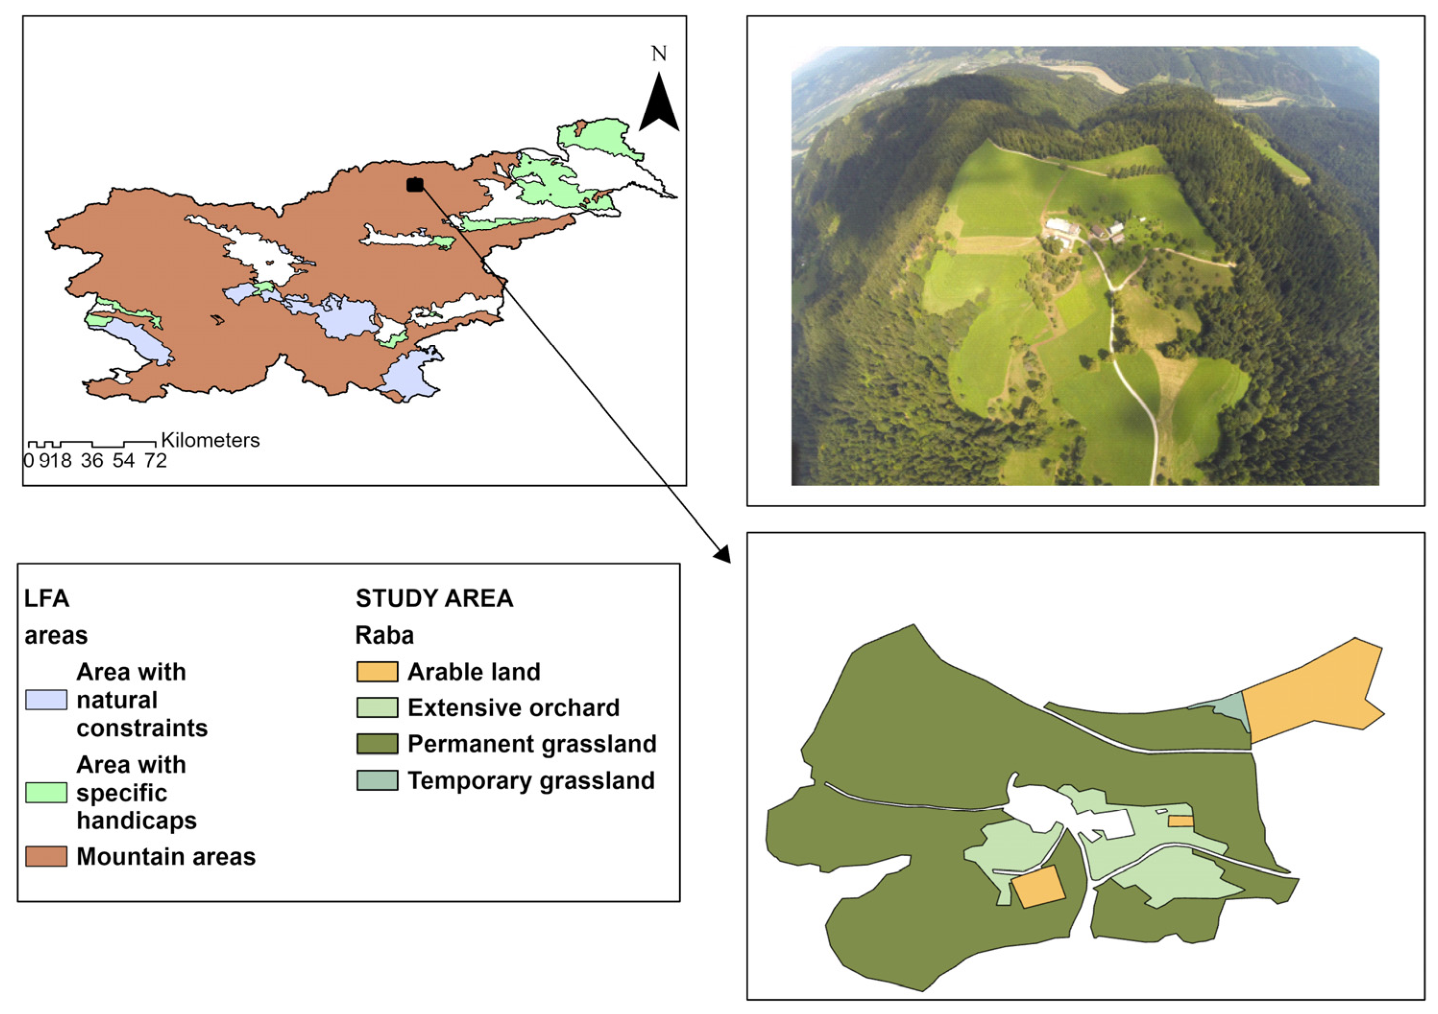
The Kajžer farm served as the empirical case study and calibration setting for the assessment framework, rather than as the site of a controlled field experiment. The farm is located at approximately 800 m above sea level on the northern slopes of the Pohorje region in northern Slovenia (46.57° N, 15.26° E; Figure 1). The earliest records of a celk (a farm whose land is consolidated into a single, continuous unit) date to 1600. Milk production has continued for 56 years and accounts for approximately 40% of total farm income. The herd comprises about 20 dairy cows and 15 replacement heifers and produces approximately 150,000 L of milk annually; the milk is sold to a dairy processor for commercial processing. Most roughage is produced on the farm, while purchased feed is used mainly to supplement the ration. Farm observations suggest that nocturnal deer use of the grasslands increased around 2020; recent observations typically range from 8 to 12 adult animals per night, with a modal value of 10. This statement refers only to local use of the case-farm grasslands and should not be interpreted as evidence of regional deer-population growth. These characteristics delimit the empirical scope of the single-farm case study and are not assumed to represent mountain dairy farms more broadly.
Figure 1.
Study area and land-use structure of the Kajžer mountain farm in northern Slovenia.
The agricultural area of the Kajžer farm is dominated by permanent grassland, reflecting the central role of forage-based dairy production (Table 1). The parcels have an average elevation of 792 m and a mean slope of 14.4°, indicating challenging terrain and limited mechanization potential. These parameters are important for transferability: applying the framework to other Alpine or mountain farms requires recalibration of land-use shares, slope-related machinery and labor costs, forage yields, herd size, ration composition, wildlife abundance, and access to purchased feed. Farms with flatter terrain, longer growing seasons, greater forage self-sufficiency, or easier access to substitute feed may experience materially different economic effects under the same level of wildlife pressure.
Table 1.
Land-use structure and topographic characteristics of agricultural parcels at the Kajžer mountain farm.
2.2. Data Collection
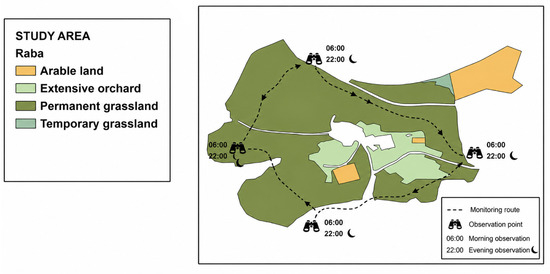
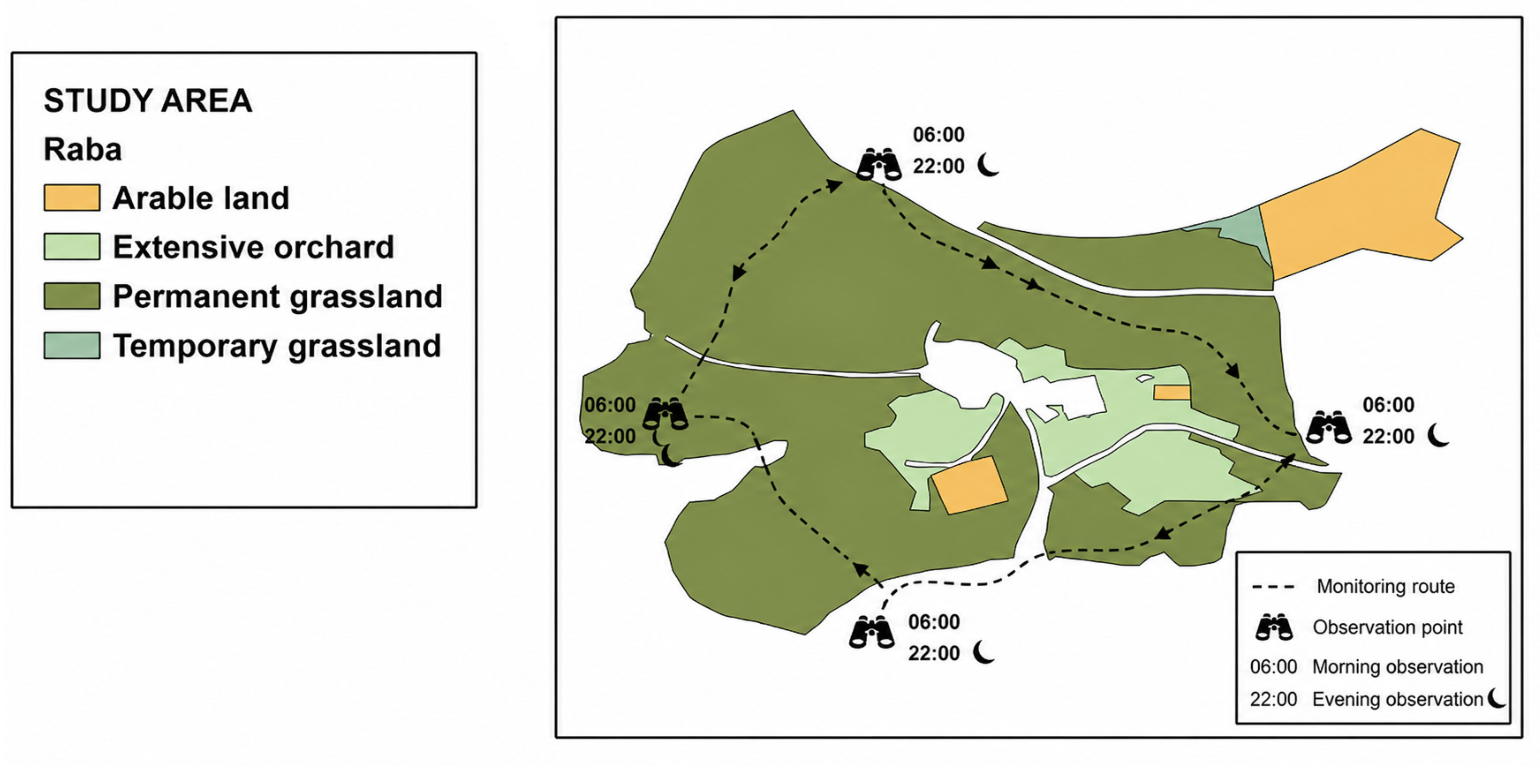
The empirical inputs combined farm-monitoring records, farm-accounting data, forage-production calculations, and dairy-ration data. Wildlife use of the grasslands was observed twice daily, at approximately 06:00 and 22:00, using night-vision equipment at the four predefined observation locations shown in Figure 2. The monitoring was intended to document the number of adult deer regularly using the case-farm grasslands without disturbing the animals; the modal nightly count was therefore used as a descriptive framework input rather than as an estimate of regional deer density. The archived source files available for this revision do not preserve a verifiable record of the number of observers or the exact number of observation days, so these values were neither reconstructed nor used as inferential sampling parameters. For scaling purposes, one livestock unit (LU) was defined as 500 kg of live weight; an adult deer with an average live weight of 250 kg was therefore represented as 0.5 LU. Economic inputs, including purchase prices, production costs, subsidies, and feed-ration data, were obtained from the Kajžer farm’s accounting and calculation workbooks.
Figure 2.
Study area of the Kajžer farm showing land-use categories, the four predefined wildlife-observation locations, and the morning (06:00) and evening (22:00) monitoring schedule used to derive the descriptive modal deer count.
2.3. Simulation-Based Cost Assessment Framework
The core analysis is a deterministic, spreadsheet-based cost assessment framework implemented in Microsoft Excel and calibrated to the Kajžer case farm. It combines accounting relationships with the farm’s forage-production and dairy-ration calculations; it is not a formal production function, optimization model, econometric model, or forecasting model. Farm cost calculations were used to estimate the unit costs (UCs) of fresh grass and milk production. Unit cost is defined as UC = TC/Y, where TC is total cost and Y is the relevant physical output. For grass production, Y is measured in kilograms of fresh matter; for milk production, it is measured in liters of milk per cow over a standard lactation. The reference dairy calculation assumes approximately 8000 L per cow per standard lactation. These farm-specific unit costs are accounting inputs to the single-farm assessment rather than population estimates.
The framework separates three damage channels: (i) fresh-grass removal through deer grazing; (ii) deep winter grazing and trampling, including the associated first-cut yield loss and sward-restoration costs; and (iii) milk-revenue loss caused by reduced forage availability. Grazing loss is estimated from the observed modal deer count and the biological assumptions stored in the source workbook, rather than from a direct exclosure-based biomass experiment. In the baseline calibration, one adult deer equals 0.5 LU. Assuming a minimum requirement of 40 kg of fresh biomass per LU per day, with 60% of intake attributed to farm grasslands over a 180-day grazing period, forage removal is estimated at 2160 kg of fresh matter per deer per season. Its monetary value is calculated by multiplying the lost fresh matter by the farm-specific unit cost of pasture grass. Winter damage is parameterized separately in the source workbook as a 5% loss of first-cut yield on the affected area, together with sward-restoration costs. For the modal 10-deer scenario, this corresponds to 3543 kg of lost green mass valued at EUR 246.98. The third channel is not imposed as a fixed percentage: forage loss is entered into the dairy-ration calculation, which recalculates the milk yield supported by the ration’s energy and protein supply.
For scenario i, the reduction in fresh-grass allowance per cow and grazing day is ΔG_i = K_i/(N_c × D_g), where K_i is deer-related forage loss (kg fresh matter), N_c is the number of dairy cows (20), and D_g is the grazing period (180 days). The available pasture allowance is G_i = G_0 − ΔG_i, with G_0 = 40 kg fresh matter cow−1 day−1 in the baseline ration.
The spreadsheet ration calculation then recalculates net energy for lactation (NEL) and protein balance in the small intestine (PSB). Daily milk potential is calculated from the energy- and protein-based relationships used in the supplied workbook, M_E,i = (NEL_i − NEL_m)/3.17 and M_P,i = (PSB_i − PSB_m)/68, where 3.17 MJ NEL kg−1 milk and 68 g PSB kg−1 milk are the conversion coefficients used in the calculation. The daily estimated milk yield is M_i = (M_E,i + M_P,i)/2.
The no-damage ration calibration divides the standard 305-day lactation into 152.5 barn-feeding days and 152.5 grazing days. In the retained deterministic workbook, the winter ration has a basic roughage cost of EUR 3.50 cow−1 day−1 plus EUR 1.79 cow−1 day−1 for concentrates and supplements, and supports 27.40 L cow−1 day−1. The grazing-period ration has corresponding costs of EUR 4.29 and EUR 2.46 cow−1 day−1 and supports 26.28 L cow−1 day−1. These are case-farm calibration inputs from the source workbook, not population-level estimates.
Annual milk loss is calculated as ΔM_i = N_c × [Y_0 − Y_i], where Y_i = 152.5 × M_w + 152.5 × M_i and Y_0 is the corresponding no-damage lactation yield. For the baseline case, one deer removes an estimated 2160 kg of fresh grass per season, equivalent to 0.6 kg cow−1 grazing-day−1 for a 20-cow herd; the ration calculation translates this deficit into approximately 11.91 L less milk per cow per lactation, or 238.13 L for the herd per deer. This explicit linkage allows it to be reproduced from the forage-loss assumptions. Recent feeding studies provide a useful external benchmark for the principle that different forage structures lead to measurable differences in milk output, although their production environments differ from the present Alpine case [11].
The revenue-to-cost ratio used in this study is total revenue divided by total cost, calculated both with and without subsidies. It is a farm-budget accounting indicator and should not be interpreted as a frontier-based measure of technical efficiency. Multi-input VRS DEA approaches, such as those applied to dairy farms by Zuniga-Gonzalez et al. [16], require a cross-sectional or panel sample of decision-making units and therefore cannot be validly estimated from the present N = 1 dataset. A future multi-farm extension could compare the budget-based ratio with DEA or stochastic-frontier measures.
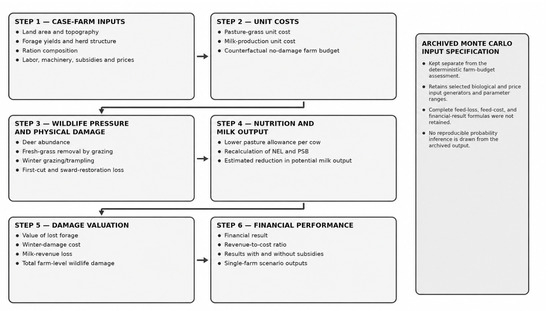
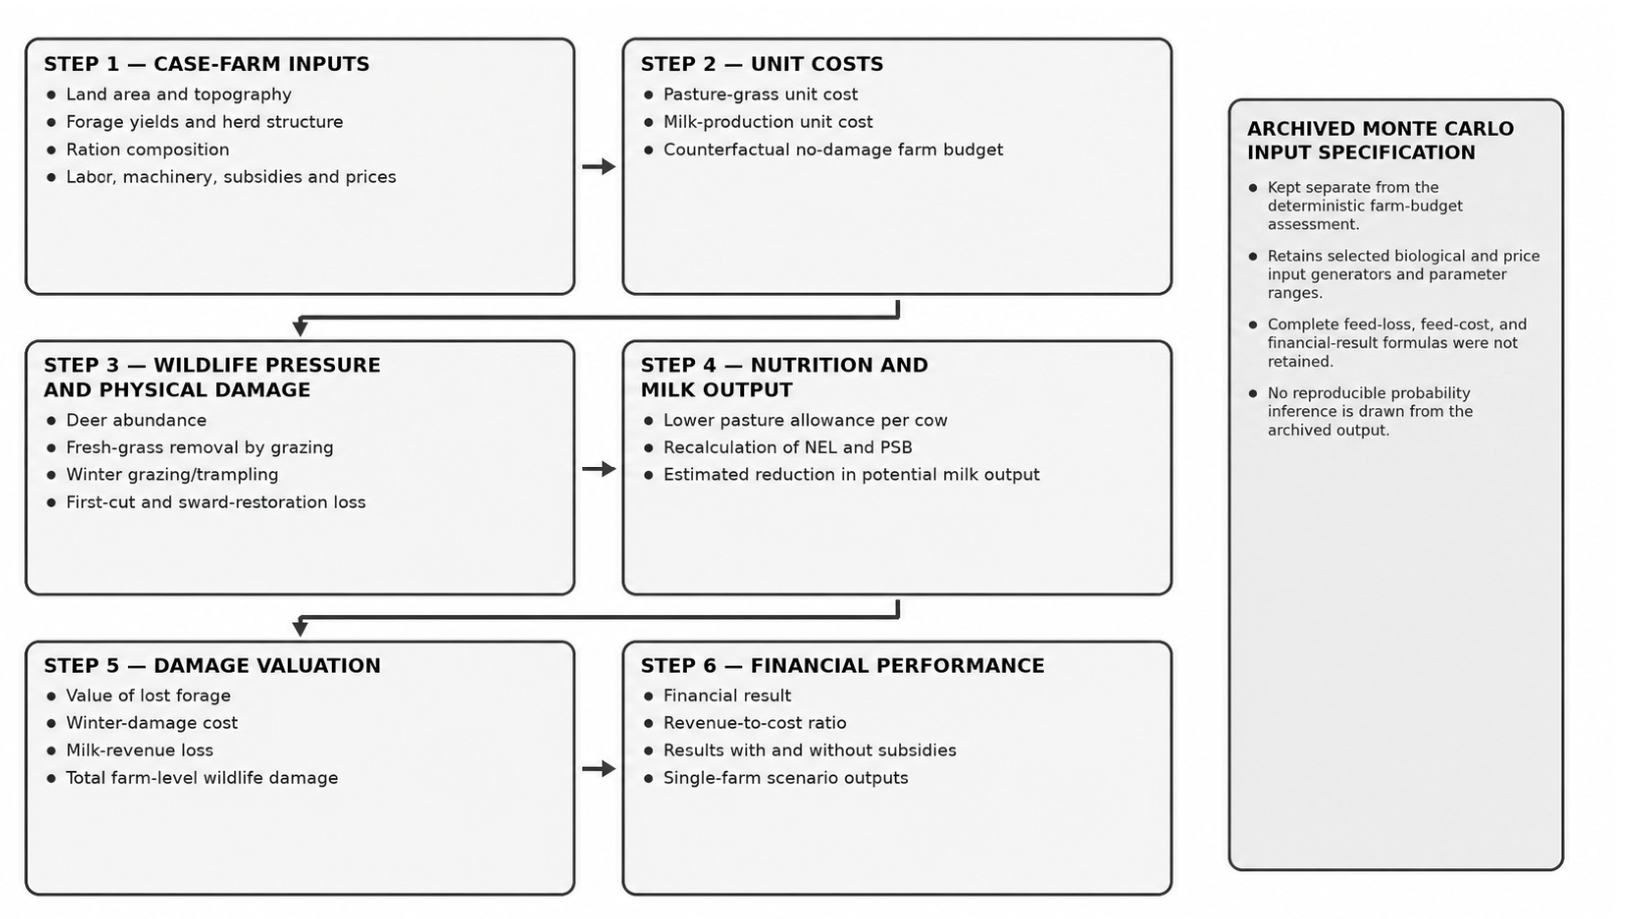
The deterministic cost assessment framework was implemented in Microsoft Excel using the computational workflow summarized in Figure 3. The workbook integrates farm-budget inputs, forage-production costs, dairy rations, deer-abundance scenarios, grazing losses, winter damage, subsidies, and the resulting financial indicators. A separate archived workbook documents the intended Monte Carlo input generators but does not preserve a complete, auditable calculation of financial outputs. Neither component is intended for forecasting, optimization, or econometric estimation. The version of Microsoft Excel used for the original calculations was not recorded in the archived project files.
Figure 3.
Computational workflow of the deterministic Microsoft Excel-based single-farm simulation-based cost assessment framework. Steps 1–6 show the sequential calculation from case-farm inputs to farm-level financial performance. The archived Monte Carlo input specification is shown separately because it is not part of the deterministic calculation. NEL, net energy for lactation; PSB, protein balance in the small intestine.
Figure 3 should be read sequentially from Step 1 to Step 6. Step 1 specifies the case-farm parameters: land area and topography, forage yields, herd size, ration composition, labor and machinery costs, subsidies, and market prices. Step 2 calculates the unit costs of grass and milk. Step 3 converts deer abundance into direct grazing loss and winter sward damage. Step 4 translates forage loss into a lower pasture allowance per cow and recalculates the milk output supported by NEL and PSB. Step 5 values the reduction in milk sales and combines all damage channels with the farm budget. Step 6 calculates total revenue, total cost, the financial result, and the revenue-to-cost ratio with and without subsidies. The right-hand panel is not part of the deterministic workflow; it summarizes the separate archived Monte Carlo input specification. Because the archived workbook does not preserve a complete, auditable financial-output calculation, this panel documents intended uncertainty inputs only and does not support reproducible probabilistic inference. The deterministic framework is calibrated only to the Kajžer farm; application to another farm requires replacing the farm-specific inputs described in Section 2.1 and Section 2.2.
2.4. Financial Analysis
The financial analysis compares two farm-budget scenarios: a counterfactual no-damage scenario and a wildlife-damage scenario. Before the financial comparison, damage is estimated by combining the three channels defined in Section 2.3: the value of grass removed by deer; the value of winter grazing, trampling, and first-cut yield loss; and the milk-revenue loss generated by the ration calculation. This structure allows the economic effect to be traced from the biological input to the final farm result.
- -
- A counterfactual no-damage budget representing the same farm under the baseline production and price conditions but without wildlife-related forage and milk losses.
- -
- A damage budget in which deer grazing, winter sward damage, and the modeled reduction in milk output are included.
Both scenarios use the same farm structure and the input and output prices recorded for March 2026; the difference between them therefore isolates the modeled effect of wildlife damage under the case-study assumptions.
For deer-abundance scenario n, total framework-estimated damage is D_n = G_n + W_n + P_mΔM_n, where G_n is the monetary value of fresh-grass loss, W_n is winter grazing/trampling and first-cut loss, P_m is the milk price, and ΔM_n is the reduction in milk sold generated by the ration calculation. The financial result is calculated as total revenue minus total cost. The damage scenario is compared with the no-damage baseline in EUR and calculated as the percentage reduction in the financial result. Baseline production costs are held constant in this comparison because the estimated loss occurs after the farm has already incurred the principal costs of grassland management and herd maintenance.
The revenue-to-cost ratio is calculated as total revenue divided by total cost, both with and without subsidies. It is used only as a farm-budget performance indicator to show how wildlife-related losses change the relationship between revenues and costs; it is not interpreted as a frontier-efficiency estimate.
2.5. Audit of the Archived Monte Carlo Input Specification
The retained Monte Carlo workbook was designed as an exploratory uncertainty layer around the farm-budget cost assessment framework. It was intended to examine how variation in selected biological and price parameters might affect the conditional farm financial result, not to forecast outcomes or support inference to a population of farms. For transparency, the intended financial-result specification is formalized as follows:
where FR_i is the farm financial result in simulation i, R_0 is baseline farm revenue before wildlife damage, SUB denotes subsidies, C_0 is baseline production cost, P_k,i is the unit value of lost forage, K_i is deer-related forage loss, W_i is winter grazing/trampling damage, P_m,i is the milk price, ΔM_i is milk-production loss, and N is the number of Monte Carlo iterations. All wildlife-related loss terms enter the financial result with a negative sign.
An audit of the retained Monte Carlo file confirmed 3000 simulation rows and the RAND()/RANDBETWEEN() input generators listed in Table 2. However, the archived worksheet does not contain complete formulas for feed loss, feed cost, or the farm financial result, and the stored milk-revenue-loss expression does not apply the independently sampled milk price. Consequently, the retained workbook documents the intended input design but does not support exact recalculation of the reported distribution of financial results. In Table 2, J denotes adult deer abundance, U(a,b) a continuous uniform distribution, and SD the standard deviation.
Table 2.
Archived Monte Carlo input generators, parameter ranges, nominal distributions, and implementation settings.
The deterministic scaling relationships that connect deer abundance with forage loss and winter damage are as follows:
where J_i is the number of adult deer in iteration i, 0.5 is the livestock-unit equivalent per adult deer used in the case framework, 40 kg is the assumed daily fresh-matter requirement per livestock unit, 0.60 is the share assumed to be consumed on farm grasslands, D_g = 180 grazing days, W_ref is winter damage in the 10-deer reference case, and J_ref = 10. The resulting K_i is subsequently converted into the per-cow forage deficit and milk-output loss through the nutrition-to-milk relationships described in Section 2.3.
3. Results
At a broader scale, permanent grasslands provide multiple ecosystem services, while the economic magnitude attributed to wildlife damage depends strongly on which direct and indirect losses are captured by the assessment data [8,13,14]. The literature documents ecological, production, and economic interactions between wildlife and livestock, with particularly strong effects where large-herbivore pressure overlaps with forage-based farming systems [3,4,5,6,10,17,18,19,20]. However, because the empirical component of this study is a single-farm case, these comparisons are used for contextual interpretation rather than statistical generalization.
Research indicates that conflicts in areas with high wildlife pressure, particularly in higher-altitude regions, can materially affect livestock farming, with impacts varying according to landscape context and proximity to wildlife habitat [3,4,5,6,12]. In mountain areas, purchasing replacement feed may create a substantial financial burden because transport is costly and suitable feed may not always be readily available. Such constraints can increase farm exposure to input-price volatility and reduce management flexibility. Wildlife–livestock interactions may also create animal-health risks, adding another source of farm-level uncertainty [12].
Damage-reporting and compensation systems may not capture all indirect losses; consequently, the farm-level economic effect can exceed the compensated visible damage. Assessment quality also depends on transparent definitions, documentation, and professional expertise, and incomplete reporting may lead to an understated picture of wildlife-related loss [13,14].
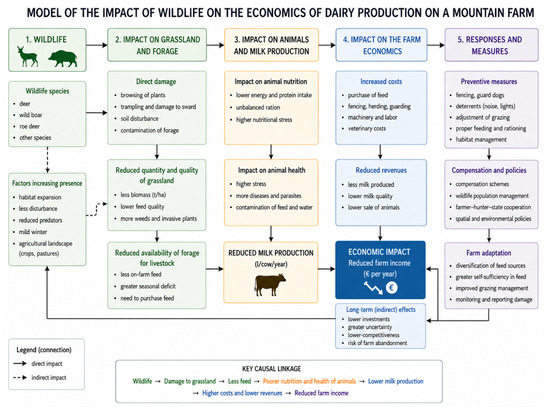
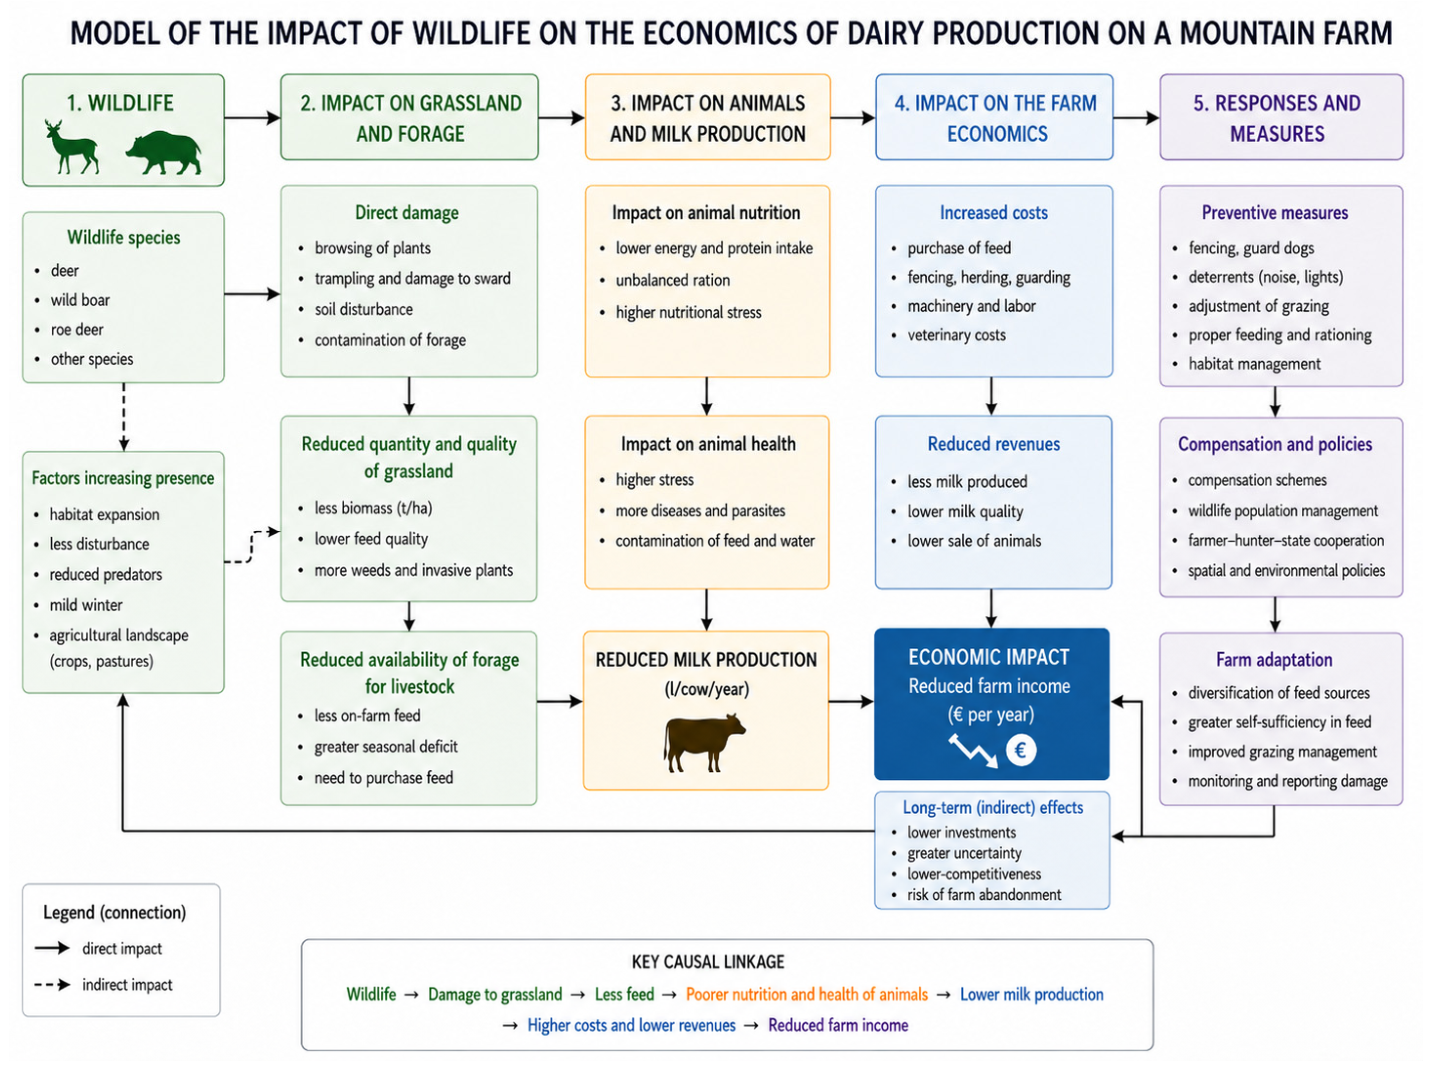
Mountain farms are particularly exposed where livestock production overlaps with wildlife habitat, while their capacity to diversify or replace locally produced forage may be constrained by terrain, farm size, and market access. These characteristics mean that even moderate grassland losses can affect farm-level economic stability. The principal causal pathways examined in this study, together with potential mitigation entry points, are summarized in Figure 4.
Figure 4.
Conceptual pathway linking wildlife pressure to grassland damage, forage loss, milk-production effects, farm-level economic performance, and potential mitigation responses.
Although wildlife-related agricultural damage is an international issue, its full farm-level economic consequences are not always captured when assessments focus only on visible physical damage. This is particularly relevant when compensation or reporting systems exclude indirect effects on feed availability, animal output, labor, and opportunity costs.
The conceptual scheme distinguishes direct grassland effects from indirect production and financial effects. It provides the interpretive structure for the deterministic results reported below and clarifies where monitoring, prevention, wildlife management, or compensation measures may intervene.
The deterministic assessment estimated the unit cost of pasture grass at EUR 0.06971 per kg of fresh matter Table 3. This reflects the relatively high labor requirements of maintenance mowing and organic-fertilizer application, as well as the need for machinery suitable for sloping terrain. The value is a case-farm accounting result rather than a regional forage-cost benchmark.
Table 3.
Results of the economic assessment using the single-farm simulation-based cost assessment framework.
Cows graze for approximately half of the year and receive a winter ration in the barn during the remaining period. The modeled unit cost of milk production is EUR 0.3368/L for a standard 305-day lactation. The ration combines farm-produced grass silage and hay with purchased maize silage, concentrates, and supplements. The March 2026 milk price used in the case budget is EUR 0.40/L. A South Tyrolean study reported unit costs of approximately EUR 0.40–0.50/L for small-scale mountain dairy farms, illustrating substantial variation in cost structures across mountain systems [17]. This comparison provides context but does not imply direct equivalence, because farm size, altitude, feeding systems, labor valuation, and accounting boundaries differ.
Using the calibration described in Section 2.3, the modal scenario of 10 adult deer corresponds to the modeled removal of 21,600 kg of fresh grass during the 180-day vegetation period. At the calculated pasture-grass unit cost, the direct grazing component is EUR 1505.74. The same parameterization yields a grazing-loss estimate of EUR 150.57 per deer. These values are deterministic case-study outputs and should not be interpreted as measured regional averages.
The modeled winter grazing/trampling component is EUR 24.70 per deer, or EUR 246.98 for the modal 10-deer scenario. This component represents the first-cut yield loss and sward-restoration effect specified in the source workbook. Together with the milk-production effect generated by the ration model, it forms the total damage estimate reported in Table 3.
Using the ration inputs specified in Section 2.3, the no-damage ration supports 27.40 L cow−1 day−1 during the barn-feeding period and 26.28 L cow−1 day−1 during the grazing period. The corresponding costs of the basic ration and supplementary feed are reported in the Methods because they are calibration inputs rather than results. The full modeled unit cost of milk is EUR 0.3368/L.
One deer removes 2160 kg of fresh grass per season; for a 20-cow herd over 180 grazing days, this equals 0.6 kg less fresh grass per cow per grazing day. The ration equations described in Section 2.3 translate this deficit into approximately 11.91 L less milk per cow per lactation, or 238.13 L for the herd. At EUR 0.40/L, the associated milk-revenue loss is EUR 95.25 per deer per grazing season.
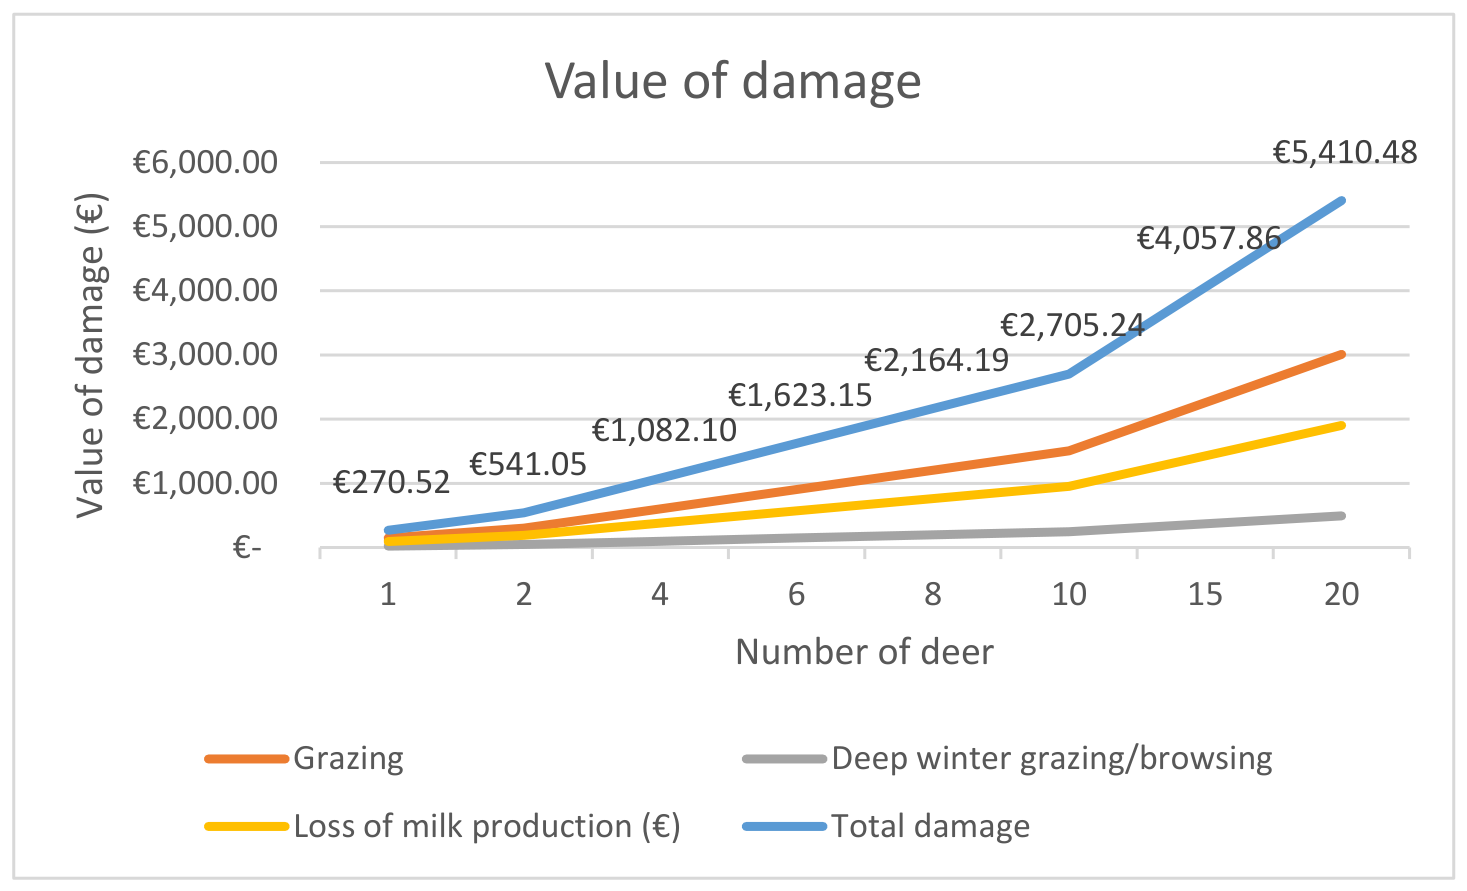
For one deer, the modeled value of grass removed by grazing is EUR 150.57 (2160 kg × EUR 0.06971/kg). Adding EUR 24.70 for winter grazing/trampling and EUR 95.25 in lost milk revenue gives total estimated damage of EUR 270.52 per deer. Relative to the no-damage case, this reduces the farm financial result by approximately 0.87%.
In the modal scenario of 10 adult deer, grazing removes an estimated 21,600 kg of fresh grass valued at EUR 1505.74; winter grazing and trampling account for EUR 246.98; and reduced milk output accounts for EUR 952.52. Total modeled damage is therefore EUR 2705.24 (Table 3). Relative to the no-damage scenario, the financial result decreases by 8.69%. The revenue-to-cost ratio falls from 1.45 to 1.41 when subsidies are included and from 1.34 to 1.30 when they are excluded. Across approximately 13 ha, total damage is equivalent to about EUR 208.10/ha, which lies within the range reported in related grassland-damage studies. This comparison provides a plausibility check for the case model but does not establish population-level external validity.
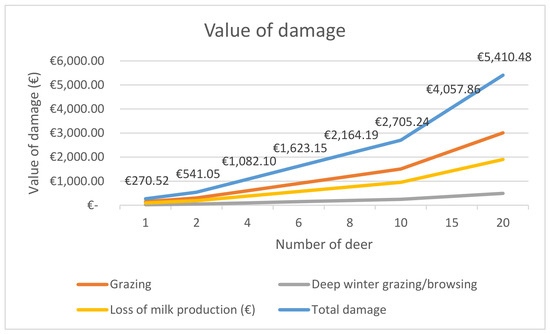
Figure 5 presents deterministic scenario outputs for increasing deer abundance. Each point is generated algebraically from fixed single-farm coefficients rather than estimated from repeated farm observations; therefore, the line should not be interpreted as a statistical regression, and inferential confidence intervals cannot be estimated from N = 1. The figure is presented as a deterministic scenario curve, while the archived exploratory uncertainty output is shown separately in Figure 6. This distinction avoids presenting scenario calculations as statistical inference.
Figure 5.
Deterministic single-farm scenario relationship between deer abundance and estimated annual damage. Values are framework outputs, not regression estimates; the archived exploratory uncertainty output is shown separately in Figure 6.
Figure 6.
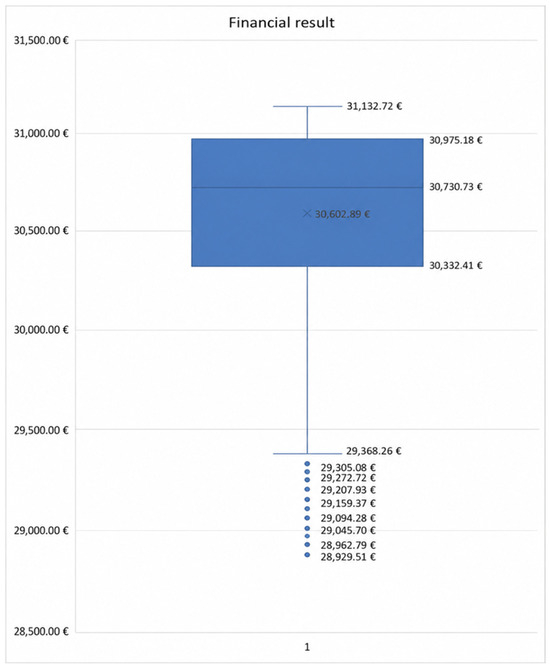
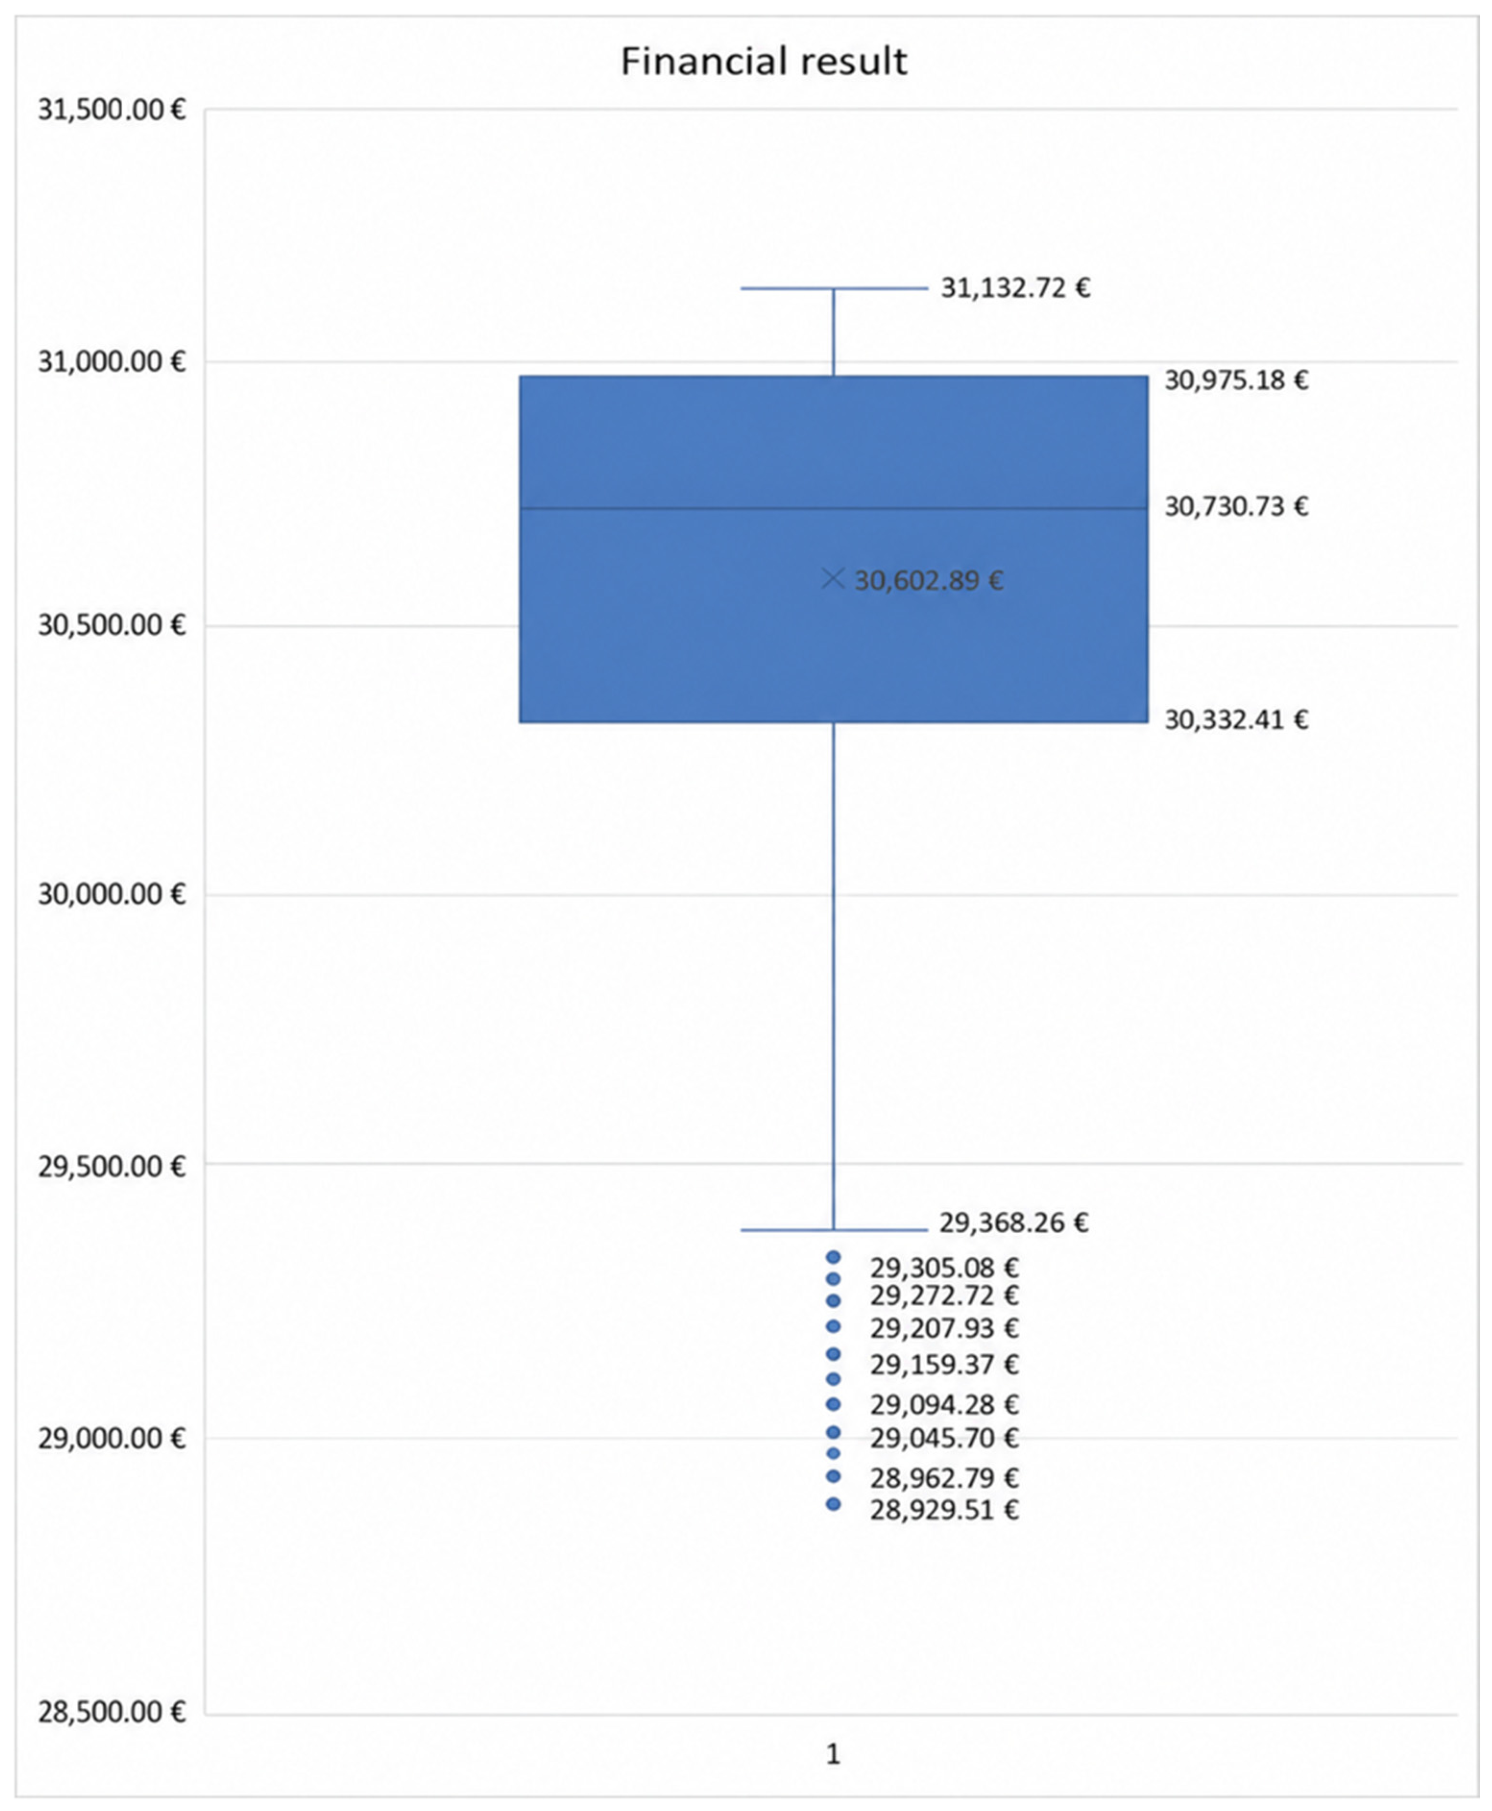
Archived box plot from the original exploratory Monte Carlo work (nominal N = 3000 input rows). The box shows the interquartile range, the central line the median, the × symbol the mean, whiskers the non-outlying range, and individual points the outliers. The complete financial-result formulas and iteration-level output vector were not retained; the figure is therefore descriptive archival material rather than a reproducible confidence interval.
Under the fixed assumptions of this single-farm scenario, 20 deer would correspond to estimated annual damage of EUR 5410.48, roughly equivalent to the value of the annual milk output from 1.5 cows. This comparison illustrates the potential scale of the loss for the case farm only. The framework does not estimate herd-size adjustment, farm exit, or regional land abandonment, and no such causal inference should be drawn from this scenario.
An archived exploratory box plot was available from the original Monte Carlo analysis. The retained workbook contains 3000 rows of input draws, but the complete financial-result formulas and the iteration-level output vector were not preserved. Accordingly, Figure 6 is retained only as a descriptive record of the original exploratory analysis and is not treated as a reproducible stochastic estimate or as evidence for population-level inference.
The values displayed in the archived figure were transcribed from its labels: mean EUR 30,602.89, median EUR 30,730.73, interquartile range EUR 30,332.41–30,975.18, and non-outlying whisker range EUR 29,368.26–31,132.72. Because the underlying financial-result vector and complete output formulas are unavailable, these values cannot be independently recalculated from the retained workbook and should be interpreted only as descriptive archival information.
The archived plot suggests how parameter uncertainty might broaden farm-level outcomes, but the retained files do not support a formal sensitivity or probability analysis. The principal methodological value of the audit is therefore diagnostic: it identifies the output formulas, random-number controls, and complete iteration-level data that must be retained in a future multi-farm implementation.
Figure 6 is not a confidence interval for a regional population of farms. The retained material preserves the plotted summary but not a complete, auditable financial-result calculation or the underlying iteration-level vector. The figure is therefore not used to estimate a 95% interval, a probability of loss, or any population-level uncertainty measure.
The displayed quartiles summarize only the central portion of the archived distribution. A reproducible future analysis should retain the complete formulas and iteration-level outputs, use an explicitly controlled random-number stream, report percentile intervals directly, and test sensitivity to dependence among biological and price inputs.
Because the archived implementation is incomplete, no formal stochastic conclusion is drawn from Figure 6. Broader inference requires a fully documented and validated uncertainty model, preferably calibrated with multi-farm data.
4. Discussion
The case-study results are best interpreted as a decomposition of economic mechanisms rather than as evidence of a population-level damage function. Under the fixed coefficients used here, total estimated loss increases approximately linearly with deer abundance because forage removal, winter damage, and milk-revenue loss are scaled proportionally. This linearity is a property of the present accounting structure and calibration, not an established biological law. Nonlinear responses may emerge where forage substitution, stocking adjustments, sward recovery, or threshold effects become important.
For the modal scenario of 10 deer, total estimated damage is EUR 2705.24, comprising EUR 1505.74 in direct grazing loss, EUR 246.98 in winter damage, and EUR 952.52 in reduced milk revenue. The indirect milk-revenue channel therefore accounts for about 35% of the total case estimate. This helps explain why assessments based only on visible sward damage may understate farm-level consequences. Previous work on wildlife damage and compensation similarly emphasizes that direct physical loss does not necessarily capture all production and opportunity costs [5,12,13,14,15]. The present case extends that logic by making the nutrition-to-revenue pathway explicit, while its magnitude remains conditional on ration flexibility, herd size, milk price, and the assumed grazing period. Additional case-based and review evidence documents deer-related grassland damage and broader wildlife–agriculture interactions, but reported magnitudes vary with study design, spatial scale, and the definition of damage [4,10,20,21,22].
Beyond the farm budget, wildlife pressure may also affect the provisioning, regulating, supporting, and cultural ecosystem services supplied by permanent grasslands. These wider effects are summarized in Table 4 and provide ecological context for the farm-level economic assessment; they are not monetized in the present case study.
Table 4.
Ecosystem services provided by permanent grasslands and the potential impacts of wildlife pressure.
The deterministic analysis uses farm-budget averages. The archived Monte Carlo file documents nominal input generators and 3000 rows, but it does not preserve complete formulas for feed loss, feed cost, or the financial result, and the original iteration-level output vector is unavailable. Figure 6 is therefore retained only as descriptive archival material. Future applications should implement the full financial equation in every iteration, retain the complete output, control the random-number stream, and report sensitivity and percentile results directly.
A distinctive feature of the framework is its explicit pathway from wildlife pressure to dairy economics. Forage removal first reduces the feed available after grassland-management costs have already been incurred; the resulting change in the ration then affects energy- and protein-supported milk output and milk revenue. Blanco-Roa et al. [11] likewise show that feeding structure can materially affect milk performance, although their tropical production context differs substantially from the present Alpine case. The comparison therefore supports the direction of the biological mechanism rather than the direct numerical transfer of coefficients.
The direct grassland-loss estimates are broadly consistent in magnitude with published studies and local case-based research documenting red-deer pressure and grassland yield losses [10,20,21,22]. Exact agreement should not be expected because studies differ in deer abundance, spatial scale, exclosure or field-measurement design, sward productivity, season length, and forage-valuation methods. Similarly, the milk unit cost in the present case is lower than values reported for some small-scale mountain dairy systems [17], possibly reflecting differences in herd structure, feeding systems, labor valuation, altitude, and accounting boundaries. These comparisons provide plausibility checks and help explain heterogeneity; they do not constitute external validation of the single-farm coefficients.
The single-farm design remains the main limitation. Altitude, slope, grassland productivity, herd structure, ration flexibility, wildlife use, market access, labor costs, and access to substitute feed can all affect both the magnitude and the shape of the estimated response. The framework should therefore be recalibrated using locally observed inputs and validated across multiple farms before any regional damage coefficient, compensation rate, or wildlife-management target is derived.
The framework’s practical value is primarily diagnostic: it makes direct and indirect loss channels transparent and can support more consistent farm-level documentation and scenario analysis. It should not be used as a ready-made compensation formula or as evidence for national or regional deer-management targets. A multi-farm extension could combine the present accounting framework with ecological population data, formal sensitivity analysis, and frontier approaches such as input-oriented VRS DEA to distinguish wildlife-related pressure from broader differences in technical efficiency [16].
5. Conclusions
This single-farm pilot case study shows how wildlife-related grassland damage can be traced through connected farm-level channels: forage removal, winter sward damage, ration constraints, lower potential milk output, and reduced financial performance (Table S1). Under the Kajžer calibration, the modal presence of 10 deer corresponds to estimated annual damage of EUR 2705.24 and an 8.69% lower financial result than the counterfactual no-damage scenario. These values are conditional on the case-farm assumptions and should not be generalized to mountain farms as a population.
Figure 6, retained from the exploratory analysis, illustrates the type of output that a stochastic extension could provide. However, the archived workbook is not sufficiently complete to support reproducible probability statements. A future implementation must preserve all formulas, random-number settings, and iteration-level outputs before stochastic results can be interpreted.
The study’s scientific contribution lies in transparently integrating direct grassland damage, nutrition-mediated milk loss, and financial consequences within a single auditable simulation-based cost assessment framework. External validity remains limited by the single-farm calibration and simplified functional relationships. Future research should validate and recalibrate the framework across multiple farms, retain complete stochastic outputs with reproducible random-number settings, test parameter sensitivity and potential nonlinear responses, and only then assess broader policy and efficiency implications, including comparisons with multi-farm frontier methods such as VRS DEA.
Supplementary Materials
The following supporting information can be downloaded at: https://www.mdpi.com/article/10.3390/agriculture16151626/s1, Table S1 presents an exploratory SWOT synthesis. It is provided as contextual material rather than as a core research method or an independent source of evidence.
Author Contributions
Conceptualization, I.P., Č.R., T.L. and K.P.; methodology, I.P., Č.R., T.L. and K.P.; formal analysis, I.P., Č.R., T.L. and K.P.; investigation, I.P. and T.L.; resources, I.P. and T.L.; data curation, I.P. and T.L.; writing—original draft preparation, I.P.; writing—review and editing, I.P., Č.R., T.L. and K.P.; visualization, I.P. and T.L.; supervision, Č.R. and K.P.; project administration, I.P. and K.P. All authors have read and agreed to the published version of the manuscript.
Funding
This research received no external funding.
Institutional Review Board Statement
Not applicable.
Informed Consent Statement
Not applicable.
Data Availability Statement
The deterministic source workbook and the archived Monte Carlo workbook are available from the corresponding author upon reasonable request. The Monte Carlo file retains the input ranges and random-number generators but not complete output formulas or the iteration-level financial-result vector; consequently, Figure 6 cannot be independently reproduced from the retained files.
Acknowledgments
The authors thank the collaborators and supervisors who supported this study. During manuscript preparation, Microsoft 365 with Microsoft Copilot was used to assist with figure preparation, translation, and language editing. The authors reviewed and edited all AI-assisted output and take full responsibility for the content of the publication.
Conflicts of Interest
The authors declare no conflicts of interest.
Abbreviations
The following abbreviations are used in this manuscript:
| LU | Livestock unit |
| UC | Unit cost |
| TC | Total cost |
| Y | Output |
| CBA | Cost–benefit analysis |
| NEL | Net energy for lactation |
| PSB | Protein balance in the small intestine |
| VRS DEA | Variable-returns-to-scale data envelopment analysis |
References
- Olaizola Tolosana, A. Viabilidad Económica de Sistemas Ganaderos de Montaña en Condiciones de Competencia en el Uso de Factores Productivos: Análisis de la Ganadería en un Valle Pirenaico Característico Mediante Técnicas Multivariantes y Optimización; Instituto de Estudios Altoaragoneses: Huesca, Spain, 1992; ISBN 84-86856-81-7. [Google Scholar]
- Côté, S.D.; Rooney, T.P.; Tremblay, J.P.; Dussault, C.; Waller, D.M. Ecological impacts of deer overabundance. Annu. Rev. Ecol. Evol. Syst. 2004, 35, 113–147. [Google Scholar] [CrossRef] [Scilit]
- Kuka, A.; Czyż, K.; Smoliński, J.; Cholewińska, P.; Wyrostek, A. The interactions between some free-ranging animals and agriculture—A review. Agriculture 2022, 12, 628. [Google Scholar] [CrossRef] [Scilit]
- Mauri, L.; Masin, R.; Tarolli, P. Wildlife impact on cultivated lands: A multi-temporal spatial analysis. Agric. Syst. 2020, 184, 102890. [Google Scholar] [CrossRef] [Scilit]
- Reimoser, F.; Putman, R. Impacts of wild ungulates on vegetation: Costs and benefits. In Ungulate Management in Europe: Problems and Practices; Putman, R., Apollonio, M., Andersen, R., Eds.; Cambridge University Press: Cambridge, UK, 2011; pp. 144–191. [Google Scholar]
- Statistical Office of the Republic of Slovenia. Annual Production and Utilisation of Milk on Agricultural Holdings. 2024. Available online: https://www.stat.si/StatWeb/en/News/Index/13789 (accessed on 21 July 2026).
- European Commission. Grassland Ecosystems and Their Ecosystem Services. Available online: https://ec.europa.eu/environment/nature/rbaps/grassland/index_en.htm (accessed on 21 July 2026).
- ANC Payment. Available online: https://agriculture.ec.europa.eu/common-agricultural-policy/income-support/additional-schemes/anc-payment_en (accessed on 21 July 2026).
- Allan, E.; Weisser, W.W.; Fischer, M.; Schulze, E.-D.; Weigelt, A.; Roscher, C.; Baade, J.; Barnard, R.L.; Beßler, H.; Buchmann, N.; et al. A comparison of the strength of biodiversity effects across multiple functions. Oecologia 2013, 173, 223–237. [Google Scholar] [CrossRef] [Scilit] [PubMed]
- Trdan, S.; Laznik, Ž.; Udov, A.; Bohinc, T.; Sinkovič, T.; Vidrih, M.; Jakovac Strajn, B.; Tavčar Kalcher, G. Quantitative and qualitative yield loss caused by red deer (Cervus elaphus L.) grazing on permanent organic grasslands. Acta Agric. Scand. Sect. B Soil Plant Sci. 2024, 74, 2321847. [Google Scholar] [CrossRef] [Scilit]
- Blanco-Roa, N.E.; Novoa-Novoa, H.R.; Berríos, E.C.; Soto-Gutiérrez, O.A.; Zúniga-González, C.A.; Sáenz-Rojas, S.J.; Nuñez-Rodriguez, J.d.J. Comparación de la producción de leche con base en la alimentación con Pennisetum sp., Pennisetum purpureum y CIAT 36087. Rev. Cient. FCV-LUZ 2025, 35, 11. [Google Scholar] [CrossRef] [Scilit]
- Barroso, P.; Gortázar, C. The coexistence of wildlife and livestock. Anim. Front. 2024, 14, 5–12. [Google Scholar] [CrossRef] [Scilit] [PubMed]
- Rondeau, D.; Bulte, E.H. Wildlife damage and agriculture: A dynamic analysis of compensation schemes. Am. J. Agric. Econ. 2007, 89, 490–507. [Google Scholar] [CrossRef] [Scilit]
- McKee, S.C.; Shwiff, S.A.; Anderson, A.M. Estimation of wildlife damage from federal crop insurance data. Pest Manag. Sci. 2021, 77, 406–416. [Google Scholar] [CrossRef] [Scilit] [PubMed]
- Herrero, M.; Thornton, P.K.; Notenbaert, A.M.; Wood, S.; Msangi, S.; Freeman, H.A.; Bossio, D. Smart investments in sustainable food production: Revisiting mixed crop–livestock systems. Science 2010, 327, 822–825. [Google Scholar] [CrossRef] [Scilit] [PubMed]
- Zuniga-Gonzalez, C.A.; Jaramillo-Villanueva, J.L.; Blanco-Roa, N.E. Inputs-oriented VRS DEA in dairy farms, version 3. F1000Research 2025, 12, 901. [Google Scholar] [CrossRef] [Scilit] [PubMed]
- Kühl, S.; Flach, L.; Gauly, M. Economic assessment of small-scale mountain dairy farms in South Tyrol depending on feed intake and breed. Ital. J. Anim. Sci. 2020, 19, 41–50. [Google Scholar] [CrossRef] [Scilit]
- Garrett, K.G.; Beck, M.R.; Froehlich, K.; Fleming, A.; Thompson, B.R.; Stevens, D.R.; Gregorini, P. A comparison of methods for estimating forage intake, digestibility, and fecal output in red deer (Cervus elaphus). J. Anim. Sci. 2020, 98, skaa069. [Google Scholar] [CrossRef] [Scilit] [PubMed]
- Hofmann, R.R. Evolutionary steps of ecophysiological adaptation and diversification of ruminants. Oecologia 1989, 78, 443–457. [Google Scholar] [CrossRef] [Scilit] [PubMed]
- Hjermann, T.K.S.; Bilet, N.A.; Rivrud, I.M.; Meisingset, E.L.; Thorvaldsen, P.; Mysterud, A. Red deer grazing pressure on agricultural grass meadows from broad to local scale. Wildl. Biol. 2025, 2025, e01312. [Google Scholar] [CrossRef] [Scilit]
- Praznik, I. Economic Assessment of Deer-Caused Damage in a Pole-Stage Forest. Master’s Thesis, University of Maribor, Maribor, Slovenia, 2025. [Google Scholar]
- Ramljak, L.M. Harmful Effects of Deer on Grasslands. Bachelor’s Thesis, University of Ljubljana, Ljubljana, Slovenia, 2022. [Google Scholar]
- FAO. Grassland and Rangeland Management; Food and Agriculture Organization of the United Nations: Rome, Italy, 2015. [Google Scholar]
- Conant, R.T.; Paustian, K.; Elliott, E.T. Grassland management and conversion into grassland: Effects on soil carbon. Ecol. Appl. 2001, 11, 343–355. [Google Scholar] [CrossRef]
- Ripple, W.J.; Beschta, R.L. Trophic cascades in Yellowstone: The first 15 years after wolf reintroduction. Biol. Conserv. 2012, 145, 205–213. [Google Scholar] [CrossRef] [Scilit]
- Potts, S.G.; Biesmeijer, J.C.; Kremen, C.; Neumann, P.; Schweiger, O.; Kunin, W.E. Global pollinator declines: Trends, impacts and drivers. Trends Ecol. Evol. 2010, 25, 345–353. [Google Scholar] [CrossRef] [Scilit] [PubMed]
- Bhattarai, P. Threats on grassland ecosystem services: A case from Shuklaphanta Wildlife Reserve. Nepal J. Sci. Technol. 2012, 13, 159–166. [Google Scholar] [CrossRef] [Scilit]

Disclaimer/Publisher’s Note: The statements, opinions and data contained in all publications are solely those of the individual author(s) and contributor(s) and not of MDPI and/or the editor(s). MDPI and/or the editor(s) disclaim responsibility for any injury to people or property resulting from any ideas, methods, instructions or products referred to in the content. |
© 2026 by the authors. Licensee MDPI, Basel, Switzerland. This article is an open access article distributed under the terms and conditions of the Creative Commons Attribution (CC BY) license.