


Abstract
In wheat threshing, reducing total grain loss and energy consumption is crucial for both economic and sustainable food security. This study investigates the effects of threshing drum type (straight and helical row), drum peripheral speed (36.73–48.98 m s−1), and drum-concave clearance (35–50 mm) on total grain loss and specific fuel consumption in a stationary threshing machine using a full factorial design. The optimum machine settings (drum type, peripheral speed and drum–concave clearance) that simultaneously minimize these two outputs were then determined. We systematically compared three surrogate modelling approaches—Response Surface Model (RSM), Gaussian Process Regression (GPR), and Artificial Neural Network (ANN)—to identify the most effective method for small-dataset optimization in threshing machine design. The best model was selected through cross-validation, and optimization was performed using the NSGA-II multi-objective genetic algorithm. GPR yielded the highest prediction accuracy for both outputs (R2 in prediction data: 0.99 for total grain loss and 0.91 for specific fuel consumption). Multi-objective optimization revealed a conflict between the two objectives; the best balance was achieved for the helical drum at a peripheral speed of approximately 41.5 m s−1 and a drum–concave clearance of 50 mm (predicted total grain loss approximately 3.7%, specific fuel consumption approximately 2.98 mL kg−1). Compared to the straight-row drum, the helical drum provided lower losses and fuel consumption, as well as approximately 3.5 times wider safe operating range. It should be noted that this optimum was predicted by the surrogate model and agreed closely with the best measured treatment; it was not confirmed by an independent validation experiment. The results demonstrated that combining a surrogate model with a genetic algorithm is an effective tool for optimizing threshing machine parameters.
1. Introduction
Wheat (Triticum aestivum L.) is one of the most important cereal crops worldwide and plays a crucial role in global food security. World wheat production decreased by approximately 0.8%, from 806 million tons in the 2022–2023 production season to 799.3 million tons in the 2024–2025 production season. In the same year, the production-to-consumption ratio was 0.995 [1,2]. This is considered a threat to food security. Wheat is also one of Türkiye’s main cereal crops and plays a significant role in feeding the country’s population. In Türkiye, wheat production increased by 6% in 2024 from 19.8 million tons in 2022 to 20.8 million tons in 2024 [3]. Although combine harvesters dominate cereal harvesting worldwide, a substantial part of the crop in Türkiye is still threshed with stationary threshing machines: approximately 6 million tons of grain and about 1 million tons of legumes are threshed in this way every year. Losses occurring in these machines therefore directly reduce the quantity of grain that reaches the consumer, which makes the optimization of stationary threshers highly relevant to food security and constitutes the specific problem addressed in this study.
Cereal threshing is the process of separating the edible part of the grain from the inedible husk, and it is a critical step in post-harvest processing; this process can significantly affect the overall quality and yield of the harvested grain [4]. Excessive mechanical damage to grains during threshing can lead to significant losses in the form of reduced grain quality, decreased germination rates, and reduced market value [5,6]. In addition to its direct economic impact, grain damage is also important for food security and sustainability, as it can affect the availability and storability of the harvested product.
To overcome these problems, researchers have focused on understanding the factors that cause grain damage during threshing and have developed models to minimize such damage [5,6,7]. Grains are often damaged by physical stress during the threshing process. This damage reduces the quantity of higher value-added products while also increasing processing costs and generating additional waste.
Cereal threshing aims to separate the grain from the inedible husk. The threshing device plays a significant role in the machine’s performance, as it can affect the efficiency of the threshing process (maximum efficiency, very good cleaning, and very little seed loss), the threshing power requirement, and the overall machine efficiency [8,9,10]. Mechanical forces during threshing often damage the grains, affecting their quality, market value, and germination ability. Increasing the impact velocity in rice threshing increases the probability of rice grain fracture [11]. When the impact energy exceeds the energy threshold, the probability of rice grain fracture will be at a certain level. Below this energy threshold, fracture does not occur; only surface abrasion takes place. This situation can be attributed to abrasion rather than particle fractures [12].
Cereal threshing machines operate on the principles of impact and friction (rubbing). Grain threshing performance, including loss and damage, is significantly affected by the contact pattern between the grain products and the threshing components [13]. Contact patterns are created based on the geometric structures and mechanical movements of the threshing machines. Force and motion are not only two important parameters of contact patterns, but also key influencing factors of grain threshing performance, such as loss and damage. The primary energy used for threshing comes from the impact of contact between the drum fingers and the grain ears. As the threshing drum rotates, the fingers penetrate the grain husk in the threshing opening. The grain ears are impacted by high-speed threshing fingers through impact, compression, and frictional movements. The grain kernels are separated from the stalks by the acceleration resulting from the impact. At the same time, the grain husk is loosened by penetrating threshing fingers. Drum peripheral speed and drum types were found to have significant effects on threshing efficiency and grain surface quality [14,15,16].
Grains are a staple component of many agricultural products, and their physical properties, such as hardness, brittleness, and moisture content, play a crucial role in determining their quality, shelf life, and processing requirements. Furthermore, grain loss and damage during threshing significantly impact threshing performance. Therefore, many researchers have developed different types of grain threshing machines or threshing components over the past 50 years [17].
Mechanical grain damage results from grain kernels striking the hard surface of the threshing unit at a high relative speed [18]. Ahmad et al. [19] modified the threshing hopper designs of a conventional wheat threshing machine. As a result, they found that grain damage was reduced fourfold and grain cleaning efficiency increased from 97.44% to 98.18%. Mesquita et al. [20] coated the drum fingers with a polymer material and increased threshing efficiency from 94.8% to 99%. At the same time, they found that the seed breakage rate decreased by 8.4%, ranging from 0.3% to 0.6%. Experiments were conducted using different drum–concave clearances and drum speeds to optimize the performance of the concave, a general threshing component in grain harvesting machines. It was found that grain damage decreased when the drum–concave clearance increased from 29 mm to 35 mm and increased when the threshing drum speed varied between 675 min−1 and 875 min−1 [21].
The threshing apparatus plays a significant role in the performance of a combine harvester, as it affects threshing efficiency (maximum yield, optimum separation, and minimum seed loss) and the power requirements for threshing. To optimize the quality of the entire threshing process, decomposition and modelling of the threshing process are necessary [22]. In their research, Vlăduț et al. [23] developed a mathematical model characterizing the threshing and separation process within an axial flow threshing apparatus of a combine harvester. Their study used material flow, drum speed, drum–concave clearance, average density of processed material, feed rate, length of the threshing apparatus, and separation surface of the axial flow threshing apparatus as the input parameters. The developed mathematical model approximately matched the experimentally obtained data, with a very small difference (1.29%) between the data obtained from the theoretical model and the experimental data for seed separation.
Chaturvedi et al. [24] conducted trials with a threshing machine they developed for millet crops, using three different drum speeds and two different drum–concave clearances. The performance parameters in the study were threshing efficiency, cleaning efficiency, and broken grains. In their study, they achieved the highest threshing efficiency at 99.67%, the highest cleaning efficiency at 98.64%, and zero broken grains.
El-Haddad [25] stated that threshing efficiency increased with increasing drum peripheral speed and decreasing feed rate. The maximum threshing efficiency was 99.761% at a drum peripheral speed of 21.25 m s−1 and a feed rate of 15 kg min−1. In addition, the maximum visible grain damage was determined to be 0.90% at the same operating parameters.
To make flaxseed harvesting suitable by minimizing stalk damage, Emara [26] modified the threshing drum of a local stationary threshing machine. The results showed that improving the threshing drum tended to improve the performance of the stationary threshing machine, especially by reducing seed losses and stalk damage, as well as increasing efficiency and effectiveness. The optimum performance of the threshing machine developed for flaxseed separation was obtained using the design with a drum peripheral speed of 28.85 m s−1, a feed rate of 8.57 kg min−1, and 12 drum fingers.
In their study, Da et al. [27] developed a discrete element simulation model of a threshing apparatus based on the rice threshing mechanism of a semi-feed combine harvester. The authors considered threshing drum speed, feed volume, and sieve vibration frequency as variable parameters. An artificial neural network model and a linear regression model were developed to predict threshing performance indicators, including loss rate and impurity content. Their experiments showed that the loss rate ranged from 4.55 to 5.96%, whereas the impurity rate varied between 8.47 and 10.01%. The results demonstrated that both artificial neural networks and linear regression models can be applied to predict threshing performance indicators; however, artificial neural networks exhibited superior predictive accuracy.
In Türkiye, 80% of existing grain production areas are harvested with combine harvesters. Due to the average farm size of 6 hectares and the unsuitability of the land topography for combine harvesting in some regions, harvesting and threshing are done with separate machines. Approximately 6 million tons of the produced grain and about 1 million tons of legumes are threshed with threshing machines. A 1% reduction in losses during threshing is important for the national economy and sustainable food security. In this study, the effects of threshing drum type, drum peripheral speed, and drum–concave clearance on total grain loss and specific fuel consumption in wheat threshing were investigated. In addition, optimum values and operating ranges were determined for minimum grain loss and specific fuel consumption using multi-objective optimization of machine parameters with machine learning-based surrogate models and genetic algorithms.
2. Materials and Methods
The experimental trials were conducted during the wheat harvesting season (June–July 2025) using a threshing machine manufactured by Demireller Industrial Agricultural Machinery Industry and Trade Limited Company, Konya/Turkey. Wheat was harvested with a tractor-mounted harvester and left in barrel-shaped piles in the field. Approximately one week after harvesting, the crop was collected and transported to the threshing site, where the machine was driven by the tractor’s power take-off (PTO) shaft. The tractor used throughout the tests was a New Holland T4.70S (manufactured in Sakarya, Türkiye), with a nominal engine power of 65 HP, a maximum engine power of 70 HP and a three-cylinder turbocharged engine. Feeding was done with a piece of equipment called a pitchfork, which is used by farmers in the region. In this study, the bread wheat cultivar Selçuklu (Triticum aestivum L.) was used, and the crop had a plant height of 75–85 cm, a harvest index of 38%, a thousand-grain weight of 37.2 g, and a moisture content of 7.3%. The grain moisture content was determined with a Wile 55 grain moisture metre (Farmcop Oy, Tuusula, Finland) with a readability of ±0.1%. This low moisture content is representative of local practice: wheat is cut at 12–14% moisture and left in the field as ear-bearing stalks in hot, dry weather, so that by the time of threshing the grain moisture has fallen to about 7–8%, and in hot and arid regions it may decrease to nearly 7%. At this moisture level the grain separates from the ear more easily, which tends to reduce unthreshed-ear losses; however, both grain and ear are more brittle, so the risk of breakage under drum impact increases, and the very dry straw breaks into small fragments that increase the load on the cleaning unit. At higher moisture contents (12–14%), the grain is more elastic and more resistant to impact, and a lower broken-grain ratio would therefore be expected. The results reported in this study should accordingly be interpreted within this low-moisture context.
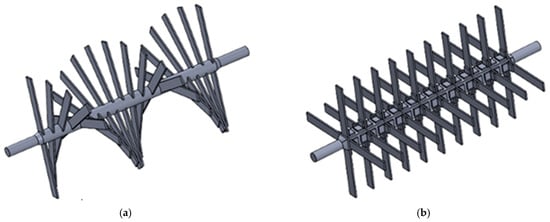
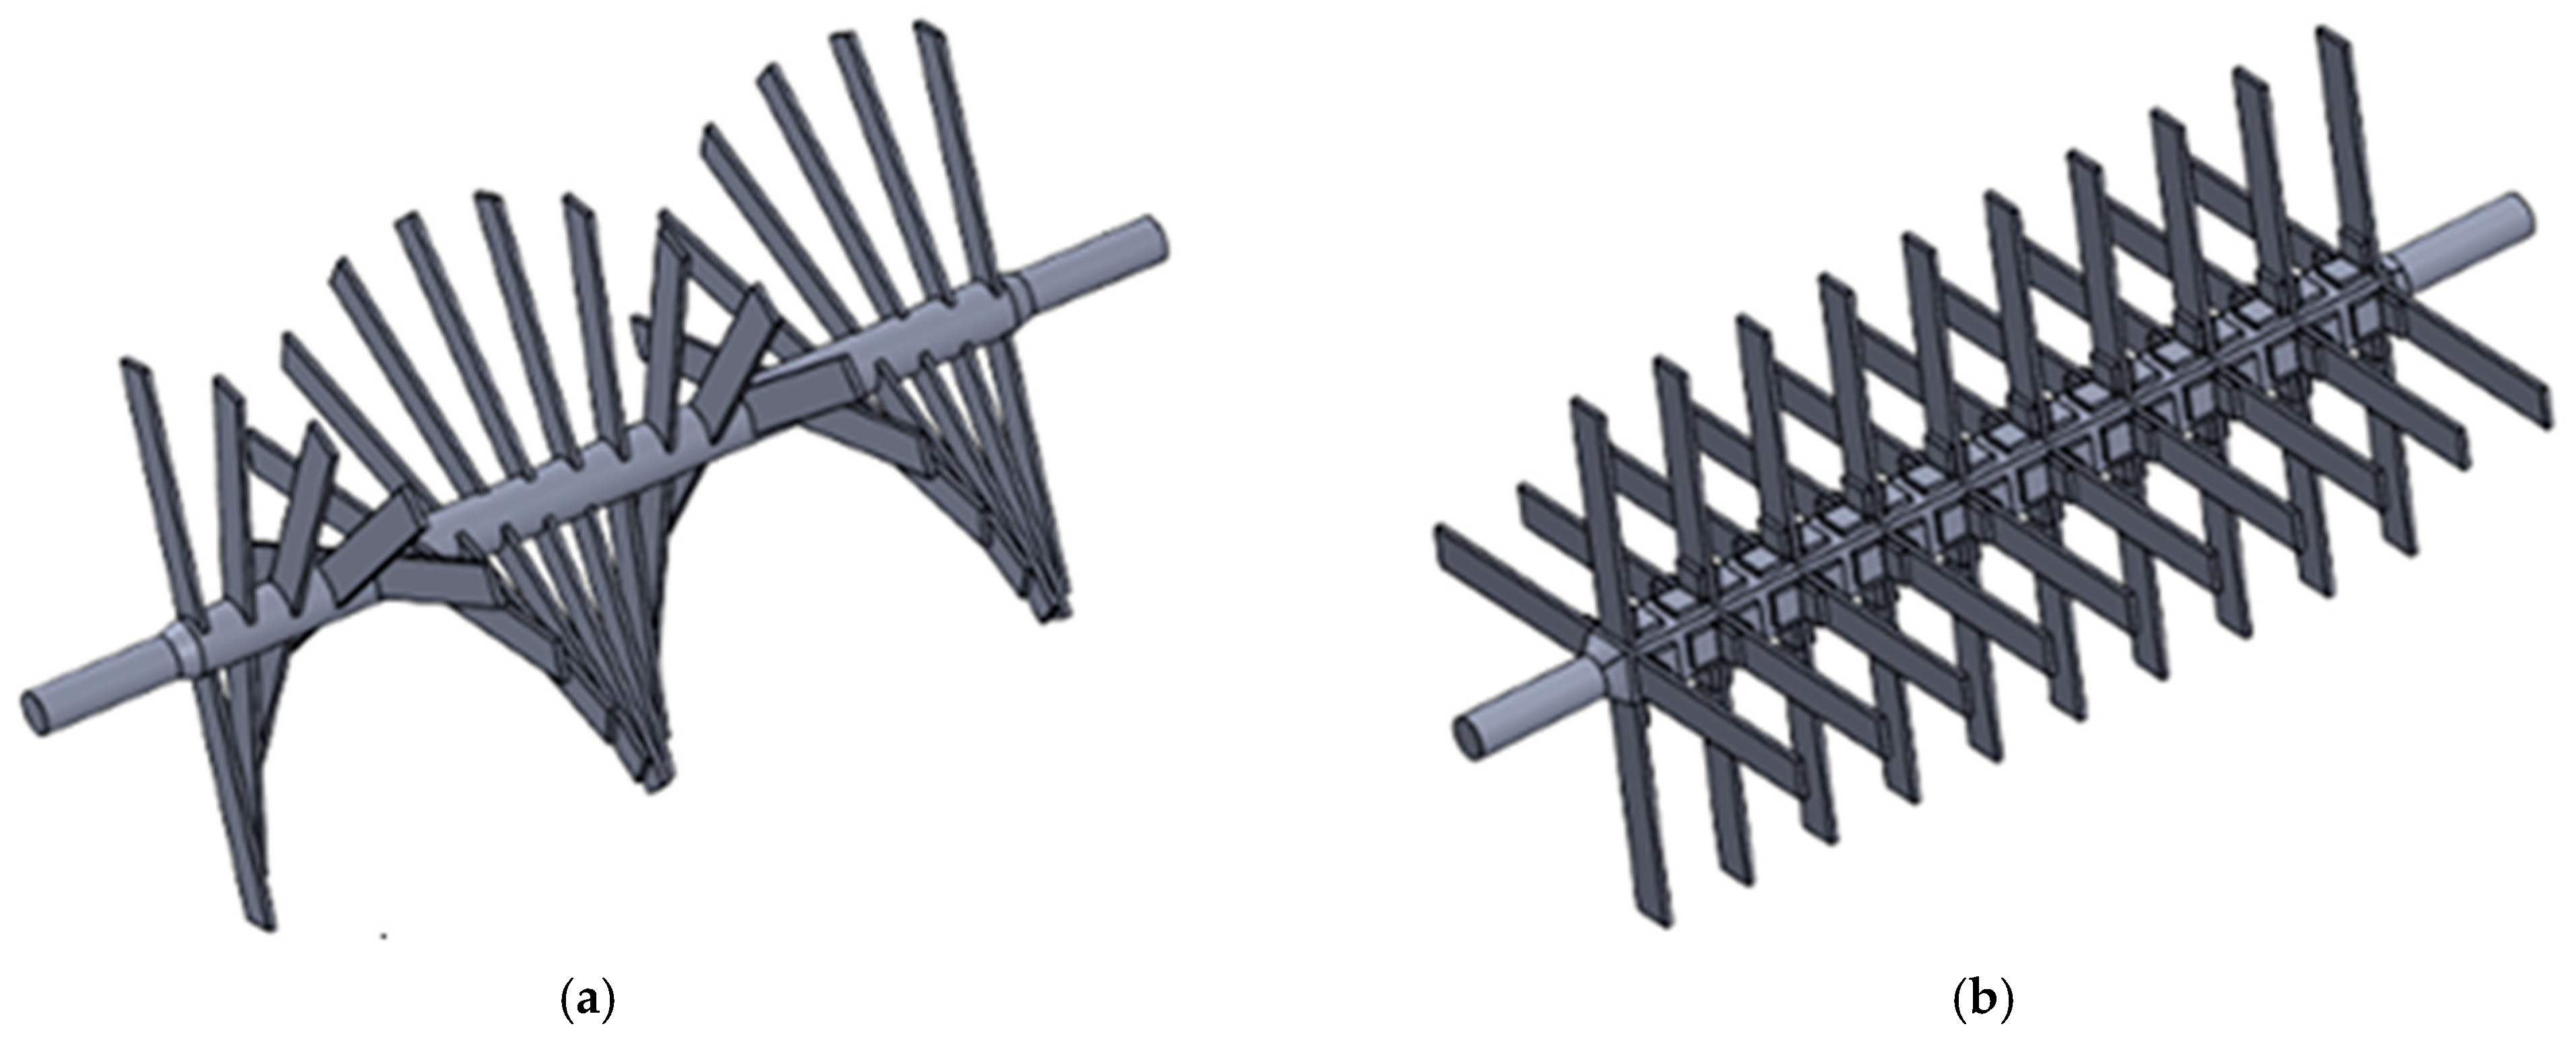
In Türkiye’s livestock industry, straw is used as animal feed; therefore, threshing machines are manufactured with finger-type threshing units. The fingers are welded onto a square shaft in a straight row. In this study, as an alternative to the straight-row fingers, a pair of fingers was first welded onto a tubular profile and then helically positioned on the threshing shaft at an 18.90° angle (Figure 1).
Figure 1.
Two different types of drums were used in the experiments: (a) Helical drum (HD). (b) Straight-row drum (SRD).
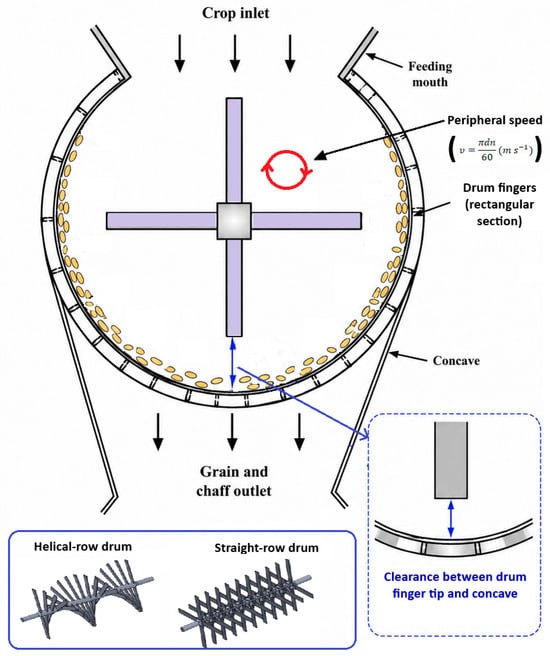
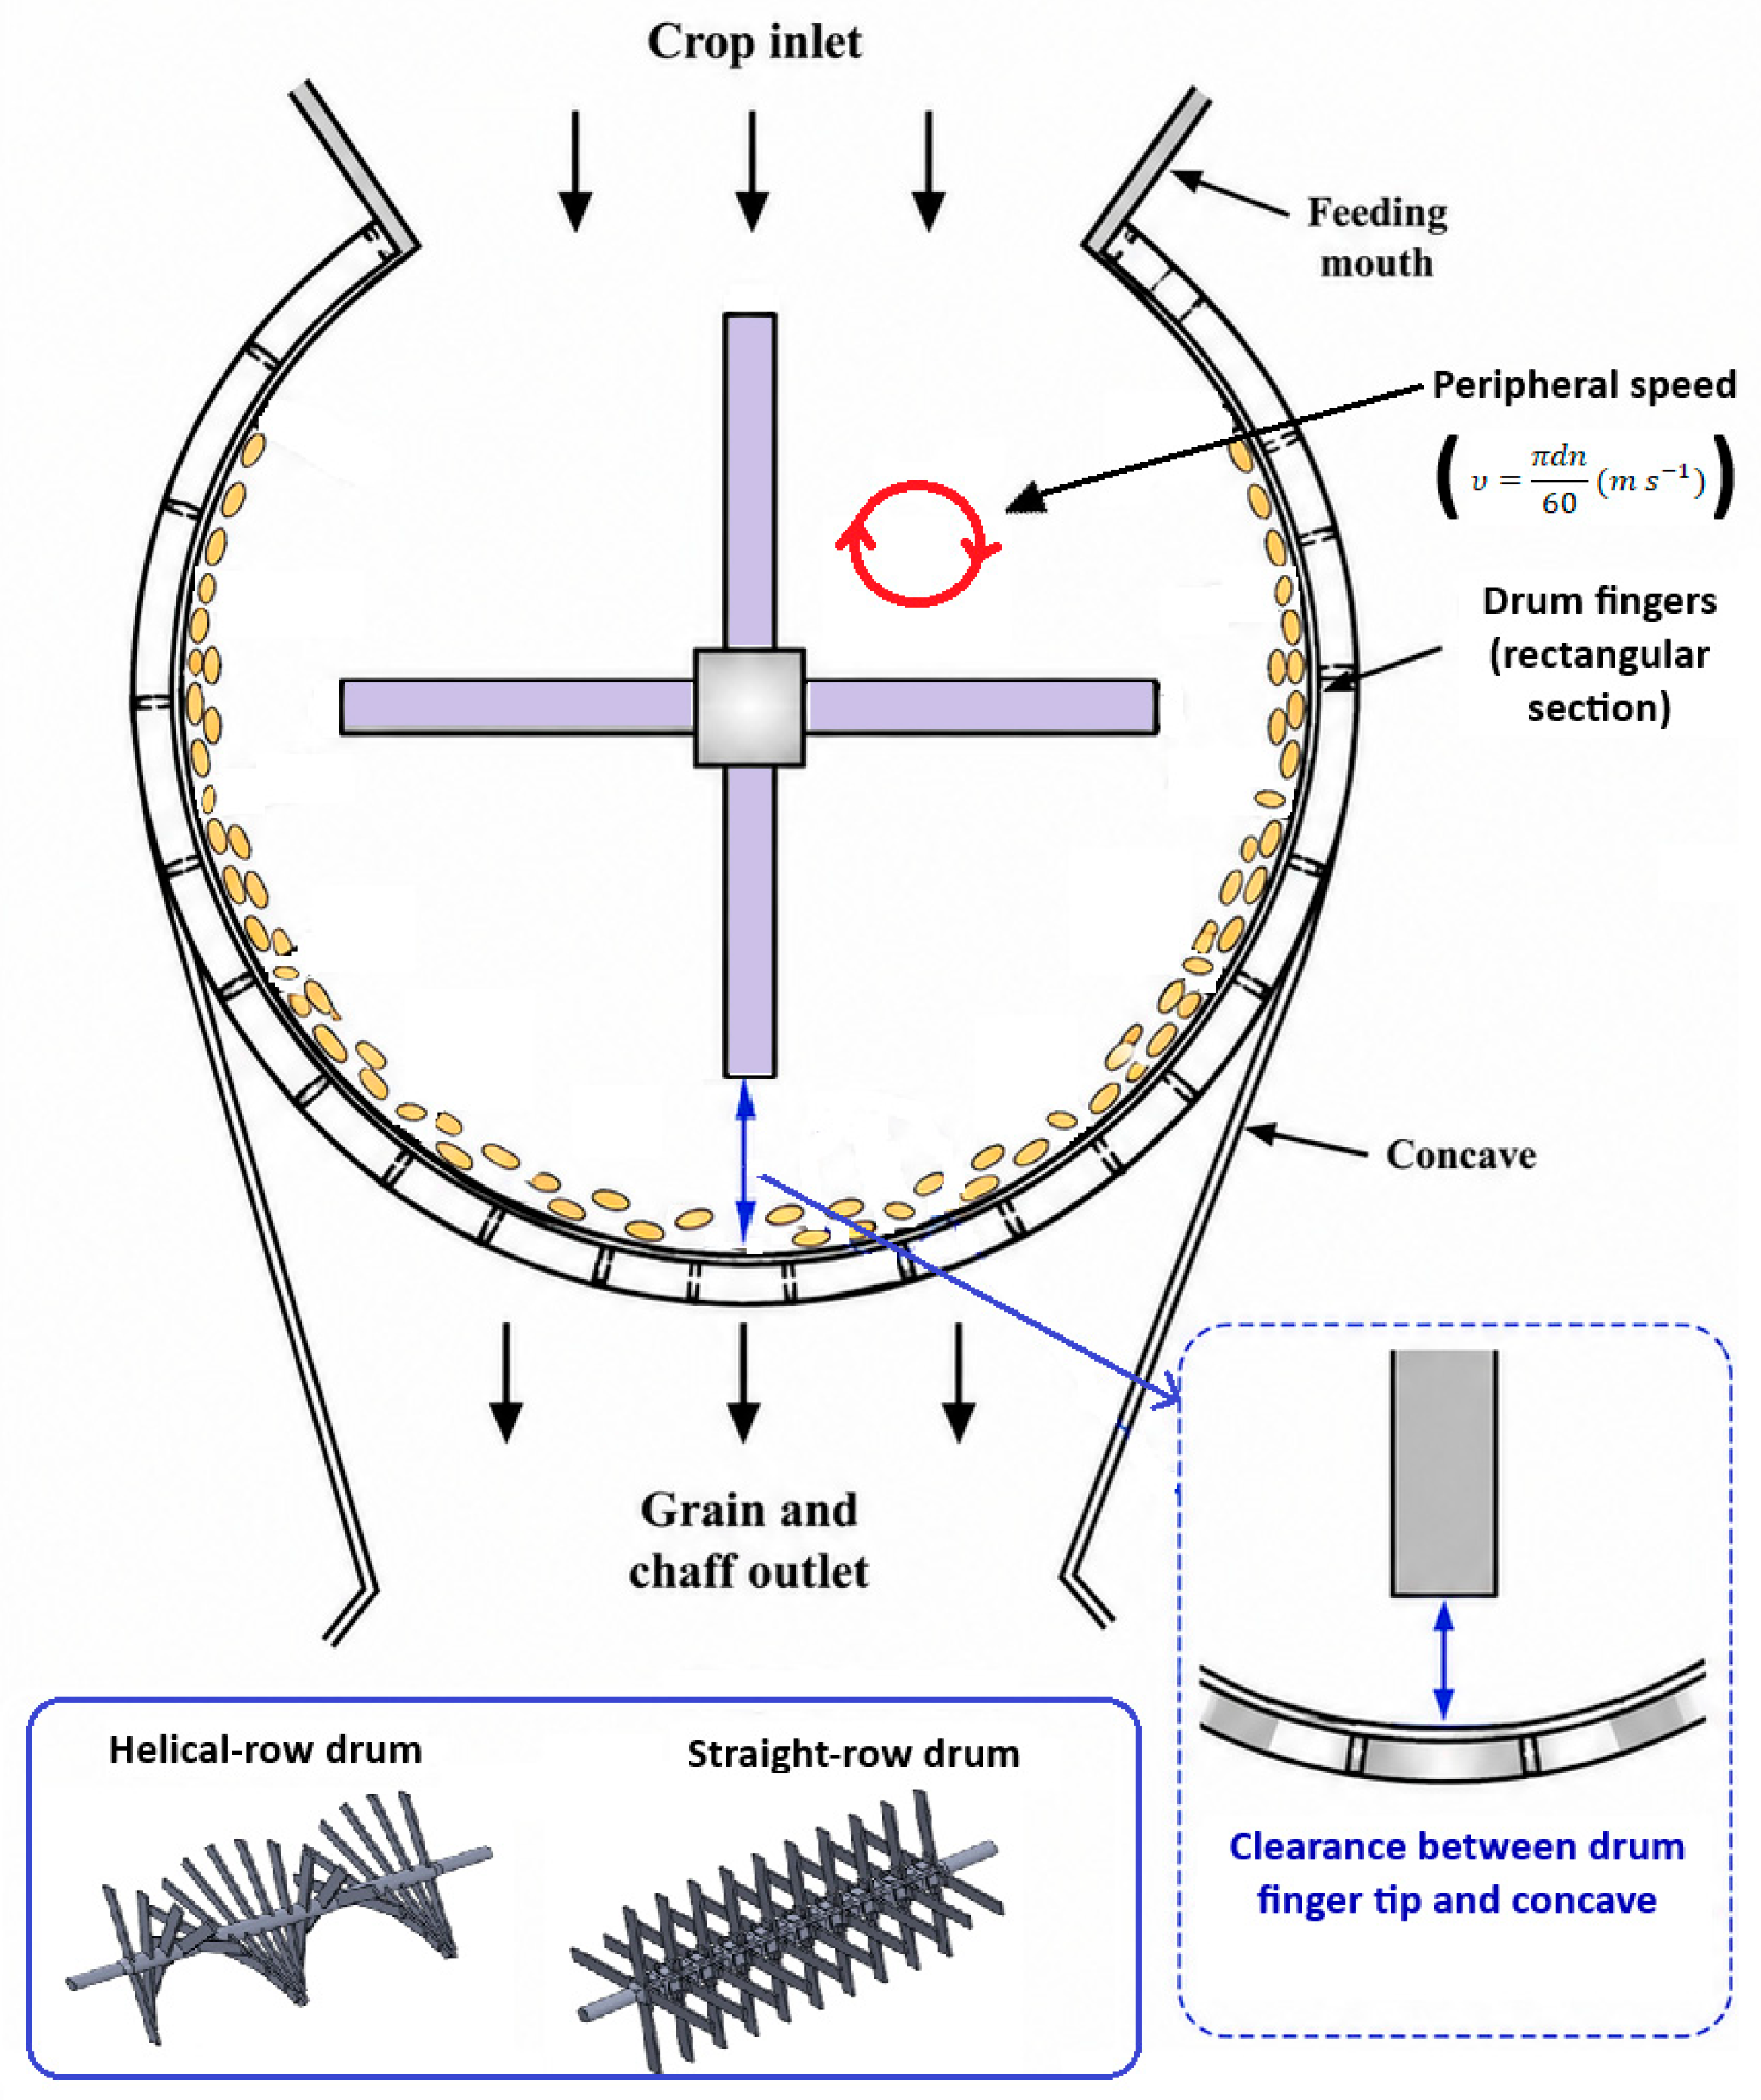
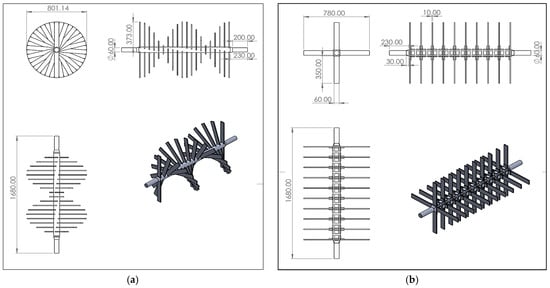
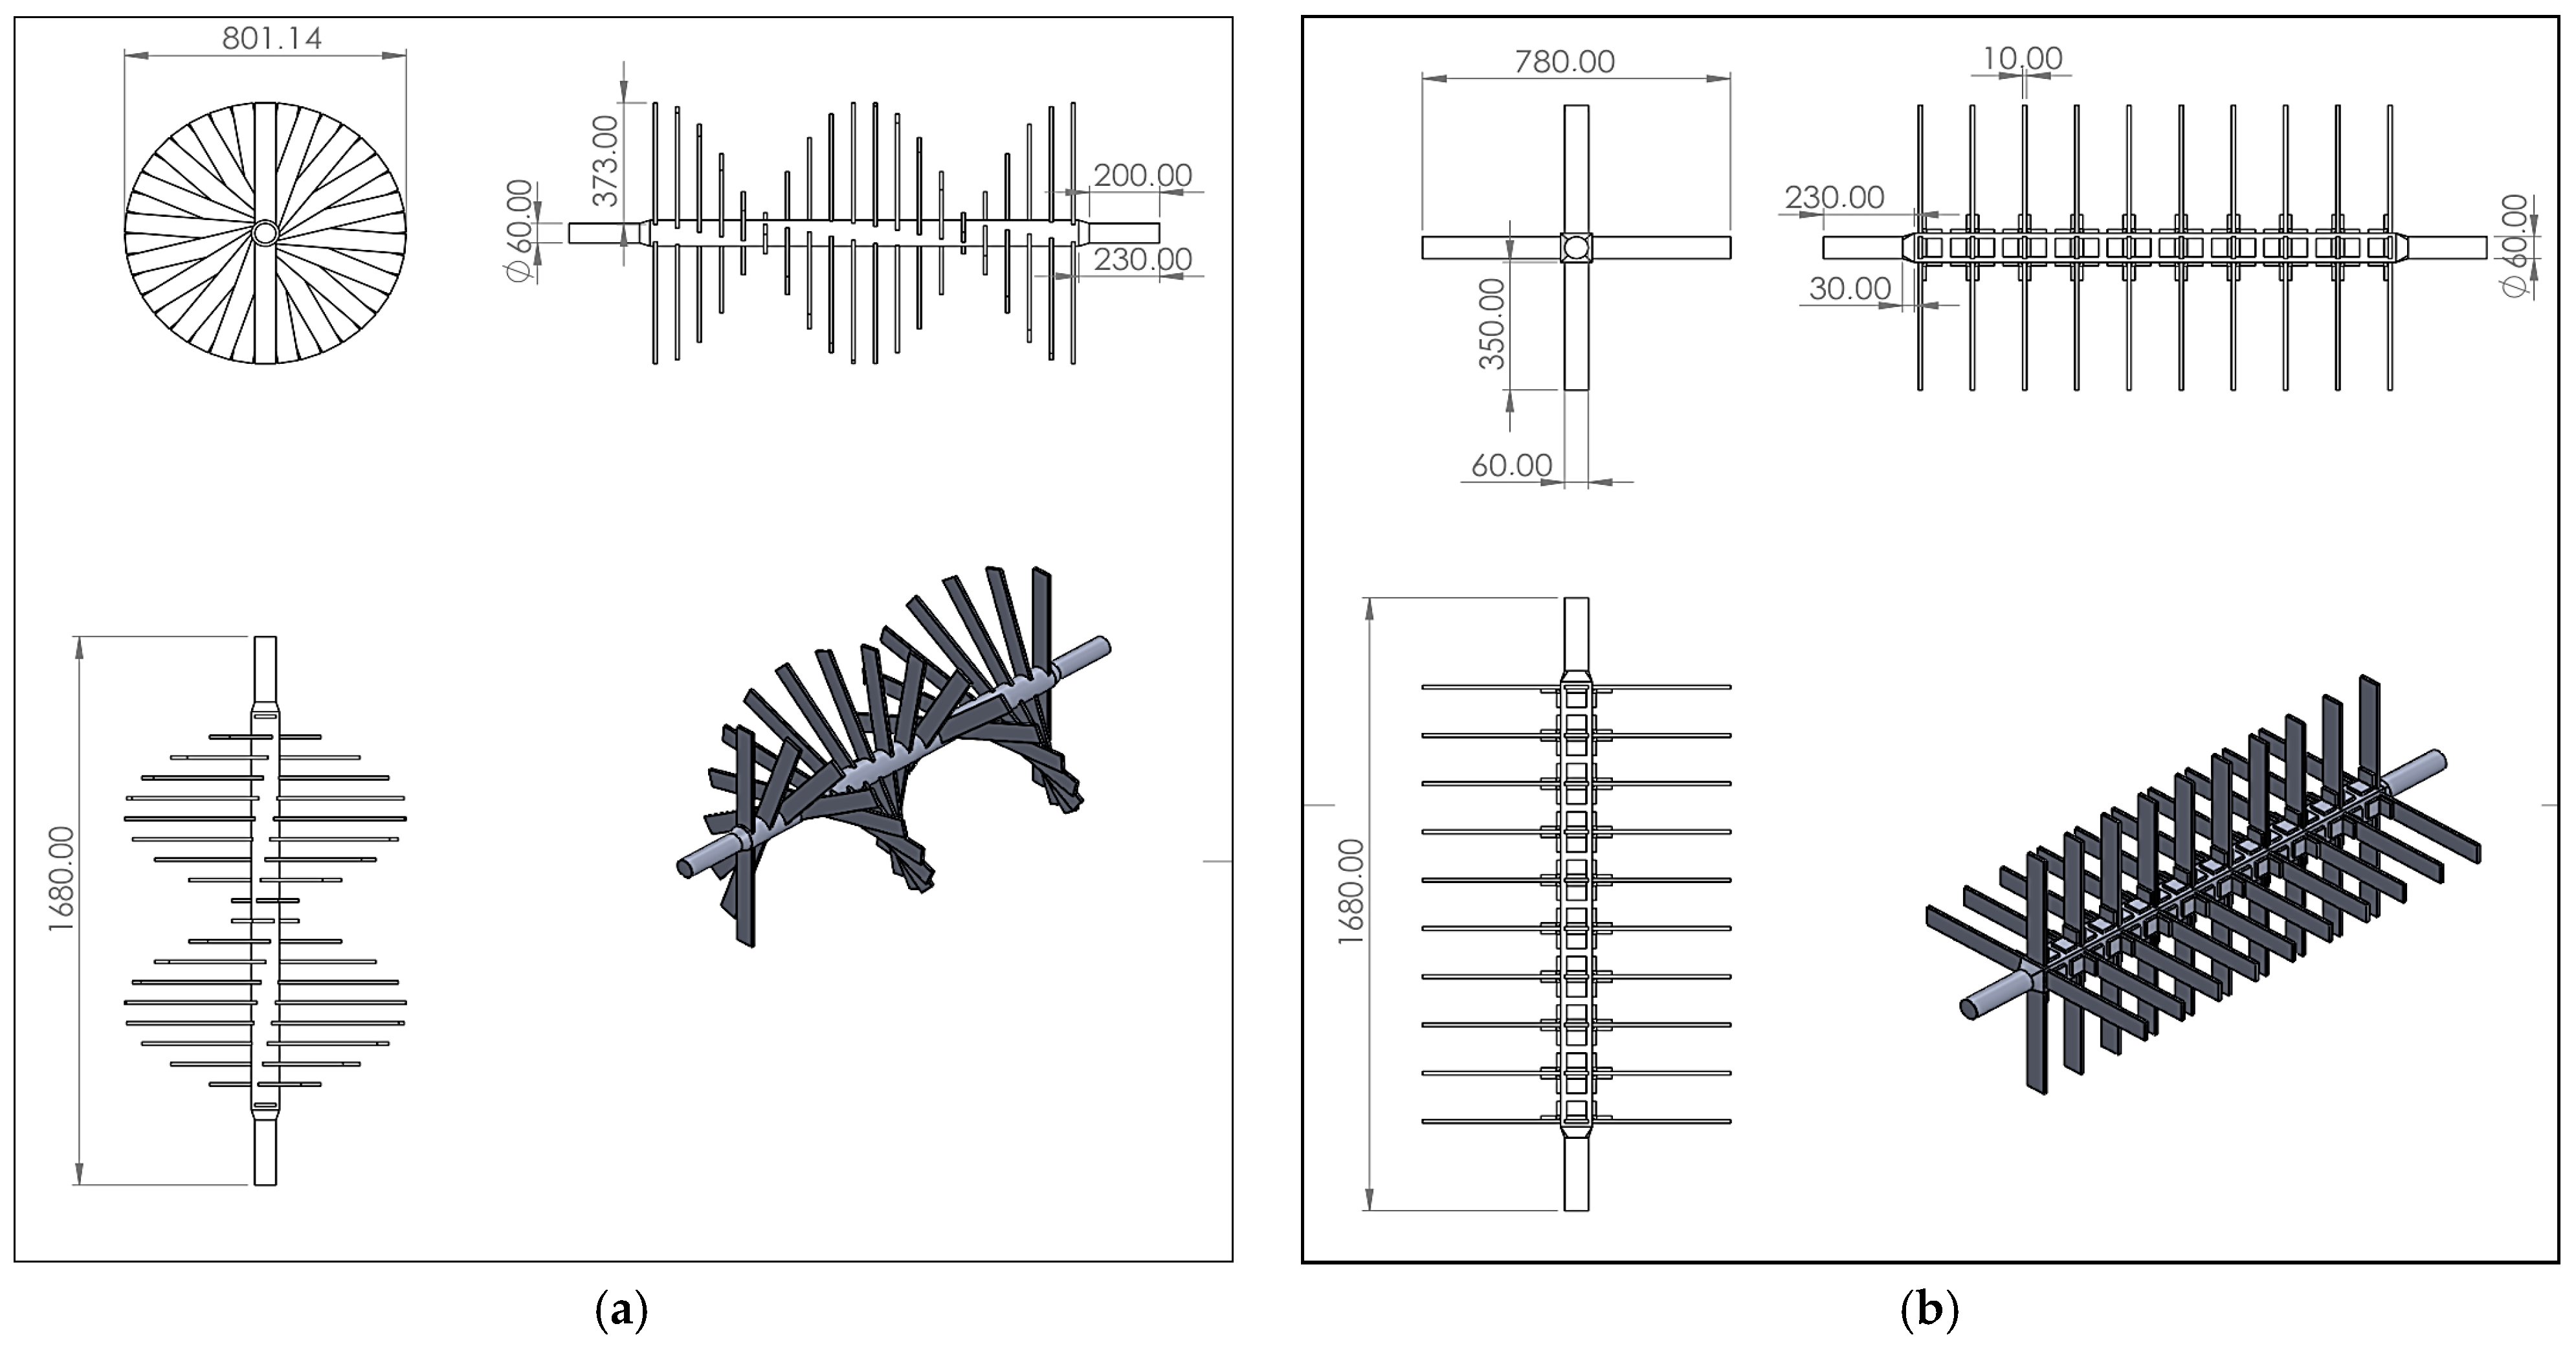
Throughout this paper, the straight-row drum is denoted as SRD and the helical drum as HD. The working principle of the threshing unit and the geometric parameters that govern threshing performance (drum peripheral speed, drum–concave clearance, finger geometry and crop flow path) are shown schematically in Figure 2, and the dimensioned technical drawings of the two drums are given in Figure 3. The schematic (Figure 2) and the technical drawings (Figure 3) were prepared with SolidWorks 2025 (Dassault Systèmes, Vélizy-Villacoublay, France).
Figure 2.
Schematic of the threshing unit showing the parameters that govern threshing performance: crop inlet and feeding mouth, drum fingers (rectangular section), drum peripheral speed (v = πdn/60), concave, drum–concave clearance (CC, the gap between the finger tip and the concave) and the grain–chaff outlet. The insets show the helical-row drum (HD) and the straight-row drum (SRD). Black straight arrows indicate the crop flow direction through the unit, the red circular arrow indicates the direction of drum rotation, the blue double-headed arrow indicates the drum–concave clearance, and the dashed blue box is an enlarged detail of the clearance; thin black lines are label leaders.
Figure 3.
Dimensioned technical drawings of the two threshing drums (dimensions in mm): (a) Helical drum (HD). (b) Straight-row drum (SRD).
The machine’s fuel consumption rate was measured using two turbine flow sensors (Aquametro Oil & Marine AG, Therwil, Switzerland) capable of measuring in the range of 1–400 L h−1. One sensor was placed between the tractor’s fuel filter and the injector pump; the other was used to measure excess fuel returning to the fuel tank from both the injectors and the injector pump. The tractor’s hourly fuel consumption (L h−1) was compared to the machine’s hourly work efficiency (kg h−1).
The drum–concave clearance (CC) varied due to the up-down movement of the drum shaft bearing and was adjusted to 35, 40, 45, and 50 mm in the middle (at the lowest point). Both the straight-row and helical-row threshing drums had a fixed diameter (780 mm), and the drum speeds were measured using a DT-6236C digital tachometer (Shenzhen Vicimeter Technology Co. Ltd., Shenzhen, China). Depending on the speed, experiments were conducted with peripheral speeds (PS) of 36.73, 40.82, 44.90, and 48.98 m s−1. Depending on the change in threshing drum speed, the sieve acceleration values were calculated as 5.99, 7.40, 8.95, and 10.66 m s−2. Some technical specifications of the threshing machine are given in Table 1.
Table 1.
Some technical specifications of the threshing machine used in the experiments.
The trials were arranged as a full factorial design with three factors: drum type (2 levels, SRD and HD), drum peripheral speed (4 levels: 36.73, 40.82, 44.90 and 48.98 m s−1) and drum–concave clearance (4 levels: 35, 40, 45 and 50 mm), giving 2 × 4 × 4 = 32 treatment combinations. Each treatment combination was carried out as a single threshing run, so that the experiment comprised 32 runs in total. During each run, five samples were taken simultaneously from all outlets of the machine over a 30 s period; these five samples are sub-samples of the same run, taken to characterize the losses within that run, and they are not independent replications of the treatment. Because the drum had to be dismounted in order to change its type, and the speed and the clearance had to be reset mechanically between runs, the runs were performed in the order in which the settings could be adjusted (the clearance was varied within each speed level, and the speed within each drum type); the run order was therefore not fully randomised. The absence of independent replication is considered in the statistical analysis, where the three-way interaction is pooled to provide the error term (Section 3), and it is stated among the limitations of the study.
Grain losses in threshing machines consist of broken and weak grains under the sieve, unthreshed grains remaining in the ear, grains escaping into the straw, and broken grains in the main grain hopper. Samples were taken from all outlets for 30 s in 5 replicates, and the total grain loss (TGL) was determined using the following equation:
where UTG is the amount of unthreshed grain, SG is the amount of grain in the straw, USG is the amount of grains under the sieve, and BG is the amount of broken grains under the sieve, in the straw and in the main grain hopper (i.e., BG includes the broken grains collected in the main grain hopper). During each run, samples were taken simultaneously from every outlet of the machine (straw outlet, under-sieve outlet and main grain hopper) over a 30 s period. Each sample was then separated by hand into unthreshed ears, sound grain and broken grain, and every fraction was weighed with a Kern FCB 12K0.1B precision balance (Kern & Sohn GmbH, Balingen, Germany) with a readability of 0.1 g. All loss fractions were thus determined on a mass basis, and each fraction was expressed as a percentage of the total grain mass fed into the machine.
The total grain loss rate (%) was determined by dividing the total loss by the total amount of grains.
Threshing capacity was determined using the following equation:
where TC is threshing capacity in kg h−1, Wt is the total weight of wheat stalk fed into the machine and T is the total time taken to thresh.
Threshing capacity was calculated as the mass of ear-bearing wheat stalks fed into the machine through the feeding mouth divided by the corresponding threshing time (Equation (2)). The specific fuel consumption was then obtained by dividing the tractor’s hourly fuel consumption (L h−1), measured with the flow sensors during each run, by the hourly threshing capacity (kg h−1). The denominator is therefore the total mass of ear-bearing stalk material fed into the machine, so that specific fuel consumption expresses the volume of fuel consumed per kilogram of fed material (mL kg−1).
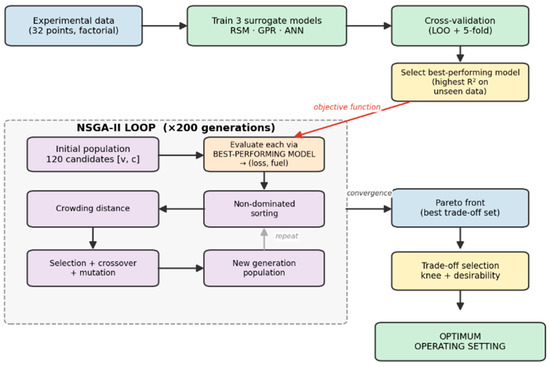
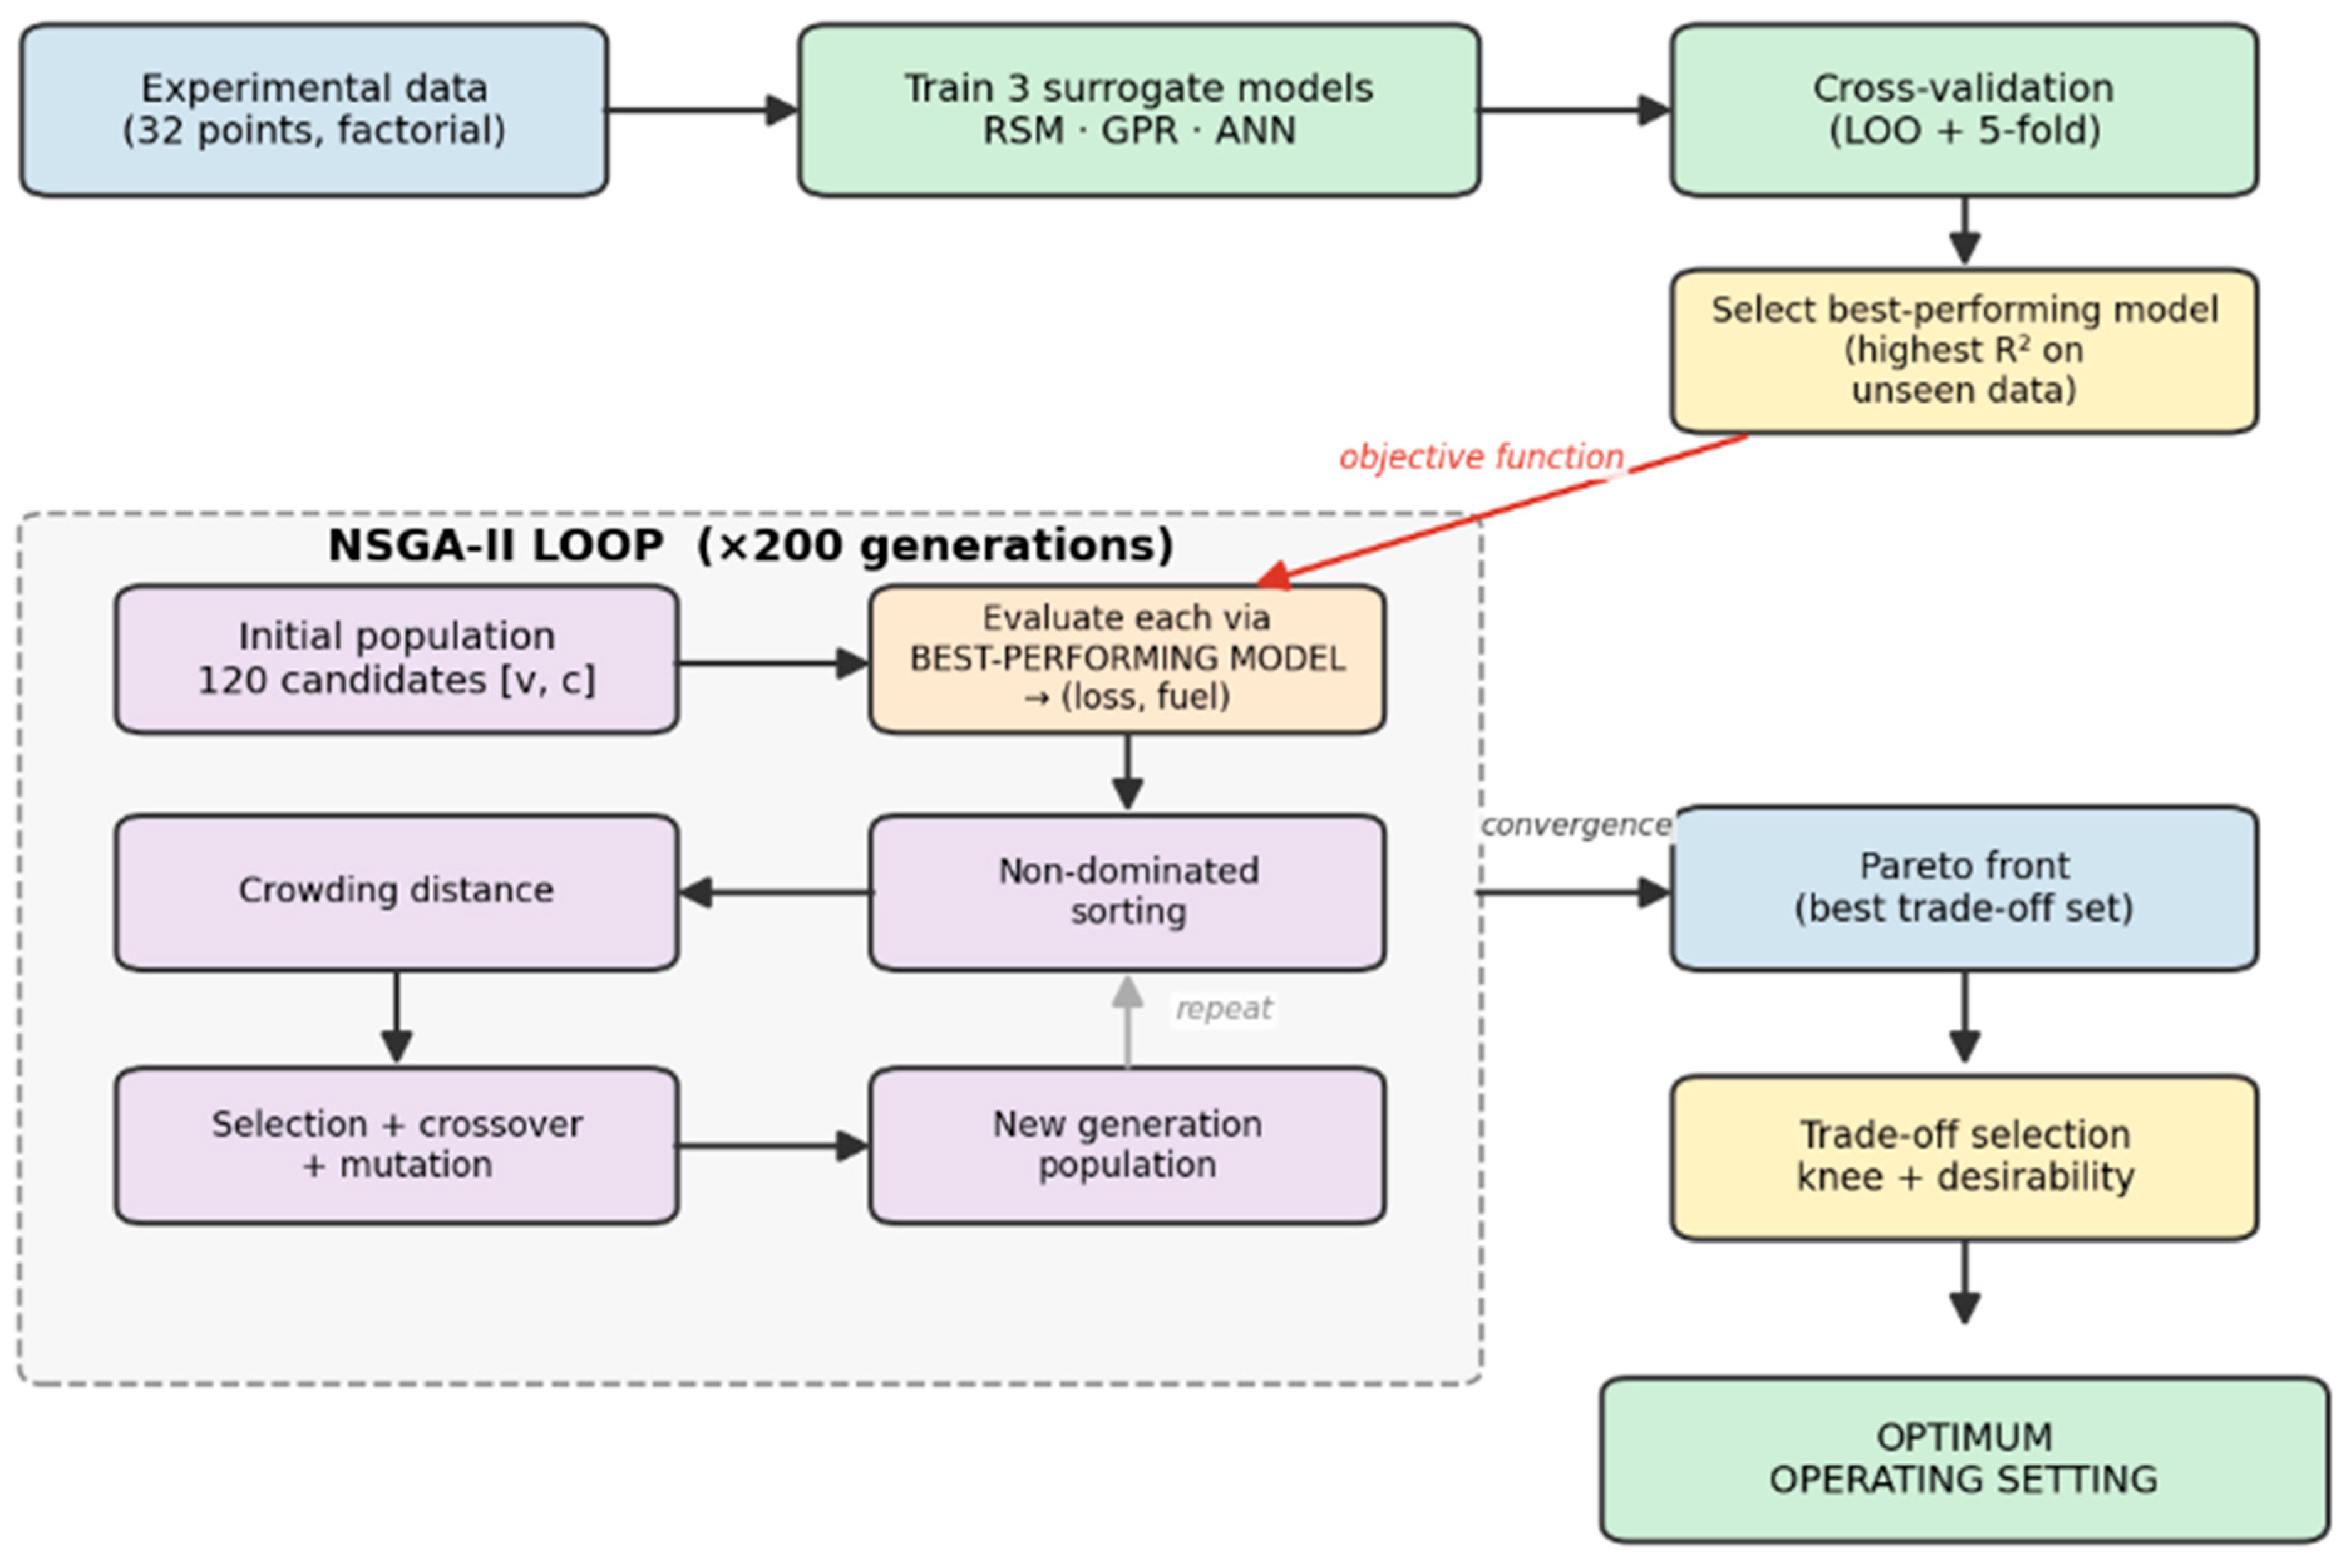
In our study, the effects of the drum peripheral speed and the drum–concave clearance on total grain loss and specific fuel consumption were modelled, and the operating settings that simultaneously minimize these two outputs were determined. Because the two objectives conflict (increasing the peripheral speed lowers the specific fuel consumption while raising the total grain loss), the optimization was treated as a multi-objective problem. The procedure was carried out in two stages: first, surrogate (prediction) models representing the experimental data were built, and then the optimum machine settings (drum type, peripheral speed and the drum–concave clearance) were searched for on the best-performing models using a genetic algorithm. Total grain loss and specific fuel consumption were selected as the two objective functions because they represent, respectively, the direct economic loss of the product and the energy cost of the operation, and because both could be measured reliably for every treatment combination on this machine. Other indicators are either contained within these two objectives or derived from them: threshing efficiency, cleaning efficiency and grain damage are already represented inside total grain loss through its unthreshed-ear, cleaning and broken-grain fractions, whereas threshing capacity enters the analysis implicitly because it forms the denominator of specific fuel consumption. They were therefore not treated as separate objective functions. The overall workflow is summarized in Figure 4.
Figure 4.
Workflow of the parameter optimization (surrogate model training, best-performing model selection by cross-validation, and the NSGA-II loop). Black arrows show the sequence of the workflow, the red arrow indicates that the selected best-performing surrogate model is used as the objective function of the NSGA-II loop, and the grey arrows denote the repetition of the generation loop and its convergence to the Pareto front. Box colours are used for visual grouping only.
The continuous inputs (peripheral speed and clearance) were standardized to zero mean and unit standard deviation for stable model training:
where x is the raw value, μ is the mean, σ is the standard deviation and z is the standardized value.
Three different prediction methods were built and compared as surrogate models: the Response Surface Model (RSM), Gaussian Process Regression (GPR) and the Artificial Neural Network (ANN).
The Response Surface Model (RSM) is a classical statistical method that describes the input–output relationship with a second-order equation; it is simple and interpretable but has difficulty capturing sharp, abrupt changes. The output was modelled as a second-order (quadratic) function of the inputs with interaction terms, and the coefficients were obtained by ordinary least squares (OLS):
where xi are the inputs (drum type, peripheral speed, clearance) β are the regression coefficients, ε is the error term, X is the design matrix, and y is the observation vector.
Gaussian Process Regression (GPR) is a machine-learning method that models the output as a Gaussian process and defines the similarity between points through a kernel function; it can capture non-linear behaviour even with few data points and provides a confidence interval for each prediction. In our study, a Matérn (ν = 5/2) kernel was used together with a white-noise term:
where m is the mean function, k is the kernel, r is the distance between points, ℓ is the length scale, and σ2 is the scale (amplitude).
For a new point x*, the prediction (mean) and the uncertainty (variance) were computed as follows:
where K is the covariance matrix of the training points, k* is the covariance between the new point and the training points, σn2 is the noise variance, and I is the identity matrix.
The kernel hyperparameters were learned by maximizing the log-marginal likelihood:
The Artificial Neural Network (ANN) learns the input–output relationship through a layered structure; although powerful, it is prone to overfitting with limited data and was included in the comparison because of its widespread use in the literature. The feed-forward pass and the L2-penalized loss function of a single-hidden-layer multilayer perceptron (MLP) are
where W and b are the weights and biases, tanh is the activation function, ŷ is the prediction, α is the regularization coefficient (which limits overfitting), and n is the number of samples.
The network was designed with 3 inputs, a single hidden layer of 8 neurons (tanh activation) and 1 output, with a regularization coefficient of α = 0.05. This architecture was selected a priori and was not tuned: with only 32 experimental observations, an extensive hyperparameter search would itself risk overfitting and would consume the very data required for an unbiased estimate of predictive performance. A deliberately small network (41 weights in total) combined with L2 regularization was therefore adopted to keep the number of free parameters low relative to the sample size. The consequences of this choice for the predictive accuracy of the ANN are discussed in Section 3.
The performance of models was evaluated both on the training (fit) data and on unseen data. To distinguish genuine predictive performance from overfitting, leave-one-out (LOO) and 5-fold cross-validation were applied, and all models were tested on the same folds for a fair comparison. The coefficient of determination (R2) and the root-mean-square error (RMSE) were used as performance metrics:
where yi is the observation, ŷi is the prediction, ȳ is the mean of observations, and n is the number of samples. For each output, the model giving the highest R2 on unseen data was selected as the best-performing model, and the optimization was carried out on these models.
The multi-objective optimization was performed with the Non-dominated Sorting Genetic Algorithm II (NSGA-II). The two objectives, total grain loss (f1) and specific fuel consumption (f2), were minimized simultaneously, with the peripheral speed (v) and the drum–concave clearance (c) as decision variables:
The superiority of one solution over another was defined through Pareto dominance:
where the symbol ≺ denotes dominance, i.e., solution xa dominating xb. In each generation, the algorithm ranked the candidates by dominance level (non-dominated sorting) and diversified solutions of the same rank by their crowding distance, thereby maintaining a balanced spread along the Pareto front. The search space was kept within the experimental limits to avoid extrapolation (v ∈ [36.73, 48.98] m s−1 and c ∈ [35, 50] mm). The genetic algorithm was run with a population of 120 individuals for a fixed number of 200 generations. Simulated binary crossover (SBX; crossover probability 0.9, distribution index η = 15) and polynomial mutation (mutation probability 1/n, where n is the number of decision variables, and distribution index η = 20) were used, together with binary tournament selection based on non-dominated rank and crowding distance. The random seed was fixed (seed = 1) so that the reported results were exactly reproducible, and the optimization was repeated with different seeds to confirm that the Pareto front was stable. Termination was based on the fixed generation count; the front had already converged well before the final generation. For each candidate solution, the objective values (total loss and specific fuel consumption) were obtained from the best-performing surrogate models, so that thousands of settings could be evaluated rapidly without the need for real experiments.
To select the most balanced solution from the resulting Pareto front, the solutions were first normalized:
Then, the “knee” point closest to the utopia (ideal) point and the maximum of the equally weighted desirability were determined:
where is the normalized objective and D is the desirability value. In addition, since it is difficult to hold a single operating point precisely in the field, the set of all speed–clearance settings satisfying acceptable limits (total grain loss ≤ 5% and specific fuel consumption ≤ 3.2 mL kg−1), i.e., the feasible region (safe operating window), was determined by scanning the parameter space on the best-performing models. These acceptance limits are not taken from a binding standard, since no international standard prescribes a fixed maximum total grain loss for stationary threshers. The 5% limit was adopted by the authors as a practical and economic criterion: it is the level above which the loss of product was judged to be no longer acceptable for the growers who use these machines, and in the present data it also separates the moderate-speed operating region from the high-speed region in which the loss rose steeply. The specific fuel consumption limit of 3.2 mL kg−1 corresponds to the median of the values measured in this study and was adopted as an economic criterion representing average energy performance. Both thresholds therefore reflect a practical and economic judgement by the authors rather than a normative standard, and the feasible region should be interpreted accordingly.
All modelling and optimization were performed in Python 3.10.11 (Python Software Foundation, Wilmington, DE, USA). The RSM, GPR and ANN models and the cross-validation were implemented with scikit-learn (version 1.7.2), the analysis of variance with statsmodels (version 0.14.6), and the multi-objective genetic algorithm with pymoo (version 0.6.1). Data handling was carried out with pandas (version 2.3.3) and NumPy (version 1.26.4), and the figures were produced with Matplotlib (version 3.10.7) and SciPy (version 1.15.3). The model and algorithm settings used in the optimization are summarized in Table 2.
Table 2.
Model and algorithm settings used in the parameter optimization.
3. Results and Discussion
Because the experiment was arranged as a full factorial design, the effects of the three factors were tested statistically before the individual factor effects were discussed. Each treatment combination was run once and the five samples taken during a run are sub-samples of that run rather than independent replications; the three-way interaction was therefore pooled to provide the error term, which is the standard procedure for an unreplicated factorial design. The resulting analysis of variance for the three measured responses is given in Table 3.
Table 3.
Analysis of variance for total grain loss, specific fuel consumption and threshing capacity (unreplicated full factorial design; the three-way interaction is pooled as the error term).
All three main effects were highly significant for all three responses (p < 0.01). For total grain loss the drum peripheral speed was by far the dominant factor (F = 3403.4), followed by the drum–concave clearance (F = 219.2) and the drum type (F = 45.6), and all two-way interactions were also significant (p < 0.01), which indicates that the effect of speed depends to some extent on the clearance and on the drum type. The same ranking of the main effects was obtained for threshing capacity (speed F = 1532.6, clearance F = 282.2, drum type F = 98.7) and for specific fuel consumption (speed F = 148.6, clearance F = 16.8, drum type F = 12.3); for these two responses none of the interactions reached significance (p > 0.05), so the factors act essentially additively. These results statistically confirm the factor effects that are described in the following sections and justify treating the peripheral speed as the most influential machine parameter. Because the design was not replicated, the error term is obtained by pooling, and the F tests should therefore be regarded as indicative rather than as a fully independent test of significance; this is stated among the limitations of the study.
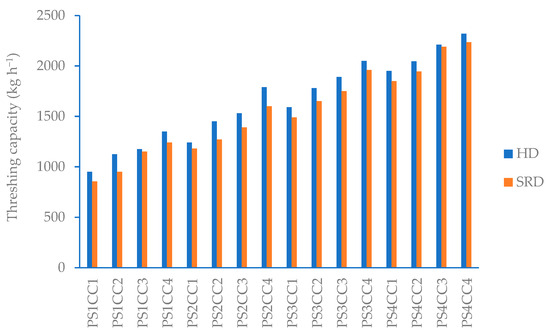
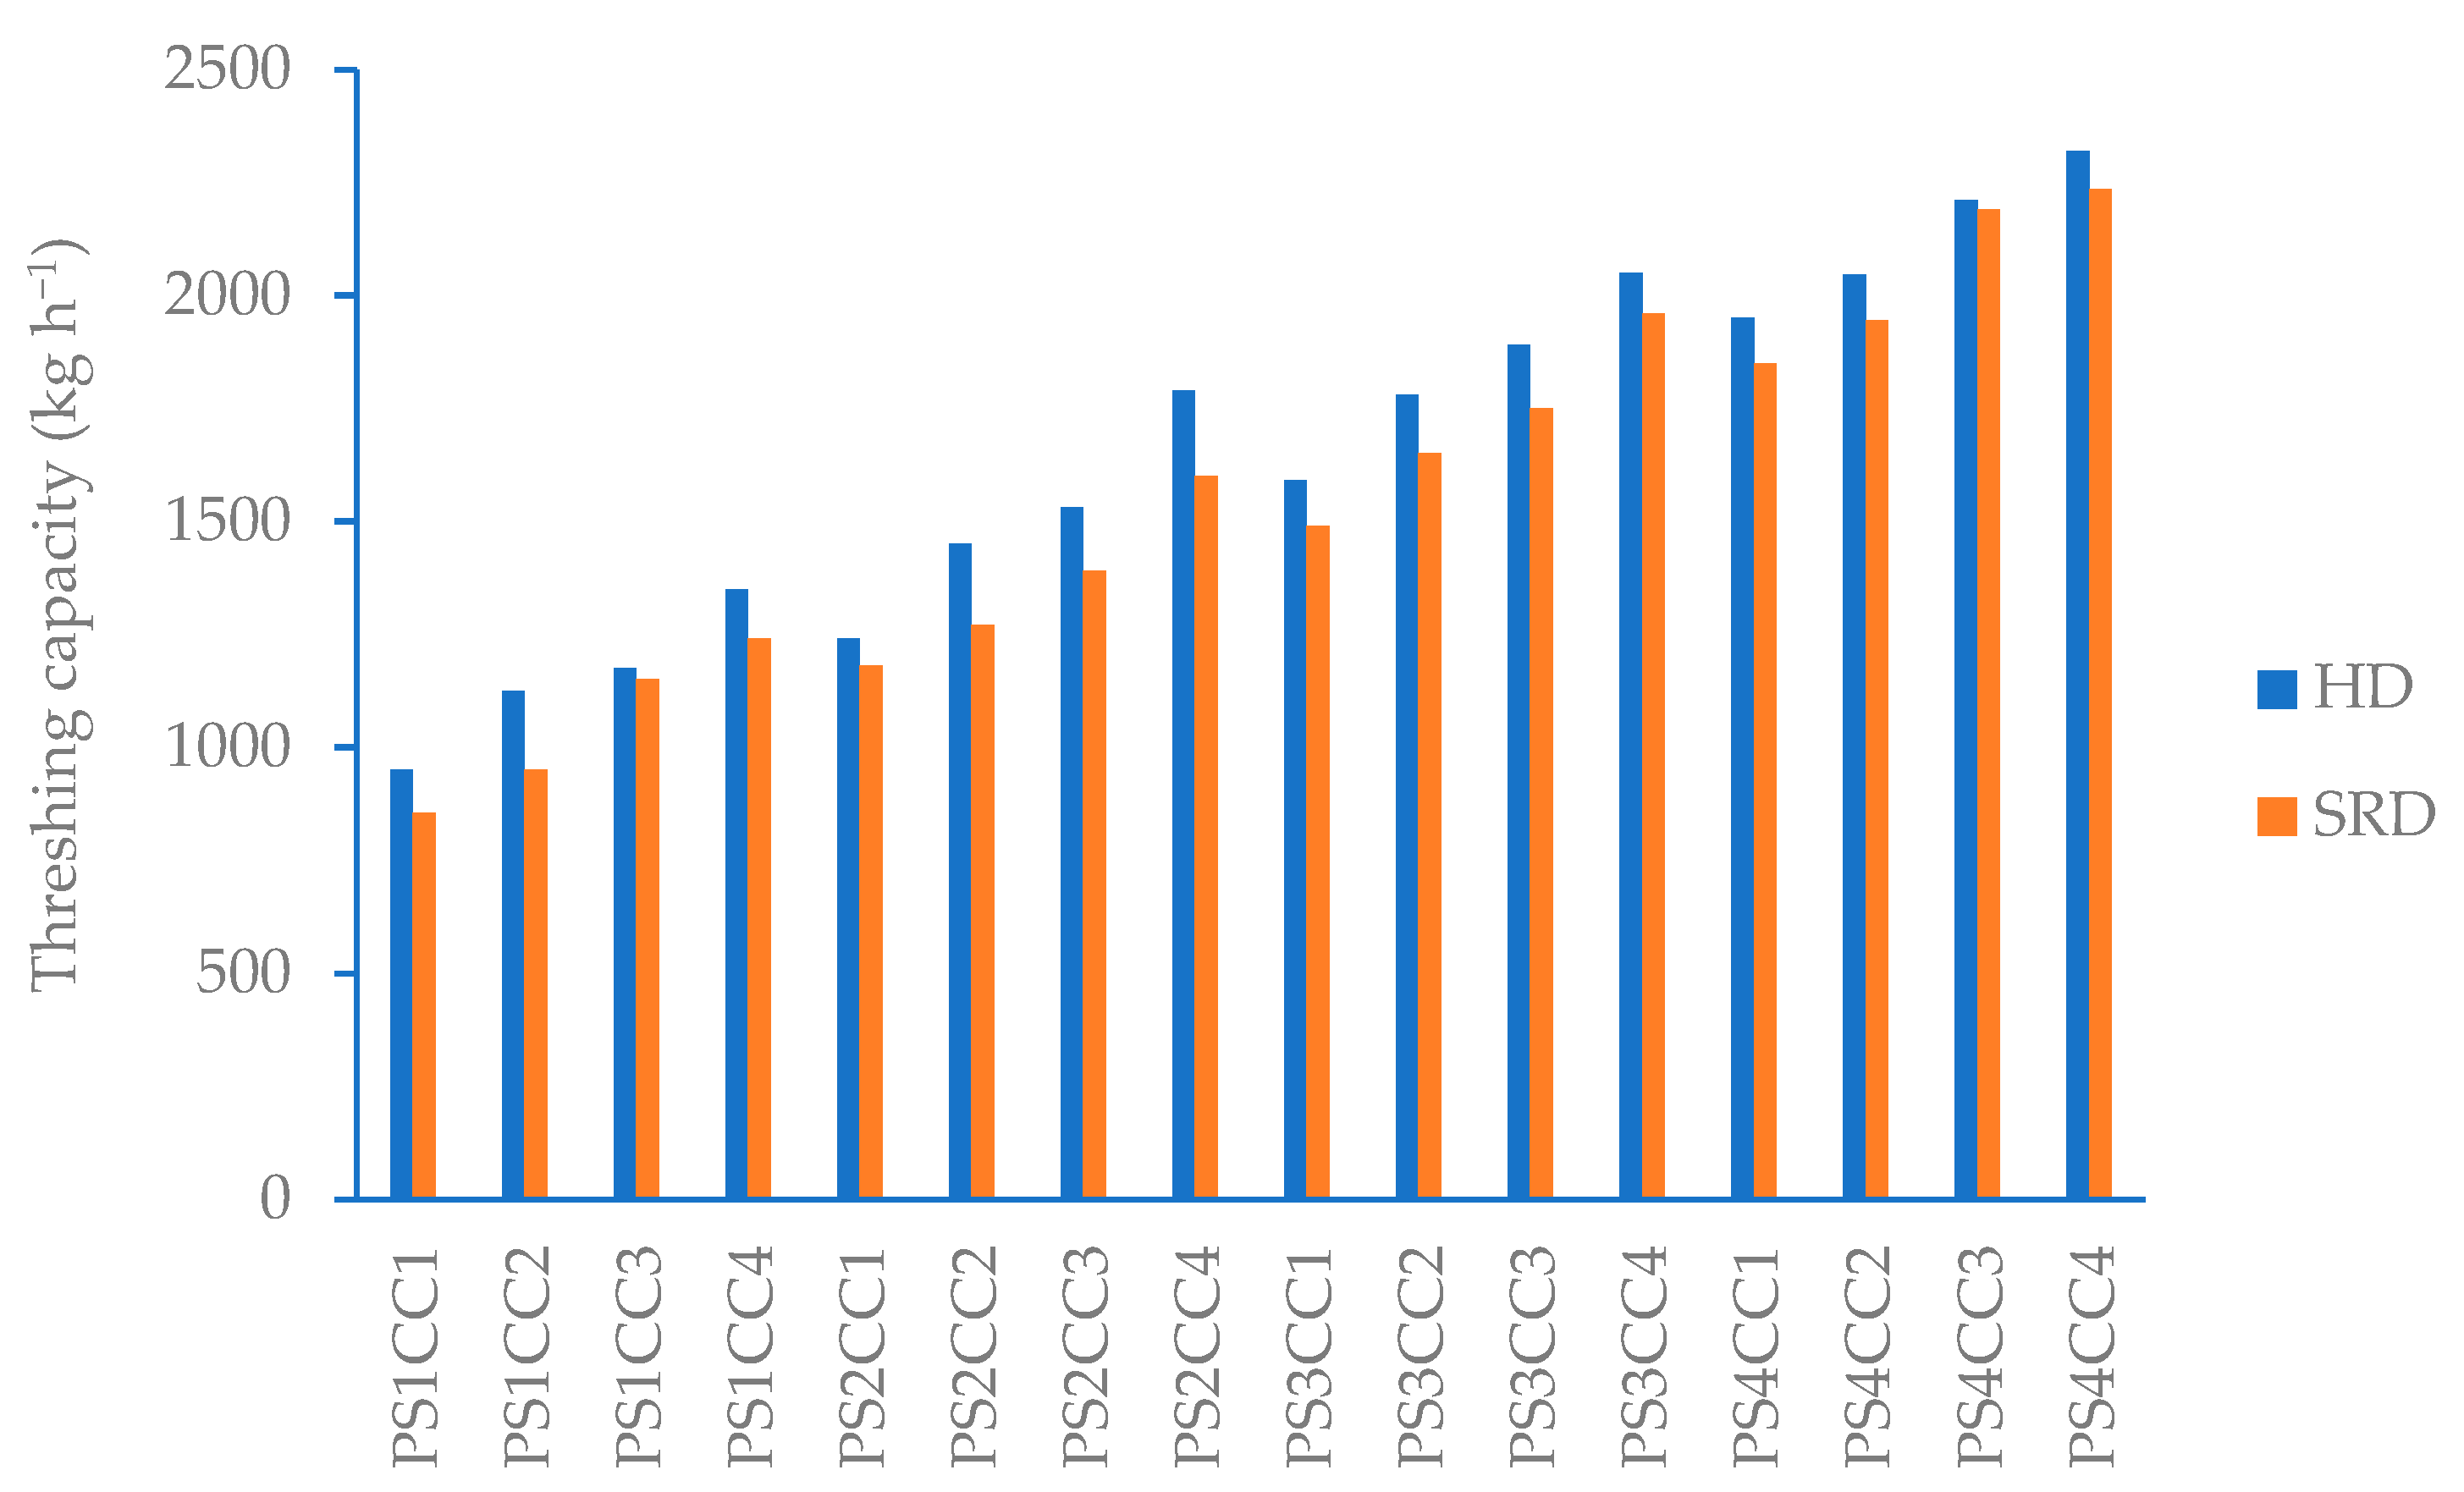
Figure 5 shows the variation in threshing capacity after wheat threshing in threshing machines with straight and helical row threshing drums, depending on the variation in threshing drum peripheral speed and drum–concave clearance. It was determined that the wheat threshing capacity varied between 855 and 2320 kg h−1 depending on the threshing drum type and different operating parameters. The lowest threshing capacity was obtained in the straight row drum with a peripheral speed of 36.73 m s−1 and a drum–concave clearance of 35 mm, while the highest threshing capacity was obtained in the helical drum with a peripheral speed of 48.98 m s−1 and a drum–concave clearance of 50 mm. The average threshing capacity in the straight row drum was 1544 kg h−1, while in the helical drum it increased by approximately 7% to an average of 1652 kg h−1. In a straight-row drum, the fingers strike the material with a delay of 90° (angle difference), while in a helical threshing drum, the strike/impact occurs with a delay of 18.90°, resulting in increased threshing capacity. Increased drum peripheral speed and drum–concave clearance also contributed to increased threshing capacity. A 33.3% increase in drum peripheral speed increased the average threshing capacity by 90%. A 43% increase in drum–concave clearance resulted in a 31% increase in threshing capacity. It was determined that drum peripheral speed had a more significant effect on threshing capacity.
Figure 5.
Changes in threshing capacity under different working conditions. PS1–PS4 denote drum peripheral speeds of 36.73, 40.82, 44.90 and 48.98 m s−1, respectively; CC1–CC4 denote drum–concave clearances of 35, 40, 45 and 50 mm, respectively.
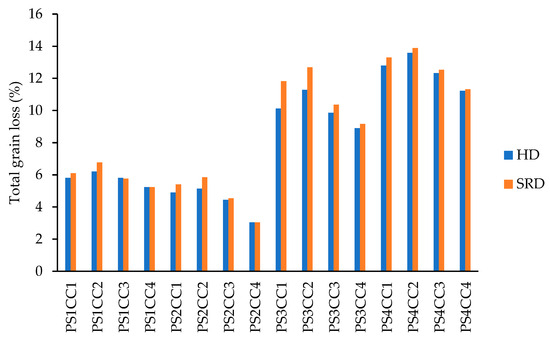
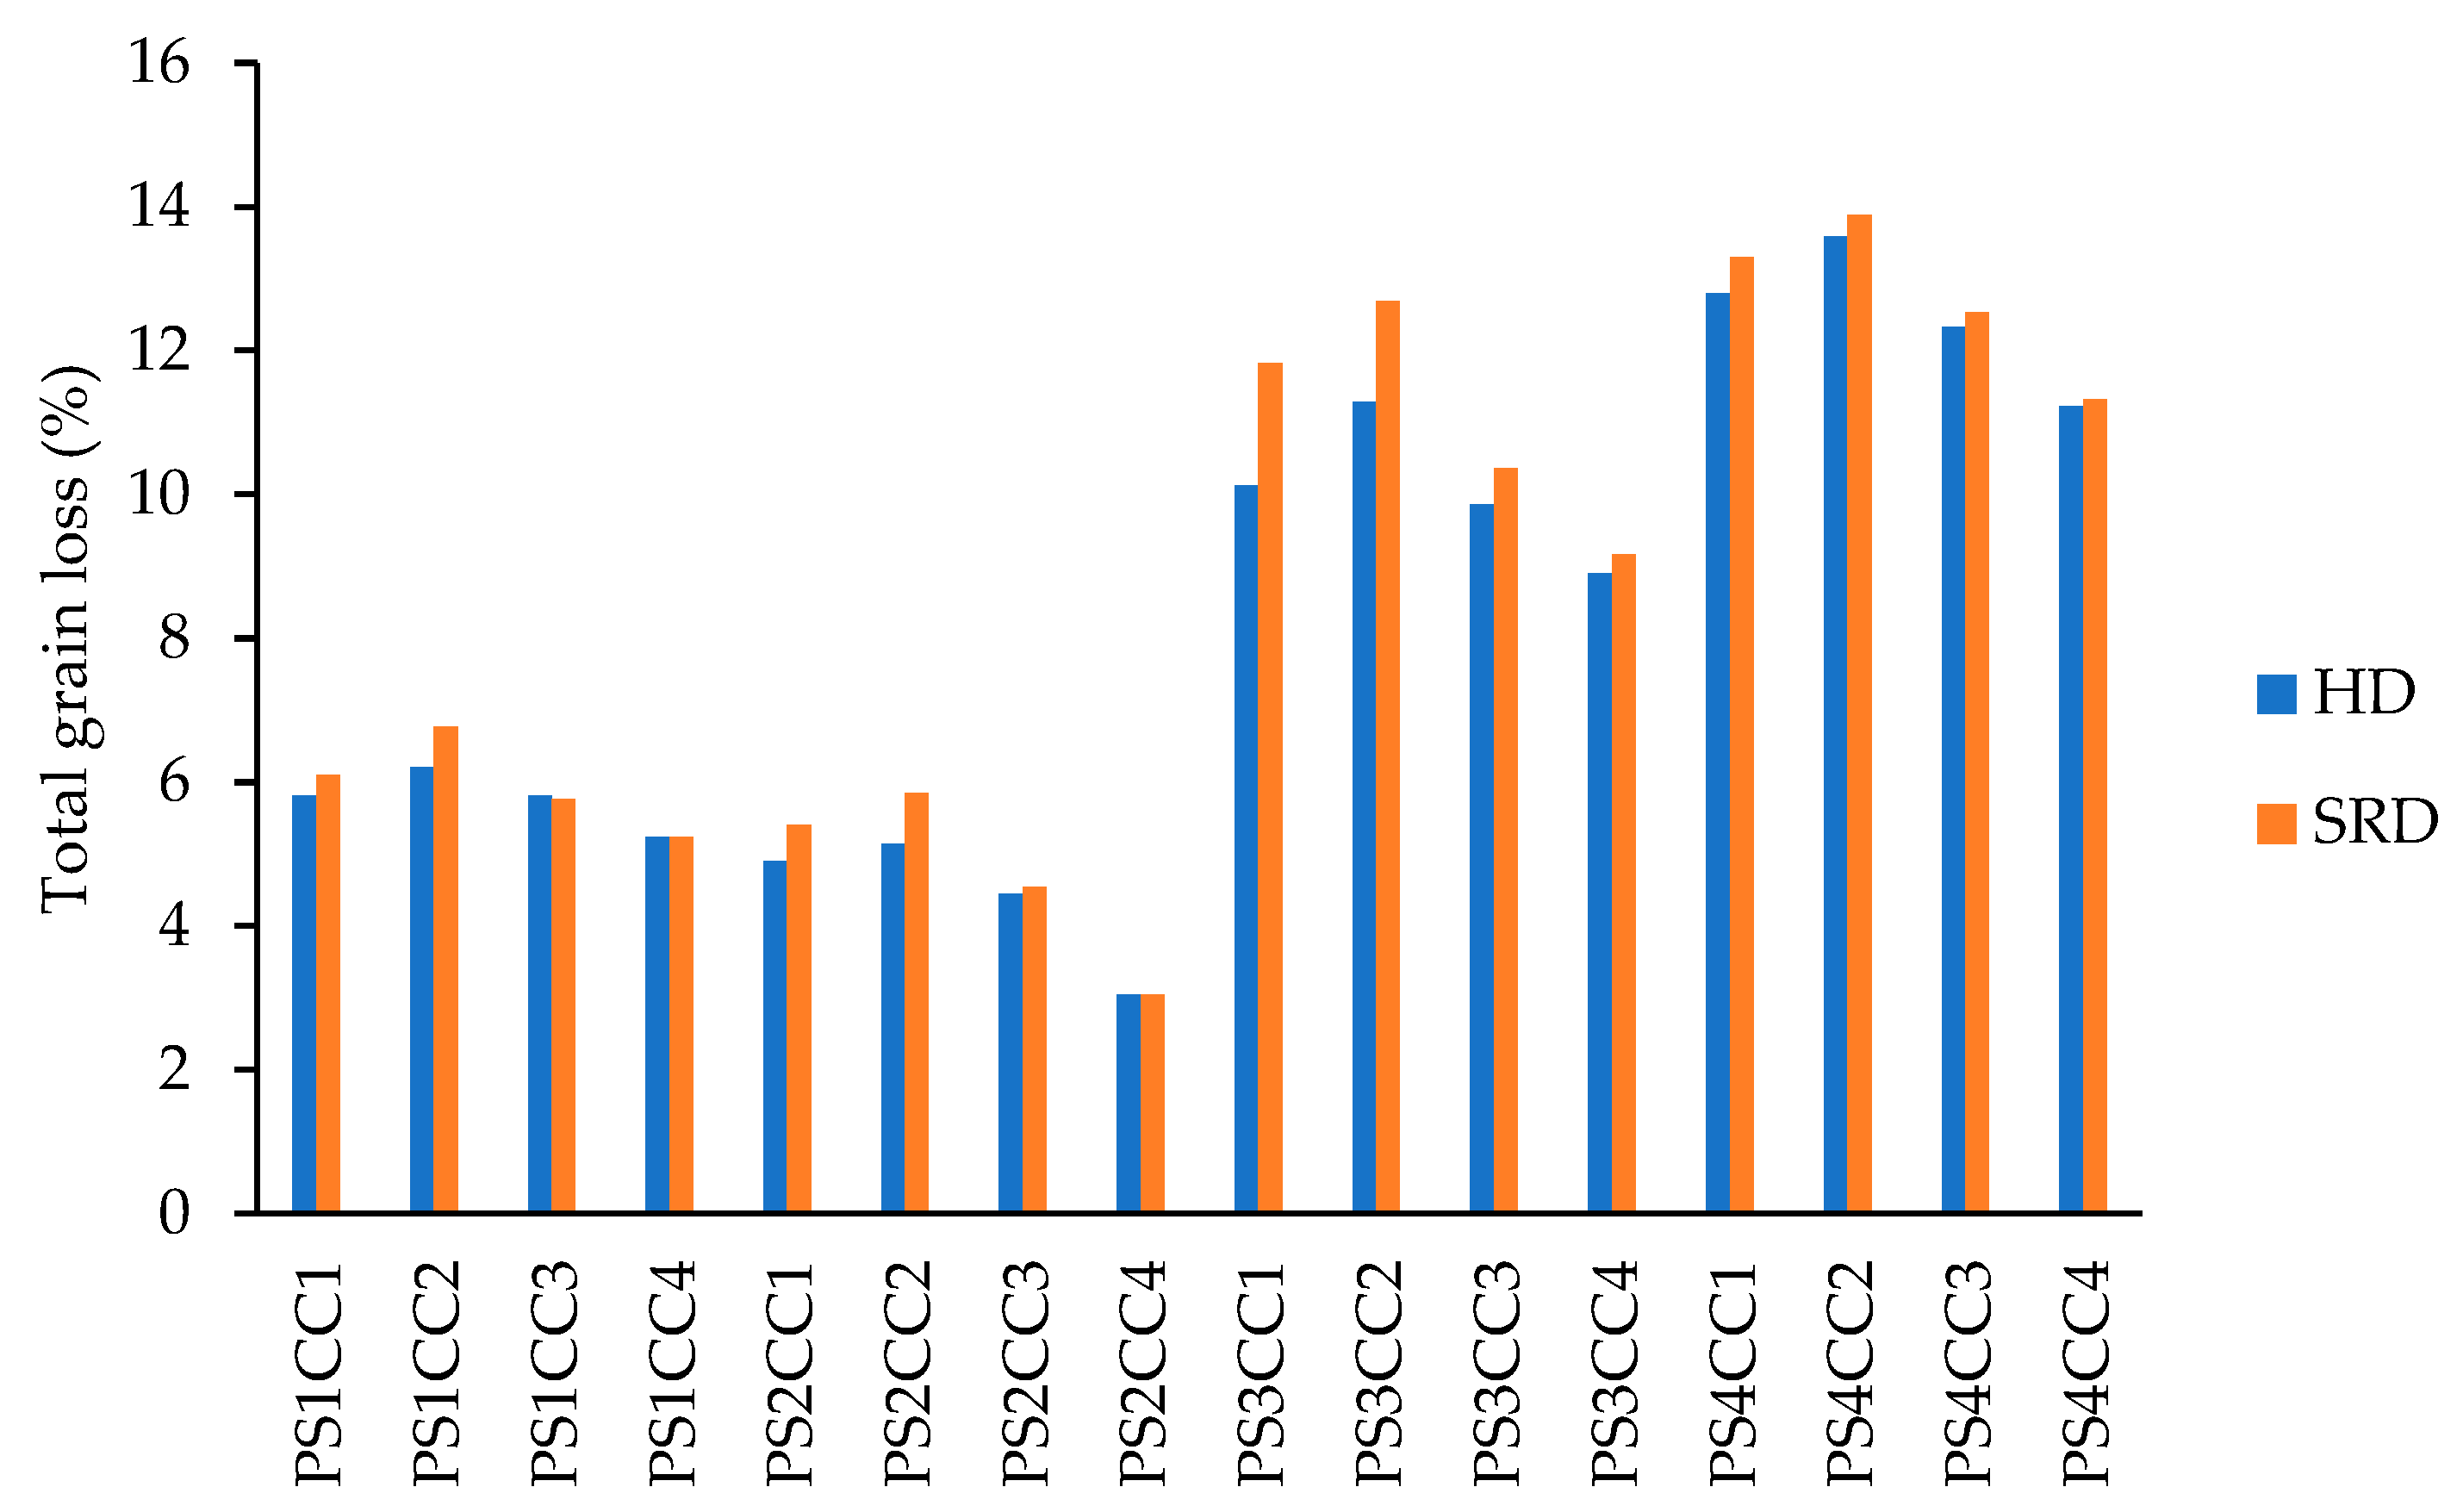
Figure 6 shows the variation in total grain loss in wheat threshing depending on the drum type, drum peripheral speed, and drum–concave clearance. It was determined that the total grain loss varied between 3.04 and 13.89% depending on the threshing drum type and different operating parameters. The lowest total loss was obtained with the helical drum at a peripheral speed of 40.82 m s−1 and a drum–concave clearance of 50 mm, while the highest loss was obtained with the straight row drum at a peripheral speed of 48.98 m s−1 and a drum–concave clearance of 40 mm. The average total grain loss was 8.61% in the straight-row drum, while it decreased by approximately 5.1% to an average of 8.17% in the helical drum. In both drum types, the percentage of cleaning loss within the total loss was approximately 56–58%, the percentage of threshing loss was 24–25%, and the percentage of broken grains was 18–19%. It was found that while threshing loss is higher in a straight-row drum, cleaning loss is higher in a helical drum due to their higher threshing capacity. The upper end of the observed range (up to 13.89%) is far above what would be acceptable in practice; such values occurred exclusively at the highest peripheral speeds (44.90 and 48.98 m s−1) and would not be selected as operating settings. Losses below the 5% criterion adopted in this study were obtained only in the moderate-speed, wide-clearance region, which is precisely the region identified by the optimization. Because this region is a continuous window rather than a single point, the recommended settings retain a margin against the variability encountered in the field.
Figure 6.
Changes in total grain loss under different operating conditions. PS1–PS4 denote drum peripheral speeds of 36.73, 40.82, 44.90 and 48.98 m s−1, respectively; CC1–CC4 denote drum–concave clearances of 35, 40, 45 and 50 mm, respectively.
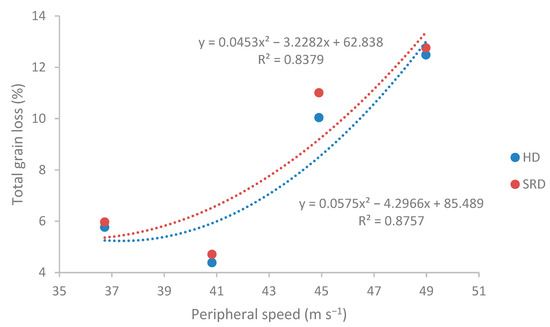
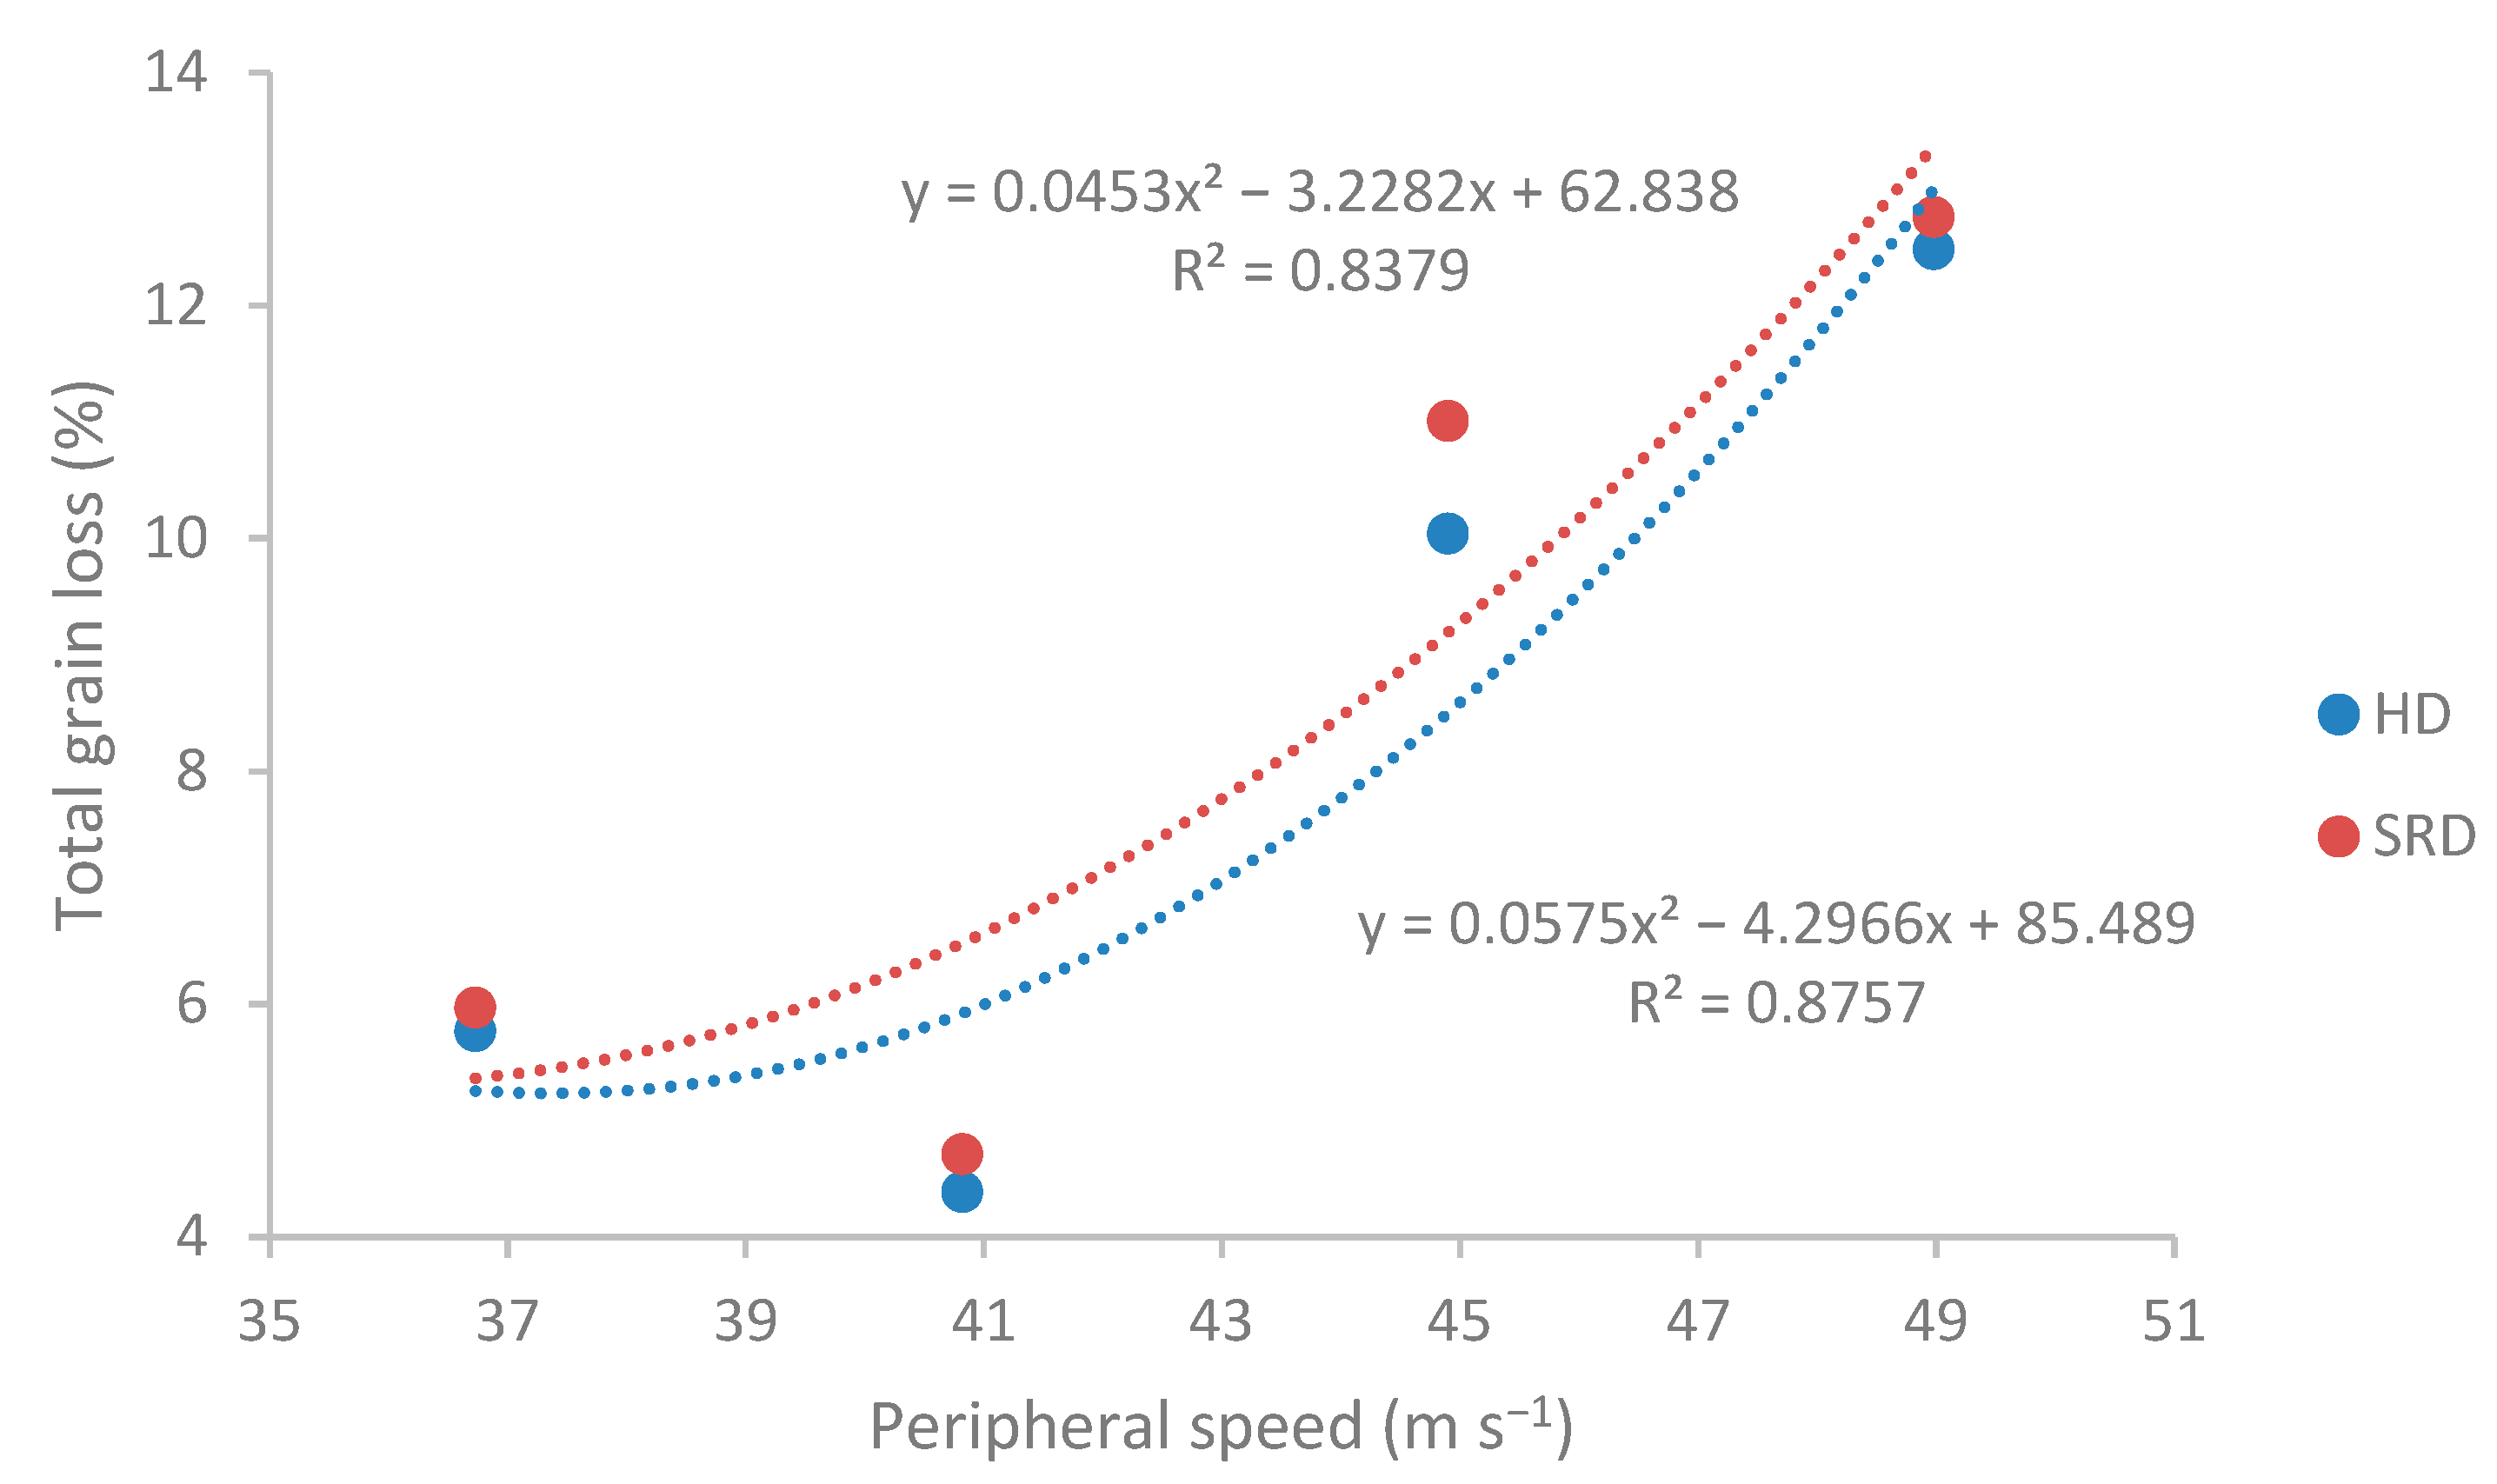
It was determined that total grain loss increased with increasing drum peripheral speed (Figure 7). An approximately 33% increase in drum peripheral speed increased total grain loss by an average of 1.14 times. While the increase in cleaning loss was approximately 35% with increasing drum peripheral speed, there was an 83% decrease in threshing loss. The increase in cleaning loss was caused by an approximately 90% increase in threshing capacity with increasing drum peripheral speed. The percentage of broken grains within the total grain loss also increased by approximately 5.8 times with increasing threshing drum peripheral speed. The damage sustained by a grain is directly proportional to its kinetic energy at the moment of impact. This was caused by a 78% increase in the kinetic energy of the drum fingers with increasing peripheral speed in the study. A second-order polynomial relationship was found between drum peripheral speed and total grain loss, and the coefficient of determination of the relationship was found to be R2 = 0.8379 for the straight row drum and 0.8757 for the helical drum. The impact forces generated during threshing are necessary for separating the grains from the plant matter. However, excessive or uncontrolled impacts damage the grains [28]. Studies on corn and soybeans have found that impact damage becomes significant when the impact velocity exceeds 10 m s−1 [29]. Khazaei [30] reported that increasing the impact velocity from 5 to 12 m s−1 resulted in an increase in the average physical damage percentage of kidney beans from 3.25% to 37.5%. These comparisons with other crops should, however, be interpreted with caution: kidney bean, maize and soybean seeds differ from wheat in size, shape, hull structure, hardness and moisture-dependent elasticity, so the absolute damage thresholds are not directly transferable. They are cited here only to illustrate the general mechanism by which impact velocity governs mechanical damage, and not as quantitative limits for wheat.
Figure 7.
Variation in total grain loss depending on drum peripheral speed.
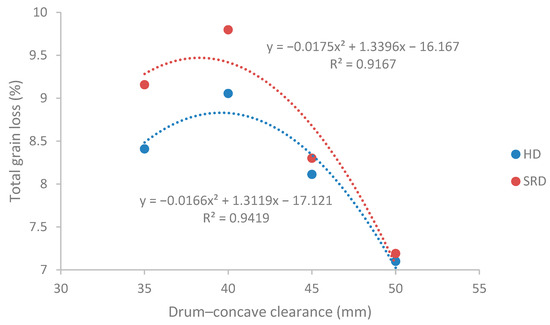
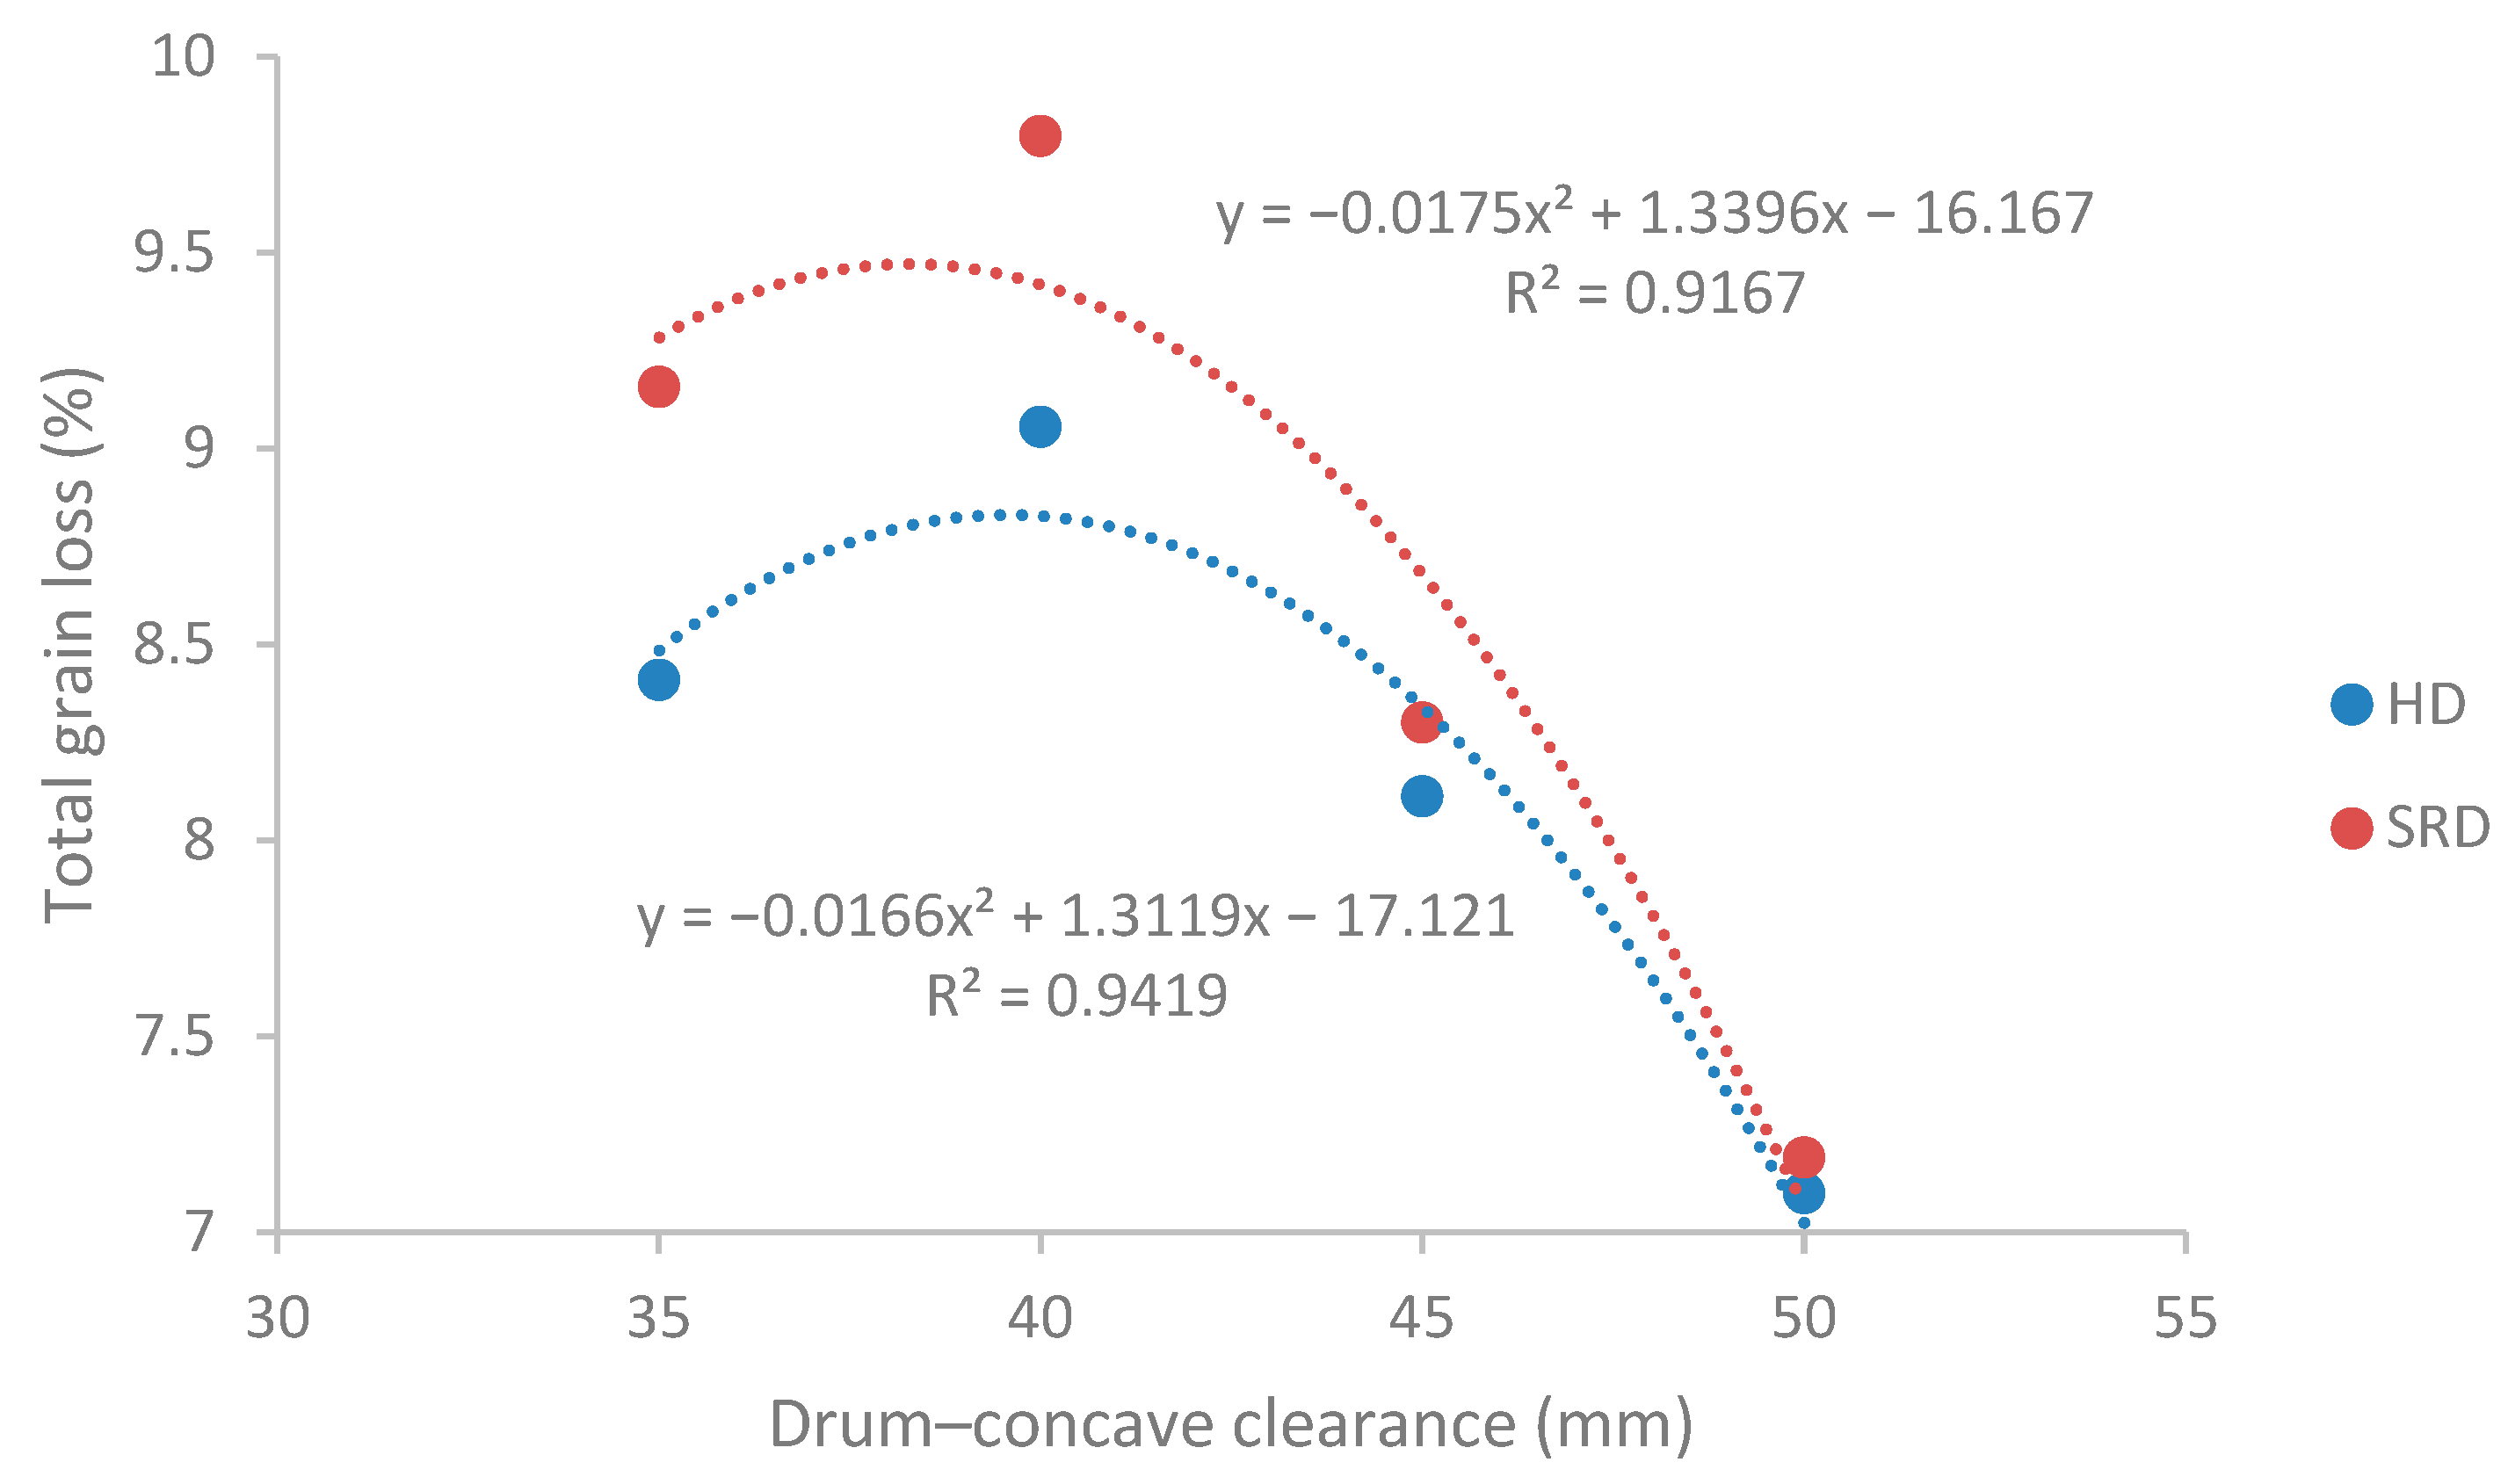
It was determined that increasing the drum–concave clearance reduced the total grain loss (Figure 8). An increase of approximately 43% in clearance reduced the total grain loss by an average of 18.45%. While the increase in cleaning loss due to the increased drum–concave clearance was approximately 100%, there was a 65% decrease in threshing loss. The increase in cleaning loss was caused by an approximately 31% increase in threshing capacity due to the increased drum–concave clearance. It was determined that threshing losses decreased because the product left the system later at increased drum–concave clearance values. There was also approximately a 39% decrease in the broken grain ratio within the total grain loss due to the increased drum–concave clearance. This situation can be explained by the fact that the product is subjected to less physical contact, impact, and compression between the drum and the concave sieve surfaces. A second-order polynomial relationship was found between the drum–concave clearance and the total grain loss, and the coefficient of determination R2 was determined to be 0.9419 for the helical drum and 0.9167 for the straight row drum. As the drum–concave clearance increases, the product is less affected by mechanical stresses, and the friction intensity between grains decreases, resulting in a lower broken grain rate [11]. Li et al. [31] found that increasing the drum–concave clearance to 30 mm in rice harvesting with a combine harvester reduced the grain damage rate. Sudajan et al. [21] stated in their study that reducing the drum–concave clearance in sunflower threshing improved threshing efficiency by increasing the compression and friction effect applied to the sunflower ears, while potentially increasing seed damage. The trade-off associated with a wide clearance nevertheless deserves emphasis. Increasing the clearance to 50 mm reduced both threshing loss and broken grain, but it also increased threshing capacity and therefore the mass flow reaching the cleaning unit, which raised the cleaning loss. At the recommended clearance of 50 mm the cleaning unit is thus operating close to its capacity limit, and in commercial operation any further increase in feed rate, or a higher proportion of short straw fragments as encountered at low grain moisture, could push cleaning losses upward. In practice this means that the wide-clearance setting should be combined with a feed rate that does not overload the sieves and aspirator; if the cleaning unit cannot be adjusted accordingly, part of the benefit obtained in threshing would be lost again during cleaning.
Figure 8.
Variation in total grain loss depending on the drum–concave clearance.
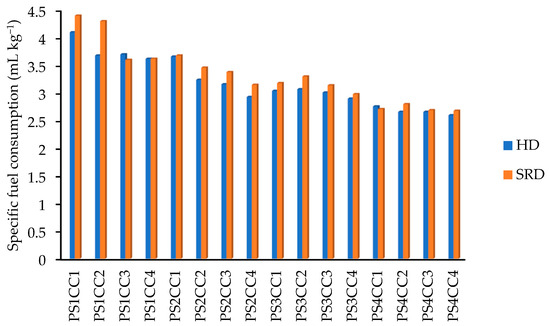
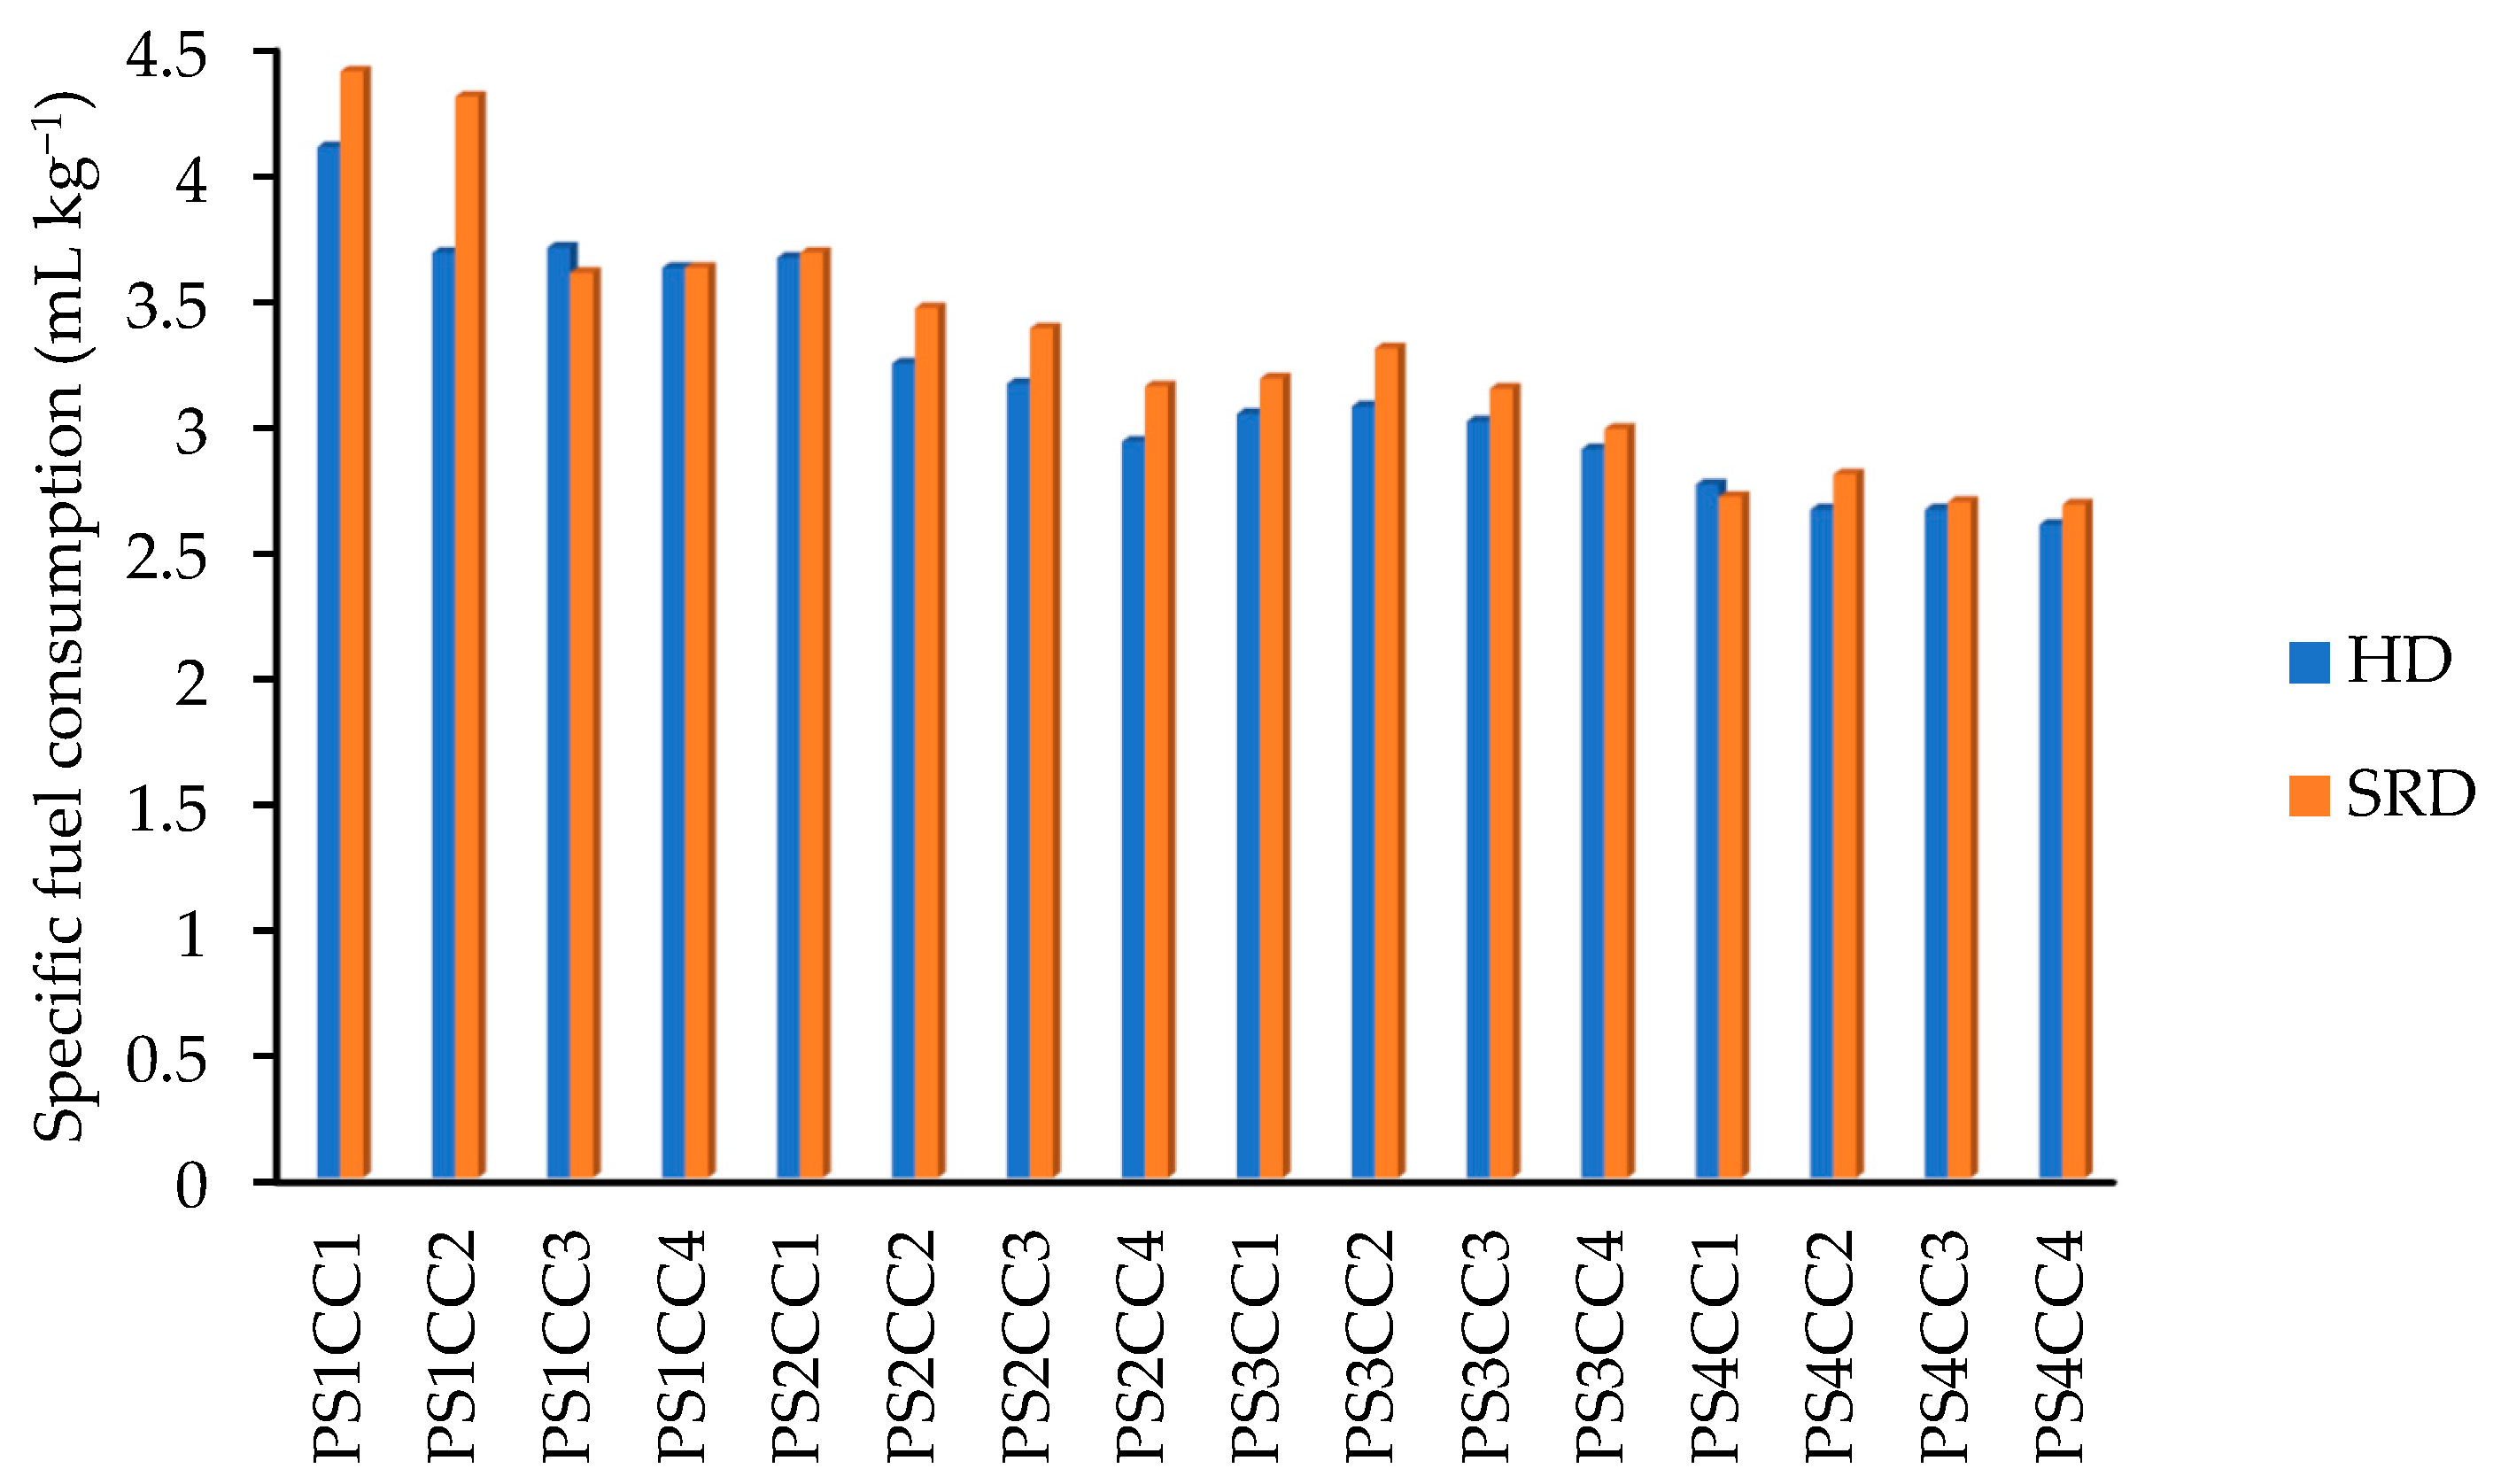
Fuel consumption in wheat threshing varied between 3.8 and 6.2 L h−1 depending on the drum type, drum peripheral speed, and the drum–concave clearance. The variation in specific fuel consumption under different operating conditions is depicted in Figure 9. It was determined that the specific fuel consumption varied between 2.6 and 4.40 mL kg−1 depending on the drum type and different operating parameters. The lowest specific fuel consumption was obtained in the helical drum with a peripheral speed of 48.98 m s−1 and a drum–concave clearance of 50 mm, while the highest specific fuel consumption was obtained in the straight row drum with a peripheral speed of 36.73 m s−1 and a drum–concave clearance of 35 mm. The average specific fuel consumption was 3.32 mL kg−1 in the straight row drum, while it decreased by approximately 4.5% to an average of 3.17 mL kg−1 in the helical drum. The fact that the threshing capacity in the helical drum is approximately 7% higher than in the straight-row drum resulted in lower specific fuel consumption. Demirel and Sessiz [32] found that fuel consumption in lentil threshing with three different manufacturers’ towed threshing machines varied between 4.52 and 6.16 L h−1. They found values quite close to the results obtained in this study. Abdeen et al. [33] studied two threshing unit structures, a conical threshing unit and a drum threshing unit, in rice threshing. In the drum threshing unit, they increased the threshing efficiency from 2304 kg h−1 to 2448 kg h−1 and reduced the specific energy from 3.37 to 3.15 kWh t−1.
Figure 9.
Variation in specific fuel consumption under different operating conditions. PS1–PS4 denote drum peripheral speeds of 36.73, 40.82, 44.90 and 48.98 m s−1, respectively; CC1–CC4 denote drum–concave clearances of 35, 40, 45 and 50 mm, respectively.
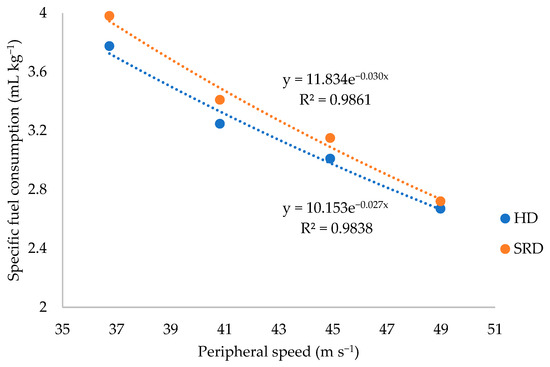
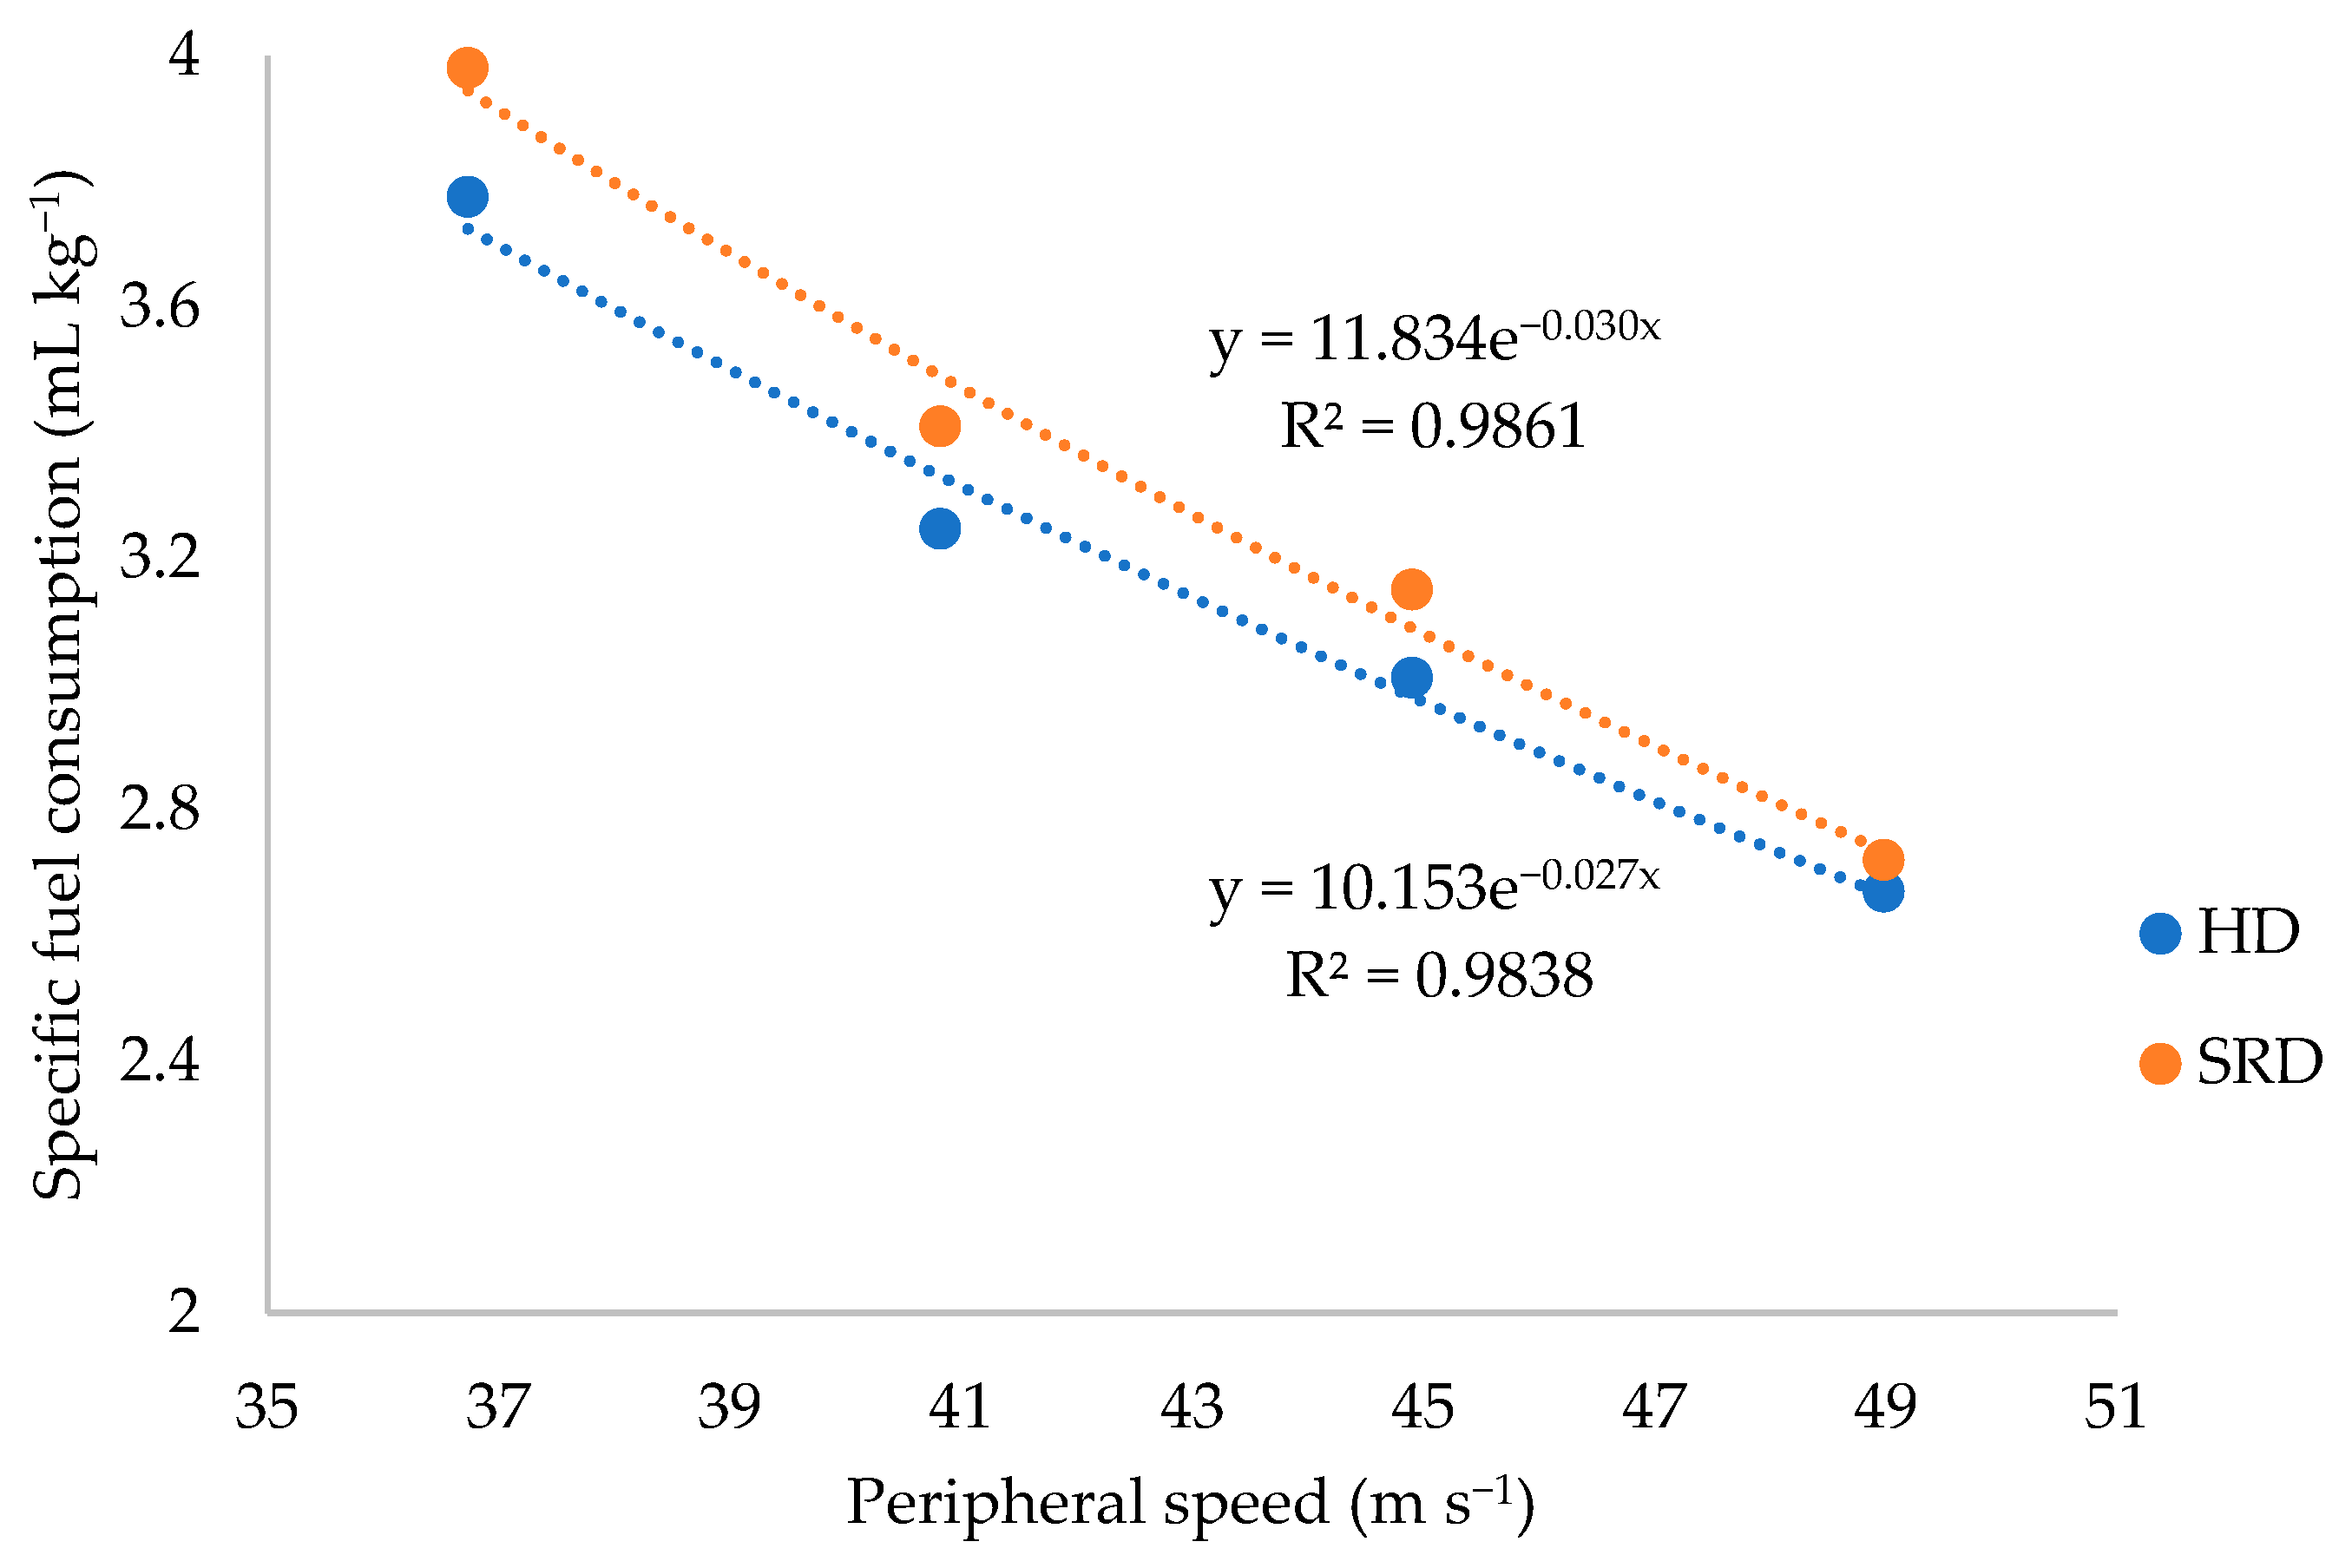
Specific fuel consumption decreased with increasing drum peripheral speed (Figure 10). An approximately 33% increase in drum peripheral speed reduced specific fuel consumption by an average of 31.6%. Hourly fuel consumption and threshing capacity increased with increasing drum peripheral speed. It must be emphasized that hourly fuel consumption and specific fuel consumption behave differently and should not be confused. The absolute hourly fuel consumption of the tractor did not decrease; on the contrary, it increased with peripheral speed (from 3.8 to 6.2 L h−1) because the higher drum speed increased the load on the engine. Specific fuel consumption decreased only because threshing capacity increased proportionally more than hourly fuel consumption, so that the fuel spent per kilogram of fed material became smaller. The reduction in specific fuel consumption is therefore driven mainly by the gain in capacity and must not be interpreted as a reduction in the absolute amount of fuel burned per hour. An exponential relationship was found between drum peripheral speed and specific fuel consumption, and the coefficient of determination of the relationship was obtained as approximately R2 = 0.98 for both drum types.
Figure 10.
Variation in specific fuel consumption depending on drum peripheral speed.
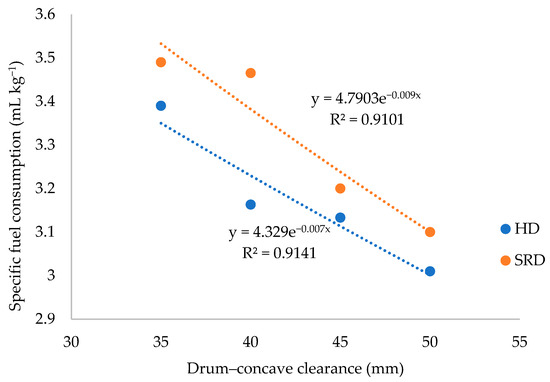
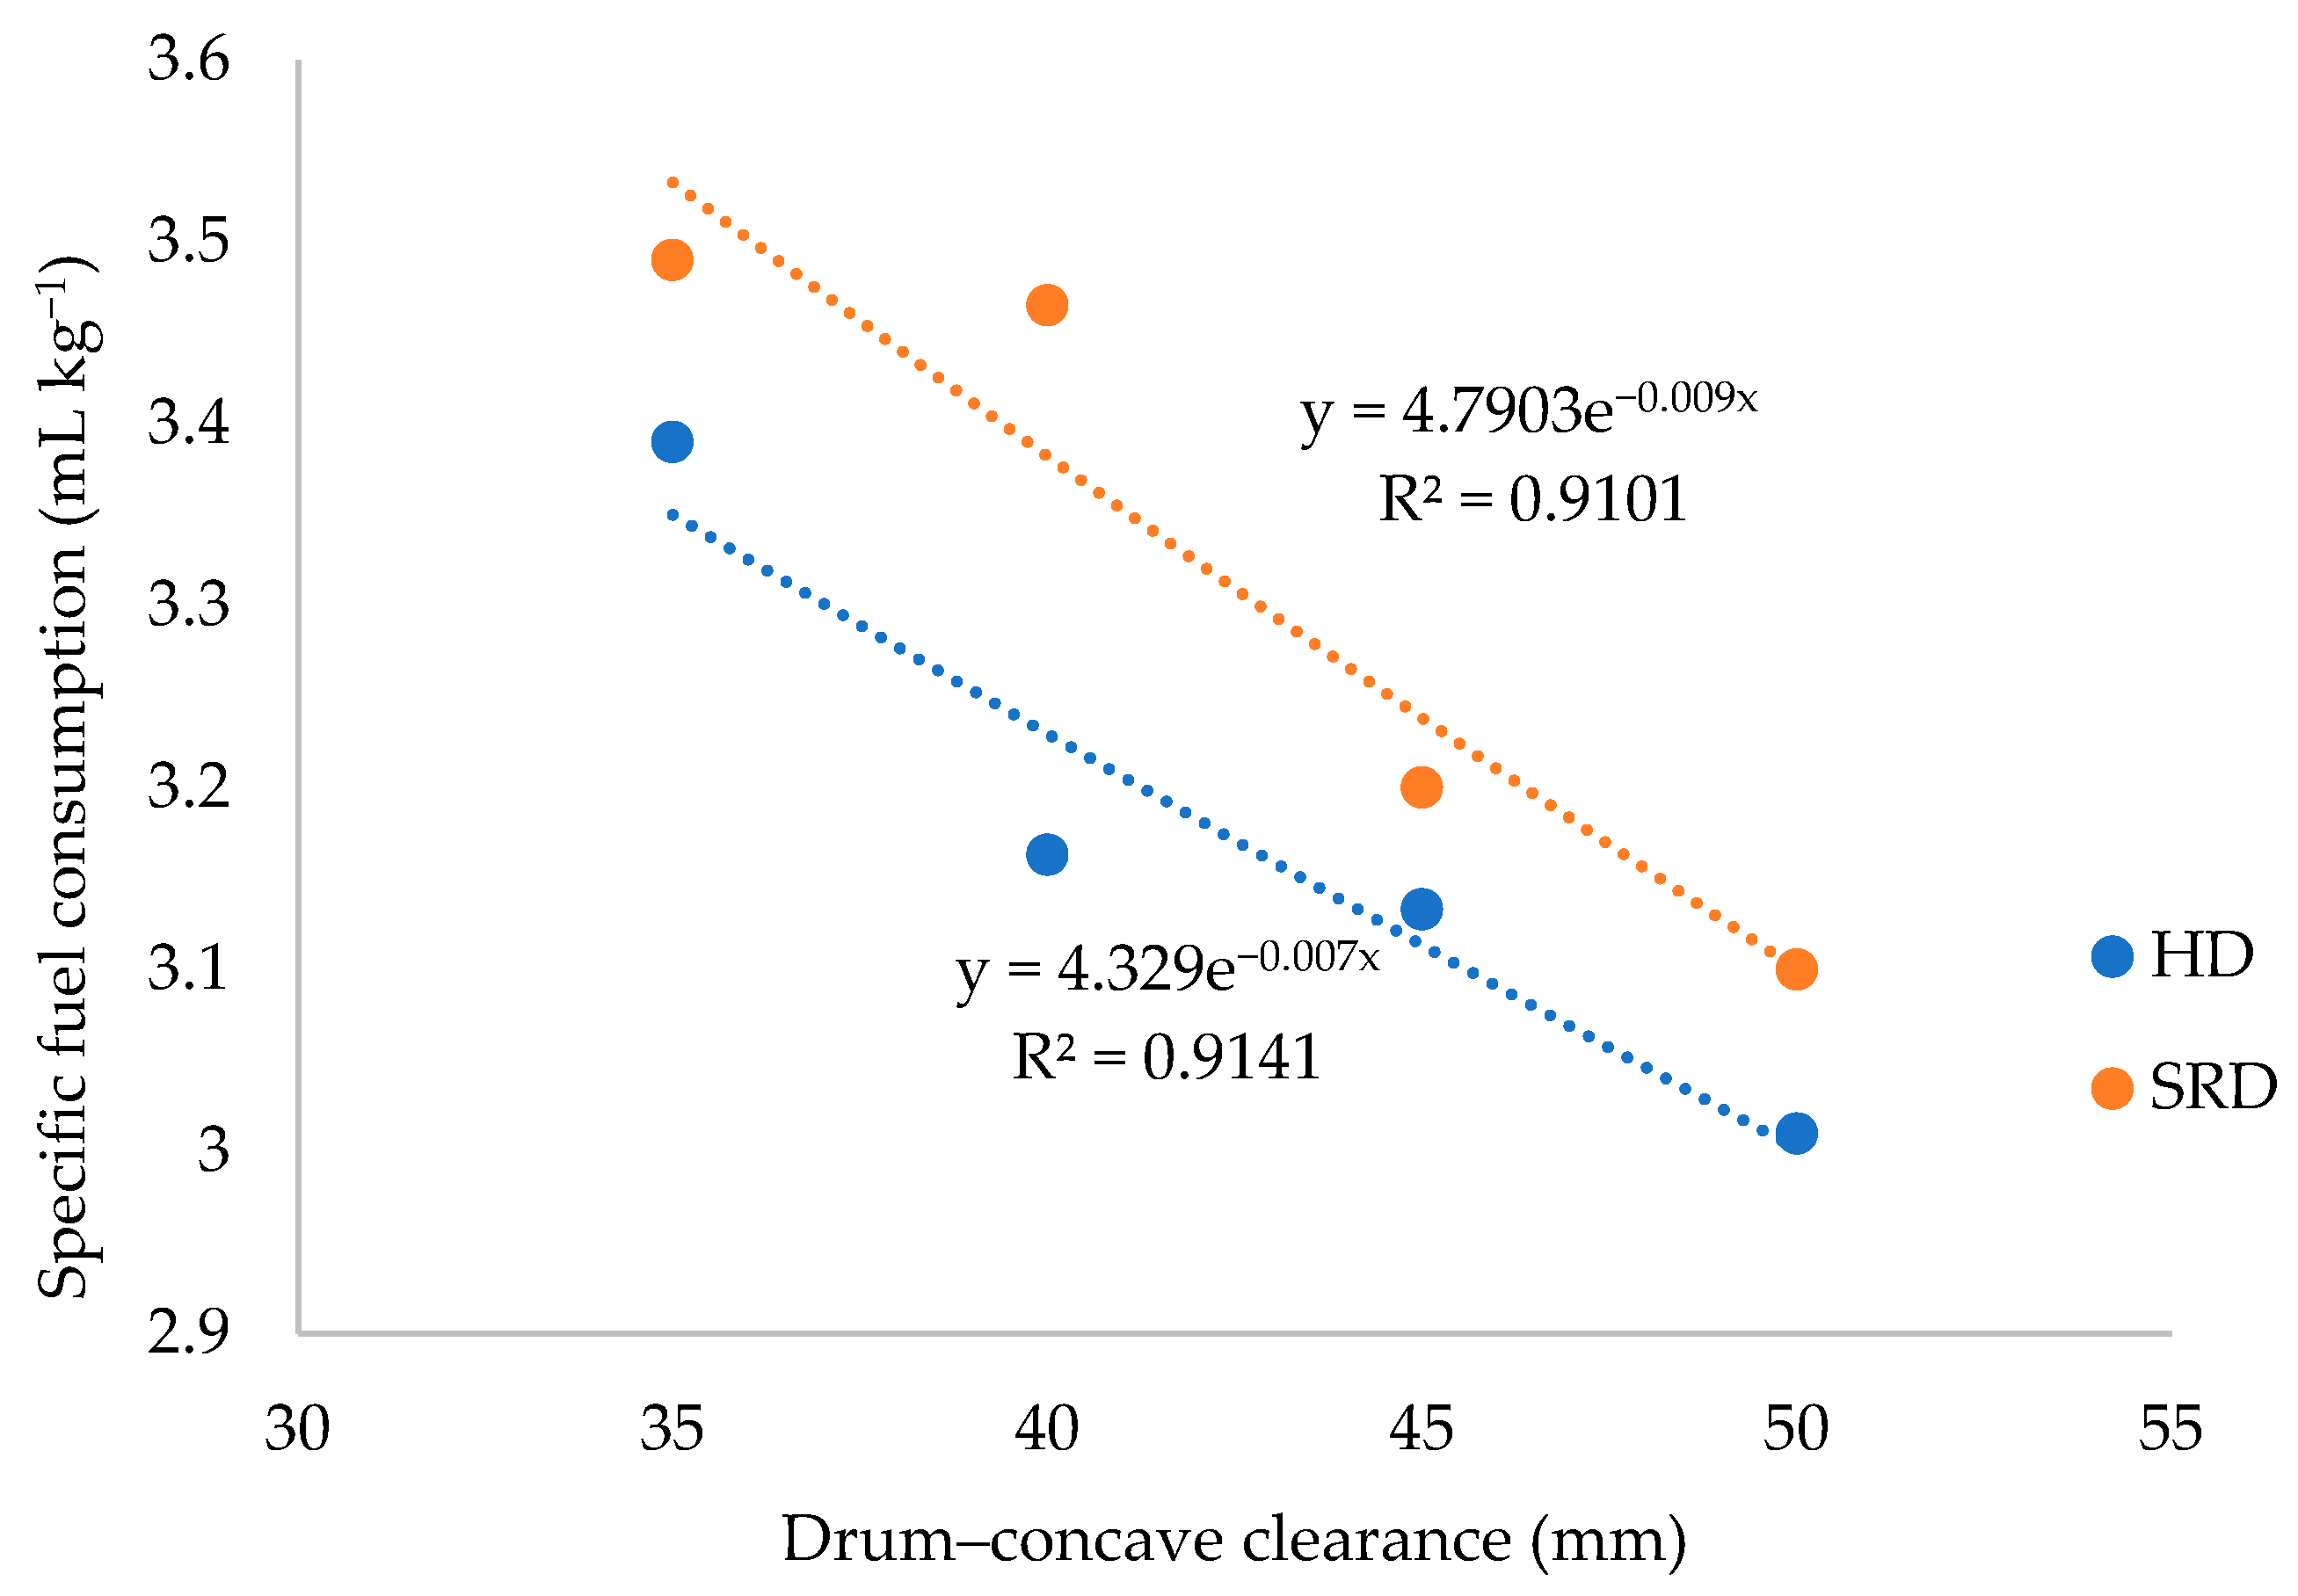
It was also determined that specific fuel consumption decreased with increasing drum–concave clearance (Figure 11). An approximately 43% increase in drum–concave clearance reduced specific fuel consumption by an average of 10.9%. Hourly fuel consumption and threshing capacity increased with increasing drum–concave clearance. However, the higher rate of increase in threshing capacity resulted in a decrease in specific fuel consumption. An exponential relationship was found between drum–concave clearance and specific fuel consumption, and the coefficient of determination of this relationship was obtained as approximately R2 = 0.91 for both drum types.
Figure 11.
Variation in specific fuel consumption depending on drum–concave clearance.
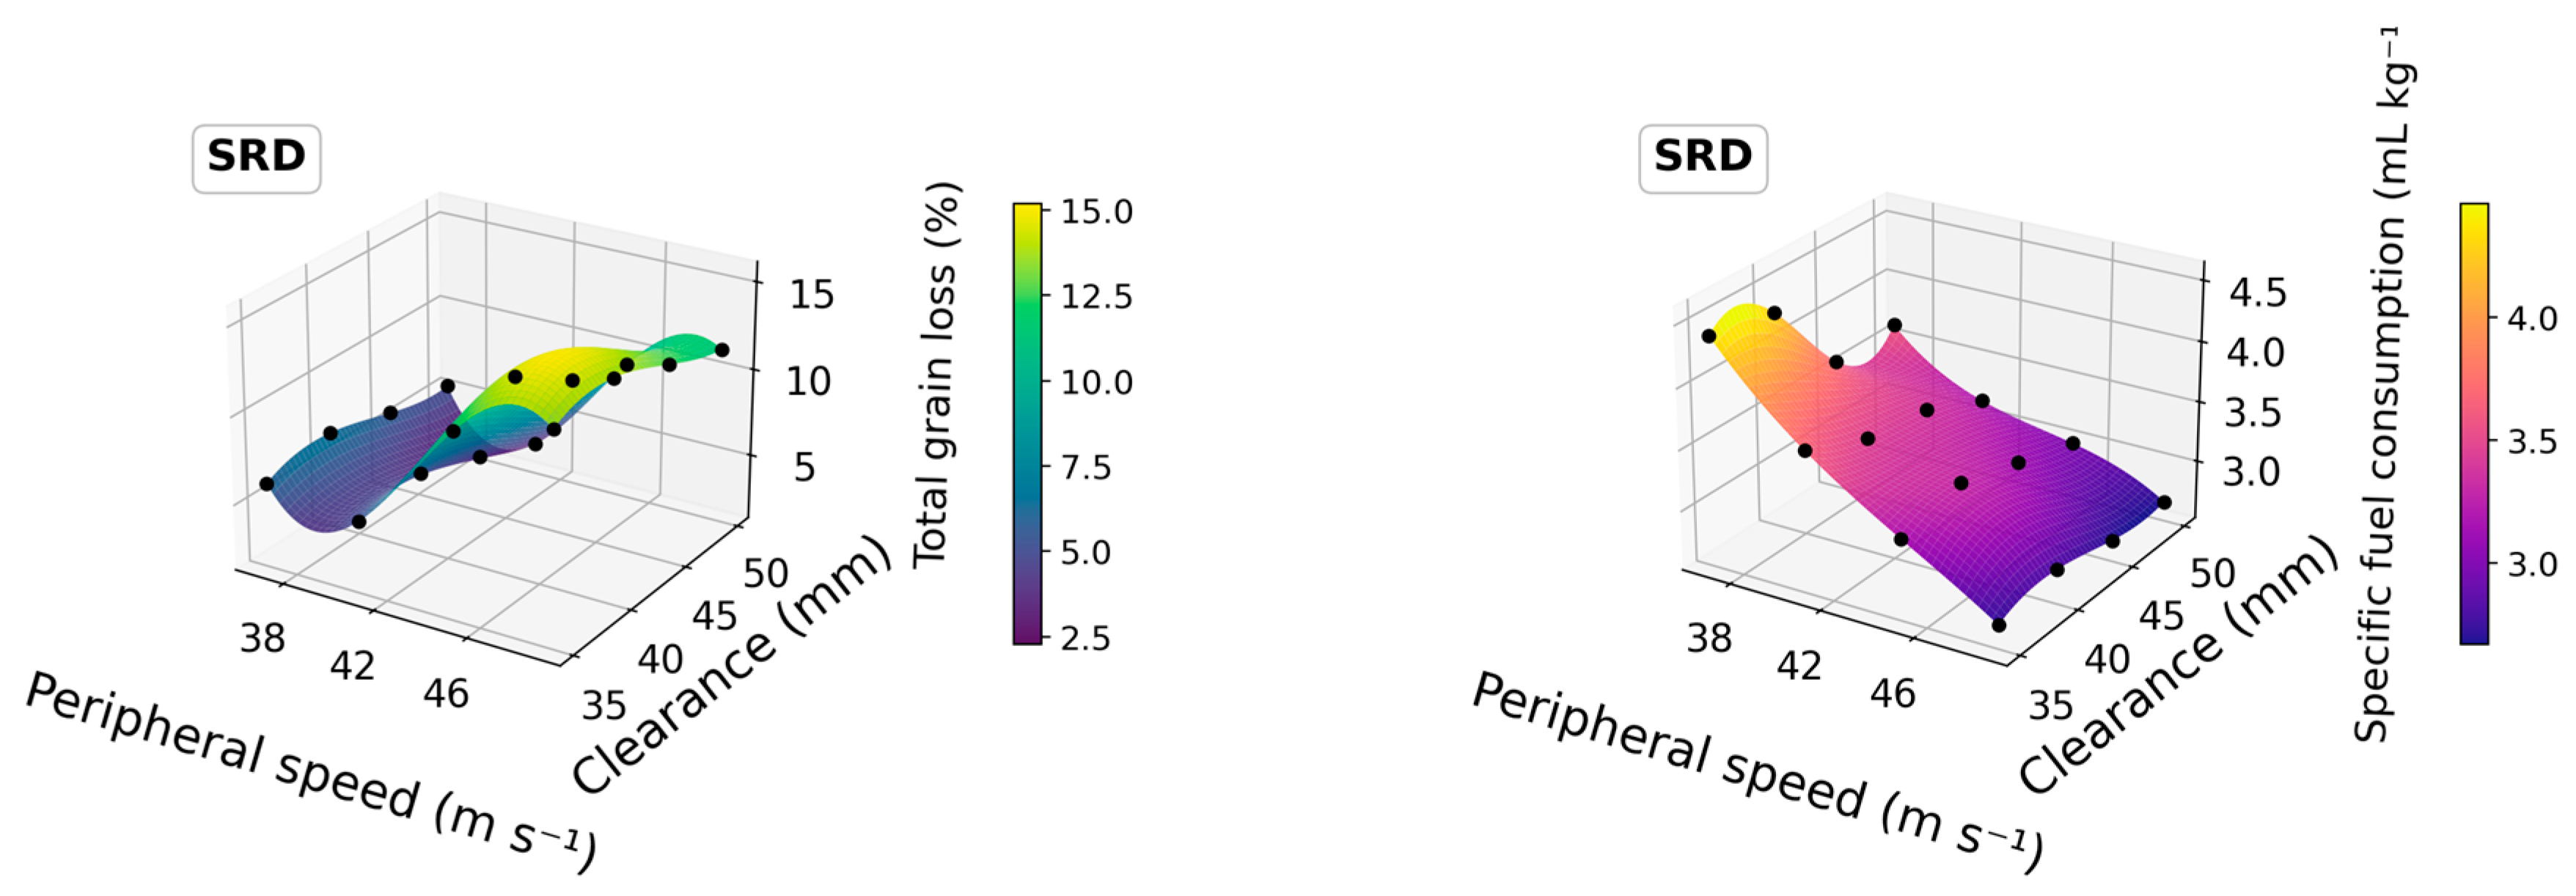
The three-dimensional surface views of the total grain loss and specific fuel consumption measured at different combinations of drum type, peripheral speed and drum–concave clearance are depicted in Figure 12 and Figure 13. The surfaces were obtained by smoothing the measured 4 × 4 grid of values with a cubic spline for visualization, and the black dots represent the actual experimental measurements. For both drum types, the total grain loss surface rises markedly once the peripheral speed exceeds about 44 m s−1, whereas the specific fuel consumption surface decreases with increasing speed and clearance. This opposite trend clearly shows that the two outputs cannot be minimized at the same time and that the problem must be treated as multi-objective. It should be emphasized that these surfaces are smoothed interpolations produced for visualization only; the values between the measured grid points are not independent experimental results and should not be interpreted as such.
Figure 12.
Three-dimensional surface view of total grain loss and specific fuel consumption for the straight row drum (SRD) (black dots: experimental measurements).
Figure 13.
Three-dimensional surface view of total grain loss and specific fuel consumption for the helical drum (HD) (black dots: experimental measurements).
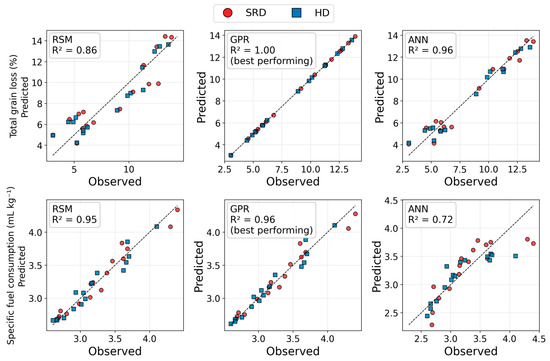
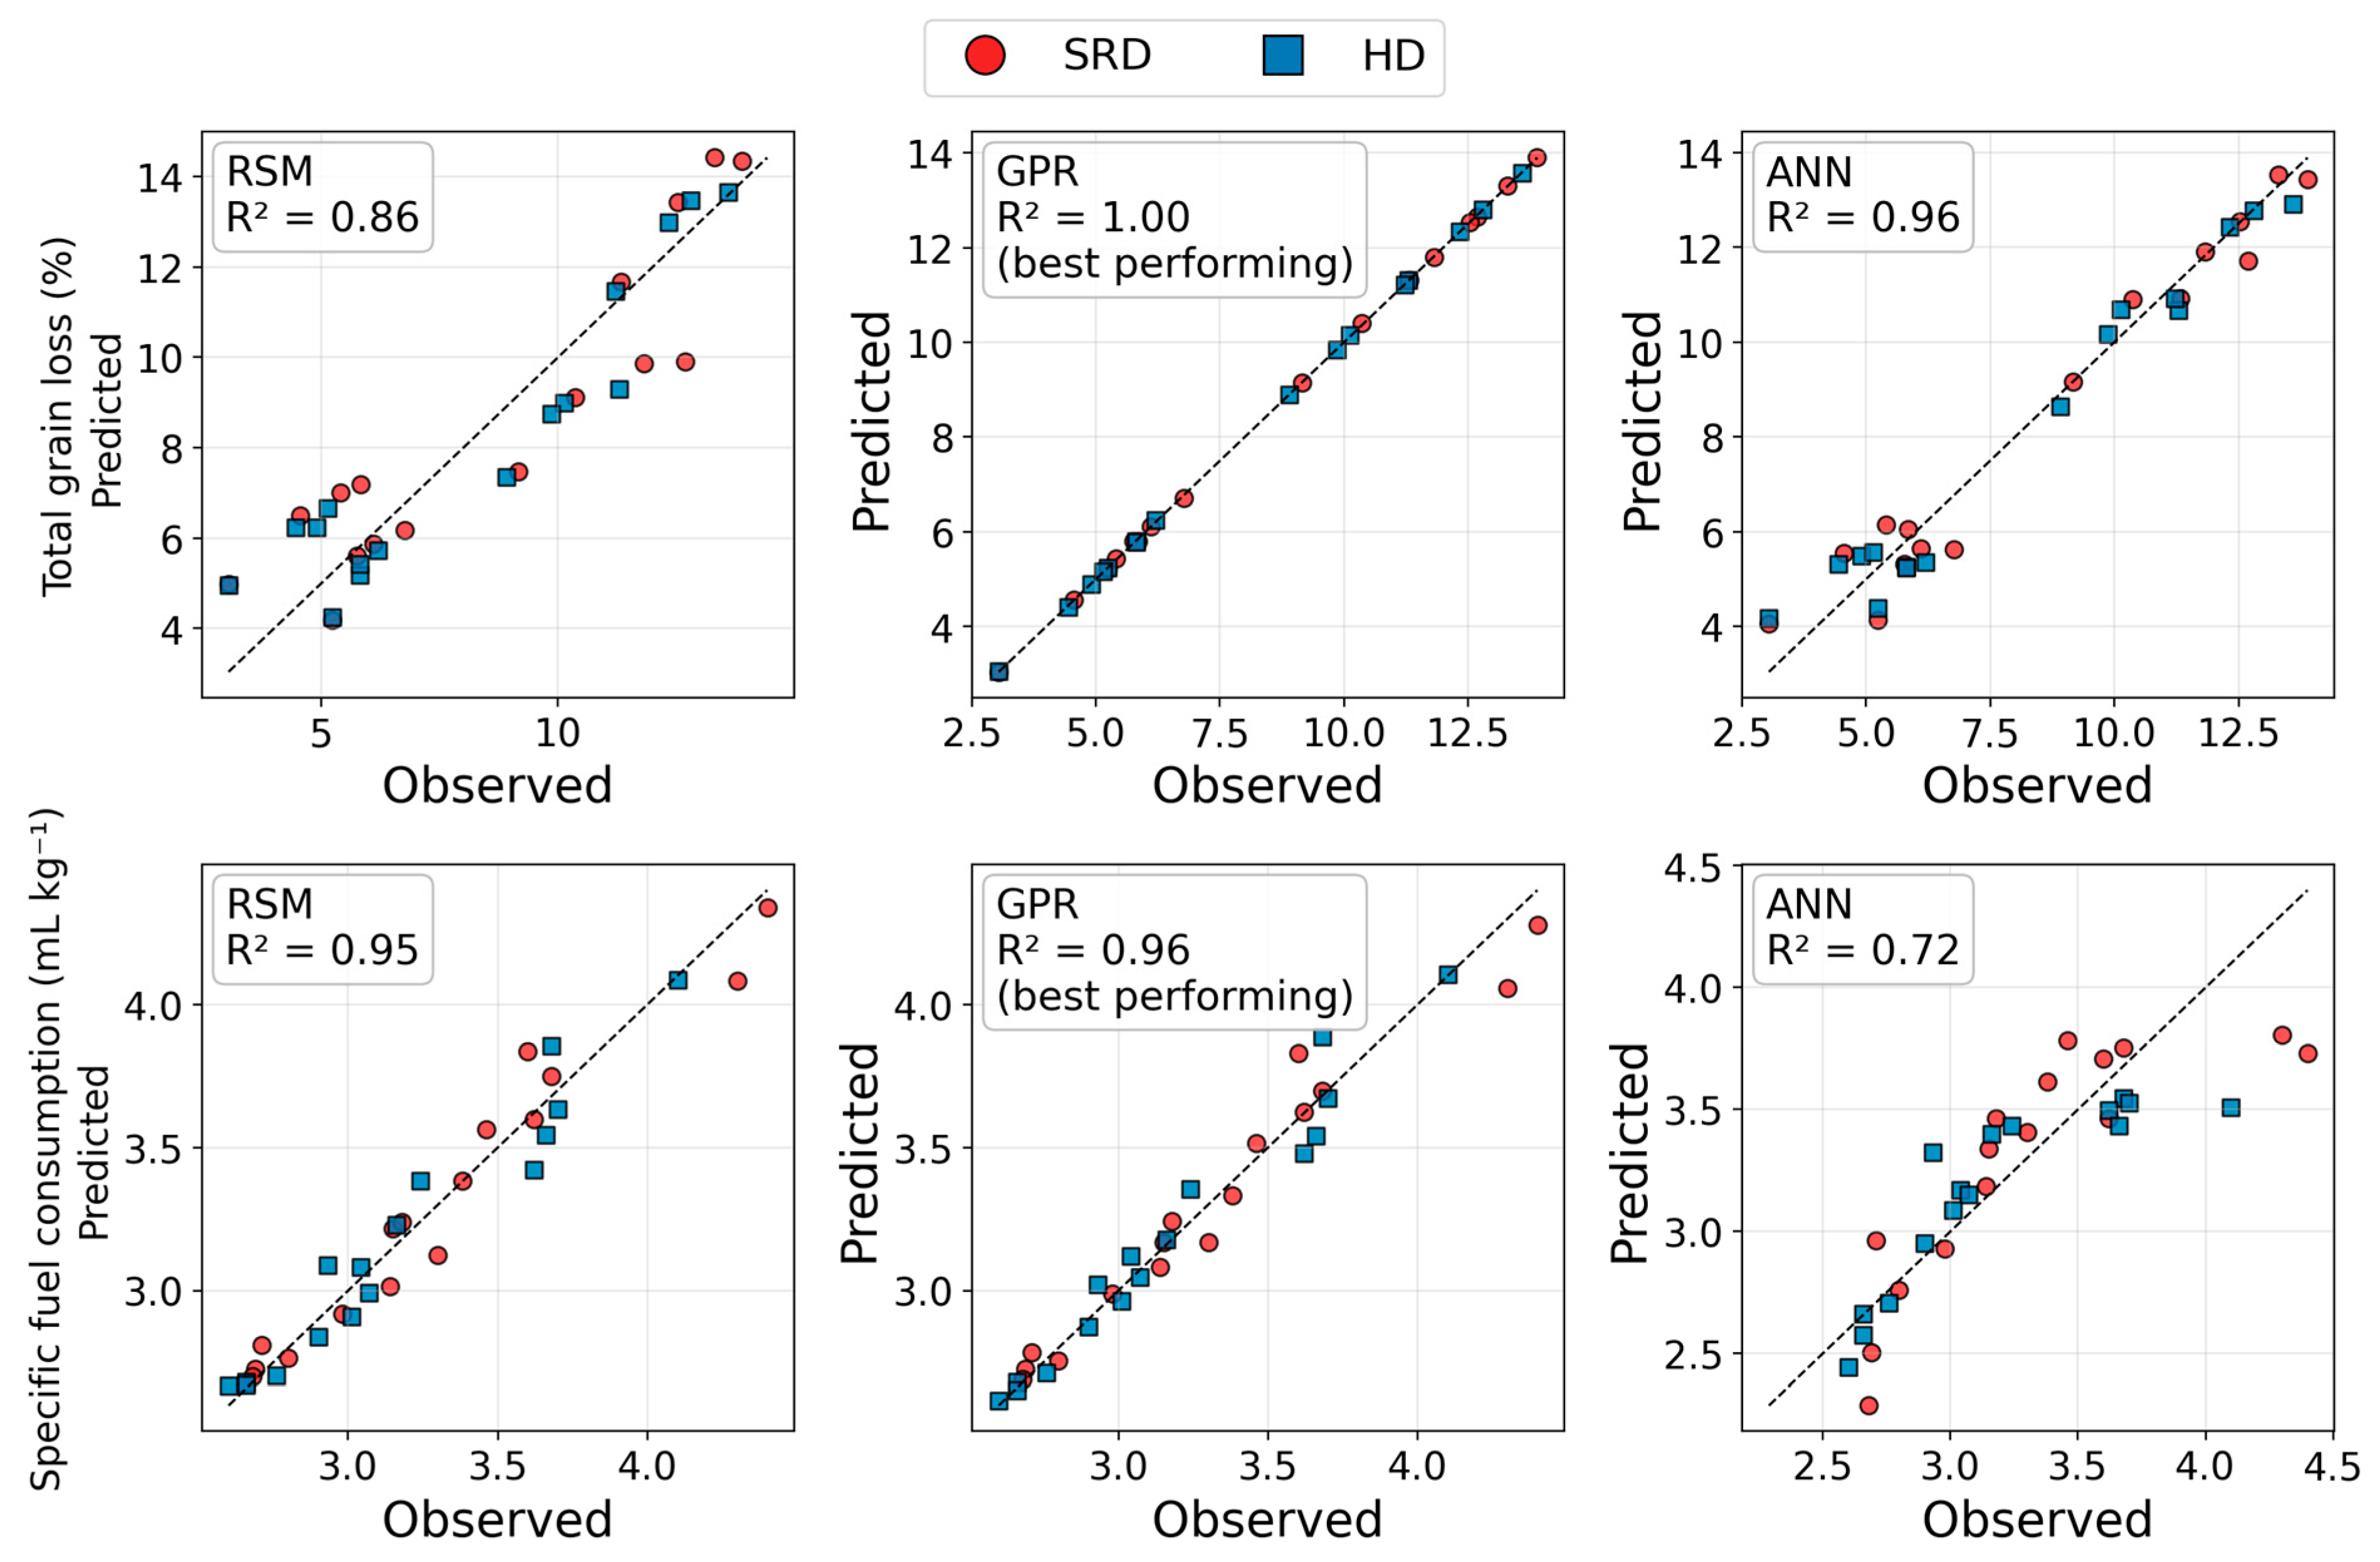
The fit and cross-validation performances of the three surrogate models (RSM, GPR and ANN) built for total loss and specific fuel consumption are given in Table 4, and the predicted-versus-observed comparison in Figure 14. When the predictive performance on unseen (LOO) data is taken as the basis, GPR was found to be the most successful model for both outputs. GPR reached R2 = 0.992 (RMSE = 0.314 percentage points) for total grain loss and R2 = 0.914 (RMSE = 0.140 mL kg−1) for specific fuel consumption.
Table 4.
Fit and cross-validation performances of the surrogate models (★: Best performing model for the corresponding output).
Figure 14.
Predicted-versus-observed comparison of the surrogate models (dashed line: ideal prediction; for each output the best-performing model is labelled in the corresponding panel).
RSM lagged behind in unseen-data performance for total grain loss (R2 = 0.749). The reason is that the threshold-type abrupt increase observed in total loss when the drum peripheral speed exceeds about 44 m s−1 cannot be adequately represented by a second-order (parabolic) surface. ANN, on the other hand, showed acceptable performance for total grain loss (R2 = 0.923) but was clearly weak for specific fuel consumption (R2 = 0.525); this can be attributed to the 32-observation data set being insufficient for the neural network to generalize properly. Similarly, Da et al. [27] reported that an artificial neural network predicted threshing-performance indicators better than linear regression; in this study, however, GPR was found to give more reliable results than both methods on the small data set. The risk of overfitting nevertheless requires explicit attention. GPR reached R2 = 1.000 on the fit data for total grain loss, which by itself is not evidence of predictive skill: a Gaussian process with a very small estimated noise term interpolates the training points almost exactly. For this reason, the fit statistics were never used to select the model. The selection was based solely on data that the model had not seen, and the leave-one-out result (R2 = 0.992, RMSE = 0.314 percentage points) together with the 5-fold result (R2 = 0.976) shows that the accuracy is retained on unseen points and is therefore not merely memorization. With only 32 observations, however, even cross-validated estimates carry appreciable uncertainty, and the reported accuracies should be regarded as optimistic upper bounds rather than as guarantees of performance on an independent data set.
The length scales learned in the best-performing GPR models also confirm the relative importance of the parameters. The drum type was encoded as a binary variable (0 = SRD, 1 = HD) and was included in the anisotropic Matérn kernel as a third input dimension, so that a separate length scale was estimated for it as well. In the total grain loss model, the length scale of the peripheral speed (ℓ = 1.12) is markedly smaller than that of the drum–concave clearance (ℓ = 2.45), while the length scale obtained for the drum type is much larger (ℓ = 14.56). Since a smaller length scale indicates a higher sensitivity of the model to that variable, this ordering shows that peripheral speed is the most influential parameter, followed by clearance, whereas the drum type produces a comparatively smooth, small shift in the response surface rather than a sharp change. The same ordering is obtained in the specific fuel consumption model (ℓ = 3.13 for speed, ℓ = 9.99 for clearance and ℓ = 24.45 for drum type). This is fully consistent with the analysis of variance, in which peripheral speed produced by far the largest F value, and with the fact that the drum type, although statistically significant, changes the mean total grain loss by only about 0.4 percentage points.
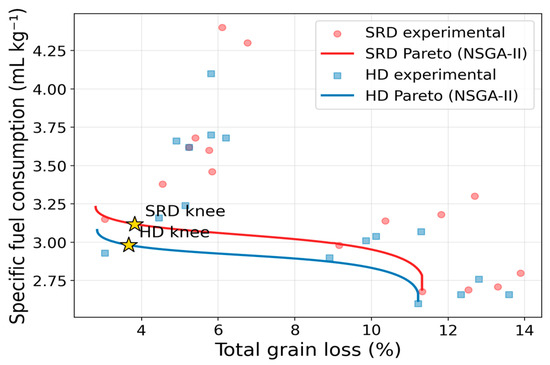
The Pareto fronts obtained for both drum types by the multi-objective optimization carried out with NSGA-II on the best-performing GPR models are given in Figure 15. The fronts clearly reveal the conflict between the two objectives: increasing the peripheral speed to reduce specific fuel consumption causes the total grain loss to rise. The Pareto front of the helical drum (HD) dominated that of the straight row drum (SRD) at almost every point; that is, at the same total grain loss level, HD offers lower specific fuel consumption.
Figure 15.
Pareto fronts obtained with NSGA-II and the knee (trade-off) points (stars).
The optimum operating settings selected on the Pareto fronts using the knee and desirability criteria are given in Table 5. The knee point was obtained at 41.65 m s−1 peripheral speed and 50 mm drum–concave clearance for SRD (predicted total grain loss 3.82%, specific fuel consumption 3.12 mL kg−1), and at 41.54 m s−1 and 50 mm for HD (3.66% and 2.98 mL kg−1). The overall best solution was determined to be operating with the HD at about 41.5 m s−1 peripheral speed and 50 mm drum–concave clearance. In the minimum-total-loss-priority scenario, the maximum desirability was found at 40.73 m s−1 and 50 mm (predicted total grain loss 3.01%).
Table 5.
Optimum operating settings selected on the Pareto front.
Unlike classical methods, GPR also provides a prediction uncertainty (confidence interval) in addition to the point estimate. At the recommended optimum (HD, 41.54 m s−1, 50 mm), the total grain loss was predicted as 3.66 ± 0.70% with a 95% confidence interval (i.e., [2.96, 4.36]) and the specific fuel consumption as 2.98 ± 0.25 mL kg−1 ([2.73, 3.23]). The narrowness of the confidence intervals indicates that the model makes reliable predictions in this operating region.
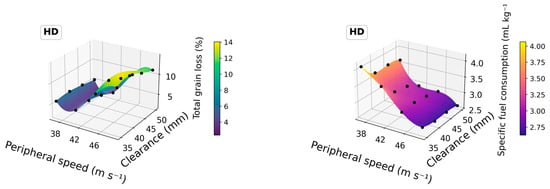
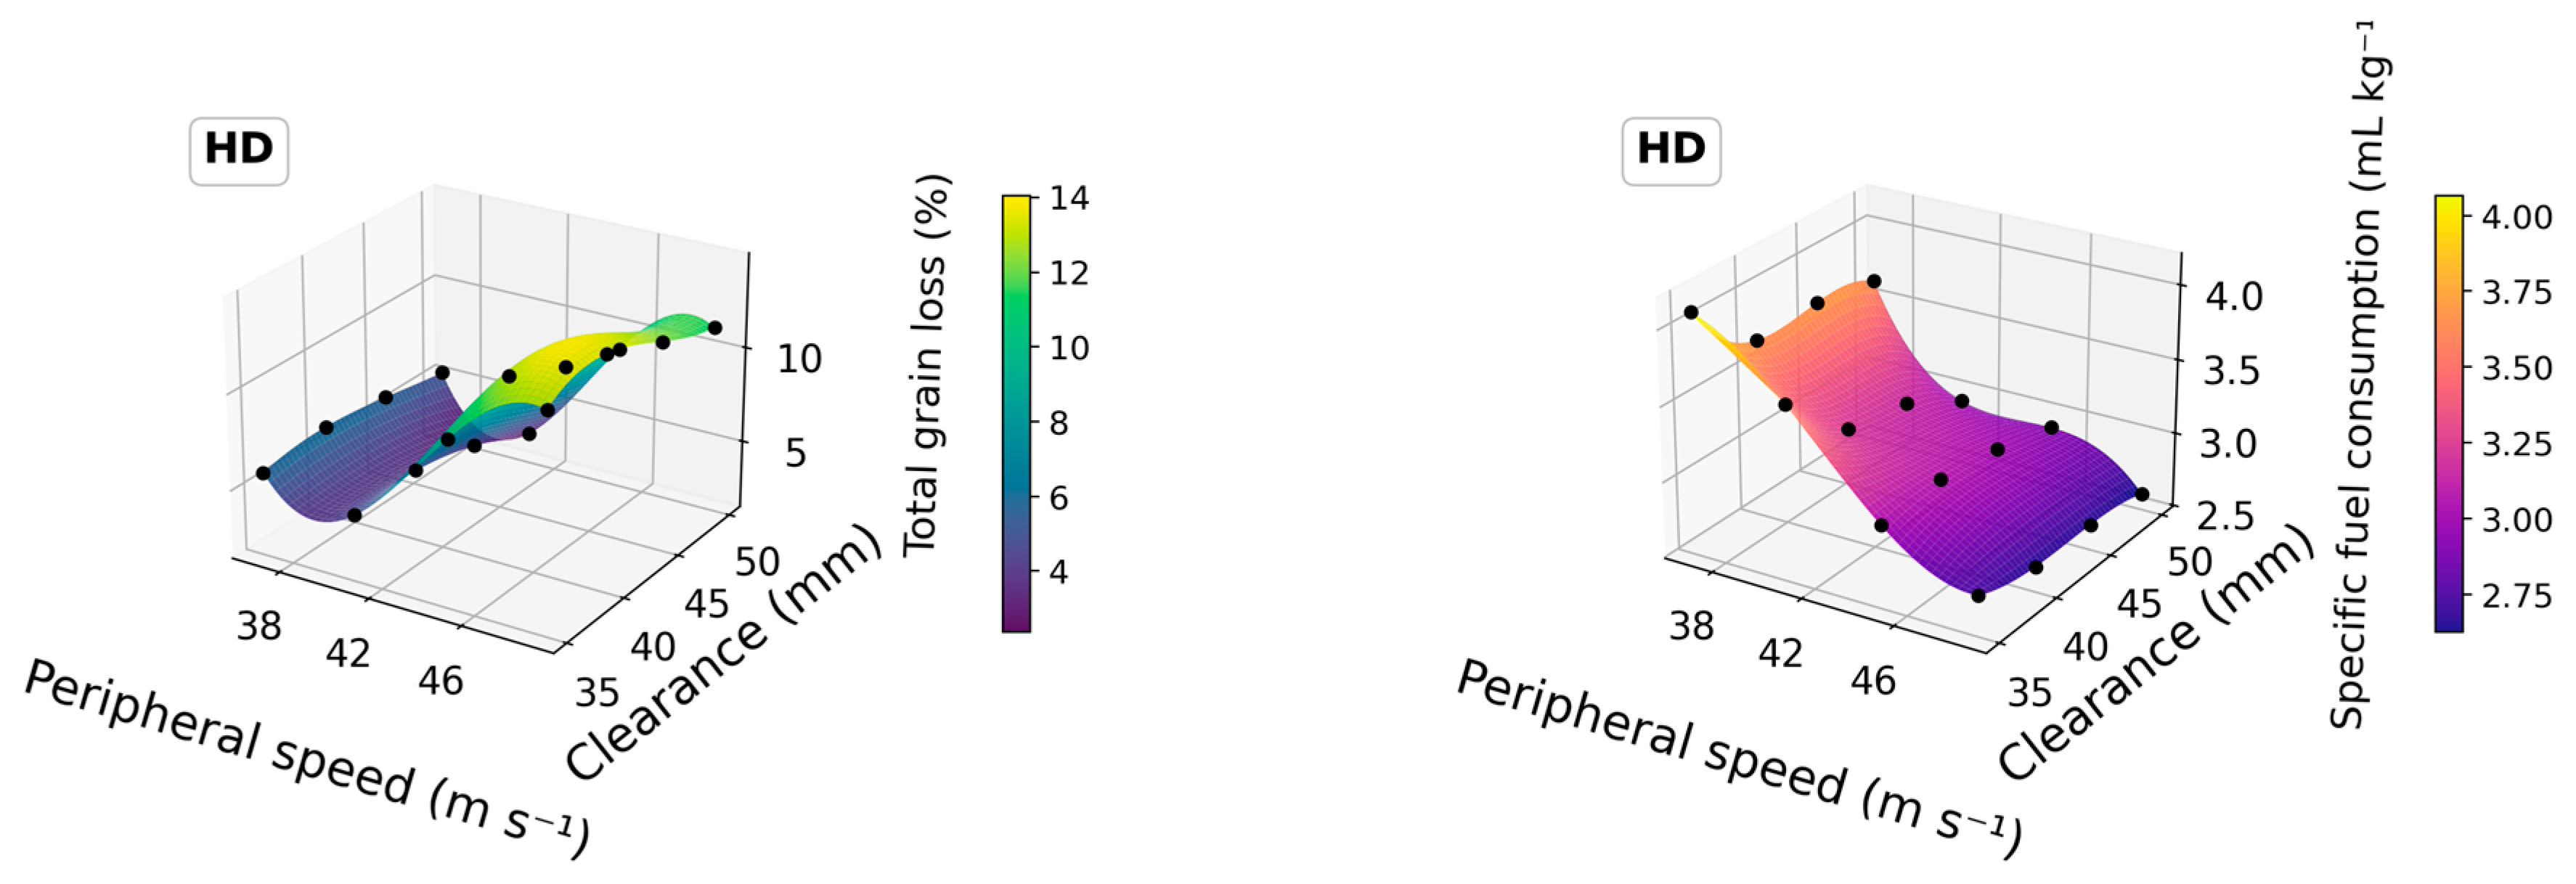
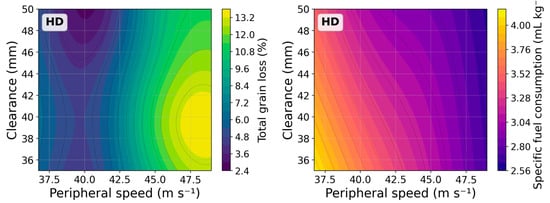
The experimental counterpart of the optimum point also supports this result: the lowest total grain loss in the experiments (3.04%) was measured for the HD at 40.82 m s−1 peripheral speed and 50 mm clearance, where the specific fuel consumption was 2.93 mL kg−1. The region indicated by the optimization coincides with the best experimental point. It must nevertheless be stated explicitly that the reported optimum is a model-based recommendation: no separate confirmation experiment was carried out at the predicted optimum. The agreement between the predicted optimum (HD, 41.54 m s−1, 50 mm; 3.66% and 2.98 mL kg−1) and the closest measured treatment (HD, 40.82 m s−1, 50 mm; 3.04% and 2.93 mL kg−1) constitutes an internal consistency check rather than an independent validation. An independent confirmation experiment at the predicted optimum therefore remains necessary before the recommendation is transferred to practice, and this is stated among the limitations of the study. The response surfaces of the best-performing GPR models (Figure 16) also visualize this region as a combination of low-to-moderate peripheral speed and wide drum–concave clearance.
Figure 16.
Response surfaces of the best performing GPR models (HD).
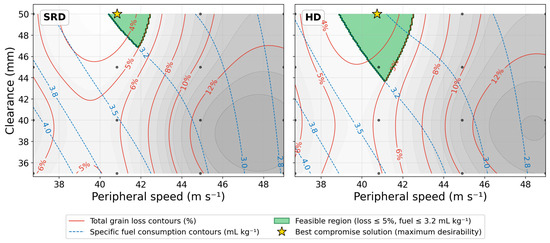
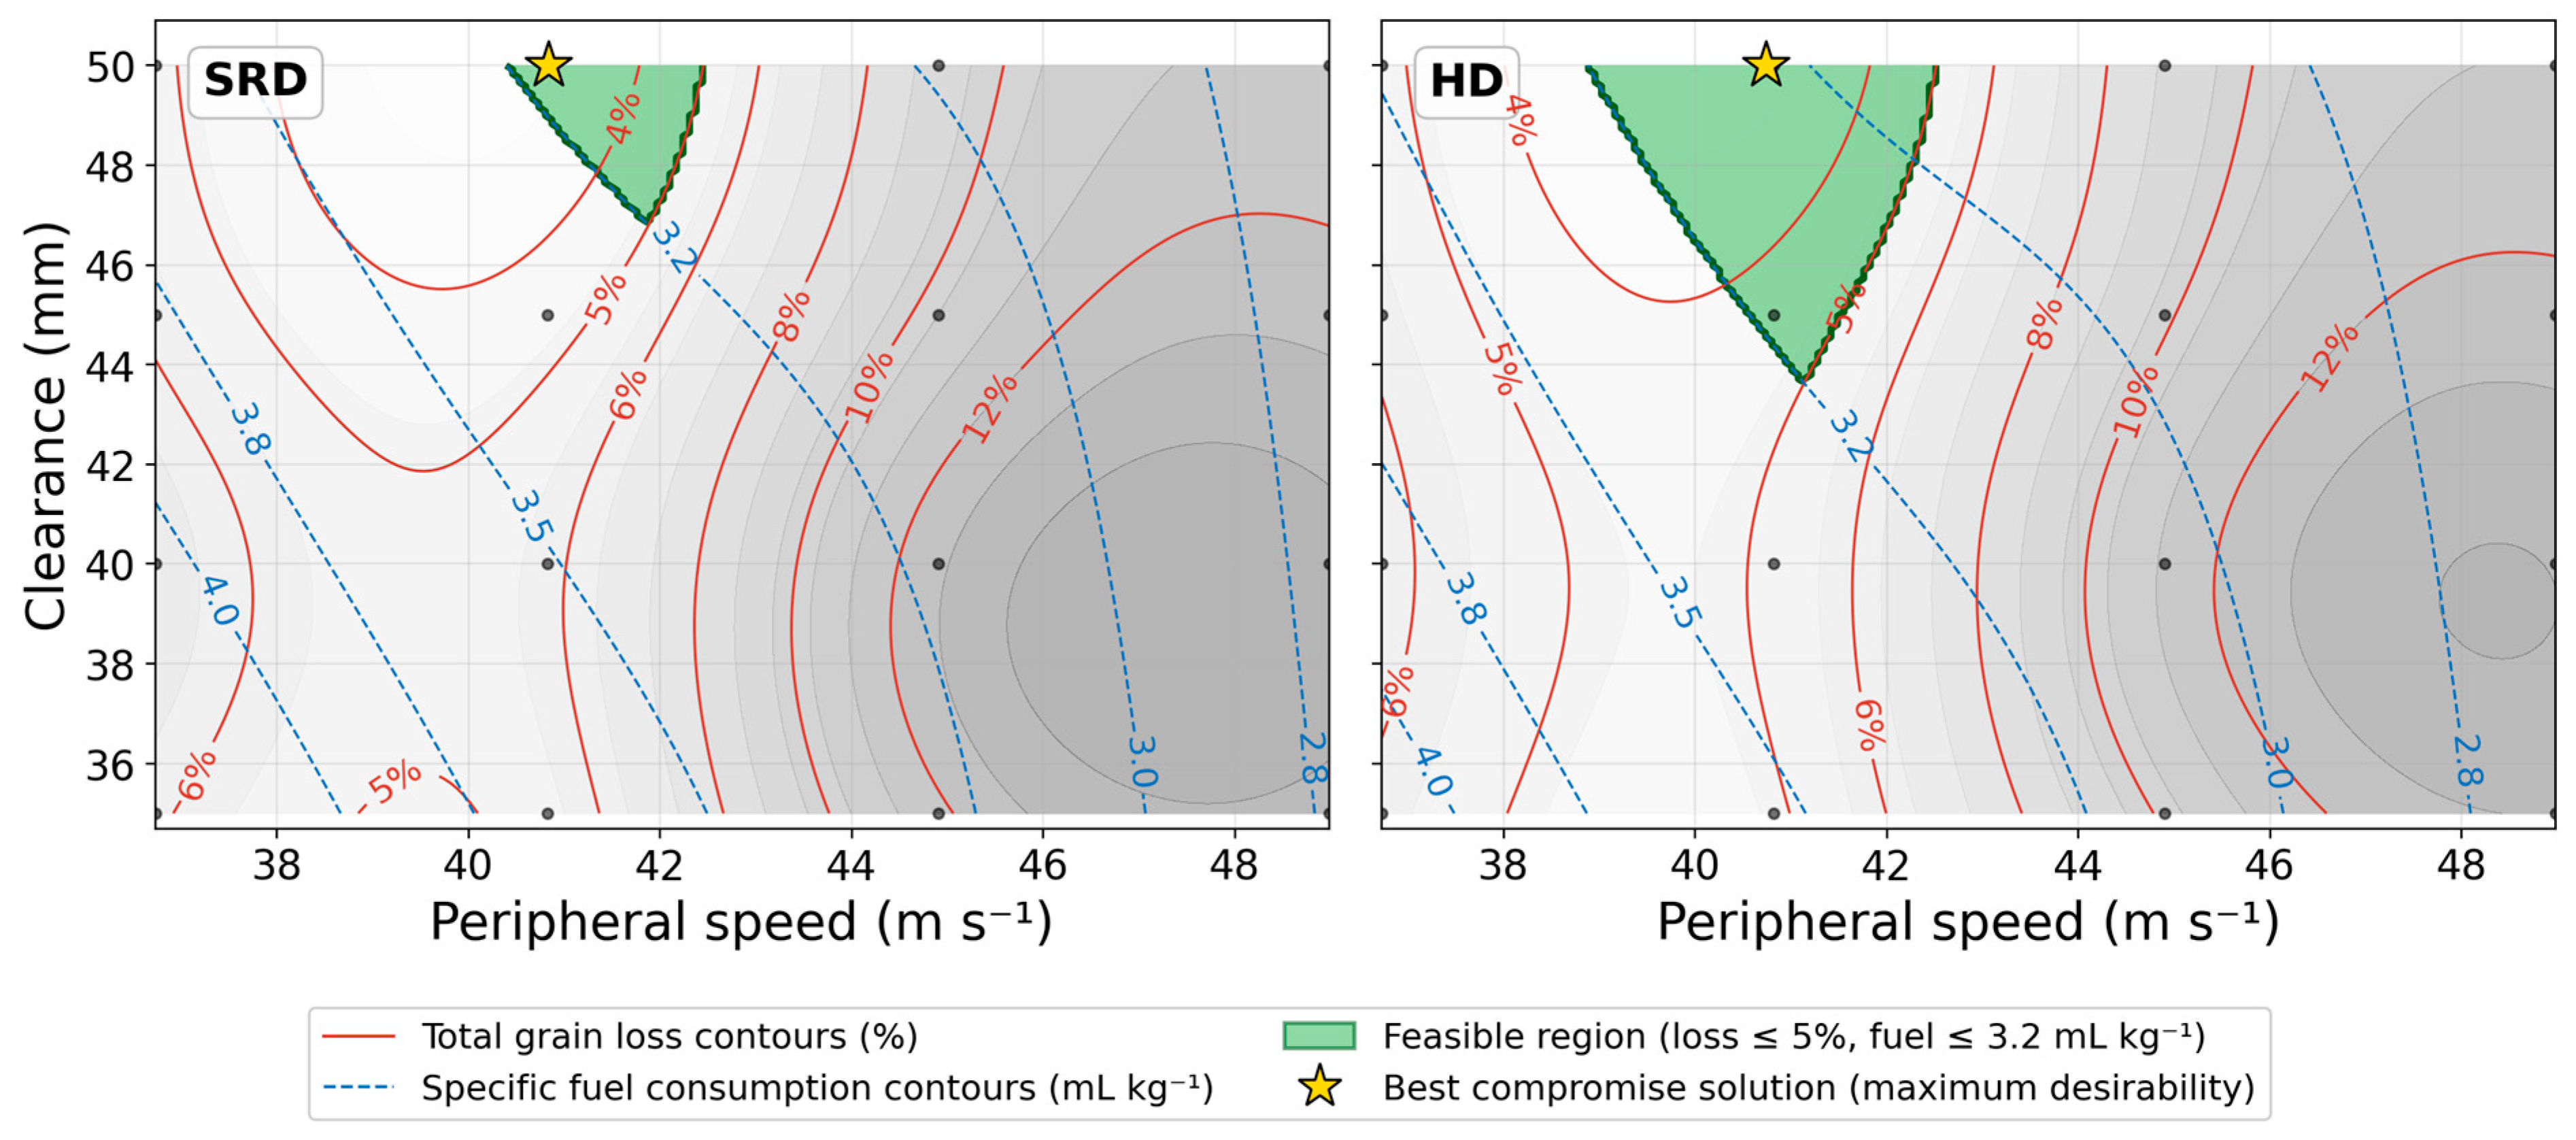
Since it is difficult to hold a single operating point precisely in the field, the feasible region satisfying acceptable limits (total grain loss ≤ 5% and specific fuel consumption ≤ 3.2 mL kg−1) was scanned for both drum types and is given in Figure 17. The feasible region covers only 2% of the parameter space for SRD (within 40.4–42.4 m s−1 peripheral speed and 46.9–50.0 mm drum–concave clearance), while it expands to 7% for HD (within 38.9–42.5 m s−1 and 43.7–50.0 mm) (Table 6). In other words, the helical drum offers an approximately 3.5 times wider safe operating window within the acceptance limits. For both drum types, the feasible region forms in the wide-clearance and moderate-speed zone, and the optimum (knee) points lie within this window.
Figure 17.
Feasible region for SRD and HD, with total grain loss and specific fuel consumption contours overlaid (constraints: total grain loss ≤ 5% and specific fuel consumption ≤ 3.2 mL kg−1; the star marks the best compromise solution of maximum desirability).
Table 6.
Limits of the feasible operating window.
The superiority of GPR over both RSM and ANN in this study demonstrated the strength of kernel-based methods on small, non-linear data sets. The threshold-type increase observed in total loss after about 44 m s−1 is consistent with the physical mechanism by which the probability of grain fracture rises sharply once the impact energy exceeds a certain threshold [12,29]. This is precisely why parabolic RSM cannot represent this sharp transition. The short length scale that GPR learned for the peripheral speed confirms the same mechanism in a data-driven way.
4. Conclusions
In this study, the effects of drum type, peripheral speed and drum–concave clearance on total grain loss and specific fuel consumption of a wheat thresher were investigated, and the machine parameters were optimized in a multi-objective manner.
The helical drum provided both lower losses and lower specific fuel consumption compared to the straight row drum. In both drum types, increased threshing capacity led to a decrease in tractor-specific fuel consumption.
With increasing peripheral speed, total grain loss increased while specific fuel consumption decreased. It was determined that grain loss and specific fuel consumption decreased with increasing drum–concave clearance. In threshing, peripheral speed has a dominant effect on total grain loss and specific fuel consumption.
Among the prediction models, GPR gave the most accurate results in the small dataset compared to both RSM and ANN and especially captured the threshold-type behaviour of total loss. The Pareto front obtained with NSGA-II revealed the conflict between loss and fuel; the best balance was determined for the helical drum at a peripheral speed of approximately 41.5 m s−1 and a drum–concave clearance of 50 mm. Due to its wider safe operating range combined with lower losses and fuel consumption, the helical drum stands out as the preferred design.
The fact that the optimum clearance was found at the experimental upper limit (50 mm) indicates that the 50–60 mm range should also be tested in future studies. Overall, combining a surrogate model with a genetic algorithm offers an effective and feasible approach to determining machine settings that reduce threshing losses and energy consumption.
Several limitations should be borne in mind when these results are generalized. The experiments were carried out with a single bread wheat cultivar (Selçuklu), at a single and low grain moisture content (7.3%) and on one locally manufactured stationary threshing machine, so the absolute values reported here cannot be transferred directly to other varieties, moisture levels or machine designs. Each treatment combination was run once, the five samples taken per run being sub-samples rather than independent replications, so the analysis of variance rests on a pooled error term. The data set comprises 32 observations, which is small for machine-learning-based modelling; the cross-validated accuracies should therefore be interpreted as optimistic upper bounds rather than as guaranteed performance on independent data. Finally, the optimum operating point reported here was predicted by the surrogate model and agrees closely with the closest measured treatment, but it was not verified by an independent confirmation experiment. A dedicated validation trial at the predicted optimum, extension of the clearance range to 50–60 mm, and repetition of the experiments at higher grain moisture contents are recommended as the next steps.
Author Contributions
Conceptualization, K.Ç., E.Ç., H.Ö., N.U. and N.-V.V.; methodology, K.Ç., E.Ç. and H.Ö.; software, H.Ö., N.U. and N.-V.V.; validation, K.Ç., E.Ç., H.Ö.; formal analysis, K.Ç., E.Ç., H.Ö. and N.U.; investigation, K.Ç., E.Ç. and H.Ö.; resources, K.Ç., E.Ç. and H.Ö.; data curation, E.Ç., N.U. and N.-V.V.; writing—original draft preparation, K.Ç., E.Ç., H.Ö., N.U. and N.-V.V.; writing—review and editing, E.Ç. and N.U.; visualization, K.Ç., E.Ç., H.Ö., N.U. and N.-V.V.; supervision, K.Ç., E.Ç., and N.U.; project administration, K.Ç. E.Ç. and N.-V.V.; funding acquisition, N.U. and N.-V.V. All authors have read and agreed to the published version of the manuscript.
Funding
The APC was funded by the National University of Science and Technology Politehnica Bucharest, Romania, within the PubArt Program.
Institutional Review Board Statement
Not applicable.
Informed Consent Statement
Not applicable.
Data Availability Statement
The original contributions presented in this study are included in the article. Further inquiries can be directed to the corresponding authors.
Conflicts of Interest
The authors declare no conflicts of interest.
References
- Food and Agriculture Organization of the United Nations (FAO). Food Outlook—Biannual Report on Global Food Markets, June 2024; FAO: Rome, Italy, 2024; Available online: https://openknowledge.fao.org/server/api/core/bitstreams/3b08b8c9-b009-4ec5-b26e-aa0c3733c97b/content (accessed on 13 June 2026).
- USDA Foreign Agricultural Service. World Agricultural Production; Circular Series WAP 06-26; United States Department of Agriculture: Washington, DC, USA, 2026. Available online: https://www.fas.usda.gov/data/world-agricultural-production-05122026 (accessed on 13 June 2026).
- Türkiye Statistical Institute (TÜİK). MEDAS (Central Dissemination System) Database. 2025. Available online: https://biruni.tuik.gov.tr/medas/?kn=92&locale=tr (accessed on 13 June 2026).
- Li, Z.; Thomas, C. Quantitative Evaluation of Mechanical Damage to Fresh Fruits. Trends Food Sci. Technol. 2014, 35, 138–150. [Google Scholar] [CrossRef] [Scilit]
- Bucklin, R.; Thompson, S.; Montross, M.; Abdel-Hadi, A. Grain Storage Systems Design. In Handbook of Farm, Dairy and Food Machinery Engineering; Academic Press: Cambridge, MA, USA, 2013; pp. 123–175. [Google Scholar]
- Kroupa, P. The Outer Quality Loss during Grain Post-Harvest Treatment and Handling. Res. Agric. Eng. 2003, 49, 91–102. [Google Scholar] [CrossRef] [Scilit]
- Yasothai, R. Factors Affecting Grain Quality: A Review. Int. J. Curr. Microbiol. Appl. Sci. 2020, 9, 205–210. [Google Scholar] [CrossRef] [Scilit]
- Abdeen, M.A.; Salem, A.E.; Zhang, G. Longitudinal Axial Flow Rice Thresher Performance Optimization Using the Taguchi Technique. Agriculture 2021, 11, 88. [Google Scholar] [CrossRef] [Scilit]
- Su, Z.; Ding, Z.; Tian, L.; Lin, X.; Wang, Z. Design and Performance Test of Variable-Diameter Threshing Drum of Combine Harvester. Food Sci. Nutr. 2021, 9, 4322–4334. [Google Scholar] [CrossRef] [Scilit] [PubMed]
- Zhou, X.; Wang, Z.; Tian, L.; Su, Z.; Ding, Z. Innovative Design and Performance Test of Threshing-Separating Device for Horizontal Axial-Flow Combine Harvester. INMATEH Agric. Eng. 2022, 67, 497–508. [Google Scholar] [CrossRef] [Scilit]
- Looh, G.A.; Xie, F.; Wang, X.; Looh, A.N.; Hind, H. Grain Kernel Damage during Threshing: A Comprehensive Review of Theories and Models. J. Agric. Eng. 2025, 56, 1674. [Google Scholar] [CrossRef] [Scilit]
- Vogel, L.; Peukert, W. Breakage Behaviour of Different Materials—Construction of a Mastercurve for the Breakage Probability. Powder Technol. 2003, 129, 101–110. [Google Scholar] [CrossRef] [Scilit]
- Vlăduț, V.; Popa, L.; Biriș, S.; Bungescu, S.; Danciu, A. Contributions to Modeling the Threshing and Separating Process within a Threshing Apparatus with Axial Flow. UPB Sci. Bull. Ser. D 2009, 71, 105–118. Available online: https://www.scientificbulletin.upb.ro/static/pdfs/full1625.pdf (accessed on 13 March 2026).
- Olaoye, J.O.; Oni, K.C.; Olaoye, M.M. Computer Applications for Selecting Operating Parameters of Stationary Grain Crop Thresher. Int. J. Agric. Biol. Eng. 2010, 3, 8–18. [Google Scholar] [CrossRef]
- Xu, L.Z.; Li, Y.M.; Ma, Z.; Zhao, Z.; Wang, C.H. Theoretical Analysis and Finite Element Simulation of a Rice Kernel Obliquely Impacted by a Threshing Tooth. Biosyst. Eng. 2013, 114, 146–156. [Google Scholar] [CrossRef] [Scilit]
- Liang, Z.; Li, Y.; Xu, L.; Zhao, Z.; Tang, Z. Optimum Design of an Array Structure for the Grain Loss Sensor to Upgrade Its Resolution for Harvesting Rice in a Combine Harvester. Biosyst. Eng. 2017, 157, 24–34. [Google Scholar] [CrossRef] [Scilit]
- Fu, J.; Chen, Z.; Han, L.; Ren, L. Review of Grain Threshing Theory and Technology. Int. J. Agric. Biol. Eng. 2018, 11, 12–20. [Google Scholar] [CrossRef] [Scilit]
- Kalkan, F.; Kara, M.; Baştaban, S.; Turgut, N. Strength and Frictional Properties of Popcorn Kernel as Affected by Moisture Content. Int. J. Food Prop. 2011, 14, 1197–1207. [Google Scholar] [CrossRef] [Scilit]
- Ahmad, S.A.; Iqbal, M.; Ahmad, M.; Tanveer, A.; Sial, J.K. Design Improvement of Indigenous Beater Wheat Thresher in Pakistan. Pak. J. Agric. Sci. 2013, 50, 711–721. Available online: https://api.pakjas.com.pk/downloadPaper/2229.pdf (accessed on 13 March 2026).
- Mesquita, C.; Hanna, M.; Costa, N.; França, N. Soya Bean Threshing by Nylon Cords on Rotating Shafts. J. Agric. Eng. Res. 2000, 77, 297–301. [Google Scholar] [CrossRef] [Scilit]
- Sudajan, S.; Salokhe, V.M.; Chusilp, S. Effect of Concave Hole Size, Concave Clearance and Drum Speed on Rasp-Bar Drum Performance for Threshing Sunflower. Agric. Mech. Asia Afr. Lat. Am. 2005, 36, 52–60. Available online: https://www.researchgate.net/publication/283647017_Effect_of_concave_hole_size_concave_clearance_and_drum_speed_on_rasp-bar_drum_performance_for_threshing_sunflower (accessed on 13 March 2026).
- Vlăduț, N.V.; Ungureanu, N.; Biriș, S.Ș.; Voicea, I.; Nenciu, F.; Găgeanu, I.; Cujbescu, D.; Popa, L.D.; Boruz, S.; Matei, G.; et al. Research on the Identification of Some Optimal Threshing and Separation Regimes in the Axial Flow Apparatus. Agriculture 2023, 13, 838. [Google Scholar] [CrossRef] [Scilit]
- Vlăduț, N.V.; Biriș, S.Ș.; Cârdei, P.; Găgeanu, I.; Cujbescu, D.; Ungureanu, N.; Popa, L.D.; Perișoară, L.; Matei, G.; Țeliban, G.C. Contributions to the Mathematical Modeling of the Threshing and Separation Process in an Axial Flow Combine. Agriculture 2022, 12, 1520. [Google Scholar] [CrossRef] [Scilit]
- Chaturvedi, S.; Rathore, F.; Pandey, S. Performance Evaluation of Developed Thresher Cylinder on Millet Crop. Int. J. Curr. Microbiol. Appl. Sci. 2019, 8, 102–106. [Google Scholar] [CrossRef] [Scilit]
- El-Haddad, W.Z. A Simplified Design and Performance Study of Threshing and Winnowing Machine Suitable for Small Holdings. Master’s Thesis, Tanta University, Tanta, Egypt, 2000. [Google Scholar]
- Emara, Z.M.I. Modification of the Threshing Drum of a Stationary Thresher to Suit Separating Flax Crop. Misr J. Agric. Eng. 2006, 23, 324–345. Available online: https://www.researchgate.net/publication/331788808_MODIFICATION_OF_THE_THRESHING_DRUM_OF_A_STATIONARY_THRESHER_TO_SUIT_SEPARATING_FLAX_CROP#fullTextFileContent (accessed on 24 April 2026).
- Da, Q.; Li, D.; Zhang, X.; Guo, W.; He, D.; Huang, Y.; He, G. Research on Performance Evaluation Method of Rice Thresher Based on Neural Network. Actuators 2022, 11, 257. [Google Scholar] [CrossRef] [Scilit]
- Chen, M.Z.; Xu, G.F.; Wang, C.X.; Diao, P.S.; Zhang, Y.P.; Niu, G.D. Design and Test of Longitudinal Axial Flow Roller Combined Corn Flexible Threshing and Separation Device. Trans. Chin. Soc. Agric. Mach. 2020, 51, 123–131. [Google Scholar] [CrossRef]
- Dobrzański, B.; Stępniewski, A. Physical Properties of Seeds in Technological Processes. In Advances in Agrophysical Research; InTech: London, UK, 2013; Available online: https://www.intechopen.com/chapters/45150 (accessed on 13 March 2026).
- Khazaei, J. Influence of Impact Velocity and Moisture Content on Mechanical Damages of White Kidney Beans under Loadings. Cercet. Agron. Mold. 2009, 1, 5–18. Available online: https://repository.iuls.ro/items/6ec380cb-ab6a-4a32-9810-2c53010d51eb (accessed on 13 March 2026).
- Li, Y.; Su, Z.; Liang, Z.; Li, Y. Variable-Diameter Drum with Concentric Threshing Gap and Performance Comparison Experiment. Appl. Sci. 2020, 10, 5386. [Google Scholar] [CrossRef] [Scilit]
- Demirel, İ.; Sessiz, A. Effects of Harvest-Threshing Methods Used in Lentil Harvesting on Fuel Consumption, Grain Losses and Machine Field Capacity. J. Agric. Sci. 2023, 7, 670–680. [Google Scholar] [CrossRef]
- Abdeen, M.A.; Wu, W.; Salem, A.; Elbeltagi, A.; Salem, A.; Metwally, K.A.; Zhang, G.; Elwakeel, A.E. The Impact of Threshing Unit Structure and Parameters on Enhancing Rice Threshing Performance. Sci. Rep. 2025, 15, 6250. [Google Scholar] [CrossRef] [Scilit] [PubMed]

Disclaimer/Publisher’s Note: The statements, opinions and data contained in all publications are solely those of the individual author(s) and contributor(s) and not of MDPI and/or the editor(s). MDPI and/or the editor(s) disclaim responsibility for any injury to people or property resulting from any ideas, methods, instructions or products referred to in the content. |
© 2026 by the authors. Licensee MDPI, Basel, Switzerland. This article is an open access article distributed under the terms and conditions of the Creative Commons Attribution (CC BY) license.