


Abstract
The North China Plain (NCP) serves as a core grain production base and one of the most water-scarce regions in China. Under global warming and intensified human activities (irrigation, groundwater exploitation, and returning farmland to forests and grasslands), soil drought has become a critical constraint on regional agricultural sustainability. This study systematically explored temporal trends, spatial disparities, and abrupt changes of soil drought using remote sensing-based soil moisture dataset. Adopting gridded Modified Mann–Kendall test, wavelet coherence analysis and SHapley Additive exPlanations (SHAP), this paper quantitatively revealed multi-scale driving mechanisms and teleconnection responses of soil drought. Drought in 2002 followed a unimodal pattern with continuous expansion from May to October. The drought-affected area peaked at 77.6% in September. Regional soil moisture increased significantly during 1982–2024, accompanied by sustained drought alleviation. Breaks for Additive Seasons and Trend (BFAST) detection verified a regional abrupt change in 2003. Drought deteriorated before 2003 and obviously relieved afterwards. Wavelet analysis indicated that precipitation dominated drought evolution. This study clarifies the evolutionary trend of drought transition from intensification to alleviation across the NCP, providing scientific evidence for the optimal allocation of water resources, regulation of farmland irrigation, and development of agricultural drought resistance.
1. Introduction
Drought is a major natural hazard threatening agricultural production, water security and ecosystem stability in northern China [1,2,3,4]. Under global climate change, drought patterns have undergone remarkable shifts in mid-latitudes of the Northern Hemisphere, with some regions gradually turning from humid to arid, which has become a hot topic in hydrometeorological research [5,6,7]. The Sixth Assessment Report of the IPCC indicates that regional climate variability, vegetation restoration, hydrological cycle regulation and intensified hydraulic engineering management have alleviated drought stress in certain agricultural areas, accompanied by structural variations in the frequency and coverage of extreme drought events [8]. As China’s largest plain, the North China Plain (NCP) serves as a core strategic zone safeguarding national food security and is renowned as China’s granary [9,10,11]. Possessing less than 10% of the nation’s total water resources, it accommodates nearly 30% of China’s population, and yields over 50% of national winter wheat and around 30% of summer corn output. It occupies an irreplaceable strategic position in food security guarantee, national water allocation and regional ecological pattern construction [12,13]. Located in the transition zone between semi-arid and semi-humid climates of the East Asian monsoon region, the plain features rapid spring temperature rise, scarce precipitation and intense evaporation. Combined with intensive agricultural water consumption, it has long suffered severe aridification, frequent spring droughts, excessive groundwater extraction and severe ecological pressure, which greatly restrict regional development [14,15]. Distinct climatic variations have emerged across the plain in recent decades. Interdecadal fluctuations of the East Asian monsoon have altered regional water vapor conditions and precipitation distribution, alongside phased temperature changes. These natural climatic factors lay the foundation for regional environmental evolution [16,17]. Meanwhile, large-scale human interventions including ecological restoration, comprehensive treatment of over-exploited groundwater, ecological water replenishment via the South-to-North Water Diversion Project, promotion of water-saving agriculture and vegetation rehabilitation have profoundly reshaped local environments [18,19]. Jointly driven by natural climate transition and anthropogenic regulation, systematic and profound changes have occurred in land surface hydrological processes, soil moisture conditions and drought regimes of the NCP [20,21]. Numerous monitoring data and research findings reveal that regional drought deterioration has halted, presenting new characteristics of overall mitigation, fluctuating improvement and reduced extreme drought occurrences [22]. This transition from worsening aridification to drought relief exerts direct impacts on food safety, sustainable water utilization and ecosystem rehabilitation, and provides crucial implications for long-term regional development strategies, drought mitigation policies and water resource planning [23].
Notably, drought conditions over the NCP have not intensified continuously in recent decades, but exhibited a new trend of gradual overall abatement and sustained relief of drought stress. The mitigating drought trend represents a prominent feature of regional climate and hydro-ecological evolution, and offers theoretical support for optimized water allocation, agricultural arrangement and ecological conservation in the NCP [16,24]. Furthermore, conventional meteorological drought indices such as SPI and SPEI are calculated from meteorological data and only characterize atmospheric dryness and wetness, failing to reflect actual soil water status [25]. In contrast, the Standardized Soil Moisture Index (SSMI) is derived from satellite remote sensing and land surface models. After standardization, it effectively quantifies the deviation of regional soil water content from climatological averages [26,27]. With clear physical implications and practical applicability to agricultural activities, SSMI features strong comparability across diverse temporal and spatial scales and enables accurate soil drought detection. Accordingly, SSMI has become a vital metric for soil drought monitoring, spatiotemporal variation analysis and driving mechanism investigation [28,29].
The NCP covers a vast territory. Distinct disparities in climatic background, topography, agricultural structure and governance intensity across the five provincial-level regions result in evident spatial divergence of drought trends. Beijing (BJ), Tianjin (TJ) and northern Hebei (HB) are most directly affected by ecological water replenishment and remediation projects, with the most pronounced drought relief. As major grain-producing regions, Shandong (SD) and Henan (HN) also witness sustained drought alleviation yet with a relatively mild magnitude. Overall, a spatial pattern of rapid relief in the north, steady improvement in the central area and gradual mitigation in the south has been formed [9,13]. Such divergence reflects regional discrepancies under climatic forcing and the spatial pattern of human intervention intensity, serving as a comprehensive outcome of combined natural and anthropogenic impacts [30,31]. Considerable achievements have been made in drought research on the NCP, whereas three major deficiencies remain. Firstly, most existing studies adopt early-stage datasets and conclude continuous drought intensification, lacking systematic, long-term and high-precision characterization of the emerging drought mitigation trends, features and patterns over the past four decades [21,24]. Secondly, previous studies predominantly focus on basin-wide analyses, with insufficient refined comparative investigations among the five provincial-level administrative units, failing to elaborate the spatial heterogeneity of drought relief [9,10]. Thirdly, driving mechanism analyses are inadequate in exploring the synergistic effects of climatic factors, atmospheric circulation, ecological projects and human activities, abrupt change points and time-frequency response characteristics. Quantitative attribution studies integrating 0.1° high-resolution grid data and multi-model coupling approaches are particularly scarce.
Against the aforementioned research background and existing limitations, this study applies multiple approaches including grid-based Modified Mann–Kendall (MMK) trend test, Breaks for Additive Seasons and Trend (BFAST) breakpoint analysis, cross wavelet transform and SHapley Additive exPlanations (SHAP) interpretable machine learning. It systematically explores the temporal variations, spatial disparities, seasonal characteristics, abrupt change points and evolutionary patterns of extreme drought regarding soil drought across the NCP during the study period. Furthermore, this paper quantitatively identifies the multi-scale driving effects of local meteorological elements and large-scale atmospheric circulation factors on drought mitigation, and determines dominant influencing factors [32]. Two testable hypotheses are proposed. Over 1982–2024, the SSMI sequence in the NCP presents an increasing trend (drought alleviation), and sub-regions show inconsistent breakpoint times. Climate factors maintain strong multi-period coherent coupling with SSMI across interannual and interdecadal scales. The research findings intend to clarify the new evolving drought patterns in the study area, scientifically evaluate the effectiveness of ecological management and water resource regulation projects, and provide scientific basis and decision-making references for formulating zoned and graded drought coping strategies, as well as safeguarding regional food and ecological security [33].
2. Materials and Methods
2.1. Study Area
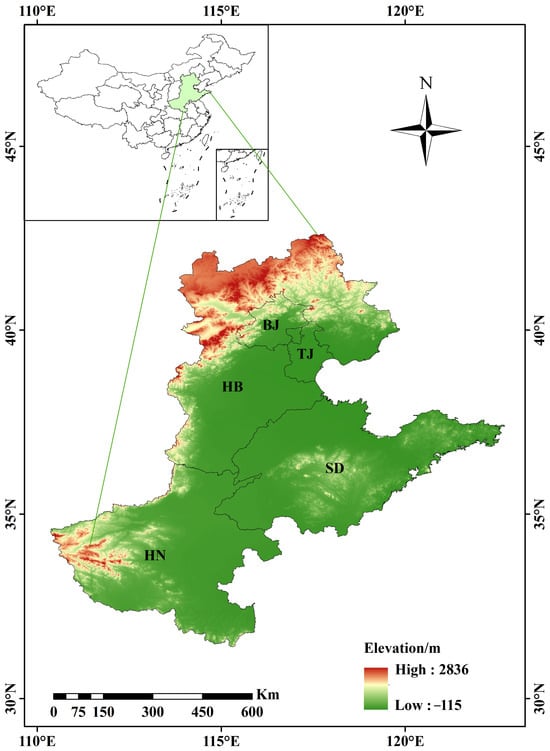
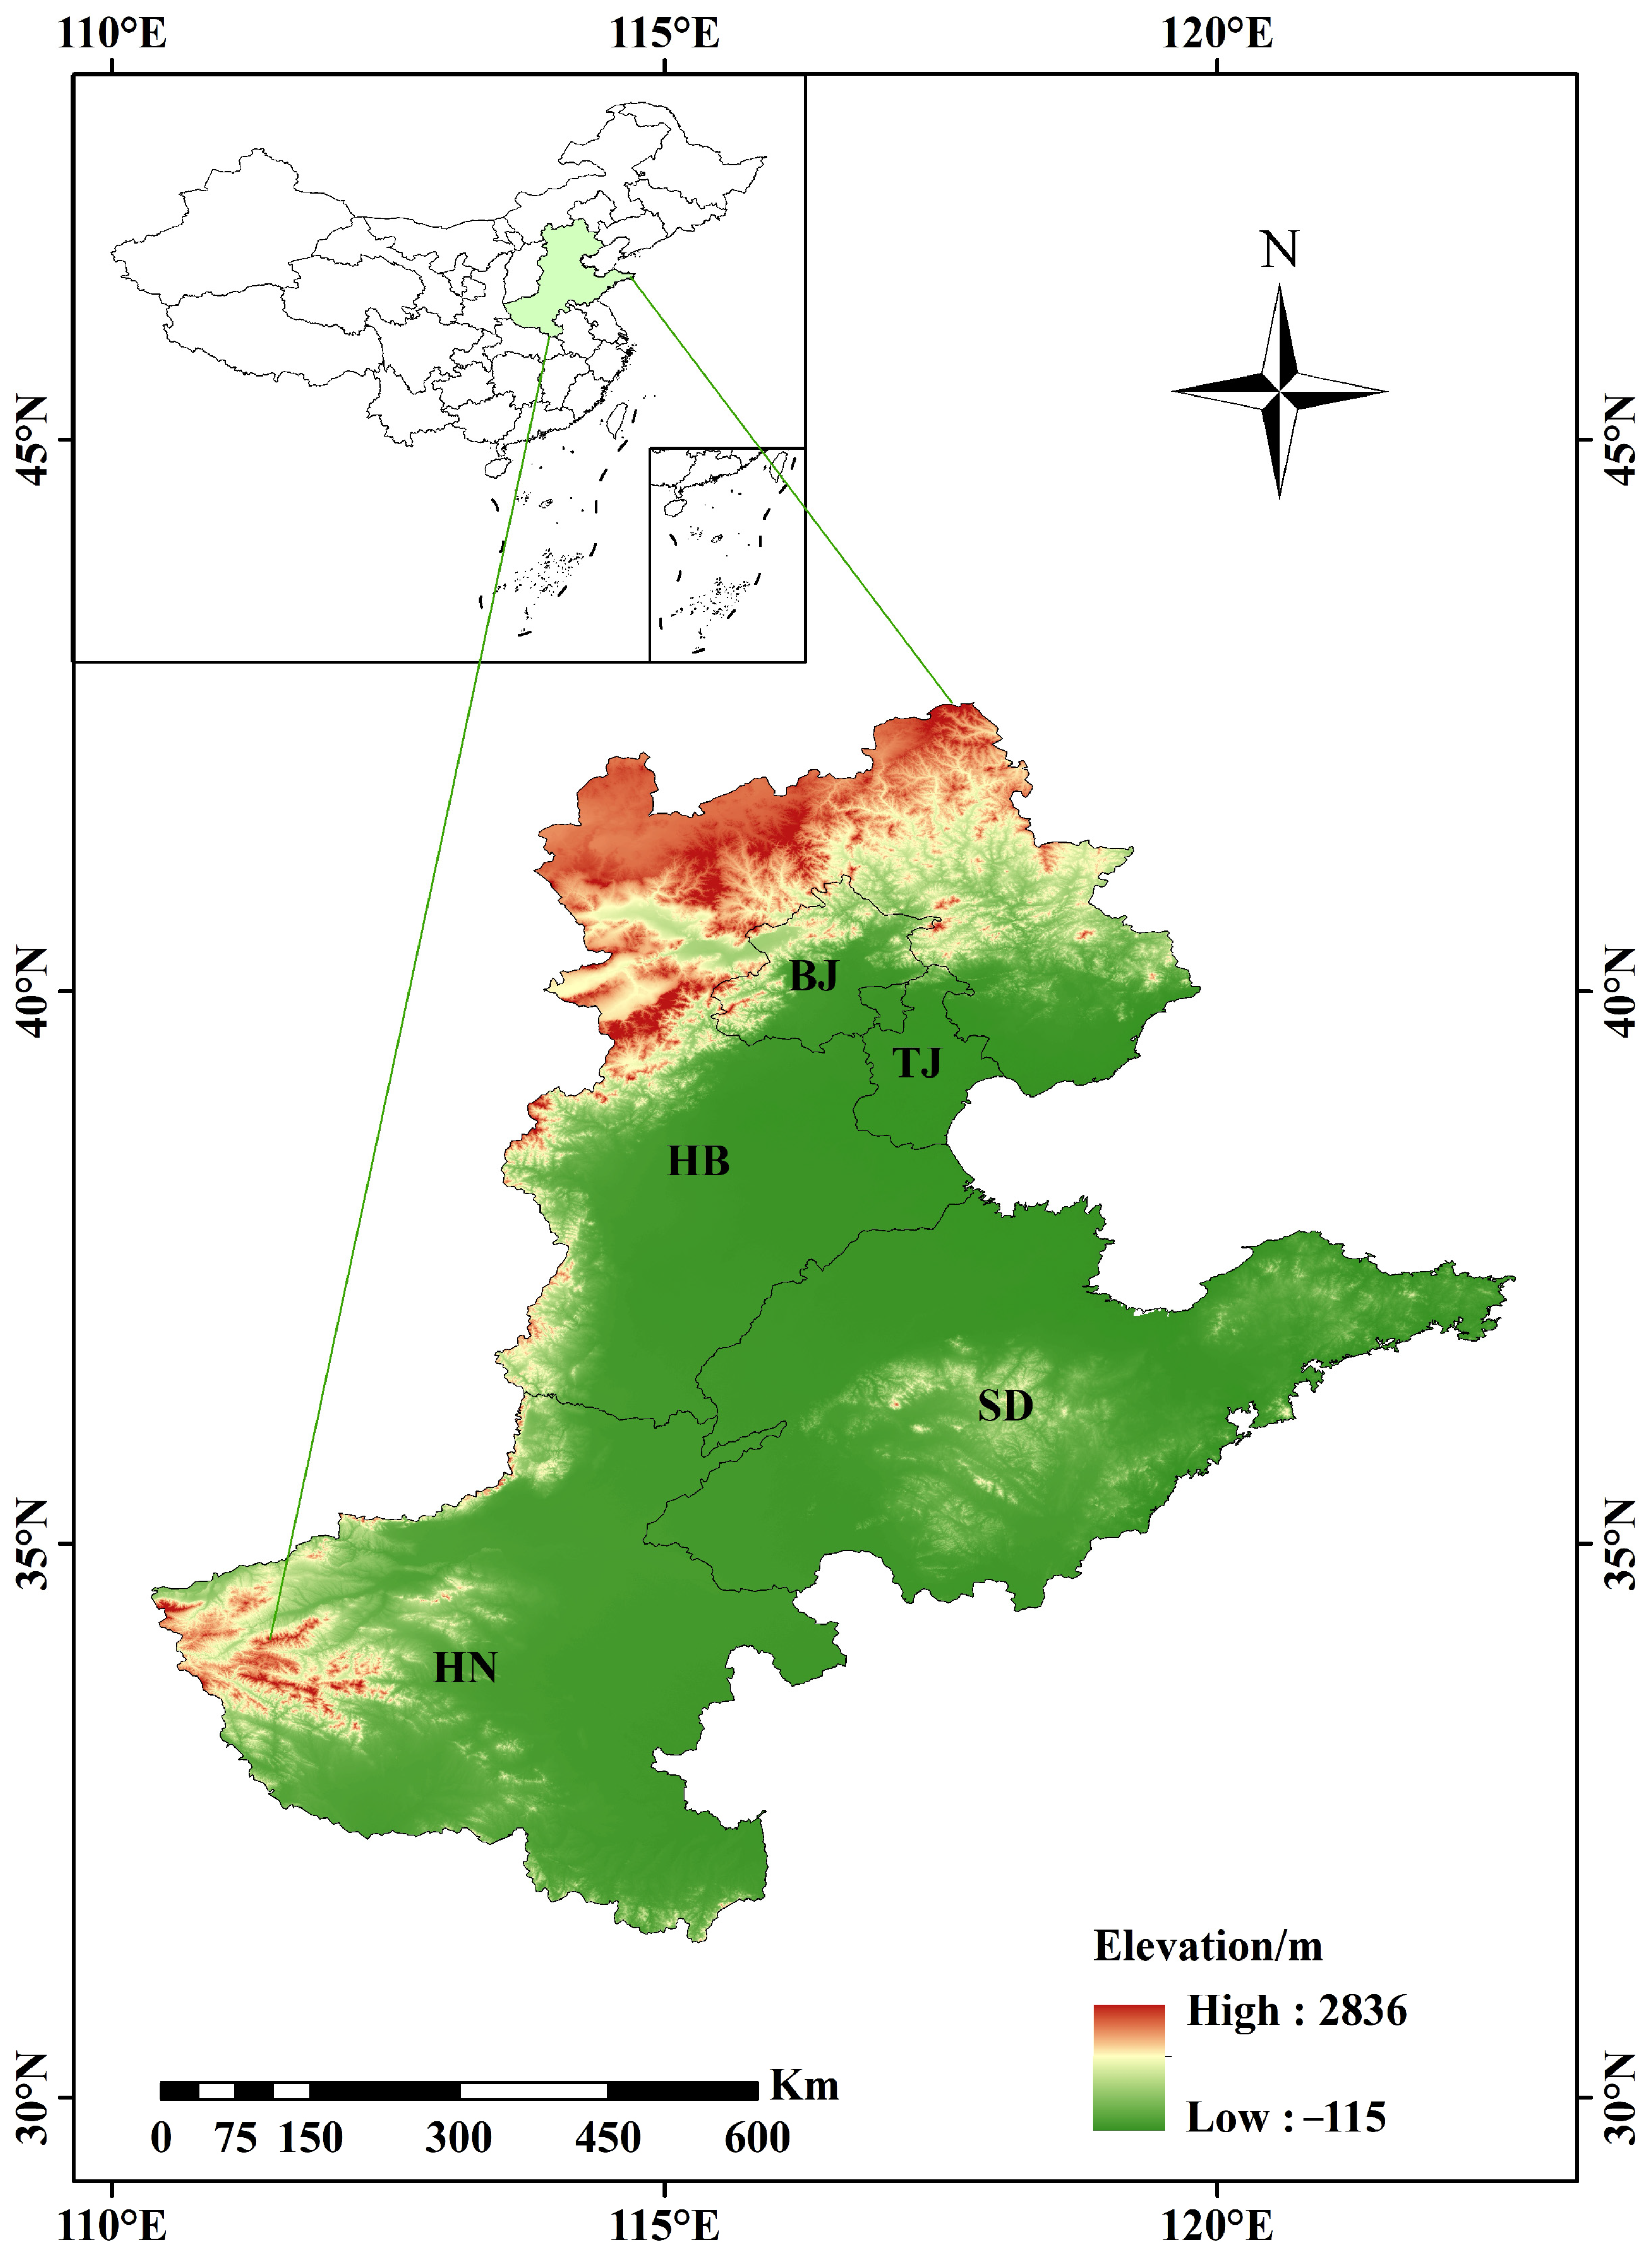
The NCP is mainly situated in eastern China, spanning parts of North and Central China. Boasting a pivotal geographical location, it serves as a core zone for national food security and a key ecological barrier, known as China’s granary [9,19]. Stretching approximately 700 km from east to west and 1200 km from north to south, it covers a total area of around 300,000 km2, encompassing the most vital agricultural and densely populated regions in northern China. The average annual temperature is between 8 and 15 °C, and the annual precipitation is between 400 and 600 mm [34]. As illustrated in Figure 1, the plain covers five provincial-level administrative regions, namely BJ, TJ, HB, SD and HN. According to World Meteorological Organization (WMO) classification, the study area features a warm temperate semi-humid monsoon climate with distinct four seasons and synchronized rainfall and heat. Precipitation is unevenly distributed temporally and spatially, making this region one of the areas most severely affected by drought disasters nationwide [35]. The northern Yanshan–Taihang mountainous area has relatively lower temperature and slightly higher precipitation. The central flat plain with deep soil layers is a major production base of wheat and corn, where agricultural water consumption is highly concentrated. The southern Huanghuai Plain receives relatively abundant rainfall yet exhibits large annual fluctuations, with frequent spring and early summer droughts. Influenced by monsoon activities, rainfall concentrates in summer, while spring witnesses scarce precipitation and intense evaporation. The region is constantly threatened by drought and regarded as a priority area for drought monitoring and prevention [36]. Drought exerts profound adverse impacts on local ecology and agricultural production, triggering crop yield reduction, excessive groundwater exploitation, land degradation, vegetation stress and intensified imbalance between water supply and demand [37]. As China’s predominant grain-producing area, investigating spatiotemporal patterns, evolutionary trends and driving mechanisms of soil drought possesses important scientific and practical implications for safeguarding regional food and water security as well as ecological sustainable development [38].
Figure 1.
The geographical location of the research area North China Plain (NCP). The underlying elevation base map was generated from ASTER GDEM V003 (https://doi.org/10.5067/ASTER/ASTGTM.003; available at https://www.earthdata.nasa.gov/data/catalog/lpcloud-astgtm-003, accessed on 20 December 2025).
2.2. Data Sources
2.2.1. FLDAS Dataset
The datasets used in this study, including precipitation (PC), soil moisture (SM), soil temperature (ST), air humidity (AH), evapotranspiration (ET) and air temperature (AT), are derived from the FLDAS Noah Land Surface Model L4 global monthly dataset (https://disc.gsfc.nasa.gov/, https://doi.org/10.5067/5NHC22T9375G) released by the National Aeronautics and Space Administration (NASA). This dataset has a spatial resolution of 0.1° × 0.1° and a monthly temporal resolution, spanning from January 1982 to present. After cropping to the research area, the 3D matrix for every single variable holds a consistent size of 516 (months) × 120 (grid points) × 130 (grid points). It delivers continuous, stable and high-quality global land surface hydrological products. SM data from 1982 to 2024 were adopted, rather than direct measured in situ or verified with in situ measurements, to analyze the spatiotemporal dynamics of soil drought across the study area. Strict quality control, bias correction and systematic error elimination were conducted via the NASA Land Data Assimilation System. Characterized by fine spatial continuity, credible data quality and intact time series, the dataset accurately captures long-term variations in regional soil water conditions. It provides fundamental data support for SSMI establishment, spatiotemporal evolution analysis of soil drought and driving mechanism exploration [39,40].
2.2.2. Atmospheric Circulation Factors
Atmospheric circulation refers to large-scale atmospheric motion patterns, encompassing both mean and instantaneous states. It features a horizontal scale of thousands of kilometers, vertical scale exceeding 10 km and temporal span of several days or longer [41]. As a crucial mechanism, it facilitates the transport and balance of angular momentum, heat and water within the Earth-atmosphere system, as well as the conversion among diverse forms of energy, while also serving as a consequence of such physical processes. Atmospheric circulation factors constitute key triggers of drought. They can modulate local climate systems via teleconnection effects and further drive the emergence, evolution and propagation of drought events [42]. Moreover, global warming tends to induce anomalous atmospheric circulation. Persistent subsiding air dominates certain regions and restrains effective precipitation formation, ultimately resulting in soil drought [43]. Owing to its unique geographical location, the NCP is jointly affected by multiple circulation patterns, including tropical cyclones, oscillations, subtropical high pressure and East Asian monsoon. Twelve representative monthly atmospheric circulation indices (1982–2024) are selected in this study, namely El Niño-Southern Oscillation (ENSO), Pacific Decadal Oscillation (PDO), North Atlantic Oscillation (NAO), Arctic Oscillation (AO), Atlantic Multidecadal Oscillation (AMO), Dipole Mode Index (DMI), North Pacific Index (NPI), Pacific-North American Pattern (PNA), Southern Oscillation Index (SOI), Sunspot Index (SSI), Interdecadal Pacific Oscillation (IPO) and Oceanic Niño Index (ONI). These data are sourced from the National Oceanic and Atmospheric Administration of the United States (https://www.noaa.gov/) released Global and Regional Climate Change Circulation Index Dataset.
2.3. Methodology
2.3.1. Construction of the Standardized Soil Moisture Index (SSMI)
The SSMI is constructed by standardizing soil moisture data, which directly reflects the relative surplus and deficit of soil water and serves as a reliable indicator for agricultural drought [28,40]. Normality test was conducted on monthly soil moisture series to guarantee index stability and comparability. In this study, the Shapiro–Wilk test was adopted for monthly soil moisture groups. If the p-value of the Shapiro–Wilk statistic exceeded 0.05, the monthly soil moisture series conformed to a normal distribution and satisfied the prerequisite for Z-score standardization to calculate SSMI. The results verified that the data conform to normal distribution, satisfying the prerequisites for standardization. The calculation formula of SSMI is presented as follows:
where i denotes the observation year ranging from 1982 to 2024, and j represents the observation month from January to December. and are the mean value and standard deviation of SM in month j. As a dimensionless indicator, SSMI is applied to drought identification. Afterwards, dimensionless SSMI values are obtained through normal standardization transformation (Table 1) [44]. After calculation, SSMI is used to identify spatial trend characteristics of drought, diagnose mutation points, and analyze driving factors. Based on the minimum SSMI on an annual scale, we can obtain the driest year during the research period and characterize the monthly and seasonal SSMI variation characteristics within the year. Specifically, March to May is spring, June to August is summer, September to November is autumn, and December to February of the following year is winter.
Table 1.
Classification schemes of the drought indicator SSMI.
2.3.2. Modified Mann–Kendall (MMK) Trend Test for Spatial Analysis
The MMK test is a widely used non-parametric statistical method for trend and abrupt change detection of hydrometeorological time series. It imposes no strict distribution requirements on samples and is less susceptible to outliers [45]. This study applies the MMK test to analyze temporal trends of soil drought in the NCP from 1982 to 2024, including trend magnitude and significance level, and identify spatial disparities in trend evolution. The Kendall rank correlation coefficient and Zs statistic are calculated. Zs is the standardized normal statistic derived from the MMK test. A positive Zs corresponds to an upward monotonic trend, and a negative Zs corresponds to a downward trend. The trend is considered statistically significant at the 95% confidence level when | Zs | > 1.96. In this study, after SSMI was calculated, we used the MMK trend test to identify the spatial trend characteristics of SSMI by using MATLAB R2022a software.
2.3.3. BFAST Mutation Analysis
BFAST is an approach designed for breakpoint detection and trend estimation of time series [46]. Using MATLAB R2022a software, BFAST can accurately identify abrupt variations based on time series decomposition and iterative breakpoint detection. The core formula is shown below:
where Yt refers to the observed value at time t, Tt denotes the trend component, St represents the seasonal component, and et stands for the residual component. The residual follows a normal distribution with a mean of 0 and fixed variance , reflecting random errors after series decomposition. Piecewise linear fitting is adopted for the trend component Tt. Assuming the time series contains m breakpoints , the whole sequence is divided into m + 1 segments. The trend formula for each segment is expressed as:
where t represents time; and are the intercept and slope of the k-th segment respectively. The sign of the slope indicates upward or downward trend, and its absolute value reflects the changing rate. The seasonal component St is fitted by Fourier series to capture seasonal fluctuations of time series.
where f denotes the seasonal cycle of time series. Given the seasonal characteristics of hydrological data, f = 12 is adopted to correspond to monthly seasonal fluctuations. p stands for the harmonic order of Fourier series, and relevant parameters represent fitting coefficients of the seasonal component.
In this study, all parameters in the formulas are estimated via the least square method. An iterative detection algorithm is applied to determine the location and quantity of breakpoints, so as to distinguish abrupt change timing and types, namely gradual and abrupt shifts. Using BFAST algorithm, we can identify the trend component Tt, seasonal component St, and residual component et in the monthly SSMI sequence. This method compensates for the limitations of the MMK test in detailed abrupt change interpretation and enables accurate identification of breakpoint number, occurrence time and category in SSMI time series. Trend variations before and after abrupt changes are further analyzed. Combined with climate change and human activities including the South-to-North Water Diversion Project and groundwater management policies, preliminary attribution analysis of abrupt changes is conducted. The analysis conforms to seasonal features of hydrological sequences in the NCP, guaranteeing scientificity and pertinence of breakpoint detection [47,48].
2.3.4. Cross Wavelet Transform Technology
Wavelet analysis is a mathematical method based on time-frequency analysis, which effectively reveals multi-scale fluctuation characteristics of time series and is highly applicable to periodic identification of long-term hydrometeorological sequences with merits of multi-resolution analysis [49]. This approach accurately captures coordinated evolution relationships across diverse periods and scales, overcoming drawbacks of conventional trend and time series analysis. It helps profoundly interpret multi-scale driving mechanisms of soil drought evolution and lays a methodological foundation for exploring long-term drought formation and evolutionary rules [50,51]. In this study, the cross wavelet technique was used to identify the driving effects of several different climate factors (PC, ST, AH, ET and AT) on SSMI, in order to identify the most critical driving factors for soil drought. Additionally, the Morlet wavelet was selected as the mother wavelet function in this work. Statistical significance for all wavelet power spectra was assessed via Monte Carlo simulation: 1000 synthetic red noise surrogate sequences were generated to derive the critical threshold corresponding to the 95% confidence level for every time-frequency grid cell.
2.3.5. SHAP Explainable Machine Learning
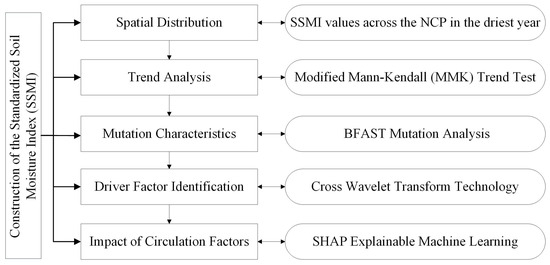
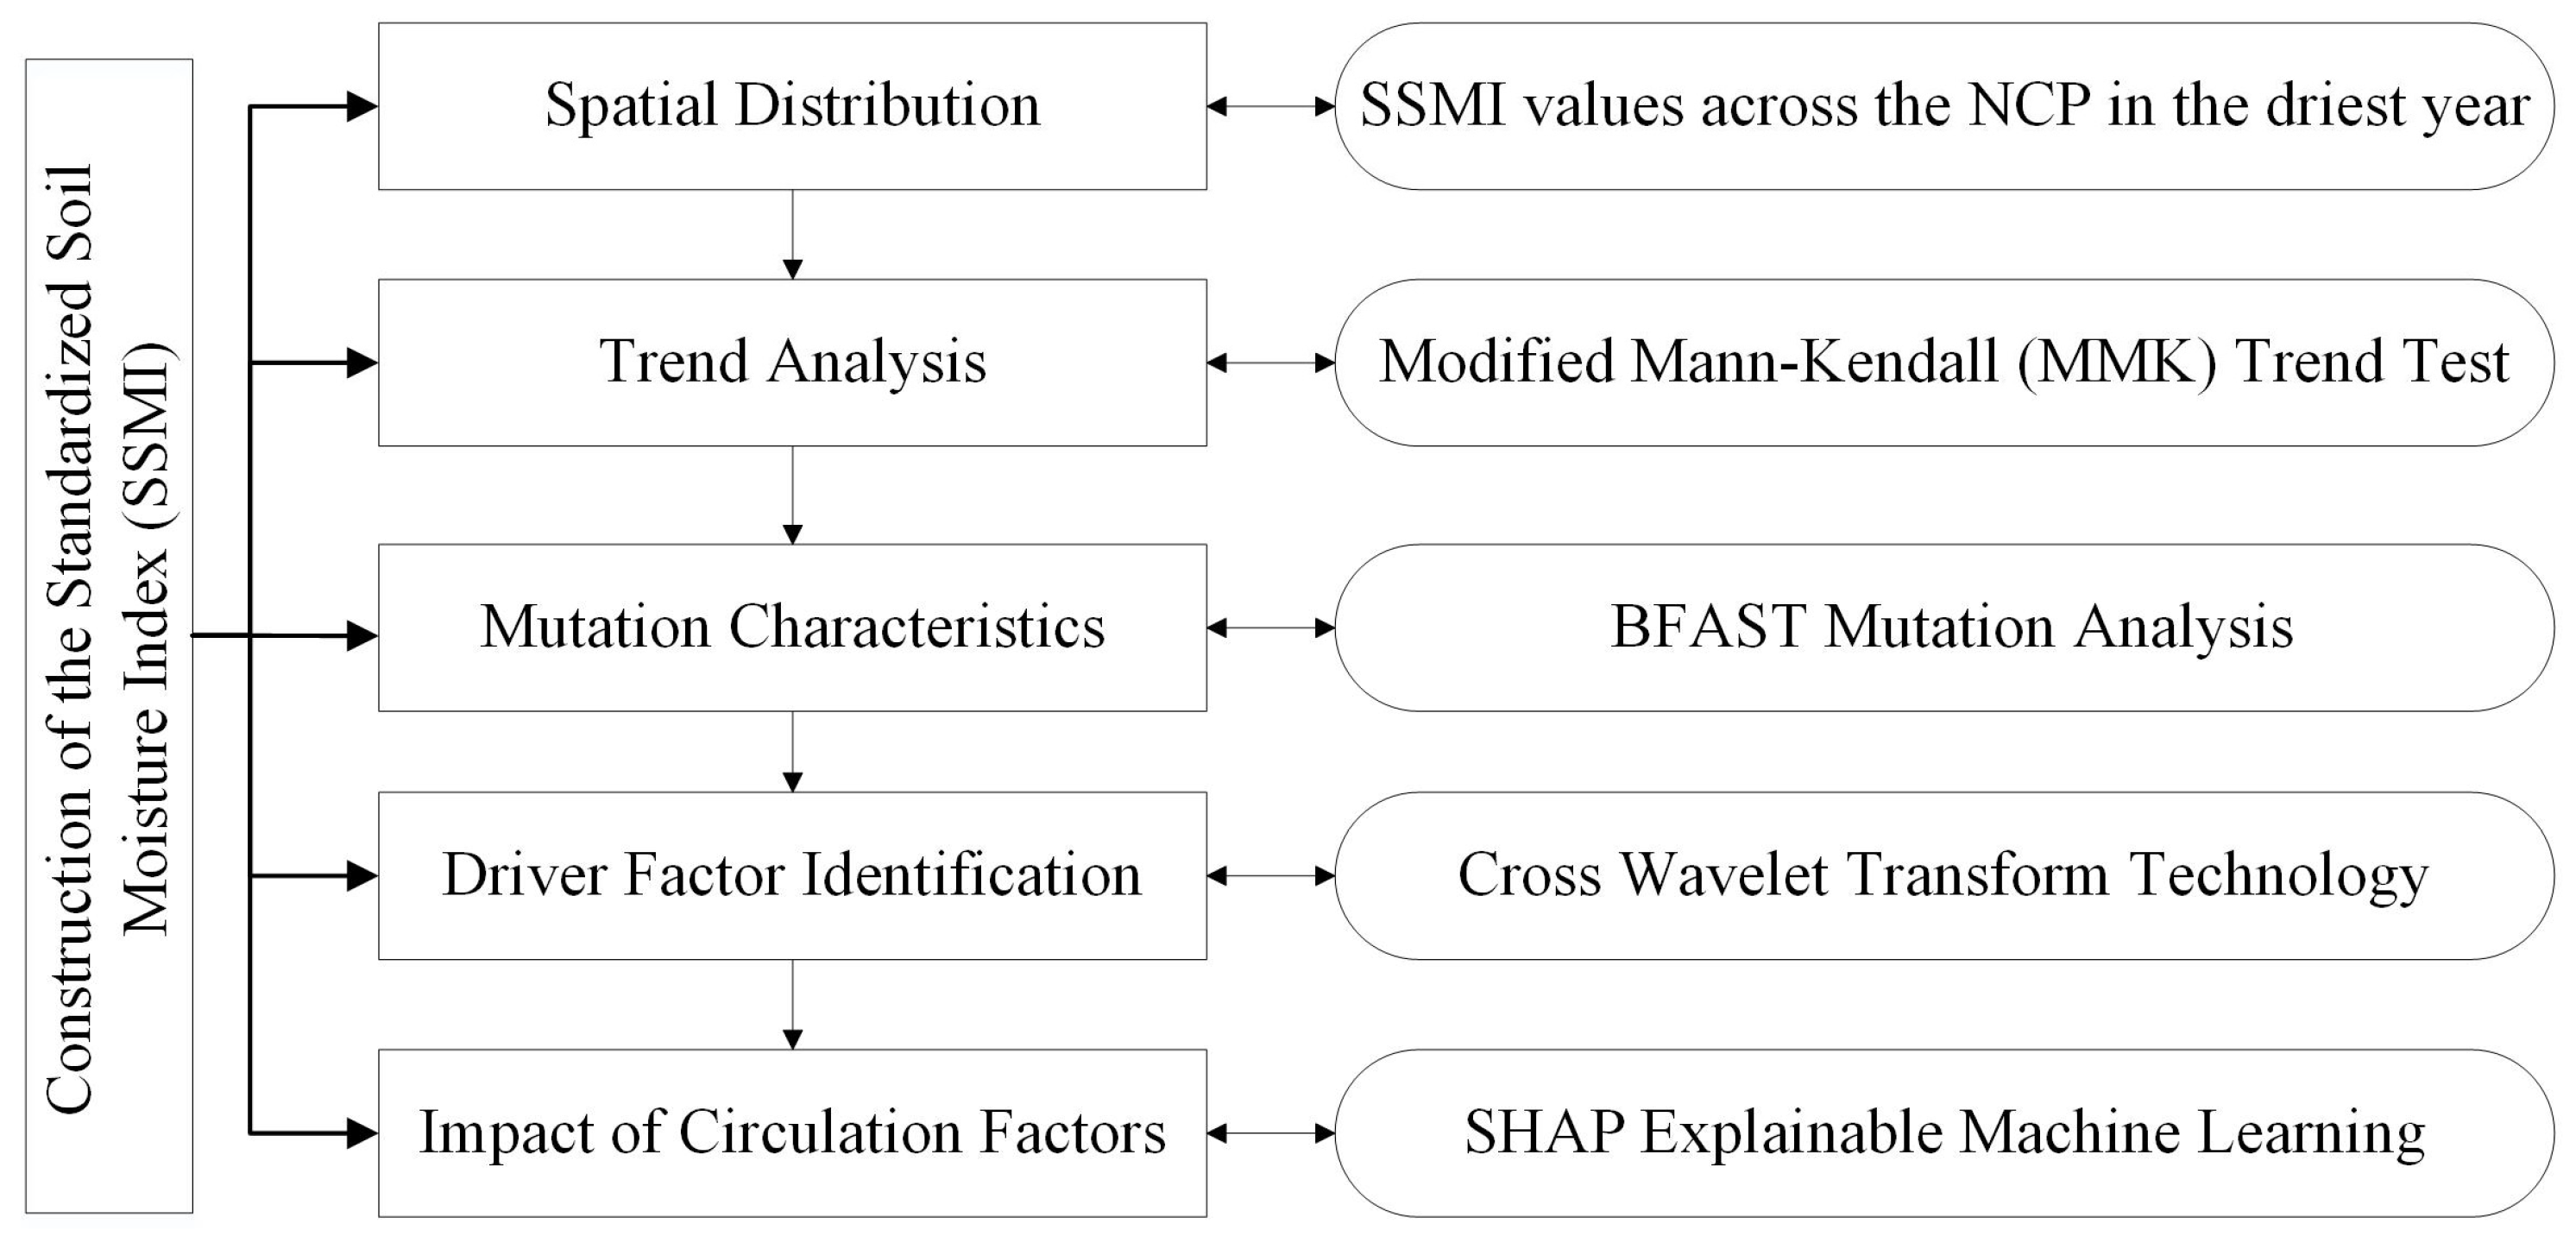
SHAP is a game theory-based interpretable machine learning algorithm. It effectively quantifies the contribution of each input feature to model outputs and addresses the black-box defect of conventional machine learning models, featuring superior interpretability and visualized results [52,53]. This study applies the SHAP method for drought driving factors over the NCP. SHAP values are calculated to quantify and rank the importance of driving factors and determine dominant factors governing drought evolution [54]. SHAP dependence plots are adopted to analyze positive or negative correlations between influencing factors and drought variations and interpret relevant action mechanisms. The method realizes quantitative and interpretable analysis of drought driving processes and compensates for deficiencies of traditional correlation analysis. In this study, the SHAP method was adopted to identify the atmospheric circulation factors (ENSO, PDO, NAO, AO, AMO, DMI, NPI, PNA, SOI, SSI, IPO and ONI) affecting SSMI, in order to reveal the role of circulation factors on soil drought in the NCP. Figure 2 depicts the scheme of the research procedure in this study.
Figure 2.
Scheme of the research procedure.
3. Results
3.1. Spatial Distribution of Soil Drought
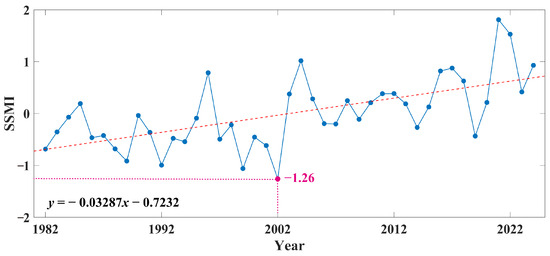
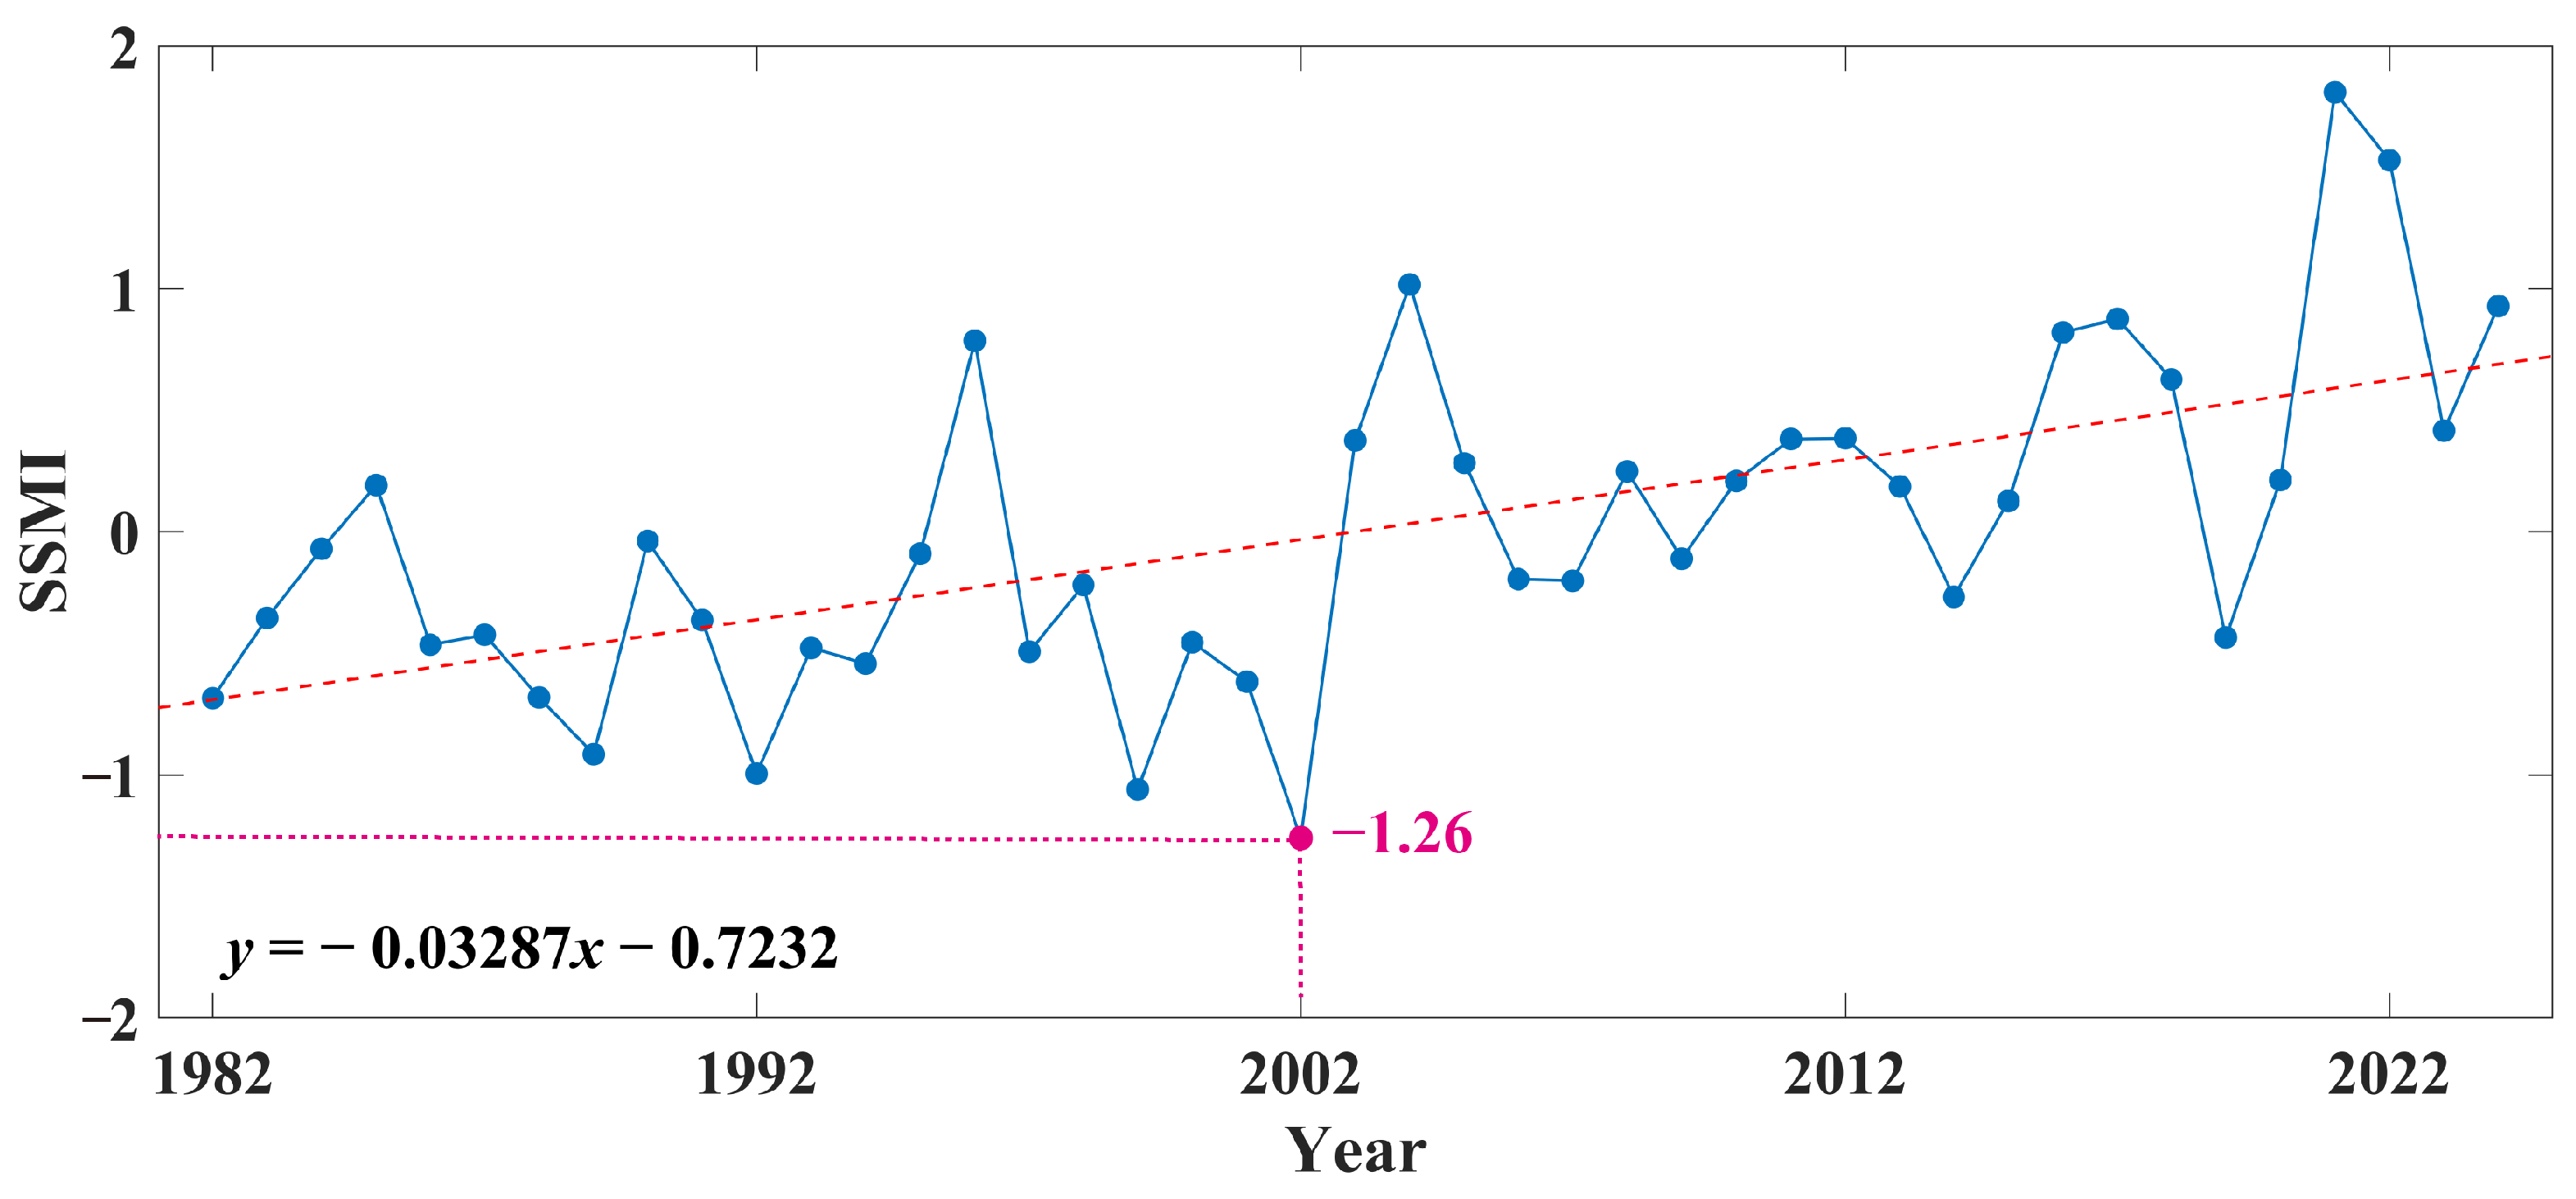
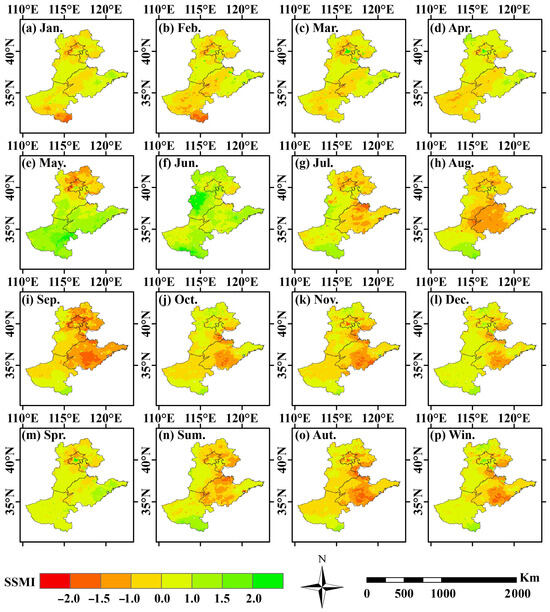
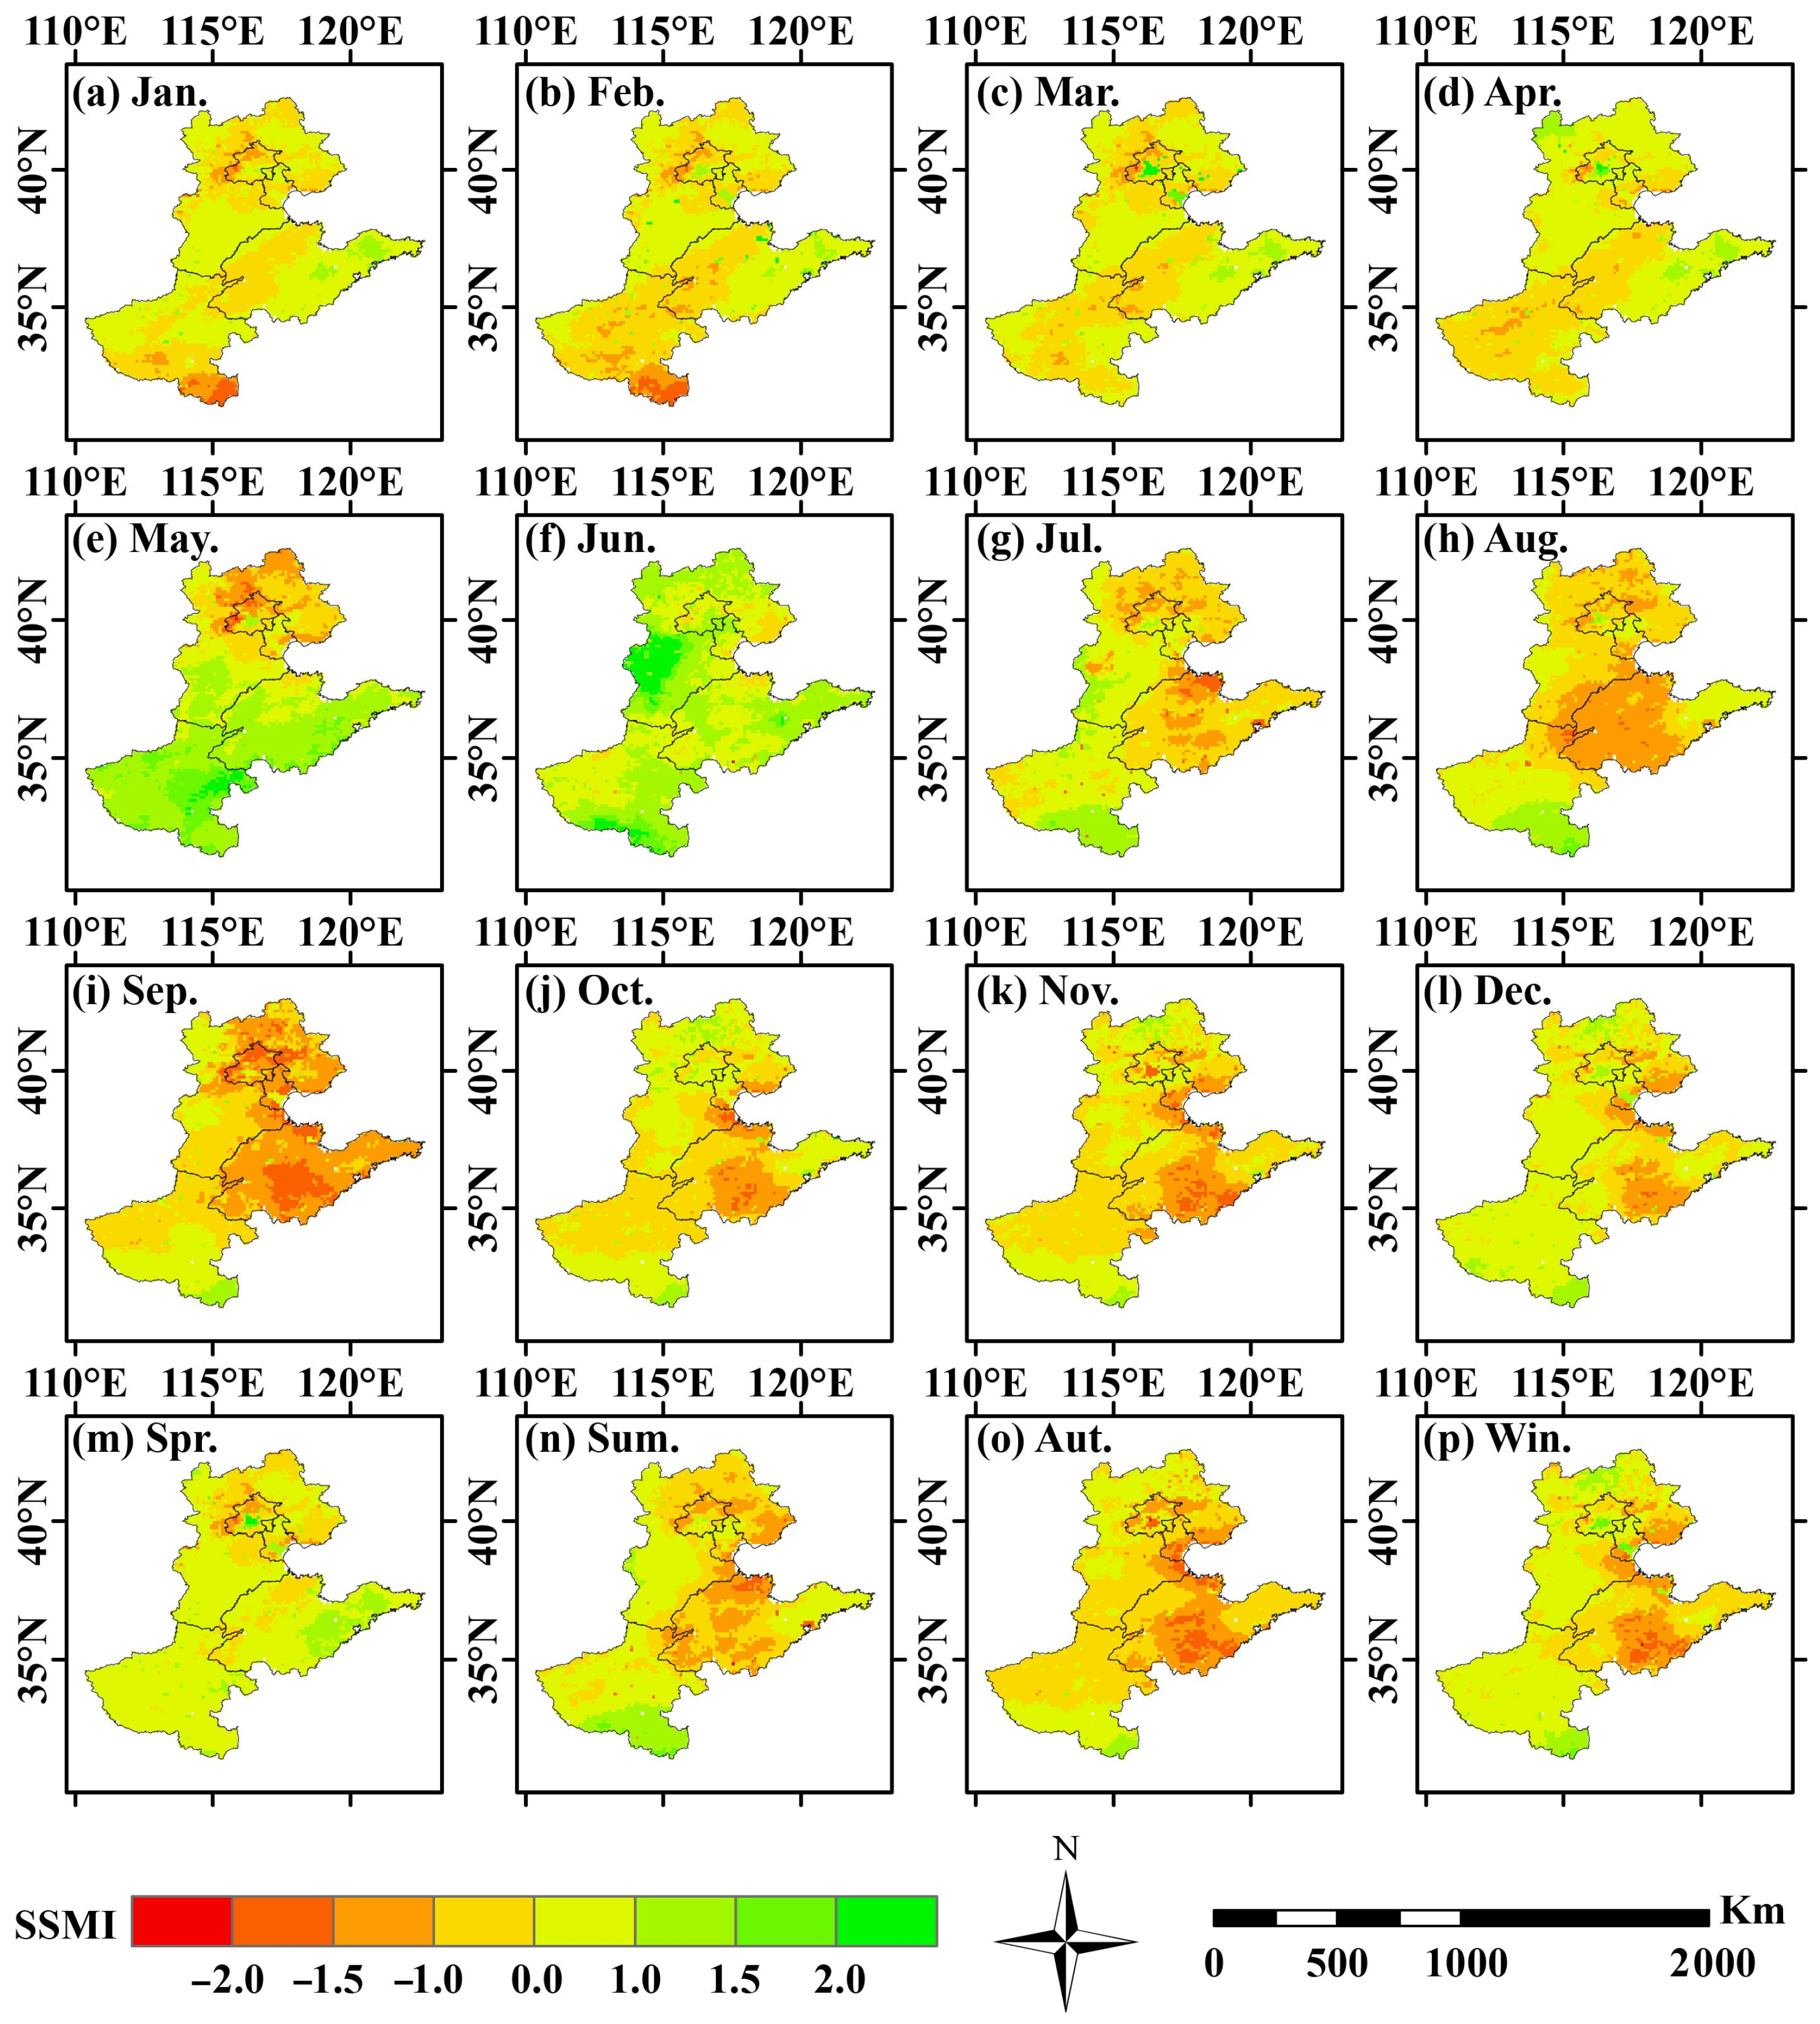
Figure 3 shows the annual change trend of SSMI in the NCP. From 1982 to 2024, there were two years with SSMI values less than –1, namely 2002 (–1.26) and 1999 (–1.06). In addition, the linear tendency rete of SSMI was –0.3287/10a, indicating an increasing trend of drought during the study period. Thus, taking SSMI as the core indicator, this study selects the typical drought year in the NCP in 2002 with an SSMI value of –1.26. The spatiotemporal distribution characteristics of drought are systematically analyzed at monthly and seasonal scales. Pixel-based statistics are applied to quantify the proportion of drought-affected areas in different periods and clarify the evolving scope and intensity of drought. Figure 4 presents pixel-based monthly and seasonal spatial distribution of SSMI in 2002, intuitively illustrating drought conditions across different regions. The proportion of drought-affected areas shows a unimodal variation trend, consistent with the spatial expansion of drought. In the first four months, drought coverage remained relatively low, standing at 42.7% in January and rising to 53.9% in February, before dropping to around 45% from March to April. Drought scattered sporadically in the southern area without regional-scale drought occurrence. Drought expanded rapidly from May to July. The coverage declined to 24.1% in May and rebounded sharply to 52.7% in July, with the drought center shifting northward. Central and southern HB and most parts of SD were successively stricken by drought. Drought coverage peaked between August and October, reaching 64.4% in August and the annual maximum of 77.6% in September, followed by 57.5% in October. Most regions suffered mild or severe drought, marking the period with the widest drought influence. Drought shrank drastically in November and December, falling from 67.3% to 35.2%, with only scattered drought patches remaining in partial areas. The whole region stayed basically normal in spring, with drought proportion merely 22.4%. Scattered mild drought emerged in HN and southern SD with no large-scale drought breakout, representing the initial stage of this drought event. Summer witnessed the full outbreak of drought, with the affected area accounting for 52.2%. Most areas experienced mild or severe drought, and moderate to severe drought prevailed in most parts of HB, SD and HN, serving as the dominant drought period. Drought intensity slightly increased and stayed at a high level in autumn, with the coverage rate of 74.1%. Moderate drought persisted across HB, SD and northern HN during the sustained drought phase. No prominent drought occurred in winter. Although the drought ratio was 43.97%, only localized mild drought existed, and the regional water condition generally returned to normal.
Figure 3.
Characteristics of annual SSMI variation trend in the NCP.
Figure 4.
Pixel-based spatial distribution of SSMI values across the NCP in the driest year (2002) by month and season.
3.2. Trend Analysis of SSMI in the NCP Using the Modified Mann–Kendall (MMK) Test
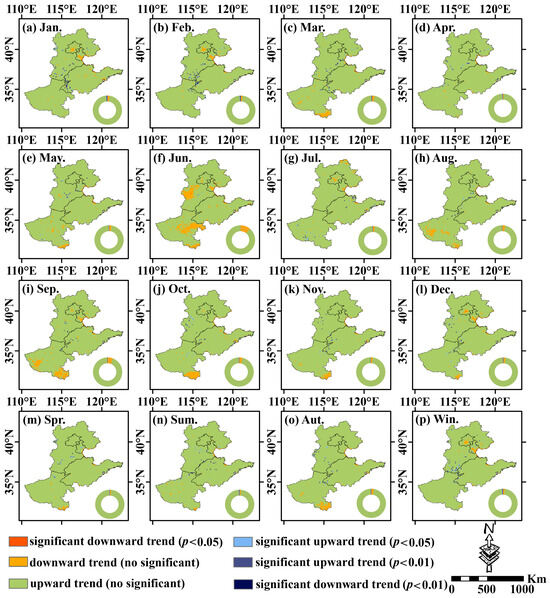
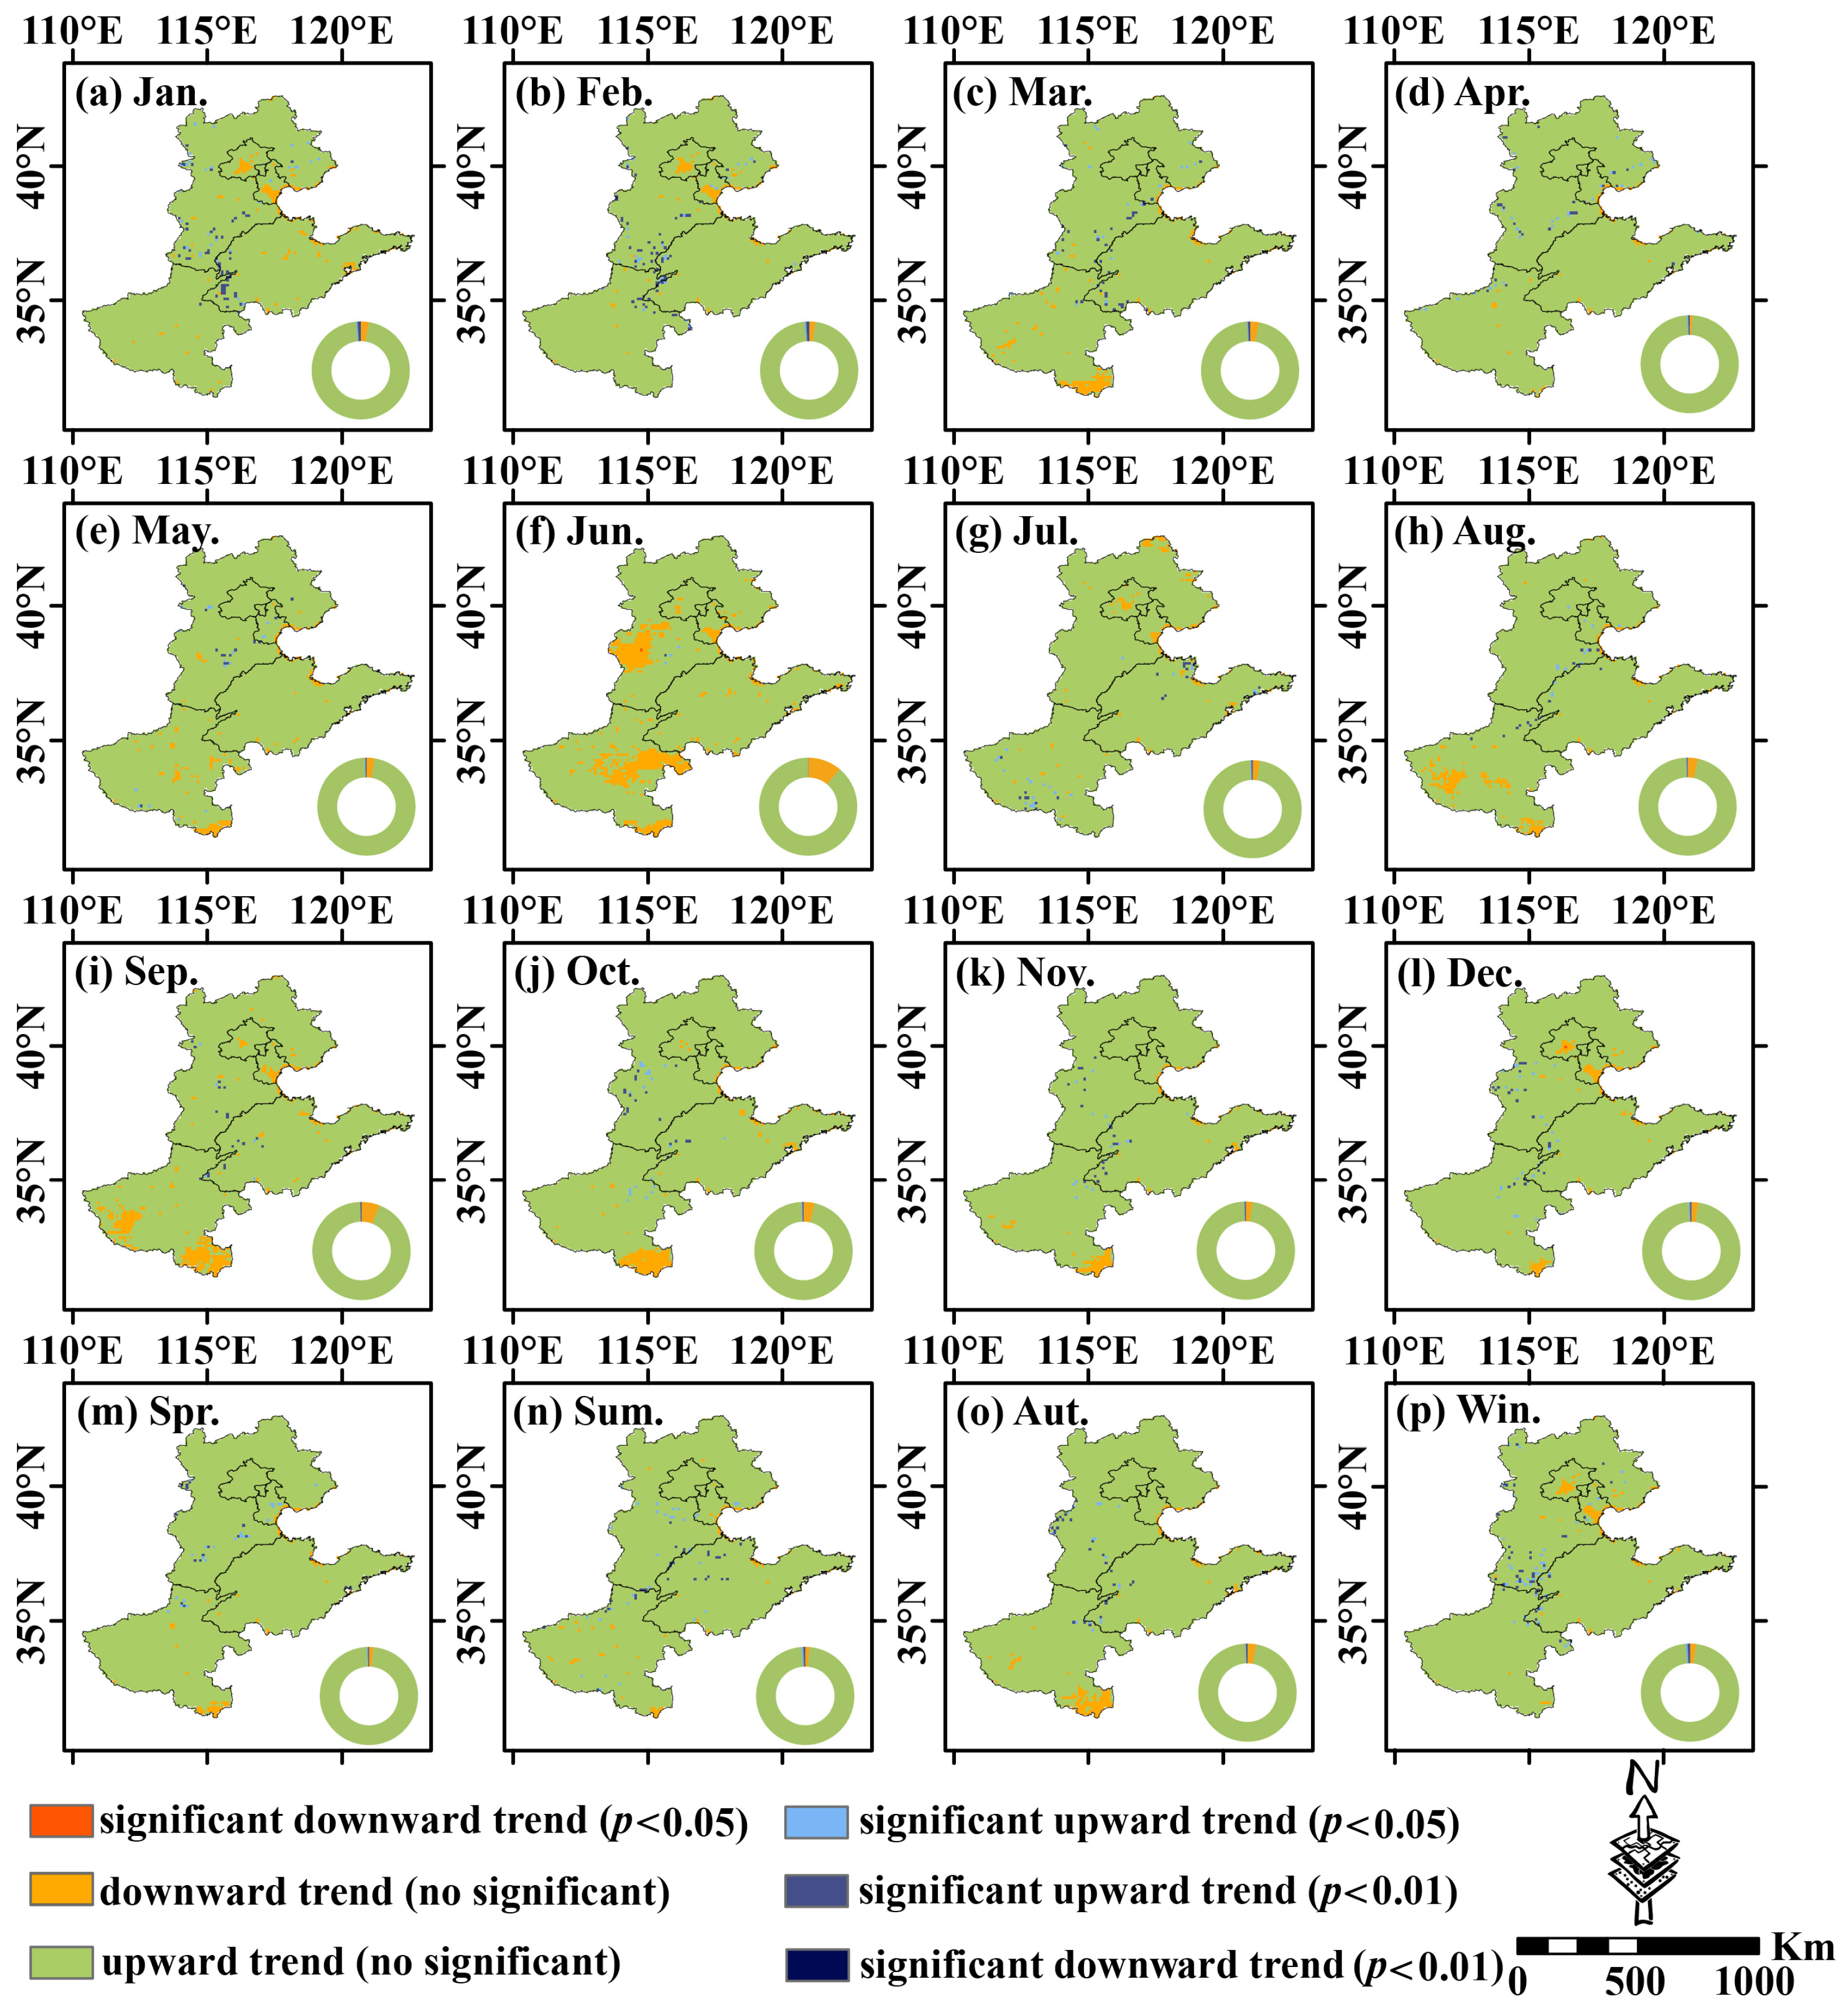
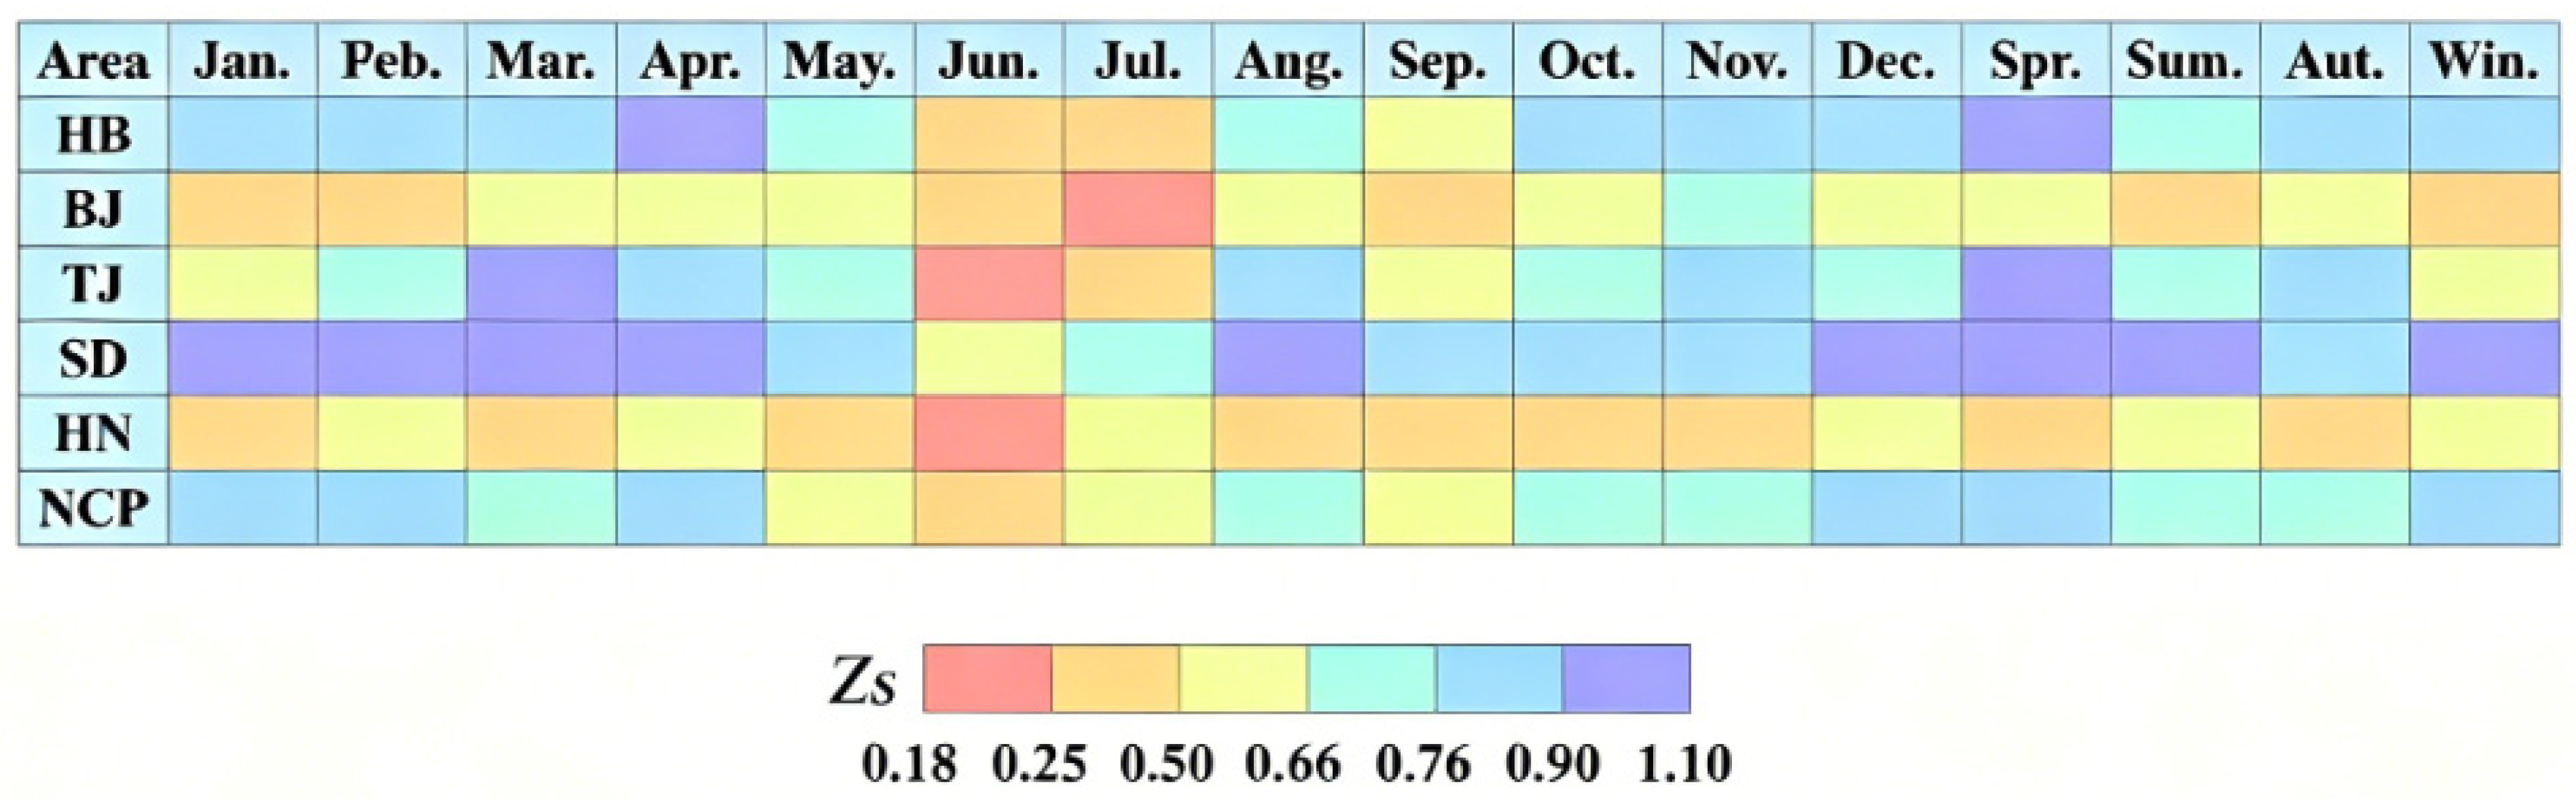
The MMK spatial test was applied to examine the long-term trend significance of SSMI over the NCP from 1982 to 2024. Statistical significance was classified with thresholds of p < 0.05 for significant trends and p < 0.01 for extremely significant trends. Figure 5 illustrates the spatial patterns of monthly and seasonal trends derived from the MMK test across the whole study area and sub-regions. Figure 6 presents Zs values reflecting SSMI trend characteristics. Positive Zs values indicate rising SSMI, namely increased soil moisture and drought alleviation, while negative values stand for declining SSMI and aggravated drought. On the monthly scale, SSMI generally exhibited an upward trend across the plain, with sporadic decreasing trends only in partial areas. June acted as a critical month for trend shifts. Non-significant decreasing trends concentrated in HN, southern SD and southern HB, with locally significant declines at p < 0.05, coinciding with the onset of extreme drought and revealing seasonal soil water deficit risks in late spring and early summer. Statistical results of Zs values show that monthly Zs values of HB, SD and the entire NCP remained above 0.3 and mostly exceeded 0.76, suggesting steady rising trends. BJ, TJ and HN recorded low Zs values below 0.3 from June to July. The annual minimum values were 0.181 in BJ in July, 0.191 in TJ in June and 0.208 in HN in June, corresponding to local decreasing trends. Seasonally, SD maintained Zs values over 0.88 with the most stable upward trend. HN had the lowest Zs in autumn, indicative of partial declining tendency. HB and the whole plain saw seasonal Zs values higher than 0.6, dominated by increasing trends.
Figure 5.
Spatial distribution of MMK trend test results for SSMI values in the NCP (monthly and seasonal scales).
Figure 6.
Grid-based heatmap of MMK trend statistics for SSMI sequences in the NCP and its sub-regions.
3.3. Mutation Characteristics of SSMI
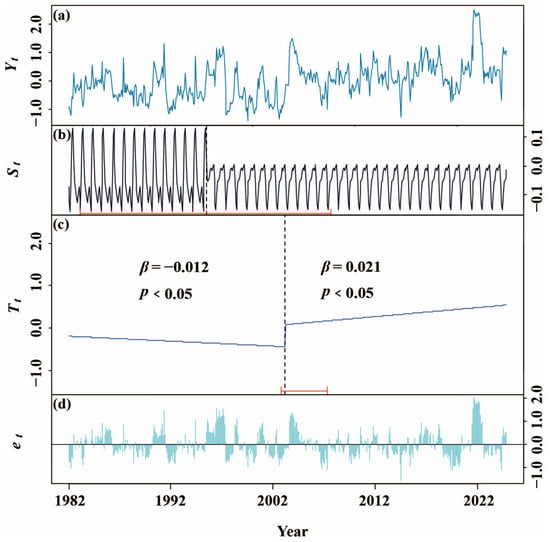
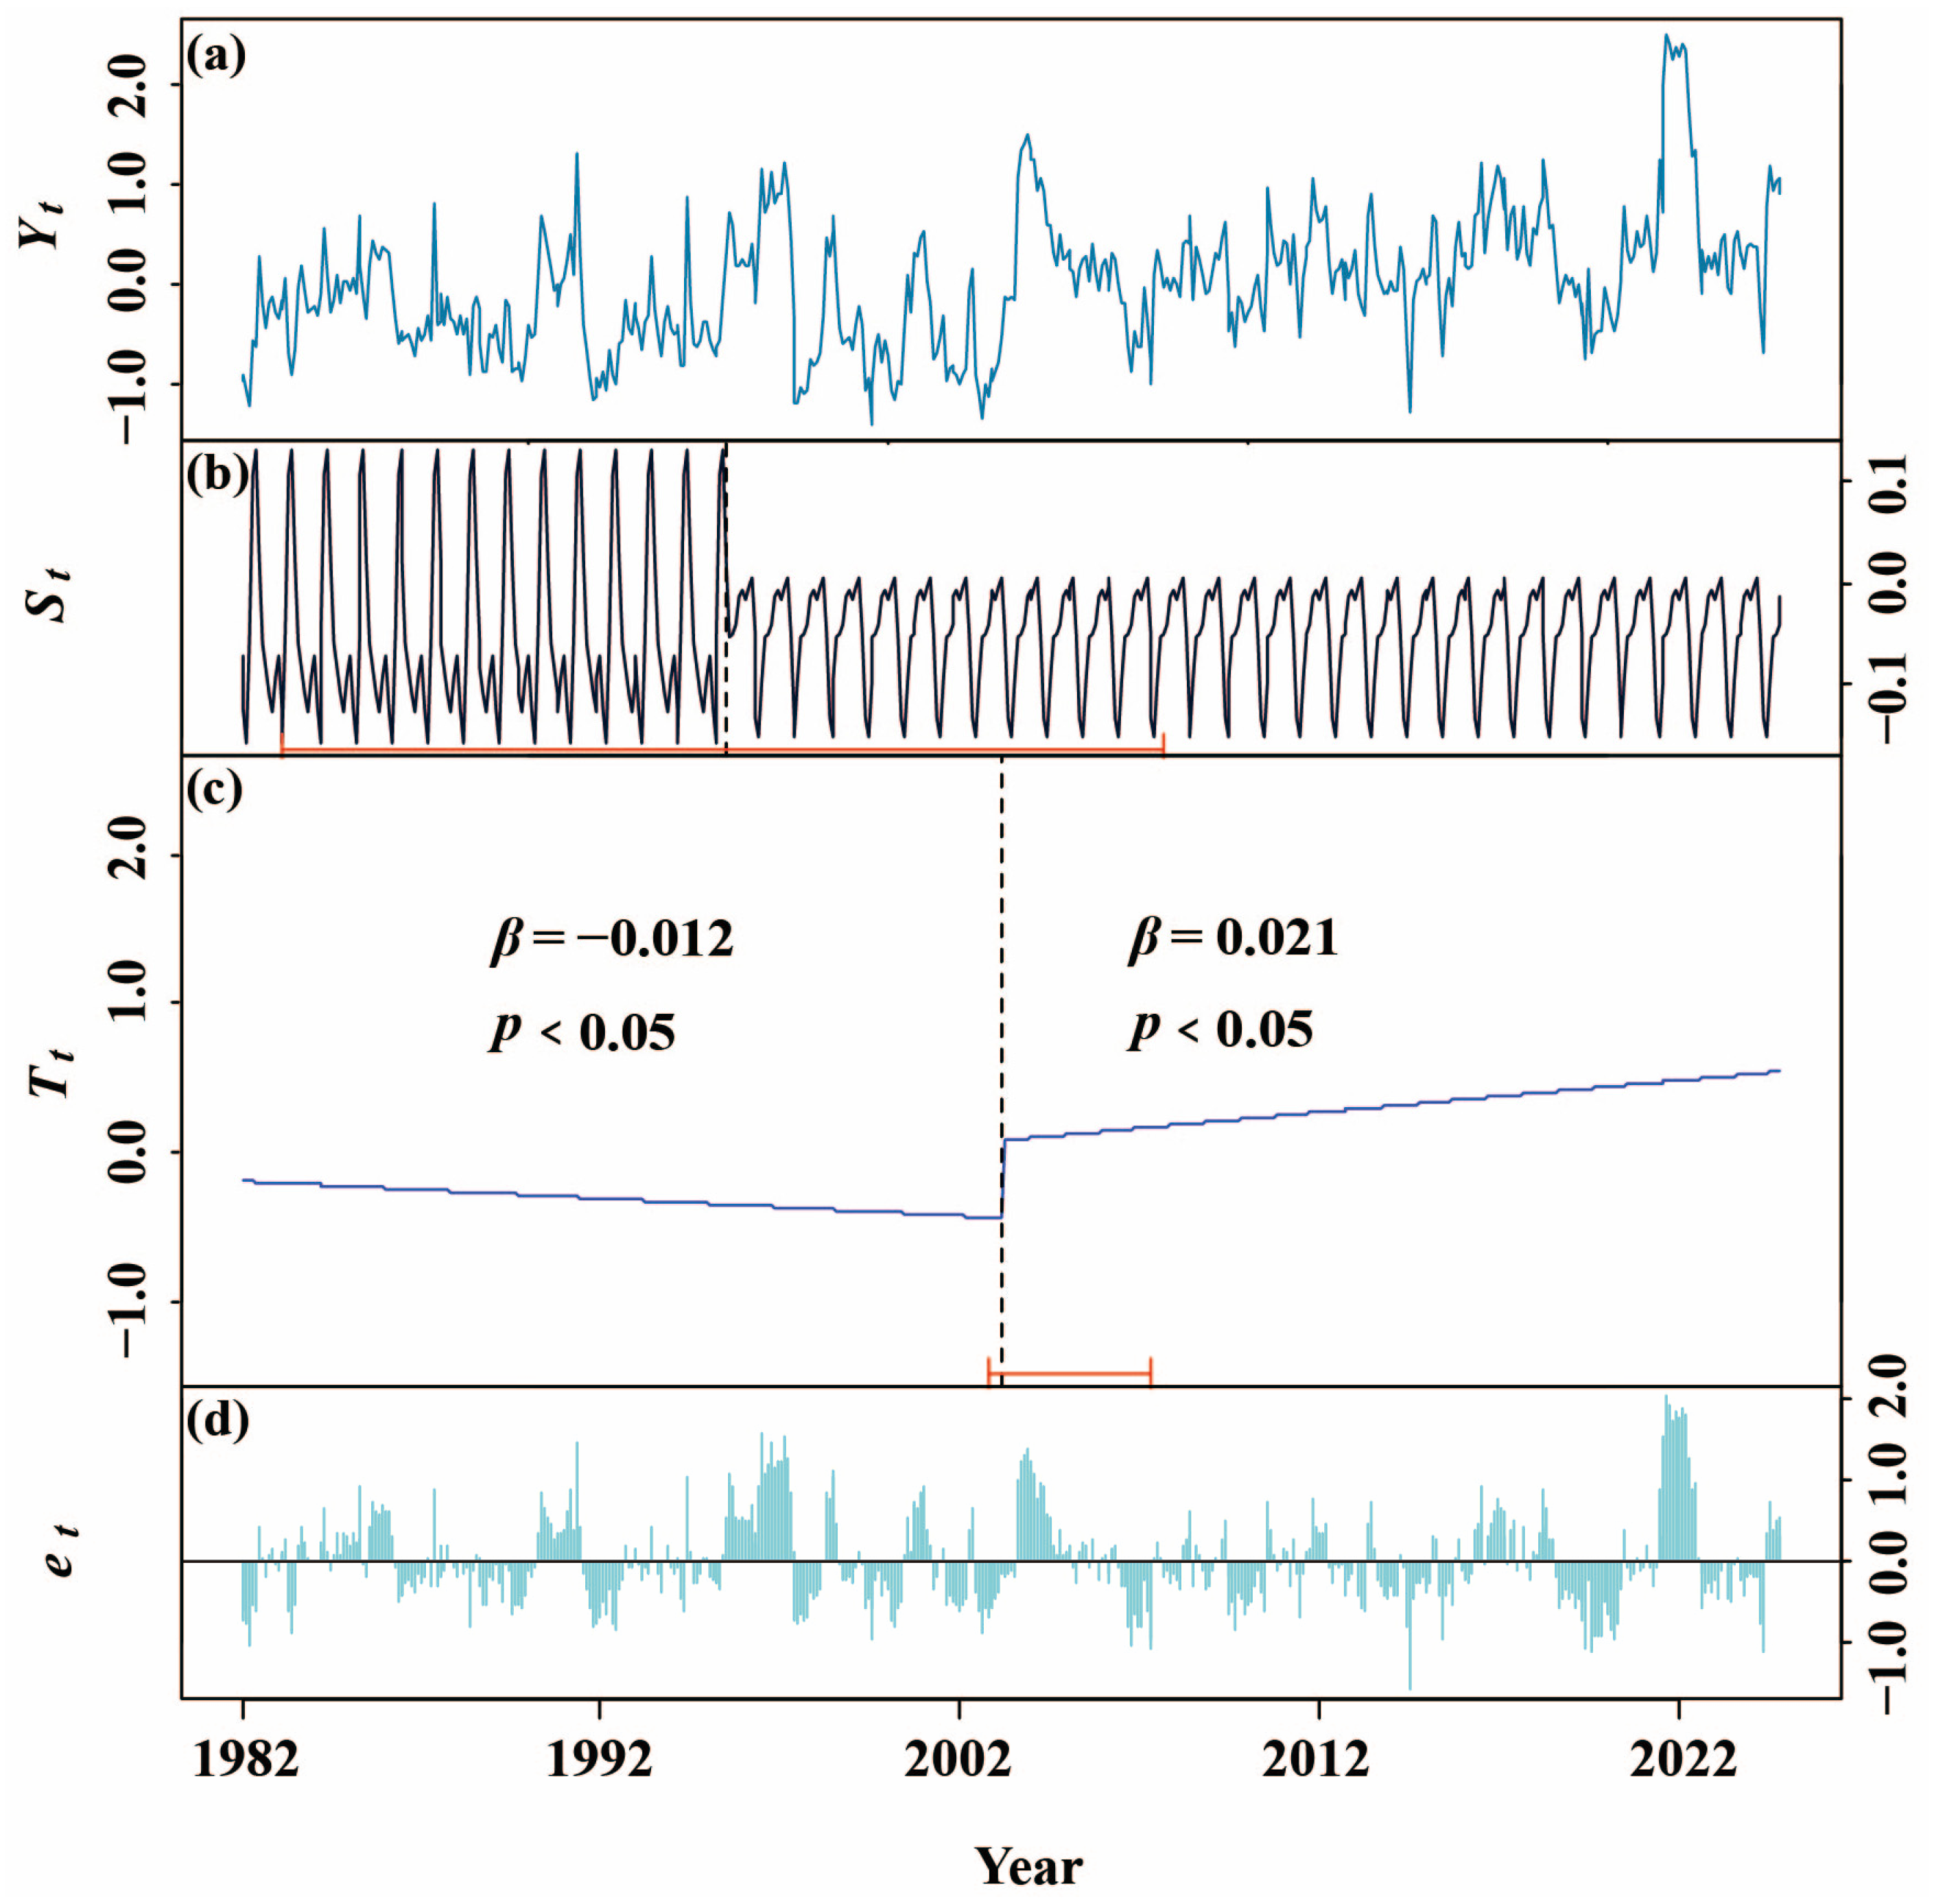
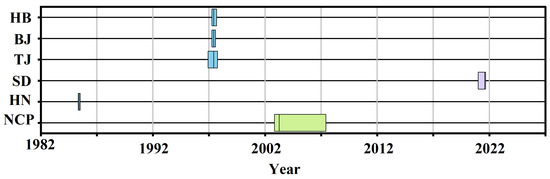
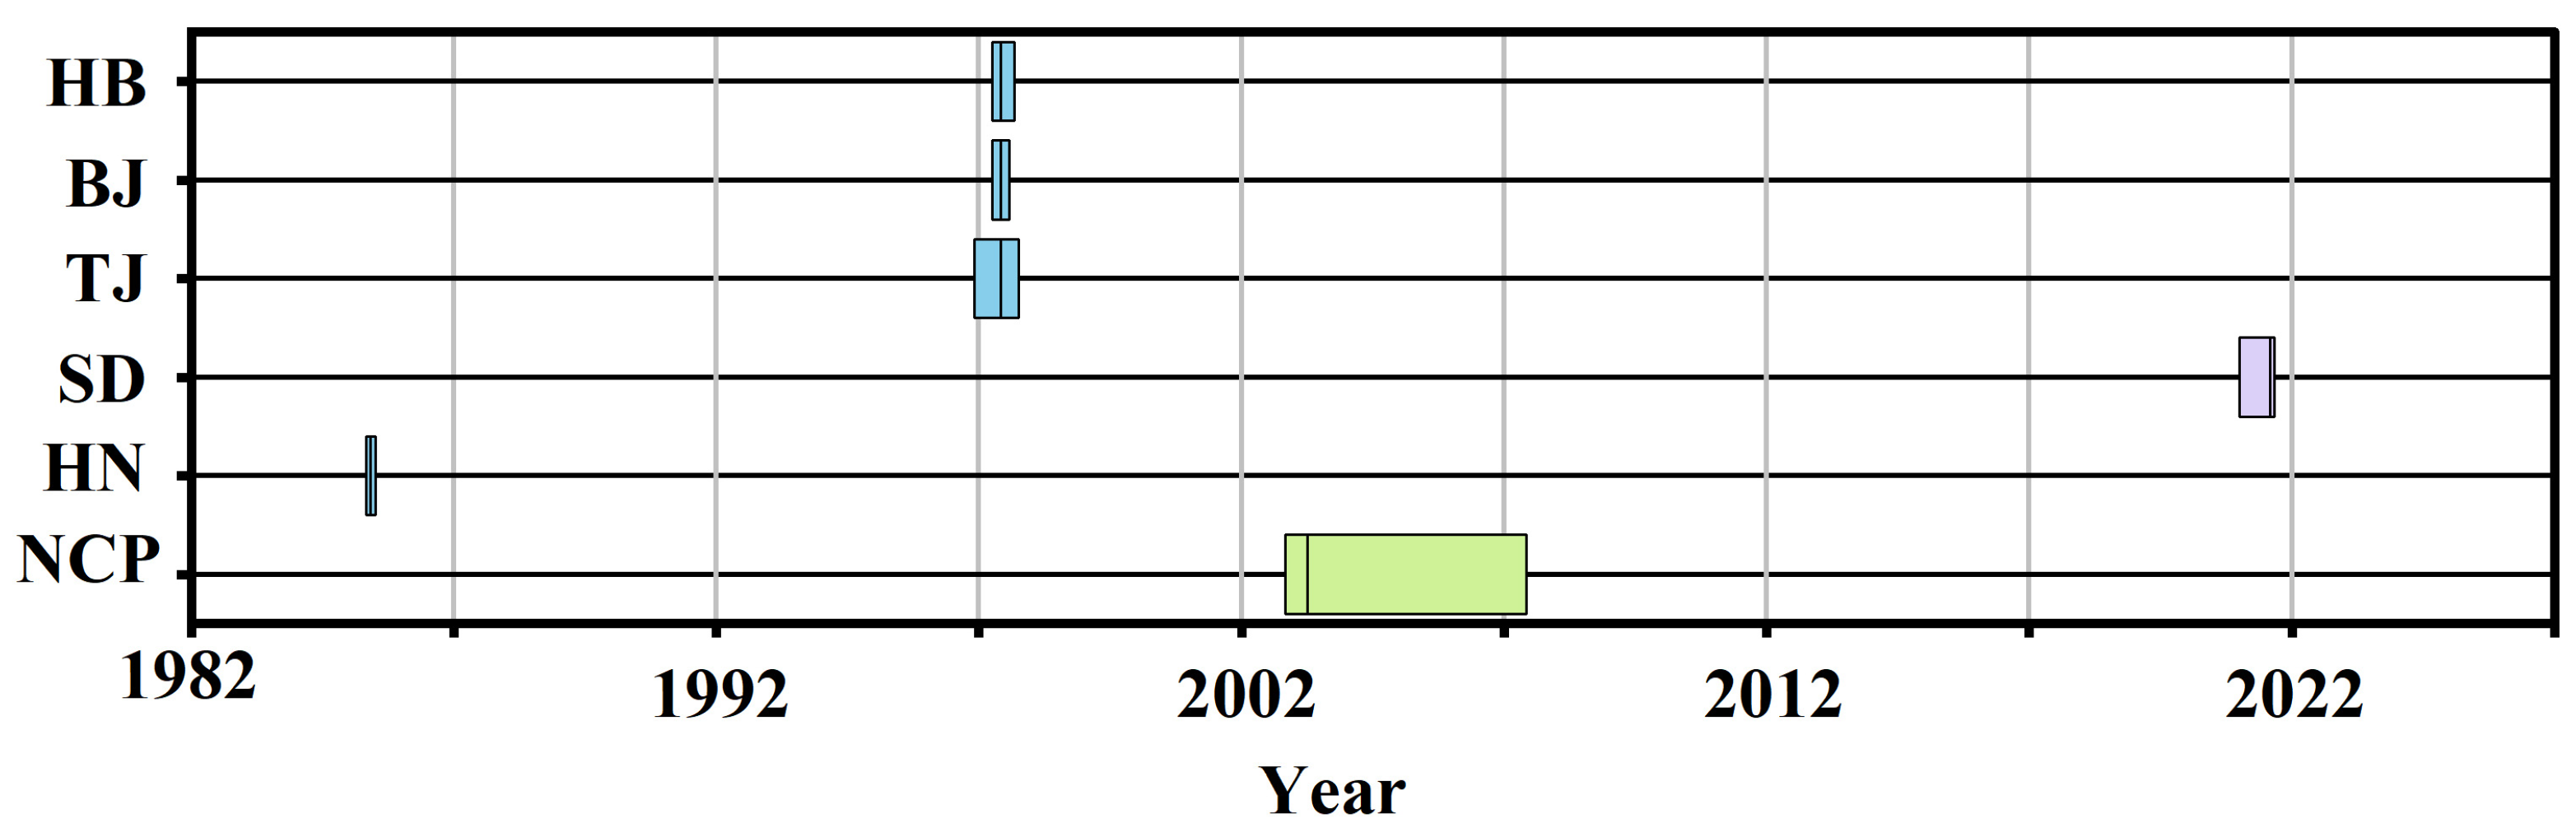
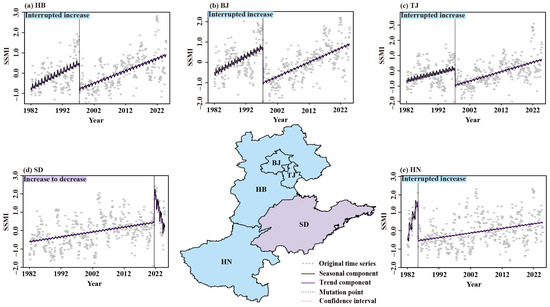
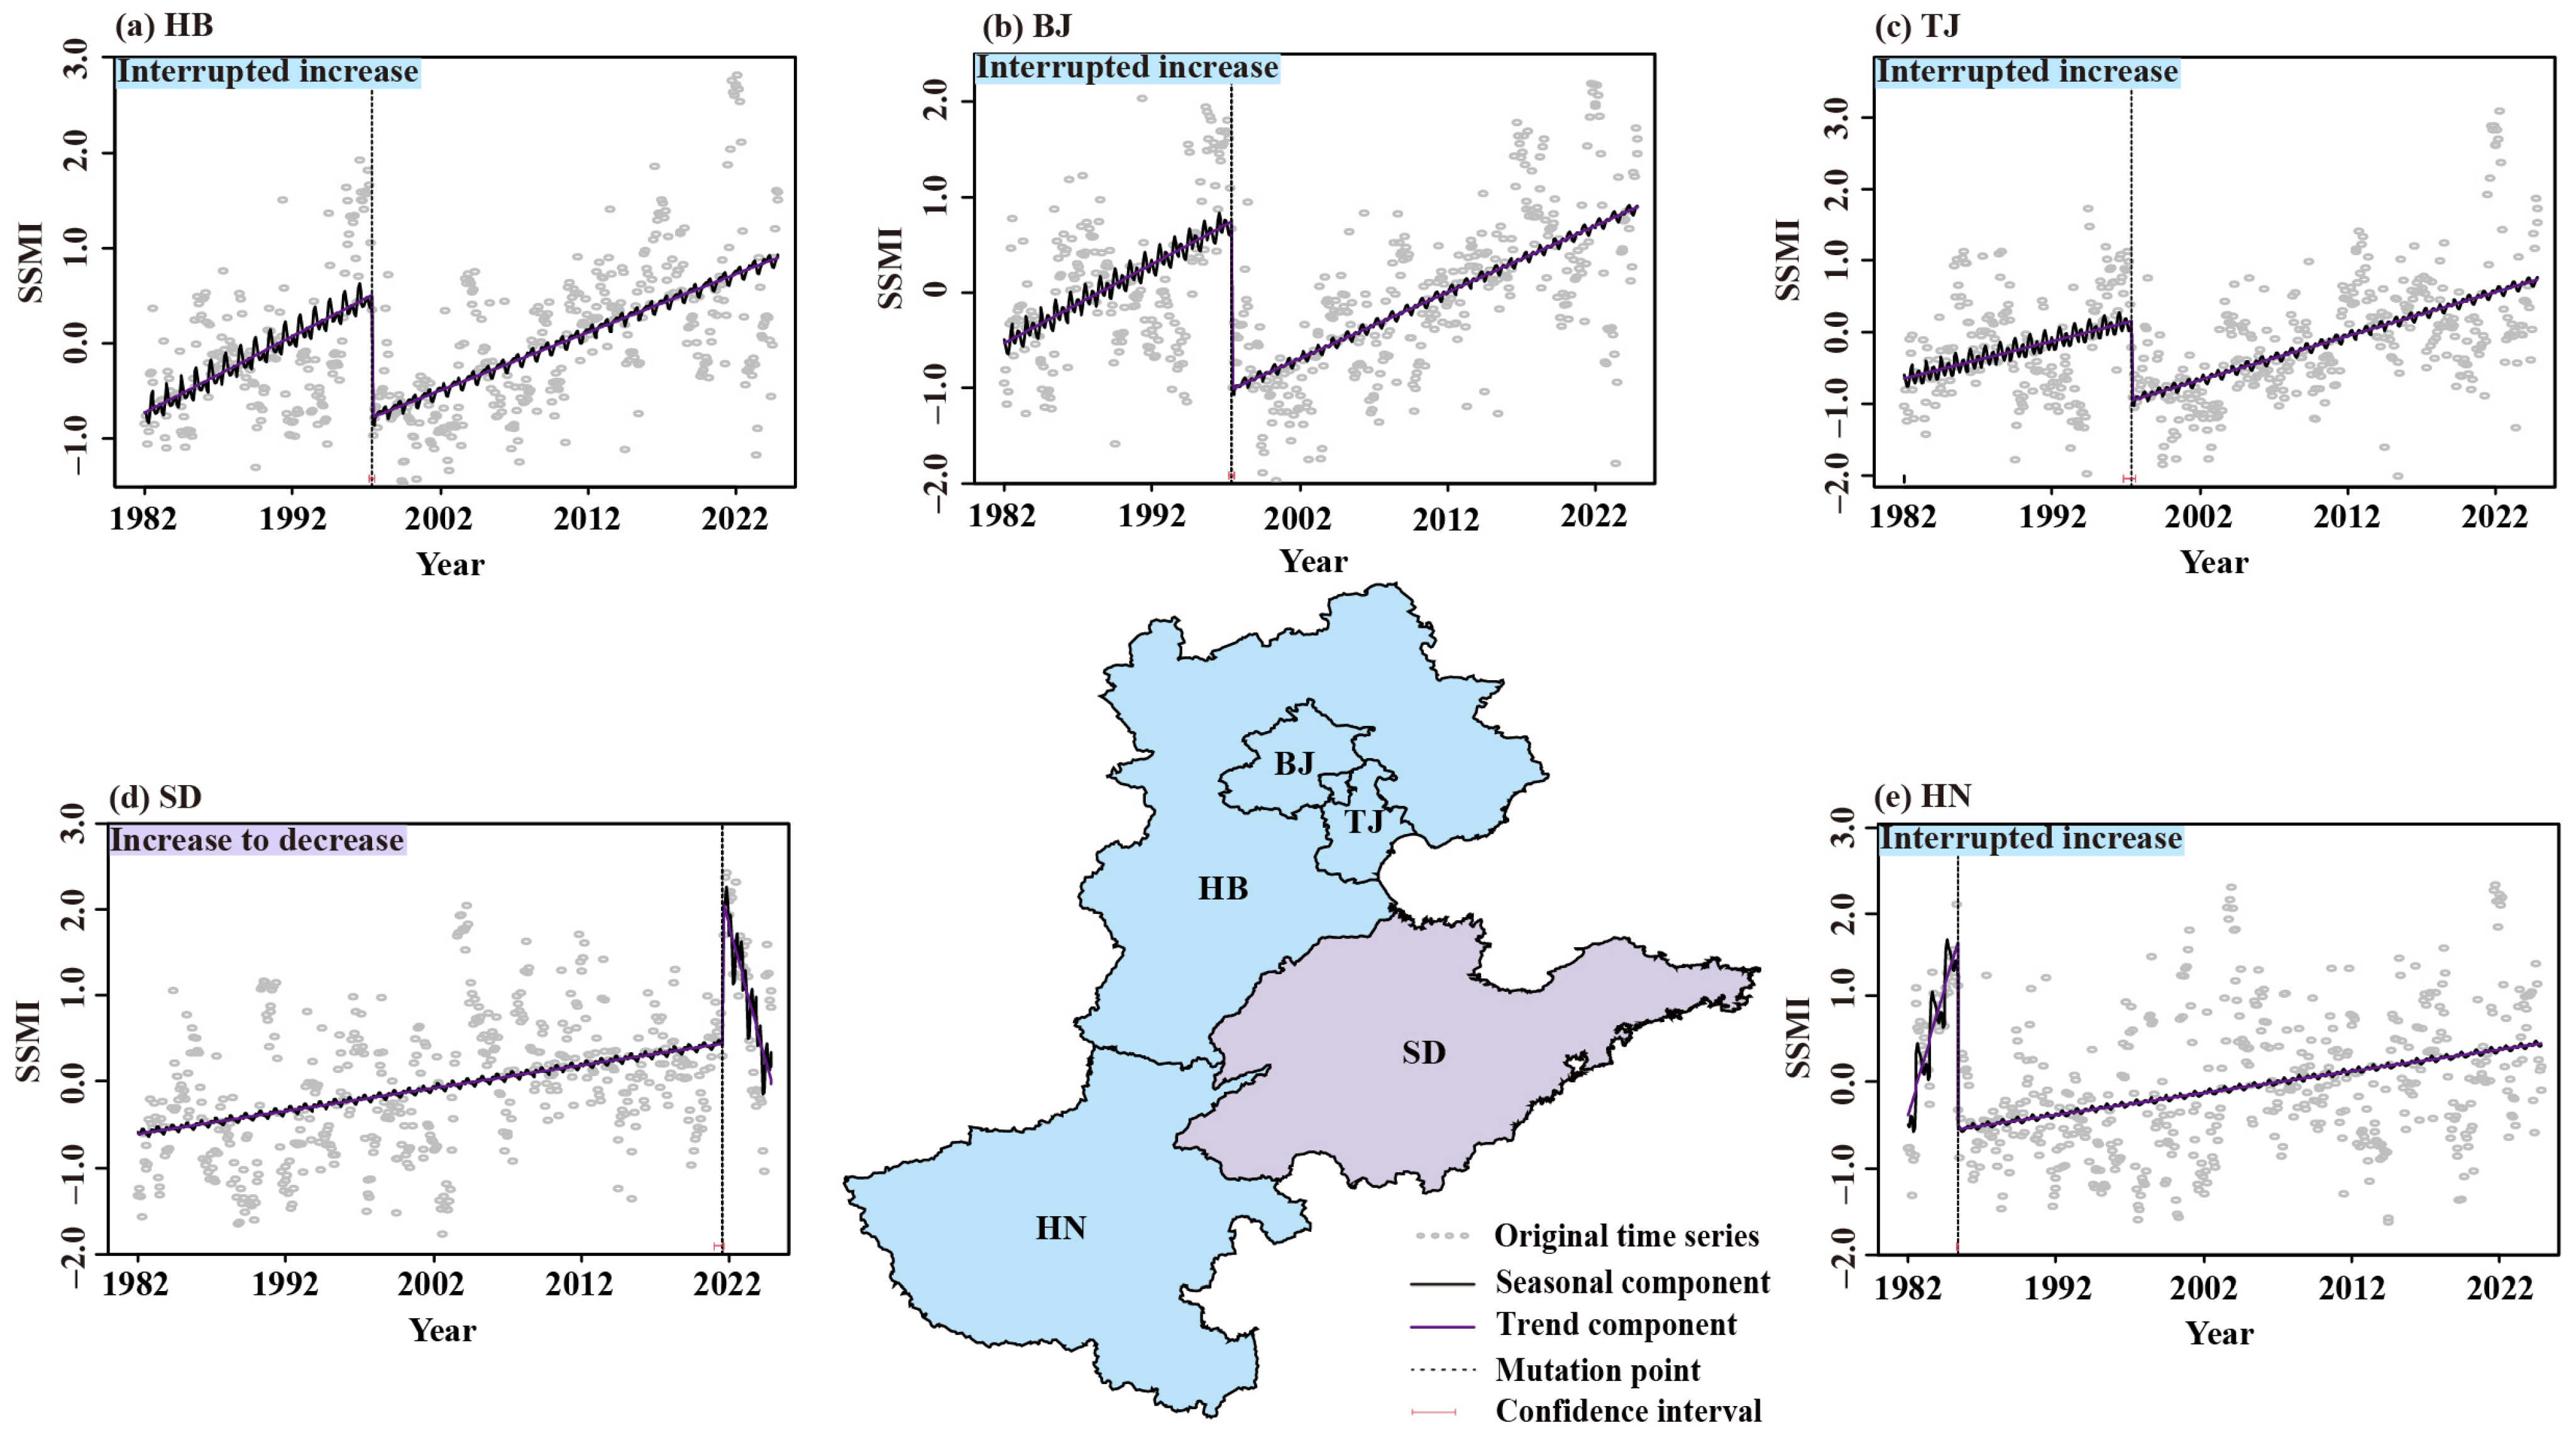
Figure 7 depicts the decomposition results of the monthly SSMI time series from 1982 to 2024 for the NCP. It reveals prominent fluctuations of the original series Yt, with distinct peaks emerging after 2020, reflecting short-term wet–dry oscillations of soil moisture. The seasonal component St presents stable annual periodic fluctuations with an obvious shift around 1995 and diminished amplitude, implying weakened seasonal variation intensity of regional soil moisture. Segmented trend analysis of the trend component Tt identifies a significant abrupt change in 2003 (p < 0.05). The series declined markedly from 1982 to 2002 with a slope of β = −0.012 (p < 0.05), indicating continuous soil drying and notable drought intensification across the plain. By contrast, a significant upward trend occurred during 2003–2024 with a slope of β = 0.021 (p < 0.05), demonstrating steady soil moisture recovery and substantial alleviation of drought tendency. No systematic deviation is observed in the residual component et, verifying reliable decomposition and effective separation of trend, seasonal and random fluctuation components. Abrupt change detection of provincial SSMI series (Figure 8) shows evident regional discrepancies. At the 95% confidence level, breakpoints of BJ, TJ and HB concentrate around 1997 with synchronous mutation timing and narrow confidence intervals, reflecting coordinated impacts of regional climate variation and human intervention. HN witnesses the earliest abrupt change in May 1985 with a merely 2-month confidence interval, suggesting an extremely pronounced mutation signal. SD has the latest breakpoint in July 2021, after which the trend shifts from rising to falling accompanied by rebounding drought risk. Combined with spatial distribution and segmented trend outcomes (Figure 9), HB, BJ, TJ and HN follow an interrupted upward pattern, while SD exhibits a trend transition from ascent to descent.
Figure 7.
Decomposition results of monthly SSMI time series in the NCP using the BFAST method. (a) The original series Yt, (b) seasonal component St, (c) trend component Tt, and (d) residual component et.
Figure 8.
Breakpoint time distribution of SSMI in the NCP and its sub-regions detected by BFAST.
Figure 9.
Decomposition results of SSMI time series in the sub-regions of the NCP using the BFAST method.
3.4. Driver Factor Identification of SSMI Based on Wavelet Analysis
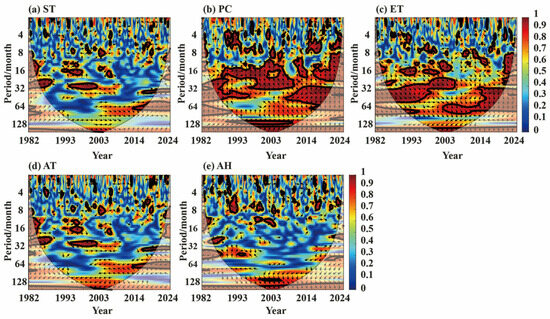
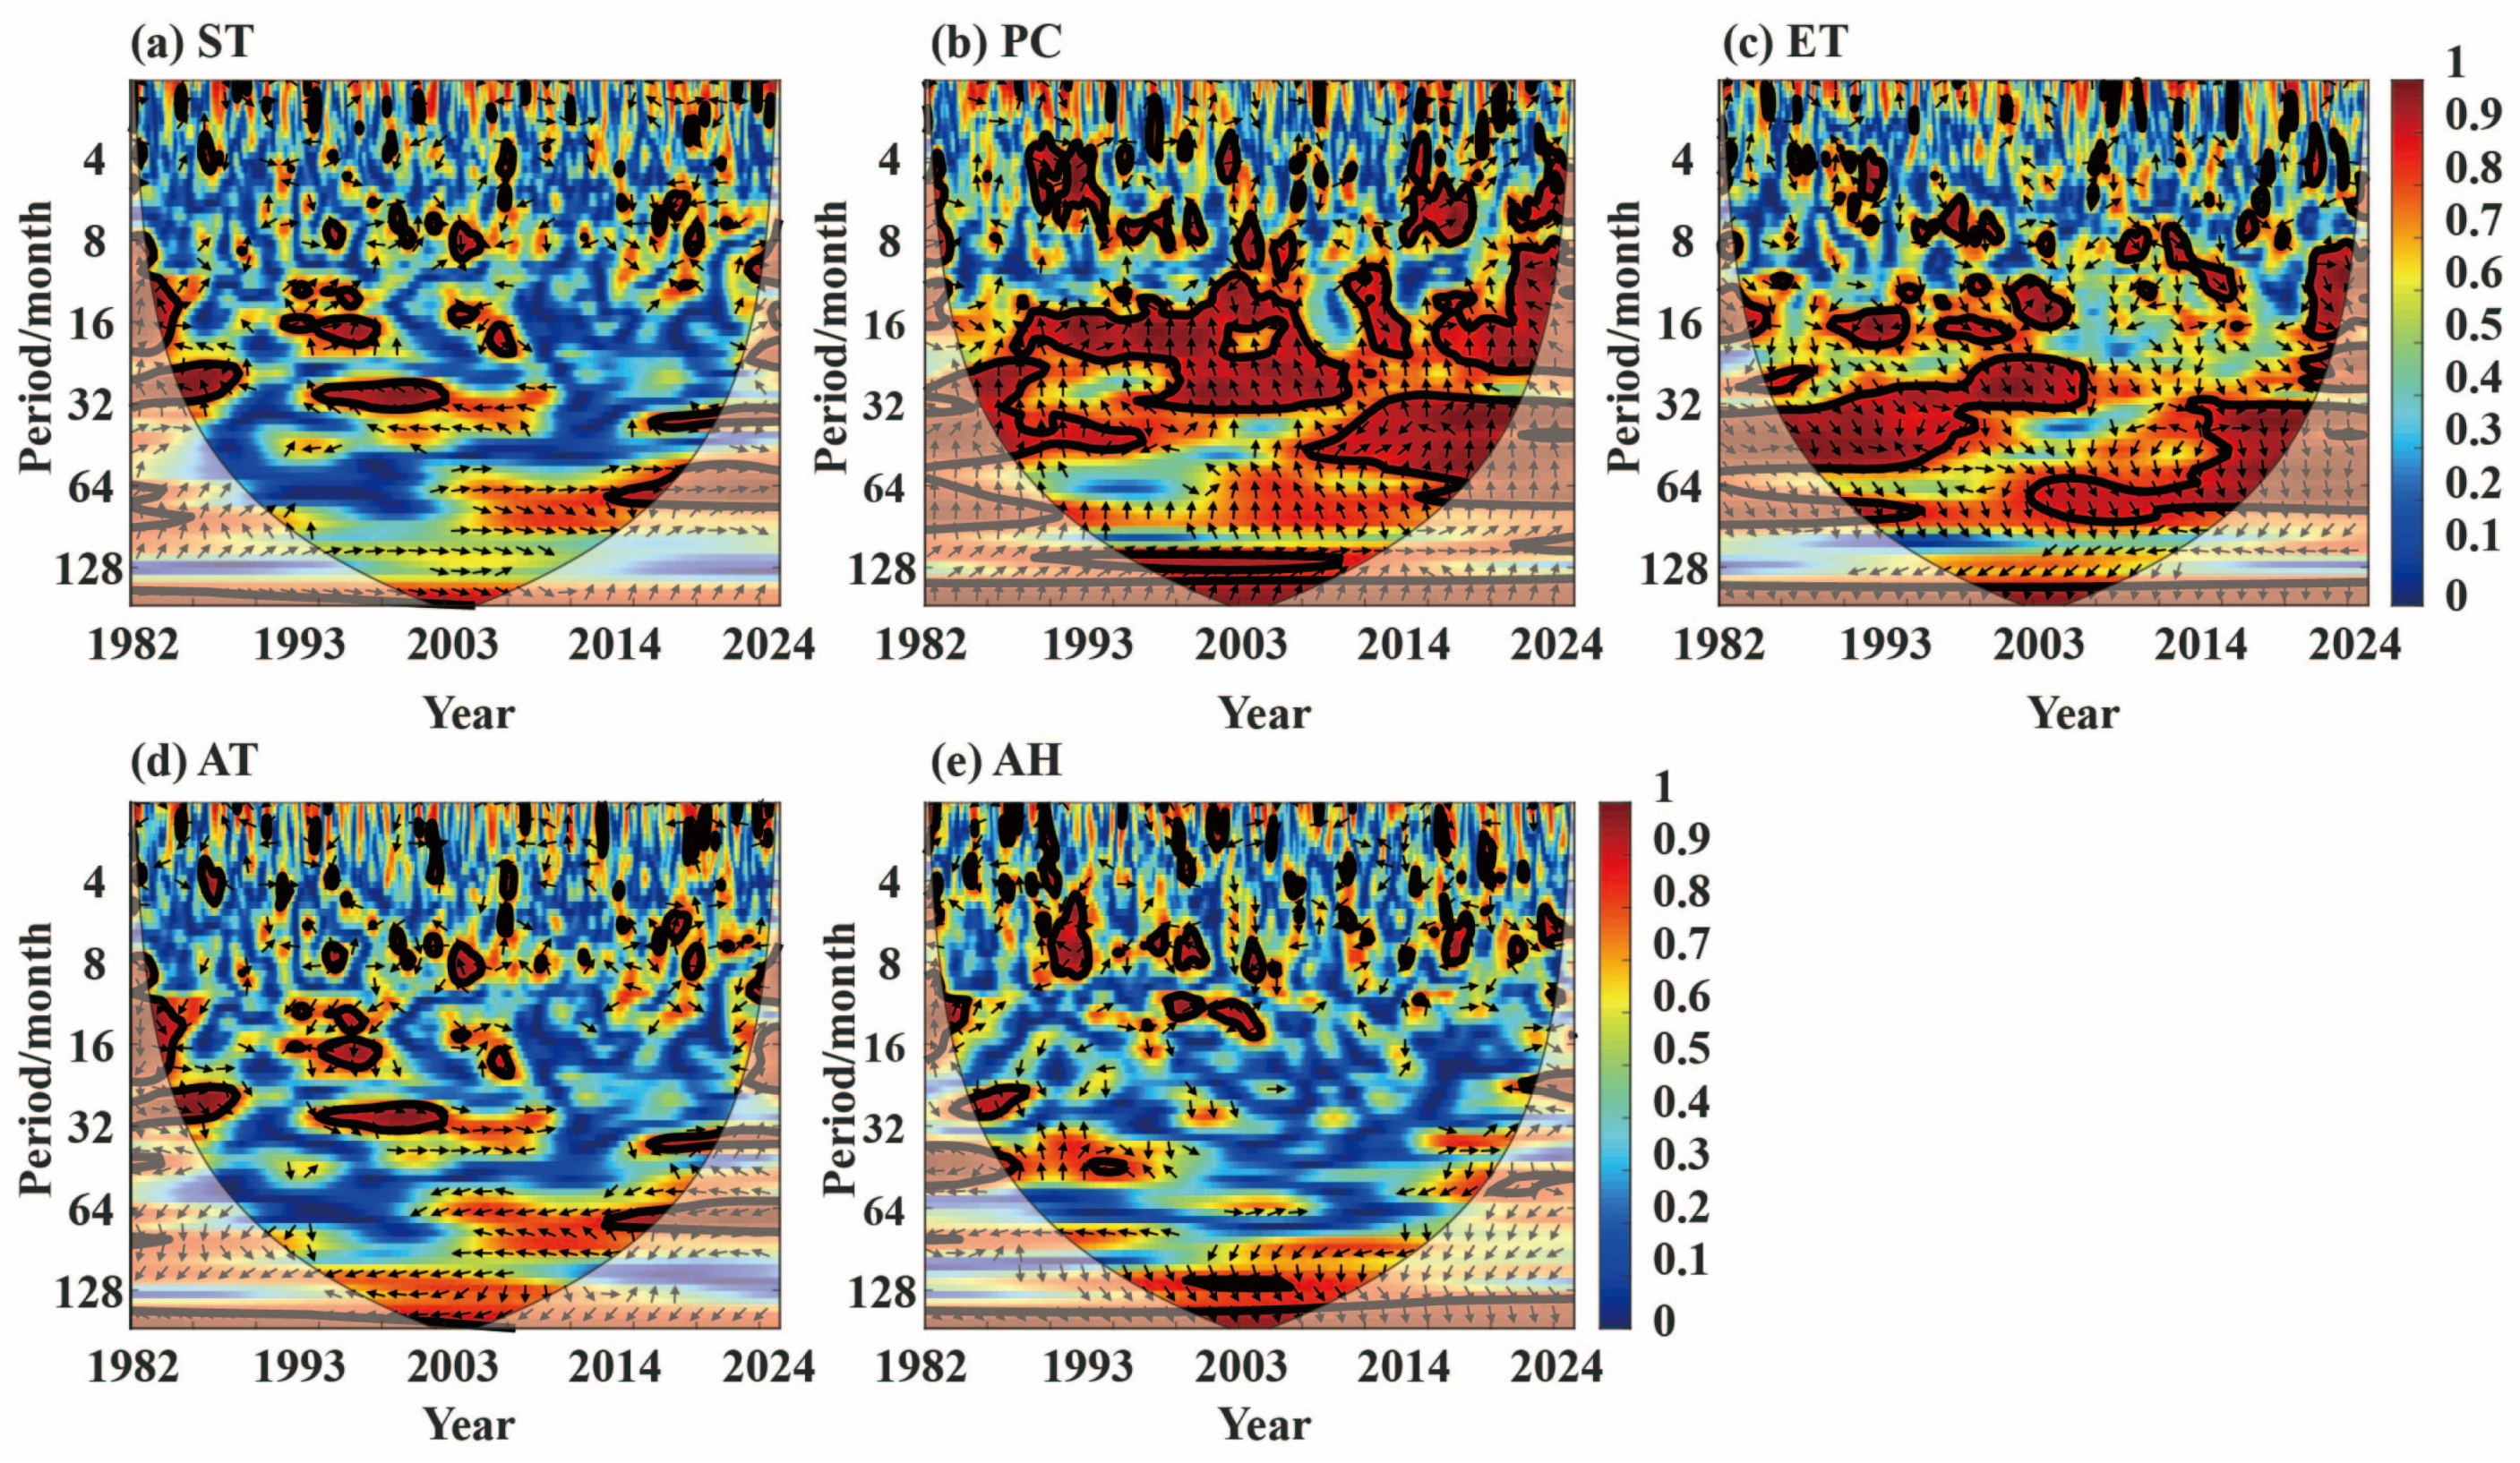
As shown in Figure 10, selected driving factors include ST, PC, ET, AT and AH to characterize the impacts of climatic and hydrological variables on drought evolution. Time scales are classified into three categories: small scale (<8 months), medium scale (8–32 months) and large scale (>32 months). Color gradients in the wavelet coherence spectrum denote coherence energy between SSMI and influencing factors, with lighter colors reflecting stronger correlation. The thin solid line outlines the cone of influence (COI), where results outside this range are statistically unreliable due to boundary effects. Thick solid lines mark areas passing the 95% significance test, indicating notable coherent correlations. All variables yield average wavelet coherence (AWC) values above 0.92, revealing strong coupling relationships (Table 2). PC achieves the highest proportion of significant power (POSP) of 32.04%, demonstrating natural water status dominates drought variation in the study area. Phase arrows indicate distinct response patterns. AT and ET show anti-phase variations, and rising AT and intensified ET aggravate drought conditions. PC and AH are mostly positively correlated with SSMI, with occasional phase reversal in short cycles, suggesting hysteresis effects in drought mitigation.
Figure 10.
Wavelet coherence analysis of time-frequency correlation between SSMI and its influencing factors in the NCP.
Table 2.
Average wavelet coherence (AWC) and proportion of significant power (POSP) values of SSMI and climate factors at different time-frequency scales.
3.5. The Impact of Circulation Factors on Drought
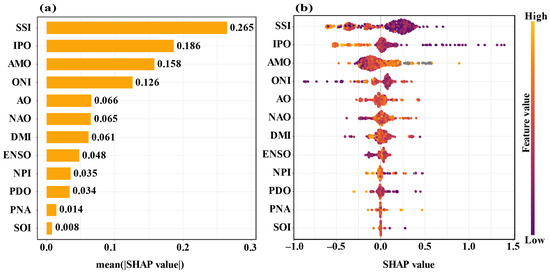
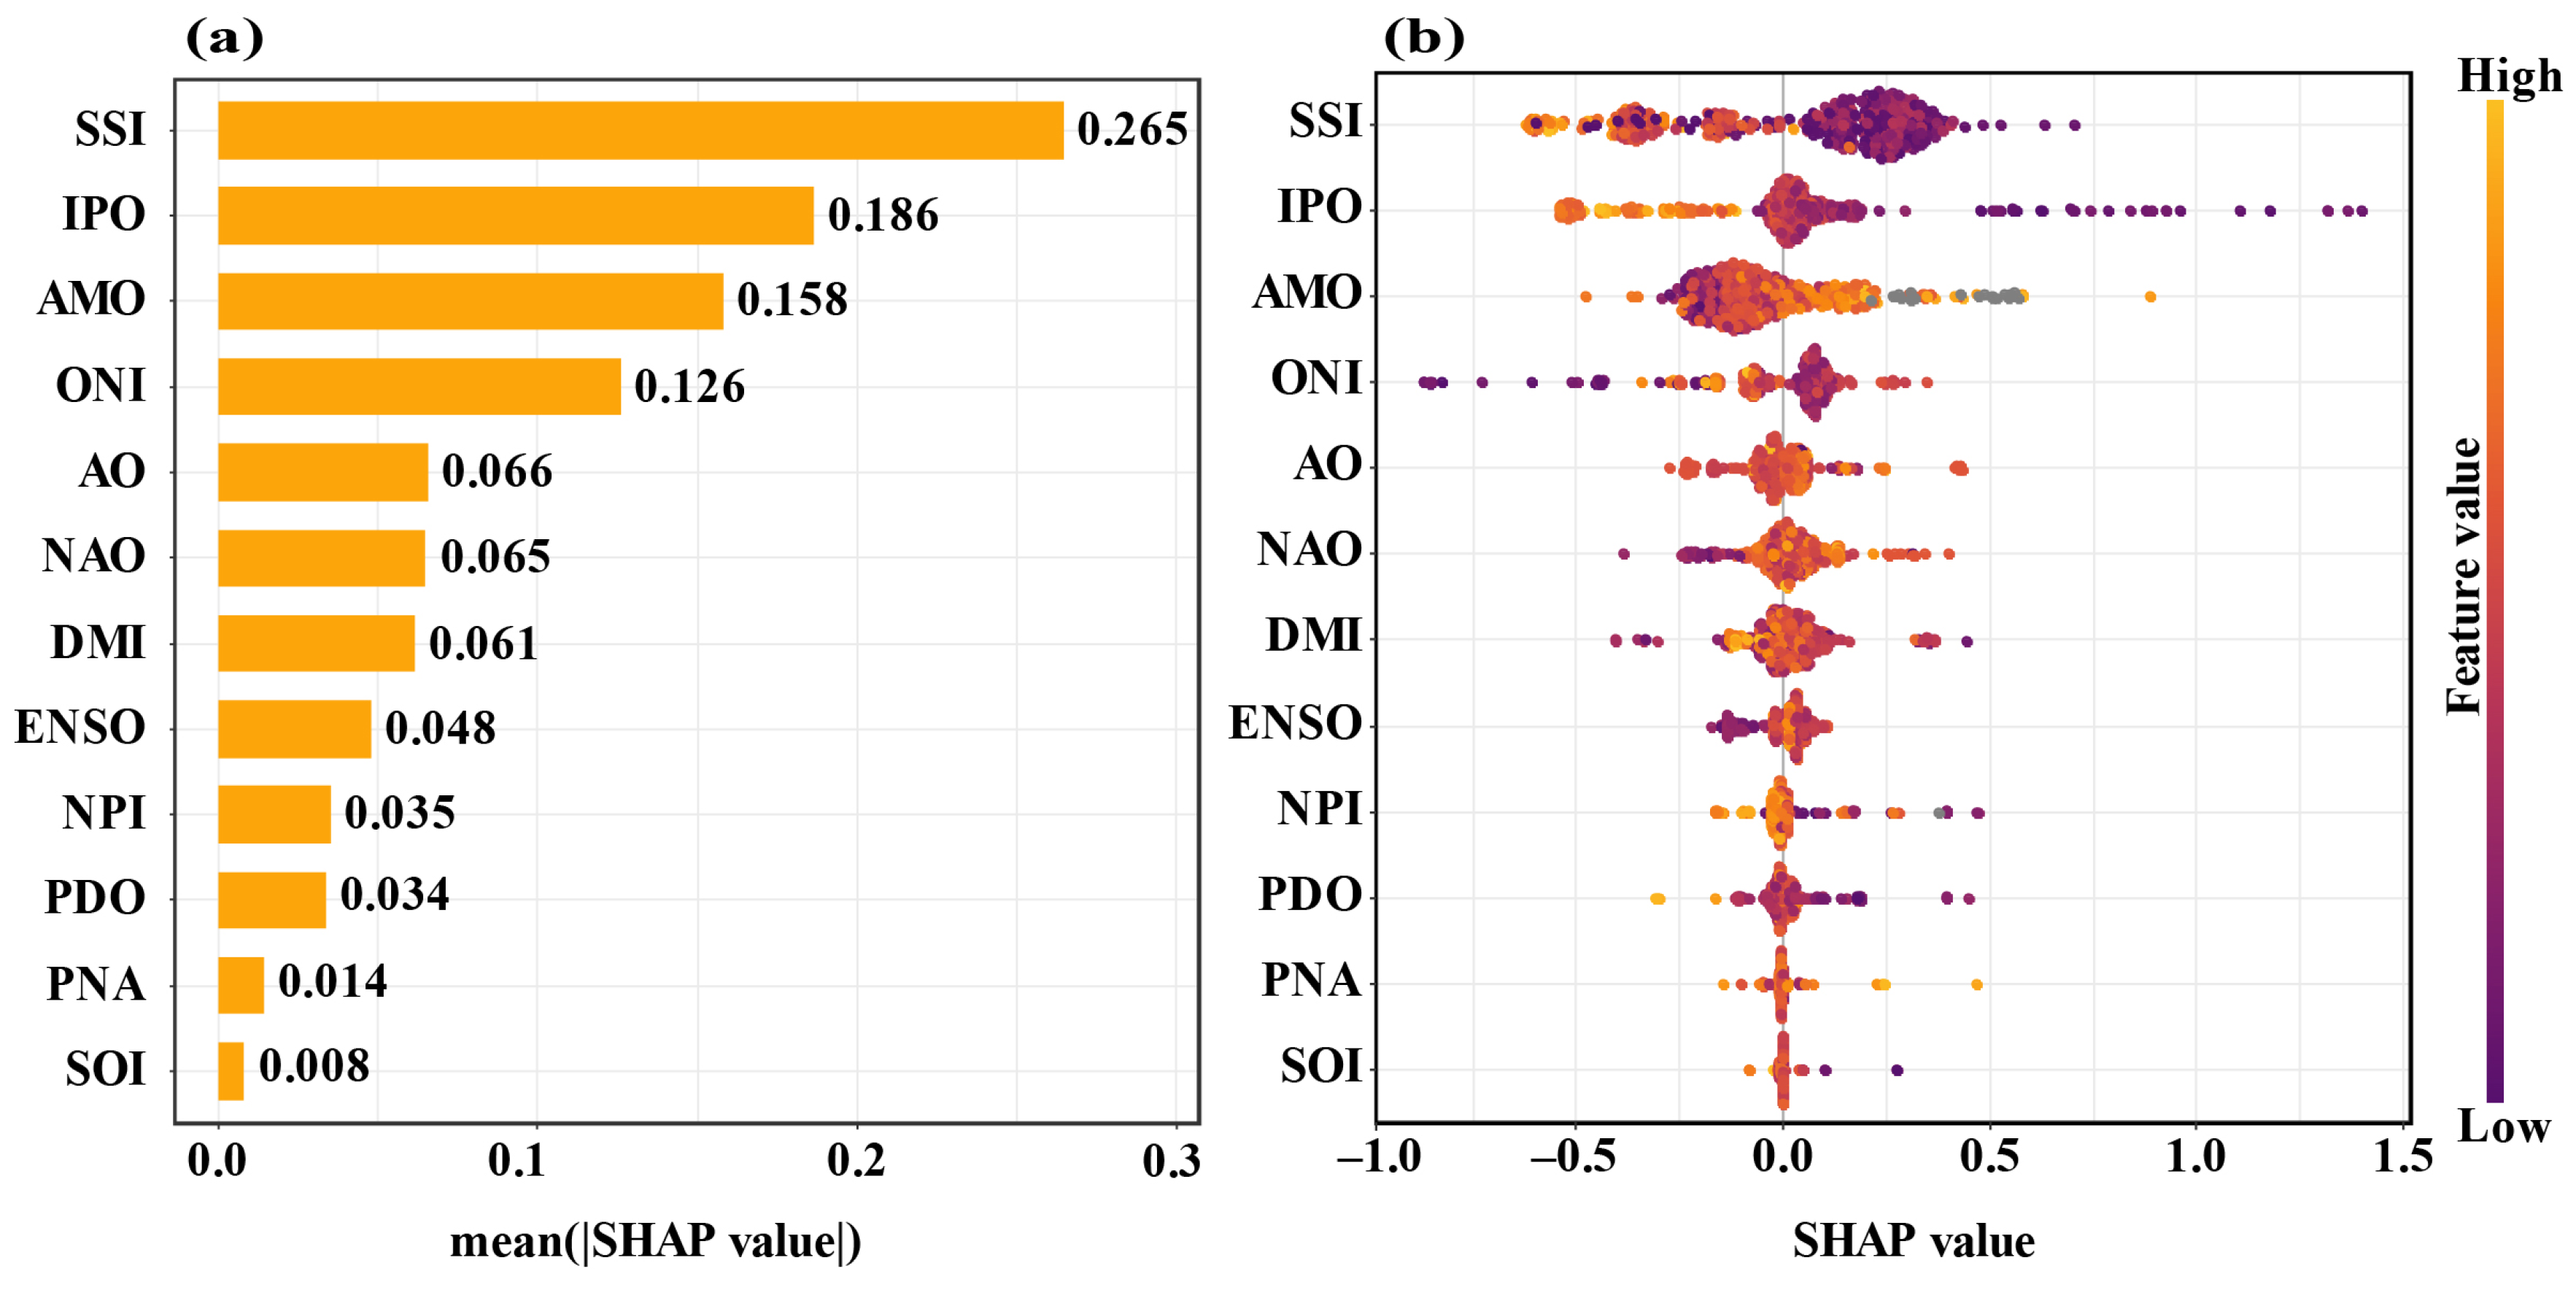
To quantify the contribution and nonlinear effects of atmospheric circulation factors on drought evolution, the SHAP method was adopted to analyze correlations between drought index and twelve major circulation indices including SSI, IPO, AMO, ONI, AO, NAO, DMI, ENSO, NPI, PDO, PNA and SOI (Figure 11). SSI ranked first with an average absolute SHAP value of 0.265, acting as the predominant driving factor. IPO (0.186), AMO (0.158) and ONI (0.126) followed with remarkably higher contributions, forming the core driving group. AO, NAO, DMI and ENSO showed moderate contributions ranging from 0.048 to 0.066. PNA and SOI had the lowest contributions below 0.015, exerting limited direct impacts on drought variation.
Figure 11.
Driving factor importance and influence mechanism of SSMI in the NCP based on SHAP explainable machine learning. (a) The importance ranking of various circulation factors, and (b) the contribution of different circulation factors.
4. Discussion
4.1. Reasons for Changes in Drought
Characterized by temperate monsoon climate, the NCP receives concentrated rainfall in flood seasons. Temperatures rise sharply and potential evapotranspiration surges rapidly from spring to summer [21]. In 2002, abnormally scarce flood-season precipitation and persistent high temperature triggered drastic soil moisture loss. Spring rainfall offset evapotranspiration consumption and only sporadic drought emerged. Summer witnessed peak temperature and evapotranspiration alongside severe precipitation deficit, leading to rapid soil water depletion and widespread drought breakout [16]. The findings verify that extreme soil drought is closely associated with high temperature, intense evapotranspiration and precipitation shortage in summer, and the imbalance between water supply and thermal demand constitutes the primary cause of regional extreme drought [19,30].
Continuous growth of SM effectively mitigated drought tendency. Temporary declining trends were only detected in southern HN, SD and HB in June, consistent with soil water deficit risks in late spring and early summer [13]. BFAST decomposition identified a significant abrupt shift in regional SSMI in 2003. The index declined and drought intensified during 1982–2002, followed by a rising trend and remarkable soil moisture recovery from 2003 to 2024. After 2003, the interdecadal weakening trend of the East Asian summer monsoon was reversed. Water vapor transport from the western Pacific to the NCP was strengthened, and annual total precipitation increased with more balanced seasonal distribution, directly raising regional soil recharge. Noticeable regional divergence existed in breakpoint timing. Breakpoints concentrated around 1997 in the BJ-TJ-HB region. HN experienced the earliest shift in 1985, while SD had the latest mutation in 2021, after which the trend reversed upward to downward with rebounding drought risk. Such inconsistency stemmed from asynchronous turning points among sub-regions. Benefiting from precipitation recovery and early water conservancy construction, HN underwent trend reversal as early as 1985. Driven by groundwater regulation policies, the BJ-TJ-HB region saw trend transition around 1997. The post-2021 descending tendency in SD further reflected regional disparities in drought evolution, which are often concealed in overall integrated analysis. The holistic SSMI trend featured an initial decrease followed by an increase, rather than uniform variations across all subareas. Weak upward growth in each region before 2002 jointly contributed to a slight regional declining trend. Accelerated rising rates in all segments after 2003 eventually turned the overall trend distinctly upward.
Climatic driving analysis revealed strong correlations between SSMI and ST, PC, ET, AT, AH, with AWC values all exceeding 0.92 (Figure 10). AT and ET changed inversely with SSMI, meaning rising AT and intensified ET worsened drought conditions. PC and AH mostly shared in-phase variations with certain hysteresis effects. PC and ET exerted steady and prominent regulatory impacts on drought evolution. ST and AT serve as key energy factors governing surface ET, jointly forming the complete water–heat balance mechanism of drought formation and possessing powerful explanatory capacity [32,55]. PC acts as the primary water replenishment source while ET dominates water consumption. The two factors directly determine soil water budget, thereby producing persistent, stable and statistically significant influences on drought dynamics [56].
Atmospheric circulation analysis shows that SSI serves as the primary circulation factor affecting drought in the NCP. As one of the dominant external forcing factors, it modulates atmospheric circulation to trigger or exacerbate regional drought [41,42]. IPO, AMO and ONI regulate East Asian summer monsoon activity and water vapor transport by altering sea surface temperature anomalies over the Pacific and Atlantic Oceans, forming the core oceanic circulation combination driving drought evolution. Cold and warm phases of ENSO and PDO shift rainbelt distribution and exert opposite regulatory effects on drought. Circulation instability peaks during AMO phase transition, substantially raising drought risk. Sufficient soil moisture and land surface cooling effect under high SSI conditions strengthen drought relief induced by El Niño and offset drought aggravation caused by La Niña. It demonstrates that land surface processes play a critical buffering and modulating role in responses to oceanic circulation signals [53].
4.2. Advantages and Limitations
The FLDAS dataset adopted in this study has a spatial resolution of 0.1° × 0.1°. Its fine resolution accurately depicts spatial heterogeneity of soil moisture and regional drought disparities across the NCP. With regular and continuous grid distribution, the dataset provides high-precision basic data for analyzing spatiotemporal drought evolution [39,40]. Multiple approaches including MMK trend test, BFAST break detection, wavelet coherence analysis, and SHAP interpretable machine learning are applied. Multi-scale drought characteristics from monthly, seasonal and interannual variations to long-term trends are comprehensively explored, constructing a systematic methodological framework for drought research. This study quantifies contributions of climatic factors and large-scale circulation indices, which deepens the understanding of drought mechanisms from land–atmosphere interaction and atmospheric circulation perspectives, and improves the physical interpretability of research findings [2].
This study still has several limitations. Firstly, the research focuses on regional overall analysis and fails to fully account for underlying surface heterogeneity such as land use type, soil texture and irrigation intensity. The drought mitigation effects of human activities including farmland irrigation and groundwater exploitation are not quantitatively evaluated, which may bring uncertainties to local drought intensity assessment [3]. Secondly, the analysis is mainly conducted at monthly and seasonal scales. Rapid drought evolution at diurnal and ten-day scales is insufficiently captured, restricting the characterization of short-term variations in extreme drought events [25]. Thirdly, driving factor analysis centers on climatic variables and atmospheric circulation indices. Impacts of anthropogenic hydrological processes including reservoir operation, crop water consumption and water conservancy projects are rarely discussed. The drought evolutionary mechanism under combined natural and human disturbances cannot be fully clarified [41,42].
4.3. Future Prospects
Future research can expand and deepen the current analytical framework. First, combined with long-term observational data and machine learning algorithms, MMK trend test and BFAST mutation analysis can be optimized to improve the identification accuracy of drought trends and abrupt changes, especially under future climate change scenarios. Second, wavelet coherence analysis can be extended to broader time scales and more environmental factors to explore multi-scale correlations and lag responses between drought and climate systems [57]. In the future follow-up work, we will also integrate long-term irrigation spatial datasets to generate irrigation distribution maps for deeper drought spatial comparative analysis. Finally, the SHAP interpretable machine learning method will be adopted to quantify nonlinear impacts and interactive driving effects of human activities (such as groundwater exploitation intensity, ecological water diversion volume, vegetation coverage, and irrigation area) and large-scale circulation [58]. The relevant findings can provide scientific references for drought early warning, risk assessment and integrated water resources management across the NCP. Variations in root-system parameters—such as rooting depth, density and water uptake efficiency—directly alter soil water extraction patterns, which can provide the essential physiological basis for understanding how these differences propagate into and significantly modify SSMI values [59]. In future works, when applying our research conclusions to farmland irrigation regulation and drought risk prevention, agricultural managers must fully consider regional differences in crop varieties and root distribution to guarantee the credibility and applicability of drought monitoring results.
5. Conclusions
Taking SSMI as a core drought indicator, this study systematically investigated the spatiotemporal evolution, abrupt changes and driving mechanisms of soil drought in the NCP from 1982 to 2024. The typical drought in 2002 was explored, and regional drought characteristics and dominant controlling mechanisms were clarified. The main conclusions are drawn as follows:
- (1)
- The proportion of drought-affected areas presented a unimodal pattern in 2002. Drought coverage expanded rapidly from May to July and peaked during August to October, with the maximum ratio reaching 77.6% in September. On the long-term scale, SSMI generally increased, indicating continuous alleviation of drought tendency.
- (2)
- BFAST mutation analysis identified a significant regional abrupt shift in 2003. Drought intensified from 1982 to 2002, while soil moisture recovered remarkably after 2003. Breakpoint timing varied substantially among sub-regions.
- (3)
- Wavelet coherence analysis revealed coupling strength above 0.92 between SSMI and all climatic factors. Furthermore, PC acted as the primary influencing factor in the NCP.
- (4)
- SHAP analysis demonstrated that SSI was the leading atmospheric circulation driving factor, and IPO, AMO and ONI formed the core driving combination. Multiple factors regulated drought evolution through nonlinear interactions, and SSI was negatively correlated with SSMI in the NCP.
Author Contributions
Conceptualization, F.W., J.G. and Z.L.; Methodology, Z.L. and W.L.; Original draft preparation, Z.L., N.L. and F.W.; Validation, B.L.; Software, B.Z.; Funding acquisition, J.G. and F.W. All authors have read and agreed to the published version of the manuscript.
Funding
This research was supported by Open Fund of State Key Laboratory of Spatial Datum (grant number SKLGIE2024-Z-4-1), Independent Research Project of State Key Laboratory of Spatial Datum (grant number SKLGIE2024-ZZ-8), Open Foundation of National Cryosphere Desert Data Center (grant number 2025NCDC002), and Joint Fund of Collaborative Innovation Center of Geo-Information Technology for Smart Central Plains, Henan Province and Key Laboratory of Spatiotemporal Perception and Intelligent Processing, Ministry of Natural Resources (grant number 231103).
Data Availability Statement
The raw data supporting the conclusions of this article will be made available by the authors on request.
Acknowledgments
Thanks for the help with language editing provided by Kai Feng.
Conflicts of Interest
The authors declare that the research was conducted in the absence of any commercial or financial relationships that could be construed as a potential conflict of interest.
References
- Li, R.; Wang, J.A.; Zhao, T.J.; Shi, J.C. Index-based evaluation of vegetation response to meteorological drought in Northern China. Nat. Hazards 2016, 84, 2179–2193. [Google Scholar] [CrossRef] [Scilit]
- Zhang, Q.; Wang, S.P.; Yue, P.; Wang, J.S. Drought onset acceleration in Northern China and its drivers. Atmos. Res. 2026, 340, 109078. [Google Scholar] [CrossRef] [Scilit]
- Cui, Y.Q.; Zhang, B.; Huang, H.; Zeng, J.J.; Wang, X.D.; Jiao, W.H. Spatiotemporal Characteristics of Drought in the North China Plain over the Past 58 Years. Atmosphere 2021, 12, 844. [Google Scholar] [CrossRef] [Scilit]
- Ding, Y.D.; Lv, H.S.; Zhu, Y.H.; Yagci, A.L.; Gou, Q.Q.; Su, J.B.; Cheng, J.X.; Yao, Y.L.; Liu, W.; Liu, J.Y. Three-dimensional identification and attribution of flash and slow agricultural droughts in the North China Plain. J. Hydrol. 2026, 668, 135030. [Google Scholar] [CrossRef] [Scilit]
- Benjamin, D.; Por, H.; Budescu, D. Climate Change Versus Global Warming: Who Is Susceptible to the Framing of Climate Change? Environ. Behav. 2017, 49, 745–770. [Google Scholar]
- Mourad, K.A. A Water Compact for Sustainable Water Management. Sustainability 2020, 12, 7339. [Google Scholar] [CrossRef] [Scilit]
- Hao, Y.; Yuan, X.; Zhang, M. Enhanced relationship between seasonal soil moisture droughts and vegetation under climate change over China. Agric. For. Meteorol. 2024, 358, 110258. [Google Scholar] [CrossRef] [Scilit]
- Roscoe, P. Method, Measurement, and Management in IPCC Climate Modeling. Hum. Ecol. 2016, 44, 655–664. [Google Scholar] [CrossRef] [Scilit]
- Liu, X.F.; Pan, Y.Z.; Zhu, X.F.; Yang, T.T.; Bai, J.J.; Sun, Z.L. Drought evolution and its impact on the crop yield in the North China Plain. J. Hydrol. 2018, 564, 984–996. [Google Scholar] [CrossRef] [Scilit]
- Bai, S.S.; Kang, Y.H.; Wan, S.Q. Drip fertigation regimes for winter wheat in the North China Plain. Agric. Water Manag. 2020, 228, 105885. [Google Scholar] [CrossRef] [Scilit]
- Zhai, L.C.; Lü, L.H.; Dong, Z.Q.; Zhang, L.H.; Zhang, J.T.; Jia, X.L.; Zhang, Z.B. The water-saving potential of using micro-sprinkling irrigation for winter wheat production on the North China Plain. J. Integr. Agric. 2021, 20, 1687–1700. [Google Scholar] [CrossRef] [Scilit]
- Liu, J.M.; Si, Z.Y.; Li, S.; Hamani, A.K.M.; Zhang, Y.Y.; Wu, L.F.; Gao, Y.; Duan, A.W. Variations in water sources used by winter wheat across distinct rainfall years in the North China Plain. J. Hydrol. 2023, 618, 129186. [Google Scholar] [CrossRef] [Scilit]
- Yang, C.; Liu, C.; Wang, Y.; Gu, Y.; Ma, X. Assessment of the spatiotemporal evolution and driving forces of meteorological drought in the North China Plain. Int. J. Climatol. 2023, 43, 7883–7898. [Google Scholar] [CrossRef] [Scilit]
- Wu, L.; Feng, J.; Miao, W. Simulating the impacts of irrigation and dynamic vegetation over the North China Plain on regional climate. J. Geophys. Res. Atmos. 2018, 123, 8017–8034. [Google Scholar] [CrossRef] [Scilit]
- Zhang, L.; Chu, Q.Q.; Jiang, Y.L.; Chen, F.; Lei, Y.D. Impacts of climate change on drought risk of winter wheat in the North China Plain. J. Integr. Agric. 2021, 20, 2601–2612. [Google Scholar] [CrossRef] [Scilit]
- Zhao, A.Z.; Xiang, K.Z.; Zhang, A.B.; Zhang, X.R. Spatial-temporal evolution of meteorological and groundwater droughts and their relationship in the North China Plain. J. Hydrol. 2022, 610, 127903. [Google Scholar] [CrossRef] [Scilit]
- Yuan, T.G.; Tai, A.P.K.; Mao, J.; Tam, O.H.F.; Li, R.K.K.; Wu, J.; Li, S. Effects of different irrigation methods on regional climate in North China Plain: A modeling study. Agric. For. Meteorol. 2023, 342, 109728. [Google Scholar] [CrossRef] [Scilit]
- Cui, Y.Q.; Zhang, B.; Huang, H.; Wang, X.D.; Zeng, J.J.; Jiao, W.H.; Yao, R.P. Identification of Seasonal Sub-Regions of the Drought in the North China Plain. Water 2020, 12, 3447. [Google Scholar] [CrossRef] [Scilit]
- Li, Q.; Liu, Y.; Luo, L.; Wang, Y.; Wang, Q.; Ma, M. Spatiotemporal drought characteristics during growing seasons of the winter wheat and summer maize in the North China Plain. Front. Earth Sci. 2024, 11, 1358987. [Google Scholar] [CrossRef] [Scilit]
- Li, S.; Guo, J.; Zhang, X.; Tong, B.; Su, T.; Wei, J.; Li, Z. Preference of afternoon precipitation over dry soil in the North China Plain during warm seasons. J. Geophys. Res. Atmos. 2024, 129, e2023JD040641. [Google Scholar] [CrossRef] [Scilit]
- Huang, S.F.; Zhang, Q.; Dai, S.Y. Identification of regional agricultural drought in the North China Plain and its attribution factors. Eur. J. Agron. 2026, 174, 127930. [Google Scholar] [CrossRef] [Scilit]
- Liu, X.F.; Zhu, X.F.; Pan, Y.Z.; Bai, J.J.; Li, S.S. Performance of different drought indices for agriculture drought in the North China Plain. J. Arid Land 2018, 10, 507–516. [Google Scholar] [CrossRef] [Scilit]
- Hasan, H.H.; Mohd Razali, S.F.; Muhammad, N.S.; Ahmad, A. Research trends of hydrological drought: A systematic review. Water 2019, 11, 2252. [Google Scholar] [CrossRef] [Scilit]
- Wei, W.; Liu, Z.; Li, K.J.; Wang, G.M.; Wu, H.Q.; Wang, Q.Y. Drought monitoring of the maize planting areas in Northeast and North China Plain. Agric. Water Manag. 2021, 245, 106636. [Google Scholar] [CrossRef] [Scilit]
- Yao, Y.; Liu, Y.; Zhou, S.; Song, J.; Fu, B. Soil moisture determines the recovery time of ecosystems from drought. Glob. Change Biol. 2023, 29, 3562–3574. [Google Scholar] [CrossRef] [Scilit]
- Kleanthis, K.; Karathanassi, V. Soil moisture estimation from Sentinel-1 interferometric observations over arid regions. Comput. Geosci. 2023, 178, 105410. [Google Scholar] [CrossRef] [Scilit]
- Bal, S.K.; Shivaramu, H.S.; Vijaya Kumar, P.; Lingaraj, H.; Sandeep, V.M.; Subba Rao, A.V.M.; Sarath Chandran, M.A.; Manikandan, N.; Thimmegowda, M.N.; Manjunatha, M.H.; et al. Re-evaluating soil moisture-based drought criteria for rainfed crops in peninsular India. Front. Environ. Sci. 2024, 12, 1319912. [Google Scholar] [CrossRef] [Scilit]
- Abebe, A.K.; Zhou, X.; Lv, T.T.; Tao, Z.; Bayissa, Y.; Zhang, H.M.; Elnashar, A. Advancing basin-scale drought monitoring: Development of a regional combined drought index using precipitation, soil moisture, and vegetation data. Agric. Water Manag. 2025, 318, 109734. [Google Scholar] [CrossRef] [Scilit]
- Xiong, Z.H.; Zhang, Z.C.; Gui, H.L.; Chen, X.Y.; Hu, S.; Gao, L. A Meteorology-Driven Transformer Network to Predict Soil Moisture for Agriculture Drought Forecasting. IEEE Trans. Geosci. Remote Sens. 2025, 63, 4405818. [Google Scholar] [CrossRef] [Scilit]
- Chen, N.C.; Li, R.H.; Zhang, X.; Yang, C.; Wang, X.P.; Zeng, L.L.; Tang, S.J.; Wang, W.; Li, D.R.; Niyogi, D. Drought propagation in Northern China Plain: A comparative analysis of GLDAS and MERRA-2 datasets. J. Hydrol. 2020, 588, 125026. [Google Scholar] [CrossRef] [Scilit]
- Luan, Q.H.; Gu, P.C.; Sun, Q.Y.; Lai, B.; Zhou, Y.L.; Weng, B.S. Agricultural drought evaluation based on a soil moisture index coupled hydrological model in North China Plain. Ecol. Indic. 2024, 166, 112473. [Google Scholar] [CrossRef] [Scilit]
- Wang, F.; Wang, Z.M.; Yang, H.B.; Di, D.Y.; Zhao, Y.; Liang, Q.H. Utilizing GRACE-based groundwater drought index for drought characterization and teleconnection factors analysis in the North China Plain. J. Hydrol. 2020, 585, 124849. [Google Scholar] [CrossRef] [Scilit]
- Wang, J.; Yang, Y.; Huang, J. Adaptive irrigation measures in response to extreme weather events: Empirical evidence from the North China plain. Reg. Environ. Change 2019, 19, 1009–1022. [Google Scholar] [CrossRef] [Scilit]
- Li, Y.J.; Zhong, X.T.; Gong, H.L.; Hen, B.B.; Zhou, C.F.; Li, H.; Wang, X.C.; Xu, L.W. Spatiotemporal evolution and attribution analysis of groundwater drought in the North China Plain: GGDI constructed based on downscaled GRACE GWSA. J. Hydrol.-Reg. Stud. 2026, 63, 103103. [Google Scholar] [CrossRef] [Scilit]
- Wang, Z.B.; Chen, J.; Tong, W.J. Impacts of climate change and varietal replacement on winter wheat phenology in the North China Plain. Int. J. Plant Prod. 2018, 12, 251–263. [Google Scholar] [CrossRef] [Scilit]
- Hu, X.; Cai, X.; Wang, X.; Song, Y.; Wang, X.; Kang, L.; Zhang, H. Surface wind climates in the North China Plain: Implications for air quality. Int. J. Climatol. 2022, 42, 10322–10336. [Google Scholar] [CrossRef] [Scilit]
- Peng, H.R.; Zhang, Y.; Nan, T.G.; Yang, X.L.; Pacenka, S.; Steenhuis, T.S.; Niu, J. Climate change impacts on spatiotemporal variability of soybean water demands in North China Plain. Agric. Water Manag. 2025, 310, 109381. [Google Scholar] [CrossRef] [Scilit]
- Guo, X.; Yang, W.Q.; Yue, Y.J. Quantifying the relative impacts of climate change and urbanization on maize production on the North China Plain. J. Agric. Food Res. 2026, 25, 102592. [Google Scholar] [CrossRef] [Scilit]
- Luo, W.R.; Guo, J.Z.; Li, Z.W.; Li, N.; Wang, F.; Lai, H.X.; Men, R.Y.; Li, R.; Du, M.T.; Feng, K.; et al. Temporal and Spatial Changes in Soil Drought and Identification of Remote Correlation Effects. Agriculture 2025, 15, 2603. [Google Scholar] [CrossRef] [Scilit]
- Albarakat, R.; Le, M.H.; Lakshmi, V. Assessment of drought conditions over Iraqi transboundary rivers using FLDAS and sat ellite datasets. J. Hydrol.-Reg. Stud. 2022, 41, 101075. [Google Scholar] [CrossRef] [Scilit]
- Hamal, K.; Sharma, S.; Pokharel, B.; Shrestha, D.; Talchabhadel, R.; Shrestha, A.; Khadka, N. Changing pattern of drought in Nepal and associated atmospheric circulation. Atmos. Res. 2021, 262, 105798. [Google Scholar] [CrossRef] [Scilit]
- Wałęga, A.; Cebulska, M.; Ziernicka-Wojtaszek, A.; Młocek, W.; Wałęga, A.; Nieróbca, A.; Caloiero, T. Spatial and temporal variability of meteorological droughts including atmospheric circulation in Central Europe. J. Hydrol. 2024, 642, 131857. [Google Scholar] [CrossRef] [Scilit]
- Manzano, A.; Clemente, M.A.; Morata, A.; Luna, M.Y.; Beguería, S.; Vicente-Serrano, S.M.; Martín, M.L. Analysis of the atmospheric circulation pattern effects over SPEI drought index in Spain. Atmos. Res. 2019, 230, 104630. [Google Scholar] [CrossRef] [Scilit]
- Li, L.S.; Zhao, L.L.; Li, Y.B. Spatiotemporal Characteristics of Meteorological and Agricultural Droughts in China: Change Patterns and Causes. Agriculture 2023, 13, 265. [Google Scholar] [CrossRef] [Scilit]
- Madane, D.A.; Waghaye, A.M. Spatio-temporal variations of rainfall using innovative trend analysis during 1951–2021 in Punjab State, India. Theor. Appl. Climatol. 2023, 153, 923–945. [Google Scholar] [CrossRef] [Scilit]
- Mendes, M.P.; Rodriguez-Galiano, V.; Aragones, D. Evaluating the BFAST method to detect and characterise changing trends in water time series: A case study on the impact of droughts on the Mediterranean climate. Sci. Total Environ. 2022, 846, 157428. [Google Scholar] [CrossRef] [Scilit] [PubMed]
- Gao, Y.; Solórzano, J.V.; Quevedo, A.; Loya-Carrillo, J.O. How BFAST Trend and Seasonal Model Components Affect Disturbance Detection in Tropical Dry Forest and Temperate Forest. Remote Sens. 2021, 13, 2033. [Google Scholar] [CrossRef] [Scilit]
- Masiliūnas, D.; Tsendbazar, N.E.; Herold, M.; Verbesselt, J. BFAST Lite: A Lightweight Break Detection Method for Time Series Analysis. Remote Sens. 2021, 13, 3308. [Google Scholar] [CrossRef] [Scilit]
- Peng, Y.; Peng, T.; Li, Y. Spatiotemporal Characteristics of Drought in Northwest China Based on SPEI Analysis. Atmosphere 2023, 14, 1188. [Google Scholar] [CrossRef] [Scilit]
- Zhang, Q.; Lu, W.; Chen, S. Using multifractal and wavelet analyses to determine drought characteristics: A case study of Jilin province, China. Theor. Appl. Climatol. 2016, 125, 829–840. [Google Scholar] [CrossRef] [Scilit]
- Yerdelen, C.; Abdelkader, M.; Eris, E. Assessment of drought in SPI series using continuous wavelet analysis for Gediz Basin, Turkey. Atmos. Res. 2021, 260, 105687. [Google Scholar] [CrossRef] [Scilit]
- Zhang, B.; Abu Salem, F.K.; Hayes, M.J.; Smith, K.H.; Tadesse, T.; Wardlow, B.D. Explainable machine learning for the prediction and assessment of complex drought impacts. Sci. Total Environ. 2023, 898, 165509. [Google Scholar] [CrossRef] [Scilit] [PubMed]
- Gan, Z.; Xie, X.; Su, C.; Ge, W.; Pan, H.; Yang, L. Understanding the evolutionary processes and causes of groundwater drought using an interpretable machine learning model. Sci. Rep. 2025, 15, 20981. [Google Scholar] [CrossRef] [Scilit] [PubMed]
- Xue, C.; Ghirardelli, A.; Chen, J.; Tarolli, P. Investigating agricultural drought in Northern Italy through explainable Machine Learning: Insights from the 2022 drought. Comput. Electron. Agric. 2024, 227, 109572. [Google Scholar] [CrossRef] [Scilit]
- Nigatu, Z.M.; You, W.; Melesse, A.M. Drought dynamics in the Nile River Basin: Meteorological, agricultural, and groundwater drought propagation. Remote Sens. 2024, 16, 919. [Google Scholar] [CrossRef] [Scilit]
- Singh, S.; Kumar Goyal, M.; Jha, S. Role of large-scale climate oscillations in precipitation extremes associated with atmospheric rivers: Nonstationary framework. Hydrol. Sci. J. 2023, 68, 395–411. [Google Scholar] [CrossRef] [Scilit]
- Hussain, A.; Cao, J.H.; Ali, S.; Ullah, W.; Muhammad, S.; Hussain, I.; Abbas, H.; Hamal, K.; Sharma, S.; Akhtar, M.; et al. Wavelet coherence of monsoon and large-scale climate variabilities with precipitation in Pakistan. Int. J. Climatol. 2022, 42, 9950–9966. [Google Scholar] [CrossRef] [Scilit]
- Xiong, H.X.; Wang, J.H.; Yang, C.; Li, S.Y.; Li, X.B.; Xiong, R.H.; Wang, Y.Z.; Ma, C.M. Critical role of vegetation and human activity indicators in the prediction of shallow groundwater quality distribution in Jianghan Plain with LightGBM algorithm and SHAP analysis. Chemosphere 2025, 376, 144278. [Google Scholar] [CrossRef] [Scilit] [PubMed]
- Středa, T.; Hajzlerová, J.; Alba-Mejía, J.; Jovanović, I.; Frantová, N.; Středová, H. Quo vadis, breeding for an efficient root system, in the era of climate change? Czech J. Genet. Plant Breed. 2024, 60, 181–211. [Google Scholar] [CrossRef] [Scilit]


Disclaimer/Publisher’s Note: The statements, opinions and data contained in all publications are solely those of the individual author(s) and contributor(s) and not of MDPI and/or the editor(s). MDPI and/or the editor(s) disclaim responsibility for any injury to people or property resulting from any ideas, methods, instructions or products referred to in the content. |
© 2026 by the authors. Licensee MDPI, Basel, Switzerland. This article is an open access article distributed under the terms and conditions of the Creative Commons Attribution (CC BY) license.