


Abstract
The beef production chain plays a strategic role in Brazilian and global agri-food systems and faces growing demands for sustainability, transparency, and traceability. Building on official Animal Transit Guide (GTA) records from Mato Grosso do Sul, Brazil, this study examines whether a parsimonious agent-based model (ABM) can generate the main structural signatures of an observed cattle-trade network. The empirical benchmark is a directed and weighted network with 20,827 nodes and 258,120 weighted edges. The ABM represents producers and slaughterhouses as spatial agents connected by trade decisions based on three mechanisms: destination attractiveness, defined as the accumulated pull of a slaughterhouse based on previous simulated throughput; geographic distance, representing spatial friction; and relational memory, representing the tendency to repeat previous commercial ties. Producer choice is formalized through a local utility function that combines attractiveness, distance penalty, and relational memory under capacity, sourcing-radius, and saturation constraints. In the simulated scenarios, the top-five slaughterhouses accounted for 38.49 ± 2.56% of throughput at reduced scale and 14.40 ± 0.65% at intermediate scale, while weighted mean distances were 11.94 ± 0.56 and 9.07 ± 0.39 model units, respectively. The model reproduced, in structural and mechanistic terms, the emergence of dominant hubs, the concentration of flows, and the bounded increase in transaction distance with connectivity around the empirical threshold of kw ≈ 256. Sensitivity analyses indicated that attractiveness increases concentration, distance localizes transactions, and relational memory can stabilize repeated ties when recurrent activation is represented. Rather than reconstructing individual transactions, estimating policy impacts, or identifying a unique parameter vector, the model provides a generative explanation of how local trade rules can produce macro-level network patterns consistent with the observed cattle-trade regime. These findings support future prospective analyses of cattle governance, traceability, and sustainability within the broader context of Livestock 4.0.
1. Introduction
The beef production chain occupies a strategic position in global agri-food systems, with implications for food security, international trade, and rural livelihoods [1,2]. In Brazil, this importance is amplified by territorial scale, regional heterogeneity, and increasing demands for sustainability, traceability, and digital governance [3,4]. Understanding how cattle trade networks are structured is therefore essential for analyzing efficiency, resilience, sanitary monitoring, and the capacity of digital traceability systems to support governance in complex livestock markets.
Network science has become an important framework for studying complex systems with heterogeneity, emergence, and feedback [5,6,7]. In livestock systems, it has been used to analyze concentration, connectivity, disease diffusion, and market vulnerability [8,9,10,11,12]. Recent studies also examine temporal organization, block structure, and regional mobility in cattle trade networks [13,14,15]. Together, these studies show that cattle commercialization is shaped by hierarchies, territorial frictions, and asymmetric connectivity. Evidence from South American cattle-trade systems remains comparatively limited. In Brazil, previous research has examined cattle-trade networks and disease-related risks in Paraná [15], while the present study builds on GTA-based evidence from Mato Grosso do Sul [16]. This regional focus is relevant because Brazilian cattle systems differ from many temperate livestock systems in spatial scale, road infrastructure, slaughterhouse distribution, sanitary governance, and territorial heterogeneity. Thus, calibrating a generative model against an observed Brazilian cattle-trade network addresses both a methodological gap in ABM-based livestock modeling and a regional gap in the literature on South American cattle commercialization.
Agent-based modeling offers a complementary approach because it allows macro-level patterns to emerge from local decisions made by heterogeneous agents under bounded rationality and operational constraints [17,18,19,20]. In livestock commercialization, real decisions may involve price, destination size, contracts, geography, routinized partnerships, infrastructure, and institutional restrictions. The present model does not attempt to represent all these dimensions explicitly. Instead, it isolates three structural mechanisms that can be evaluated with the available empirical information: destination attractiveness, spatial friction, and relational memory. This choice is consistent with the use of spatial ABMs to represent human–environment interactions in agricultural systems, where local behavior, spatial heterogeneity, and feedback between agents and territory are central [21,22]. Spatial ABMs are therefore suitable when local behavior interacts with territorial structure [21]. Although ABM has already been applied to market, welfare, production, and coordination problems in livestock systems, empirically anchored applications directly calibrated against observed commercialization networks remain limited [23,24].
The empirical benchmark used here comes from a previous study based on GTA records from Mato Grosso do Sul between January 2021 and June 2022 [16]. That study characterized a directed and weighted cattle trade network composed of 20,827 nodes and 258,120 edges. The network showed strong asymmetry, with many producers connected to relatively few slaughterhouses, and a weighted-degree distribution compatible with a heavy-tailed regime up to a critical threshold of approximately kw_critical ≈ 256. This pattern suggests the joint action of cumulative attraction, destination heterogeneity, and spatial constraints, in line with preferential attachment, node fitness, and constrained network growth [25,26,27]. However, descriptive network evidence alone does not establish which minimal mechanisms are sufficient to generate such a regime.
This gap is especially relevant for digital livestock governance. The expansion of traceability databases, interoperable platforms, and analytical tools associated with Livestock 4.0 creates opportunities to connect empirical transaction records with simulation models for prospective analysis [1,3,28]. In this context, the contribution of the present article is not to reconstruct individual transactions or predict specific commercial decisions, but to test whether a small set of local rules can generate the main structural signatures observed in the empirical cattle-trade network.
This purpose also distinguishes the present ABM from statistical network models. In livestock-trade research, exponential random graph models have been used to reproduce, understand, and predict trade-network structure, while temporal exponential-family random graph models (TERGMs) are relevant for modeling tie dynamics in time-varying systems [29,30]. These approaches are complementary rather than competing. Statistical network models are useful for inference on evolving tie structure and observed covariates, whereas the ABM developed here formalizes a generative mechanism linking micro-level decisions to macro-level trade patterns. It represents heterogeneous agents, spatial constraints, capacity limits, feedback from previous flows, and repeated interaction as explicit mechanisms that can be experimentally inspected.
This study therefore addresses three connected gaps. First, most livestock-trade network studies describe observed structures, but fewer explain how such structures may emerge from local trade decisions. Second, ABM applications in livestock systems remain only partially connected to empirically observed cattle-commercialization networks, especially in South American contexts. Third, the mechanisms linking slaughterhouse attractiveness, spatial frictions, and repeated commercial ties remain insufficiently formalized. The research question is: can a parsimonious agent-based model, grounded in GTA-based network evidence, generate the main structural signatures of the Mato Grosso do Sul cattle-trade network? The central hypothesis is that the large-scale organization of this network can emerge from the interaction of cumulative attraction, relational persistence, and spatial–operational constraints.
2. Materials and Methods
2.1. Empirical Basis, Modeling Purpose, and Validation Targets
The empirical basis of this study is the GTA database previously analyzed by [16] for Mato Grosso do Sul, Brazil, covering the period from January 2021 to June 2022. The resulting network is directed and weighted, with producers and slaughterhouses represented as distinct classes and cattle movements represented as producer-to-slaughterhouse flows weighted by the number of animals moved. This benchmark network contains 20,827 nodes and 258,120 weighted edges and provides the empirical reference for model calibration and validation.
The methodological strategy is to move from empirical diagnosis to generative explanation. Rather than reconstructing each historical transaction, the model tests whether a small set of local mechanisms can reproduce the main structural regime observed in the empirical network. This design follows the logic of explanatory ABM, based on parsimonious rules, transparent behavioral assumptions, and explicit links between micro-level decisions and macro-level outcomes [17,18,19,20]. It also follows the pattern-oriented modeling tradition, in which models are evaluated against multiple empirical regularities instead of a single target metric [31].
The empirical validation targets were derived from the GTA-based network: weighted-degree concentration, emergence of slaughterhouse hubs, bounded expansion of mean transaction distance with connectivity, and a saturation regime around kw_critical ≈ 256 [16]. The benchmark data include recorded animal movements, origins, destinations, and transaction volumes, but not transaction-level prices, payment terms, contracts, transport costs, or detailed buyer–seller agreements. Therefore, the model focuses on structural mechanisms that can be linked to the available network evidence, rather than on a complete economic representation of producer choice.
The simulation uses 18 stylized allocation rounds over a horizon comparable to the empirical observation period. A tick should be interpreted as an abstract decision cycle, not as a literal calendar month. This temporal abstraction supports mechanism identification, but it also limits the direct interpretation of outputs related to repeated trade and relational persistence.
2.2. Model Architecture, Decision Rule, and Dynamic Updating
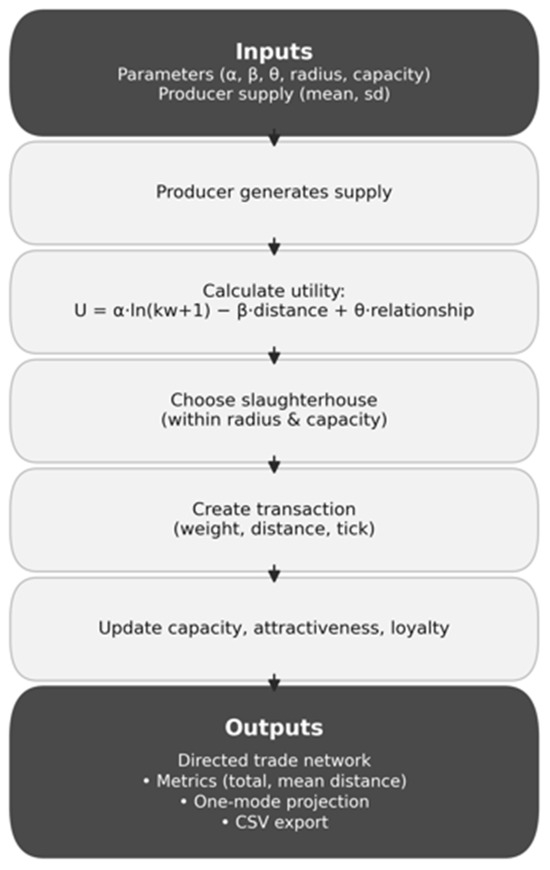
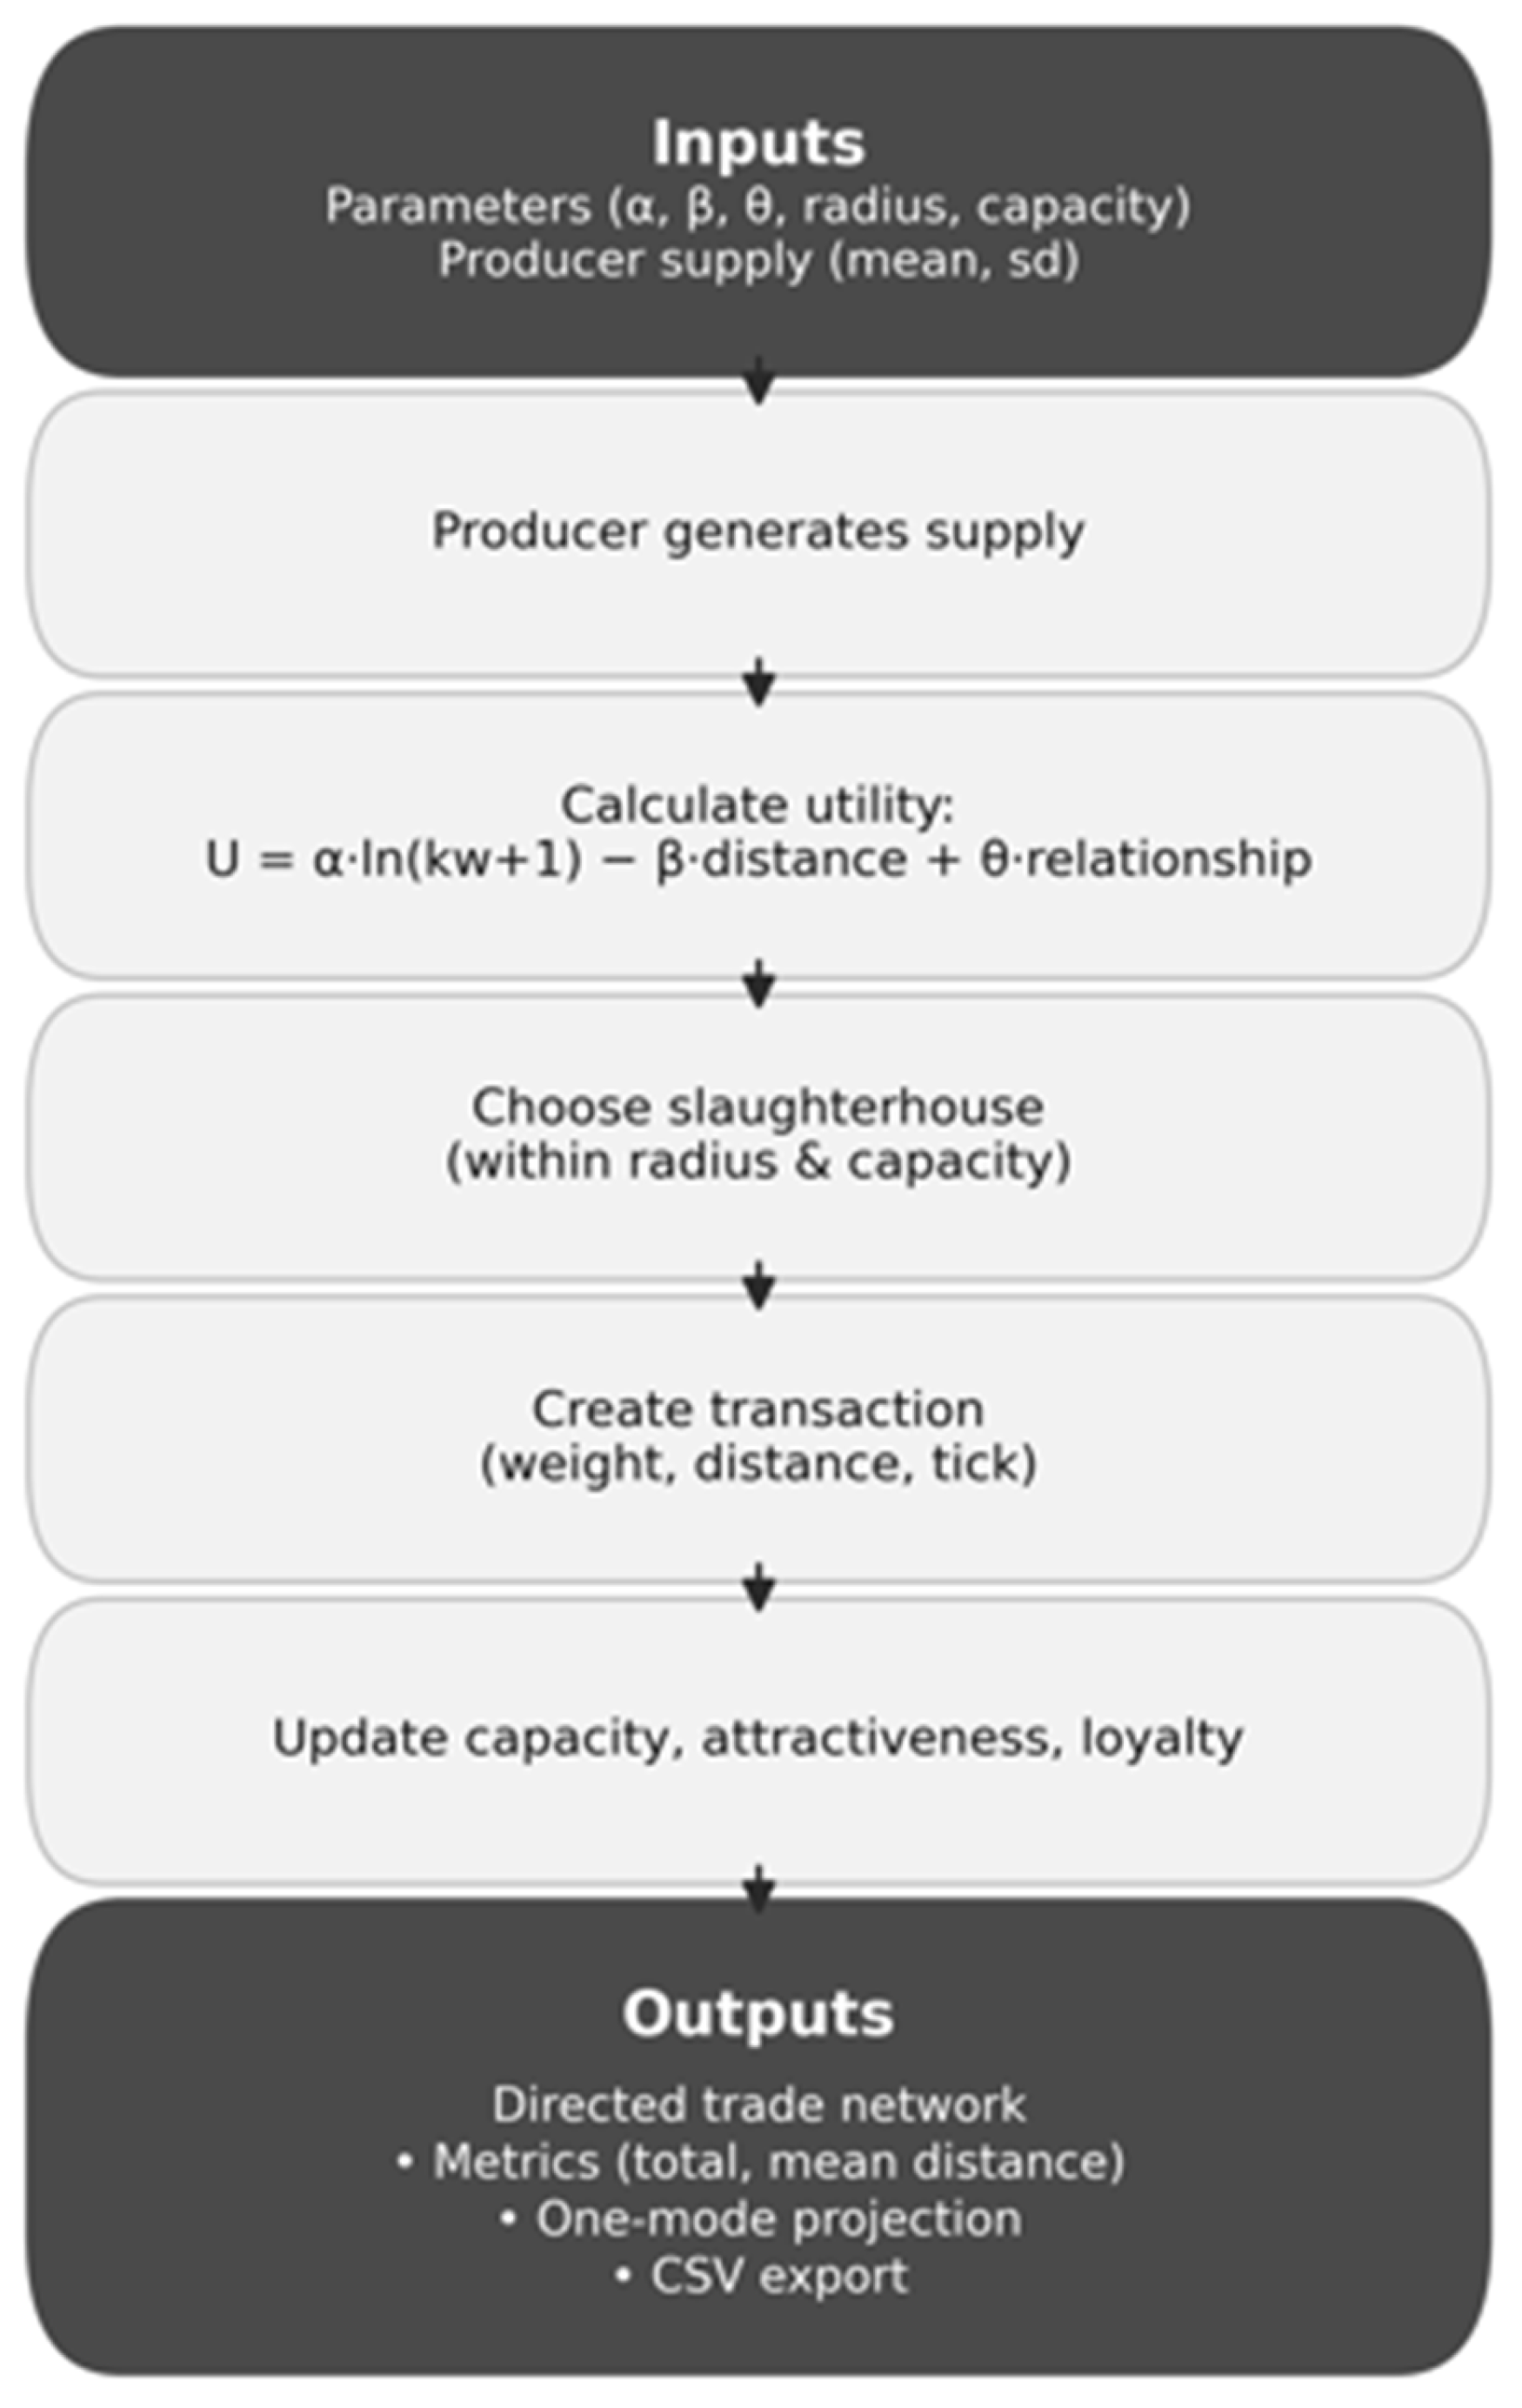
The ABM was implemented in NetLogo 6.4.0, and the complete NetLogo source code is provided as Supplementary Material. The model description follows an ODD-inspired logic while remaining organized according to the journal format [18]. As shown in Figure 1, the model includes two agent classes, producers and slaughterhouses, connected through an operational cycle of initialization, local decision-making, link formation, dynamic updating, and output export. Producers are initialized with heterogeneous supply, location, zone, and a relational-memory table. Slaughterhouses are initialized with location, zone, capacity, remaining capacity, incoming flow, and dynamic attractiveness. The simulation generates a directed weighted trade network and exports aggregate metrics for post-processing.
Figure 1.
Conceptual architecture and operational cycle of the ABM.
Producer choice is governed by the following local utility function [16]:
where kwj is the attractiveness of slaughterhouse j, dij is the Euclidean distance between producer i and slaughterhouse j, and Rij is the relational memory between the pair. The parameter α controls the weight of destination attractiveness, β controls the spatial penalty, and θ controls relational reinforcement.
Uij = α·ln(kwj + 1) − β·dij + θ·Rij,
Attractiveness is treated as a lagged endogenous state variable: producers use the attractiveness accumulated up to the previous updating step, and realized flows affect only future attractiveness. In the implementation, attractiveness is saturated through kwj = min(kwj, kw_critical), preventing unlimited cumulative advantage in the decision layer. Attractiveness is a stylized throughput-based state variable and should not be interpreted as a direct measure of price, contract status, transport cost, sanitary requirements, payment conditions, or buyer reputation, which are not available in the GTA benchmark.
Producers evaluate only viable slaughterhouses, defined as destinations within the sourcing radius, with remaining capacity, and compatible with the zoning rule when this option is activated. Relational memory is also stylized. Rij records whether a simulated dyadic relation has been reinforced by previous interaction and then gradually decays over time. It should not be interpreted as a direct measure of trust, formal contracts, logistics convenience, payment reliability, or long-term lock-in. Instead, it formalizes the possibility that repeated commercial interaction can stabilize trade structure.
The three terms of the utility function correspond to complementary mechanisms. Attractiveness represents cumulative destination advantage and destination heterogeneity; distance represents spatial friction; and relational memory represents boundedly rational repetition of previous commercial ties. The function is not intended to estimate complete producer utility, but to formalize a minimal behavioral mechanism capable of generating the structural patterns analyzed in this article.
At the beginning of each iteration, slaughterhouses restore remaining capacity to their fixed initialized capacity and reset incoming-flow counters. Producers with positive supply evaluate viable destinations, choose the slaughterhouse with the highest utility, and generate a weighted directed link. After the transaction, producer supply is exhausted in the baseline implementation, and relational memory is updated for the selected pair. At the end of the iteration, slaughterhouse attractiveness is updated according to received flow and attractiveness decay. This cycle links cumulative attraction, spatial restriction, capacity limitation, and relational memory in a livestock trade setting [17,19,32].
2.3. Initialization, Baseline Parameterization, and Replication Protocol
The model combines deterministic behavioral rules with stochastic initialization. At setup, all agents are placed in a discrete two-dimensional territory with randomly assigned coordinates. Slaughterhouse capacities are drawn from a normal distribution centered on base-capacity with dispersion capacity-std and truncated to remain positive. Producers receive heterogeneous supply drawn from a normal distribution centered on mean-supply with dispersion sd-supply. Producers and slaughterhouses are also assigned one of three stylized zones.
Capacities are not redrawn at each iteration. Each slaughterhouse restores its initially assigned capacity at the beginning of every allocation round. Producer supply is initialized at setup and consumed when a trade occurs. Thus, the model distinguishes static attributes assigned at initialization, dynamic state variables updated during the simulation, and stochastic variation introduced through random seed changes across replications.
The baseline parameters are reported in Table 1. The simulated system includes 400 producers and 18 slaughterhouses at reduced scale and 2000 producers and 50 slaughterhouses at the intermediate scale. The simulation length is 18 stylized allocation rounds. The core decision parameters are α = 1.0, β = 0.05, and θ = 0.50; the sourcing radius is 25; kw_critical = 256; kw-decay = 0.10; and loyalty-decay = 0.05. Producer supply is initialized with mean 10 and standard deviation 2, while slaughterhouse capacity is initialized with mean 220 and standard deviation 40. In the baseline scenario, zoning restrictions are deactivated.
Table 1.
Baseline parameters and global variables.
Independent replications were conducted with distinct random seeds while keeping behavioral and operational parameters fixed within each scenario. The broader experimental design comprised 20 planned executions per scenario, of which 10 network realizations were exported for detailed post-processing and structural inspection. Unless otherwise indicated, simulated summary metrics are reported as mean ± standard deviation across replicated runs.
2.4. Scaling Assumptions, Sensitivity Design, and Validation Strategy
The ABM was implemented at reduced and intermediate scales rather than at the full empirical size of 20,827 nodes. This reduction reflects the explanatory purpose of the model: to test whether the same local mechanisms can generate the main structural signatures of the observed trade network, not to reconstruct the empirical system transaction by transaction. Reduced-scale simulation is acceptable insofar as it preserves the essential asymmetry of the empirical system: many origin agents, relatively few destination hubs, spatially bounded interaction, and adaptive reinforcement through attractiveness and relational memory.
This scaling choice imposes limits. Absolute concentration levels, distance magnitudes, and detailed frequency counts are scale-dependent and should not be interpreted as one-to-one estimates of the empirical network. Validation is therefore structural and mechanistic: it evaluates whether the model preserves functional patterns across simulated scales, including many-to-few asymmetry, spatially bounded destination choice, nonlinear reinforcement of destination attractiveness, and saturation under capacity constraints.
Sensitivity analysis was used to assess whether the main outputs respond coherently to parameter changes. The parameters α, β, and θ were varied to evaluate their effects on concentration, mean transaction distance, and relational persistence. Additional parameters, including sourcing radius, kw_critical, decay rates, supply, and capacity, were used to inspect operational saturation, memory, heterogeneity, and scale effects. The tested ranges are summarized in Table 2.
Table 2.
Sensitivity design: parameter ranges, target outputs, and expected directional effects.
Table 2 summarizes the tested ranges, target outputs, and expected directional effects used to guide the sensitivity analysis. This summary is presented directly in the main text to keep the methodology concise and transparent.
The value kw_critical = 256 is used as an empirical structural anchor derived from the benchmark network [16]. It should not be interpreted as a regulatory threshold or as a decision rule consciously perceived by producers. In the model, it operates as a saturation device that prevents unlimited cumulative advantage in perceived destination attractiveness.
Although the validation remains structural and mechanistic, the revised analysis also reports quantitative comparison metrics whenever possible, including concentration indicators and the correspondence between empirical and simulated degree–distance patterns. These indicators do not eliminate the structural nature of the validation, but they make the empirical grounding more transparent and directly address concerns about parameter identification and statistical validation.
3. Results
3.1. Baseline Regime and Empirical Correspondence
The baseline simulations indicate that the observed cattle trade structure can be generated by the interaction of cumulative attraction, spatial friction, operational constraints, and relational memory. At the micro-level, producers evaluate only feasible slaughterhouses and rank them according to lagged attractiveness, distance, and relational memory. Attractiveness reinforces already central destinations, while the distance penalty and sourcing radius restrict this cumulative process spatially. Capacity limits and the kw_critical threshold prevent unlimited hub growth. At the macro-level, these local rules generate a trade network characterized by hub dominance, heavy-tailed weighted connectivity, and bounded expansion of mean distance with connectivity.
Table 3 consolidates the empirical-versus-simulated checks that can be directly supported by the current implementation. The calibrated ABM reproduces the main structural signatures of the empirical network: a heavy-tailed concentration regime, a saturation mechanism anchored around kw_critical ≈ 256, the emergence of dominant slaughterhouse hubs, and a bounded degree–distance relationship. Relational memory is retained as a behavioral mechanism, but outputs related to tie repetition and one-mode clustering are treated as limitations rather than direct validation targets, because recurrent producer activation is underrepresented in the baseline implementation.
Table 3.
Empirical and simulated validation summary.
Simulated values are reported as mean ± standard deviation across replicated runs retained for structural comparison. The comparison is structural and mechanistic rather than a claim of direct quantitative equivalence with the full empirical network.
3.2. Spatially Conditioned Centralization
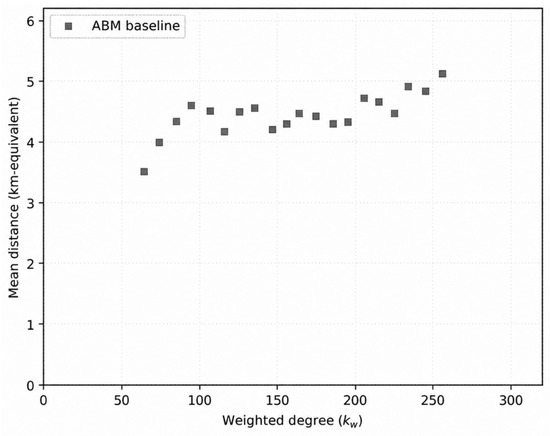
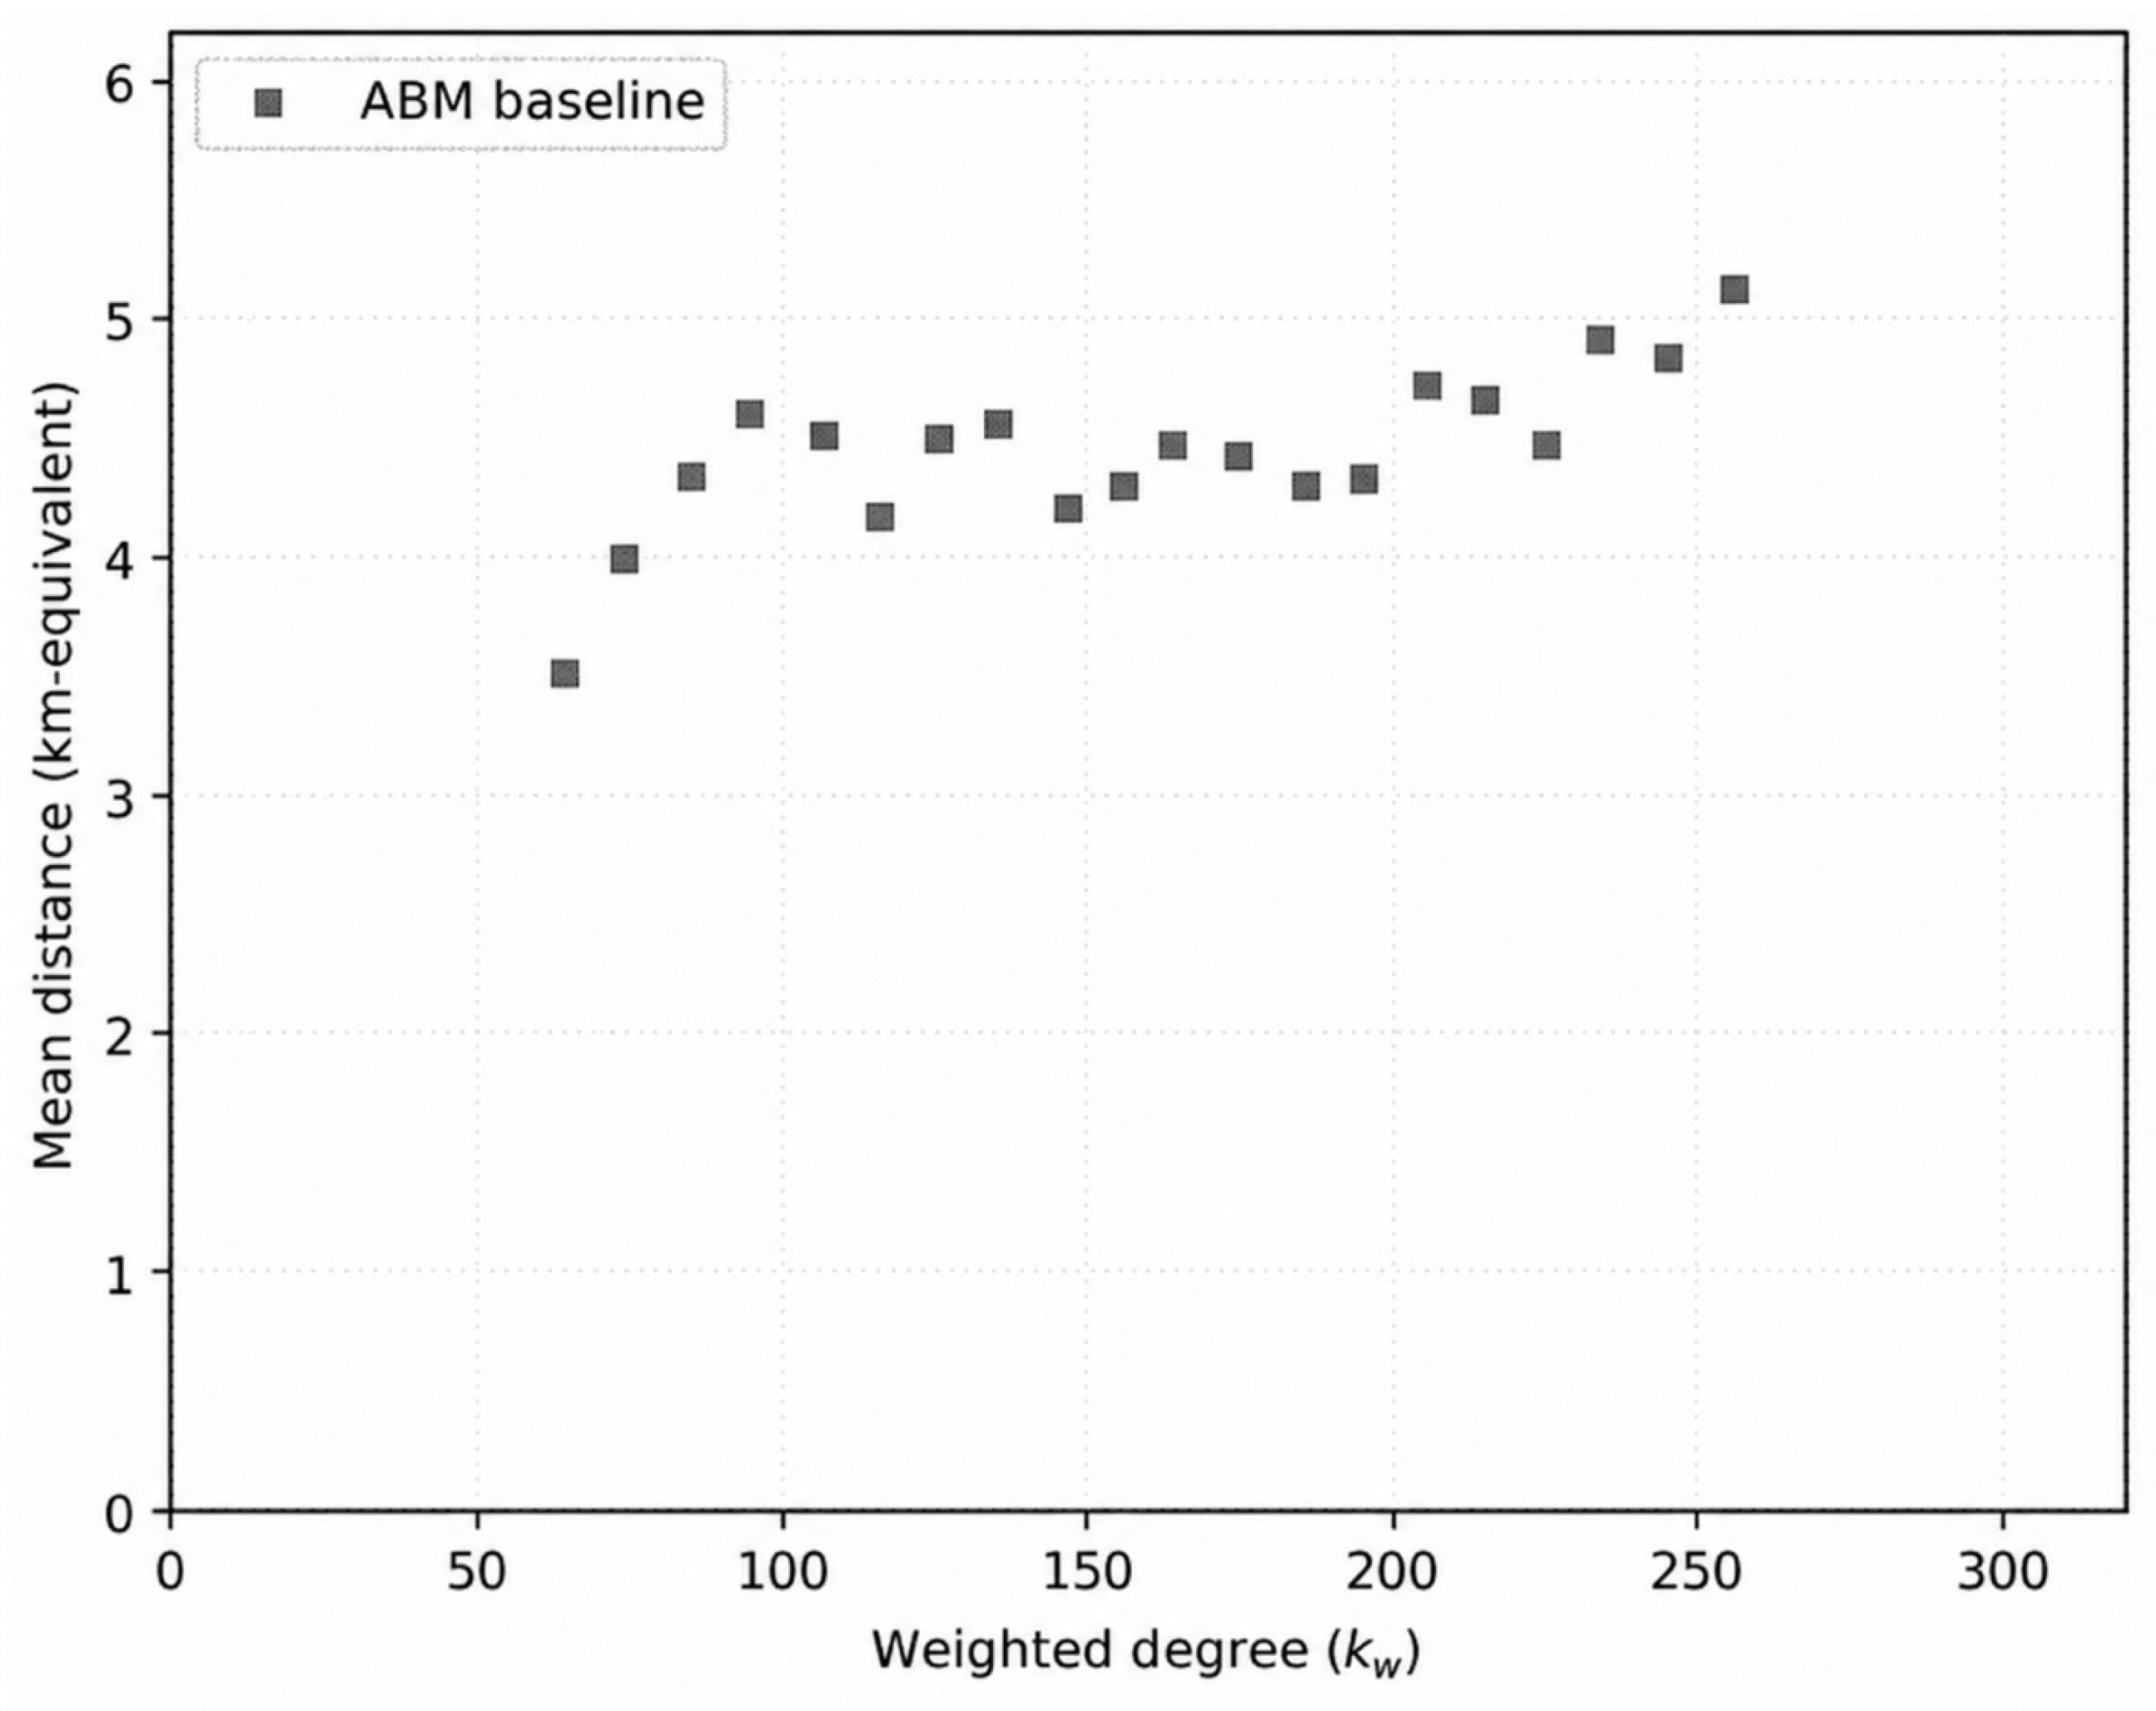
A key result concerns the relationship between slaughterhouse connectivity and mean transaction distance. In the empirical network, more connected slaughterhouses tend to attract animals from larger areas, but this spatial expansion does not continue indefinitely. The same pattern is reproduced in the baseline ABM, as shown in Figure 2. Mean distance increases at low and intermediate connectivity levels and then stabilizes or becomes irregular at higher kw, indicating a transition from expansion to limitation.
Figure 2.
Connectivity and mean transaction distance.
This result is theoretically important because it shows that dominant slaughterhouses behave as regionally bounded hubs rather than unlimited attractors. Spatial friction, sourcing radius, capacity saturation, and the truncation of attractiveness jointly regulate expansion. Therefore, the relevant validation criterion is not equivalence in physical kilometers, since the NetLogo environment uses synthetic spatial units and β is a dimensionless distance-penalty parameter. Instead, the result shows that a generic distance penalty is sufficient to constrain cumulative attraction and generate bounded spatial expansion. Future versions should replace synthetic coordinates with georeferenced locations and calibrate β against observed kilometers, road-network distance, or logistics costs.
3.3. Sensitivity, Parameter Interactions, and Interpretability
The sensitivity analysis indicates that the three core parameters of the utility function regulate distinct but partially overlapping dimensions of network formation. Attraction (α) primarily affects concentration and hub dominance; distance penalty (β) primarily affects spatial reach and mean trade distance; and relational memory (θ) primarily affects repeated interaction and tie persistence when recurrence is temporally feasible. These effects are directionally stable and behaviorally interpretable across the explored parameter ranges summarized in Table 2.
However, the parameters are not fully separable in their realized effects. Concentration is mainly intensified by a higher α, but it can also be moderated by a stronger spatial restriction, operational capacity, and the kw_critical saturation threshold. Mean trade distance responds primarily to β and sourcing radius, but can also shift indirectly when stronger cumulative attraction pulls flows toward dominant hubs. Tie persistence is mainly associated with θ, but its realized magnitude depends on the temporal design of the model and on the opportunity for repeated interaction.
For this reason, the sensitivity analysis should not be interpreted as the identification of a unique “true” parameter vector. Rather, it shows that the model occupies an interpretable parameter space in which the main structural outputs vary in coherent directions. This is important because different parameter combinations may generate similar macro-level structures, a situation commonly described as equifinality. In the present model, similar concentration patterns may emerge from different combinations of attractiveness, spatial restriction, relational reinforcement, and operational limits.
Calibration should therefore be interpreted as the identification of plausible mechanism-consistent regions of the parameter space, not as the exact recovery of a single hidden behavioral process. In practical terms, α, β, and θ should not be interpreted as independently identified causal effects. The contribution of the model is structural: it shows that a small set of mechanisms can jointly generate the observed regime, while future work should combine ablation experiments, formal sensitivity analysis, multi-objective calibration, additional empirical covariates, and out-of-sample validation.
3.4. Scope of Validation
The validation strategy is pattern-oriented and mechanistic. The model is considered informative because it reproduces several empirical regularities simultaneously: strong asymmetry, endogenous hub formation, bounded growth, spatially mediated centralization, and coherent responses to parameter changes. Validation does not require perfect bin-by-bin coincidence or direct equivalence to the full empirical network, but it does require that deviations be explainable by explicit assumptions of the simulation design.
The main deviations are related to scale and temporal simplification. First, concentration indicators such as Top-1 and Top-5 throughput shares are sensitive to the number of destination agents, the producer-to-slaughterhouse ratio, and the capacity distribution. Therefore, the lower concentration values at intermediate scale do not necessarily indicate failure of the mechanism; they indicate that absolute concentration levels are scale-dependent under the current parameterization. Second, outputs related to tie repetition and one-mode clustering are limited by the baseline implementation, in which producer supply is consumed after trade and repeated producer activation is underrepresented.
This validation strategy should not be confused with formal statistical goodness-of-fit testing. The present article does not perform likelihood-based estimation, MLE fitting of the weighted-degree distribution, or formal hypothesis testing comparing simulated and empirical networks. Instead, the model is evaluated as a generative explanation: it is informative if a small set of local mechanisms can reproduce multiple structural signatures of the empirical cattle-trade network and if its limitations are transparent. Future work should complement this approach with formal distributional fitting, out-of-sample tests, and statistical comparison between empirical and simulated network metrics.
4. Discussion
4.1. Methodological Contribution
This study advances from empirical diagnosis to mechanistic explanation by showing that a small set of local decision rules can generate the main structural signatures of the cattle trade network in Mato Grosso do Sul. The contribution is not merely descriptive similarity, but the identification of a plausible generative system in which cumulative attraction, spatial friction, relational memory, and operational constraints interact to produce concentrated yet bounded market organization.
A first implication concerns centralization. The observed network is strongly asymmetric, but the ABM suggests that this asymmetry can emerge from decentralized producer decisions rather than from centralized coordination. Producers tend to select attractive destinations, and these destinations become more attractive as throughput accumulates. This mechanism is consistent with preferential attachment and node-fitness arguments, but in cattle trade it is regulated by spatial and industrial limits [25,26,27].
A second implication concerns territoriality. The results show that hierarchy and regional boundedness are not contradictory. More central slaughterhouses attract animals from larger areas, but only up to the limits imposed by distance, capacity, and saturation of perceived attractiveness. Thus, the network is both hierarchical and spatially mediated. This interpretation complements spatial analyses of livestock movements and commodity mobility [15] and supports the use of ABM to explore zoning, logistics, and governance scenarios in Livestock 4.0.
A third implication is relational. By modeling relational memory as a decaying but reinforceable state variable, the ABM formalizes the idea that trade persistence may be partly built through repeated interactions. This is relevant in agro-industrial systems where trust, routine, and institutional continuity influence exchange [13,32,33]. In this sense, stable trade structure cannot be explained only by geography or destination size; relational persistence may also contribute to the observed organization.
Methodologically, the article positions ABM as a bridge between empirical network analysis and prospective governance analytics. This is aligned with spatially explicit and computationally integrated approaches to complex socio-ecological systems, as well as with pattern-oriented modeling, in which multiple empirical regularities discipline mechanistic explanation [21,31,34]. In the livestock domain, the article extends the mainly descriptive tradition of trade-network studies by offering a generative framework that can be inspected experimentally [13,14,23,24]. At the same time, ABM does not replace statistical network approaches. ERGM and TERGM remain valuable complementary tools when the goal is to infer tie formation and temporal network evolution directly from relational data [29,30].
The theoretical contribution is therefore to connect three mechanisms that are often treated separately in livestock-trade studies: cumulative destination advantage, spatially constrained exchange, and relational persistence. The model shows that hub dominance can be interpreted not only as a descriptive property of the observed network, but also as an emergent outcome of local decisions under spatial and operational constraints.
4.2. Prospective Policy Applications and Scenario Questions
The policy discussion should be read as a prospective application of the modeling framework, not as evidence of policy impacts. The present article did not conduct a dedicated policy-experiment batch, and the model does not explicitly include prices, subsidies, transport costs, contracts, sanitary enforcement, or traceability compliance. Therefore, α, β, and θ should not be interpreted as direct policy instruments. They are structural parameters that help formulate future counterfactual scenarios once additional economic, geographic, institutional, and traceability data are incorporated.
In this limited sense, the model is consistent with the use of behavioral agent-based models for ex-ante policy assessment in agricultural systems [35]. Programs such as PROAPE and Precoce MS illustrate institutional contexts in which future versions of the model could test changes in destination advantage or certified-channel attractiveness. Similarly, initiatives such as the Selo Verde platform and Pará’s official individual bovine traceability system (SRBIPA) illustrate possible contexts for future scenarios involving traceability-based relational persistence. These examples are not treated here as validated policy effects; rather, they show how the model mechanisms could be connected to empirically parameterized policy experiments in future research.
The parameter α can be interpreted as destination advantage. A higher α may represent situations in which compliant, better remunerated, or institutionally preferred slaughterhouses become more attractive to producers, whereas anti-concentration measures or throughput ceilings would operate in the opposite direction. The parameter β represents effective spatial friction, which may be affected by road conditions, transport costs, inspection coverage, local slaughter capacity, or sanitary zoning. The parameter θ represents persistence of repeated commercial ties, which may be strengthened by traceability requirements, supplier-monitoring systems, contract enforcement, and continuity rules for compliant supply chains.
These interpretations lead to three prospective scenario families: certified-channel incentives, territorial integration or restriction, and traceable-chain continuity. As summarized in Table 4, these scenarios can be linked to the model parameters α, β, and θ, which represent destination advantage, spatial friction, and relational persistence, respectively. The present article does not claim to estimate these policy effects. Instead, it establishes a mechanistic basis for formulating future policy experiments. The policy relevance claimed here is therefore conceptual and prospective: the model indicates which types of scenarios could be tested, but it does not yet provide evidence about the effects of specific policy interventions.
Table 4.
Policy interpretation of model parameters and prospective what-if scenarios.
The table should be read as a heuristic mapping between model mechanisms and possible classes of future governance scenarios. It does not present policy recommendations, estimated policy effects, or validated intervention outcomes.
4.3. Limitations and Future Research
This study has several limitations. First, it is regionally anchored in Mato Grosso do Sul and benchmarked against a single observation window, from January 2021 to June 2022. Therefore, the model should not be interpreted as a direct representation of the Brazilian cattle system as a whole or as immediately generalizable to other states or countries. Differences in slaughter capacity, road infrastructure, sanitary regulation, market concentration, herd composition, and territorial organization may alter the balance between attraction, distance, and relational persistence. Out-of-sample validation against other Brazilian states, later periods, or international datasets remains necessary.
Second, the model remains computationally and experimentally constrained. The empirical benchmark contains 20,827 nodes, whereas the simulations were implemented at reduced and intermediate scales for interpretability and tractability. Thus, the results support structural and mechanistic correspondence rather than one-to-one quantitative reconstruction. Several components also remain stylized: prices, transport costs, embargoes, heterogeneous contracts, macroeconomic cycles, and explicit traceability compliance are not included; producer activity is simplified through stylized allocation rounds; and zones are assigned as abstract territorial categories.
Third, parameter uncertainty remains important. The explored ranges support coherent directional interpretation, but they do not imply unique recovery of a true underlying parameter vector. As in many agent-based models, equifinality is possible: different combinations of attraction, distance, relational memory, and operational constraints may generate similar macro-structural patterns. For this reason, α, β, and θ should be interpreted as mechanism-oriented parameters, not as independently identified causal effects.
A central implementation limitation concerns repeated-trade dynamics. In the current code structure, producer supply is initialized at setup and set to zero after a realized transaction, while the baseline loop does not regenerate producer supply across rounds. This design is transparent and useful for examining concentration and spatially bounded allocation, but it underrepresents recurrent activation of the same producer over time. Consequently, outputs related to tie repetition, relational memory, and one-mode projection clustering should be interpreted with caution. Future versions should introduce producer reactivation, seasonal supply regeneration, or multiple trading opportunities per producer.
Finally, the validation strategy remains pattern-oriented rather than definitive. The model was compared against multiple empirical regularities, including concentration, bounded degree–distance expansion, saturation, and spatially mediated centralization, but this does not eliminate uncertainty about alternative mechanisms that might generate comparable outcomes. The contribution of the model is therefore best understood as a transparent and testable generative explanation, not as a final predictive replica of the cattle market.
Future work should proceed in five directions: scaling simulations closer to the empirical network; introducing richer temporal activation and repeated-trade dynamics; incorporating prices, logistics, contracts, and traceability compliance; testing the model on additional Brazilian states and multi-year panels; and performing out-of-sample validation against unseen regional or temporal datasets. Future developments may also integrate ABM with machine-learning-assisted calibration, surrogate modeling, or scenario discovery, following recent advances in multidisciplinary computational modeling [36].
5. Conclusions
This article examined whether a parsimonious agent-based model, grounded in empirical GTA-based network evidence, could generate the main structural signatures of the cattle-trade network in Mato Grosso do Sul, Brazil. The results provide a cautiously affirmative answer within the limits of structural and mechanistic validation. The model shows that cumulative destination attractiveness, spatial friction, relational memory, capacity constraints, and attractiveness saturation can jointly generate hub dominance, flow concentration, and bounded spatial expansion.
The main contribution is therefore generative rather than predictive. The model does not reconstruct individual transactions, estimate direct policy impacts, or prove that the calibrated parameters are uniquely identified. Instead, it shows how a transparent and reproducible ABM can connect micro-level trade decisions to macro-level network patterns consistent with the observed cattle-trade regime. In this sense, the study contributes by translating empirical network regularities into an explicit mechanism that can be inspected, tested, and extended.
The results also define the current scope of inference. Reduced and intermediate simulation scales, abstract spatial units, stylized zones, absence of explicit prices, revenues, contracts, and transport costs, simplified temporal activation, and limited repeated-trade dynamics restrict external validity and prevent direct generalization to other regions or periods. These limitations indicate that the present model should be interpreted as a generative explanatory framework, not as a final predictive replica of the Brazilian cattle market. In particular, the current version does not identify the economic causes of concentration and does not estimate the effect of specific policy instruments.
Future research should extend the model toward larger empirical scales, real administrative or sanitary zoning, explicit price and logistics components, richer producer reactivation rules, formal statistical validation, and out-of-sample testing using additional states and multi-year datasets. These developments would allow the framework to move from structural explanation toward more robust prospective policy experimentation in cattle governance, traceability, and sustainability.
Supplementary Materials
The following supporting information can be downloaded at: https://www.mdpi.com/article/10.3390/agriculture16121254/s1. Complete NetLogo source code used to implement the agent-based model and run the simulation scenarios described in this study.
Author Contributions
Conceptualization, methodology, software, validation, formal analysis, investigation, visualization, and writing—original draft preparation, R.F.M.d.S.; methodology, writing—review and editing, and supervision, S.R.d.M.O.; writing—review and editing, analysis and interpretation of results, and supervision, I.B. All authors have read and agreed to the published version of the manuscript.
Funding
This research and the article processing charge (APC) were funded by FAPESP, grant number 2022/09319-9.
Institutional Review Board Statement
Not applicable.
Data Availability Statement
The NetLogo code used to implement the agent-based model and run the simulation scenarios is provided in the Supplementary Material. Restrictions apply to the availability of the empirical GTA records used as benchmark in this study. These data were obtained from the competent data-holding institution and are not publicly available due to administrative restrictions and the sensitive nature of livestock-movement records. Aggregated and anonymized outputs used to support the structural validation are reported in the manuscript and Supplementary Material. Additional access to the original records depends on authorization by the competent data-holding institution.
Acknowledgments
The authors thank the institutional support provided by the Faculdade de Engenharia Agrícola (FEAGRI/UNICAMP) and Embrapa Agricultura Digital.
Conflicts of Interest
Authors Stanley Robson de Medeiros Oliveira and Ivan Bergier were employed by the company Brazilian Agricultural Research Corporation. The remaining authors declare that the research was conducted in the absence of any commercial or financial relationships that could be construed as a potential conflict of interest.
Abbreviations
The following abbreviations are used in this manuscript:
| ABM | Agent-based model |
| GTA | Animal Transit Guide (Guia de Trânsito Animal) |
| ERGM | Exponential random graph model |
| TERGM | Temporal exponential random graph model |
| FAO | Food and Agriculture Organization of the United Nations |
| USDA | United States Department of Agriculture |
| MS | Mato Grosso do Sul |
References
- Food and Agriculture Organization of the United Nations. The State of Food and Agriculture 2023: Revealing the True Cost of Food to Transform Agrifood Systems; FAO: Rome, Italy, 2023. [Google Scholar] [CrossRef] [Scilit]
- United States Department of Agriculture, Foreign Agricultural Service. Livestock and Poultry: World Markets and Trade. 9 December 2025. Available online: https://apps.fas.usda.gov/psdonline/circulars/livestock_poultry.pdf (accessed on 16 March 2026).
- Malafaia, G.C.; Biscola, P.H.N. Anuário CiCarne da Cadeia Produtiva da Carne Bovina—2023; Embrapa Gado de Corte: Campo Grande, MS, USA, 2023; Documentos 314; Available online: https://www.infoteca.cnptia.embrapa.br/infoteca/bitstream/doc/1160117/1/Anuario-CiCarne-cadeia-produtiva-2023.pdf (accessed on 26 January 2026).
- Silva e Souza, G.; Gomes, E.G.; Abreu, U.G.P. Modelo de produção para a pecuária de corte brasileira com base em dados censitários: Abordagens determinística e estocástica com hipótese de endogeneidade. Rev. Econ. Agríc. 2016, 63, 21–34. [Google Scholar]
- Boccaletti, S.; Latora, V.; Moreno, Y.; Chavez, M.; Hwang, D.-U. Complex networks: Structure and dynamics. Phys. Rep. 2006, 424, 175–308. [Google Scholar] [CrossRef] [Scilit]
- Caldarelli, G. Scale-Free Networks: Complex Webs in Nature and Technology; Oxford University Press: Oxford, UK, 2007; Available online: https://global.oup.com/academic/product/scale-free-networks-9780199211517 (accessed on 6 January 2026).
- Newman, M.E.J. The Structure and Function of Complex Networks. SIAM Rev. 2003, 45, 167–256. [Google Scholar] [CrossRef] [Scilit]
- Bigras-Poulin, M.; Thompson, R.A.; Chriel, M.; Mortensen, S.; Greiner, M. Network analysis of Danish cattle industry trade patterns as an evaluation of risk potential for disease spread. Prev. Vet. Med. 2006, 76, 11–39. [Google Scholar] [CrossRef] [Scilit]
- Dubé, C.; Ribble, C.; Kelton, D.; McNab, B. A review of network analysis terminology and its application to foot-and-mouth disease modelling and policy development. Transbound. Emerg. Dis. 2009, 56, 73–85. [Google Scholar] [CrossRef] [Scilit]
- Motta, P.; Porphyre, T.; Handel, I.; Hamman, S.M.; Ngwa, V.N.; Tanya, V.; Morgan, K.; Christley, R.; Bronsvoort, B.M.d.C. Implications of the cattle trade network in Cameroon for regional disease prevention and control. Sci. Rep. 2017, 7, 43932. [Google Scholar] [CrossRef] [Scilit]
- Natale, F.; Giovannini, A.; Savini, L.; Palma, D.; Possenti, L.; Fiore, G.; Calistri, P. Network analysis of Italian cattle trade patterns and evaluation of risks for potential disease spread. Prev. Vet. Med. 2009, 92, 341–350. [Google Scholar] [CrossRef] [Scilit] [PubMed]
- Pastor-Satorras, R.; Vespignani, A. Epidemic Spreading in Scale-Free Networks. Phys. Rev. Lett. 2001, 86, 3200–3203. [Google Scholar] [CrossRef] [Scilit]
- Ansari, S.A.; Heitzig, J.H.; Brzoska, L.B.; Lentz, H.H.K.; Mihatsch, J.M.; Fritzemeier, J.; Moosavi, M.R. A Temporal Network Model for Livestock Trade Systems. Front. Vet. Sci. 2021, 8, 766547. [Google Scholar] [CrossRef] [Scilit]
- Brzoska, L.; Fischer, M.; Lentz, H.H.K. Hierarchical Structures in Livestock Trade Networks—A Stochastic Block Model of the German Cattle Trade Network. Front. Vet. Sci. 2020, 7, 281. [Google Scholar] [CrossRef] [Scilit]
- Rodrigues, D.L.; Marquetoux, N.; Grisi Filho, J.H.d.H.; Ferreira Neto, J.S. The Cattle Trading Network and Its Effect on the Spread of Brucellosis in Paraná, Brazil. Ruminants 2023, 3, 202–213. [Google Scholar] [CrossRef] [Scilit]
- Silva, R.F.M. Rastreabilidade Digital e Modelagem Baseada em Agentes da Cadeia de Comercialização de Bovinos No Brasil: Integração Entre Redes, Sustentabilidade e Governança da Pecuária 4.0. Ph.D. Thesis, Universidade Estadual de Campinas (UNICAMP), Faculdade de Engenharia Agrícola, Campinas, Brazil, 2026. Available online: https://hdl.handle.net/20.500.12733/44530 (accessed on 26 March 2026).
- Gilbert, N. Agent-Based Models, 2nd ed.; SAGE Publications, Inc.: Thousand Oaks, CA, USA, 2020. [Google Scholar] [CrossRef] [Scilit]
- Grimm, V.; Berger, U.; Bastiansen, F.; Eliassen, S.; Ginot, V.; Giske, J.; Goss-Custard, J.; Grand, T.; Heinz, S.K.; Huse, G.; et al. A standard protocol for describing individual-based and agent-based models. Ecol. Model. 2006, 198, 115–126. [Google Scholar] [CrossRef] [Scilit]
- Macal, C.M.; North, M.J. Tutorial on agent-based modelling and simulation. J. Simul. 2010, 4, 151–162. [Google Scholar] [CrossRef] [Scilit]
- Railsback, S.F.; Grimm, V. Agent-Based and Individual-Based Modeling: A Practical Introduction, 2nd ed.; Princeton University Press: Princeton, NJ, USA, 2019. [Google Scholar]
- Filatova, T.; Verburg, P.H.; Parker, D.C.; Stannard, C.A. Spatial agent-based models for socio-ecological systems: Challenges and prospects. Environ. Model. Softw. 2013, 45, 1–7. [Google Scholar] [CrossRef] [Scilit]
- Schreinemachers, P.; Berger, T. An agent-based simulation model of human–environment interactions in agricultural systems. Environ. Model. Softw. 2011, 26, 845–859. [Google Scholar] [CrossRef] [Scilit]
- Addis, A.H.; Blair, H.T.; Kenyon, P.R.; Morris, S.T.; Schreurs, N.M.; Garrick, D.J. Agent-Based Modelling to Improve Beef Production from Dairy Cattle: Young Beef Production. Agriculture 2023, 13, 898. [Google Scholar] [CrossRef] [Scilit]
- Hwang, H. Simulation design to find the welfare impacts of livestock trading and disease transmission. PLoS ONE 2024, 19, e0310213. [Google Scholar] [CrossRef] [Scilit]
- Amaral, L.A.N.; Scala, A.; Barthélémy, M.; Stanley, H.E. Classes of small-world networks. Proc. Natl. Acad. Sci. USA 2000, 97, 11149–11152. [Google Scholar] [CrossRef] [Scilit]
- Barabási, A.-L.; Albert, R. Emergence of Scaling in Random Networks. Science 1999, 286, 509–512. [Google Scholar] [CrossRef] [Scilit] [PubMed]
- Bianconi, G.; Barabási, A.-L. Competition and multiscaling in evolving networks. EPL 2001, 54, 436–442. [Google Scholar] [CrossRef] [Scilit]
- Silva, R.F.M.; Papa, M.; Bergier, I.; Oliveira, S.R.M.; Cruz, S.A.B.; Romani, L.A.S.; Massruhá, S.M.F.S. Digital transformation for improving sustainable value of products and services from agri-food systems. Front. Sustain. 2022, 3, 1048701. [Google Scholar] [CrossRef] [Scilit]
- Leung, W.T.M.; Rudge, J.W.; Fournié, G. Simulating contact networks for livestock disease epidemiology: A systematic review. J. R. Soc. Interface 2023, 20, 20220890. [Google Scholar] [CrossRef] [Scilit] [PubMed]
- Relun, A.; Grosbois, V.; Alexandrov, T.; Sánchez-Vizcaíno, J.M.; Waret-Szkuta, A.; Molia, S.; Etter, E.M.C.; Martínez-López, B. Prediction of Pig Trade Movements in Different European Production Systems Using Exponential Random Graph Models. Front. Vet. Sci. 2017, 4, 27. [Google Scholar] [CrossRef] [Scilit] [PubMed]
- Grimm, V.; Revilla, E.; Berger, U.; Jeltsch, F.; Mooij, W.M.; Railsback, S.F.; Thulke, H.-H.; Weiner, J.; Wiegand, T.; DeAngelis, D.L. Pattern-Oriented Modeling of Agent-Based Complex Systems: Lessons from Ecology. Science 2005, 310, 987–991. [Google Scholar] [CrossRef] [Scilit] [PubMed]
- Simon, H.A. Organizations and Markets. J. Econ. Perspect. 1991, 5, 25–44. [Google Scholar] [CrossRef] [Scilit]
- Huber, R.; Bakker, M.; Balmann, A.; Berger, T.; Bithell, M.; Brown, C.; Grêt-Regamey, A.; Xiong, H.; Le, Q.B.; Mack, G.; et al. Representation of decision-making in European agricultural agent-based models. Agric. Syst. 2018, 167, 143–160. [Google Scholar] [CrossRef] [Scilit]
- Kremmydas, D.; Athanasiadis, I.N.; Rozakis, S. A review of Agent Based Modeling for agricultural policy evaluation. Agric. Syst. 2018, 164, 95–106. [Google Scholar] [CrossRef] [Scilit]
- Huber, R.; Späti, K.; Finger, R. A behavioural agent-based modelling approach for the ex-ante assessment of policies supporting precision agriculture. Ecol. Econ. 2023, 212, 107936. [Google Scholar] [CrossRef] [Scilit]
- Zhang, W.; Valencia, A.; Chang, N.-B. Synergistic Integration Between Machine Learning and Agent-Based Modeling: A Multidisciplinary Review. IEEE Trans. Neural Netw. Learn. Syst. 2023, 34, 2170–2190. [Google Scholar] [CrossRef] [Scilit]

Disclaimer/Publisher’s Note: The statements, opinions and data contained in all publications are solely those of the individual author(s) and contributor(s) and not of MDPI and/or the editor(s). MDPI and/or the editor(s) disclaim responsibility for any injury to people or property resulting from any ideas, methods, instructions or products referred to in the content. |
© 2026 by the authors. Licensee MDPI, Basel, Switzerland. This article is an open access article distributed under the terms and conditions of the Creative Commons Attribution (CC BY) license.